Article

Identifying the Genes Regulated by AtWRKY6 Using Comparative Transcript and Proteomic Analysis under Phosphorus Deficiency

College of Agronomy, Sichuan Agricultural University, Chengdu 611130, China
*
Author to whom correspondence should be addressed.
Int. J. Mol. Sci. 2017, 18(5), 1046; https://0-doi-org.brum.beds.ac.uk/10.3390/ijms18051046
Submission received: 8 February 2017 / Revised: 26 April 2017 / Accepted: 4 May 2017 / Published: 12 May 2017
(This article belongs to the Special Issue Selected Papers from the 6th National Plant Protein Research Congress)

Abstract

:
Phosphorus (P) is an important mineral nutrient for plant growth and development. Overexpressing AtWRKY6 (35S:WRKY6-9) was more sensitive and wrky6 (wrky6-1) was more resistant under low Pi conditions. To better understand the function of AtWRKY6 under low phosphate stress conditions, we applied two-dimensional gel electrophoresis (2-DE) to analyse differentially expressed proteins in the shoots and roots between wild type, 35S:WRKY6-9 and wrky6-1 after phosphorus deficiency treatment for three days. The results showed 88 differentially abundant protein spots, which were identified between the shoots and roots of 35S:WRKY6-9 and wrky6-1 plants. In addition, 59 differentially expressed proteins were identified in the leaves and roots of 35S:WRKY6-9 plants. After analysis, 9 genes with W-box elements in their promoter sequences were identified in the leaves, while 6 genes with W-box elements in their promoter sequences were identified in the roots. A total of 8 genes were identified as potential target genes according to the quantitative PCR (QPCR) and two dimension difference gel electrophoresis, (2D-DIGE) results, including ATP synthase, gln synthetase, nitrilase, 14-3-3 protein, carbonic anhydrases 2, and tryptophan synthase. These results provide important information concerning the AtWRKY6 regulation network and reveal potential vital target genes of AtWRKY6 under low phosphorus stress. two dimension difference gel electrophoresis, 2D-DIGE

1. Introduction

Phosphorus (P) is an indispensable macronutrient involved in many physiological processes, particularly photosynthesis [1]. Although the Pi content in most soils is generally high, Pi availability is extremely low because of its fixed form and slow diffusion [2]. Interestingly, plants have evolved many adaptive strategies to accommodate Pi deficiency. These strategies include morphological, physiological, biochemical, and molecular responses, such as increasing the root/shoot ratio [3]; promoting organic acid synthesis and secretion; and enhancing the expression of acid phosphatases, high-affinity phosphate transporters and transcription factors [4,5,6]. In recent years, some important genes related to low phosphorus have been identified in Arabidopsis. Previous studies have shown that micro RNA399 indirectly regulates PHO2 (E2 conjugase); and PHR1—a MYB (V-myb avian myeloblastosis viral oncogene homolog) transcription factor—binds to the promoters of Pi starvation-induced genes, including micro RNA399 [7]. This finding indicates that PHR1 and micro RNA399 play regulatory roles in the phosphorus-signalling pathway. WRKY45 overexpression in Arabidopsis increases Pi content and uptake, while the suppression of WRKY45 through RNA interference decreases Pi content and uptake. These observations suggest that WRKY45 is involved in the response of Arabidopsis to Pi starvation by the direct upregulation of PHT1; one expression [5]. Other studies have suggested that some protein modifications—such as SUMOylation, phosphorylation, dephosphorylation, and epigenetic modifications [8,9,10,11]—play vital roles in the adaptation of plants to phosphorus deficiency.
Proteome analysis using two dimension difference gel electrophoresis (2D-DIGE) is a well-established technique used to identify genes that respond to environmental stress [12]. Important proteins involved in P signalling and regulatory mechanisms have been identified in maize, Arabidopsis thaliana, rice and soybean using proteomics studies [13,14,15,16]. The proteins involved in remodelling the composition of lipid membranes and the activity of the glycolysis alternative pathways showed increased functions in response to phosphorus deficiency in Arabidopsis [15]; and alcohol dehydrogenase, malic enzyme and aconitate hydratase contributed to the contrasting adaptation strategy to Pi deficiency in two ecotypes of Arabidopsis thaliana [17].
WRKY (WRKYGQK domain) proteins are plant-specific transcription factors characterized by the presence of one or two highly conserved WRKY domains. The WRKY domain is approximately 60 amino acids in length followed by a Cys2His2 or Cys2HisCys zinc finger motif [18]. Both conserved motifs of the WRKY domain are necessary for the binding affinity of the WRKY protein to the consensus cis-acting element W-box (C/T)TGAC(C/T) [19]. AtWRKY6 was first reported to influence the senescence- and pathogen defence-associated PR1 promoter activity in senescence- and defence-related processes [20], and this protein could activate the expression of its target gene SIRK, a receptor-like protein kinase during senescence [21]. AtWRKY6 has also been implicated in phosphorus, boron, and arsenic stress and ABA (abscisic acid) signalling [22,23,24,25]. Overexpressing WRKY6 increases sensitivity under low Pi conditions, and WRKY6 negatively regulates PHO1 expression by binding to two W-box elements on the PHO1 promoter. The repression of PHO1 expression by WRKY6 is released under low Pi conditions, likely reflecting WRKY6 degradation by 26S proteasomes [22].
In the present study, we analysed the differential protein expression profiles of leaves and roots using overexpressing AtWRKY6 lines (35S:WRKY6-9) and knockout mutant (wrky6-1) plant materials to identify proteins that are differentially expressed under low Pi conditions. A total of six genes were identified as potential target genes regulated by WRKY6 according to the results of the QPCR (quantitative PCR) and difference in gel electrophoresis (DIGE) experiment. The present study provides valuable information that will lay the foundation for further studies of the functions of genes that respond to phosphorus deficiency.

2. Results

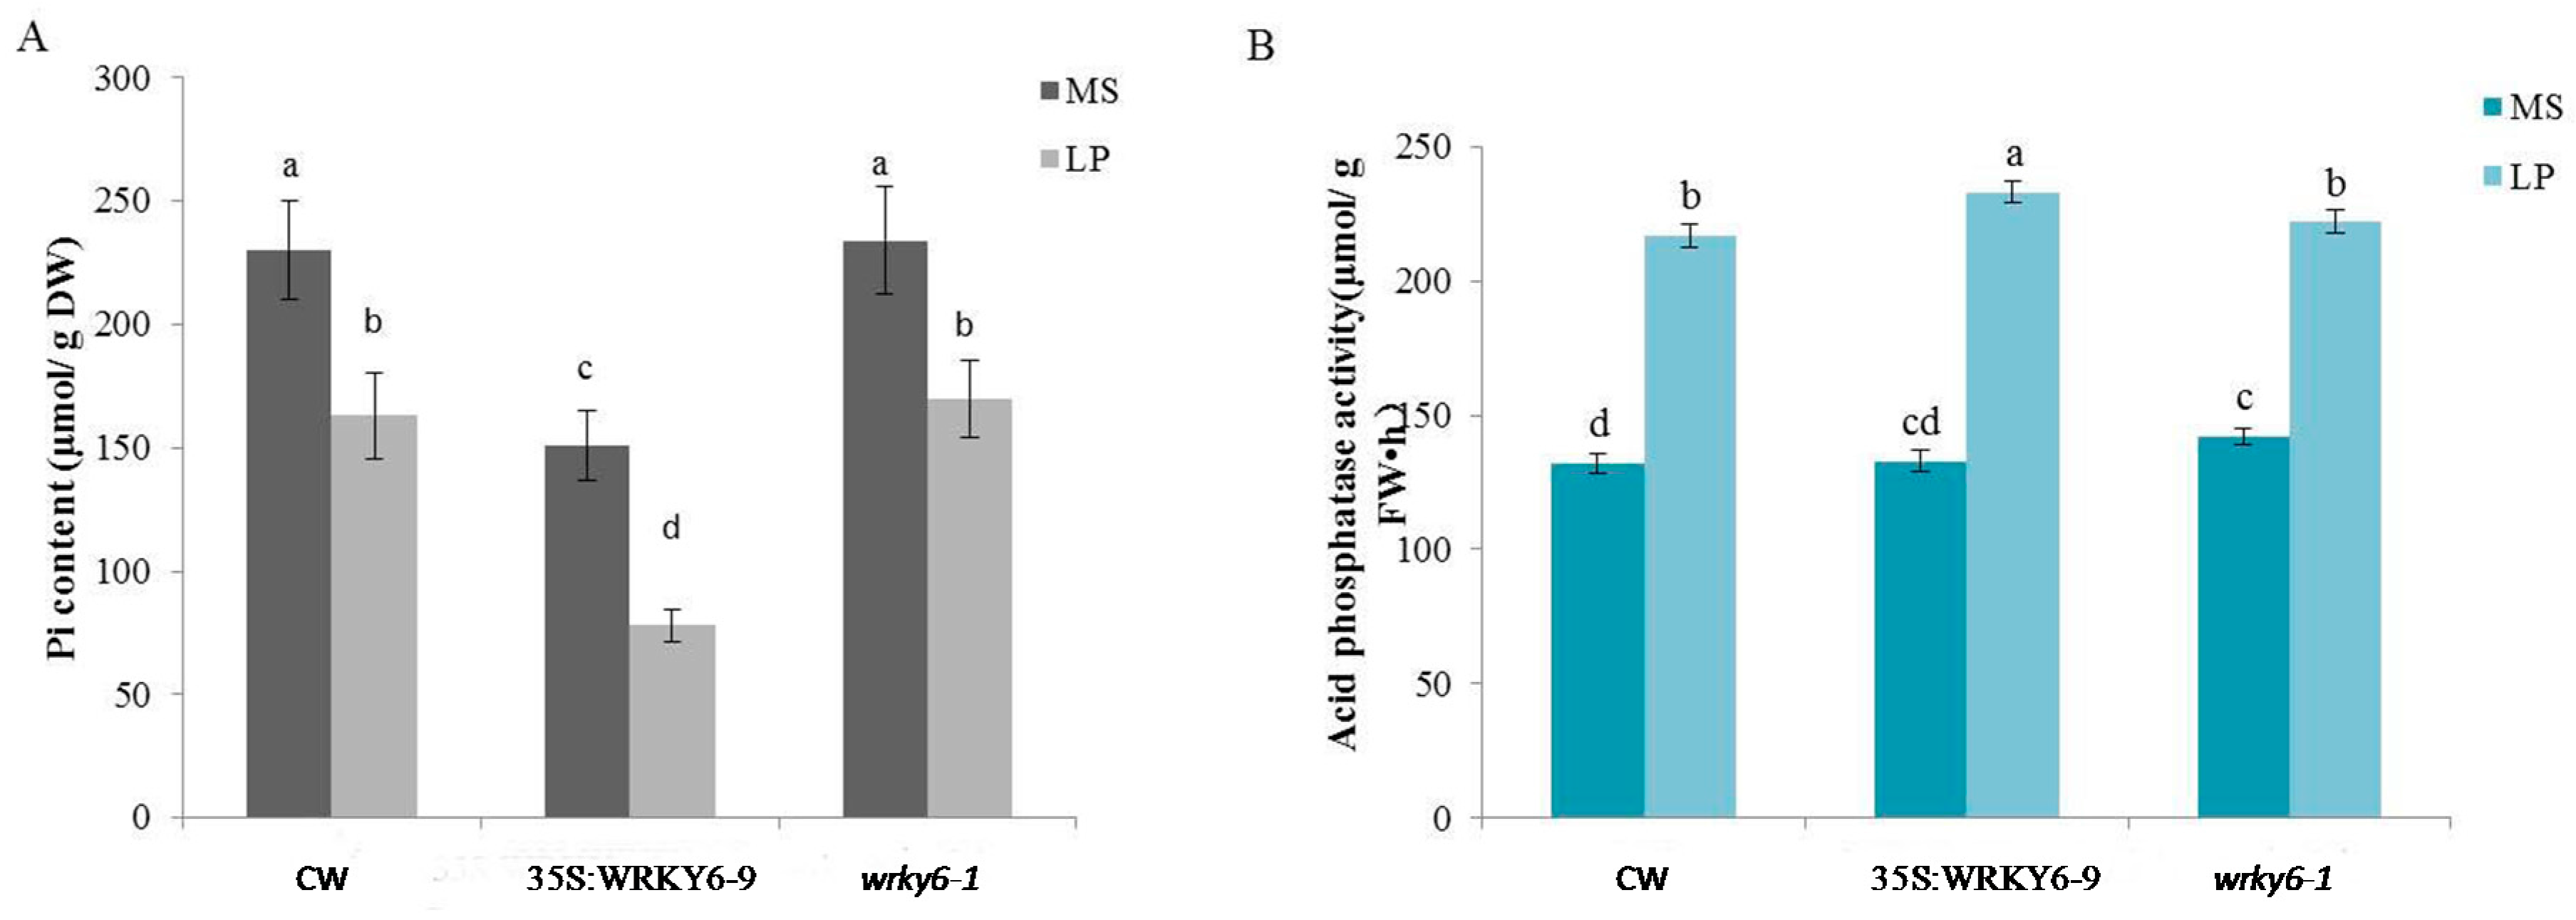
2.1. Measurements of Biochemical Data in Three Plant Samples

Seedlings of wild type, 35S:WRKY6-9 and wrky6-1 were collected after phosphorus deficiency treatment for three days to clarify their physiological status. Firstly, Pi content of seedings were checked. The results demonstrated that under either Pi-sufficient or Pi-deficient conditions, 35S:WRKY6-9 showed similar reduced Pi contents as compared to wild type and wrky6-1; there was no difference in wild type and wrky6-1 under either Pi-sufficient or Pi-deficient conditions (Figure 1A). Acid phosphatase activities in the root of 35S:WRKY6-9 was almost the same as the two samples when growing on MS medium (Pi-sufficient medium); but when growing on LP medium (Pi-deficient medium), phosphatase activities in 35S:WRKY6-9 roots were higher than other materials (Figure 1B). The two results suggested that 35S:WRKY6-9 was more sensitive to low phosphorus stress than wild type and wrky6-1. Next, chlorophyll, reducing sugar and sucrose content were also tested to study response difference after phosphorus deficiency treatment in three samples. Chlorophyll content in 35S:WRKY6-9 shoots was higher than wild type under either Pi-sufficient or Pi-deficient conditions. Reducing sugar in 35S:WRKY6-9 shoots was higher than wild type and wrky6-1 under Pi-sufficient conditions, but there were no differences in the three materials under Pi-deficient conditions. The trend of sucrose content was the opposite; under Pi-sufficient conditions, there was no difference in the three materials, but sucrose content in the 35S:WRKY6-9 shoots was substantially higher than wild type and wrky6-1 (Table 1). Thus, from these five results we concluded that many physiological changes were produced in 35S:WRKY6-9 in adapting to low Pi stress after three days of treatment.

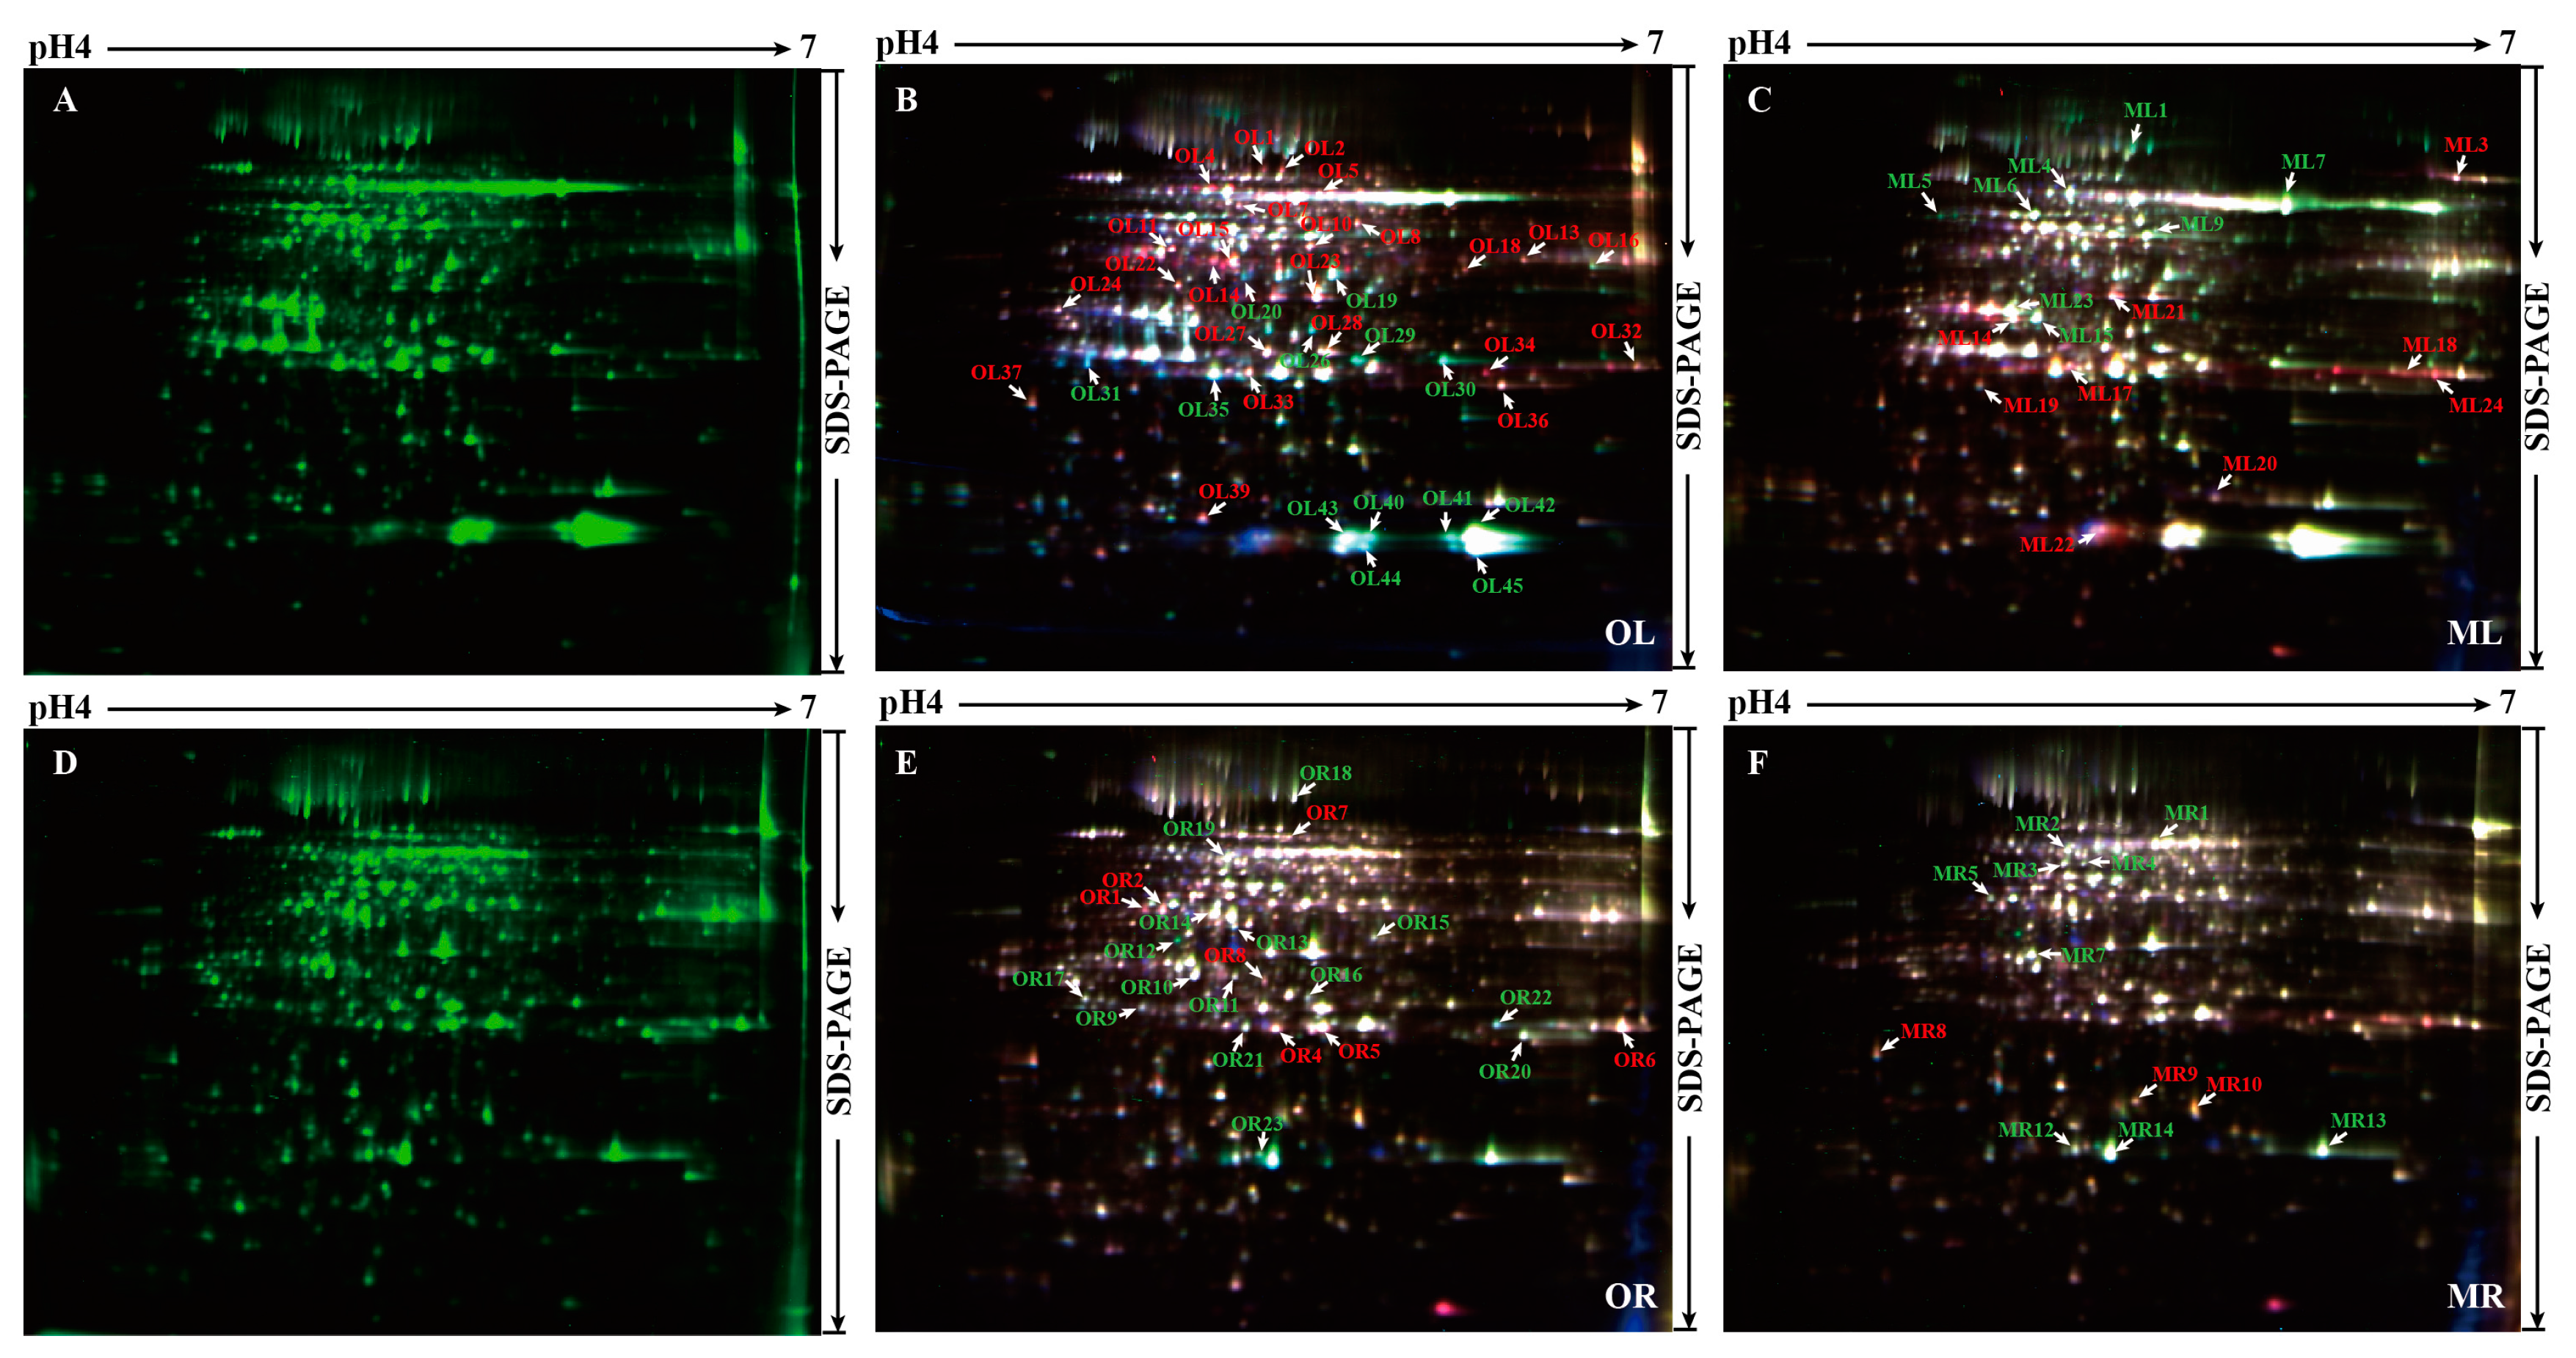
2.2. 2-D DIGE Determination and MS (Mass spectrometry) Identification of Phosphorus Responsive Proteins in 35S:WRKY6-9 and wrky6-1

The 2-D DIGE experiments were conducted to determine the differentially abundant proteins in the leaves and roots under low phosphorus treatment for 3 days in 35S:WRKY6-9 and wrky6-1. We used pH 4–7 IPG (immobilized pH gradient) strips for IEF (isoelectric focusing), and different proteins from three different samples (wild type, 35S:WRKY6-9, and wrky6-1) were labelled with different fluorescent dyes. The typical DIGE gels for each low phosphorus treatment and the combined images are presented. A total of 54 protein spots demonstrated a more than 1.5-fold change with statistically significant differences (p < 0.05) in 35S:WRKY6-9 and wrky6-1 leaves. A total of 34 protein spots demonstrated more than a 1.2-fold change with statistically significant differences (p < 0.05) in 35S:WRKY6-9 and wrky6-1 roots (Figure 2). Then, 88 differentially abundant proteins were positively identified using MALDI TOF/TOF MS/MS (Matrix-assisted laser desorption/ionization time of flight mass spectrometry). Every different abundance protein spots were listed in Figures S1 and S2, Mass spectrometry data was collected in Supplementary File S1.

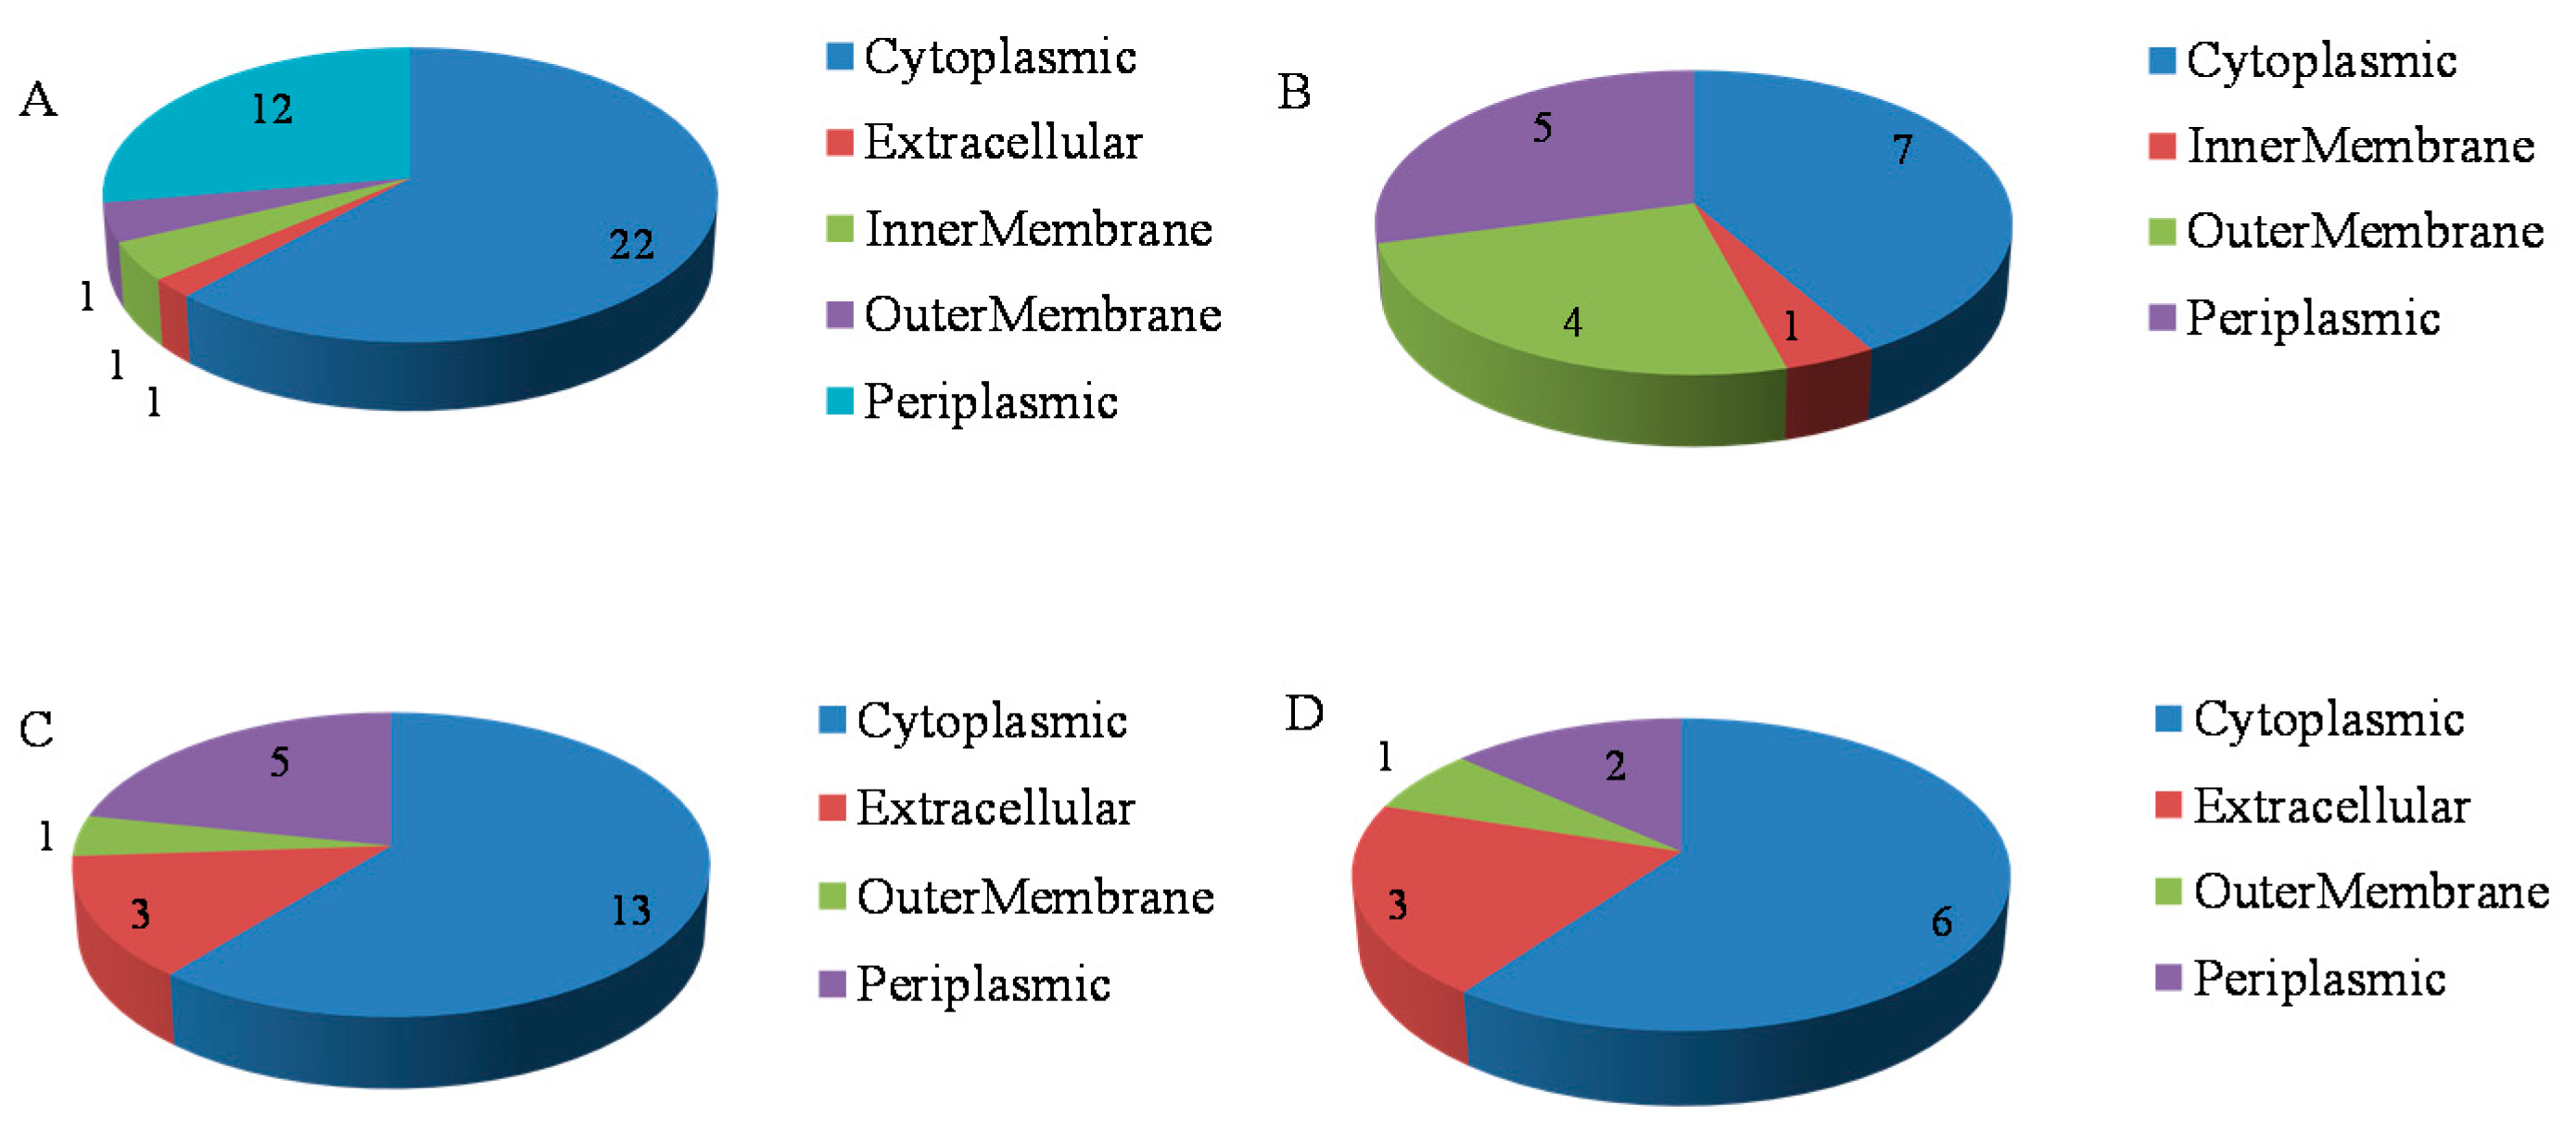
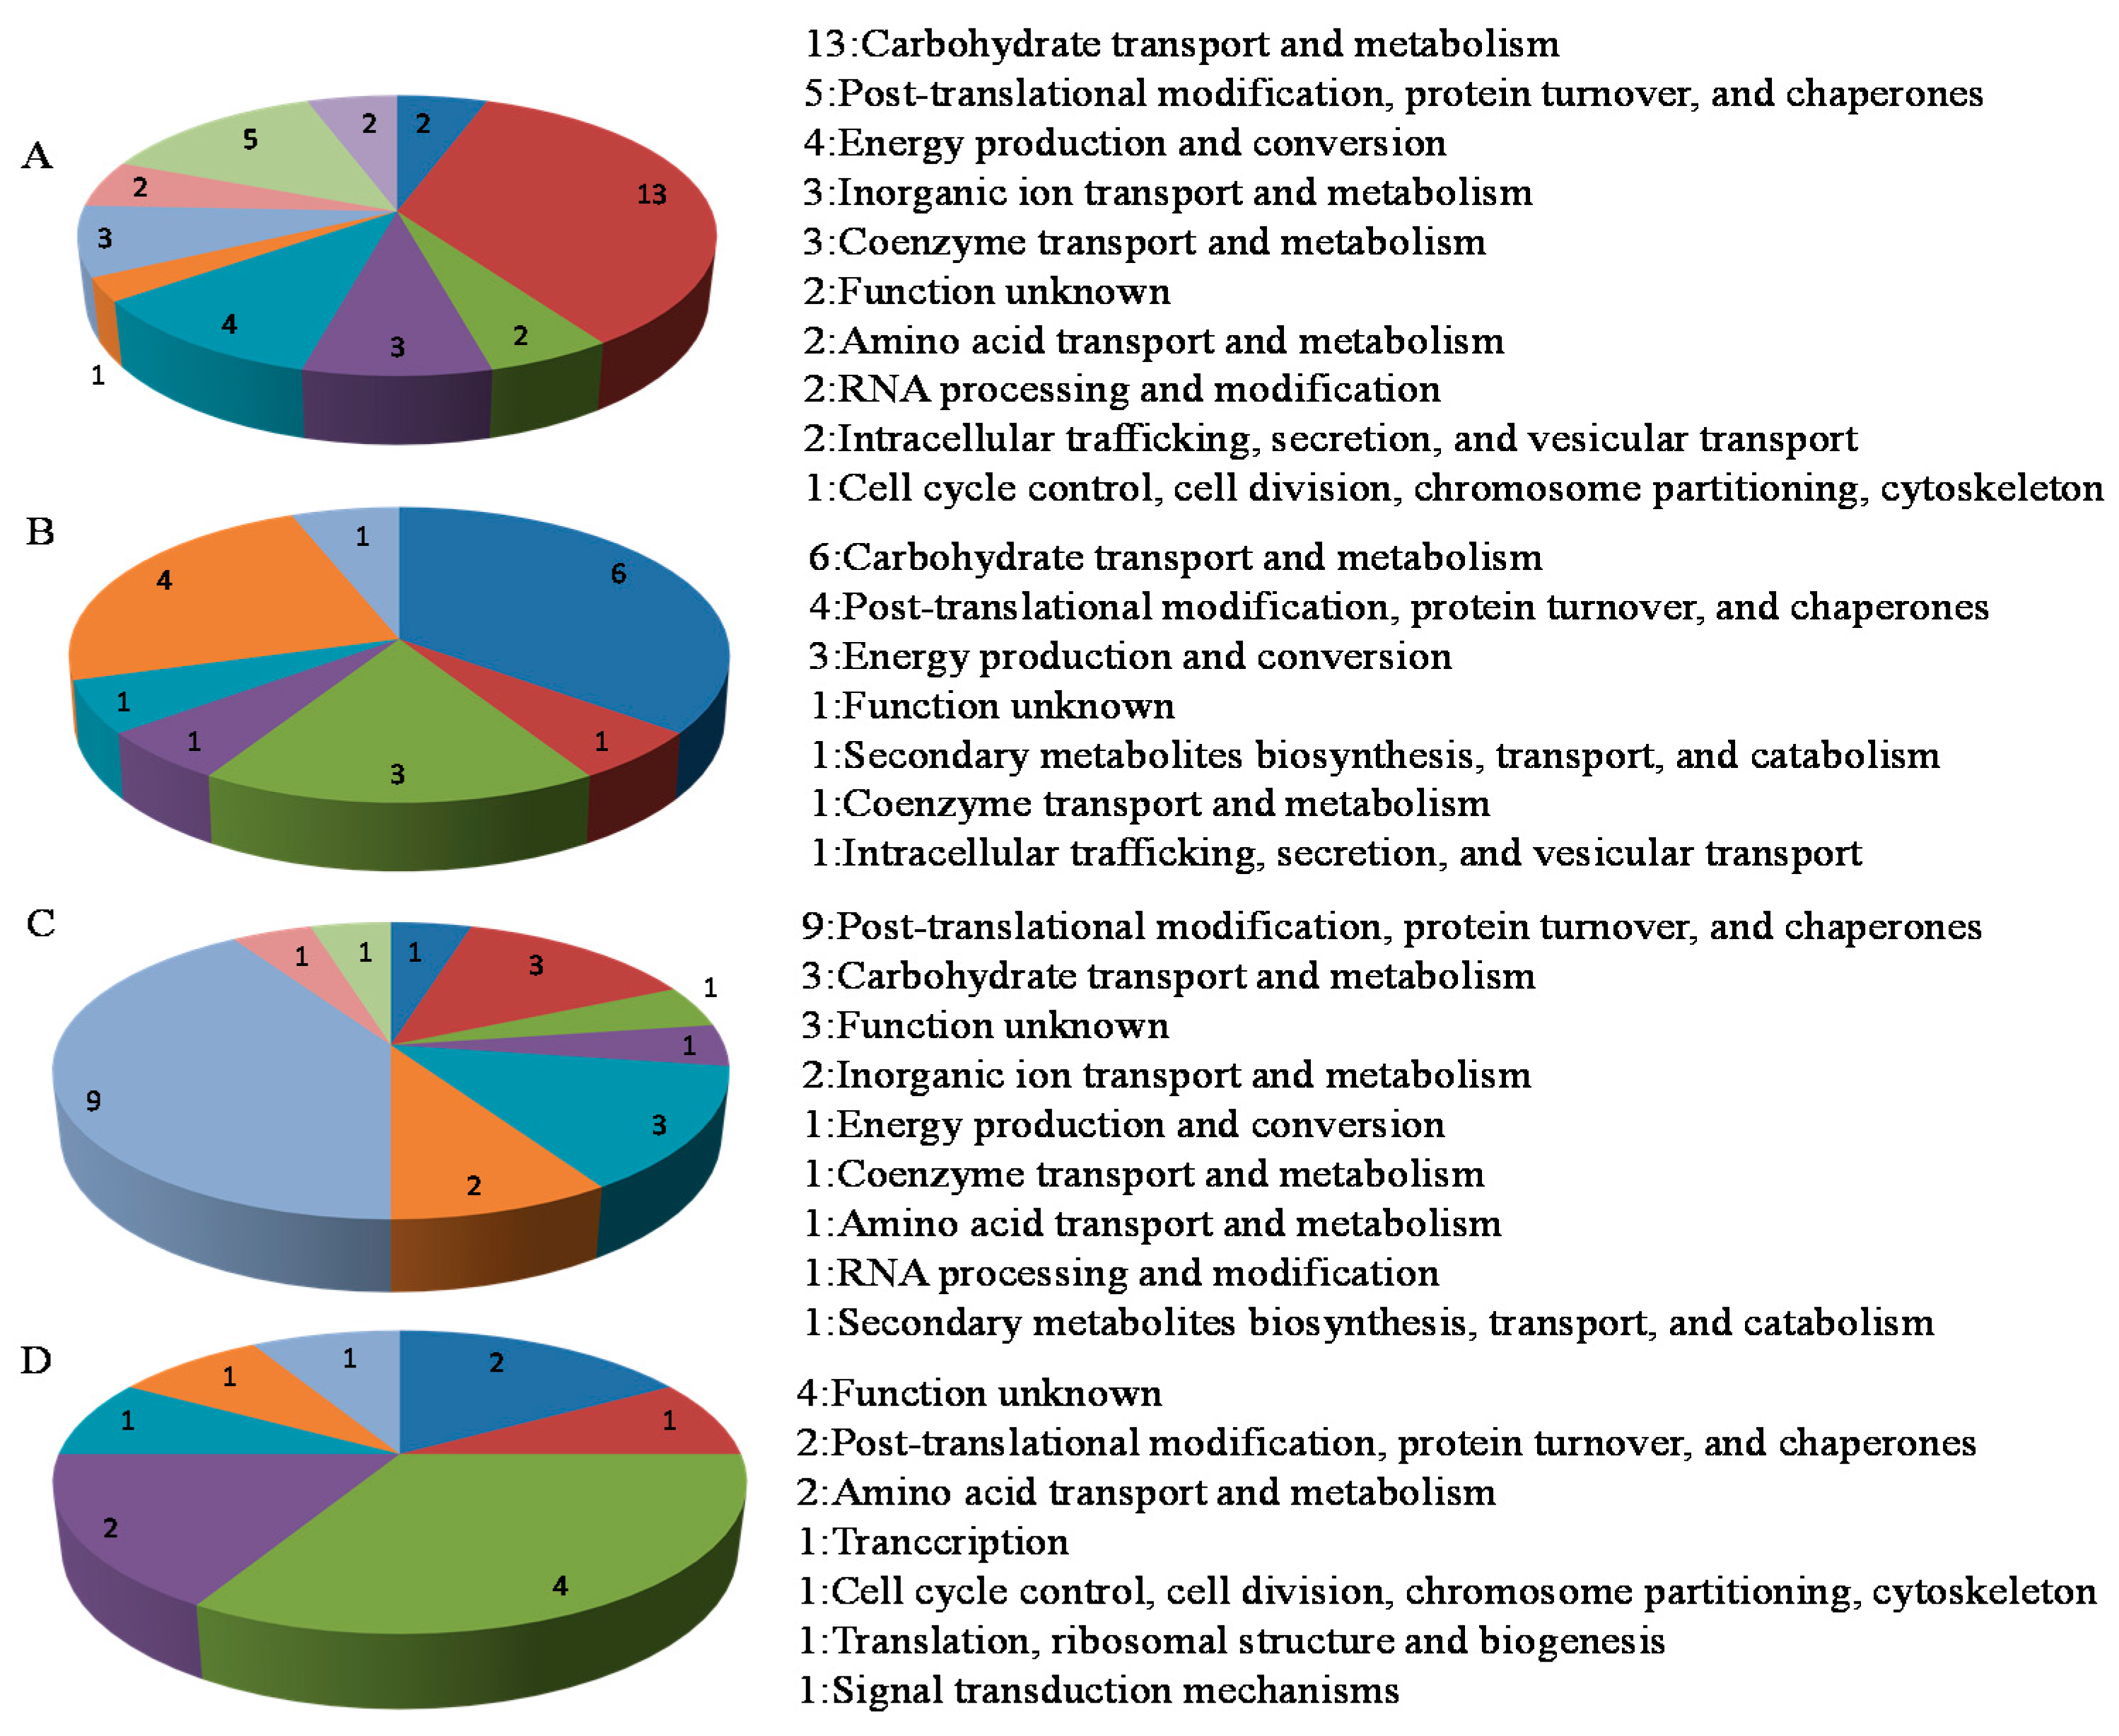
2.3. Functional Analysis of the Phosphorus Responsive Proteins

The 88 proteins identified had their subcellular locations predicted by TargetP1.1. In 35S:WRKY6-9 shoots, 22 proteins showed cytoplasmic localization, 12 proteins showed periplasmic localization, 1 showed outer membrane and 1 showed inner membrane localization, 1 protein was extracellular (Figure 3A). In wrky6-1 shoots, 7 proteins showed cytoplasmic localization, 5 proteins showed periplasmic localization, 4 showed outer membrane and 1 showed inner membrane localization, 1 protein was extracellular (Figure 3B).
13 proteins showed cytoplasmic localization, 5 proteins showed periplasmic localization, 3 proteins were extracellular, 1 showed outer membrane in 35S:WRKY6-9 roots (Figure 3C) and 6 proteins showed cytoplasmic localization, 3 proteins were extracellular, 2 proteins showed periplasmic localization, and 1 showed outer membrane in wrky6-1 roots (Figure 3D).
The 88 proteins were analysed using the EggNOG (evolutionary genealogy of genes: Non-supervised Orthologous Groups) classification system based on their main functions. In 35S:WRKY6-9 shoots, most proteins were related to carbohydrate transport and metabolism, followed by post-translational modification, protein turnover and chaperones, energy production and conversion with protein numbers of 13, 5, and 4 (Figure 4A). In wrky6-1 shoots, 6 proteins belong to carbohydrate transport and metabolism; 4 belong to post-translational modification, protein turnover and chaperones; and 3 belong to energy production and conversion (Figure 4B). In 35S:WRKY6-9 roots, post-translational modification, protein turnover and chaperones, carbohydrate transport and metabolism, and function unknown were the most common groups; the numbers were 9, 4 and 3 (Figure 4C). In wrky6-1 roots, 4 proteins belong to function unknown, 3 belong to post-translational modification, protein turnover and chaperones, and 2 belong to amino acid transport and metabolism (Figure 4D).

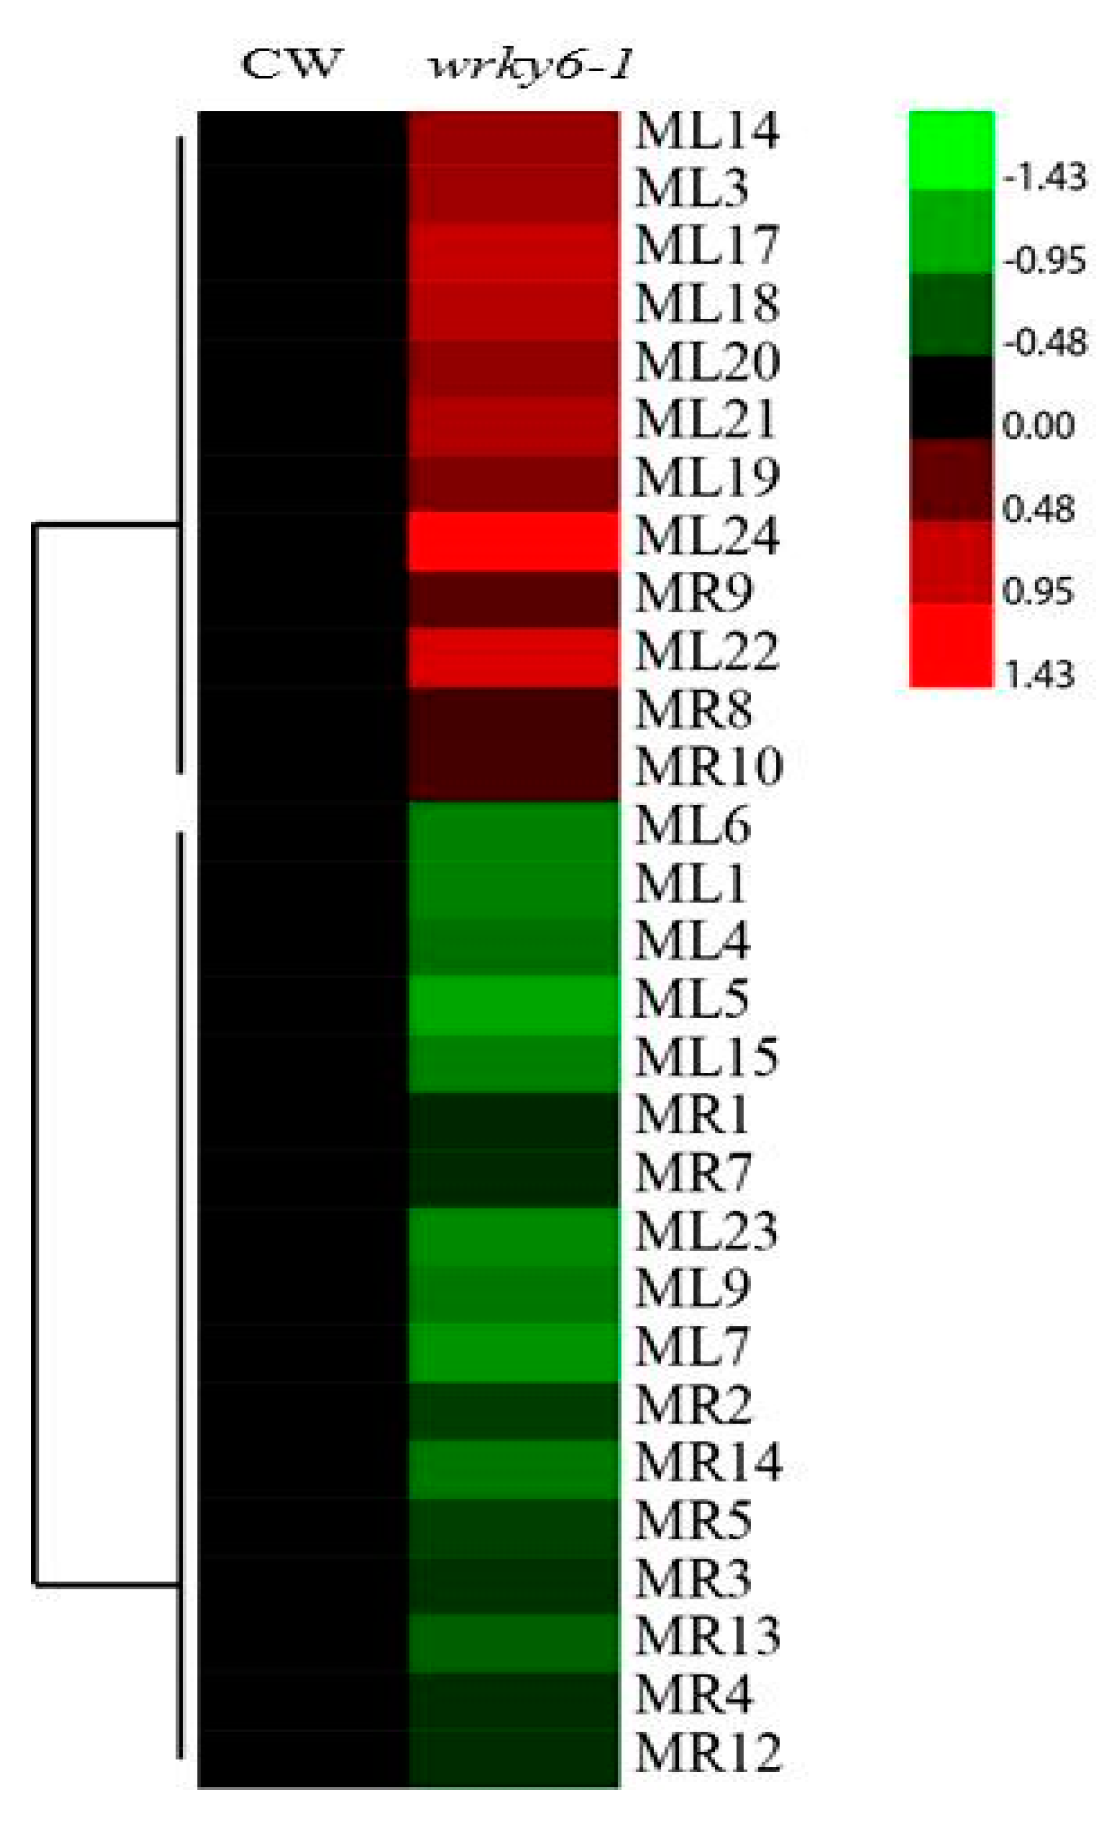
2.4. Analysis of the Differentially Abundant Proteins in wrky6-1

A total of 17 and 12 differentially abundant proteins in leaves and roots were identified between wrky6-1 and wild type in Table S1. Cluster analysis of differentially abundant proteins in wrky6-1 were listed (Figure 5). Nine proteins increased in abundance in wrky6-1 leaves. Three proteins increased, including glutathione S-transferase, Ribulose bisphosphate carboxylase, and 2-Cys peroxiredoxin, showing a 2.99-, 2.03-, and 1.89-fold increase, respectively. Three proteins predominantly decreased, including fructose-bisphosphatase, ribulose bisphosphate carboxylase, and myrosinase 1, showing a −1.93, −1.8, and −1.67-fold decrease, respectively. Four proteins increased in abundance in wrky6-1 roots. Three proteins predominantly increased, including 40S ribosomal protein, and two translationally-controlled tumour proteins, showing a 1.32-, 1.25-, and 1.23-fold increase, respectively. Three proteins, including MLP (myristoylated alanine-rich C kinase substrate like protein)-like protein 328, PYL5 (polyketide cyclase/dehydrase and lipid transport) and glutamine synthetase, predominantly decreased in abundance among most proteins identified, showing a −1.61-, −1.48-, and −1.31-fold decrease, respectively. In leaves, two protein spots identified as 2-Cys peroxiredoxin increased in abundance; three ribulose bisphosphate carboxylase decreased in abundance and one increased in abundance; in roots, two protein spots identified as the same JA (Jasmonates)-responsive protein 1 were decreased, and two translationally-controlled tumour proteins also increased in abundance.

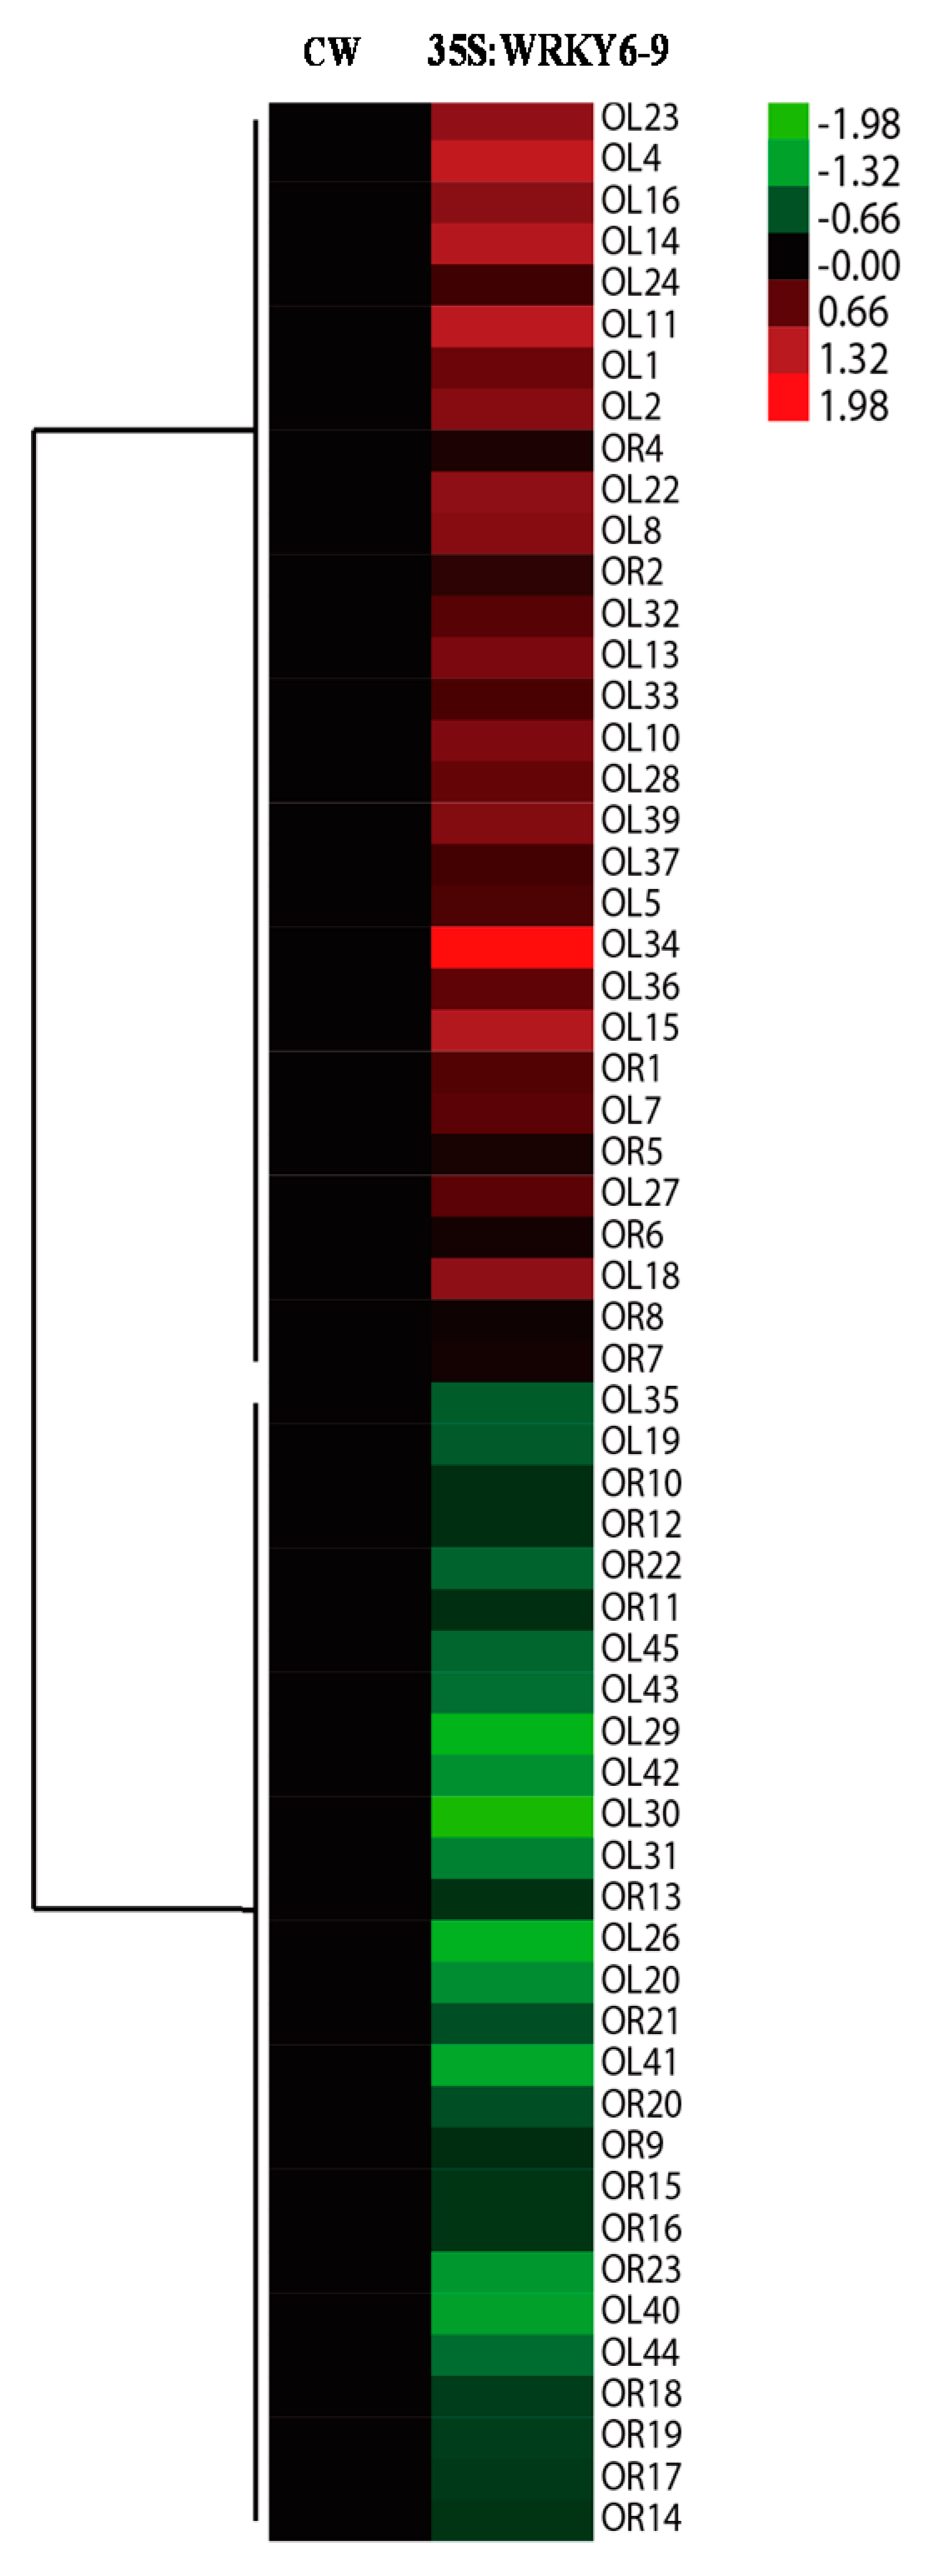
2.5. Analysis of the Differentially Abundant Proteins in 35S:WRKY6-9

A total of 37 differentially abundant proteins were identified between 35S:WRKY6-9 and wild type leaves, and 22 differentially expressed proteins were identified between 35S:WRKY6-9 and wild type roots (Table 2). Cluster analysis of differentially abundant proteins in 35S:WRKY6-9 were listed (Figure 6). The results show that 31 proteins increased in abundance in 35S:WRKY6-9 leaves. Three proteins, including glutathione S-transferase, the ATP synthase CF1 alpha subunit, and Gln synthetase predominantly increased, showing a 3.89-, 2.82-, and 2.73-fold increase, respectively. Three proteins predominantly decreased, including two carbonic anhydrase 1 proteins and carbonic anhydrase 2, showing a −4.04-, −2.98-, and −2.69-fold decrease, respectively. Eight proteins increased in abundance in 35S:WRKY6-9 roots. Three proteins increased, including carbohydrate kinase, ACC oxidase, and Chaperonin 10, showing a 1.62-, 1.37-, and 1.27-fold increase, respectively. Three proteins, including glycine-rich RNA-binding protein 8, 2 glutathione S-transferases and ferritin 1 decreased, showing a −2.16-, −1.6-, and −1.4-fold decrease, respectively.
After analysis, one 14-3-3 protein (AT4G09000) increased in abundance in 35S:WRKY6-9 leaves and one (AT5G10450) decreased in abundance in roots. One mercaptopyruvate sulfurtransferase 1 protein increased in abundance in 35S:WRKY6-9 leaves and decreased in abundance in roots. Two glutathione transferases increased in 35S:WRKY6-9 leaves, and two glutathione transferases decreased; glutathione transferases increased in 35S:WRKY6-9 roots. Two protein spots identified as the same ferritin 1 increased in abundance in 35S:WRKY6-9 leaves and decreased in roots.

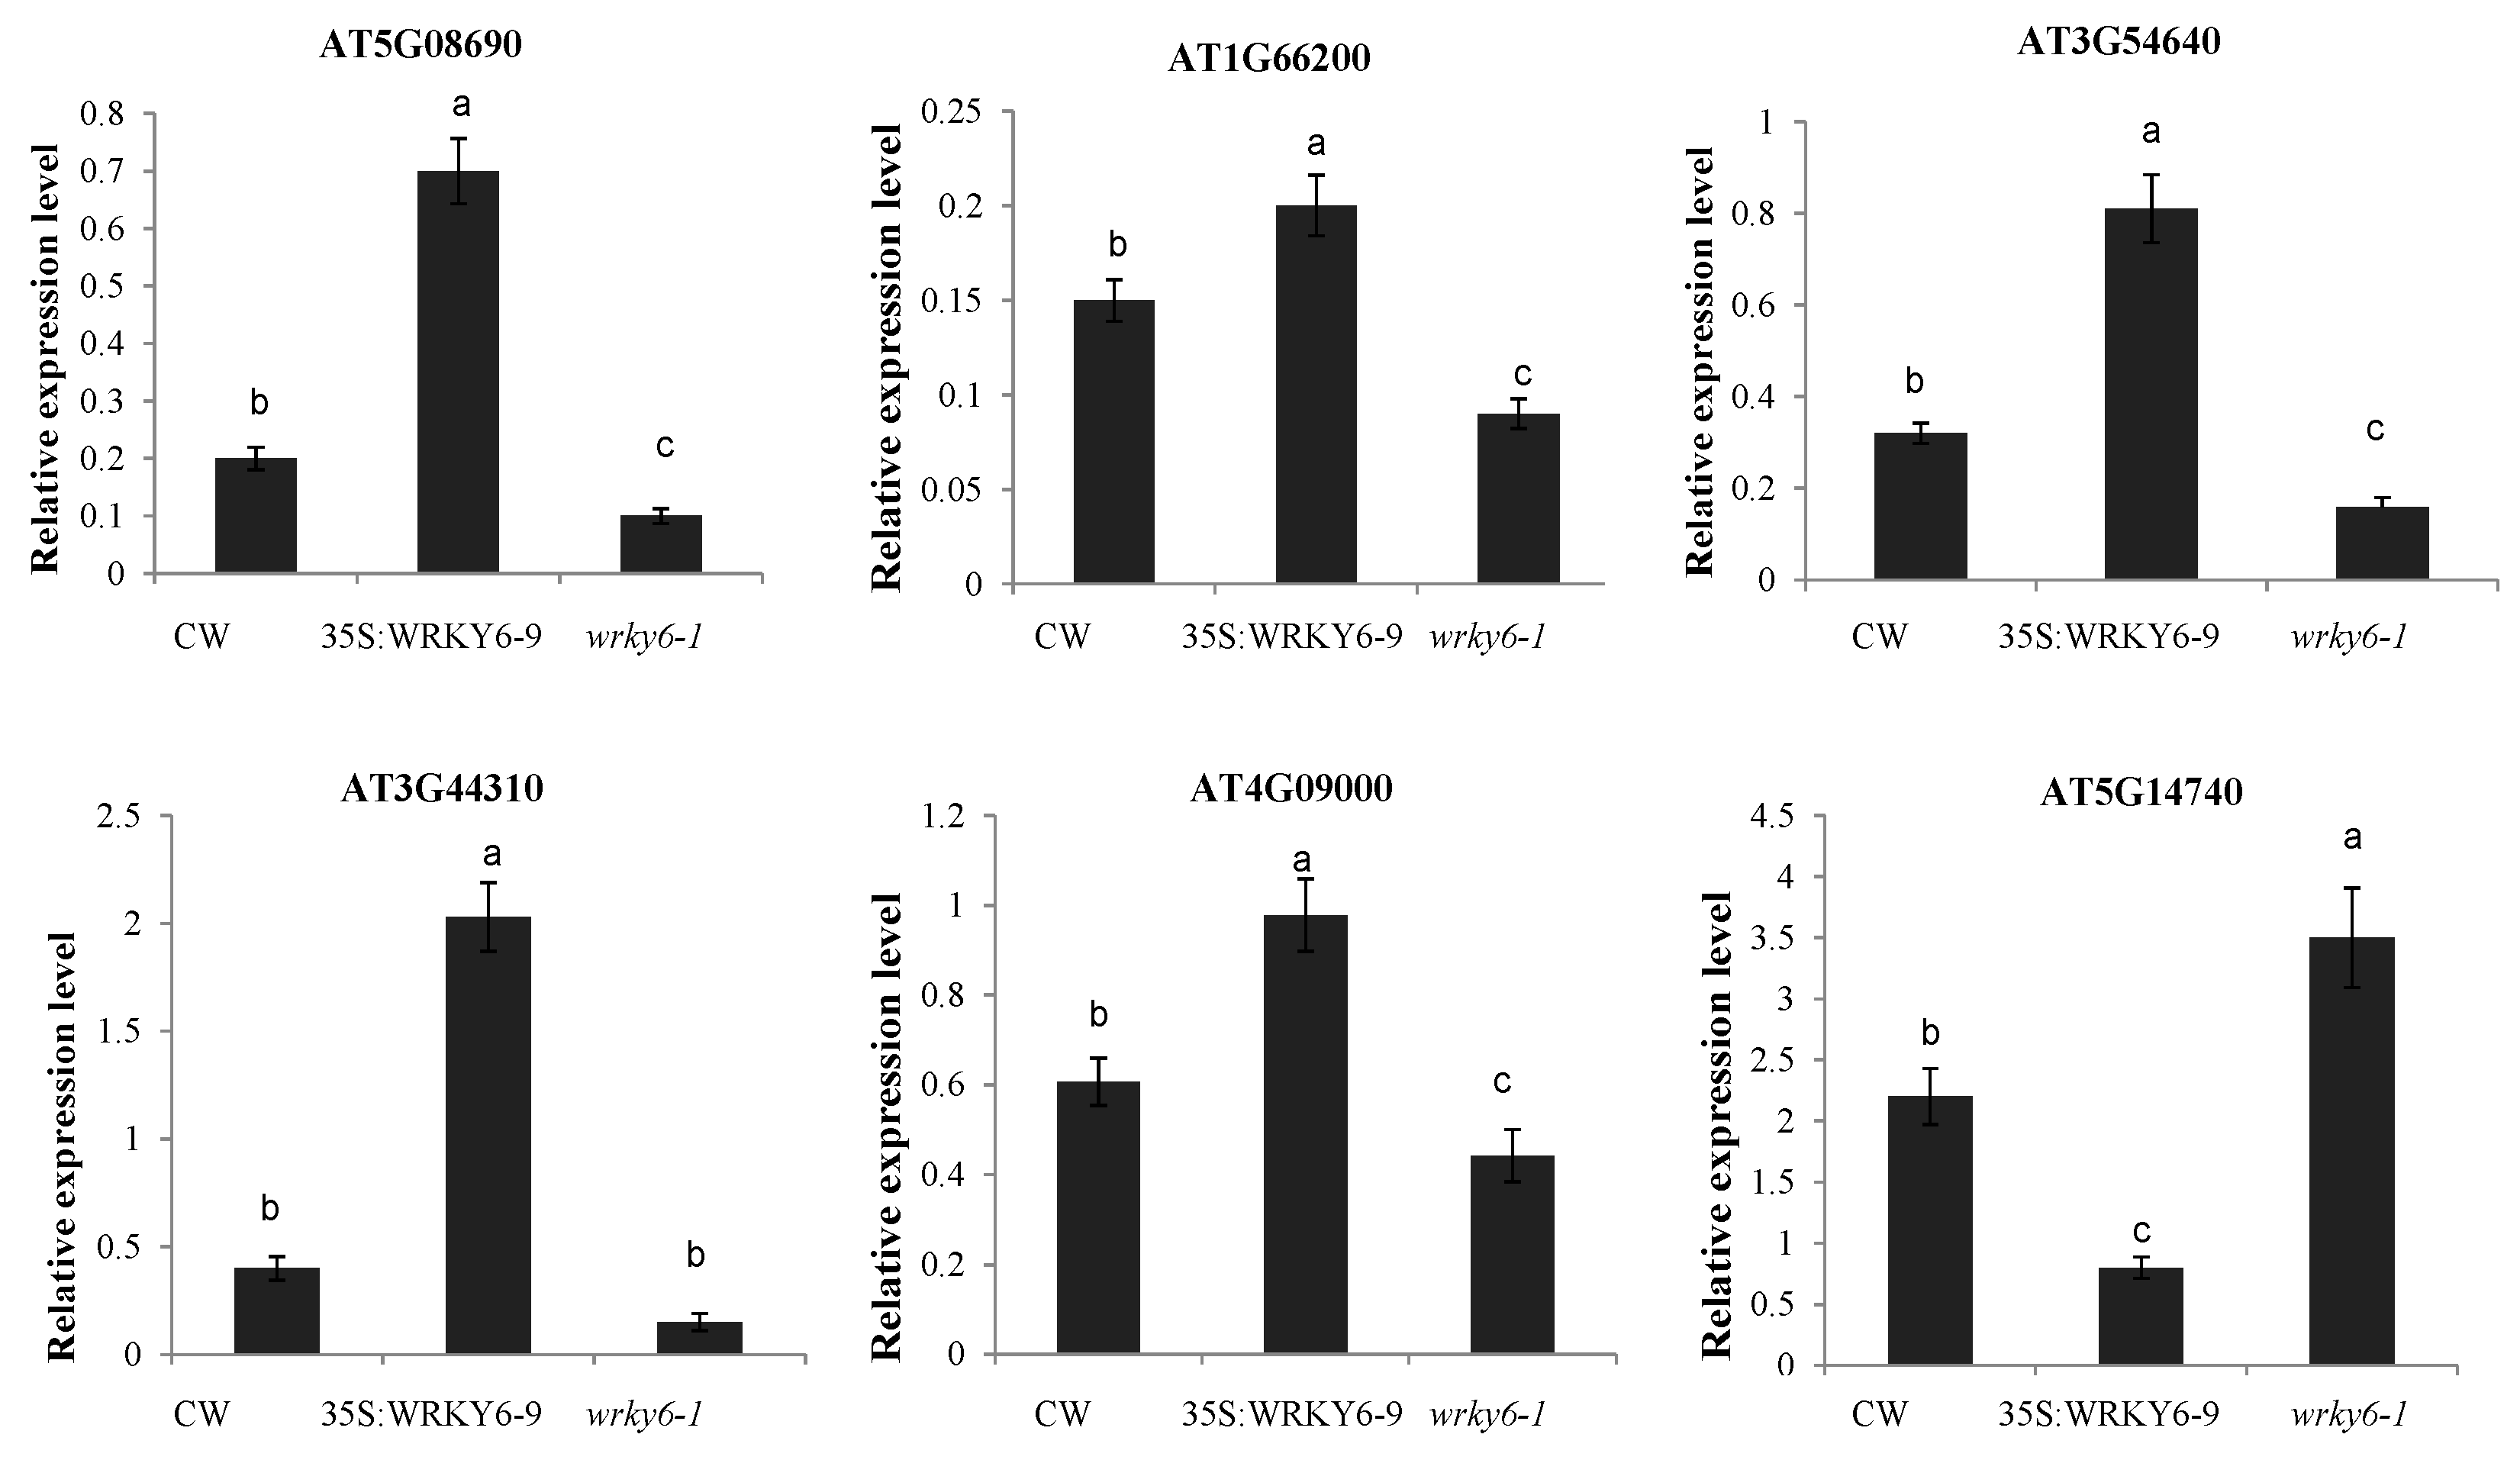
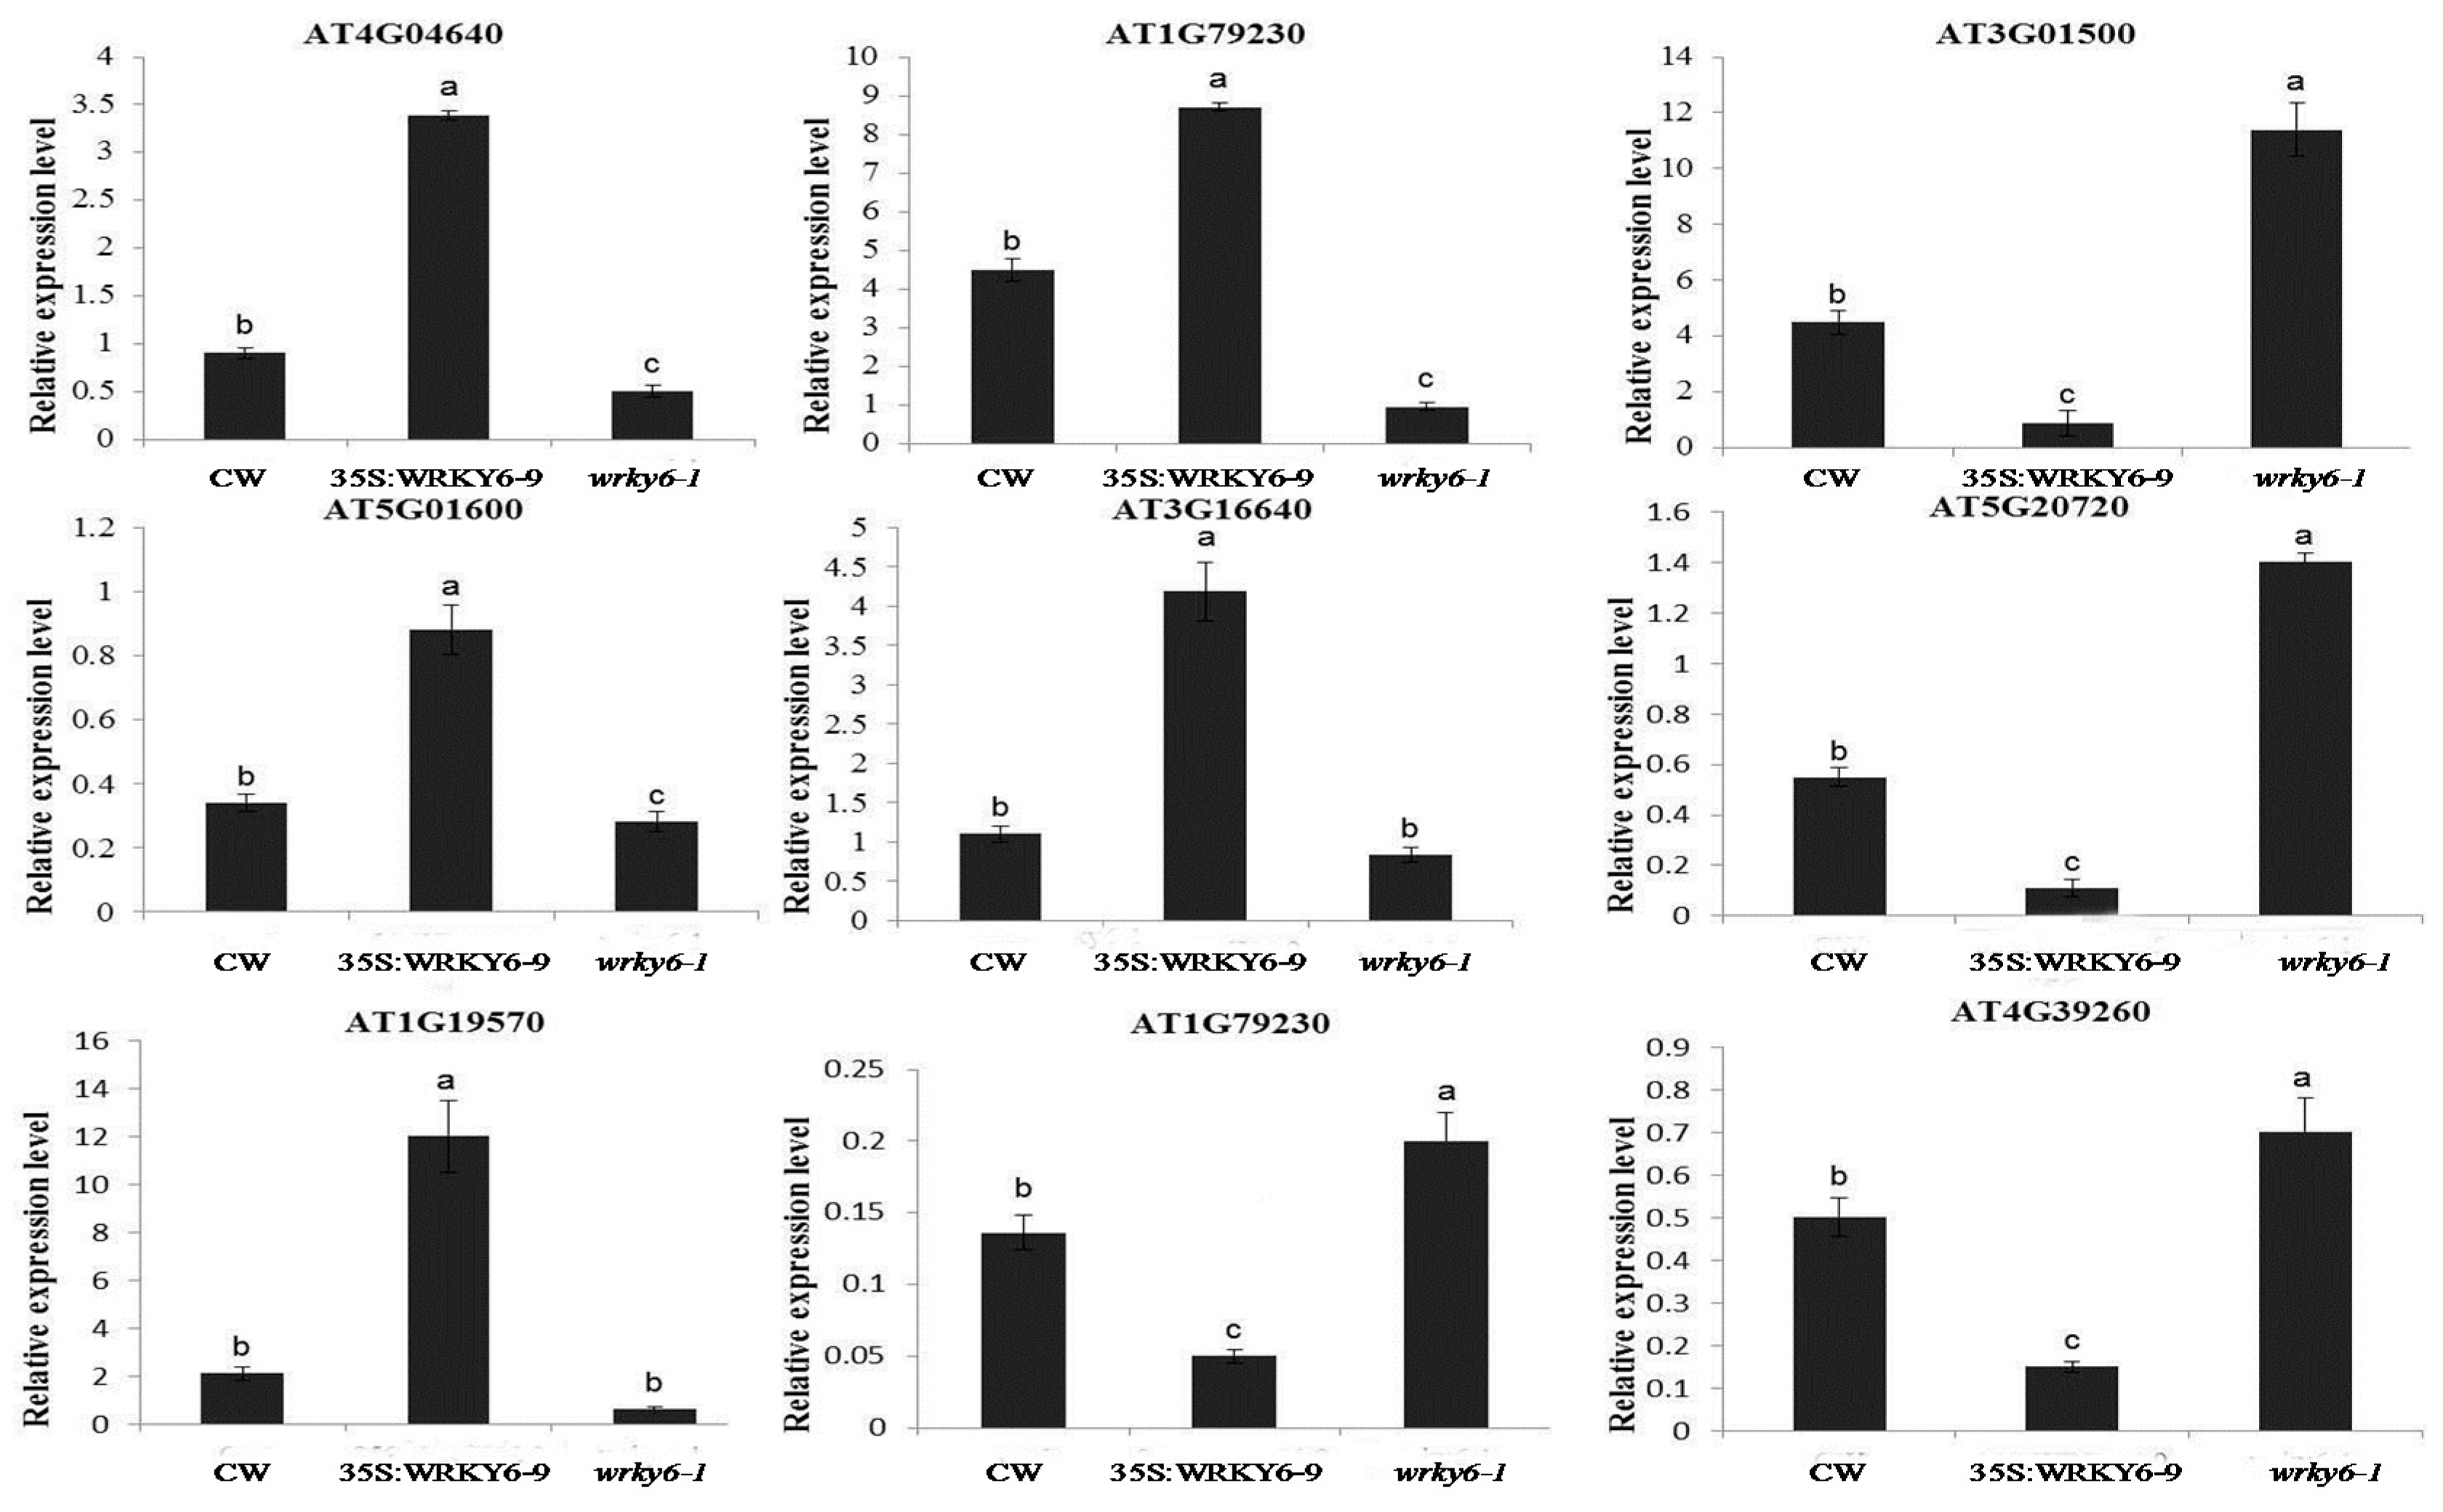
2.6. Potential Target Genes Regulated by WRKY6 in the Leaves and Roots

A total of 59 differentially abundant proteins were identified in the leaves and roots of 35S:WRKY6-9 plants. Further analysis revealed that these proteins corresponded to 59 genes. Firstly, 29 genes in leaves were checked by quantitative RT-PCR between 35S:WRKY6-9, wrky6-1 and wild type plants, 20 gene expression levels were consistent with DIGE experiment. Nine genes were not consistent. OL4 was not checked, because it was a chloroplast genome gene. Also, 22 genes in the roots were checked; 18 expression levels were consistent with DIGE experiment; 4 genes were not consistent. These gene expression patterns were listed in Table S2.
WRKY protein activates or depresses target gene expression by binding to the W-box in the promoter region. To identify target genes of WRKY6, 52 genes in 35S:WRKY6-9 leaves and roots were examined to find W-box elements in their promoter regions (2 kb); the results suggested there were 17 genes with 1–2 W-box elements (Table S3. Glutathione transferase has 2 W-box elements in the roots; 14-3-3 protein has 2 W-box elements. The other gene has one W-box element in the promoter regions.
According to gene expression patterns and W-box element numbers, we found 6 genes as potential target genes because they showed contrasting expression levels in 35S:WRKY6-9 and wrky6-1, including mitochondrial F1 ATP synthase, gln synthetase, nitrilase, 14-3-3 protein, carbonic anhydrases 2, and tryptophan synthase (Figure 7). Also, 35 genes in leaves and roots without W-box elements on the promoter had their expression level checked among three materials using qRT-PCR to find indirect regulated genes by WRKY (Table S2). The results revealed ATP synthase, mercaptopyruvate sulfurtransferase 1, carbonic anhydrase1, ferretin 1, and translationally-controlled tumour proteins as indirect regulated genes in the leaves. Chaperonin 10, dehydroascorbate reductase, mercaptopyruvate sulfurtransferase 1, and glycine-rich RNA-binding protein 8 were indirect regulated genes in the roots (Figure 8).

3. Discussion

3.1. Physiological Changes Were Induced after Phosphorus Deprivation

Three plant materials (wild type, 35S:WRKY6-9, and wrky6-1) were collected to test physiological changes after phosphorus deprivation for three days. Protein gel blot analysis suggested WRKY6 protein was degraded after low Pi stress for three days [22], so we speculated that many downstream genes of WRKY6 were regulated at transcription level. At the same time, abundance of the encoding proteins of these genes was changed to play a vital role in response to low Pi stress in Arabidopsis. With both growing on MS medium and LP medium, 35S:WRKY6-9 seedings had high chlorophyll content and less Pi content among three plant material. This indicated that the regulatory effect of WKRY6 overexpression on two contents could be independent of the Pi status of the plant. Shoot P concentration was thought to be an important factor in Arabidopsis when overexpressing MYB62. The chlorophyll content was higher and the total Pi content was significantly decreased relative to the wild-type plants under both P+ and P− conditions [26]. This is consistent with 35S:WRKY6-9 plants. Maybe transcriptional regulators as coordinated spatio-temporal regulations had many of the same functions in the regulation of Pi-responsive genes to maintenance of Pi homeostasis in plants [27]. Sugar and sucrose was reduced more in the seedings of the three materials after LP treatment than in the control, because under P starvation, plants accumulate sugars and starch in their leaves to respond to low Pi stress [28]. The sucrose content was higher in 35S:WRKY6-9 shoots than wild type and wrky6-1 under Pi-deficient conditions. Hermans et al. reported that an increased leaf sucrose concentration also results in more transport proteins delivering sucrose to the phloem, which promoted sucrose transport to roots to increase root shoot ratio under P starvation [29]; the result was consistent with more roots of 35S:WRKY6-9 in either Pi-sufficient or Pi-deficient conditions [22].
Increased root sucrose content appear to result in high phosphatases activity [30]; the overexpression of SUC2 (a SUC transporter) had high sucrose concentrations in both shoot and root tissues, and enhanced sensitivity to low P availability, including increased acid phosphatase activity [31]. Acid phosphatase activities in 35S:WRKY6-9 was higher than the other samples after low Pi stress treatment. This was probably due to sucrose concentration differences in roots.
These data indicated that the distribution of the photosynthetic carbon metabolism was altered in 35S:WRKY6-9 under low phosphate conditions.

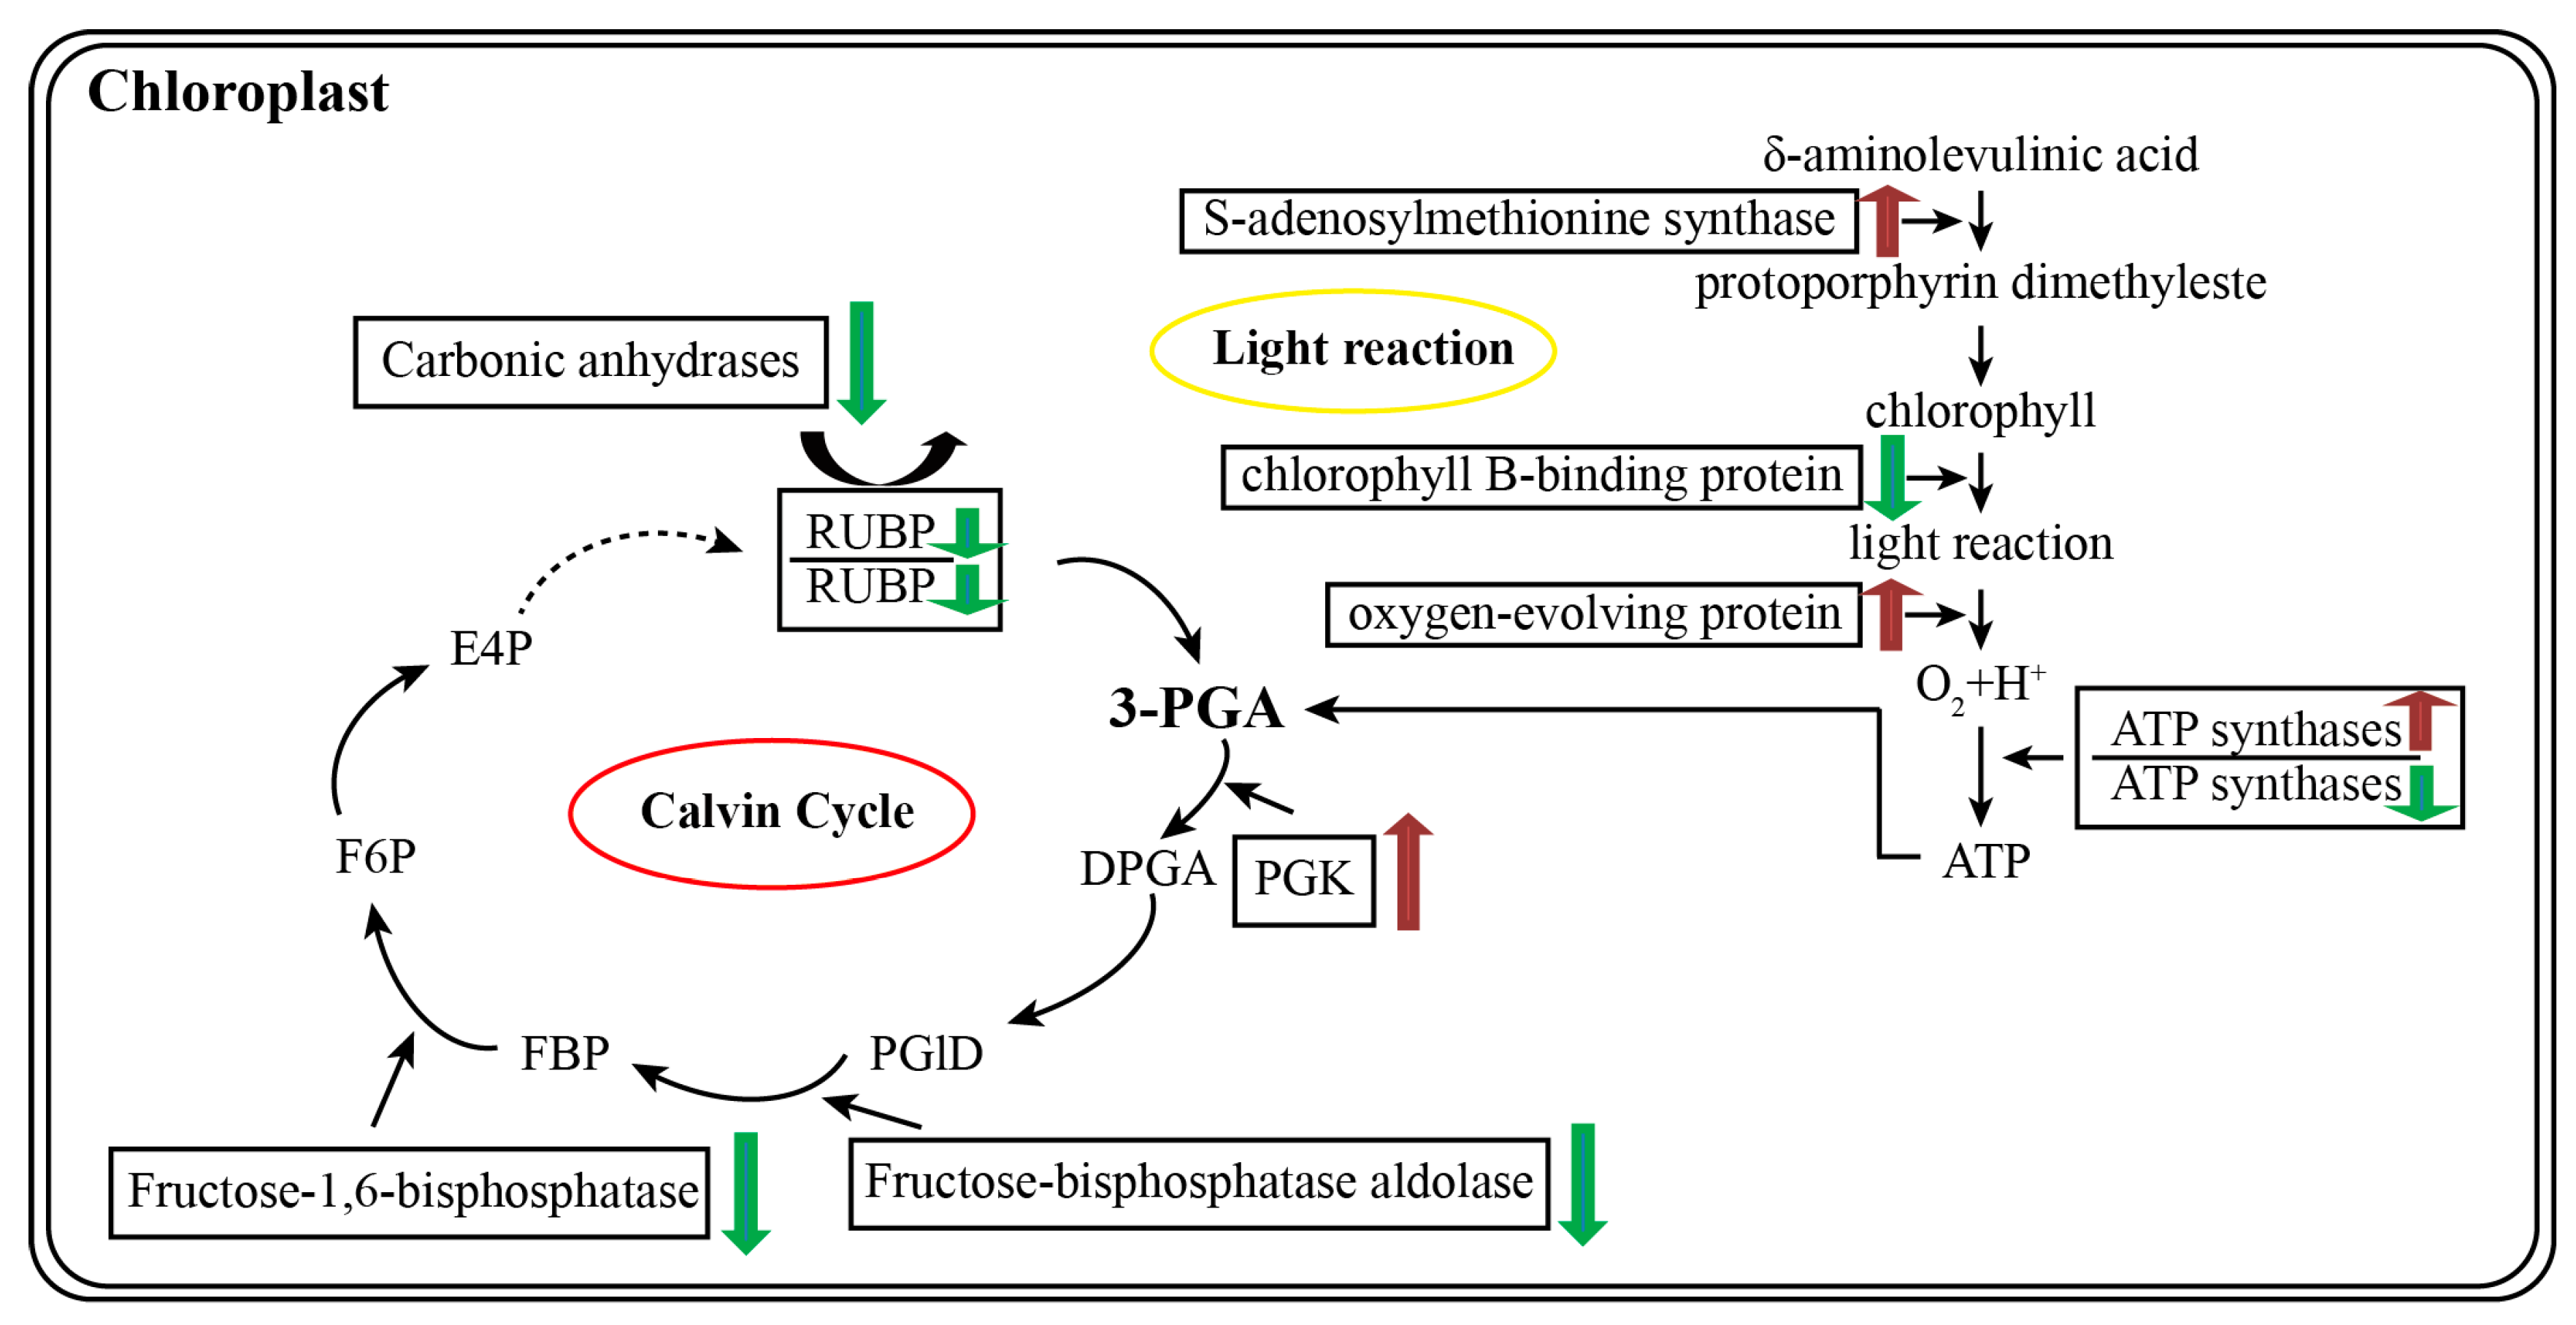
3.2. Proteomics Revealed That the Enzymes Primarily Involved in Photosynthesis Are Differentially Abundant in 35S:WRKY6-9 and wrky6-1

Photosynthesis is significantly decreased during phosphorus deprivation [32]. A total of 16 proteins related to photosynthesis have been identified in 35S:WRKY6-9. Among these proteins, 5 proteins increased in abundance and 11 proteins decreased in abundance. A total of 7 differentially expressed proteins were identified in wrky6-1, and among these proteins, 1 proteins increased in abundance and 6 proteins were decreased (Figure 9). The ATP synthase CF1 α subunit (OL4) increased in abundance in 35S:WRKY6-9 leaves and decreased 1.57-fold in wrky6-1 compared to wild-type plants. ATP synthase synthesizes ATP to power the dark reaction of photosynthesis, and ATP levels in the leaves decreased 29.32% under phosphorus deficiency stress. Decreased ATP synthase activity reduced carbon assimilation in maize [33,34], in addition to the function of this protein of Arabidopsis in mitochondrial oxidative phosphorylation, and also as a key negative regulator of plant cell death [35]. However, its expression levels were opposite in 35S:WRKY6-9 and wrky6-1 leaves. The ATP synthase CF1 α subunit e is a member of the chloroplast genome and has no promoter; thus, this protein is likely an indirect target gene of WRKY6. However, which gene can directly regulate ATP synthase expression? Answering this question requires additional studies.
A carbonic anhydrase 2 (OL26) and two carbonic anhydrase 1 (OL29, 30) proteins decreased 2.98-, 4.04- and 2.69-fold in 35S:WRKY6-9, respectively. Six ribulose bisphosphate carboxylase proteins (OL40, 41, 42, 43, 44, 45) were downregulated; this is possibly related to high sucrose concentration in 35S:WRKY6-9 shoots, as many genes encoding photosystesubunits and small subunits of Rubisco showed decreased expression when there were high sucrose concentrations in Arabidopsis leaves, resulting in a reduction of photosynthesis [36,37]. Physiological analysis showed that phosphorus deficiency reduces the carboxylase activity of RuBisCO 65.02% [38]. AtRBCS1A exhibits light-dependent expression [39]. Decreased RBCS3B expression causes severe photoinhibition, reflecting the accumulation of ROS, which accelerates the photodamage of PSII and inhibits the repair of PSII in RBCS3B-7 (cosuppression material) [38]. Phosphorus starvation reduces the rate of RuBP regeneration and inhibits the Calvin cycle. Among the six proteins related to the Calvin cycle, five proteins decreased and phosphoglycerate kinase (PGK) (OL10) increased 1.99-fold in 35S:WRKY6-9 leaves; currently, there are no reports concerning this gene as being involved in low Pi stress. PGK (phosphoglycerate kinase) is involved in ATP production and demonstrated as stress responsive in sunflowers [40], rice [41] and soybeans [42]. PGK has also been identified in responses against abiotic stresses in crops using organ-specific proteome analyses [43]. Overexpression of OsPgk2a-P in transgenic tobacco plants increased salt tolerance [44].
S-adenosylmethionine synthase (OL8) increased; this protein was also accumulated during phosphorus starvation in maize [34]. These data suggest that this enzyme was involved in the responses of Arabidopsis leaves to phosphorus starvation. Ferredoxin (OL35)—which is involved in photosynthetic electron transport—was downregulated 1.55-fold in 35S:WRKY6-9 leaves, and this protein was also downregulated in abundance in maize under phosphorus deprivation, which caused vital effects on NADPH electron transfer [34]. Fructose-bisphosphate aldolase (OL19, OL20) was decreased 1.53-fold and 2.02-fold, suggesting that sucrose synthesis was reduced in 35S:WRKY6-9 leaves; perhaps sucrose degradation was not decreased, so sucrose content was higher in 35S:WRKY6-9 shoots than wild type and wrky6-1 under phosphorus deprivation. The 33 kDa oxygen-evolving protein (ML23) increased, and this protein shows increased expression in rice infected with the rice stripe virus [45].

3.3. Proteins Related to Energy Metabolism and Stress Were Identified in 35S:WRKY6-9

In the current study, proteins related to energy metabolism and stress were differently expressed in 35S:WRKY6-9 using proteomics analysis. The enzyme 2,3-bisphosphoglycerate-independent phosphoglycerate mutase is key in glucose metabolism during the conversion between 3- and 2- acid-catalysed ADP, and two phosphoglycerate mutases (OL1 and OL2) increased 1.82- and 2.07-fold in the leaves. Malate dehydrogenase (OL13) increased 1.86-fold in the leaves, and the overexpression of the rice malic enzyme gene in Arabidopsis conferred tolerance to salt, osmotic and drought stresses [46]. Two mercaptopyruvate sulfurtransferase proteins (MST) (OL22, OR12) increased and decreased in abundance in 35S:WRKY6-9 leaves and roots. Their expression patterns were confirmed by qRT-PCR analysis. The different expression pattern in the leaves and roots suggests that these proteins have different functions in plants. Previous studies have suggested that MST activity is higher in older rather than in younger Arabidopsis plants [47], and this protein functions in Arabidopsis senescence and cyanide detoxification [48], consistent with the research paper suggesting that 35S:WRKY6-9 leaves exhibit early senescence symptoms [21].
Triose phosphate isomerase plays an important role in glycolysis, is essential for efficient energy production, and primarily functions in the catalytic conversion of triose phosphate isomers between dihydroxyacetone phosphate. Cytosolic triose phosphate isomerase (OL27 and OL28) increased 1.68- and 1.77-fold in the leaves. A triose phosphate isomerase from rice (OscTPIn) was induced in response to various abiotic stresses and methylglyoxal [49]. Several enzymes involved in oxidative stress have been described in various stress proteomics studies [50]. In the leaves, two glutathione peroxidases (OL32, OL34) increased 1.65- and 3.85-fold; these enzymes can reduce H2O2 to H2O to protect plants from oxidative damage under abiotic stress [51]. One SOD (Superoxide dismutase) (OL36) increased 1.71-fold in response to phosphorus deficiency. Furthermore, SOD increased approximately three-fold in a phosphorus-tolerant rice variety but increased 30% in phosphorus-sensitive rice [52].
Three ferredoxin protein (OL33, OL35, OR21) spots decreased. Ferritin 1 (AtFer1) regulates the phosphate starvation response 1 (AtPHR1) transcription factor and plays a vital role in iron and phosphate homeostasis under phosphate starvation stress [53]. A tCTP (translationally-controlled tumour protein from Arabidopsis thaliana) (OL37) increased 1.52-fold; in tobacco, NtTCTP (translationally-controlled tumour protein from Nicotiana tabacum) interacts with NtHK1 (histidine kinase 1 [ethylene receptor]), which stabilizes NtHK1 protein and reduces the sensitivity of plants to ethylene to promote cell proliferation and avoid excess ethylene in normal plant growth and development inhibition [54]. Therefore, we speculated that the leaves of 35S:WRKY6-9 plants grow bigger on MS medium because of high AtCTP expression levels. MLP-like protein 423 (OL 39) was upregulated 2.04-fold in 35S:WRKY6-9, and its function as a positive regulator during ABA (abscisic acid) responses confers drought tolerance in Arabidopsis thaliana [55].
Proteins such as A pfkB-like carbohydrate kinase (OR1) increased 1.62-fold, and two studies have suggested that this induction occurred in response to salt and drought in maize and sunflower in proteomics analysis [56,57]. Aminocyclopropane-1-carboxylic acid (ACC) oxidase (OR2) increased 1.37-fold in the roots. ACC oxidase is a key enzyme in the ethylene biosynthesis pathway. The ACC synthesis inhibitor AVG from Arabidopsis thaliana inhibits the occurrence of adventitious roots, and the root morphology was changed [58,59]. Ethylene regulates root hair growth and root elongation development [60]; thus, the high expression of ACC oxidase could contribute to root morphology changes in 35S:WRKY6-9 lines.
The expression of the chaperonin 10 gene (OR4) was not consistent between the results of the QPCR and DIGE experiment, as this protein increased in 35S:WRKY6-9 according to the DIGE experiment, but decreased in 35S:WRKY6-9 and increased in wrky6-1 according to the QPCR experiment. Thus, we speculated that WRKY6 negatively regulates chaperonin 10 expression under low phosphorus. This gene is reportedly induced under heat-shock abiotic stress [61]. Dehydroascorbate reductase (OR5) was upregulated 1.25-fold. In tobacco, this protein was reported to affect the level of foliar ROS and photosynthetic activity during leaf development; at least, the protein influences the rate of plant growth and leaf aging [62]. Thus, high expression levels of the protein may be related to the leaf senescence symptoms of 35S:WRKY6-9. Glutathione peroxidase (OR6) increased 1.23-fold, and 3 glutathione peroxidases (OR16, 20, 22) decreased 1.3-, 1.4- and 1.6-fold in the present study; these proteins were important and participated in a variety of abiotic stresses [63,64]. A mitochondrial chaperonin (HSP60) (OR7) was upregulated, and previous studies have suggested that this protein can combine with the F-ATPase alpha subunit in maize. HSP60 is not only involved in the nuclear gene encoding the protein into mitochondria and protein folding and assembly [65], but perhaps it is also vital to the synthesis of new proteins under low phosphorus. Glycine-rich RNA-binding protein 8 (OR23) decreased in abundance; this gene is downregulated after treatment with the stress-associated hormone, abscisic acid (ABA) [66], and rapidly increased in response to peroxide-induced oxidative stress [67], suggesting that this protein plays a vital role in stress.

3.4. Potential Target Genes of WRKY6 Identified Using Proteomics and qRT-PCR Analysis

A total of 6 genes were identified as potential target genes using DIGE and qRT-PCR analysis. First, a mitochondrial F1 ATP synthase showed increased abundance in 35S:WRKY6-9 leaves and decreased in wrky6-1 compared to wild type. In addition, one W-box element was identified in the promoter of this gene. Thus, WRKY6 may activate this gene expression to adopt to low phosphorus stress. Overexpression of a mitochondrial ATP synthase (AtMtATP6) confers tolerance to several abiotic stresses in Saccharomyces cerevisiae and Arabidopsis thaliana [68].
In leaves, glu synthetase (OL11) showed an increased expression in 35S:WRKY6-9 and decreased expression in wrky6-1; in roots two protein spots (MR5 and MR6) corresponding to the same gene decreased in wrky6-1 by DIGE analysis. Thus, this gene expression pattern was consistent in two experiments. In rice, GS1 2-overexpressed lines exhibited higher sensitivity to salt, drought, and cold stress [69]; this phenotypic is similar to 35S:WRKY6-9 and sensitive to abiotic stress. Nitrilase (OL18) showed the opposite expression pattern in 35S:WRKY6-9 and wrky6-1 leaves. Nitrilase was involved in the IAA biosynthesis pathway and the defence response to microbial pathogens [70]. The 14-3-3 proteins (OL24, OR17) were upregulated and downregulated. As a 14-3-3 family member, GRF9 plays a role in Pi starvation-induced responses [71]. Zhou et al. reported that the interaction between 14-3-3 proteins and SOS2 activates the SOS pathway for salt tolerance [72]. Carbonic anhydrase 2 (CA2,OL26) proteins decreased 2.98- fold in 35S:WRKY6-9. CA (Carbonic anhydrase) accelerates a conversion of carbon dioxide and water to bicarbonate and protons in the cell and CO2 transport to active photosynthetic cells, thereby improving the photosynthesis rate [73]. Under low phosphorus stress, 35S:WRKY6-9 leaves exhibit yellowing, and senescence was likely affected by decreased carbonic anhydrase expression. A tryptophan synthase (OR8) increased in abundance; in response to low Pi starvation this protein can promote the formation of tryptophan, the auxin precursor, for auxin-induced lateral root formation in the siz1 mutant in response to low Pi starvation [8]; this agrees with more lateral root formation in 35S:WRKY6-9 under low phosphorus stress.

4. Materials and Methods

4.1. Plant Materials and Low Phosphorus Treatment

The WRKY6 overexpression line (35S:WRKY6-9) and the WRKY6 knockout mutant (wrky6-1) were kindly provided by ImreE. Somssich (Max-Planck-Institute, Munchen, Germany). The Arabidopsis thaliana seeds (wild type, 35S:WRKY6-9, and wrky6-1) were surface sterilized using mixed solutions of NaClO (0.5%) and Triton X-100 (0.01%) for 15 min, followed by washing five times with sterilised distilled water on a clean working table. The sterilised seeds were first incubated in Petri dishes containing MS agar (0.8%) medium (containing 1.25 mM KH2PO4 and 3% sucrose) at 4 °C for 2 days prior to germination. The seeds were germinated at 22 °C under constant illumination at 40 µmol·m−2·s−1 and the 7-day-old seedlings were transferred to Pi-deficient medium (LP) for 3 days. The LP medium was generated by the modification of MS medium, such that the Pi (supplied with KH2PO4) concentration in LP medium was 10 µM, and agar was replaced with agarose (Promega Corporaion, Madison, WI, USA) to avoid the contamination of phosphorous. After 3 days of LP treatment, three plant materials were collected for measurements of biochemical data such as Pi content, reducing sugar content, sucrose content, chlorophyll content in seedlings, and acid phosphatase activity in the root. For Pi content measurements, the seedings were oven dried at 80 °C for 48 h and ashed in a muffle furnace at 300 °C for 1 h and 575 °C for an additional 5 h and then dissolved in 0.1 N HCl. The total Pi content in the samples was quantified as described previously [74]. Extraction and content determination of the chlorophyll experiment were performed according to the method [75]. Measurements of reducing sugar and sucrose content were carried out following the methods described [76,77]. Approximately 0.5 g of root tissue was collected to check acid phosphatase activity using p-nitrophenol phosphate as the substrate. Activity was quantified by comparing the absorption at 410 nm to a standard curve of diluted p-nitrophenol solutions and NaOH [78]. At the same time, the leaves and roots of three plant materials were collected for the extraction of total protein and RNA.

4.2. Protein Extraction and 2-D DIGE Analysis

Leaf and root proteins of six Arabidopsis samples were extracted using the Borax/PVPP (Polyvinyl polypyrrolidone)/Phenol (BPP) protocol [79]. The protein concentration was determined using a Bradford assay. Bovine serum albumin (BSA) was used as a standard. DIGE (two-dimensional difference in gel electrophoresis) was performed as previously described [80], and the details of 2D-DIGE experiments were shown in Table S4; wild type was used as a control. Each protein sample extracted from the leaves and roots was treated with Pi-deficient medium and labelled with a ratio of 250 pmol Cy2, Cy3 and Cy5 minimal labelling dye (GE Healthcare, Little Chalfont, UK) per 50 μg of protein. The reactions were quenched after the addition of 1 μL of 10 mM lysine, followed by mixing and incubation on ice for 10 min in the dark. The three labelled and quenched samples were combined, and a total of 150 μg of protein was added to rehydration buffer (7 M urea, 2 M thiourea, and 2% w/v CHAPS) containing 0.5% IPG buffer to a final volume of 450 μL. IEF was performed on pH 4–7, 24 cm IPG strips (GE Healthcare). Two-dimensional electrophoresis was performed using 12.5% SDS-PAGE (dodecyl sulfate sodium salt polyacrylamide gel electrophoresis). The Cy2-, Cy3- and Cy5-labelled 2-DE images were subsequently acquired using a Typhoon Trio scanner (GE Healthcare), and the DIGE images were analysed using DeCyder 7.0 software (GE Healthcare). A differential in-gel analysis module was used for spot detection, and a biological variation analysis module was applied to the three biological repeats to identify the differentially abundant spots with higher than 95% confidence in 35S:WRKY6-9 and wrky6-1 plant samples.

4.3. Protein Identification via Mass Spectrometry and Bioinformatics Analysis

The target protein spots were manually excised and in-gel digested using bovine trypsin as previously described [80]. The mass spectra of the peptides were acquired on an AB 5800 MALDI-TOF/TOF mass spectrometry (MS) instrument (AB SCIEX, Foster City, CA, USA) equipped with a neodymium laser with a laser wavelength of 349 nm. The measured tryptic peptide masses were transferred to Protein Pilot Software (AB SCIEX, Foster City, CA, USA) and used for a Mascot Algorithm (version2.2, Matrix Science, Boston, USA) search of the taxonomy of Viridiplantae in the nonredundant NCBI (NCBInr) database (NCBIprot 20170414; 119815302 sequences; 43934382767 residues). Proteins with protein score confidence intervals above 95% (total protein score higher than 50) were considered as confident identifications; at the same time, at least two peptides or a coverage of 5% is requested to accept the protein identification. The identified proteins were searched using EggNOG (https://eggnog.embl.de) to confirm their functions, followed by TargetP1.1 (http://www.cbs.dtu.dk/services/TargetP/) to predict their subcellular locations. Subsequently, a gene ontology (GO) analysis was performed using the Blast software 2GO as previously described [81]. Finally, in-house BLAST searching of UniProtKB was performed for each protein to identify its homology and confirm its detailed cellular component, biological process, and molecular function.

4.4. Gene Expression Analysis by qRT-PCR

For qRT-PCR analysis, total RNA in leaves and roots after 3 days of LP treatment were isolated using TRIzol reagent (Invitrogen, Carlsbad, CA, USA) according to the manufacturer’s protocol. RNA samples were treated with RNasefree DNase I (Takara, Tokyo, Japan) to digest genomic DNA. The quality of the RNA was checked using an Agilent 2100 RNA Bioanalyzer (Agilent, Santa Clara, CA, USA). Then, the cDNA was synthesized from the treated total RNA by SuperScript II Reverse Transcriptase (Invitrogen) using Random Hexamer Primers (Promega). The qRT-PCR was performed on a 7500 Real Time PCR System machine (Applied Biosystems, Carlsbad, CA, USA) following the manufacturer’s protocols. The 20 μL reaction mixture included 10 μL of 2× SYBR Green Master Mix Reagent (TaKaRa Corporaion, Dalian, China), 10 ng cDNA template, and 0.3 μM each of gene-specific primers. The thermal treatment was 10 min at 95 °C, then 40 cycles of 15 s at 95 °C, 1 min at 60 °C. Amplification was followed by a melt curve analysis. The 2−ΔΔCt method was used for relative quantification. Actin 2/8 expression was used as an internal control. The statistical significance was evaluated by Paired t-test analysis. The primers used are listed in Table S5.

4.5. Statistical Analysis

The data were subjected to the unpaired student t test at levels of p ≤ 0.01 and p ≤ 0.05. Data are shown as mean ± SE (n = 5 or 3) and n represents the biological replicates. Excel 2010 (Microsoft Corporaion, Redmond, WA, USA) and SPSS14.0 software (IBM, New York, NY, USA) were used for data statistics.

Supplementary Materials

Supplementary materials can be found at www.mdpi.com/1422-0067/18/5/1046/s1.

Acknowledgments

This research was financially supported by a grant from the National Natural Science Foundation (31070244) and State Key Laboratory of Plant Physiology and Biochemistry (SKLPPBKF1505 and SKLPPBKF1506).We thank Imre E. Somssich (Max-Planck-Institut für Züchtungsforschung, Abteilung Biochemie, Germany) for kindly providing AtWRKY6 overexpression lines 35S:WRKY6-9 and the AtWRKY6 knockout mutant (wrky6-1). We thank Xuchu Wang and Dan Wang from the Institute of Tropical Biosciences and Biotechnology, Chinese Academy of Tropical Agricultural Sciences, for technical support with the 2-DE analysis and protein identification performed in the present study.

Author Contributions

Li-Ming Lu, Li-Qin Li and Xi-Yao Wang designed the experiments. Lu-Ping Huang, Gang Pan, Lun Liu performed the experiments and analyzed the data. Li-Qin Li and Li-Ming Lu wrote the paper. All authors have given approval of the final version of the manuscript.

Conflicts of Interest

The authors declare no conflict of interest.

References

  1. Wissuwa, M. How do plants achieve tolerance to phosphorus deficienby? Small causes with big effects. Plant Physiol. 2003, 133, 1947–1958. [Google Scholar] [CrossRef] [PubMed]
  2. Shen, J.; Yuan, L.; Zhang, J.; Li, H.; Bai, Z.; Chen, X.; Zhang, W.; Zhang, F. Phosphorus dynamics: From soil to plant. Plant Physiol. 2011, 156, 997–1005. [Google Scholar] [CrossRef] [PubMed]
  3. Lynch, J.P. Root phenes for enhanced soil exploration and phosphorus acquisition: Tools for future crops. Plant Physiol. 2011, 156, 1041–1049. [Google Scholar] [CrossRef] [PubMed]
  4. Plaxton, W.C.; Tran, H.T. Metabolic adaptations of phosphate starved plants. Plant Physiol. 2011, 156, 1006–1015. [Google Scholar] [CrossRef] [PubMed]
  5. Wang, H.; Xu, Q.; Kong, Y.H.; Chen, Y.; Duan, J.Y.; Wu, W.H.; Chen, Y.F. Arabidopsis WRKY45 transcription factor activates Phosphate transporter 1;1 expression in response to phosphate starvation. Plant Physiol. 2014, 164, 2020–2029. [Google Scholar] [CrossRef] [PubMed]
  6. Su, T.; Xu, Q.; Zhang, F.C.; Chen, Y.; Li, L.Q.; Wu, W.H.; Chen, Y.F. WRKY42 modulates phosphate homeostasis through regulating phosphate translocation and acquisition in Arabidopsis. Plant Physiol. 2015, 167, 1579–1591. [Google Scholar] [CrossRef] [PubMed]
  7. Bari, R.; Pant, B.D.; Stitt, M.; Scheible, W.R. PHO2, microRNA399, and PHR1 define a phosphate signaling pathway in plants. Plant Physiol. 2006, 141, 988–999. [Google Scholar] [CrossRef] [PubMed]
  8. Miura, K.; Lee, J.; Gong, Q.; Ma, S.; Jin, J.B.; Yoo, C.Y.; Miura, T.; Sato, A.; Bohnert, H.J.; Hasegawa, P.M. SIZ1 Regulation of phosphate starvation induced root architecture remodeling involves the control of auxin accumulation. Plant Physiol. 2011, 155, 1000–1012. [Google Scholar] [CrossRef] [PubMed]
  9. Smith, A.P.; Jain, A.; Deal, R.B.; Nagarajan, V.K.; Poling, M.D.; Raghothama, K.G.; Meagher, R.B. Histone H2A.Z regulates the expression of several classes of phosphate starvation response genes but not as a transcriptional activator. Plant Physiol. 2010, 152, 217–225. [Google Scholar] [CrossRef] [PubMed]
  10. Cheng, L.; Bucciarelli, B.; Liu, J.; Zinn, K.; Miller, S.; Patton, V.J.; Allan, D.; Shen, J.; Vance, C.P. White lupin cluster root acclimation to phosphorus deficiency and root hair development involve unique glycerophosphodiester phosphodiesterases. Plant Physiol. 2011, 156, 1131–1148. [Google Scholar] [CrossRef] [PubMed]
  11. Chiou, T.J.; Lin, S.I. Signaling network in sensing phosphate availability in plants. Annu. Rev. Plant Biol. 2011, 62, 185–206. [Google Scholar] [CrossRef] [PubMed]
  12. Alexova, R.; Millar, A.H. Proteomics of phosphate use and deprivation in plants. Proteomics 2013, 13, 609–623. [Google Scholar] [CrossRef] [PubMed]
  13. Li, K.; Xu, C.; Li, Z.; Zhang, K.; Yang, A.; Zhang, J. Comparative proteome analyses of phosphorus responses in maize (Zea mays L.) roots of wild-type and a low-P-tolerant mutant reveal root characteristics associated with phosphorus efficiency. Plant J. 2008, 55, 927–939. [Google Scholar] [CrossRef] [PubMed]
  14. Lan, P.; Li, W.; Schmidt, W. Complementary proteome and transcriptome profiling in phosphate-deficient Arabidopsis roots reveals multiple levels of gene regulation. Mol. Cell. Proteom. 2012, 11, 1156–1166. [Google Scholar] [CrossRef] [PubMed]
  15. Kim, S.G.; Wang, Y.; Lee, C.H.; Mun, B.G.; Kim, P.J.; Lee, S.Y.; Kim, Y.C.; Kang, K.Y.; Rakwal, R.; Agrawal, G.K.; et al. A comparative proteomics survey of proteins responsive to phosphorous starvation in roots of hydroponically-grown rice seedlings. J. Korean Soc. Appl. Biol. Chem. 2011, 54, 667–677. [Google Scholar] [CrossRef]
  16. Chen, Z.; Cui, Q.; Liang, C.; Sun, L.; Tian, J.; Liao, H. Identification of differentially expressed proteins in soybean nodules under phosphorus deficiency through proteomic analysis. Proteomics 2011, 11, 4648–4659. [Google Scholar] [CrossRef] [PubMed]
  17. Chevalier, F.; Rossignol, M. Proteomic analysis of Arabidopsis thaliana ecotypes with contrasted root architecture in response to phosphate deficiency. J. Plant Physiol. 2011, 168, 1885–1890. [Google Scholar] [CrossRef] [PubMed]
  18. Eulgem, T.; Rushton, P.J.; Robatzek, S.; Somssich, I.E. The WRKY Superfamily of Plant Transcription Factors. Trends Plant Sci. 2000, 5, 199–206. [Google Scholar] [CrossRef]
  19. Zhang, Y.; Wang, L. The WRKY transcription factor superfamily: Its origin in eukaryotes and expansion in plants. BMC Evolut. Biol. 2005, 5, 1–12. [Google Scholar] [CrossRef] [PubMed]
  20. Robatzek, S.; Somssich, I.E. A new member of the Arabidopsis WRKY transcription factor family, AtWRKY6, is associated with both senescence- and defence-related processes. Plant J. 2001, 28, 123–133. [Google Scholar] [CrossRef] [PubMed]
  21. Robatzek, S.; Somssich, I.E. Targets of AtWRKY6 regulation during plant senescence and pathogen defense. Genes Dev. 2002, 16, 1139–1149. [Google Scholar] [CrossRef] [PubMed]
  22. Chen, Y.F.; Li, L.Q.; Xu, Q.; Kong, Y.H.; Wang, H.; Wu, W.H. The WRKY6 transcription factor modulates PHOSPHATE1 Expression in Response to Low Pi Stress in Arabidopsis. Plant Cell 2009, 21, 3554–3566. [Google Scholar] [CrossRef] [PubMed]
  23. Kasajima, I.; Ide, Y.; Yokota, H.M.; Fujiwara, T. WRKY6 is involved in the response to boron deficiencyin Arabidopsis thaliana. Physiol. Plant. 2010, 139, 80–92. [Google Scholar] [CrossRef] [PubMed]
  24. Castrillo, G.; Eduardo, S.B.; Lorenzo, L.D.; Crevillén, P.; Ana, F.E.; Mohan, T.C.; Mouriz, A.; Catarecha, P.; Juan, S.P.; Olsson, S.; et al. WRKY6 transcription factor restricts arsenate uptake and transposon activation in Arabidopsis. Plant Cell 2013, 25, 2944–2957. [Google Scholar] [CrossRef] [PubMed]
  25. Huang, Y.; Feng, C.Z.; Ye, Q.; Wu, W.H.; Chen, Y.F. Arabidopsis WRKY6 transcription factor acts as a positive regulator of abscisic acid signaling during seed germination and early seedling development. PLoS Genet. 2016, 12, e1005833. [Google Scholar] [CrossRef] [PubMed]
  26. Devaiah, B.N.; Madhuvanthi, R.; Karthikeyan, A.S.; Raghothama, K.G. Phosphate starvation responses and gibberellic acid biosynthesis are regulated by the MYB62 transcription factor in Arabidopsis. Mol. Plant 2009, 2, 43–58. [Google Scholar] [CrossRef] [PubMed]
  27. Hammond, J.P.; Broadley, M.R.; White, P.J. Genetic responses to phosphorus deficiency. Ann. Bot. 2004, 94, 323–332. [Google Scholar] [CrossRef] [PubMed]
  28. Hammond, J.P.; White, P.J. Sugar signaling in root responses to low phosphorus availability. Plant Physiol. 2011, 156, 1033–1040. [Google Scholar] [CrossRef] [PubMed]
  29. Hermans, C.; Hammond, J.P.; White, P.J.; Verbruggen, N. How do plants respond to nutrient shortage by biomass allocation? Trends Plant Sci. 2006, 11, 610–617. [Google Scholar] [CrossRef] [PubMed]
  30. Jain, A.; Poling, M.D.; Karthikeyan, A.S.; Blakeslee, J.J.; Peer, W.A.; Titapiwatanakun, B.; Murphy, A.S.; Raghothama, K.G. Differential effects of sucrose and auxin on localized Pi–deficiency induced modulation of different traits of root system architecture in Arabidopsis. Plant Physiol. 2007, 144, 232–247. [Google Scholar] [CrossRef] [PubMed]
  31. Lei, M.; Liu, Y.; Zhang, B.; Zhao, Y.; Wang, X.; Zhou, Y.; Raghothama, K.G.; Liu, D. Genetic and genomic evidence that sucrose is a global regulator of plant responses to phosphate starvation in Arabidopsis. Plant Physiol. 2011, 156, 1116–1130. [Google Scholar] [CrossRef] [PubMed]
  32. Suriyagoda, L.D.; Lambers, H.; Ryan, M.H.; Renton, M. Effects of leaf development and phosphorus supply on the photosynthetic characteristics of perennial legume species with pasture potential: Modelling photosynthesis with leaf development. Funct. Plant Biol. 2010, 37, 713–725. [Google Scholar] [CrossRef]
  33. Hammond, J.P.; White, P.J. Sucrose transport in the phloem: Integrating root responses to phosphorus starvation. J. Exp. Bot. 2008, 59, 93–109. [Google Scholar] [CrossRef] [PubMed]
  34. Zhang, K.W.; Liu, H.H.; Tao, P.L.; Chen, H. Comparative proteomic analyses provide new insights into low phosphorus stress responses in maize leaves. PLoS ONE 2014, 9, e98215. [Google Scholar] [CrossRef] [PubMed]
  35. Chivasa, S.; Tomé, D.F.; Hamilton, J.M.; Slabas, A.R. Proteomic analysis of extracellular ATP-regulated proteins identifies ATP synthase beta-subunit as a novel plant cell death regulator. Mol. Cell. Proteom. 2011, 10, M110.003905. [Google Scholar] [CrossRef] [PubMed]
  36. Lloyd, J.C.; Zakhleniuk, O.V. Responses of primary and secondary metabolism to sugar accumulation revealed by microarray expression analysis of the Arabidopsis mutant, pho3. J. Exp. Bot. 2004, 55, 1221–1230. [Google Scholar] [CrossRef] [PubMed]
  37. Morcuende, R.; Bari, R.; Gibon, Y.; Zheng, W.M.; Pant, B.D.; Bla¨sing, O.; Usadel, B.; Czechowski, T.; Udvardi, M.K.; Stitt, M.; et al. Genome-wide reprogramming of metabolism and regulatory networks of Arabidopsis in response to phosphorus. Plant Cell Environ. 2007, 30, 85–112. [Google Scholar] [CrossRef] [PubMed]
  38. Chang, M.M.; Li, A.; Feissner, R.; Ahmad, T. RT-qPCR demonstrates light-dependent AtRBCS1A and AtRBCS3B mRNA expressions in Arabidopsis thaliana leaves. Biochem. Mol. Biol. Educ. 2016, 44, 405–411. [Google Scholar] [CrossRef] [PubMed]
  39. Zhan, G.M.; Li, R.J.; Hu, Z.Y.; Liu, J. Cosuppression of RBCS3B in Arabidopsis leads to severe photoinhibition caused by ROS accumulation. Plant Cell Rep. 2014, 33, 1091–1108. [Google Scholar] [CrossRef] [PubMed]
  40. Castillejo, M.A.; Maldonado, A.M.; Ogueta, S.; Jorrı´n, J.V. Proteomic analysis of responses to drought stress in sunflower (Helianthus annuus) leaves by 2DE gel electrophoresis and mass spectrometry. Open Proteom. J. 2008, 1, 59–71. [Google Scholar] [CrossRef]
  41. Singh, R.; Jwa, N.S. Understanding the responses of rice to environmental stress using proteomics. J. Proteome Res. 2013, 12, 4652–4669. [Google Scholar] [CrossRef] [PubMed]
  42. Khatoon, A.; Rehman, S.; Hiraga, S.; Makino, T.; Komatsu, S. Organ-specific proteomics analysis forresponse mechanism in soybean seedlings under flooding stress. J. Proteom. 2012, 75, 5706–5723. [Google Scholar] [CrossRef] [PubMed]
  43. Komatsu, S.; Hossain, Z. Organ-specific proteome analysis for identification of abiotic stress response mechanism in crop. Front. Plant Sci. 2013, 4, 71. [Google Scholar] [CrossRef] [PubMed]
  44. Joshi, R.; Karan, R.; Singla-pareek, S.L.; Pareek, A. Ectopic expression of Pokkali phosphoglycerate kinase-2 (OsPGK2-P) improves yield in tobacco plants under salinity stress. Plant Cell Rep. 2016, 35, 27–41. [Google Scholar] [CrossRef] [PubMed]
  45. Wang, B.; Hajano, J.D.; Ren, Y.D.; Lu, C.T.; Wang, X.F. iTRAQ-based quantitative proteomics analysis of rice leaves infected by rice stripe virus reveals several proteins involved in symptom formation. Virol. J. 2015, 12, 99–120. [Google Scholar] [CrossRef] [PubMed]
  46. Liu, S.; Cheng, Y.; Zhang, X.; Guan, Q.; Nishiuchi, S.; Hase, K.; Takano, T. Expression of an NADP- malic enzyme gene in rice (Oryza sativa L.) is induced by environmental stresses: Over-expression of the gene in Arabidopsis confers salt and osmotic stress tolerance. Plant Mol. Biol. 2007, 64, 49–58. [Google Scholar] [CrossRef] [PubMed]
  47. Papenbrock, J.; Schmidt, A. Characterization of two sulfurtransferase isozymes from Arabidopsis thaliana. Eur. J. Biochem. 2000, 267, 5571–5579. [Google Scholar] [CrossRef] [PubMed]
  48. Meyer, T.; Meike, B.; Michael, B.; Jutta, P. Arabidopsis sulfurtransferases: Investigation of their function during senescence and in cyanide detoxification. Planta 2003, 217, 1–10. [Google Scholar] [PubMed]
  49. Sharma, S.; Mustafiz, A.; Singla-Pareek, S.L.; Srivastava, P.S.; Sopory, S.K. Characterization of stress and methylglyoxal inducible triose phosphate isomerase (OscTPI) from rice. Plant Signal. Behav. 2012, 7, 1337–1345. [Google Scholar] [CrossRef] [PubMed]
  50. Sepideh, T.; Matthias, W.; Manzar, H.; Mohammad, R.N.; Salekdeh, G.H.; Komatsu, S. Crop proteomics: Aim at sustainable agriculture of tomorrow. Proteomics 2007, 7, 2976–2996. [Google Scholar]
  51. Cummins, I.; Cole, D.J.; Edwards, R. A role for glutathione transferases functioning as glutathione peroxidases in resistance to multiple herbicides in black-grass. Plant J. 1999, 18, 285–292. [Google Scholar] [CrossRef] [PubMed]
  52. Torabi, S.; Wissuwa, M.; Heidari, M.; Naghavi, M.R.; Gilany, K.; Hajirezaei, M.R.; Omidi, M.; Yazdi, S.B.; Ismail, A.M.; Salekdeh, G.H. A comparative proteome approach to decipher the mechanism of rice adaptation to phosphorous deficiency. Proteomics 2009, 9, 159–170. [Google Scholar] [CrossRef] [PubMed]
  53. Bournier, M.; Tissot, N.; Mari, S.; Boucherez, J.; Lacombe, E.; Briat, J.F.; Gaymard, F. Arabidopsis ferritin 1 (AtFer1) gene regulation by the phosphate starvation response 1 (AtPHR1) transcription factor reveals a direct molecular link between iron and phosphate homeostasis. J. Biol. Chem. 2013, 288, 22670–22680. [Google Scholar] [CrossRef] [PubMed]
  54. Tao, J.J.; Cao, Y.R.; Chen, J.W.; Wei, W.; Li, Q.T.; Ma, B.; Zhang, W.K.; Chen, S.Y.; Zhang, J.S. Tobacco translationally controlled tumor protein interacts with ethylene receptor tobaccohistidine kinase1 and enhances plant growth through promotion of cell proliferation. Plant Physiol. 2015, 169, 96–114. [Google Scholar] [CrossRef] [PubMed]
  55. Wang, Y.; Yang, L.; Chen, X.; Ye, T.; Liu, R.; Wu, Y.; Chan, Z. MLP-like protein 43 (MLP43) functions as a positive regulator during ABA responses and confers drought tolerance in Arabidopsis thaliana. J. Exp. Bot. 2016, 67, 421–434. [Google Scholar] [CrossRef] [PubMed]
  56. Zorb, C.; Schmitt, S.; Muhling, K.H. Proteomic changes in maize roots after short-term adjustment to saline growth conditions. Proteomics 2010, 10, 4441–4449. [Google Scholar] [CrossRef] [PubMed]
  57. Fulda, S.; Mikkat, S.; Stegmann, H.; Horn, R. Physiology and proteomics of drought stress acclimation in sunflower (Helianthus annuus L.). Plant Biol. 2011, 13, 632–642. [Google Scholar] [CrossRef] [PubMed]
  58. Ma, Z.; Baskin, T.I.; Brwon, K.M.; Lynch, J.P. Regulation of root elongation under phosphorus stress involves changes in ethylene responsiveness. Plant Physiol. 2013, 131, 1381–1390. [Google Scholar] [CrossRef] [PubMed]
  59. Roldan, M.; Dinh, P.; Leung, S.; Mcmanus, M.T. Ethylene and the response of plants to phosphate deficiency. AOB Plants 2013, 5, 1–10. [Google Scholar] [CrossRef]
  60. Nagarajan, V.K.; Smith, A.P. Ethylene’s role in phosphate starvation signaling: More than just a root growth regulator. Plant Cell Physiol. 2012, 53, 277–286. [Google Scholar] [CrossRef] [PubMed]
  61. Koumoto, Y.; Tsugeki, R.; Shimada, T.; Mori, H.; Kondo, M.; Hara, N.I.; Nishimura, M. Isolation and characterization of a cDNA encoding mitochondrial chaperonin 10 from Arabidopsis thaliana by functional complementation of an Escherichia coli groES mutant. Plant J. 1996, 10, 1119–1125. [Google Scholar] [CrossRef] [PubMed]
  62. Chen, Z.; Gallie, D.R. Dehydroascorbate reductase affects leaf growth, development, and function. Plant Physiol. 2006, 142, 775–787. [Google Scholar] [CrossRef] [PubMed]
  63. Islam, T.; Manna, M.; Reddy, M.K. Glutathione peroxidase of Pennisetum glaucum (PgGPx) is a functional Cd2+ dependent peroxiredoxin that enhances tolerance against salinity and drought stress. PLoS ONE 2015, 23, e0143344. [Google Scholar] [CrossRef] [PubMed]
  64. Wang, X.L.; Cai, X.F.; Xu, C.X.; Wang, Q.H.; Dai, S.J. Drought-responsive mechanisms in plant leaves revealed by proteomics. Int. J. Mol. Sci. 2016, 17, 1706. [Google Scholar] [CrossRef] [PubMed]
  65. Prasad, T.K.; Hack, E.; Hallberg, R.L. Function of the maize mitochondrial chaperonin hsp60: Specific Association between hsp60 and newly synthesized F1-ATPase alpha Subunits. Mol. Cell. Biol. 1990, 10, 3979–3986. [Google Scholar] [CrossRef] [PubMed]
  66. Carpenter, C.D.; Kreps, J.A.; Simon, A.E. Genes encoding glycine-rich Arabidopsis thaliana proteins with RNA-binding motifs are influenced by cold treatment and an endogenous circadianrhythm. Plant Physiol. 1994, 104, 1015–1025. [Google Scholar] [CrossRef] [PubMed]
  67. Schmidt, F.; Marnef, A.; Cheung, M.K.; Wilson, J.; Hancock, J.; Staiger, D.; Ladomery, M. A Proteomic analysis of oligo(dT)-bound mRNP containing oxidative stress-induced Arabidopsis thaliana RNA-binding proteins ATGRP7 and ATGRP8. Mol. Biol. Rep. 2010, 37, 839–845. [Google Scholar] [CrossRef] [PubMed]
  68. Zhang, X.; Liu, S.; Takano, T. Overexpression of a mitochondrial ATP synthase small subunit gene (AtMtATP6) confers tolerance to several abiotic stresses in Saccharomyces cerevisiae and Arabidopsis thaliana. Biotechnol. Lett. 2008, 30, 1289–1294. [Google Scholar] [CrossRef] [PubMed]
  69. Cai, H.M.; Zhou, Y.; Xiao, J.H.; Li, X.H.; Zhang, Q.F.; Lian, X.M. Overexpressed glutamine synthetase gene modifies nitrogen metabolism and abiotic stress responses in rice. Plant Cell Rep. 2009, 28, 527–537. [Google Scholar] [CrossRef] [PubMed]
  70. Choidu, S.; Lim, C.W.; Hwang, B.K. Proteomics and functional analyses of Arabidopsis nitrilases involved in the defense response to microbial pathogens. Planta 2016, 244, 449–465. [Google Scholar]
  71. Cao, A.; Jain, A.; Baldwin, J.C.; Raghothama, K.G. Phosphate differentially regulates 14-3-3 family membersand GRF9 plays a role in Pi-starvation induced responses. Planta 2007, 226, 1219–1230. [Google Scholar] [CrossRef] [PubMed]
  72. Zhou, H.P.; Lin, H.X.; Chen, S.; Becker, K.; Yang, Y.Q.; Zhao, J.F.; Kudla, J.; Schumaker, K.S.; Guo, Y. Inhibition of the Arabidopsis salt overly sensitive Pathway by 14-3-3 Proteins. Plant Cell 2014, 26, 1166–1182. [Google Scholar] [CrossRef] [PubMed]
  73. Moroney, J.V.; Bartlett, S.G.; Samuelsson, G. Carbonic anhydrases in plant and algae. Plant Cell Environ. 2011, 24, 141–153. [Google Scholar] [CrossRef]
  74. Ames, B.N. Assay of inorganic phosphate, total phosphate and phosphatases. Methods Enzymol. 1966, 8, 115–118. [Google Scholar]
  75. Solfanelli, C.; Poggi, A.; Loreti, E.; Alpi, A.; Perata, P. Sucrose-specific induction of the anthocyanin biosynthetic pathway in Arabidopsis. Plant Physiol. 2006, 140, 637–646. [Google Scholar] [CrossRef] [PubMed]
  76. Miller, G.L. Use of dinitrosalicylic acid reagent for determination of reducing sugar. Anal. Chem. 1959, 31, 426–428. [Google Scholar] [CrossRef]
  77. Caspar, T.; Lin, T.P.; Kakefuda, G.; Benbow, L.; Preiss, J.; Somerville, C. Mutants of Arabidopsis with altered regulation of starch degradation. Plant Physiol. 1991, 95, 1181–1188. [Google Scholar] [CrossRef] [PubMed]
  78. Gilbert, G.A.; Knight, J.D.; Vance, C.P.; Allan, D.L. Acid phosphatase activity in phosphorus-deficient white lupin roots. Plant Cell Environ. 1999, 22, 801–810. [Google Scholar] [CrossRef]
  79. Wang, X.C.; Li, X.F.; Deng, X.; Han, H.P.; Shi, W.L.; Li, Y.X. A protein extraction method compatible with proteomic analysis for the euhalophyte Salicornia europaea. Electrophoresis 2007, 28, 3976–3987. [Google Scholar] [CrossRef] [PubMed]
  80. Li, T.; Xu, S.L.; Oses, J.A.; Putil, S.; Xu, P.; Wang, R.J.; Li, K.H.; Maltby, D.A.; An, L.H.; Burlingame, A.L.; et al. Proteomics analysis reveals post-translational mechanisms for cold-induced metabolic changes in Arabidopsis. Mol. Plant. 2011, 4, 361–374. [Google Scholar] [CrossRef] [PubMed]
  81. Conesa, A.; Gotz, S. Blast2GO: A comprehensive suite for functional analysis in plant genomics. Int. J. Plant Genom. 2008, 2008, 619832. [Google Scholar] [CrossRef] [PubMed]
Figure 1. Measurements of Pi content and acid phosphatase activity in three plant samples. Note: (A) measurements of Pi content; (B) measurements of acid phosphatase activity. Values followed by different lowercase letters mean that data was significantly different among samples in the same treatment at 0.05 level. Bars represent the mean ± SE (n = 5).
Ijms 18 01046 g001
Figure 2. Difference in gel electrophoresis (DIGE) analysis of the differentially abundant proteins between 35S:WRKY6-9 and wrky6-1. (A) Protein spots were listed in wild type leaves; (B) 37 protein spots were listed in 35S:WRKY6-9 leaves; (C) 17 protein spots were listed in wrky6-1 leaves; (D) Protein spots were listed in wild type roots; (E) 22 protein spots were listed in 35S:WRKY6-9 roots; (F) 12 protein spots were listed in wrky6-1 roots. Red number indicates increase; green number indicates decrease.
Ijms 18 01046 g002
Figure 3. Localization analysis of the 88 differentially abundant proteins identified in 35S:WRKY6-9 and wrky6-1. (A) 37 protein localizations were shown in shoots of 35S:WRKY6-9; (B) 17 protein localizations were shown in shoots of wrky6-1; (C) 22 protein localizations were shown in roots of 35S:WRKY6-9; (D) 12 protein localizations were shown in roots of wrky6-1.
Ijms 18 01046 g003
Figure 4. Functional analysis of the 88 differentially abundant proteins identified in35S:WRKY6-9 and wrky6-1. (A) Function classification of 37 proteins were shown in shoots of 35S:WRKY6-9; (B) Function classification of 17 proteins were shown in shoots of wrky6-1; (C) Function classification of 22 proteins were shown in roots of 35S:WRKY6-9; (D) Function classification of 12 proteins were shown in roots of wrky6-1.
Ijms 18 01046 g004
Figure 5. Cluster analysis of differentially abundant proteins in wrky6-1. Red colour indicates increase; green colour indicates decrease.
Ijms 18 01046 g005
Figure 6. Cluster analysis of differentially abundant proteins in 35S:WRKY6-9. Red colour indicates increase; hreen colour indicates decrease.
Ijms 18 01046 g006
Figure 7. The expression levels of 8 potential target genes are listed. Bars represent the mean ± SE (n = 3), the lowercase letters indicate a significant difference between the groups. Notes: AT5G08690: Mitochondrial F1 ATP synthase β subunit; AT1G66200: Gln synthetase; AT3G44310: Nitrilase I; AT4G09000: 14-3-3 protein; AT5G14740: Carbonic anhydrase 2; AT3G54640: Tryptophan synthase.
Ijms 18 01046 g007
Figure 8. The expression levels of 9 indirect regulated genes are listed. Bars represent the mean ± SE (n = 3), the lowercase letters indicate a significant difference between the groups.Notes: AT4G04640: ATP synthase gamma; AT1G79230: Mercaptopyruvate sulfurtransferase 1; AT3G01500: Carbonic anhydrase 1; AT5G01600: Ferritin 1; AT3G16640: Translationally-controlled tumour protein-like protein; AT5G20720: Chaperonin 10; AT1G19570: Dehydroascorbate reductase; AT4G39260: Glycine-rich RNA-binding protein 8.
Ijms 18 01046 g008
Figure 9. Schematic representation of the differentially abundant proteins involved in photosynthesis in Arabidopsis. Red arrow indicates increase; green arrow indicates decrease; dashed arrow indicates reactions of multiple steps.
Ijms 18 01046 g009
Table 1. Measurements of three biochemical data results in three plant samples.
SamplesChlorophyll Content (μg/g FW)Reducing Sugar Content (μg/g FW)Sucrose Content (mg/g FW)
CW (MS)107 ± 8.7 c0.56 ± 0.05 b10.1 ± 0.98 c
35S:WRKY6-9 (MS)132 ± 10.1 b0.78 ± 0.06 a13.2 ± 0.88 c
wrky6-1 (MS)113 ± 9.8 c0.61 ± 0.05 b11.5 ± 1.12 c
CW (LP)136 ± 10.6 b0.83 ± 0.07 a28.3 ± 2.22 b
35S:WRKY6-9 (LP)155 ± 11.3 a0.88 ± 0.09 a40.6 ± 3.65 a
wrky6-1 (LP)142 ± 10.4 a,b0.86 ± 0.08 a27.8 ± 2.37 b
Values followed by different lowercase letters means that data was significantly different among samples in the same treatment at 0.05 level. Bars represent the mean ± SE (n = 3).
Table 2. The 59 differentially expressed proteins identified in 35S:WRKY6-9.
SpotNameScoreVersionPi/Mr (kDa)Ttest (P)Cov. (%)MatchedChange Fold
ExperimentalTheoretical
OL1iPGAM105AAL09820.15.48/595.27/619.3 × 10−3321.82
OL2iPGAM150AAL09820.15.54/585.27/613.1 × 10−5322.07
OL4ATP synthase CF1 alpha subunit200NP_051044.15.29/565.19/551.5 × 10−3732.82
OL5Mitochondrial F1 ATP synthase beta subunit339CAC81058.15.65/546.52/642.4 × 10−41051.58
OL7AT4g23100/F7H19_290228AAL08228.15.38/546.16/599.7 × 10−5631.68
OL8S-adenosylmethionine synthetase like protein291BAF01944.15.7/545.60/435.9 × 10−51032.06
OL10Phosphoglycerate kinase, putative519AAM61185.15.62/415.49/425.6 × 10−112461.99
OL11Glutamine synthetase like protein180BAE98486.15.11/445.14/395.0 × 10−9322.73
OL13AT1G0441050BAH20341.15.79/536.59/263.4 × 10−8811.96
OL14Annexin-like protein270AAC49472.15.28/415.34/366.0 × 10−51752.63
OL15Annexin, partial350CAA67608.15.35/405.19/361.6 × 10−41842.6
OL16AT4G04640299BAH20433.16.68/355.06/171.4 × 10−33132.12
OL18AT3g44310/T10D17_100149AAL16248.16.2/355.78/393.6 × 10−3732.16
OL19AT4g38970/F19H22_70133AAL16224.15.68/366.79/437.6 × 10−572−1.53
OL20AT2G21330111BAH56881.15.39/376.34/417.3 × 10−862−2.02
OL22Mercaptopyruvate sulfurtransferase 1197NP_565203.15.17/375.95/422.1 × 10−1932.15
OL23AT3G16420576BAH57171.15.64/315.44/303.9 × 10−72862.2
OL24GF14chi isoform354AAA96254.14.68/304.68/305.8 × 10−82261.5
OL26AT5G14740367BAH20249.15.61/275.94/313.0 × 10−6224−2.69
OL27Cytosolic triose phosphate isomerase363AAA03449.15.46/235.24/273.6 × 10−62051.68
OL28Cytosolic triose phosphate isomerase513AAA03449.15.66/225.24/278.0 × 10−72051.77
OL29AT3G01500388BAH56801.15.75/216.14/321.2 × 10−4225−2.98
OL30AT3G01500344BAH56801.16.05/206.14/325.0 × 10−6225−4.04
OL31AT5G5427063BAH56768.14.8/224.76/184.5 × 10−562−1.89
OL32Glutathione transferase68CAA72973.16.72/197.03/243.5 × 10−7511.65
OL33Ferritin 178BAD94306.15.39/214.74/65.6 × 10−61811.55
OL34Glutathione S-transferase297AAG30126.16.35/206.31/244.6 × 10−31843.89
OL35Ferritin 1107AAM61077.15.27/215.73/284.1 × 10−572−1.55
OL36Fe-superoxide dismutase159AAA32791.16.48/196.30/254.2 × 10−61531.71
OL37Translationally-controlled tumor protein115AAM66134.14.62/194.52/192.0 × 10−51121.52
OL39MLP-like protein 423281NP_173813.15.2/165.1/171.3 × 10−82932.04
OL40Ribulose bisphosphate carboxylase261CAA32701.15.72/157.59/211.4 × 10−9193−2.26
OL41Ribulose bisphosphate carboxylase133CAA32701.16.17/157.59/215.4 × 10−7142−2.37
OL42Ribulose bisphosphate carboxylase197CAA32701.15.72/157.59/217.7 × 10−6142−2.07
OL43Ribulose bisphosphate carboxylase68CAA32701.15.76/157.59/217.0 × 10−961−1.71
OL44Ribulose bisphosphate carboxylase303CAA31948.15.77/157.59/211.8 × 10−8194−1.7
OL45Ribulose bisphosphate carboxylase324CAA31948.16.2/157.59/214.6 × 10−8194−1.63
OR1PfkB-like carbohydrate kinase family protein343NP_199996.15.04/434.99/371.31 × 10−21641.62
OR2ACC oxidase254AAC27484.15.13/454.97/361.4 × 10−21531.37
OR4Chaperonin 10111AAC14026.15.52/268.86/271.42 × 10−2721.27
OR5Dehydroascorbate reductase356NP_173387.15.68/255.56/242.04 × 10−23651.25
OR6Glutathione S-transferase PHI 9432NP_180643.16.78/256.17/242.66 × 10−22361.23
OR7Mitochondrial chaperonin (HSP60)260AAC04902.15.55/615.30/562.66 × 10−21141.23
OR8TSA1219OAP06349.15.47/327.68/332.96 × 10−21321.21
OR9Putative cysteine proteinase AALP161AAN31820.15.03/286.26/393.22 × 10−293−1.21
OR10Putative lactoylglutathione lyase292AAL07227.15.21/325.11/323.26 × 10−2165−1.22
OR11Glyoxalase II455AAB17995.15.37/335.58/283.27 × 10−2245−1.22
OR12Mercaptopyruvate sulfurtransferase 1343NP_565203.15.19/395.95/423.37 × 10−2124−1.22
OR13Transketolase family protein409NP_199898.15.36/405.67/393.61 × 10−2185−1.24
OR14MLP-like protein 34329NP_850976.15.3/435.14/363.61 × 10−2206−1.25
OR15NmrA-like negative transcriptional regulator336NP_565107.15.85/385.66/343.61 × 10−2184−1.26
OR16GSTU26106OAP16650.15.63/305.53/263.62 × 10−282−1.26
OR17RCI1B58CAA52238.14.8/294.97/284.46 × 10−261−1.29
OR18Mannose-binding lectin superfamily protein560NP_188267.15.58/745.31/724.59 × 10−2116−1.31
OR19F23N19.3334AAF19535.15.33/557.26/824.64 × 10−275−1.31
OR20GSTF8341OAP11759.16.39/248.50/294.72 × 10−2226−1.44
OR21Ferritin 1384AAM61077.15.4/265.73/284.8 × 10−2145−1.44
OR22Glutathione S transferase526AAM63854.16.28/266.08/244.81 × 10−2366-1.6
OR23Glycine-rich RNA-binding protein 8528NP_195637.15.46/155.58/174.82 × 10−2374−2.16
iPGAM: 2,3-bisphosphoglycerate-independent phosphoglycerate mutase; AT4g23100/F7H19_290: Gamma-glutamylcysteine synthetase; AT1G04410: Malate dehydrogenase; AT4G04640: ATP synthase gamma; AT3g44310/T10D17_100: Nitrilase I; AT4g38970/F19H22_70: Fructose-bisphosphate aldolase; AT2G21330: Putative fructose bisphosphate aldolase; AT3G16420: PYK10-binding protein 1; AT5G14740: Carbonic anhydrase 2; AT3G01500: Carbonic anhydrase 1; AT5G54270: Light-harvesting chlorophyll B-binding protein; F23N19.3: Beta-fructofuranosidase; TSA1: Tryptophan synthase beta subunit.

