
Significance of Phosphorylated Epidermal Growth Factor Receptor and Its Signal Transducers in Human Soft Tissue Sarcoma

Abstract
: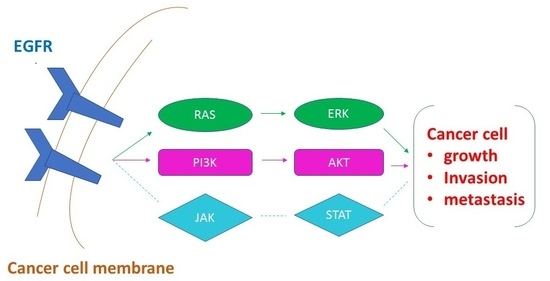
1. Introduction
2. Results
2.1. Clinicopathological Characteristics and Difference between Groups with or without Neoadjuvant Therapy
2.2. Correlation between Epidermal Growth Factor Receptor and Its Signalling Transducers and Clinical Stage and Tumour Grade
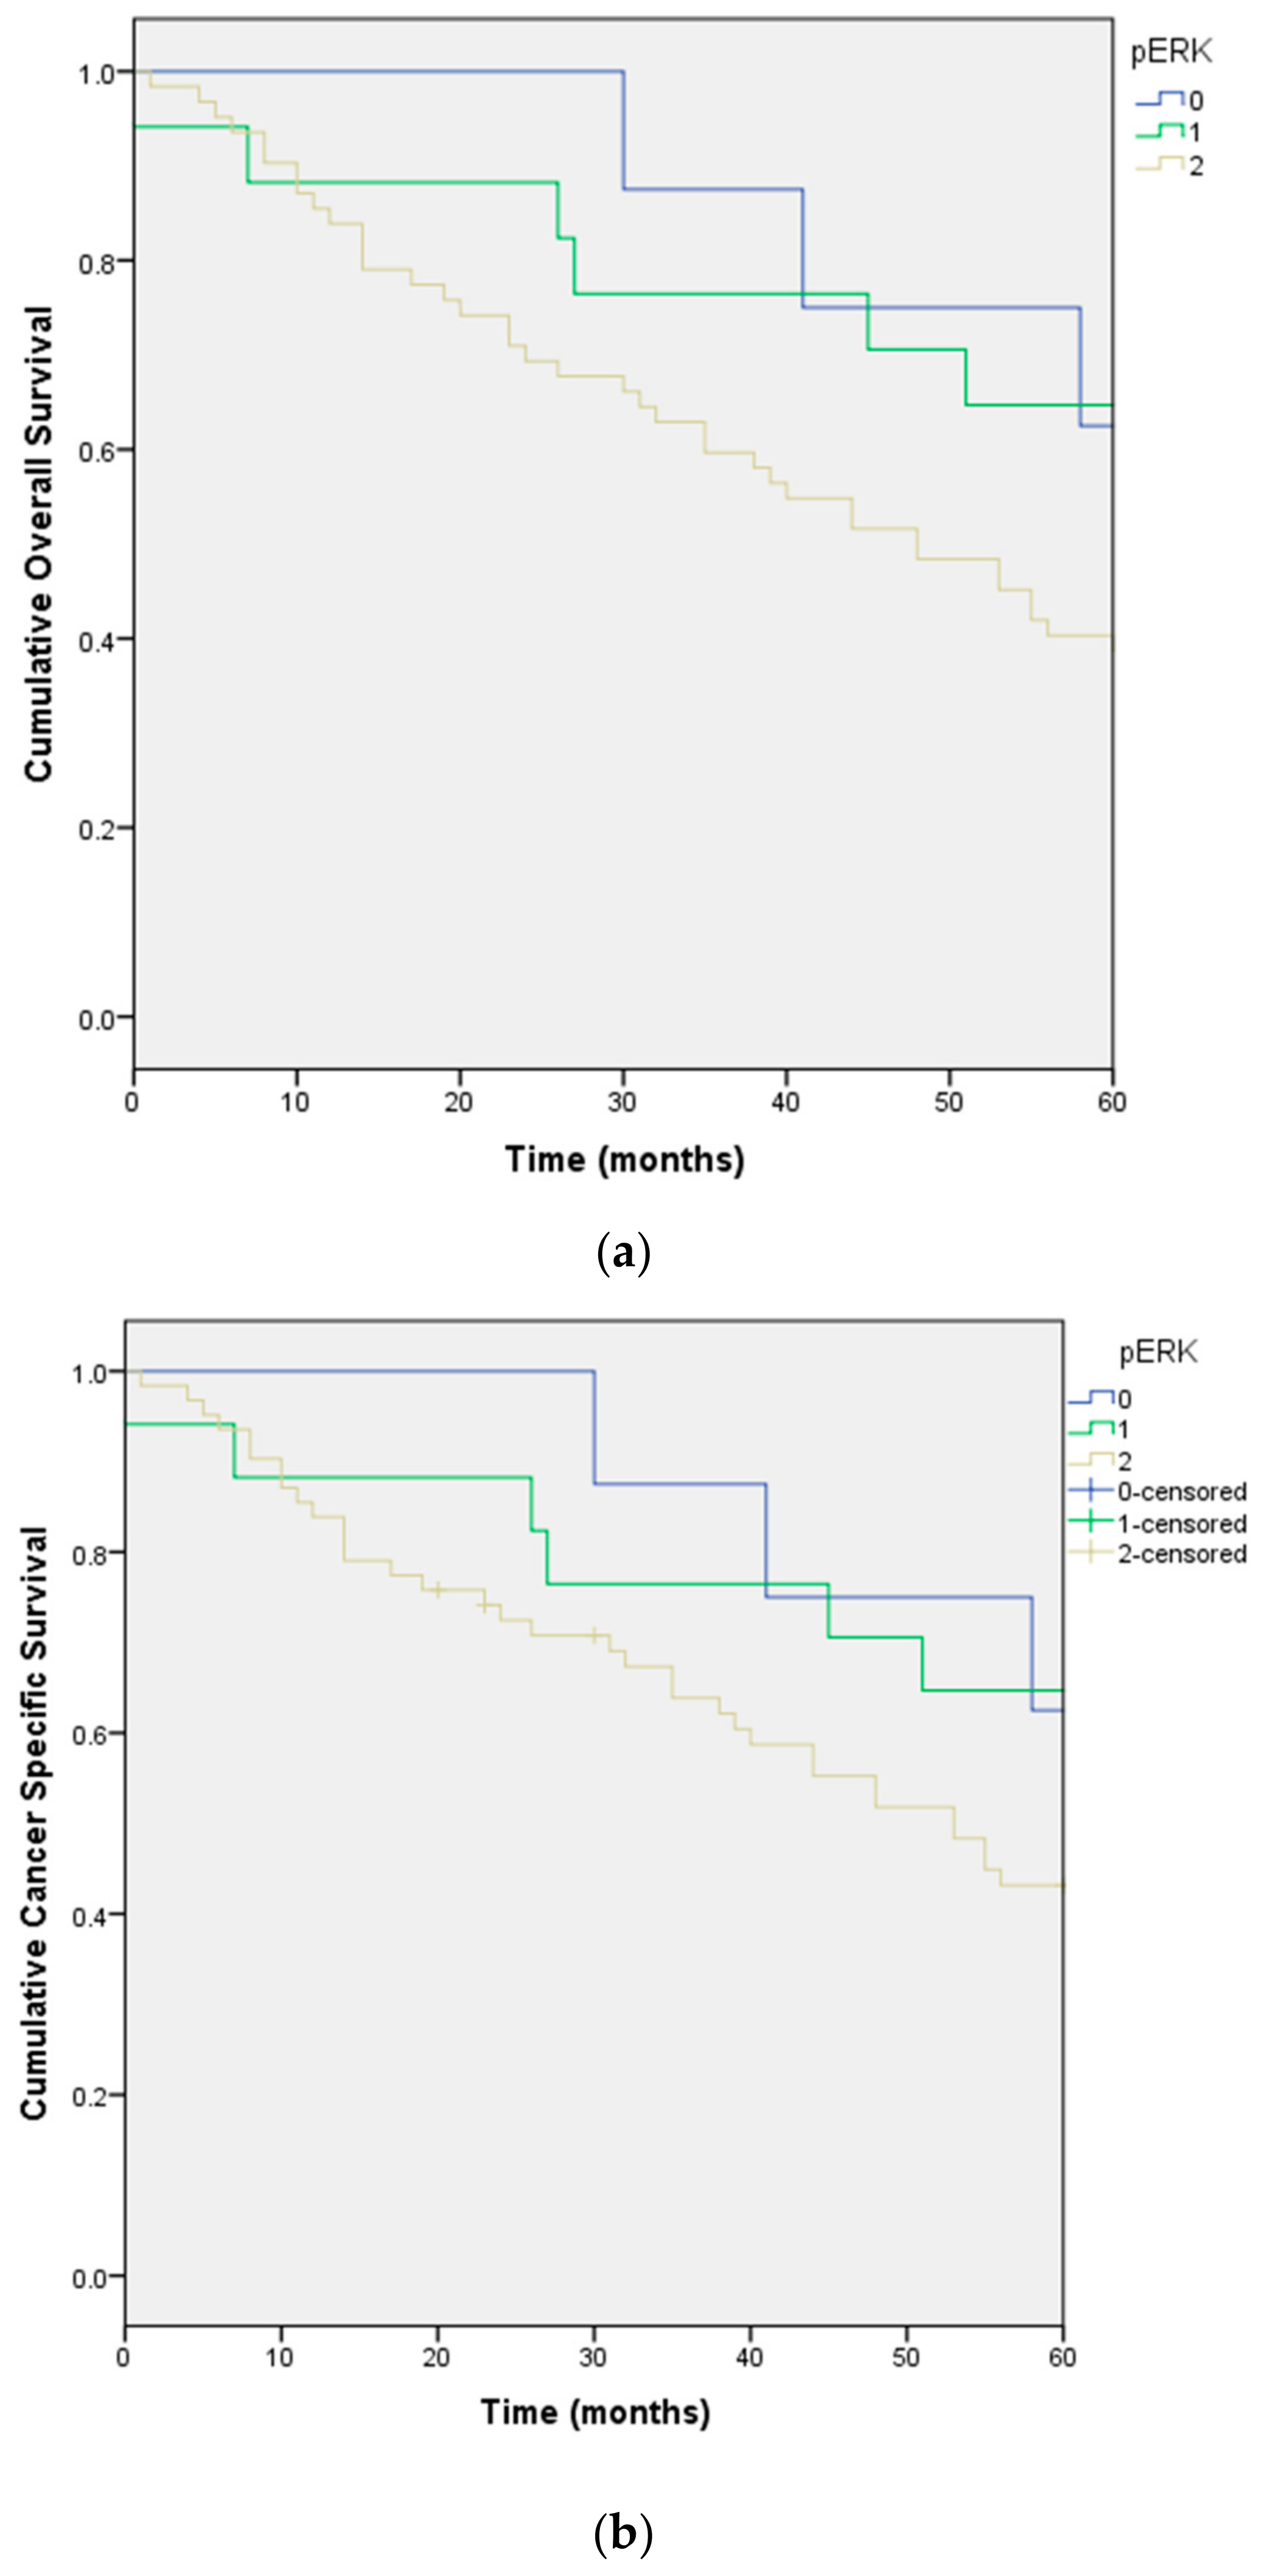
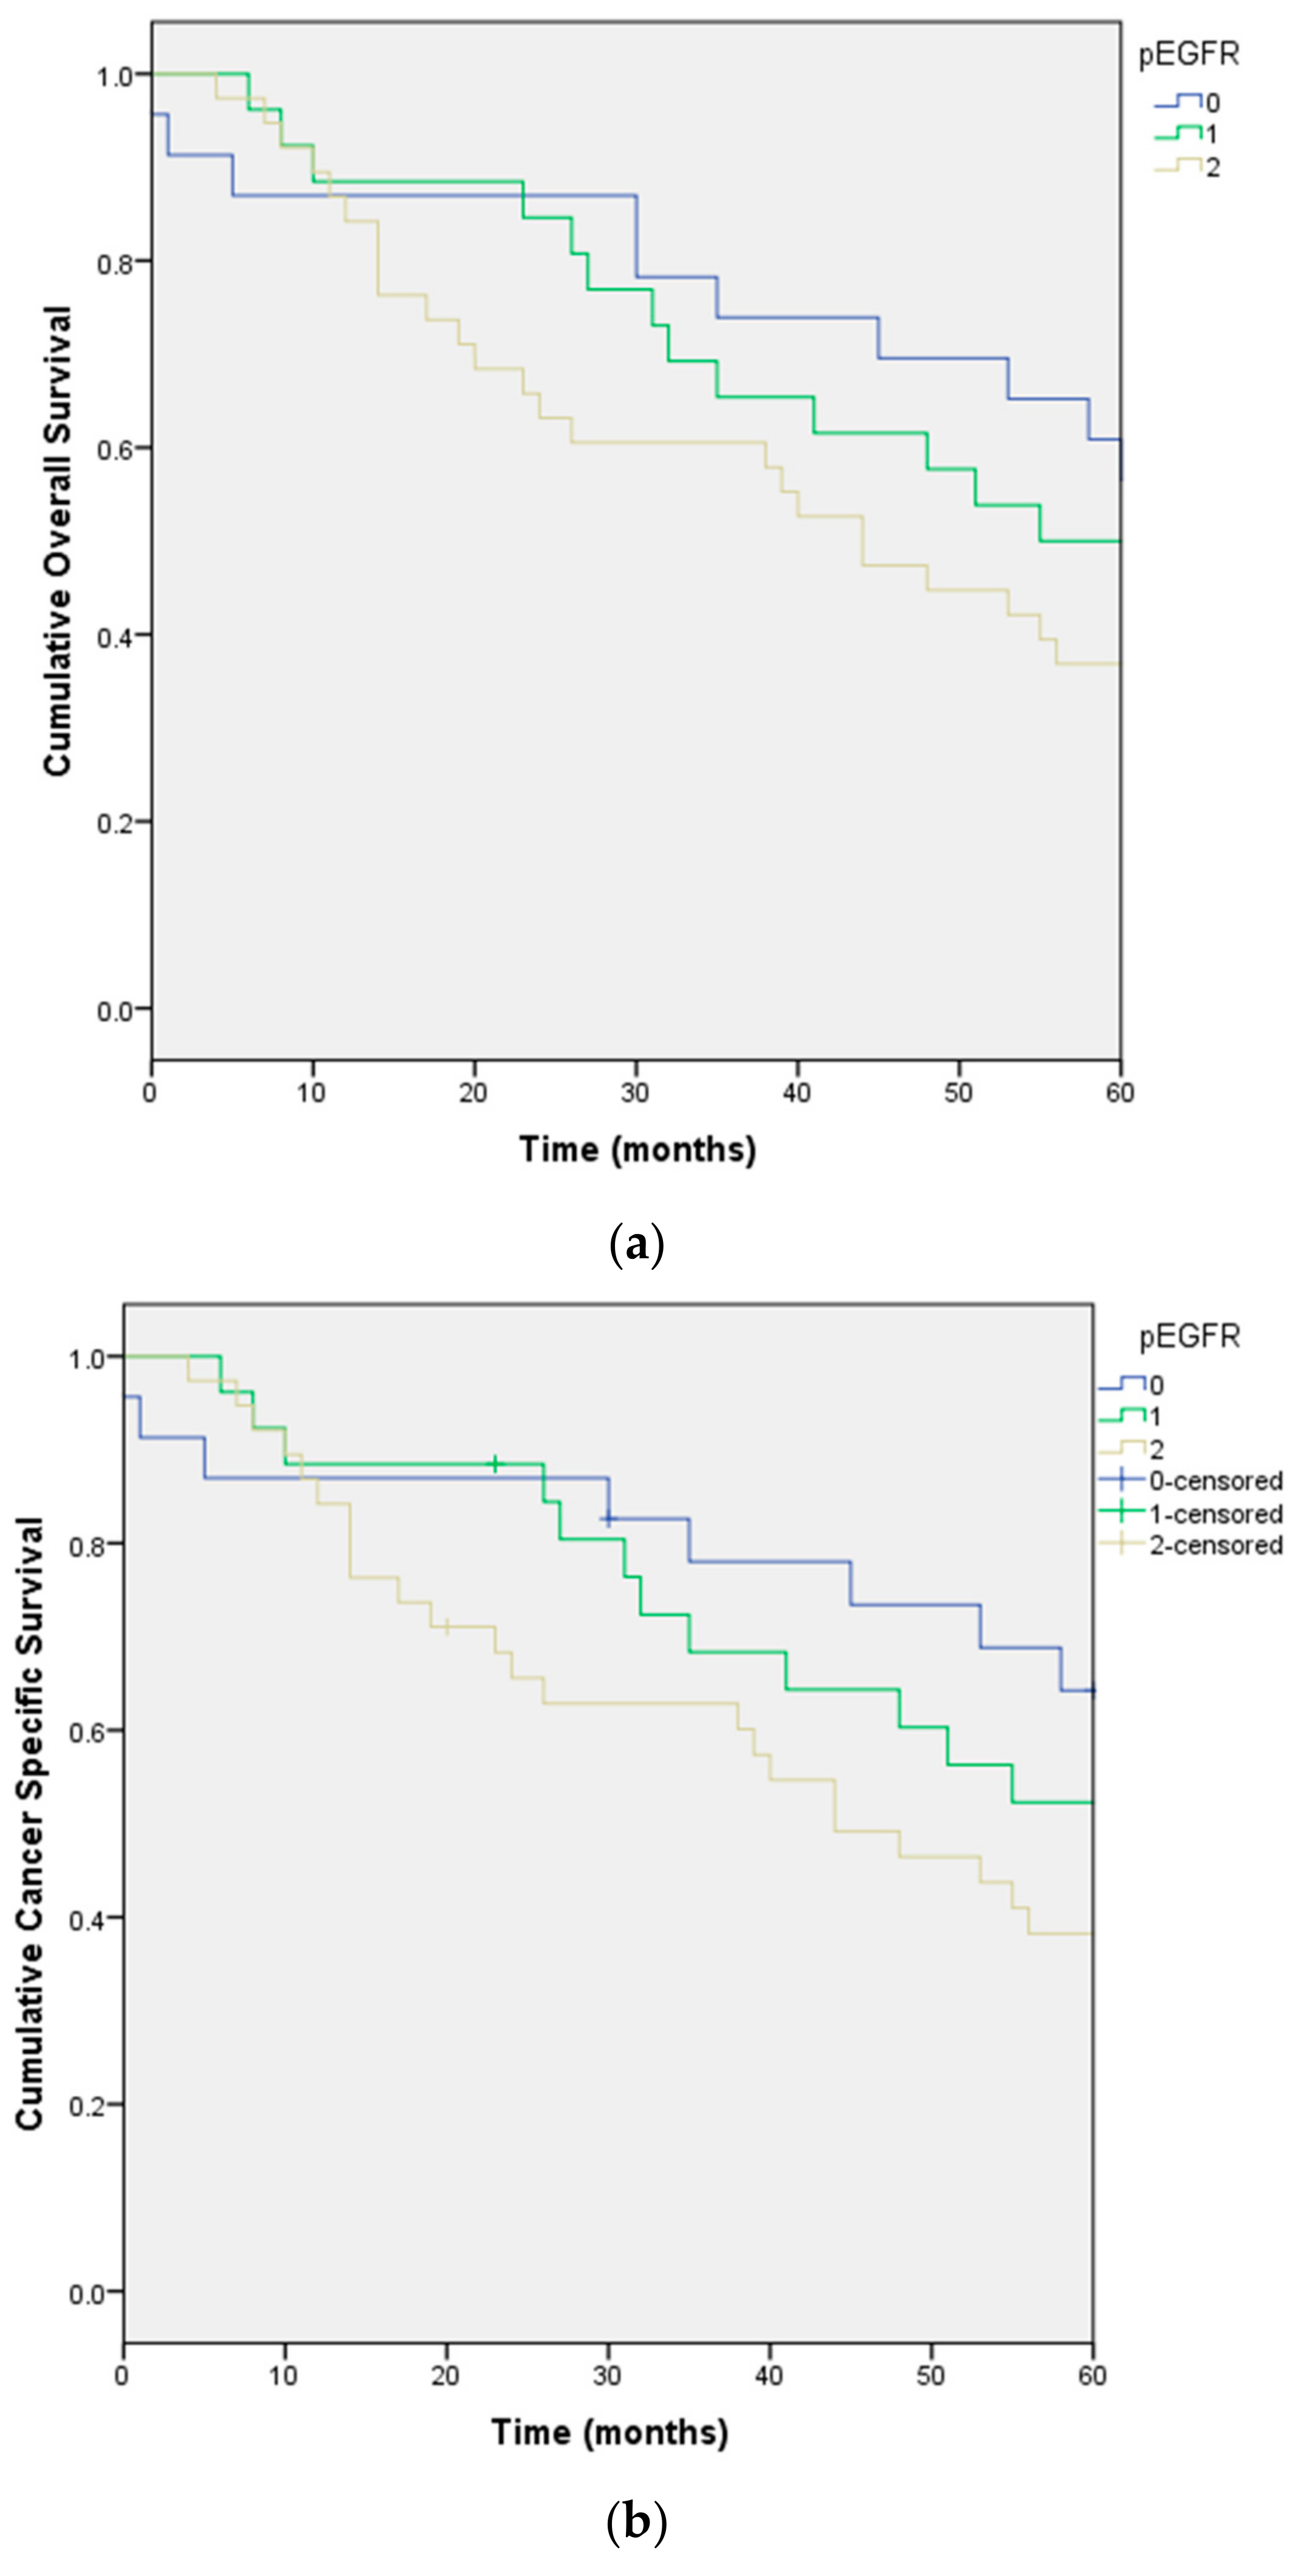
2.3. Independent Prognostic Factors
3. Discussion
4. Materials and Methods
4.1. Patients and Samples
4.2. Patient Treatment
4.3. Antibodies
4.4. Tissue Micro-Array (TMA) and Immunohistochemistry
4.5. Statistical Analysis
Supplementary Materials
Acknowledgments
Author Contributions
Conflicts of Interest
References
- Siegel, R.; Ma, J.; Zou, Z.; Jemal, A. Cancer statistics, 2014. CA Cancer J. Clin. 2014, 64, 9–29. [Google Scholar] [CrossRef] [PubMed]
- Kasper, B.; Gil, T.; D’Hondt, V.; Gebhart, M.; Awada, A. Novel treatment strategies for soft tissue sarcoma. Crit. Rev. Oncol. Hematol. 2007, 62, 9–15. [Google Scholar] [CrossRef] [PubMed]
- Beech, D.; Pollock, R.E.; Tsan, R.; Radinsky, R. Epidermal growth factor receptor and insulin-like growth factor-I receptor expression and function in human soft-tissue sarcoma cells. Int. J. Oncol. 1998, 12, 329–336. [Google Scholar] [CrossRef] [PubMed]
- Yang, J.L.; Hannan, M.T.; Russell, P.J.; Crowe, P.J. Expression of HER1/EGFR protein in human soft tissue sarcomas. Eur. J. Surg. Oncol. 2006, 32, 466–468. [Google Scholar] [CrossRef] [PubMed]
- Sato, O.; Wada, T.; Kawai, A.; Yamaguchi, U.; Makimoto, A.; Kokai, Y.; Yamashita, T.; Chuman, H.; Beppu, Y.; Tani, Y.; Hasegawa, T. Expression of epidermal growth factor receptor, ERBB2 and Kit in adult soft tissue sarcomas. Cancer 2005, 103, 1881–1890. [Google Scholar] [CrossRef] [PubMed]
- Biscuola, M.; van de Vijver, K.; Castilla, M.A.; Romero-Pérez, L.; López-García, M.Á.; Díaz-Martín, J.; Matias-Guiu, X.; Oliva, E.; Palacios-Calvo, J. Oncogene alterations in endometrial carcinosarcomas. Hum. Pathol. 2013, 44, 852–859. [Google Scholar] [CrossRef] [PubMed]
- Teng, H.W.; Wang, H.W.; Chen, W.M.; Chao, T.C.; Hsieh, Y.Y.; Hsih, C.H.; Tzeng, C.H.; Chen, P.C.; Yen, C.C. Prevalence and prognostic influence of genomic changes of EGFR pathway markers in synovial sarcoma. J. Surg. Oncol. 2011, 103, 773–781. [Google Scholar] [CrossRef] [PubMed]
- Cascio, M.J.; O′Donnell, R.J.; Horvai, A.E. Epithelioid sarcoma expresses epidermal growth factor receptor but gene amplification and kinase domain mutations are rare. Mod. Pathol. 2010, 23, 574–580. [Google Scholar] [CrossRef] [PubMed]
- Keizman, D.; Issakov, J.; Meller, I.; Maimon, N.; Ish-Shalom, M.; Sher, O.; Merimsky, O. Expression and significance of EGFR in malignant peripheral nerve sheath tumor. J. Neurooncol. 2009, 94, 383–388. [Google Scholar] [CrossRef] [PubMed]
- Zahorowska, B.; Crowe, P.J.; Yang, J.L. Combined therapies for cancer: A review of EGFR targeted monotherapy and combination treatment with other drugs. J. Cancer Res. Clin. Oncol. 2009, 135, 1137–1148. [Google Scholar] [CrossRef] [PubMed]
- Morgensztern, D.; McLeod, H.L. PI3K/Akt/mTOR pathway as a target for cancer therapy. Anticancer Drugs 2005, 16, 797–803. [Google Scholar] [CrossRef] [PubMed]
- Wang, X.; Crowe, P.J.; Goldstein, D.; Yang, J.L. STAT3 inhibition, a novel approach to enhancing targeted therapy in human cancers (review). Int. J. Oncol. 2012, 41, 1181–1191. [Google Scholar] [PubMed]
- Quesnelle, K.M.; Boehm, A.L.; Grandis, J.R. STAT-Mediated EGFR Signaling in Cancer. J. Cell Biochem. 2007, 102, 311–319. [Google Scholar] [CrossRef] [PubMed]
- Tsujino, K.; Kawaguchi, T.; Kubo, A.; Aono, N.; Nakao, K.; Koh, Y.; Tachibana, K.; Isa, S.; Takada, M.; Kurata, T. Response rate is associated with prolonged survival in patients with advanced non-small cell lung cancer treated with gefitinib or erlotinib. J. Thorac. Oncol. 2009, 4, 994–1001. [Google Scholar] [CrossRef] [PubMed]
- Laurent-Puig, P.; Cayre, A.; Manceau, G.; Buc, E.; Bachet, J.B.; Lecomte, T.; Rougier, P.; Lievre, A.; Landi, B.; Boige, V.; Ducreux, M.; et al. Analysis of PTEN, BRAF, and EGFR Status in Determining Benefit From Cetuximab Therapy in Wild-Type KRAS Metastatic Colon Cancer. J. Clin. Oncol. 2009, 27, 5924–5930. [Google Scholar] [CrossRef] [PubMed]
- Aggerholm-Pedersen, N.; Demuth, C.; Safwat, A.; Meldgaard, P.; Kassem, M.; Sorensen, B.S. Dasatinib and Doxorubicin Treatment of Sarcoma Initiating Cells: A Possible New Treatment Strategy. Stem Cells Int. 2016, 2016, 9601493. [Google Scholar] [CrossRef] [PubMed]
- Ray-Coquard, I.; Le Cesne, A.; Whelan, J.S.; Schoffski, P.; Bui, B.N.; Verweij, J.; Marreaud, S.; van Glabbeke, M.; Hogendoorn, P.; Blay, J.Y. A phase II study of gefitinib for patients with advanced HER-1 expressing synovial sarcoma refractory to doxorubicin-containing regimens. Oncologist 2008, 13, 467–473. [Google Scholar] [CrossRef] [PubMed]
- Ha, H.T.; Griffith, K.A.; Zalupski, M.M.; Schuetze, S.M.; Thomas, D.G.; Lucas, D.R.; Baker, L.H.; Chugh, R. Phase II trial of cetuximab in patients with metastatic or locally advanced soft tissue or bone sarcoma. Am. J. Clin. Oncol. 2013, 36, 77–82. [Google Scholar] [CrossRef] [PubMed]
- Vesely, K.; Jurajda, M.; Nenutil, R.; Vesela, M. Expression of p53, cyclin D1 and EGFR correlates with histological grade of adult soft tissue sarcomas: A study on tissue microarrays. Neoplasma 2008, 56, 239–244. [Google Scholar] [CrossRef]
- De Graeff, P.; Crijns, A.P.; Ten Hoor, K.A.; Klip, H.G.; Hollema, H.; Oien, K.; Bartlett, J.M.; Wisman, G.B.; de Bock, G.H.; de Vries, E.G.; et al. ERBB signalling pathway: protein expression and prognostic value in epithelial ovarian cancer. Br. J. Cancer 2008, 99, 341–349. [Google Scholar] [CrossRef] [PubMed]
- Lim, J.; Poulin, N.M.; Nielsen, T.O. New Strategies in Sarcoma: Linking Genomic and Immunotherapy Approaches to Molecular Subtype. Clin. Cancer Res. 2015, 21, 4753–4759. [Google Scholar] [CrossRef] [PubMed]
- Wang, X.; Goldstein, D.; Crowe, P.; Yang, M.; Garrett, K.; Zeps, N.; Yang, J.L. Overcoming resistance of targeted EGFR monotherapy by inhibition of STAT3 escape pathway in soft tisue sarcoma. Oncotarget 2016, 7, 21496–21509. [Google Scholar] [PubMed]
- Wheler, J.J.; Falchook, G.S.; Tsimberidou, A.M.; Hong, D.S.; Naing, A.; Piha-Paul, S.A.; Chen, S.S.; Fu, S.; Stephen, B.; Fok, J.Y.; et al. Aberrations in the epidermal growth factor receptor gene in 958 patients with diverse advanced tumors: Implications for therapy. Ann. Oncol. 2013, 24, 838–842. [Google Scholar] [CrossRef] [PubMed]
- Bode, B.; Frigerio, S.; Behnke, S.; Senn, B.; Odermatt, B.; Zimmermann, D.R.; Moch, H. Mutations in the tyrosine kinase domain of the EGFR gene are rare in synovial sarcoma. Mod. Pathol. 2006, 19, 541–547. [Google Scholar] [CrossRef] [PubMed]
- Capobianco, G.; Pili, F.; Contini, M.; de Miglio, M.R.; Marras, V.; Santeufemia, D.A.; Cherchi, C.; Dessole, M.; Cherchi, P.L.; Cossu-Rocca, P. Analysis of epidermal growth factor receptor (EGFR) status in endometrial stromal sarcoma. Eur. J. Gynaec. Oncol. 2012, 33, 629–632. [Google Scholar]
- Benvenuti, S.; Sartore-Bianchi, A.; Di Nicolantonio, F.; Zanon, C.; Moroni, M.; Veronese, S.; Siena, S.; Bardelli, A. Oncogenic Activation of the RAS/RAF Signaling Pathway Impairs the Response of Metastatic Colorectal Cancers to Anti-Epidermal Growth Factor Receptor Antibody Therapies. Cancer Res. 2007, 67, 2643–2648. [Google Scholar] [CrossRef] [PubMed]
- Lievre, A.; Bachet, J.B.; Le Corre, D.; Boige, V.; Landi, B.; Emile, J.F.; Cote, J.F.; Tomasic, G.; Penna, C.; Ducreux, M.; et al. KRAS mutation status is predictive of response to cetuximab therapy in colorectal cancer. Cancer Res. 2006, 66, 3992–3995. [Google Scholar] [CrossRef] [PubMed]
- Kim, J.I.; Suh, J.T.; Choi, K.U.; Kang, H.J.; Shin, D.H.; Lee, I.S.; Moon, T.Y.; Kim, W.T. Inactivation of 06-methylguanine-DNA methyltransferase in soft tissue sarcomas: Association with K-ras mutations. Hum. Pathol. 2009, 40, 934–941. [Google Scholar] [CrossRef] [PubMed]
- Je, E.M.; An, C.H.; Yoo, N.J.; Lee, S.H. Mutational analysis of PIK3CA, JAK2, BRAF, FOXL2, IDH1, AKT1 and EZH2 oncogenes in sarcomas. APMIS 2012, 120, 635–639. [Google Scholar] [CrossRef] [PubMed]
- Fasanaro, E.; Staffieri, C.; Cappellesso, R.; Marino, F.; Ottaviano, G.; Val, M.; Giacomelli, L.; de Filippis, C.; Stellini, E.; Staffieri, A.; et al. Prognostic Significance of Serine-Phosphorylated STAT3 Expression in pT1-T2 Oral Tongue Carcinoma. Clin. Exp. Otorhinolaryngol. 2015, 8, 275–280. [Google Scholar] [CrossRef] [PubMed]
- Einzinger, L.; Weiss, S.W. Soft Tissue Tumors, 3rd ed.; Mosby, Co.: St Louis, MO, USA, 1995. [Google Scholar]
- Coindre, J.M.; Terrier, P.; Guillou, L.; Le Doussal, V.; Collin, F.; Ranchère, D.; Sastre, X.; Vilain, M.O.; Bonichon, F.; N’Guyen Bui, B. Predictive value of grade for metastasis development in the main histologic types of adult soft tissue sarcomas: A study of 1240 patients from the French Federation of Cancer Centers Sarcoma Group. Cancer 2001, 91, 1914–1926. [Google Scholar] [CrossRef]
- Massarweh, N.N.; Dickson, P.V.; Anaya, D.A. Soft Tissue Sarcomas: Staging Principles and Prognostic Nomograms. J. Surg. Oncol. 2015, 111, 532–539. [Google Scholar] [CrossRef] [PubMed]
- Mack, L.A.; Crowe, P.J.; Yang, J.L.; Schachar, N.S.; Morris, M.; Kurien, E.; Temple, C.L.F.; Lindsay, R.L.; Magi, E.; DeHaas, W.G.; Temple, W.J. Preoperative chemoradiotherapy (modified Eilber Protocol) provides maximum local control and minimal morbidity in patients with soft tissue sarcoma. Ann. Surg. Onc. 2005, 12, 646–653. [Google Scholar] [CrossRef] [PubMed]
- Dolled-Filhart, M.; Camp, R.L.; Kowalski, D.P.; Smith, B.L.; Rimm, D.L. Tissue Microarray Analysis of Signal Transducers and Activators of Transcription 3 (Stat3) and Phospho-Stat3 (Tyr705) in Node-negative Breast Cancer Shows Nuclear Localization Is Associated with a Better Prognosis. Clin. Cancer Res. 2003, 9, 594–600. [Google Scholar] [PubMed]
- Nielsen, T.O.; Hsu, F.D.; O'Connell, J.X.; Gilks, C.B.; Sorensen, P.H.; Linn, S.; West, R.B.; Liu, C.L.; Botstein, D.; Brown, P.O.; et al. Tissue microarray validation of epidermal growth factor receptor and SALL2 in synovial sarcoma with comparison to tumors of similar histology. Am. J. Pathol. 2003, 163, 1449–1456. [Google Scholar] [CrossRef]


| Variable | All Patients (n = 87) | Standard Treatment a (n = 74) | Preoperative Adjuvant Treatment b (n = 13) | p Value c Between a and b | |
|---|---|---|---|---|---|
| Subgroup | No. (%) | No. (%) | No. (%) | ||
| Age (years) | Mean (range) | 52.5 (12–91) | 52.3 (19–91) | 53.6 (12–83) | 0.839 |
| <40 | 23 (26.4) | 20 (27.0) | 3 (23.1) | 0.533 | |
| >40 | 64 (73.6) | 54 (73.0) | 10 (76.9) | ||
| Gender | female | 43 (49.4) | 37 (50.0) | 6 (46.2) | 0.518 |
| male | 44 (50.6) | 37 (50.0) | 7 (53.8) | ||
| Histiotype d | MFH/PMS | 24 (27.6) | 20 (27.0) | 4 (30.8) | 0.273 |
| LPS | 22 (25.3) | 22 (29.7) | 0 (0.0) | ||
| LMS | 16 (18.4) | 12 (16.2) | 4 (30.8) | ||
| SS | 6 (6.9) | 5 (6.8) | 1 (7.7) | ||
| MPNST | 4 (4.6) | 3 (4.1) | 1 (7.7) | ||
| AS | 4 (4.6) | 4 (5.4) | 0 | ||
| others | 11 (12.6) | 8 (10.8) | 3 (23.1) | ||
| Stage | I | 14 (16.1) | 14 (18.9) | 0 (0.0) | 0.377 |
| II | 35 (40.2) | 29 (39.2) | 6 (46.1) | ||
| III | 25 (28.7) | 20 (27.0) | 5 (38.5) | ||
| IV | 13 (14.9) | 11 (14.9) | 2 (15.4) | ||
| Grade | Low | 26 (29.9) | 23 (31.1) | 3 (23.1) | 0.319 |
| Intermediate | 8 (9.2) | 8 (10.8) | 0 (0.0) | ||
| High | 53 (60.9) | 43 (58.1) | 10 (76.9) | ||
| Site | Extremity | 40 (46.1) | 32 (43.2) | 8 (61.5) | 0.034 |
| Trunk | 14 (16.1) | 12 (16.2) | 2 (15.4) | ||
| Head and neck | 7 (8.0) | 7 (9.5) | 0 (0.0) | ||
| Abdomen and pelvis | 23 (26.4) | 22 (29.7) | 1 (7.7) | ||
| Thorax | 3 (3.4) | 1 (1.4) | 2 (15.4) | ||
| Size (cm) | <5 | 27 (31.0) | 25 (33.8) | 2 (15.4) | 0.035 |
| >5 to <10 | 27 (31.0) | 19 (25.6) | 8 (61.5) | ||
| >10 | 33 (37.9) | 30 (40.5) | 3 (23.1) | ||
| Depth | Superficial | 19 (21.8) | 18 (24.3) | 1 (7.7) | 0.166 |
| deep | 68 (78.2) | 56 (75.7) | 12 (92.3) | ||
| Margin (mm) | >10 | 5 (5.7) | 4 (5.4) | 1 (7.5) | 0.995 |
| 1–10 | 20 (23.0) | 17 (23.0) | 3 (23.1) | ||
| <1 | 12 (13.8) | 10 (13.5) | 2 (16.7) | ||
| Involved | 44 (50.6) | 38 (51.3) | 6 (46.2) | ||
| Unknown | 6 (6.9) | 5 (6.8) | 1 (7.5) | ||
| Local Recurrence | Yes | 9 (89.7) | 8 (10.8) | 1 (7.7) | 0.597 |
| No | 78 (10.3) | 66 (89.2) | 12 (92.3) | ||
| Overall Survival (months) | Median (95% CI) | 55 (42–68) | 56 (45–67) | 40 (19–61) | 0.744 |
| Factor | No. (%) | EGFR | pEGFR | pERK | pAkt | pSTAT3 | |||||||||||
|---|---|---|---|---|---|---|---|---|---|---|---|---|---|---|---|---|---|
| Score | 0 | 1 | 2 | 0 | 1 | 2 | 0 | 1 | 2 | 0 | 1 | 2 | 0 | 1 | 2 | ||
| All Patients (n = 87) | |||||||||||||||||
| Stage | I | 14 (16.1) | 4 (28.6) | 6 (42.8) | 4 (28.6) | 7 (50.0) | 1 (7.1) | 6 (42.9) | 2 (14.3) | 7 (50.0) | 5 (35.7) | 3 (21.4) | 4 (28.6) | 7 (50.0) | 12 (85.7) | 2 (14.3) | 0 (0.0) |
| II | 35 (40.2) | 13 (37.1) | 11 (31.4) | 11 (31.4) | 14 (40.0) | 11 (31.4) | 10 (28.6) | 5 (14.3) | 8 (22.9) | 22 (62.8) | 8 (22.9) | 5 (14.3) | 22 (62.8) | 25 (71.4) | 8 (22.9) | 2 (5.7) | |
| III | 25 (28.7) | 1 (4.0) | 7 (28.0) | 17 (68.0) | 1 (4.0) | 7 (28.0) | 17 (68.0) | 1 (4.0) | 1 (4.0) | 23 (92.0) | 0 (0.0) | 3 (12.0) | 22 (88.0) | 17 (68.0) | 7 (28.0) | 1 (4.0) | |
| IV | 13 (14.9) | 1 (7.7) | 7 (53.8) | 5 (38.5) | 1 (7.7) | 7 (53.8) | 5 (38.5) | 0 (0.0) | 1 (7.7) | 12 (92.3) | 0 (0.0) | 1 (7.7) | 12 (92.3) | 10 (76.9) | 2 (15.4) | 1 (7.7) | |
| p Value a | 0.012 | 0.001 | 0.004 | 0.031 | 0.866 | ||||||||||||
| Grade | L | 26 (29.9) | 11 (42.3) | 11 (42.3) | 4 (15.4) | 14 (53.8) | 6 (23.1) | 6 (23.1) | 7 (26.9) | 12 (46.2) | 7 (26.9) | 9 (34.6) | 8 (30.8) | 9 (34.6) | 19 (73.1) | 7 (26.9) | 0 (0.0) |
| M | 8 (9.2) | 1 (12.5) | 4 (50.0) | 3 (37.5) | 2 (57.1) | 4 (28.6) | 2 (14.3) | 0 (0.0) | 3 (28.6) | 5 (71.4) | 1 (14.3) | 2 (28.6) | 5 (57.1) | 7 (85.7) | 1 (14.3) | 0 (0.0) | |
| H | 53 (60.9) | 7 (13.2) | 16 (30.2) | 30 (56.6) | 7 (13.2) | 16 (30.2) | 30 (56.6) | 1 (1.9) | 2 (3.8) | 50 (94.3) | 1 (1.9) | 3 (5.7) | 49 (92.4) | 38 (71.7) | 11 (20.8) | 4 (7.5) | |
| p Value | 0.004 | 0.001 | < 0.001 | < 0.001 | 0.484 | ||||||||||||
| Spearman’s Correlation Coefficient (n = 87) | |||||||||||||||||
| EGFR R b | 0.609 | 0.451 | 0.511 | 0.076 | |||||||||||||
| p Value | < 0.001 | < 0.001 | < 0.001 | 0.519 | |||||||||||||
| pEGFR R | 0.609 | 0.536 | 0.671 | 0.095 | |||||||||||||
| p Value | < 0.001 | 0.001 | < 0.001 | 0.423 | |||||||||||||
| Factor | Overall Survival | ||||||
|---|---|---|---|---|---|---|---|
| Subtype | Cox, p | Logrank, p | Median Survival (Months) | SE | 95% Confidence Interval | ||
| Lower | Upper | ||||||
| pERK | 0 | 0.006 | 0.008 | 104.0 | 52.4 | 1.3 | 206.6 |
| 1 | 96.0 | 19.9 | 56.8 | 135.1 | |||
| 2 | 48.0 | 7.3 | 33.7 | 62.2 | |||
| Grade | Low | 0.010 | 0.011 | 86.0 | 16.5 | 53.5 | 118.4 |
| mediate | 55.0 | 2.6 | 49.8 | 60.1 | |||
| High | 44.0 | 9.1 | 26.0 | 61.9 | |||
| Stage | 1 | 0.036 | 0.019 | 58.0 | 10.2 | 37.8 | 78.1 |
| 2 | 81.0 | 6.7 | 67.6 | 94.3 | |||
| 3 | 38.0 | 13.5 | 11.3 | 64.6 | |||
| 4 | 32.0 | 10.7 | 10.8 | 53.1 | |||
| Factor | Cancer Specific Survival | ||||||
| Subtype | Cox, p | Logrank, p | Median Survival (Months) | SE | 95% Confidence Interval | ||
| Lower | Upper | ||||||
| pERK | 0 | 0.013 | 0.016 | 104.0 | 52.3 | 1.3 | 206.6 |
| 1 | 96.0 | 19.9 | 56.8 | 135.1 | |||
| 2 | 55.0 | 6.3 | 42.5 | 67.4 | |||
| pEGFR | 0 | 0.040 | 0.047 | 86.0 | 10.5 | 65.3 | 106.6 |
| 1 | 62.0 | 9.5 | 43.3 | 80.6 | |||
| 2 | 48.0 | 9.6 | 29.1 | 66.8 | |||
| Grade | Low | 0.011 | 0.012 | 96.0 | 15.9 | 64.7 | 127.2 |
| mediate | 77.0 | 13.6 | 50.2 | 103.7 | |||
| High | 44.0 | 8.7 | 26.8 | 61.1 | |||
| Stage | 1 | 0.042 | 0.039 | 58.0 | 10.2 | 37.8 | 78.1 |
| 2 | 84.0 | 5.3 | 73.4 | 94.5 | |||
| 3 | 40.0 | 10.8 | 18.7 | 61.2 | |||
| 4 | 32.0 | 10.7 | 10.8 | 53.1 | |||
© 2017 by the authors. Licensee MDPI, Basel, Switzerland. This article is an open access article distributed under the terms and conditions of the Creative Commons Attribution (CC BY) license (http://creativecommons.org/licenses/by/4.0/).
Share and Cite
Yang, J.-L.; Gupta, R.D.; Goldstein, D.; Crowe, P.J. Significance of Phosphorylated Epidermal Growth Factor Receptor and Its Signal Transducers in Human Soft Tissue Sarcoma. Int. J. Mol. Sci. 2017, 18, 1159. https://0-doi-org.brum.beds.ac.uk/10.3390/ijms18061159
Yang J-L, Gupta RD, Goldstein D, Crowe PJ. Significance of Phosphorylated Epidermal Growth Factor Receptor and Its Signal Transducers in Human Soft Tissue Sarcoma. International Journal of Molecular Sciences. 2017; 18(6):1159. https://0-doi-org.brum.beds.ac.uk/10.3390/ijms18061159
Chicago/Turabian StyleYang, Jia-Lin, Romi Das Gupta, David Goldstein, and Philip J. Crowe. 2017. "Significance of Phosphorylated Epidermal Growth Factor Receptor and Its Signal Transducers in Human Soft Tissue Sarcoma" International Journal of Molecular Sciences 18, no. 6: 1159. https://0-doi-org.brum.beds.ac.uk/10.3390/ijms18061159