
Eplerenone-Resistant Salt-Sensitive Hypertension in Nedd4-2 C2 KO Mice

 , ,
, ,
Abstract
:
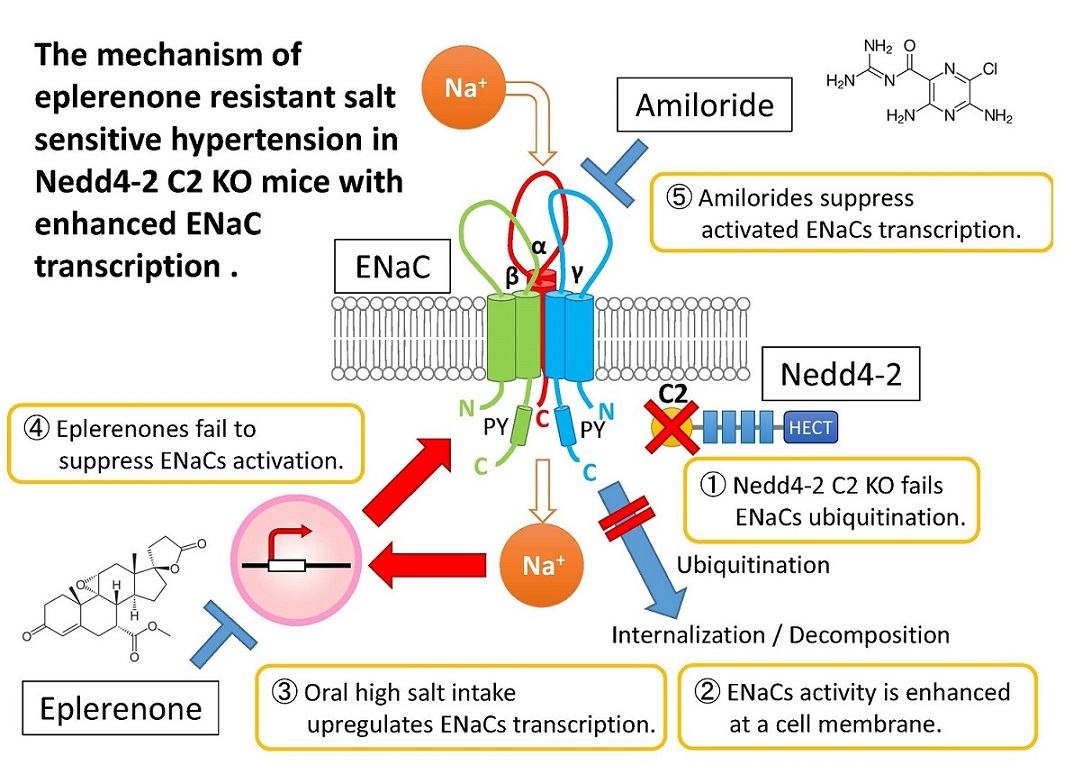
1. Introduction
2. Results
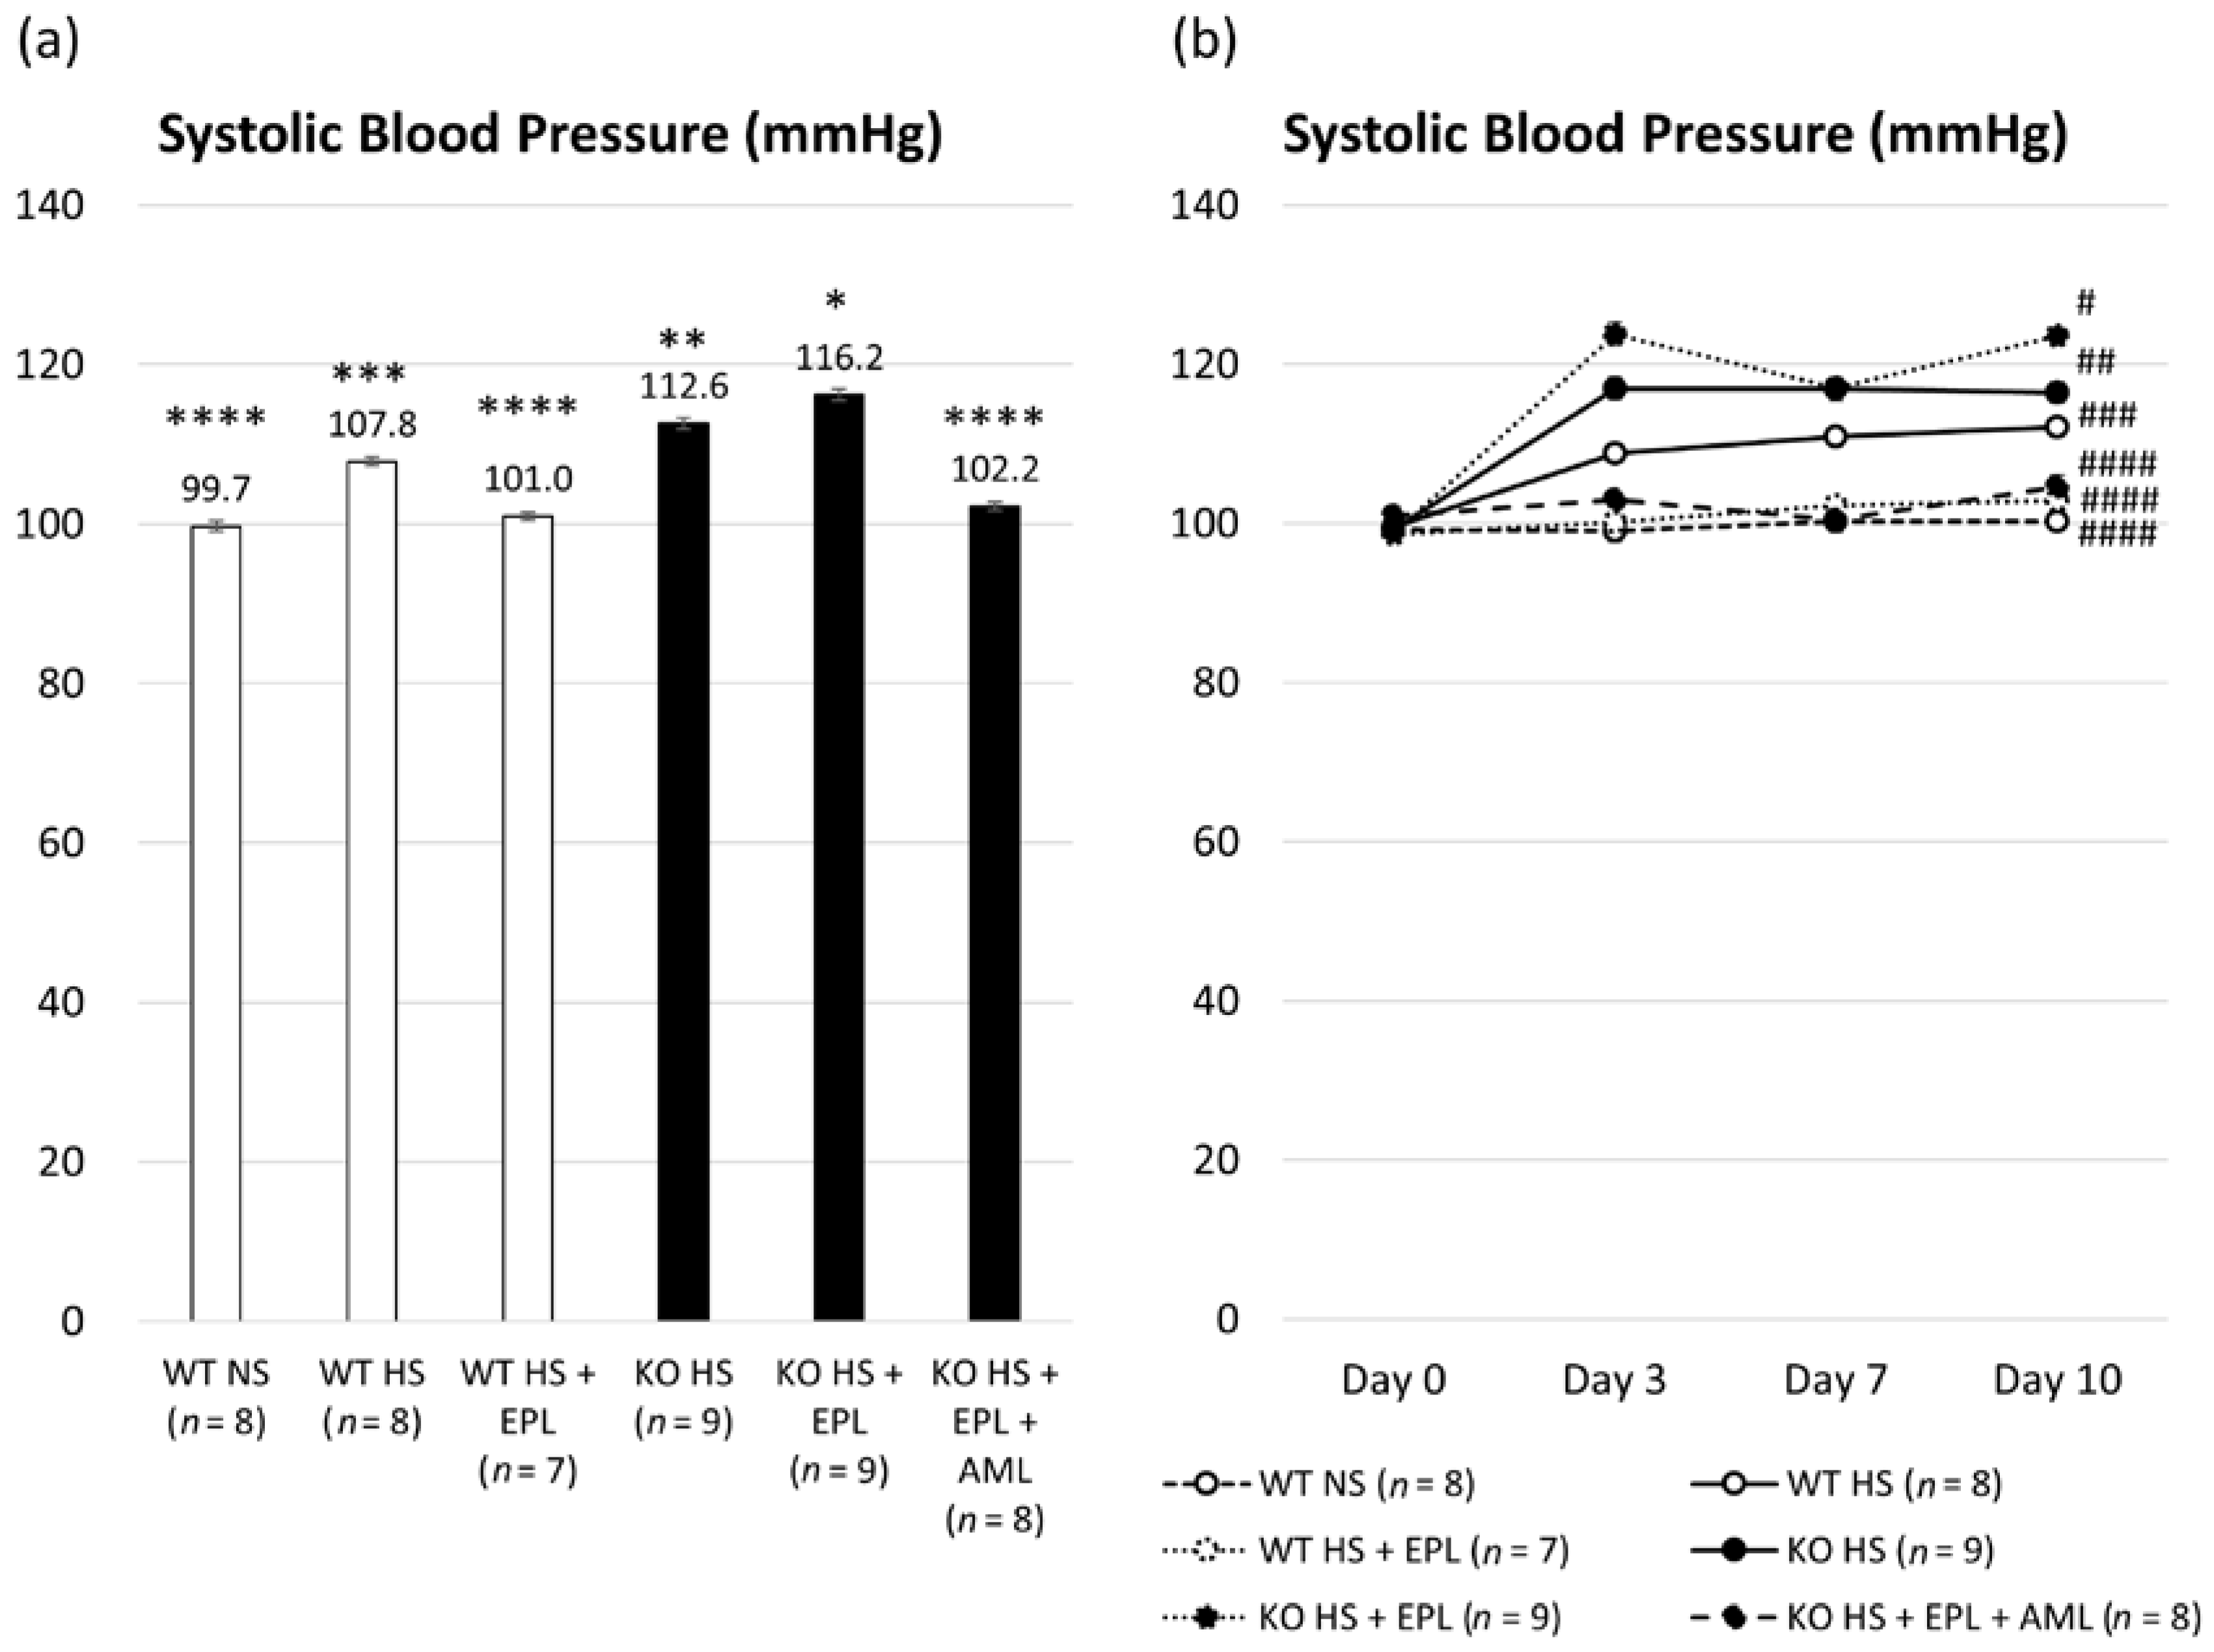
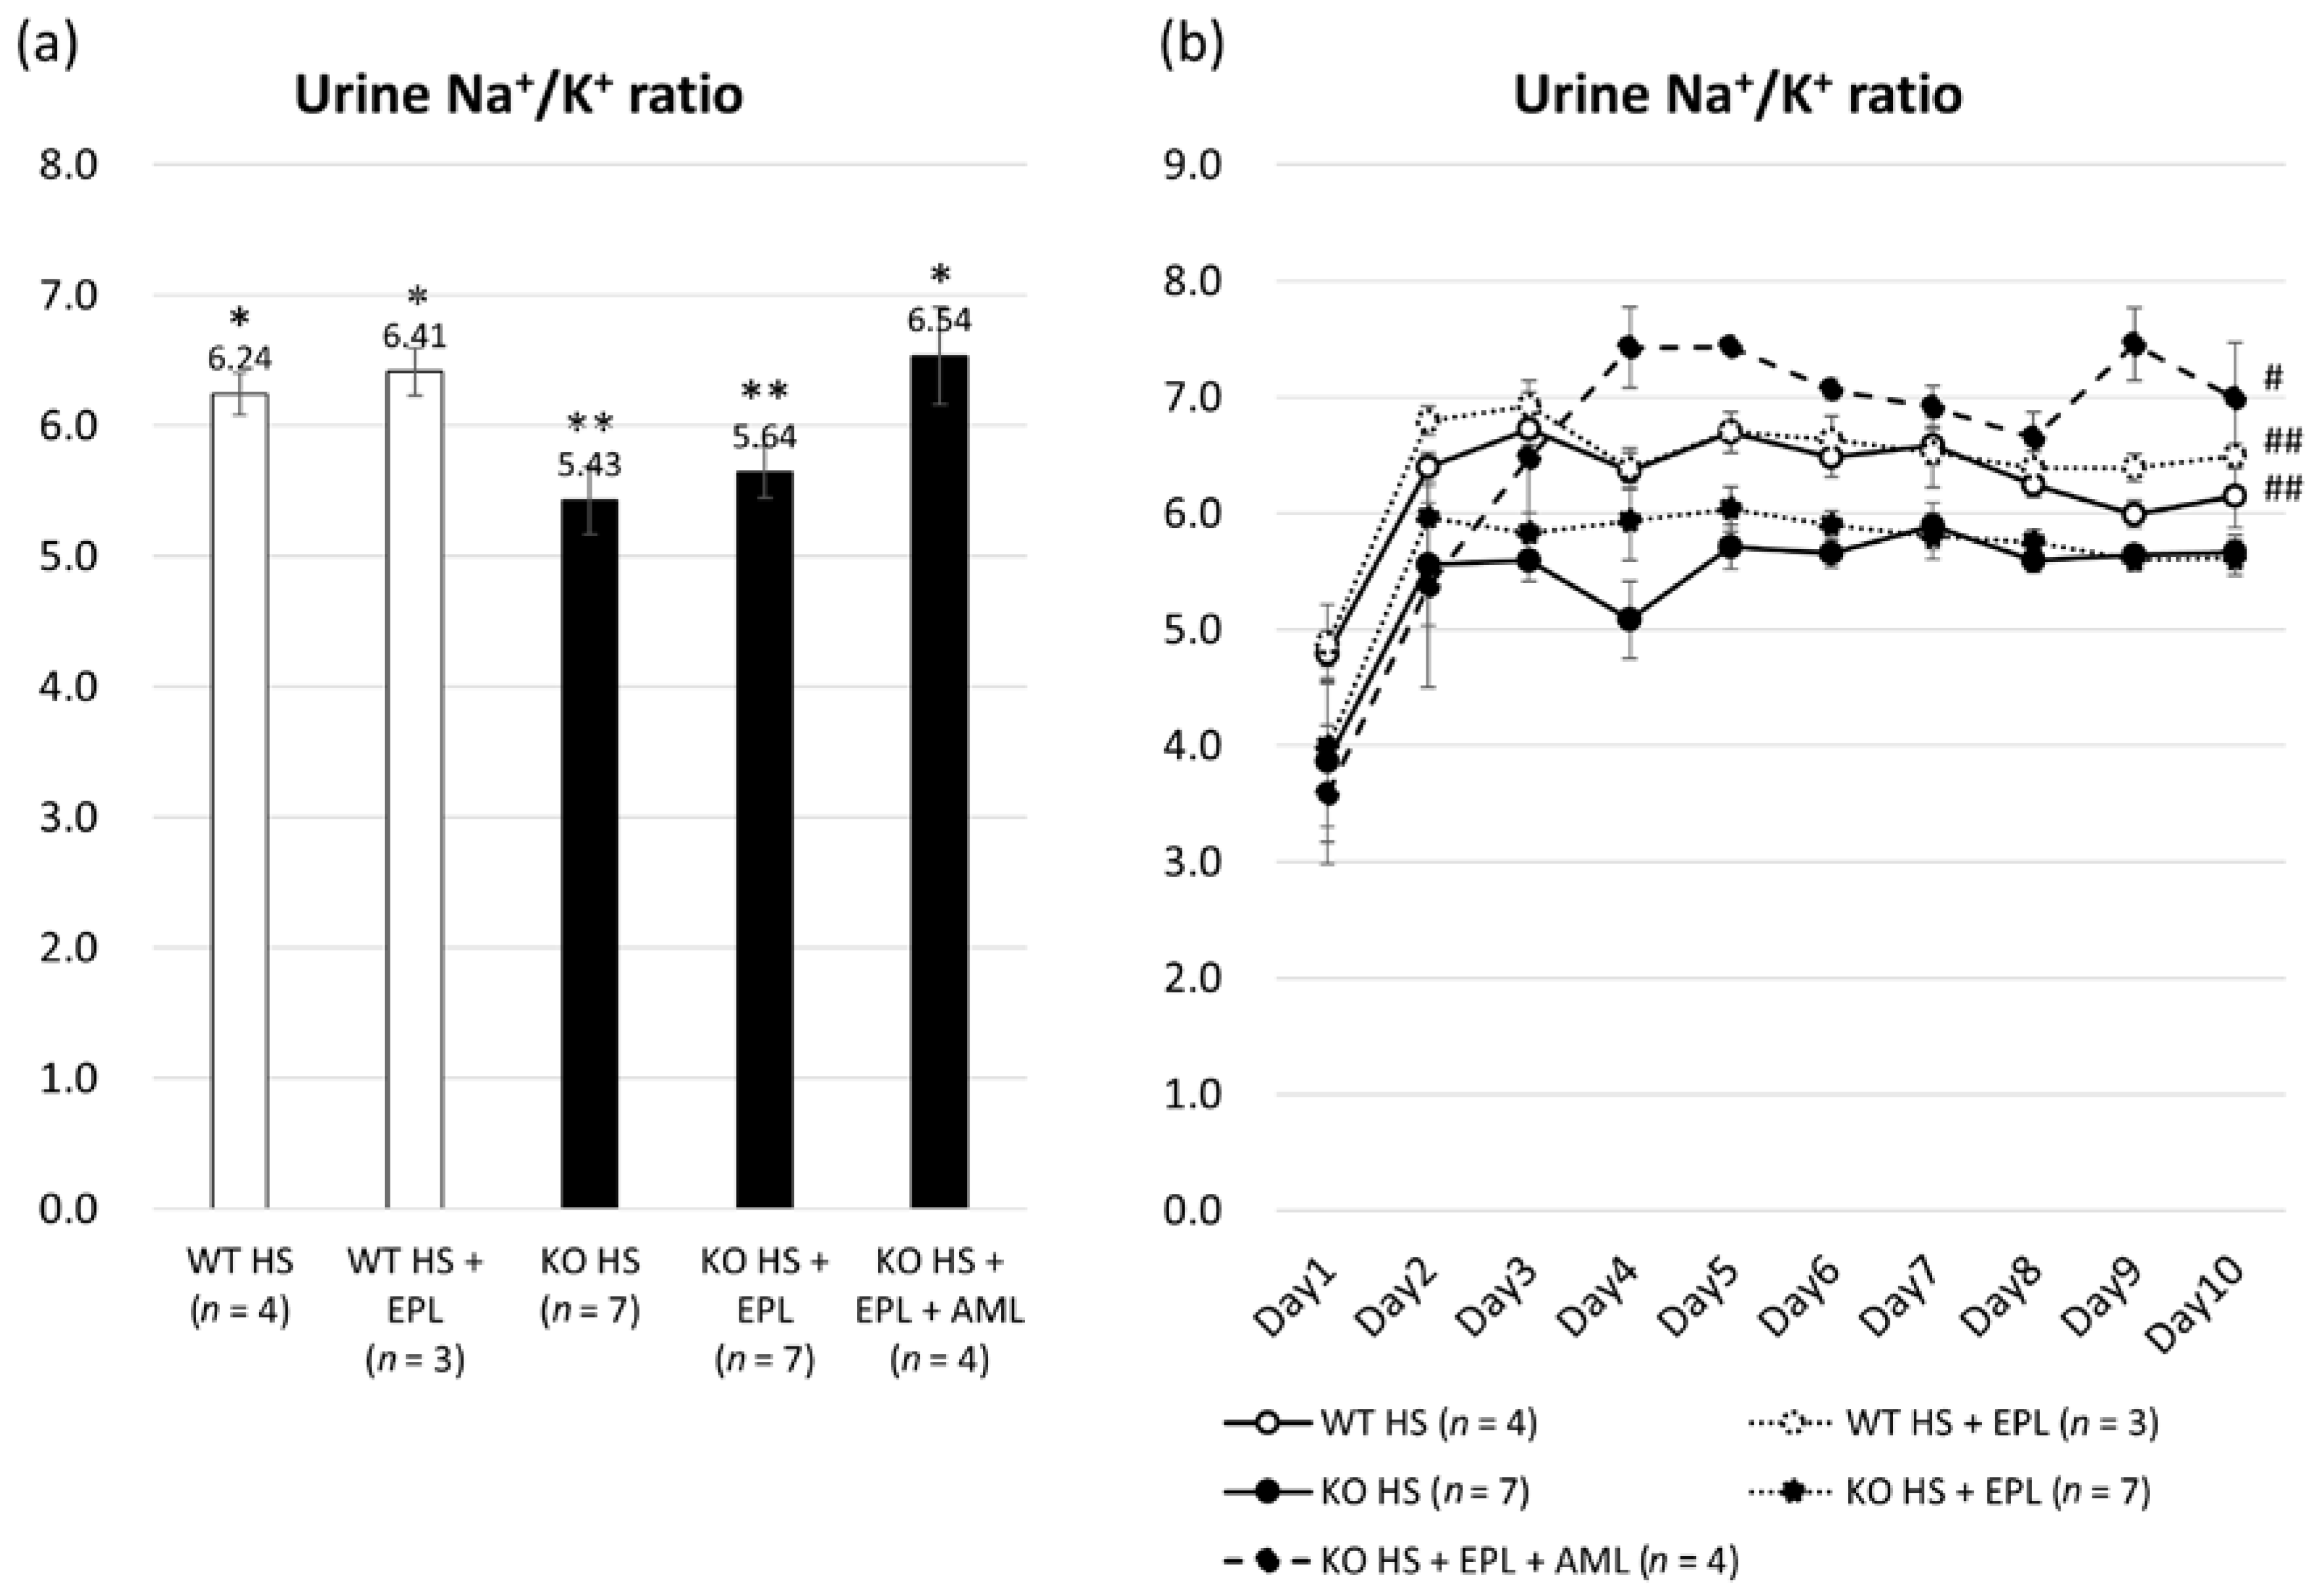
2.1. Metabolic Data in Nedd4-2 C2−/− Mice
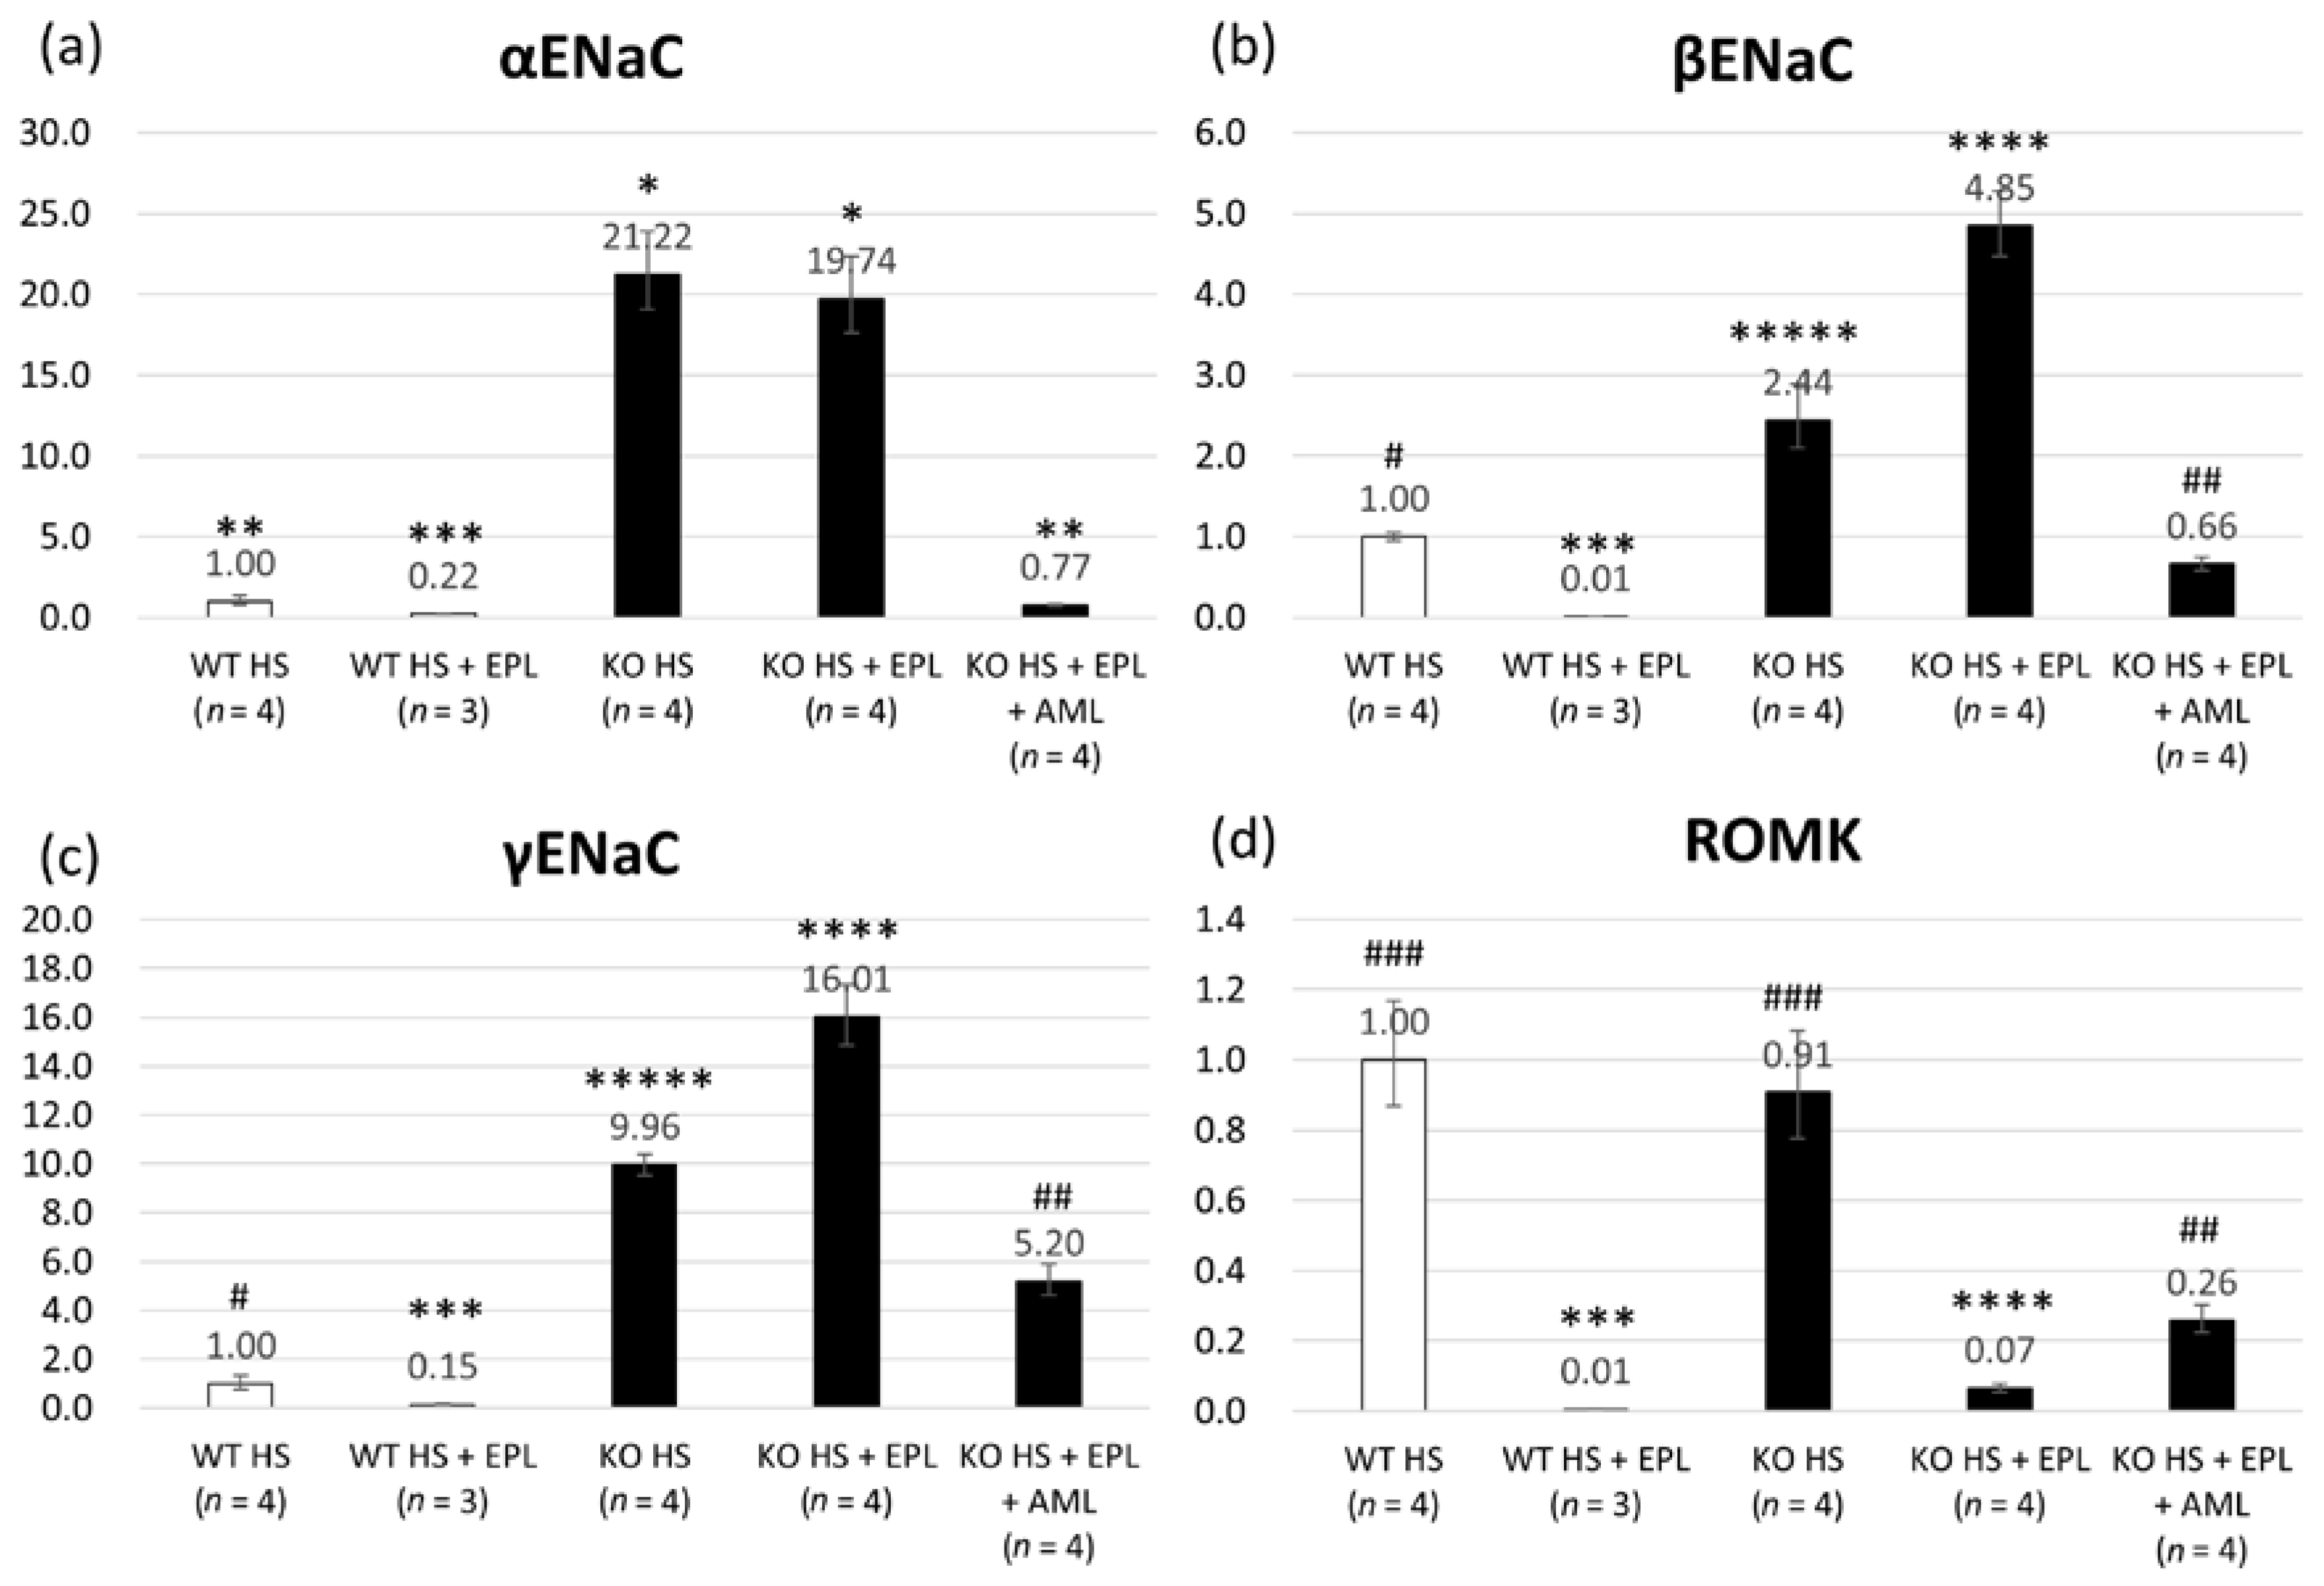
2.2. Quantitative Analysis of Epithelial Sodium Channel (ENaC) Transcripts
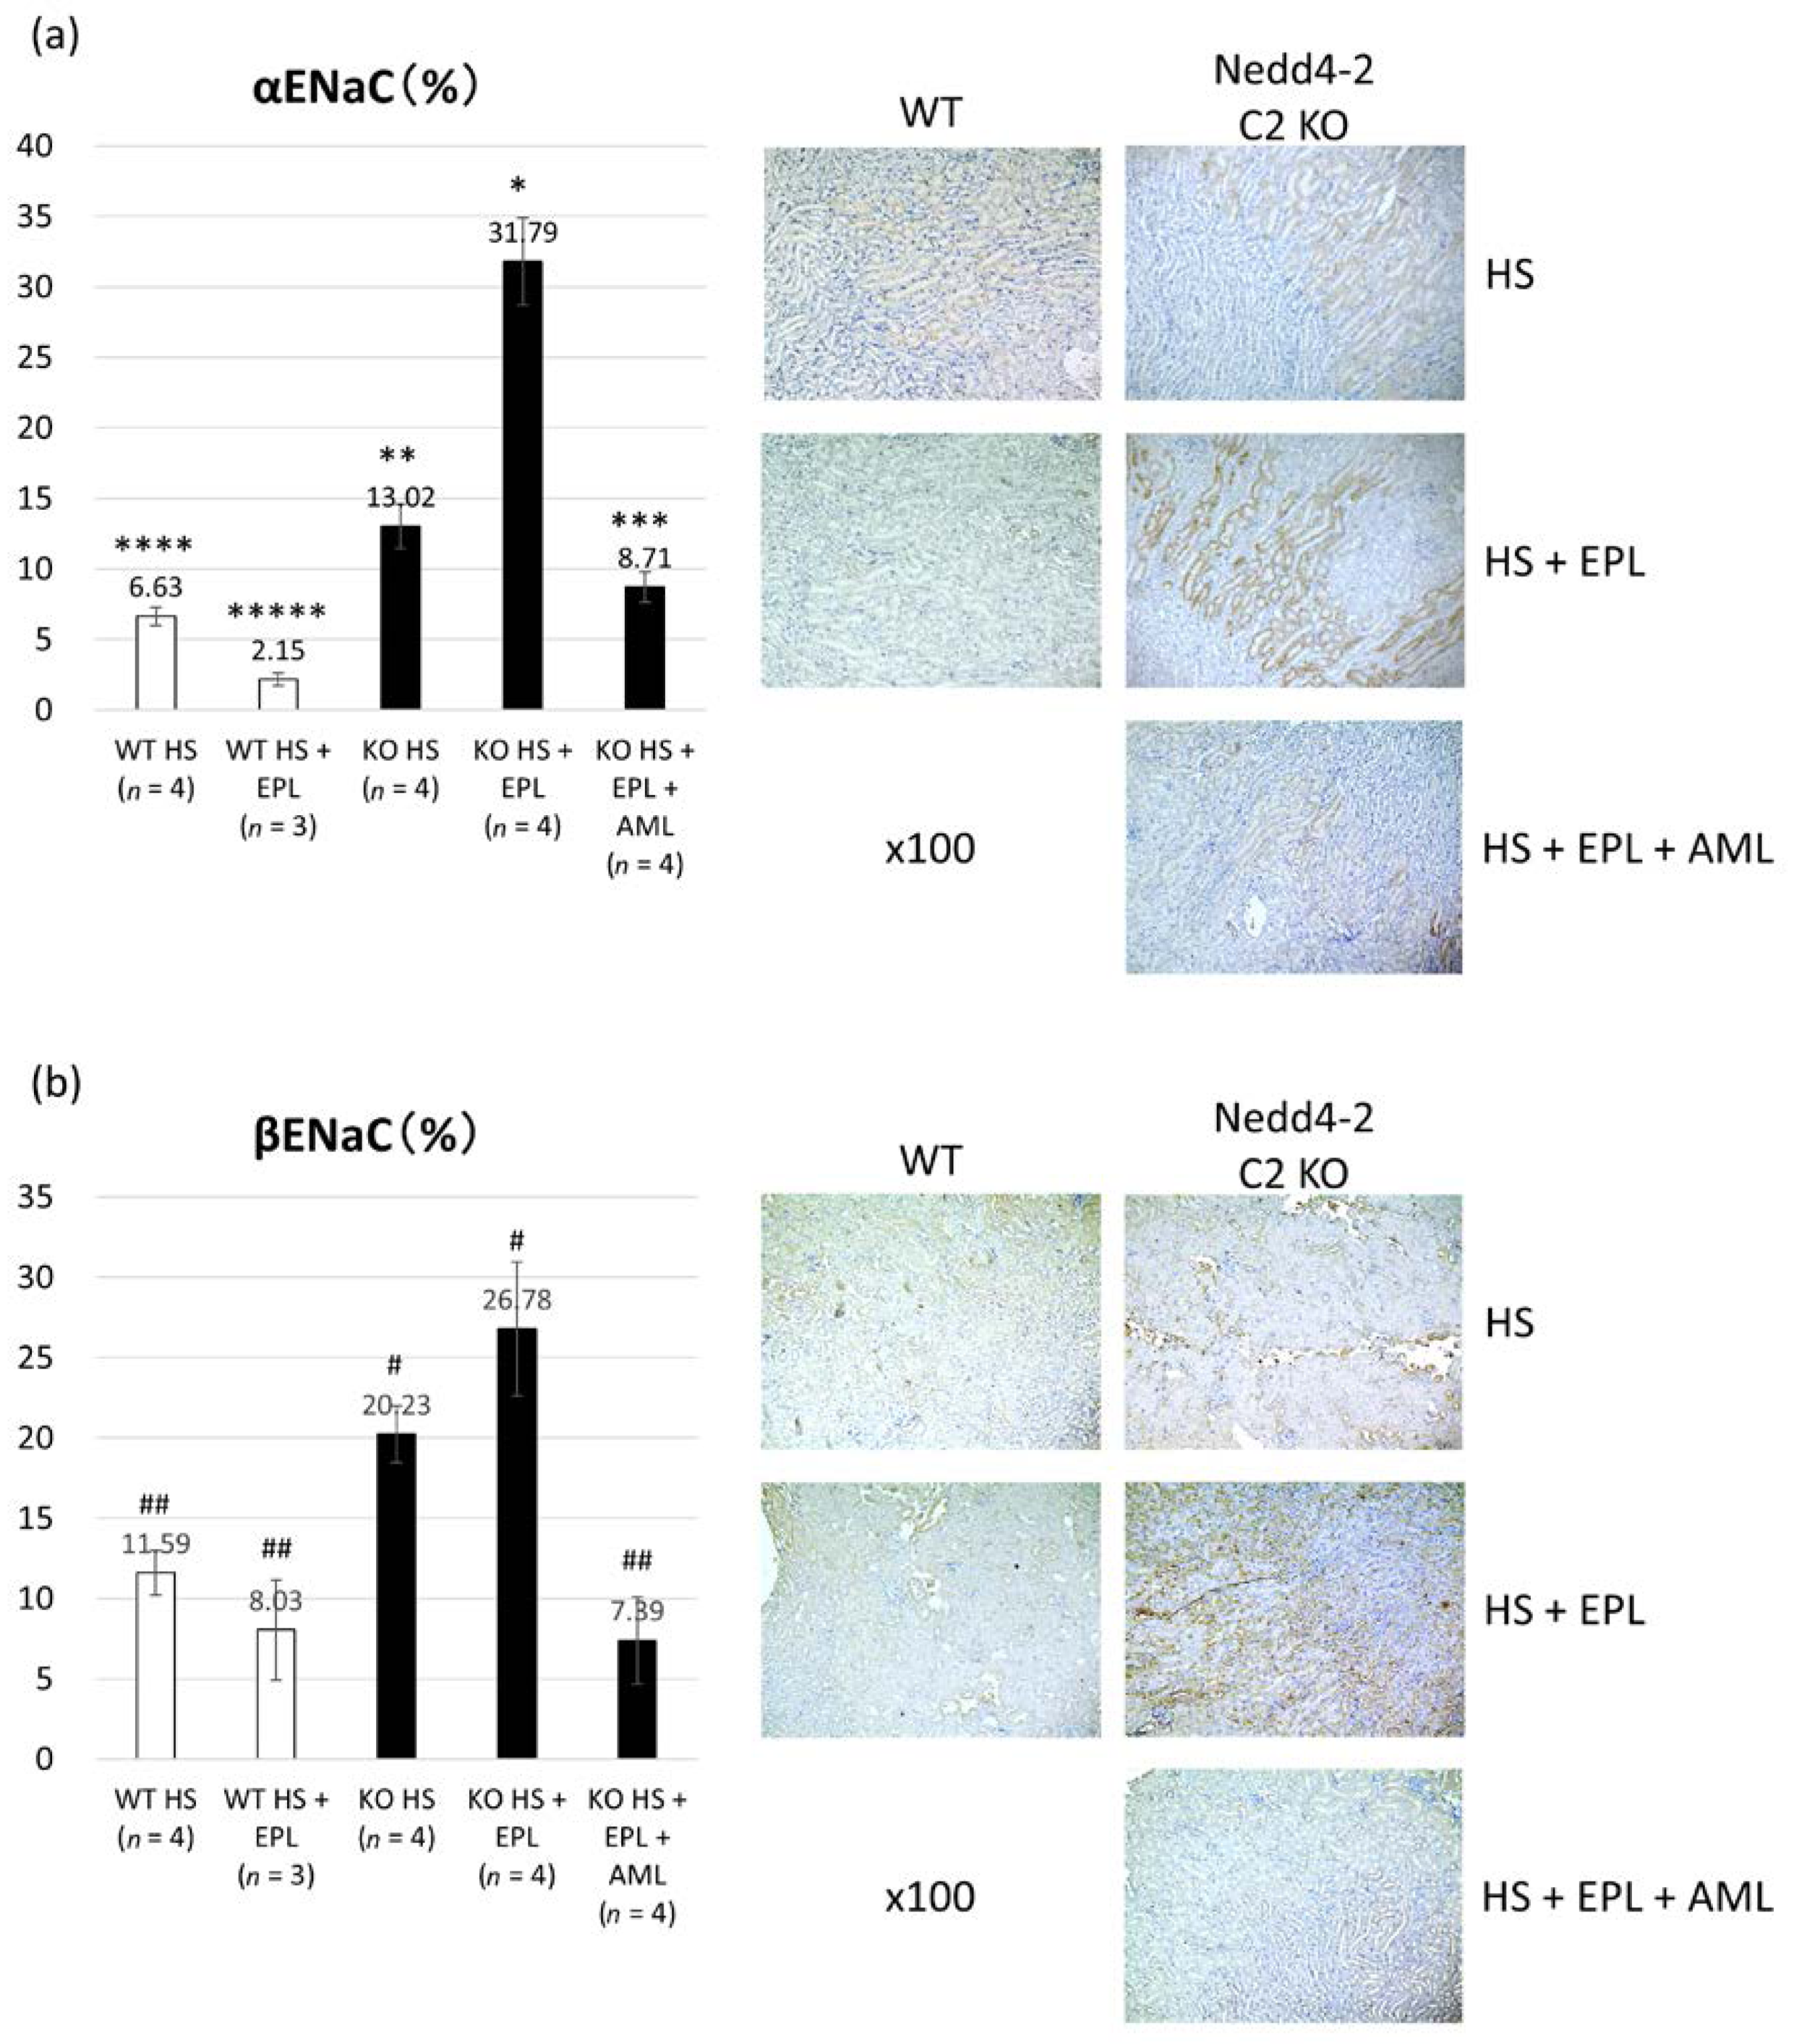
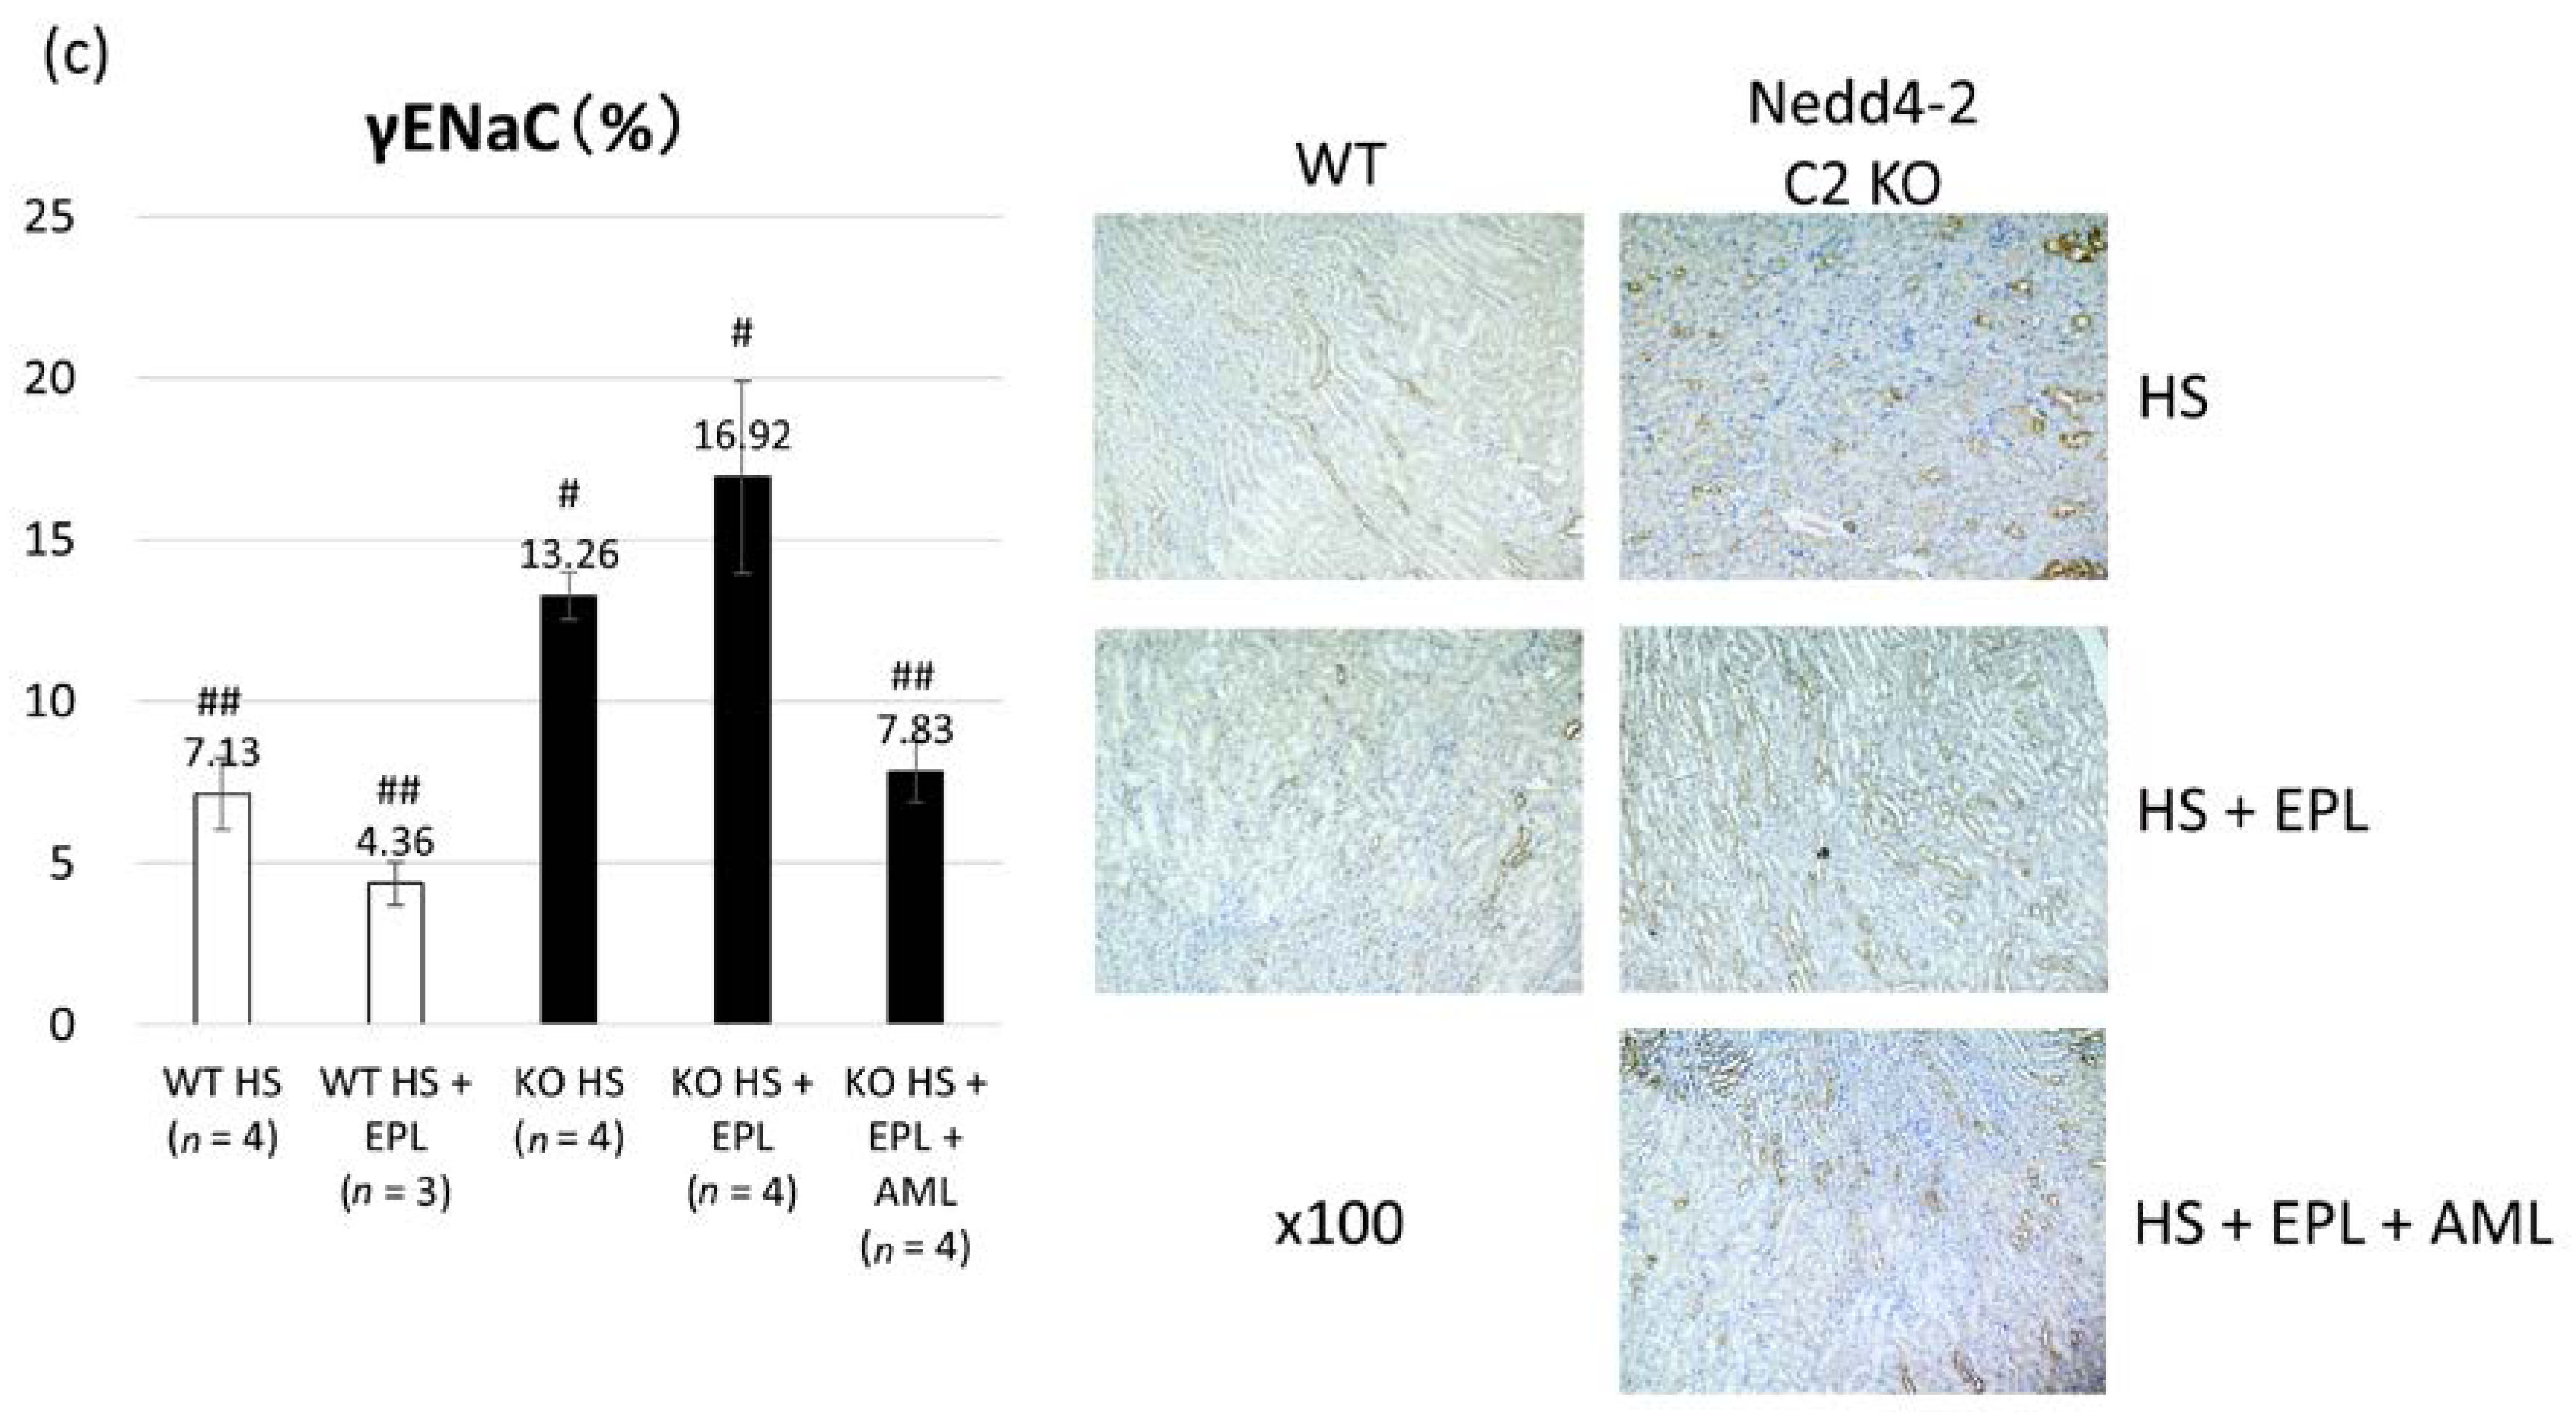
2.3. Semi-Quantitative Analysis of ENaC Proteins
3. Discussion
4. Materials and Methods
4.1. Metabolic Studies
4.2. Quantitative Reverese Transcriptase Polymerase Chain Reaction (RT-PCR) Analyses of ENaC Transcripts
4.3. Semi-Quantitative Immunohistopathological Analysis of ENaC Proteins
4.4. Statistical Analyses
5. Conclusions
Acknowledgments
Author Contributions
Conflicts of Interest
Abbreviations
| ASDN | Aldosterone Sensitive Distal Nephron |
| ENaC | Epithelial Sodium Channel |
| EPL | Eplerenone |
References
- McLaren, L.; Sumar, N.; Barberio, A.M.; Trieu, K.; Lorenzetti, D.L.; Tarasuk, V.; Webster, J.; Campbell, N.R. Population-level interventions in government jurisdictions for dietary sodium reduction. Cochrane Database Syst. Rev. 2016, 9, CD010166. [Google Scholar] [PubMed]
- Kong, Y.W.; Baqar, S.; Jerums, G.; Ekinci, E.I. Sodium and its role in cardiovascular disease—The debate continues. Front. Endocrinol. (Lausanne) 2016, 7, 164. [Google Scholar] [CrossRef] [PubMed]
- Joffres, M.; Falaschetti, E.; Gillespie, C.; Robitaille, C.; Loustalot, F.; Poulter, N.; McAlister, F.A.; Johansen, H.; Baclic, O.; Campbell, N. Hypertension prevalence, awareness, treatment and control in national surveys from england, the USA and canada, and correlation with stroke and ischaemic heart disease mortality: A cross-sectional study. BMJ 2013, 3, e003423. [Google Scholar] [CrossRef] [PubMed]
- Farooq, U.; Ray, S.G. 2014 guideline for the management of high blood pressure (eighth joint national committee): Take-home messages. Med. Clin. N. Am. 2015, 99, 733–738. [Google Scholar] [CrossRef] [PubMed]
- Shimamoto, K.; Ando, K.; Fujita, T.; Hasebe, N.; Higaki, J.; Horiuchi, M.; Imai, Y.; Imaizumi, T.; Ishimitsu, T.; Ito, M.; et al. The japanese society of hypertension guidelines for the management of hypertension (JSH 2014). Hypertens. Res. 2014, 37, 253–390. [Google Scholar] [PubMed]
- Mancia, G.; Fagard, R.; Narkiewicz, K.; Redon, J.; Zanchetti, A.; Bohm, M.; Christiaens, T.; Cifkova, R.; de Backer, G.; Dominiczak, A.; et al. 2013 ESH/ESC guidelines for the management of arterial hypertension: The task force for the management of arterial hypertension of the european society of hypertension (ESH) and of the european society of cardiology (ESC). Eur. Heart J. 2013, 34, 2159–2219. [Google Scholar] [CrossRef] [PubMed]
- Weber, M.A.; Schiffrin, E.L.; White, W.B.; Mann, S.; Lindholm, L.H.; Kenerson, J.G.; Flack, J.M.; Carter, B.L.; Materson, B.J.; Ram, C.V.; et al. Clinical practice guidelines for the management of hypertension in the community: A statement by the american society of hypertension and the international society of hypertension. J. Clin. Hypertens. (Greenwich) 2014, 16, 14–26. [Google Scholar] [CrossRef] [PubMed]
- Wright, J.T., Jr.; Williamson, J.D.; Whelton, P.K.; Snyder, J.K.; Sink, K.M.; Rocco, M.V.; Reboussin, D.M.; Rahman, M.; Oparil, S.; Lewis, C.E.; et al. A randomized trial of intensive versus standard blood-pressure control. N. Engl. J. Med. 2015, 373, 2103–2116. [Google Scholar] [PubMed]
- Staessen, J.A.; Wang, J.G.; Thijs, L. Cardiovascular protection and blood pressure reduction: A meta-analysis. Lancet 2001, 358, 1305–1315. [Google Scholar] [CrossRef]
- Calhoun, D.A.; Jones, D.; Textor, S.; Goff, D.C.; Murphy, T.P.; Toto, R.D.; White, A.; Cushman, W.C.; White, W.; Sica, D.; et al. Resistant hypertension: Diagnosis, evaluation, and treatment. A scientific statement from the american heart association professional education committee of the council for high blood pressure research. Hypertension 2008, 51, 1403–1419. [Google Scholar] [CrossRef] [PubMed]
- Vongpatanasin, W. Resistant hypertension: A review of diagnosis and management. JAMA 2014, 311, 2216–2224. [Google Scholar] [CrossRef] [PubMed]
- Townsend, R.R.; Epstein, M. Resistant hypertension: Insights on evaluation and management in the post-sprint (systolic blood pressure intervention trial) era. Hypertension 2016, 68, 1073–1080. [Google Scholar] [CrossRef] [PubMed]
- Dahl, L.K.; Love, R.A. Evidence for relationship between sodium (chloride) intake and human essential hypertension. AMA Arch. Intern. Med. 1954, 94, 525–531. [Google Scholar] [CrossRef] [PubMed]
- Dahl, L.K. Possible role of chronic excess salt consumption in the pathogenesis of essential hypertension. Am. J. Cardiol. 1961, 8, 571–575. [Google Scholar] [CrossRef]
- Intersalt Cooperative Research Group. Intersalt: An international study of electrolyte excretion and blood pressure. Results for 24 hour urinary sodium and potassium excretion. BMJ 1988, 297, 319–328. [Google Scholar]
- Kurtz, T.W.; DiCarlo, S.E.; Pravenec, M.; Schmidlin, O.; Tanaka, M.; Morris, R.C., Jr. An alternative hypothesis to the widely held view that renal excretion of sodium accounts for resistance to salt-induced hypertension. Kidney Int. 2016, 90, 965–973. [Google Scholar] [CrossRef] [PubMed]
- Engbaek, M.; Hjerrild, M.; Hallas, J.; Jacobsen, I.A. The effect of low-dose spironolactone on resistant hypertension. J. Am. Soc. Hypertens. 2010, 4, 290–294. [Google Scholar] [CrossRef] [PubMed]
- Calhoun, D.A.; White, W.B. Effectiveness of the selective aldosterone blocker, eplerenone, in patients with resistant hypertension. J. Am. Soc. Hypertens. 2008, 2, 462–468. [Google Scholar] [CrossRef] [PubMed]
- Heshka, J.; Ruzicka, M.; Hiremath, S.; McCormick, B.B. Spironolactone for difficult to control hypertension in chronic kidney disease: An analysis of safety and efficacy. J. Am. Soc. Hypertens. 2010, 4, 295–301. [Google Scholar] [CrossRef] [PubMed]
- Oxlund, C.S.; Henriksen, J.E.; Tarnow, L.; Schousboe, K.; Gram, J.; Jacobsen, I.A. Low dose spironolactone reduces blood pressure in patients with resistant hypertension and type 2 diabetes mellitus: A double blind randomized clinical trial. J. Hypertens. 2013, 31, 2094–2102. [Google Scholar] [CrossRef] [PubMed]
- Minegishi, S.; Ishigami, T.; Kino, T.; Chen, L.; Nakashima-Sasaki, R.; Araki, N.; Yatsu, K.; Fujita, M.; Umemura, S. An isoform of Nedd4-2 is critically involved in the renal adaptation to high salt intake in mice. Sci. Rep. 2016, 6, 27137. [Google Scholar] [CrossRef] [PubMed]
- Shimkets, R.A.; Warnock, D.G.; Bositis, C.M.; Nelson-Williams, C.; Hansson, J.H.; Schambelan, M.; Gill, J.R., Jr.; Ulick, S.; Milora, R.V.; Findling, J.W.; et al. Liddle’s syndrome: Heritable human hypertension caused by mutations in the beta subunit of the epithelial sodium channel. Cell 1994, 79, 407–414. [Google Scholar] [CrossRef]
- Dunn, D.M.; Ishigami, T.; Pankow, J.; von Niederhausern, A.; Alder, J.; Hunt, S.C.; Leppert, M.F.; Lalouel, J.M.; Weiss, R.B. Common variant of human Nedd4L activates a cryptic splice site to form a frameshifted transcript. J. Hum. Genet. 2002, 47, 665–676. [Google Scholar] [CrossRef] [PubMed]
- Umemura, M.; Ishigami, T.; Tamura, K.; Sakai, M.; Miyagi, Y.; Nagahama, K.; Aoki, I.; Uchino, K.; Rohrwasser, A.; Lalouel, J.M.; et al. Transcriptional diversity and expression of Nedd4L gene in distal nephron. Biochem. Biophys. Res. Commun. 2006, 339, 1129–1137. [Google Scholar] [CrossRef] [PubMed]
- Araki, N.; Umemura, M.; Miyagi, Y.; Yabana, M.; Miki, Y.; Tamura, K.; Uchino, K.; Aoki, R.; Goshima, Y.; Umemura, S.; et al. Expression, transcription, and possible antagonistic interaction of the human Nedd4L gene variant: Implications for essential hypertension. Hypertension 2008, 51, 773–777. [Google Scholar] [CrossRef] [PubMed]
- Koltsova, S.V.; Shilov, B.; Birulina, J.G.; Akimova, O.A.; Haloui, M.; Kapilevich, L.V.; Gusakova, S.V.; Tremblay, J.; Hamet, P.; Orlov, S.N. Transcriptomic changes triggered by hypoxia: Evidence for HIF-1α-independent, [Na+]i/[K+]i-mediated, excitation-transcription coupling. PLoS ONE 2014, 9, e110597. [Google Scholar] [CrossRef] [PubMed]
- Taurin, S.; Dulin, N.O.; Pchejetski, D.; Grygorczyk, R.; Tremblay, J.; Hamet, P.; Orlov, S.N. C-fos expression in ouabain-treated vascular smooth muscle cells from rat aorta: Evidence for an intracellular-sodium-mediated, calcium-independent mechanism. J. Physiol. 2002, 543, 835–847. [Google Scholar] [CrossRef] [PubMed]
- Koltsova, S.V.; Trushina, Y.; Haloui, M.; Akimova, O.A.; Tremblay, J.; Hamet, P.; Orlov, S.N. Ubiquitous [Na+]i/[K+]i-sensitive transcriptome in mammalian cells: Evidence for Ca2+i-independent excitation-transcription coupling. PLoS ONE 2012, 7, e38032. [Google Scholar] [CrossRef] [PubMed]
- Orlov, S.N.; Hamet, P. Salt and gene expression: Evidence for [Na+]i/[K+]i-mediated signaling pathways. Pflugers Arch. Eur. J. Physiol. 2015, 467, 489–498. [Google Scholar] [CrossRef] [PubMed]
- Ushio-Yamana, H.; Minegishi, S.; Ishigami, T.; Araki, N.; Umemura, M.; Tamura, K.; Maeda, E.; Kakizoe, Y.; Kitamura, K.; Umemura, S. Renin angiotensin antagonists normalize aberrant activation of epithelial sodium channels in sodium-sensitive hypertension. Nephron. Exp. Nephrol. 2012, 122, 95–102. [Google Scholar] [CrossRef] [PubMed]
- Kakizoe, Y.; Kitamura, K.; Ko, T.; Wakida, N.; Maekawa, A.; Miyoshi, T.; Shiraishi, N.; Adachi, M.; Zhang, Z.; Masilamani, S.; et al. Aberrant ENaC activation in Dahl salt-sensitive rats. J. Hypertens. 2009, 27, 1679–1689. [Google Scholar] [CrossRef] [PubMed]
- Rossier, B.C.; Stutts, M.J. Activation of the epithelial sodium channel (ENaC) by serine proteases. Annu. Rev. Physiol. 2009, 71, 361–379. [Google Scholar] [CrossRef] [PubMed]
- Shi, S.; Carattino, M.D.; Hughey, R.P.; Kleyman, T.R. ENaC regulation by proteases and shear stress. Curr. Mol. Pharm. 2013, 6, 28–34. [Google Scholar] [CrossRef]
- Frindt, G.; Gravotta, D.; Palmer, L.G. Regulation of ENaC trafficking in rat kidney. J. Gen. Physiol. 2016, 147, 217–227. [Google Scholar] [CrossRef] [PubMed]
- Shibata, S.; Nagase, M.; Yoshida, S.; Kawarazaki, W.; Kurihara, H.; Tanaka, H.; Miyoshi, J.; Takai, Y.; Fujita, T. Modification of mineralocorticoid receptor function by Rac1 GTPase: Implication in proteinuric kidney disease. Nat. Med. 2008, 14, 1370–1376. [Google Scholar] [CrossRef] [PubMed]
- Dahlberg, J.; Sjogren, M.; Hedblad, B.; Engstrom, G.; Melander, O. Genetic variation in Nedd4L, an epithelial sodium channel regulator, is associated with cardiovascular disease and cardiovascular death. J. Hypertens. 2014, 32, 294–299. [Google Scholar] [CrossRef] [PubMed]
- Dahlberg, J.; Nilsson, L.O.; von Wowern, F.; Melander, O. Polymorphism in Nedd4L is associated with increased salt sensitivity, reduced levels of p-renin and increased levels of Nt-proANP. PLoS ONE 2007, 2, e432. [Google Scholar] [CrossRef] [PubMed]
- Masilamani, S.; Kim, G.H.; Mitchell, C.; Wade, J.B.; Knepper, M.A. Aldosterone-mediated regulation of ENaC alpha, beta, and gamma subunit proteins in rat kidney. J. Clin. Investig. 1999, 104, R19–R23. [Google Scholar] [CrossRef] [PubMed]


| WT Littermates | Nedd4-2 C2−/− (KO) | p 1 | |||||
|---|---|---|---|---|---|---|---|
| NS (n = 8) | HS (n = 8) | HS + EPL (n = 7) | HS (n = 9) | HS + EPL (n = 9) | HS + EPL + AML (n = 8) | ||
| BW on day 0 | 28.50 ± 0.53 | 27.42 ± 1.17 | 26.78 ± 0.98 | 26.75 ± 0.93 | 27.69 ± 1.09 | 29.76 ± 0.68 | 0.2133 |
| BW on day10 | 29.43 ± 0.53 | 28.02 ± 1.09 | 26.69 ± 1.30 | 27.86 ± 0.60 | 26.80 ± 1.06 | 28.59 ± 0.40 | 0.2584 |
© 2017 by the authors. Licensee MDPI, Basel, Switzerland. This article is an open access article distributed under the terms and conditions of the Creative Commons Attribution (CC BY) license (http://creativecommons.org/licenses/by/4.0/).
Share and Cite
Kino, T.; Ishigami, T.; Murata, T.; Doi, H.; Nakashima-Sasaki, R.; Chen, L.; Sugiyama, M.; Azushima, K.; Wakui, H.; Minegishi, S.; et al. Eplerenone-Resistant Salt-Sensitive Hypertension in Nedd4-2 C2 KO Mice. Int. J. Mol. Sci. 2017, 18, 1250. https://0-doi-org.brum.beds.ac.uk/10.3390/ijms18061250
Kino T, Ishigami T, Murata T, Doi H, Nakashima-Sasaki R, Chen L, Sugiyama M, Azushima K, Wakui H, Minegishi S, et al. Eplerenone-Resistant Salt-Sensitive Hypertension in Nedd4-2 C2 KO Mice. International Journal of Molecular Sciences. 2017; 18(6):1250. https://0-doi-org.brum.beds.ac.uk/10.3390/ijms18061250
Chicago/Turabian StyleKino, Tabito, Tomoaki Ishigami, Tsumugi Murata, Hiroshi Doi, Rie Nakashima-Sasaki, Lin Chen, Michiko Sugiyama, Kengo Azushima, Hiromichi Wakui, Shintaro Minegishi, and et al. 2017. "Eplerenone-Resistant Salt-Sensitive Hypertension in Nedd4-2 C2 KO Mice" International Journal of Molecular Sciences 18, no. 6: 1250. https://0-doi-org.brum.beds.ac.uk/10.3390/ijms18061250