Melatonin Decreases Glucose Metabolism in Prostate Cancer Cells: A 13C Stable Isotope-Resolved Metabolomic Study

 , ,
, ,  and
and 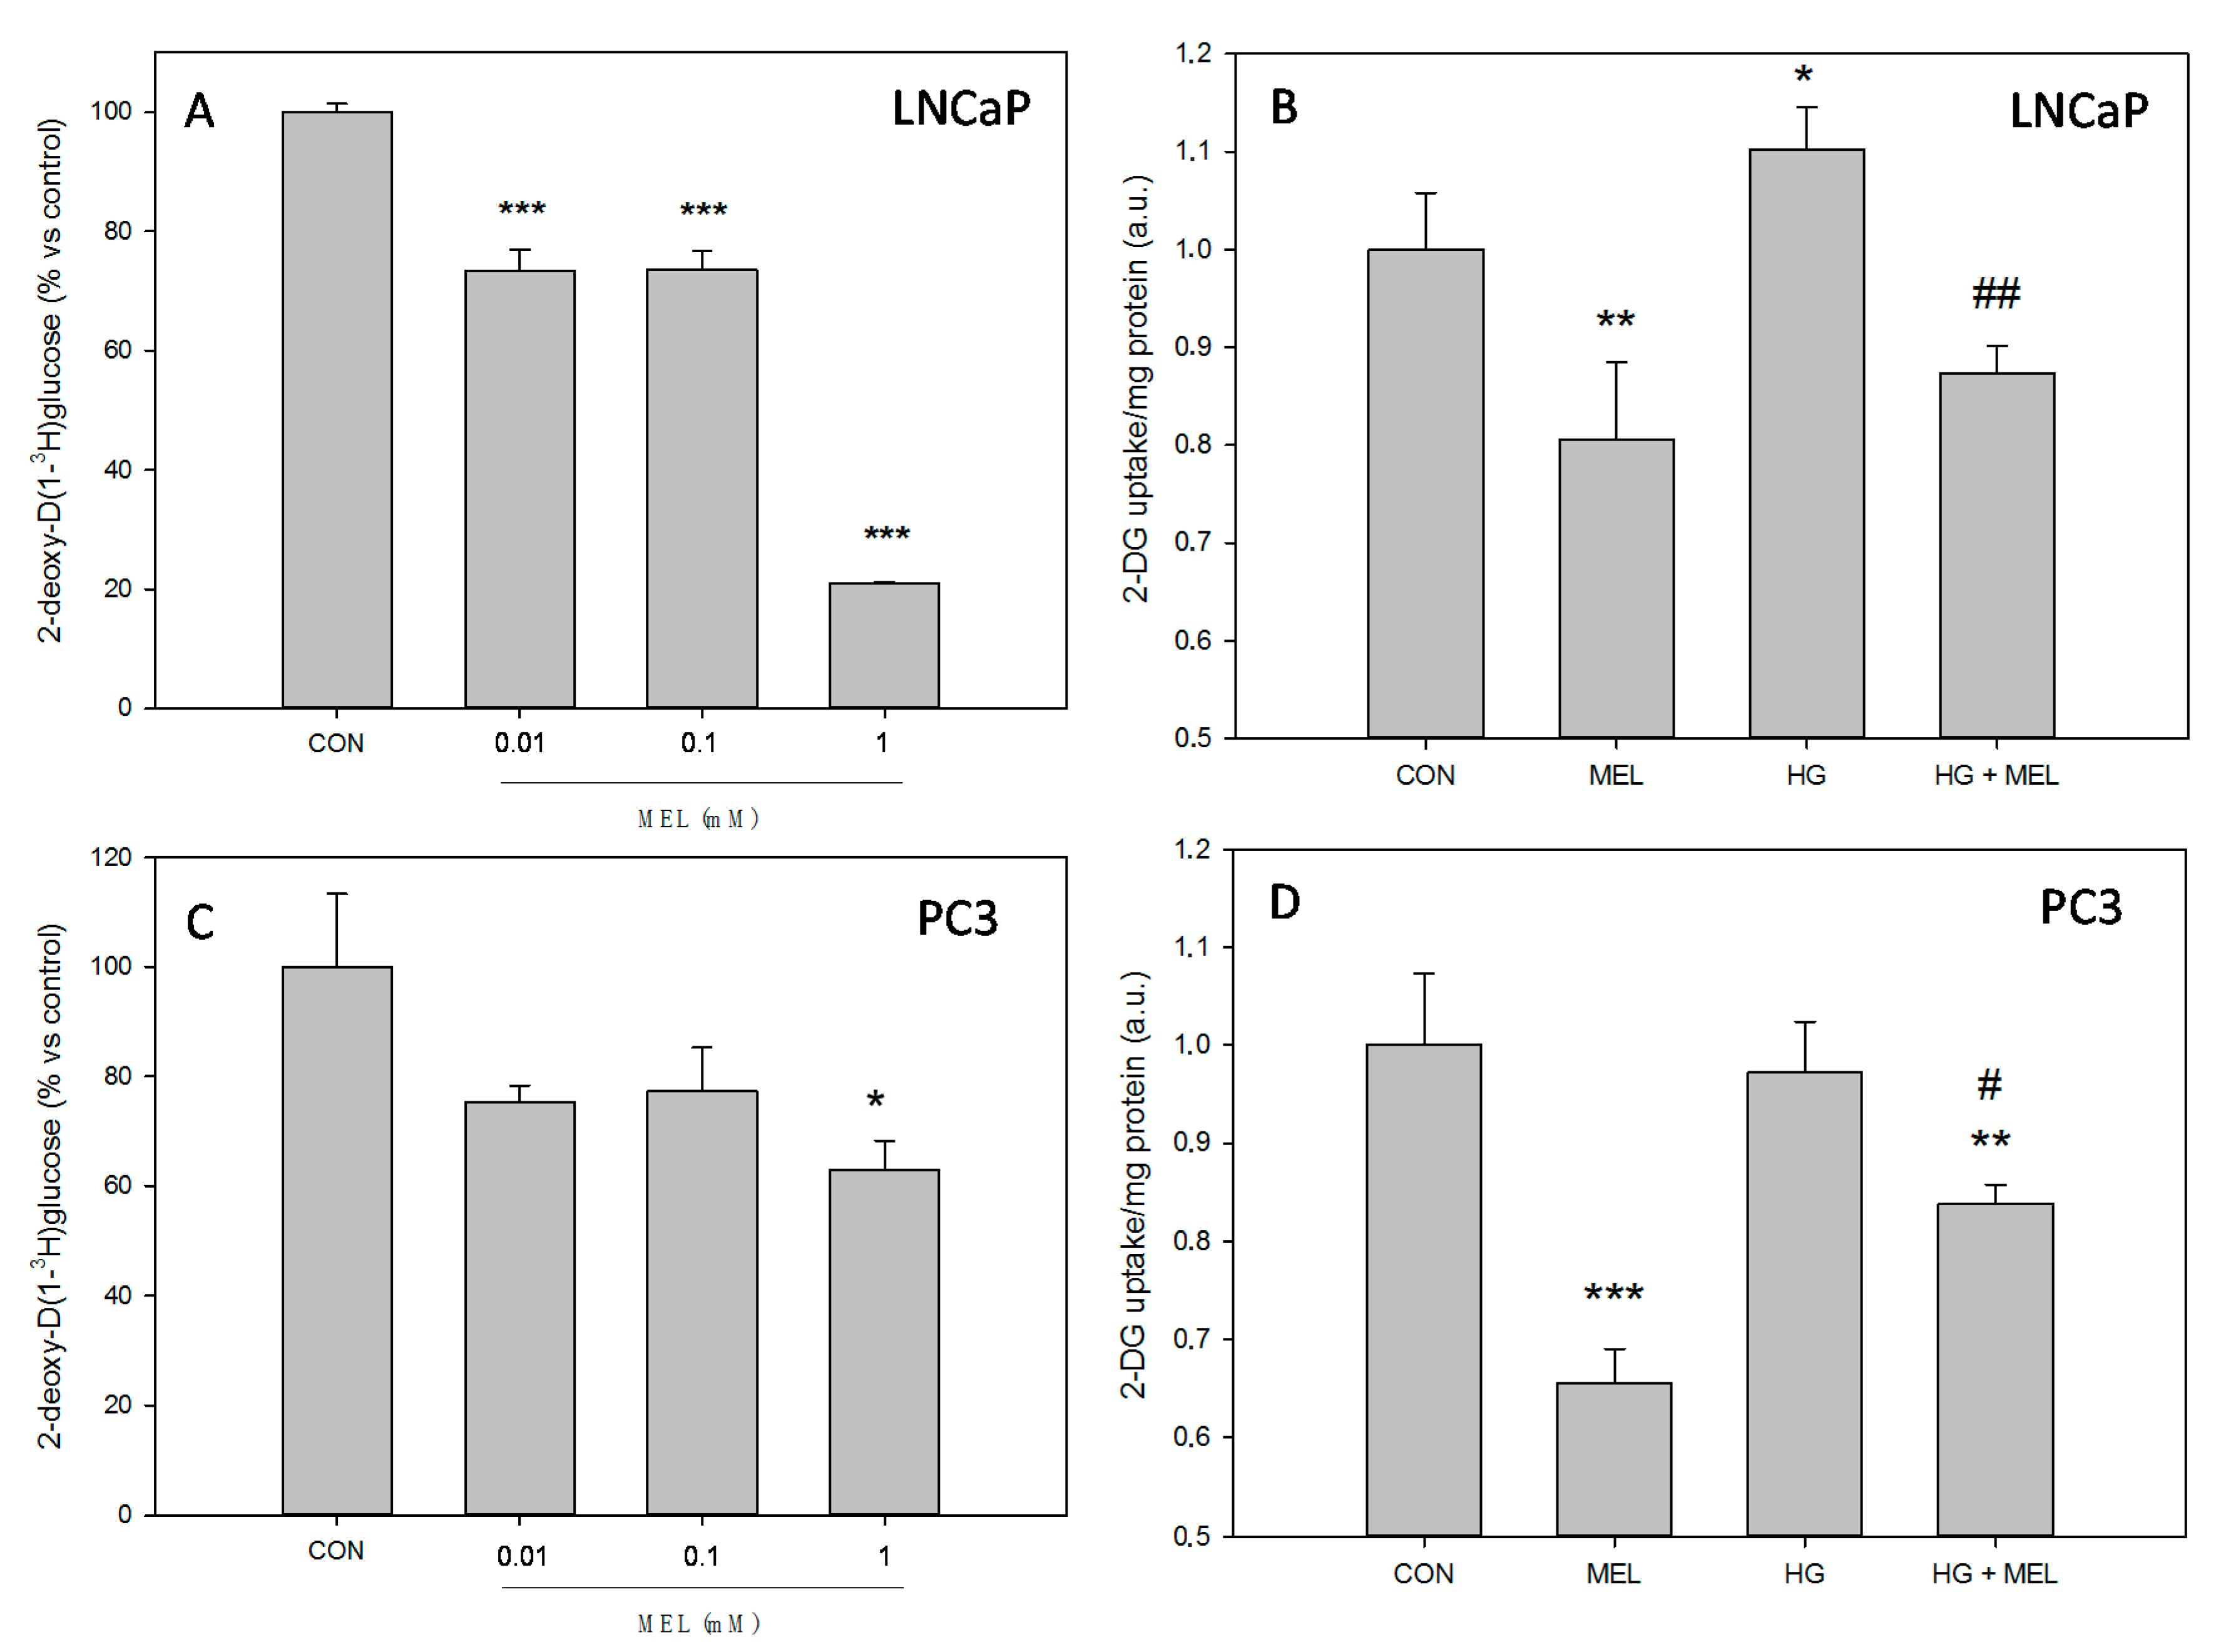
Abstract
:1. Introduction
2. Results
2.1. Melatonin Decreases Glucose Uptake in Prostate Cancer Cells
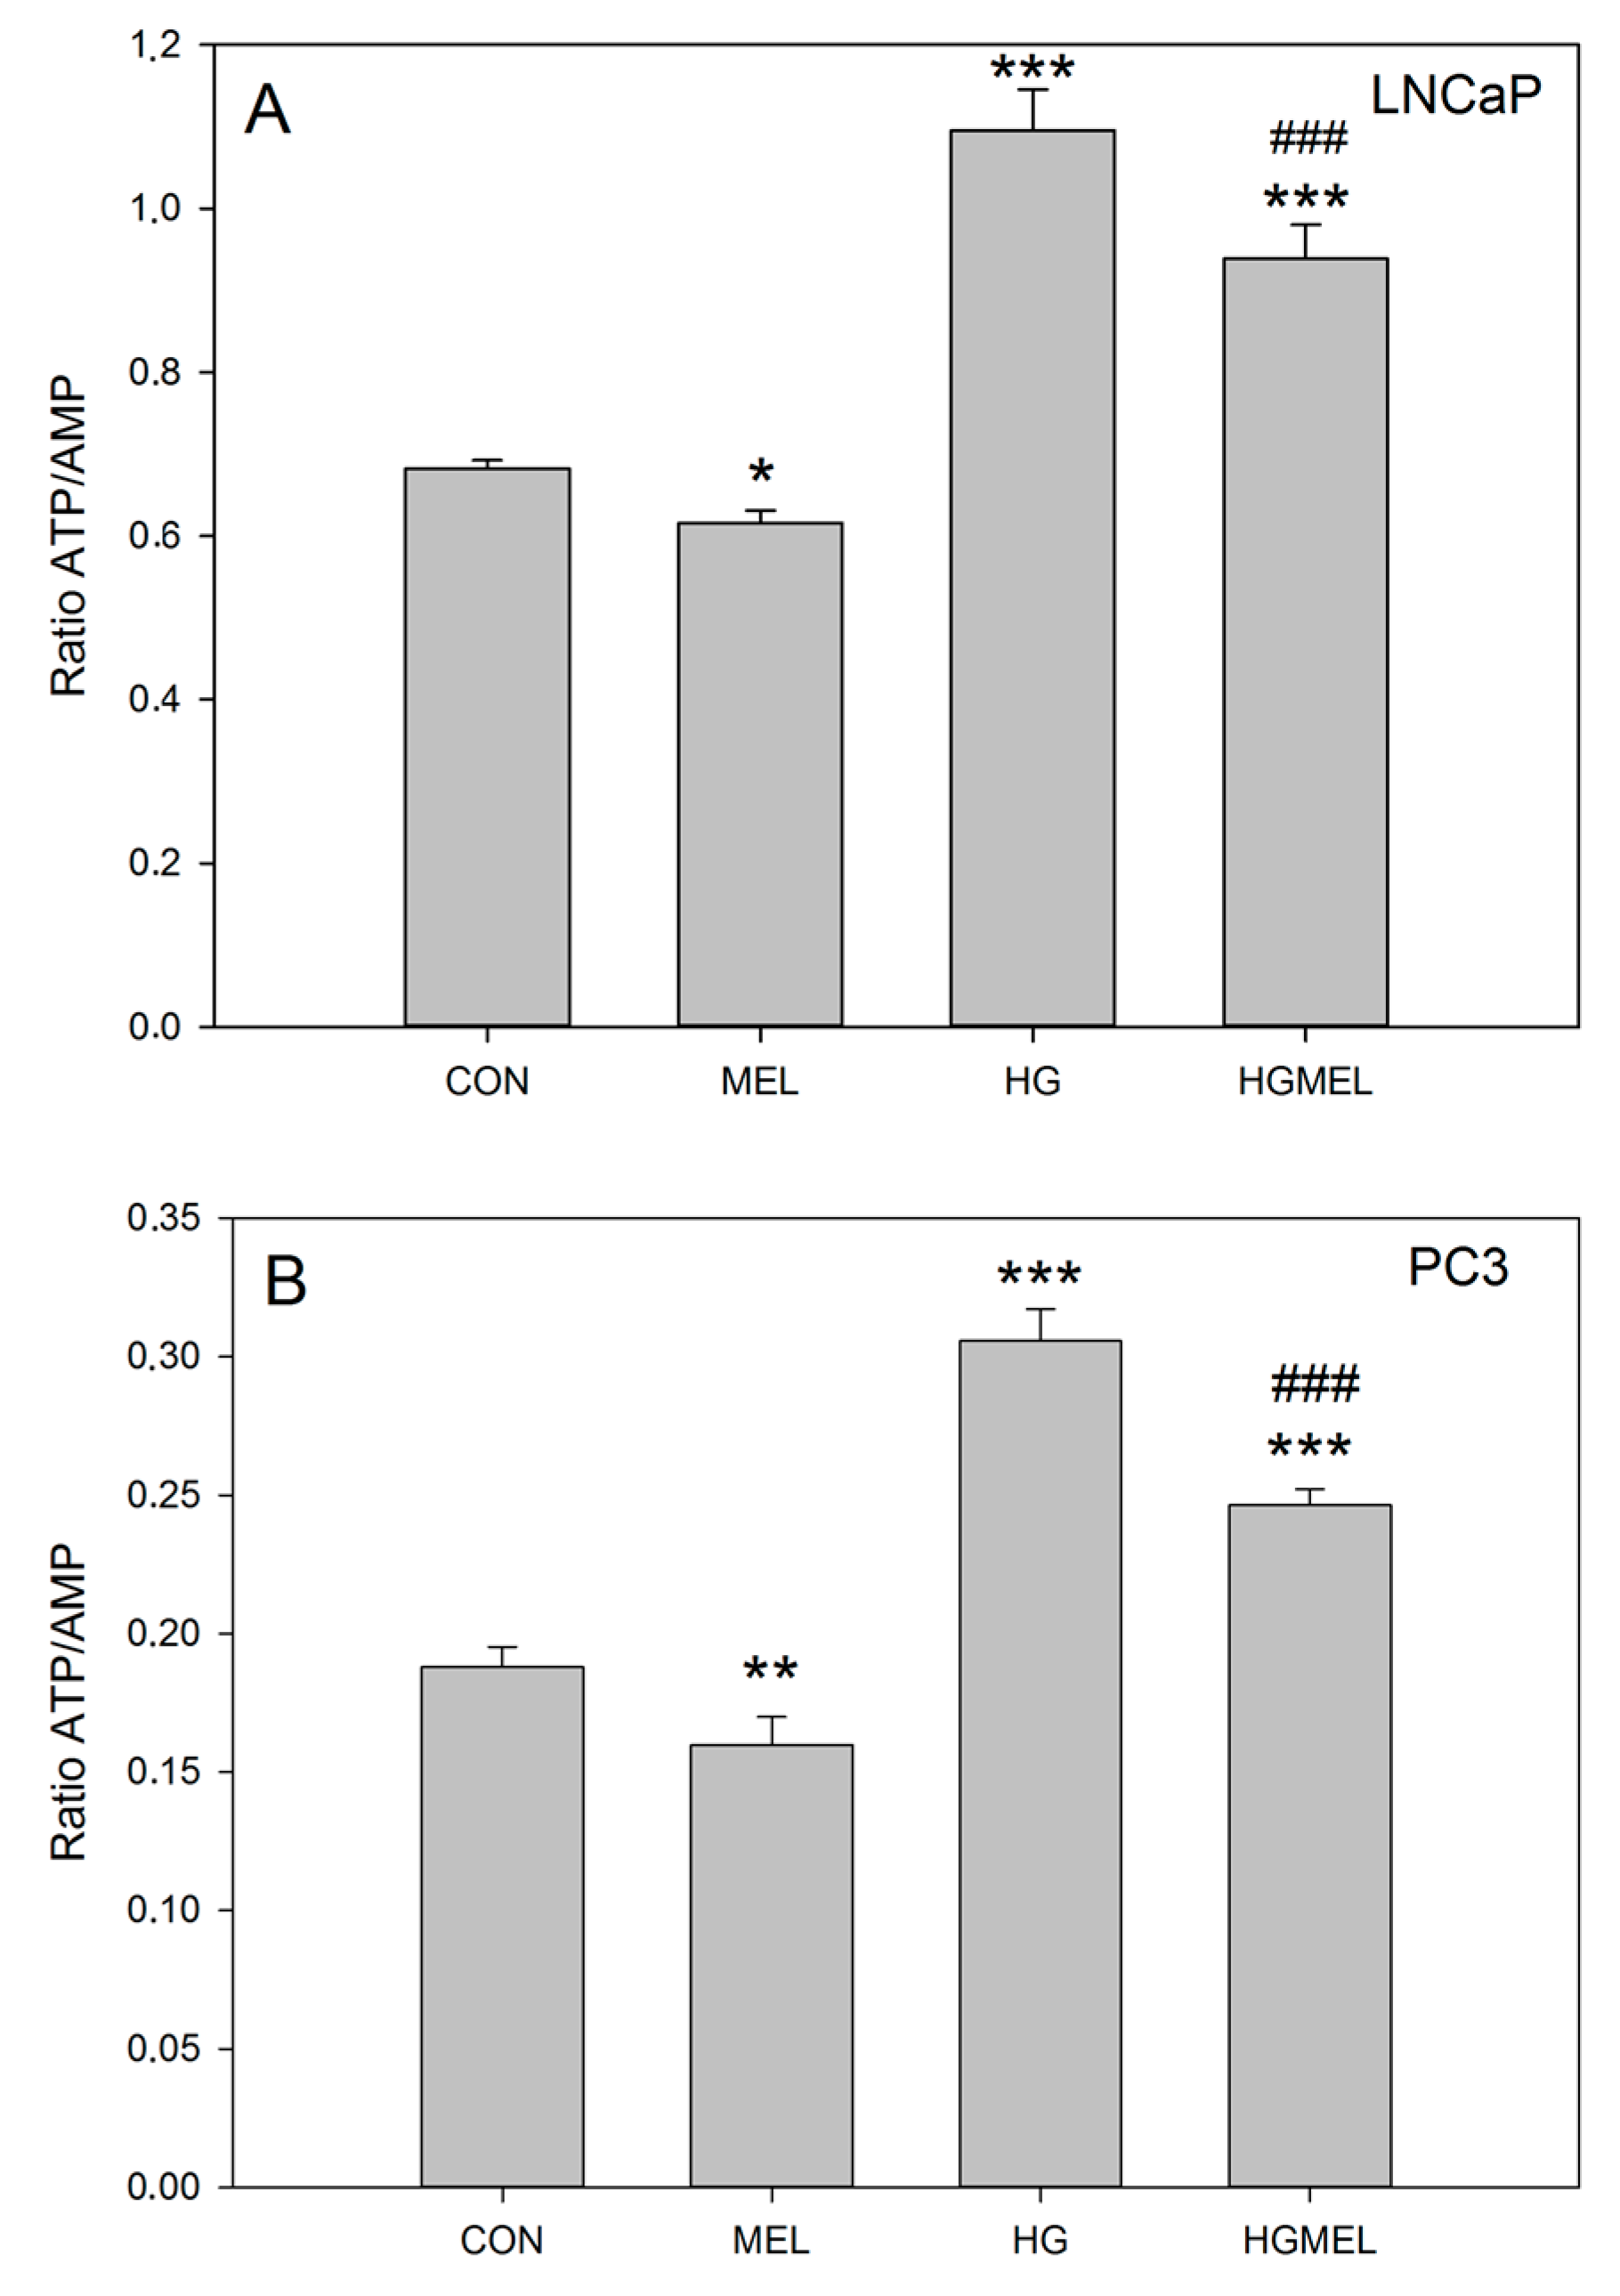
2.2. Melatonin Reduces ATP/AMP Ratio in Prostate Cancer Cells
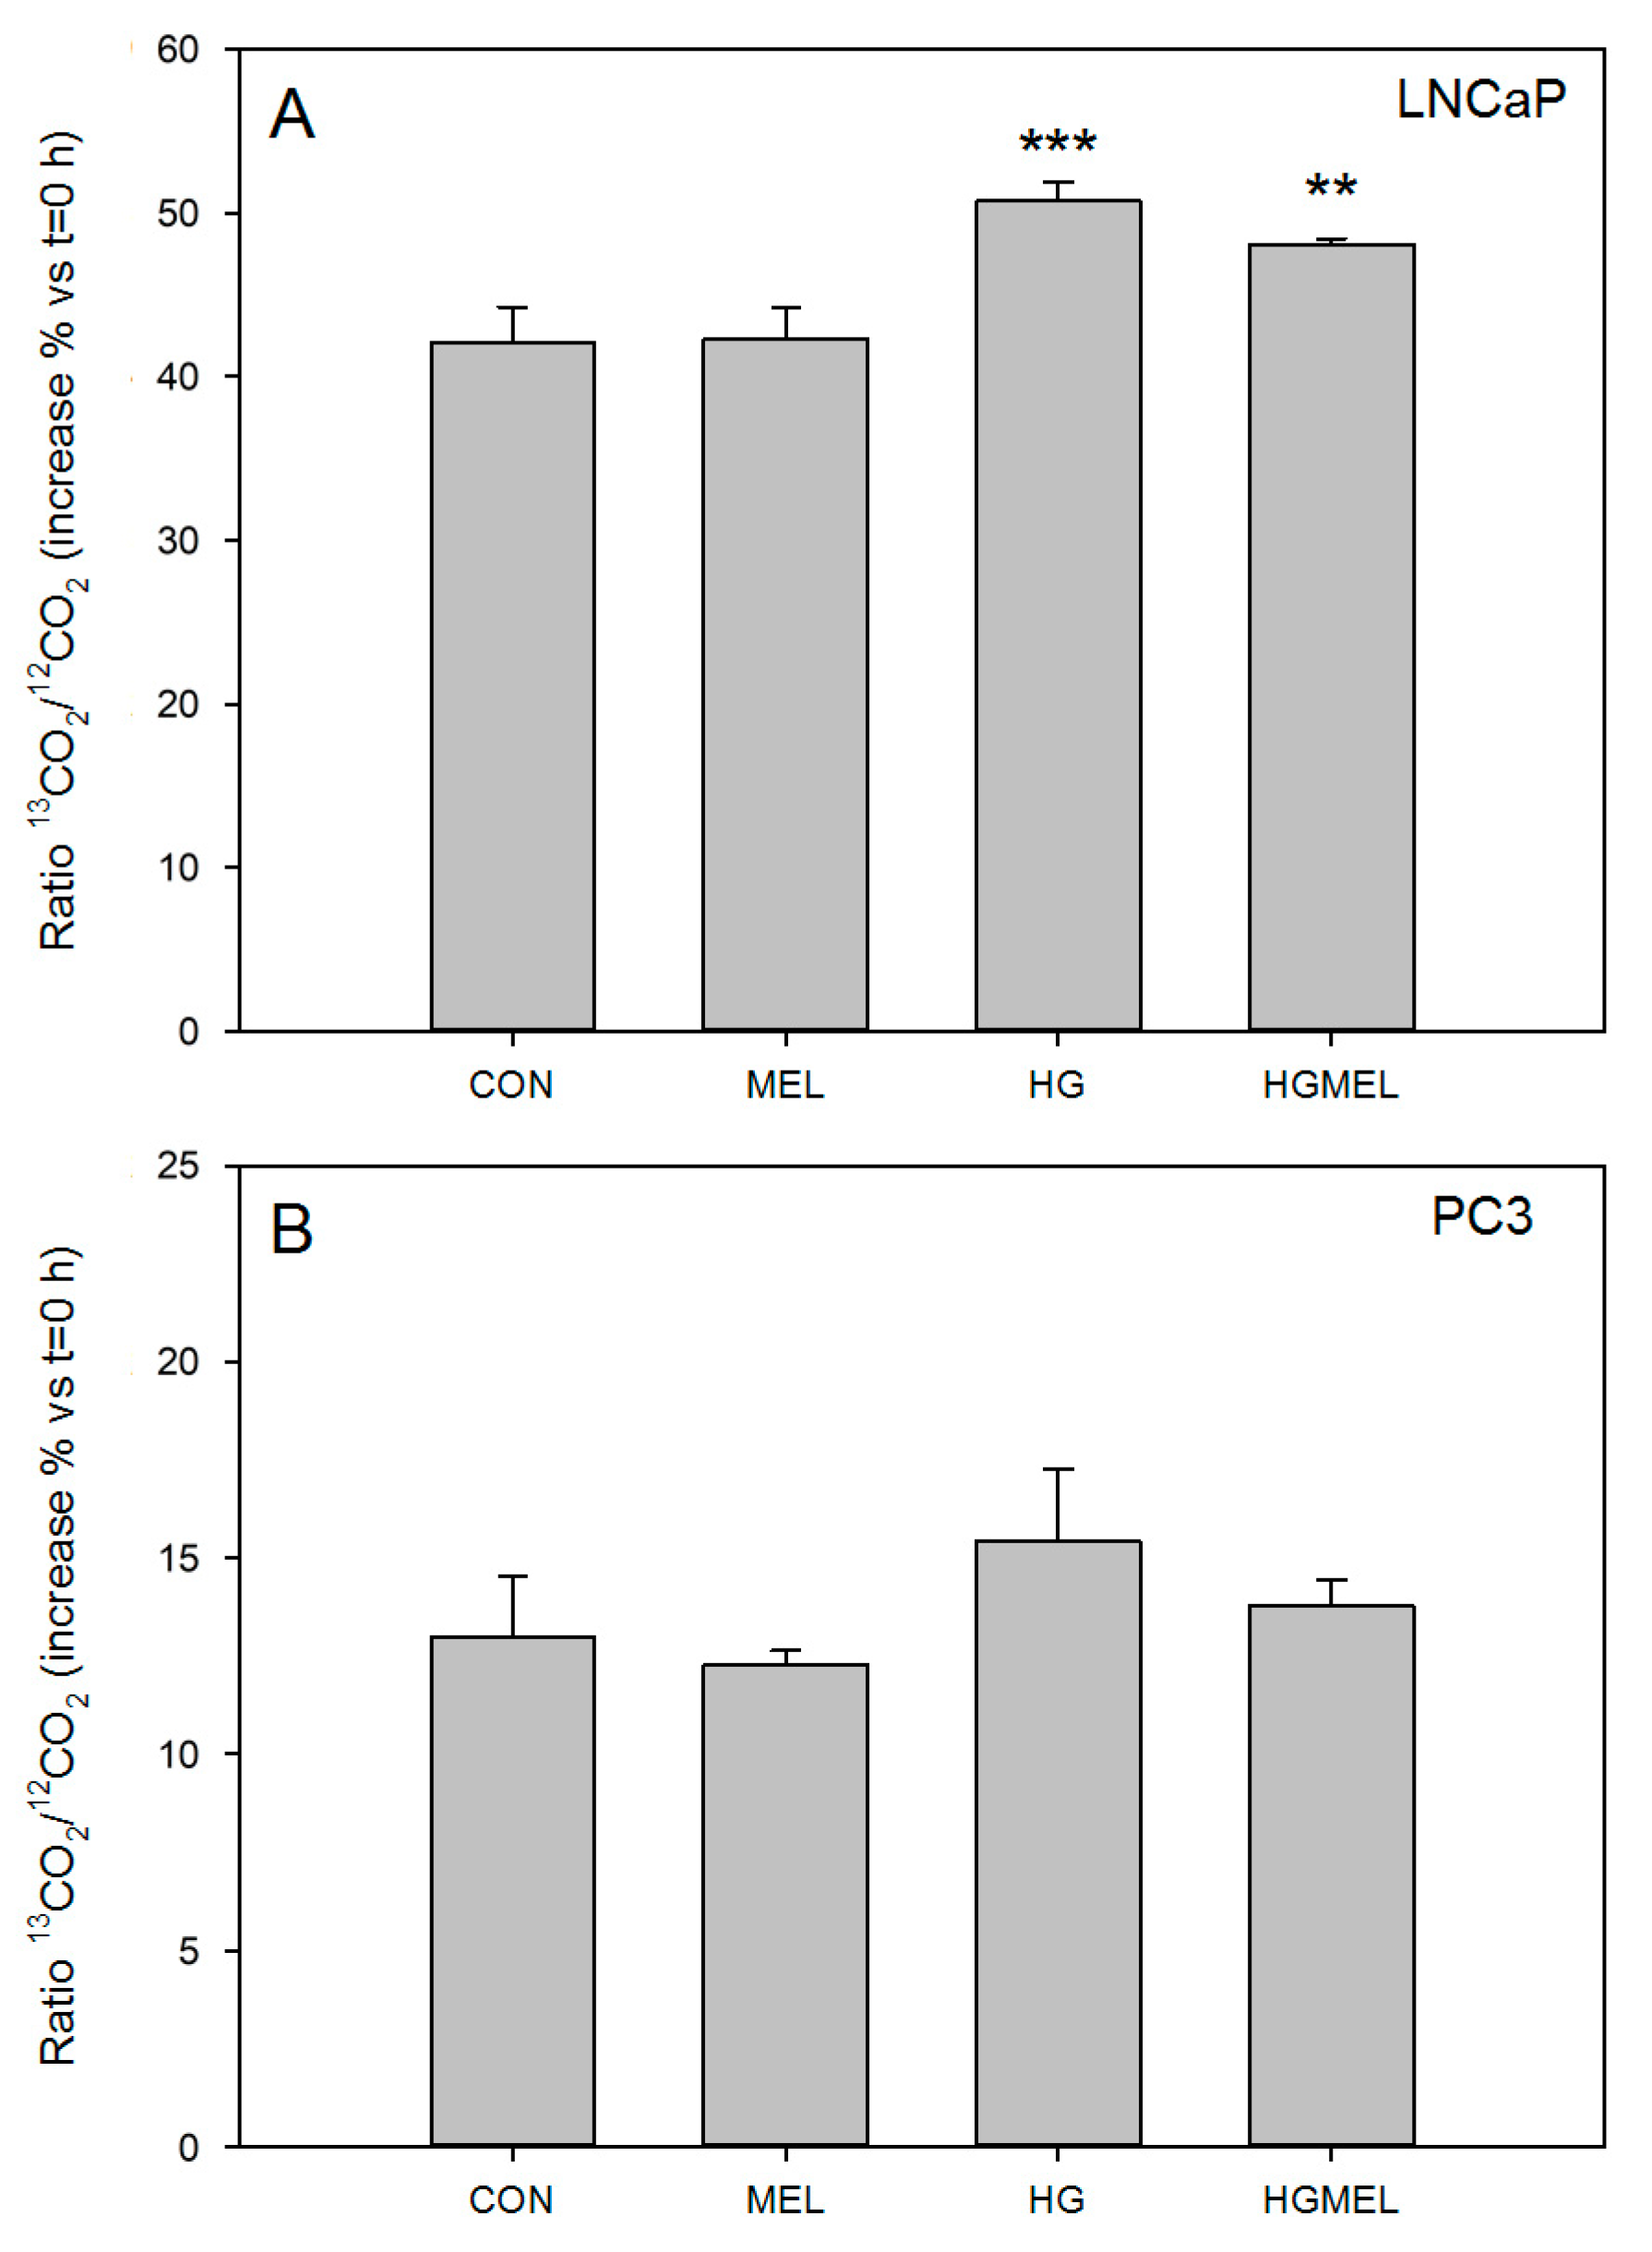
2.3. Increase Glucose Concentration Rise CO2 Released in Androgen Sensitive Prostate Cancer Cells
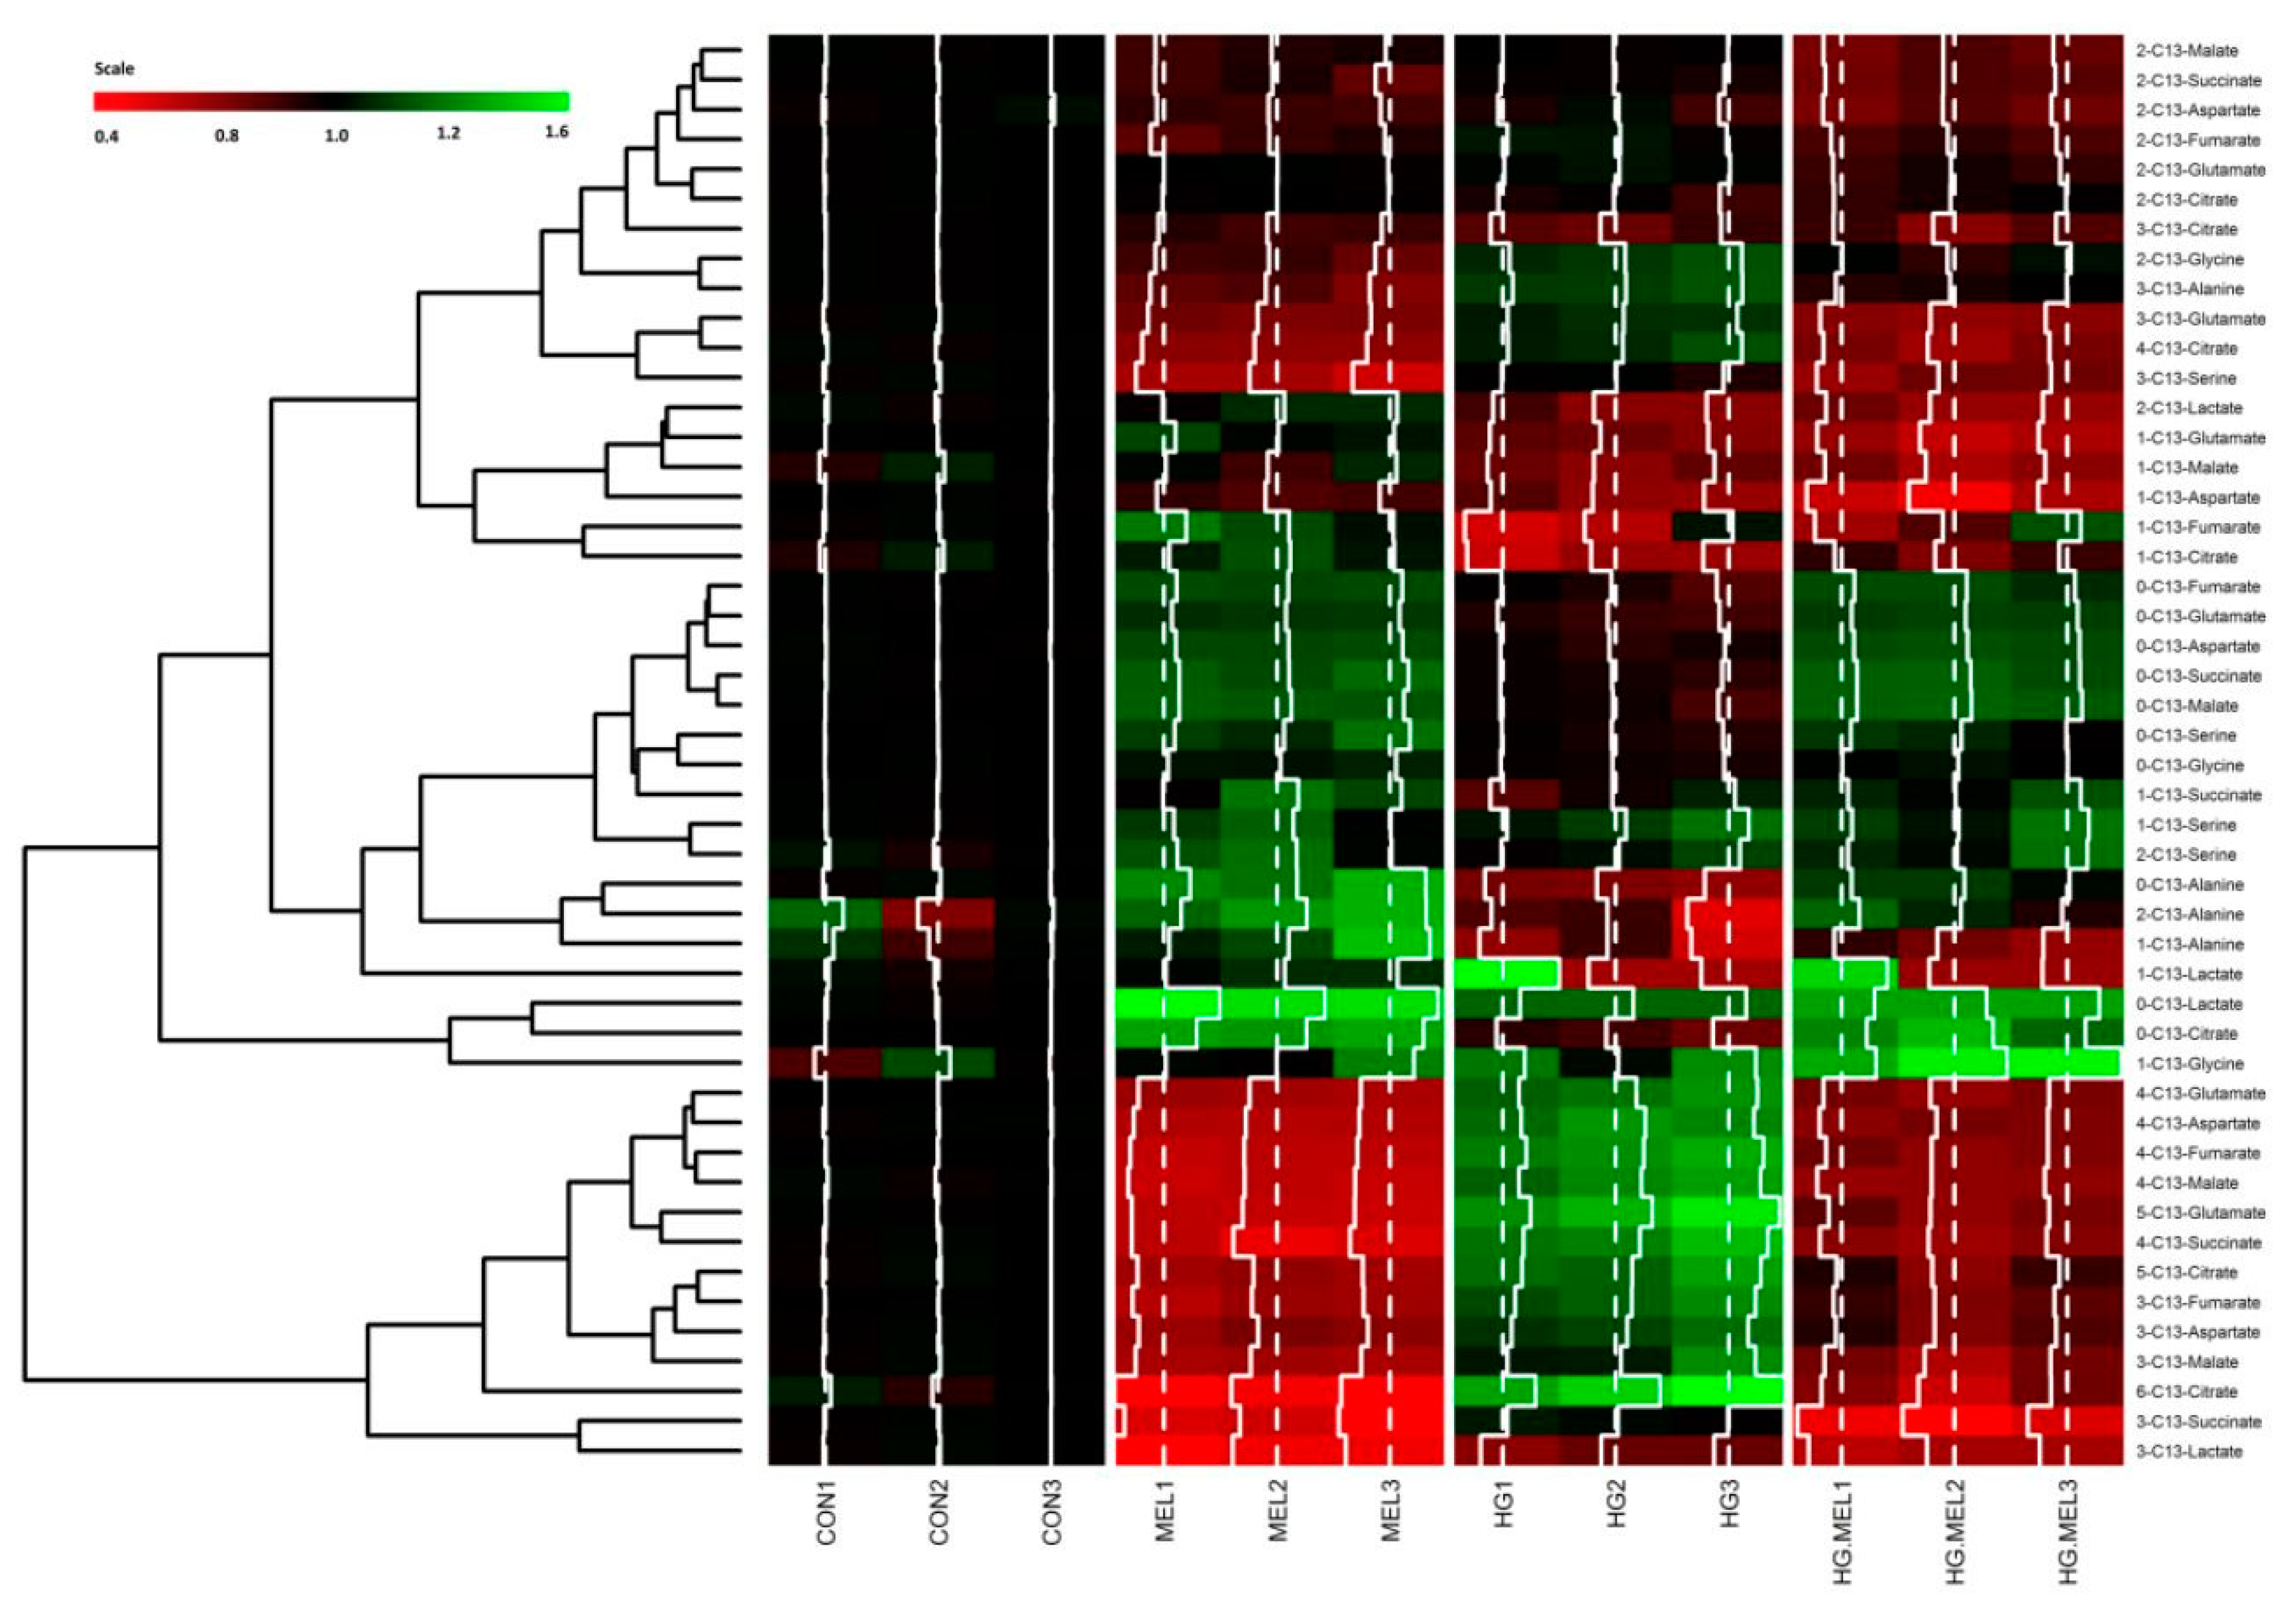
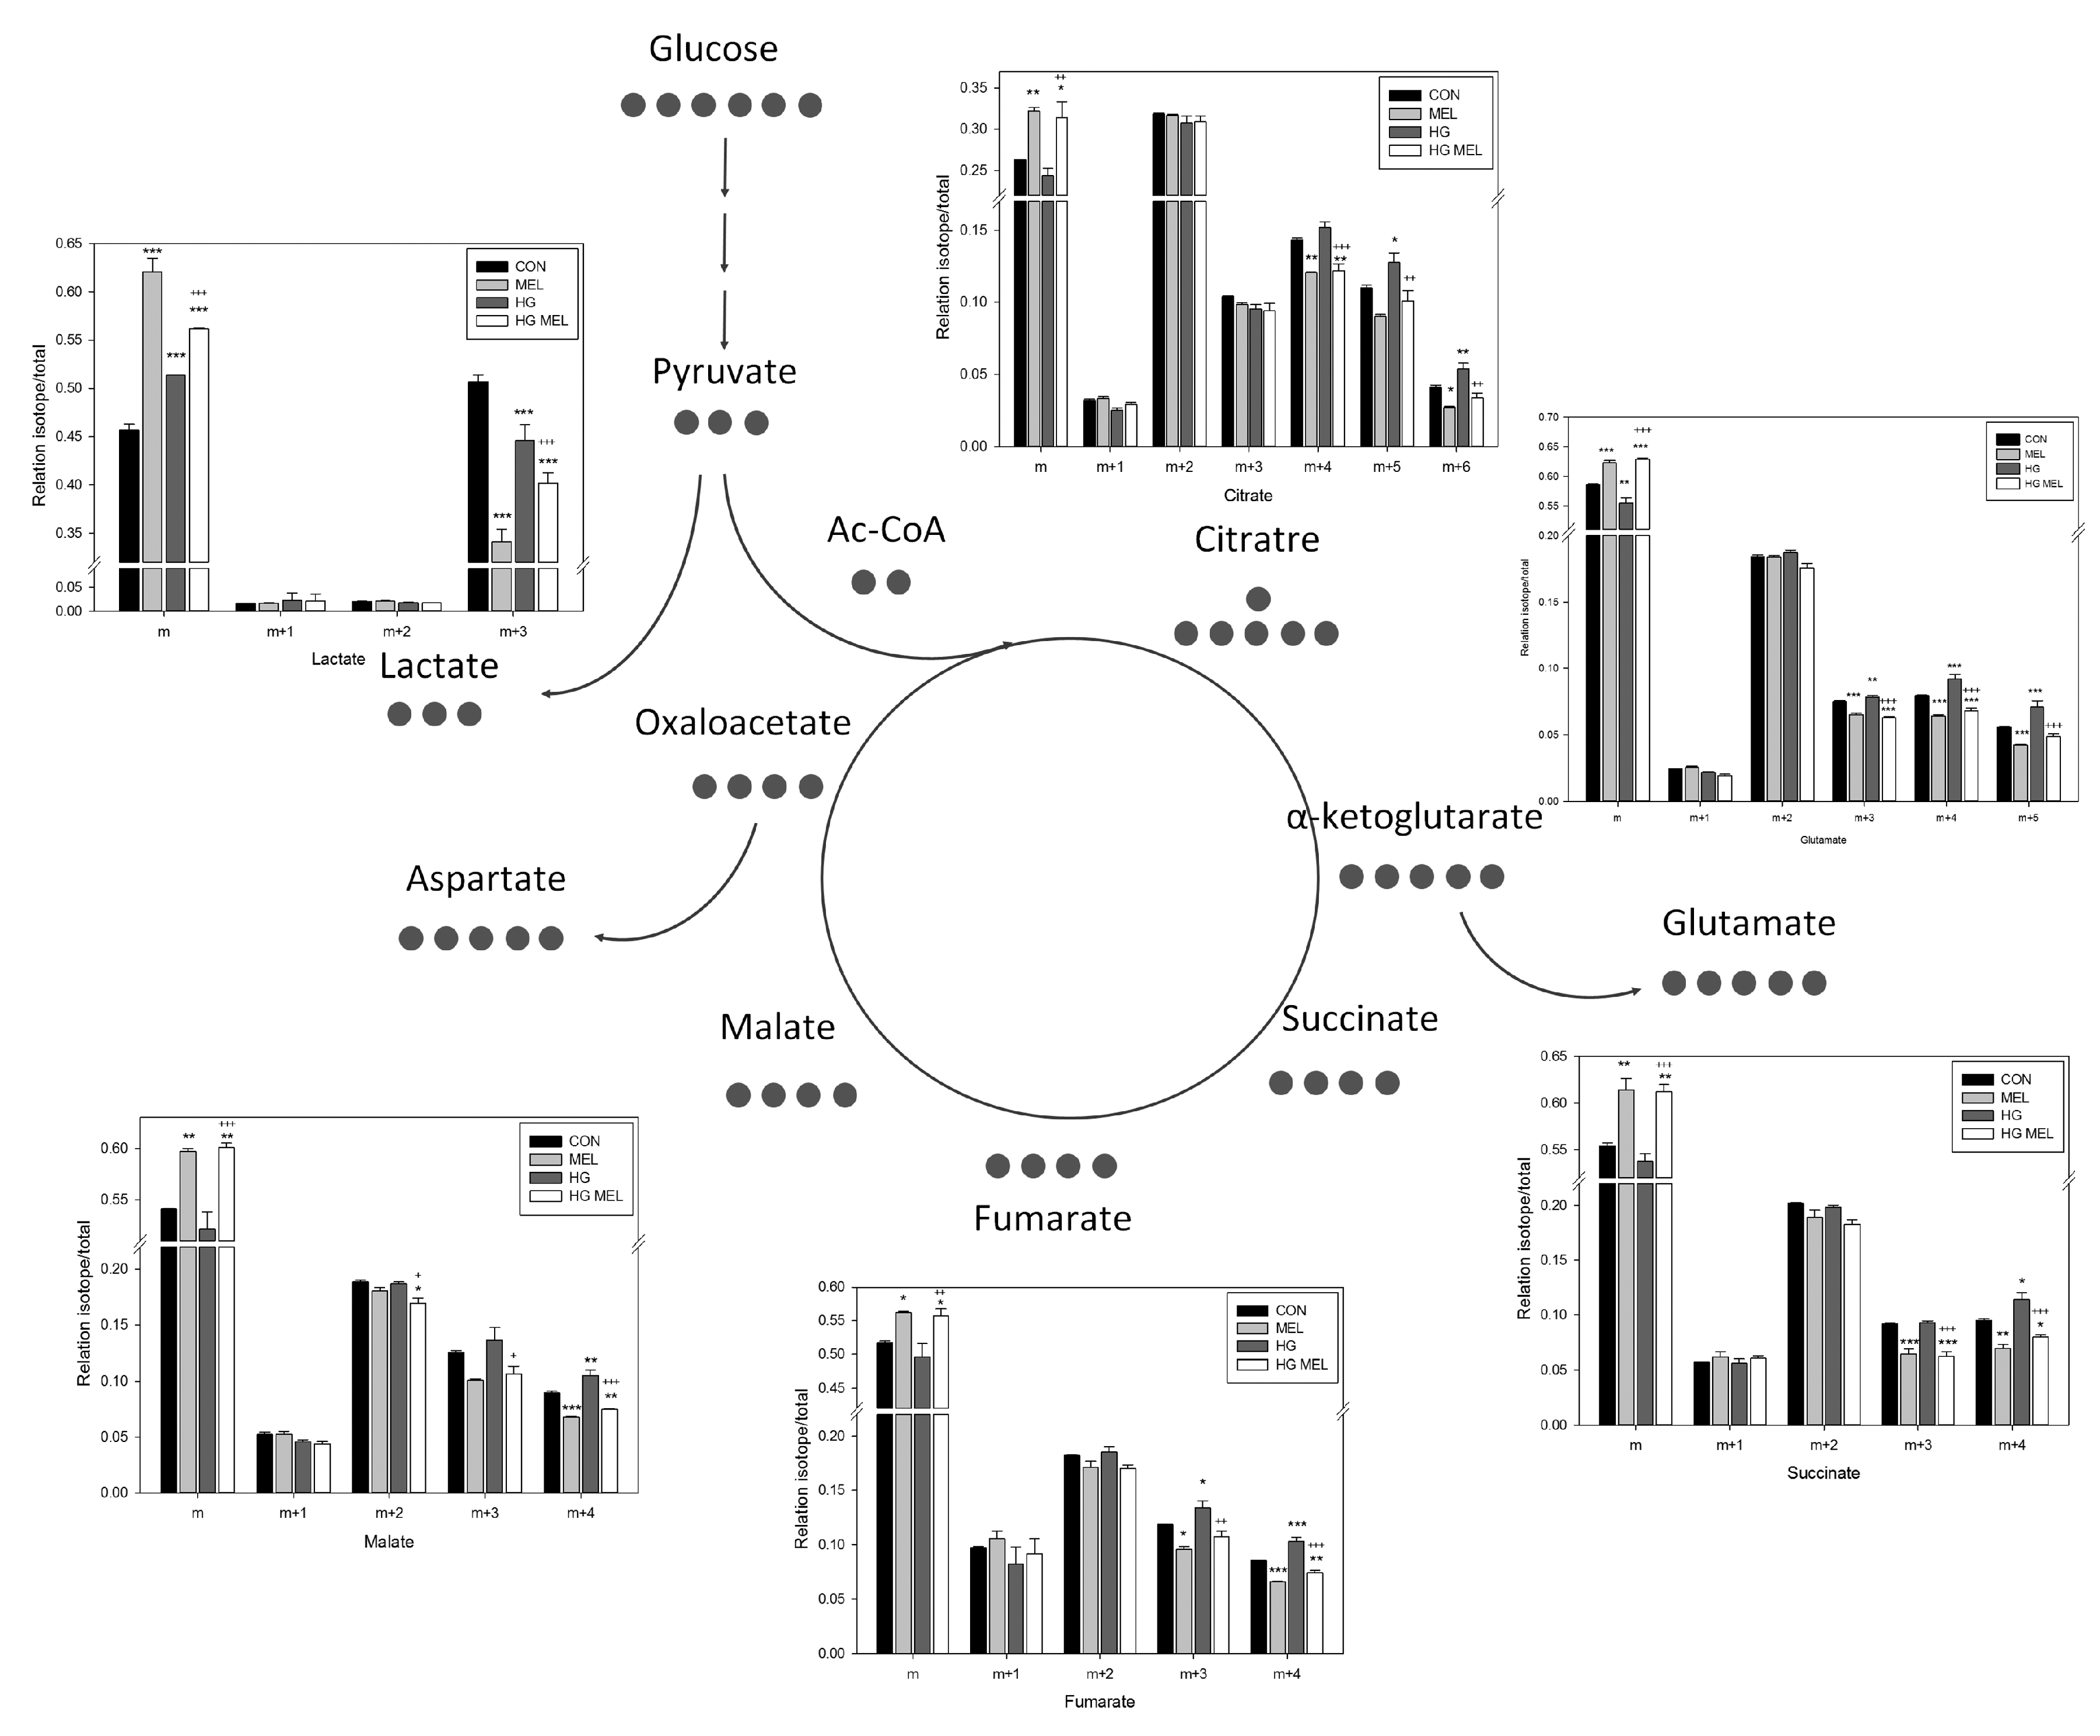
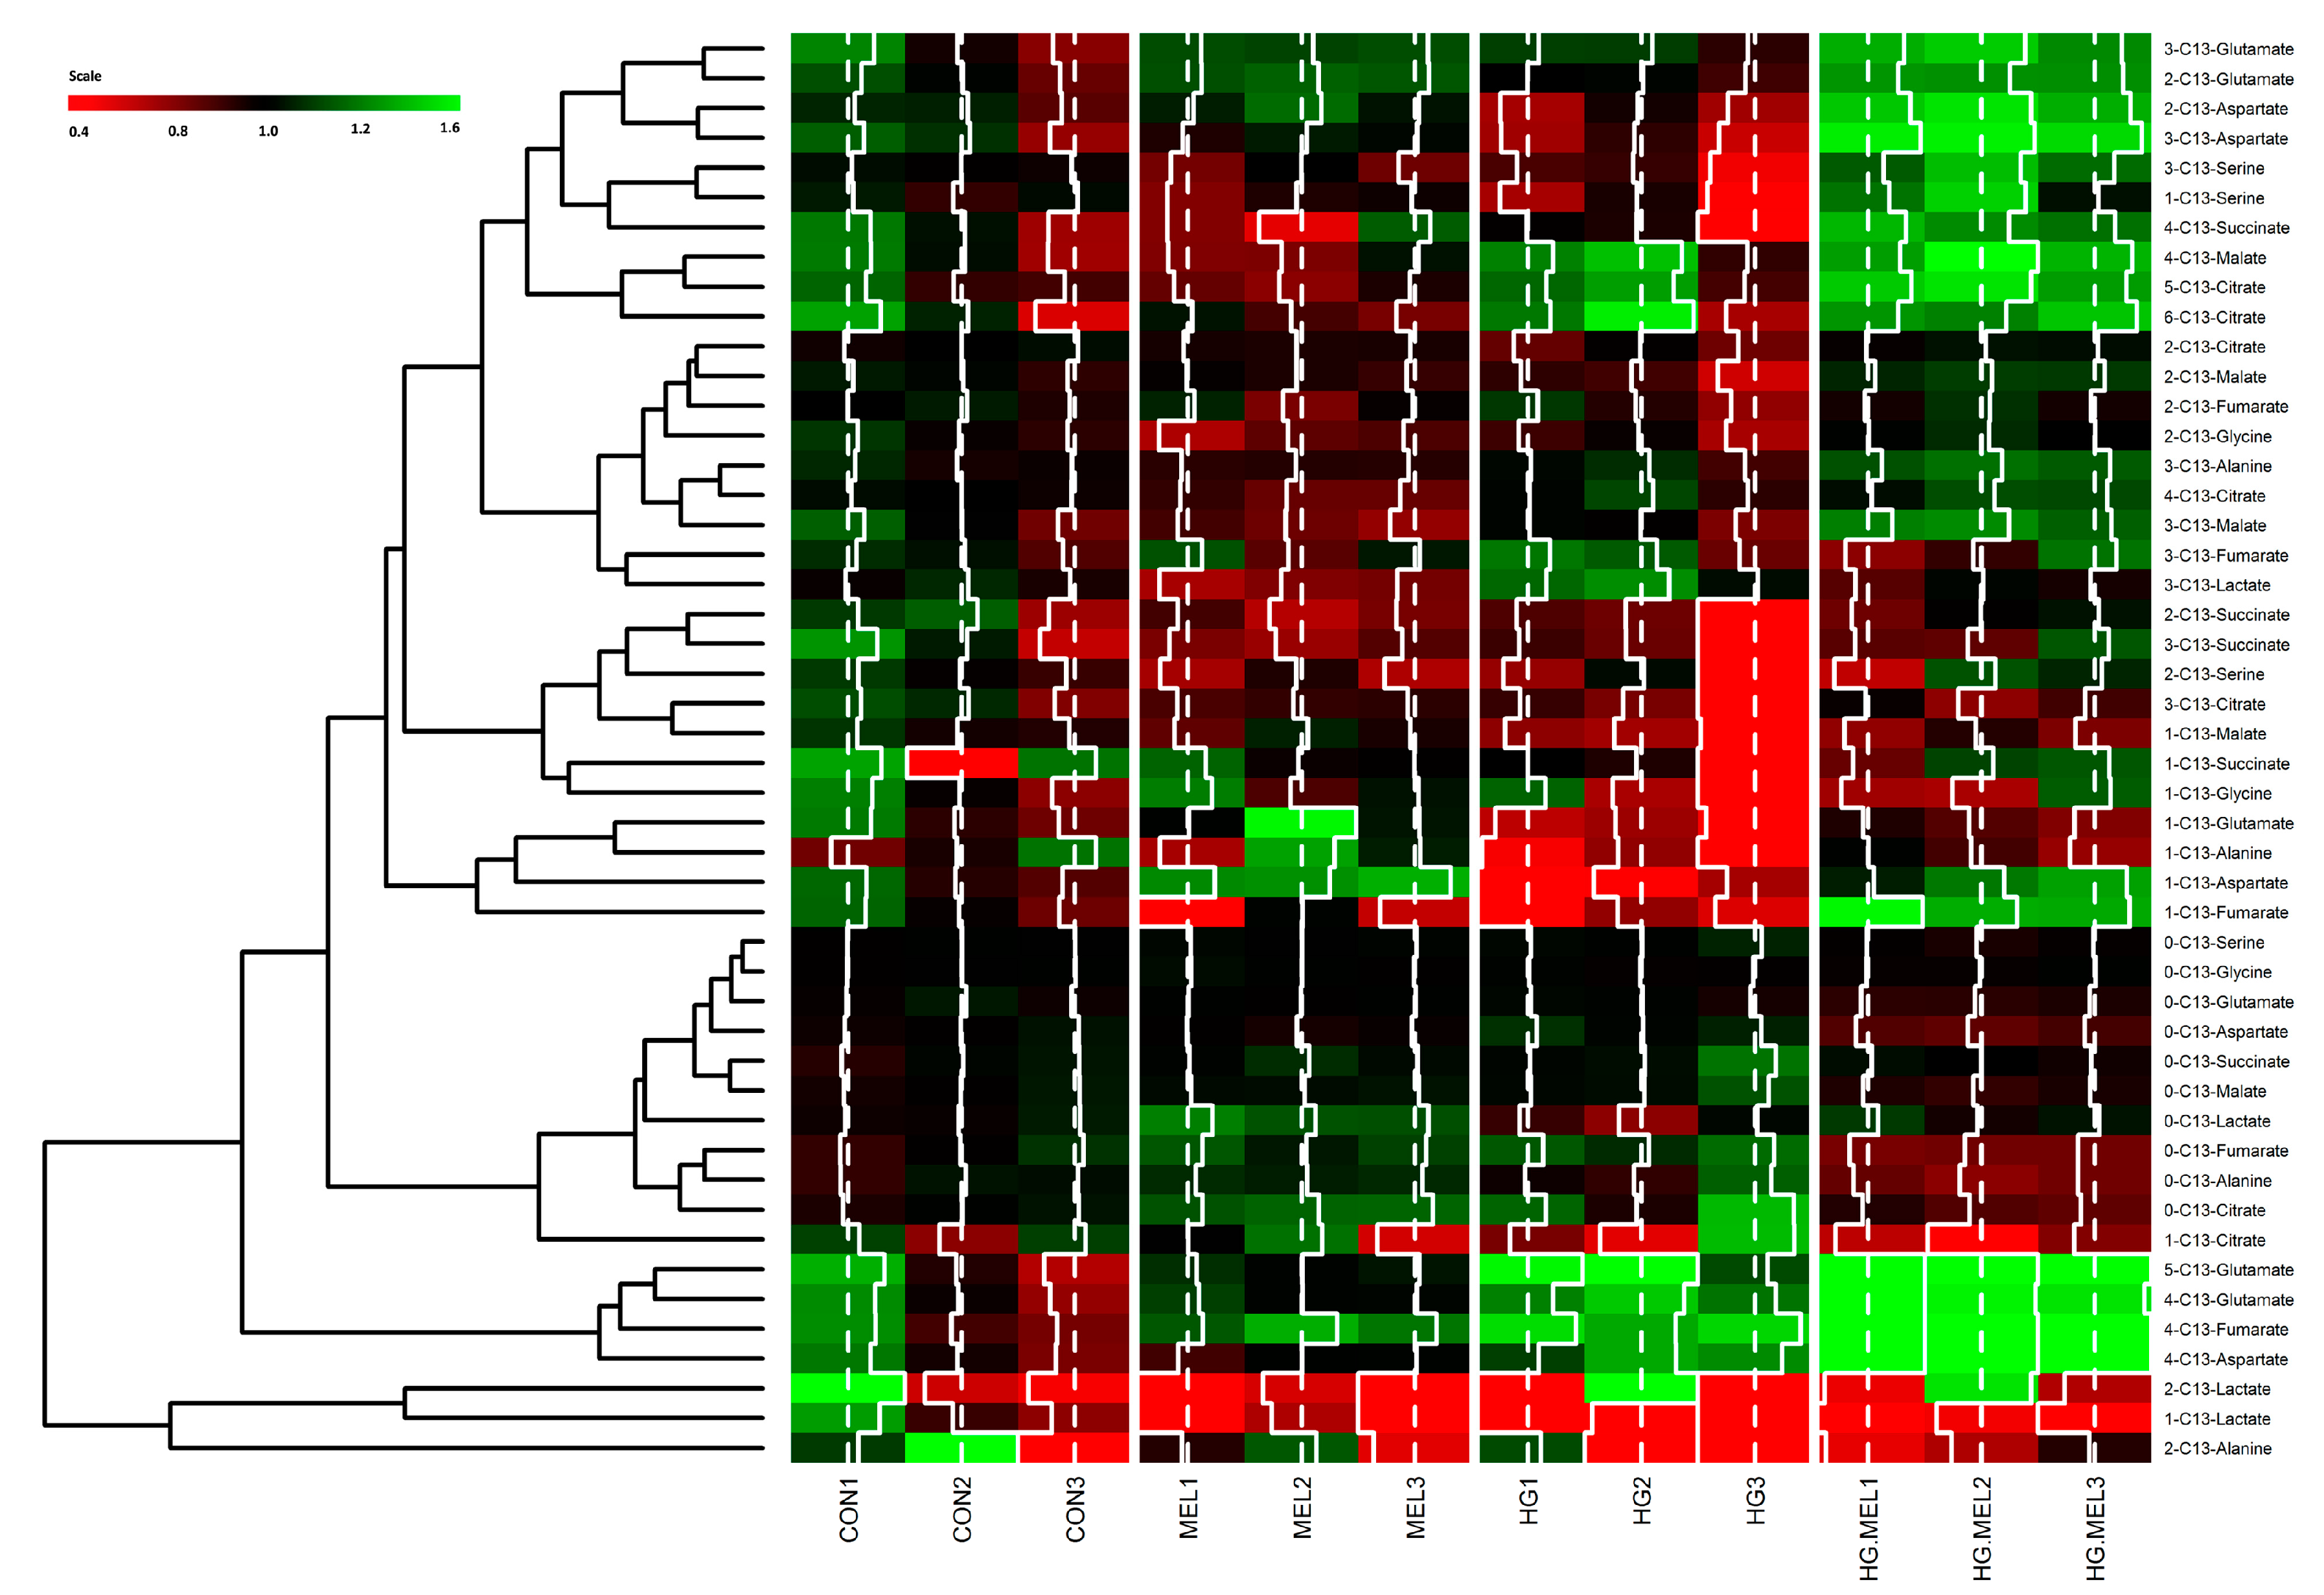
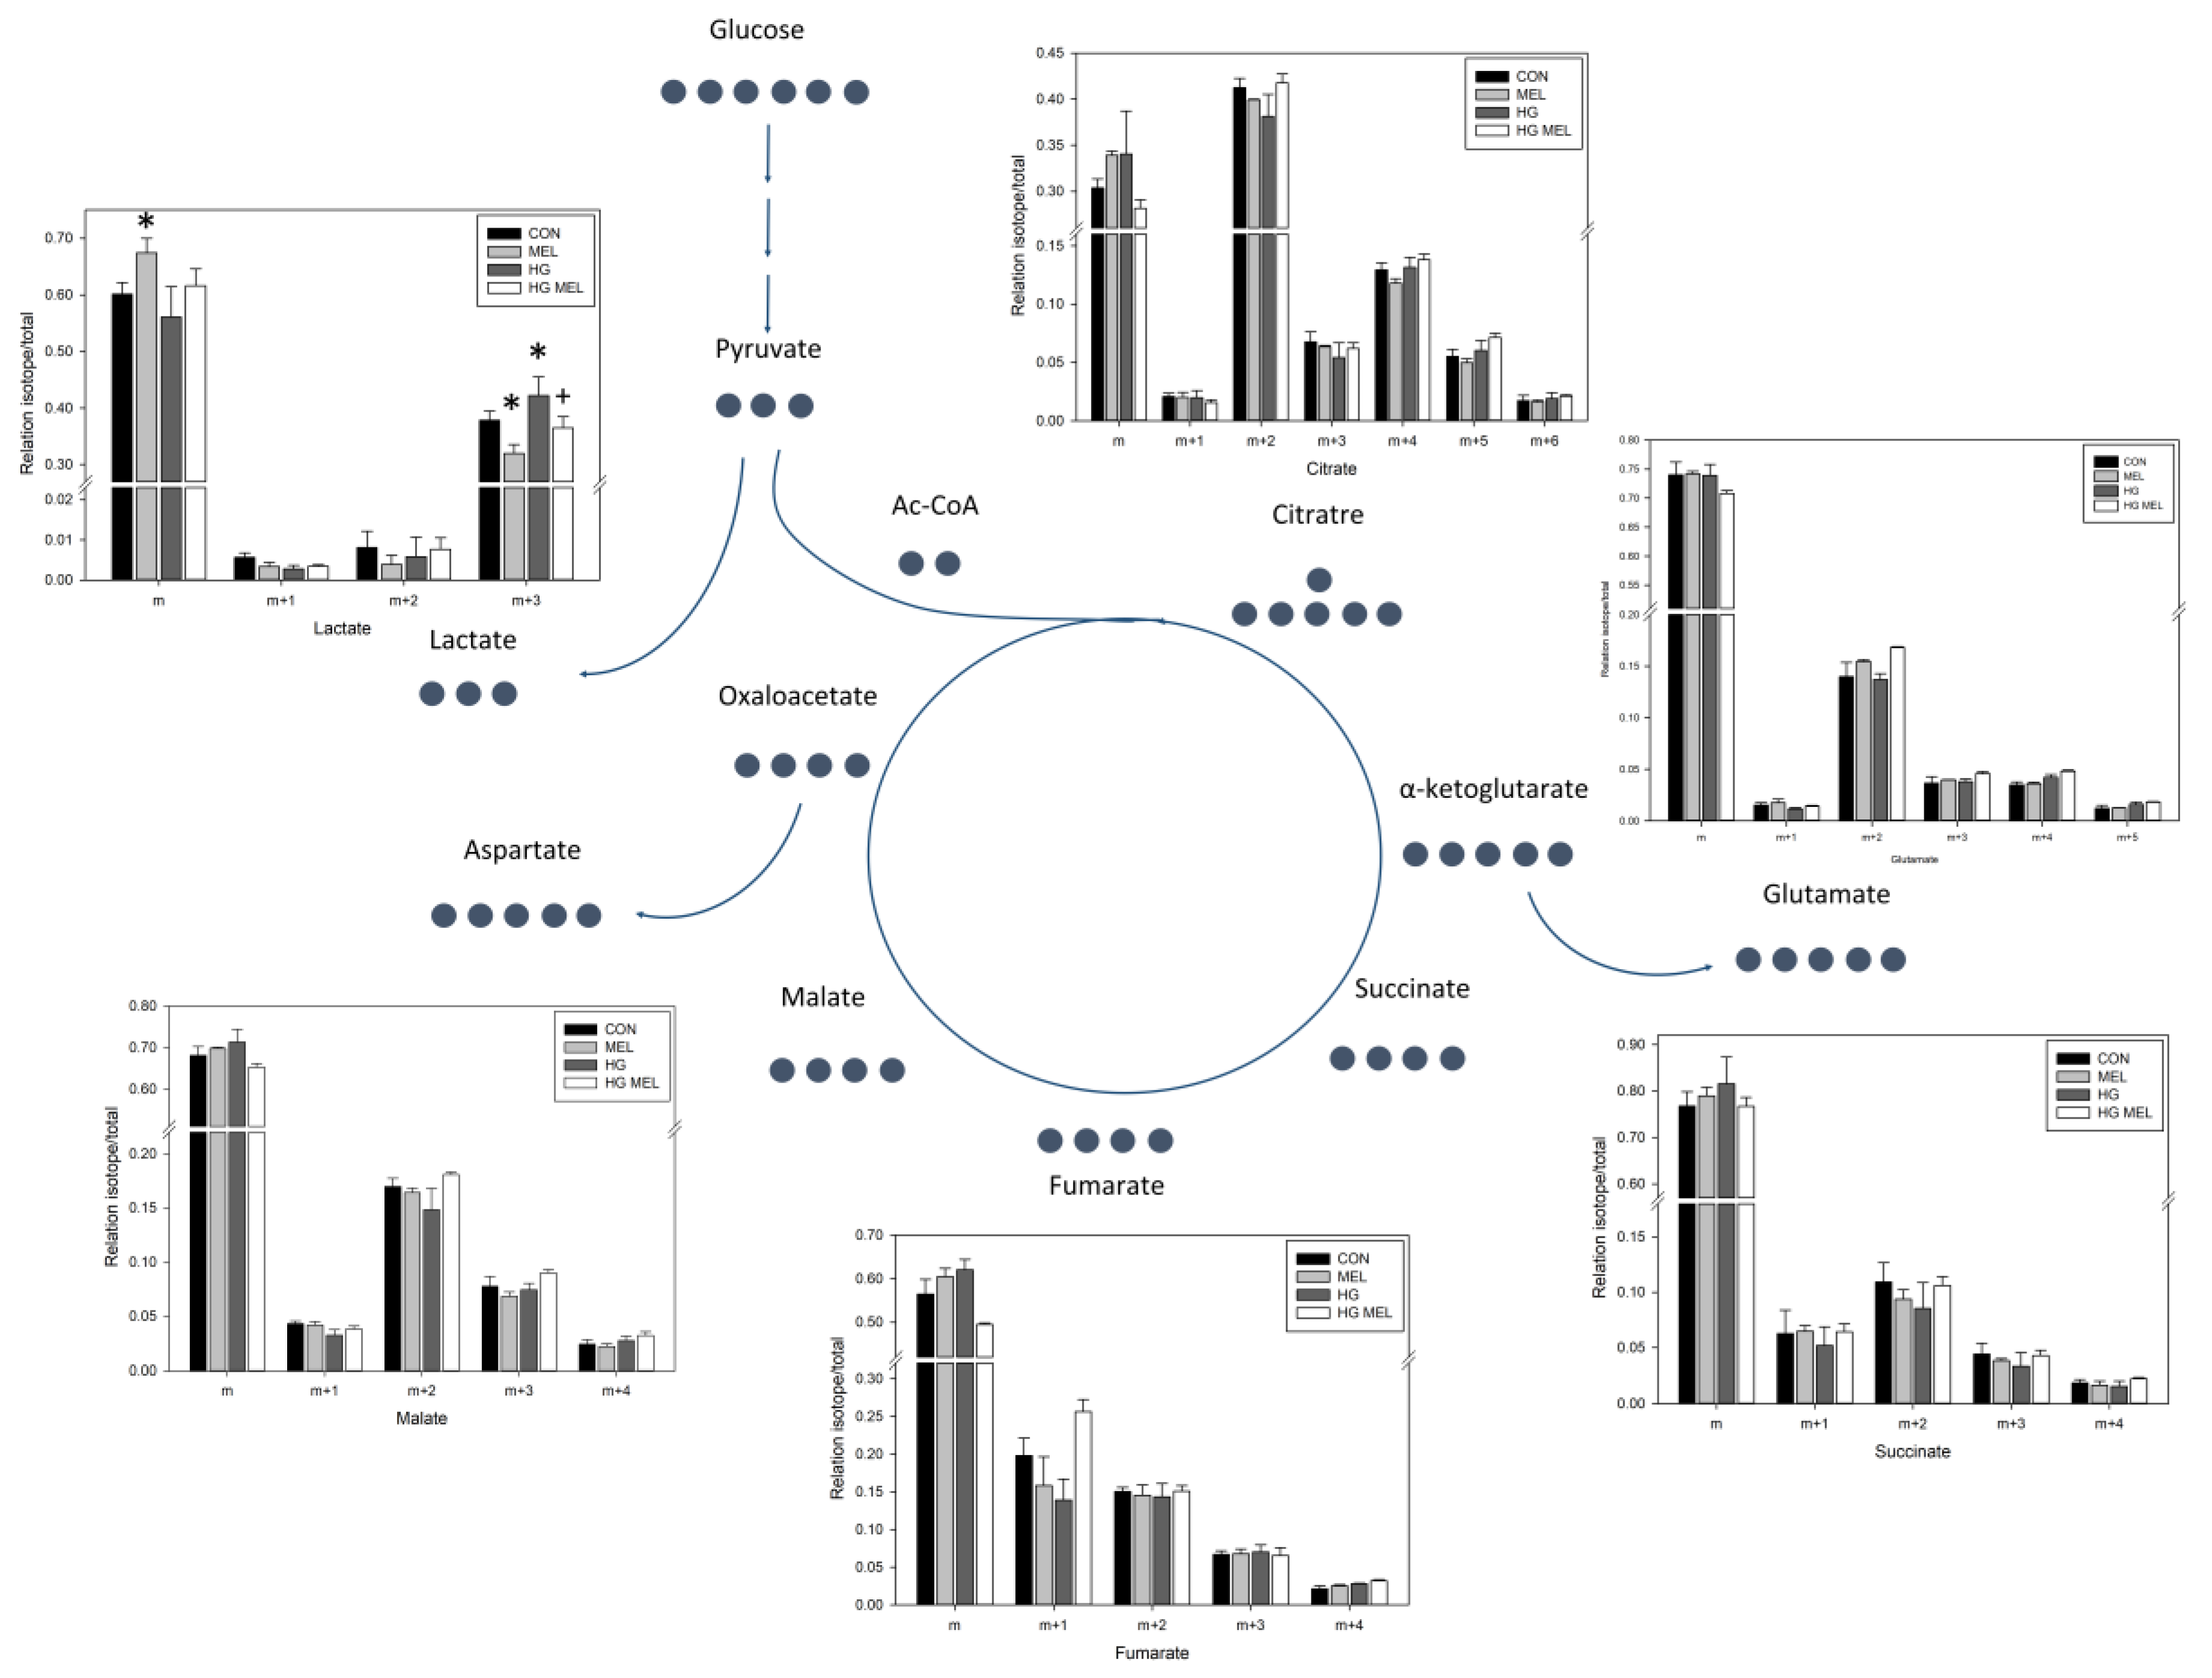
2.4. Melatonin Decreases the Tricarboxylic Acid Cycle (TCA) in Androgen Dependent Prostate Cancer Cells and 13C-Lactate Labeling in Both Cell Types
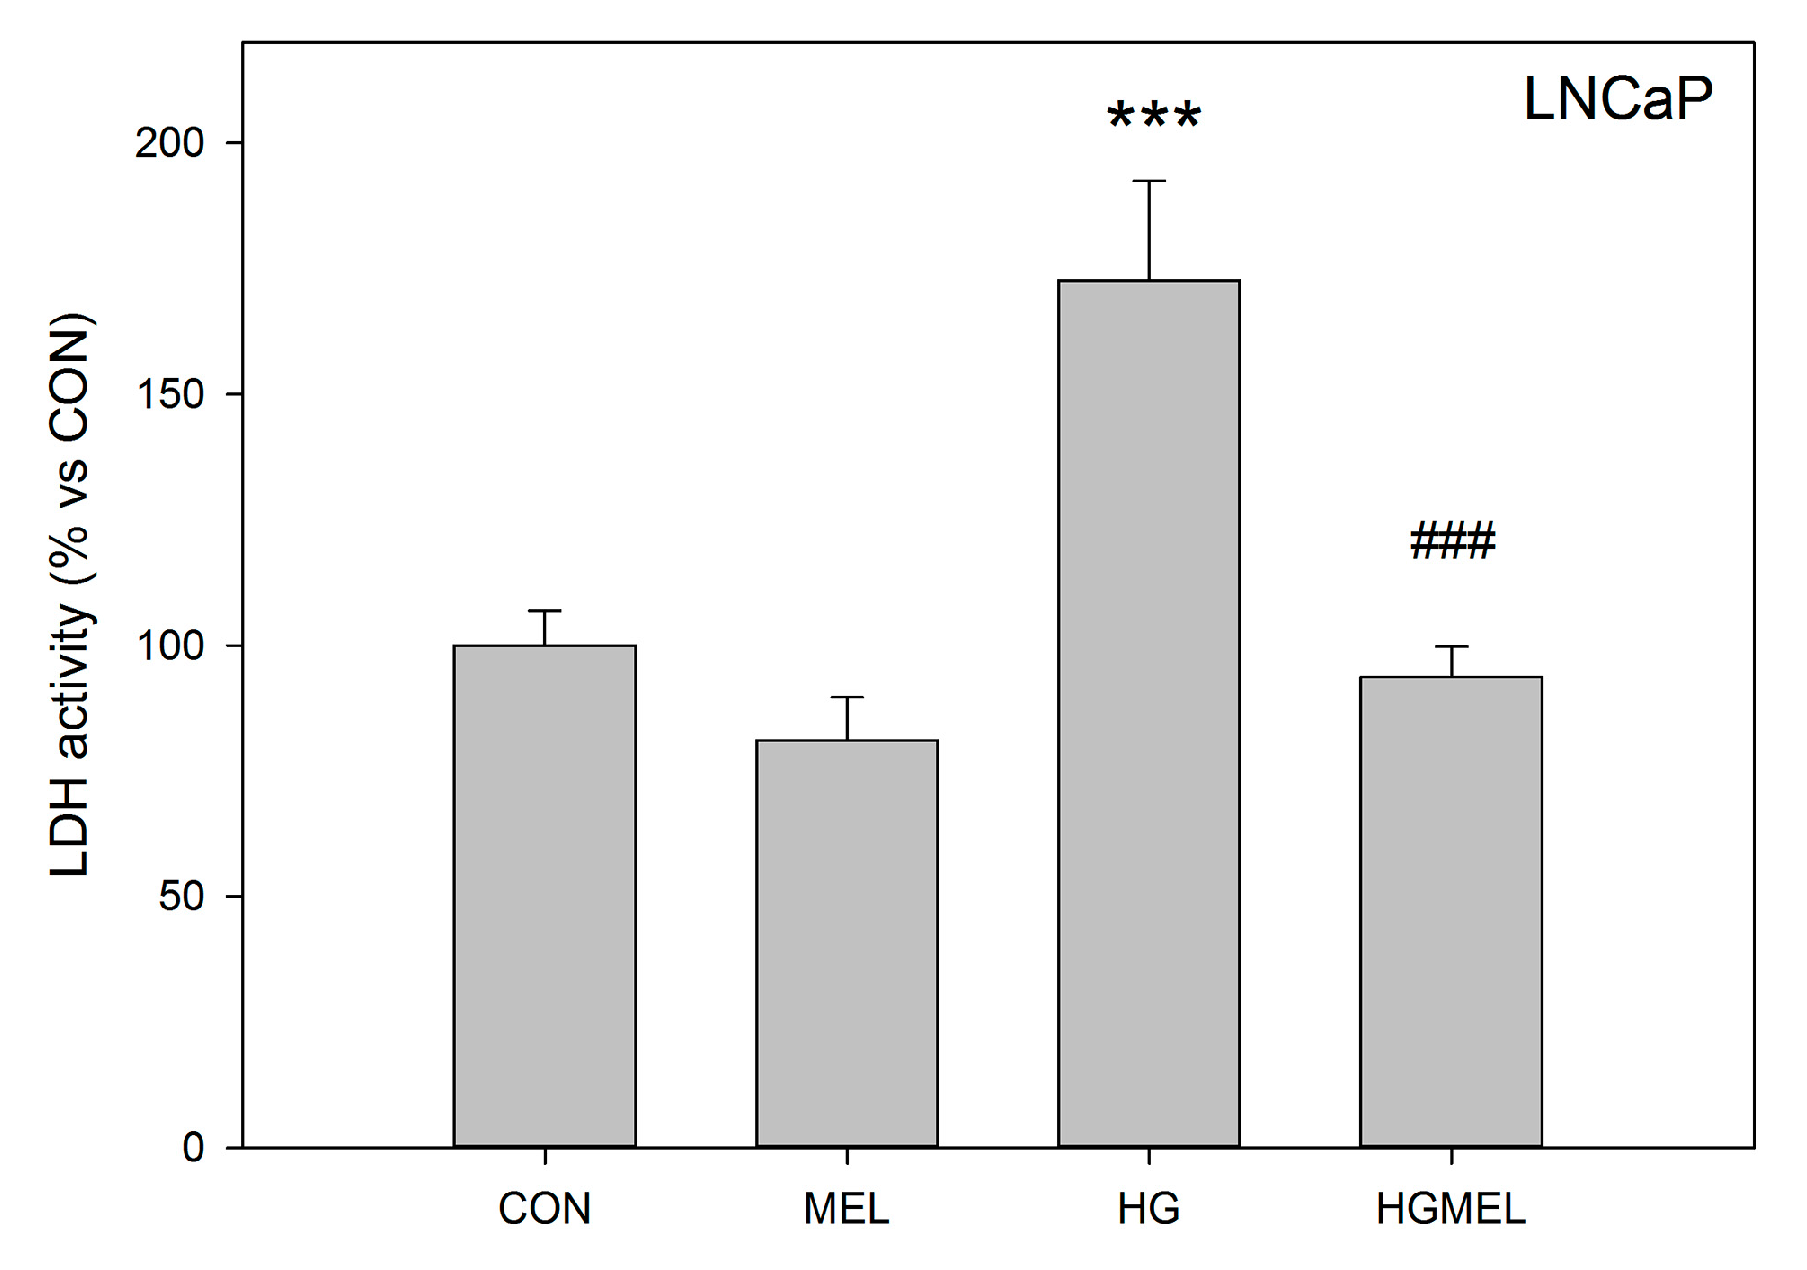
2.5. Melatonin Decreases LDH Activity
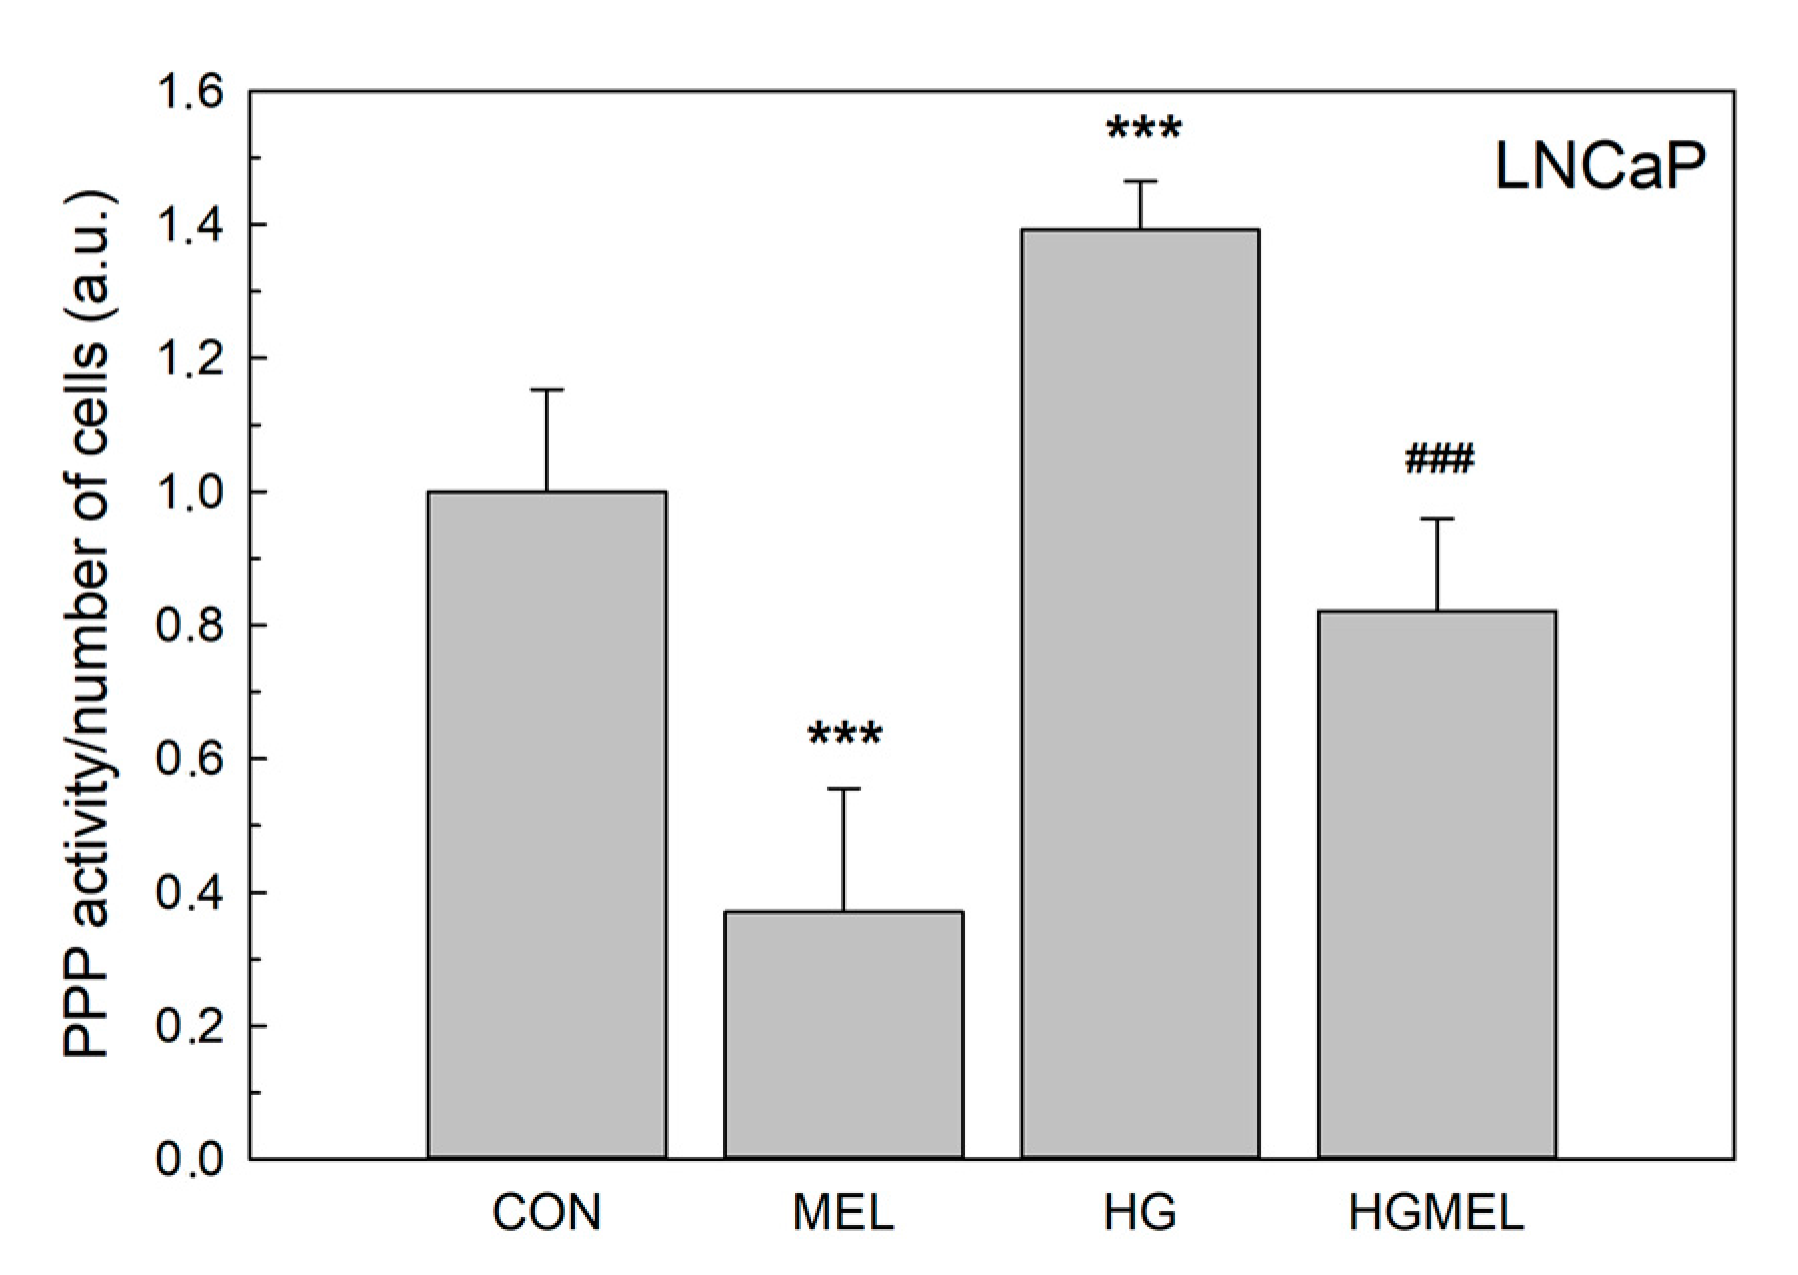
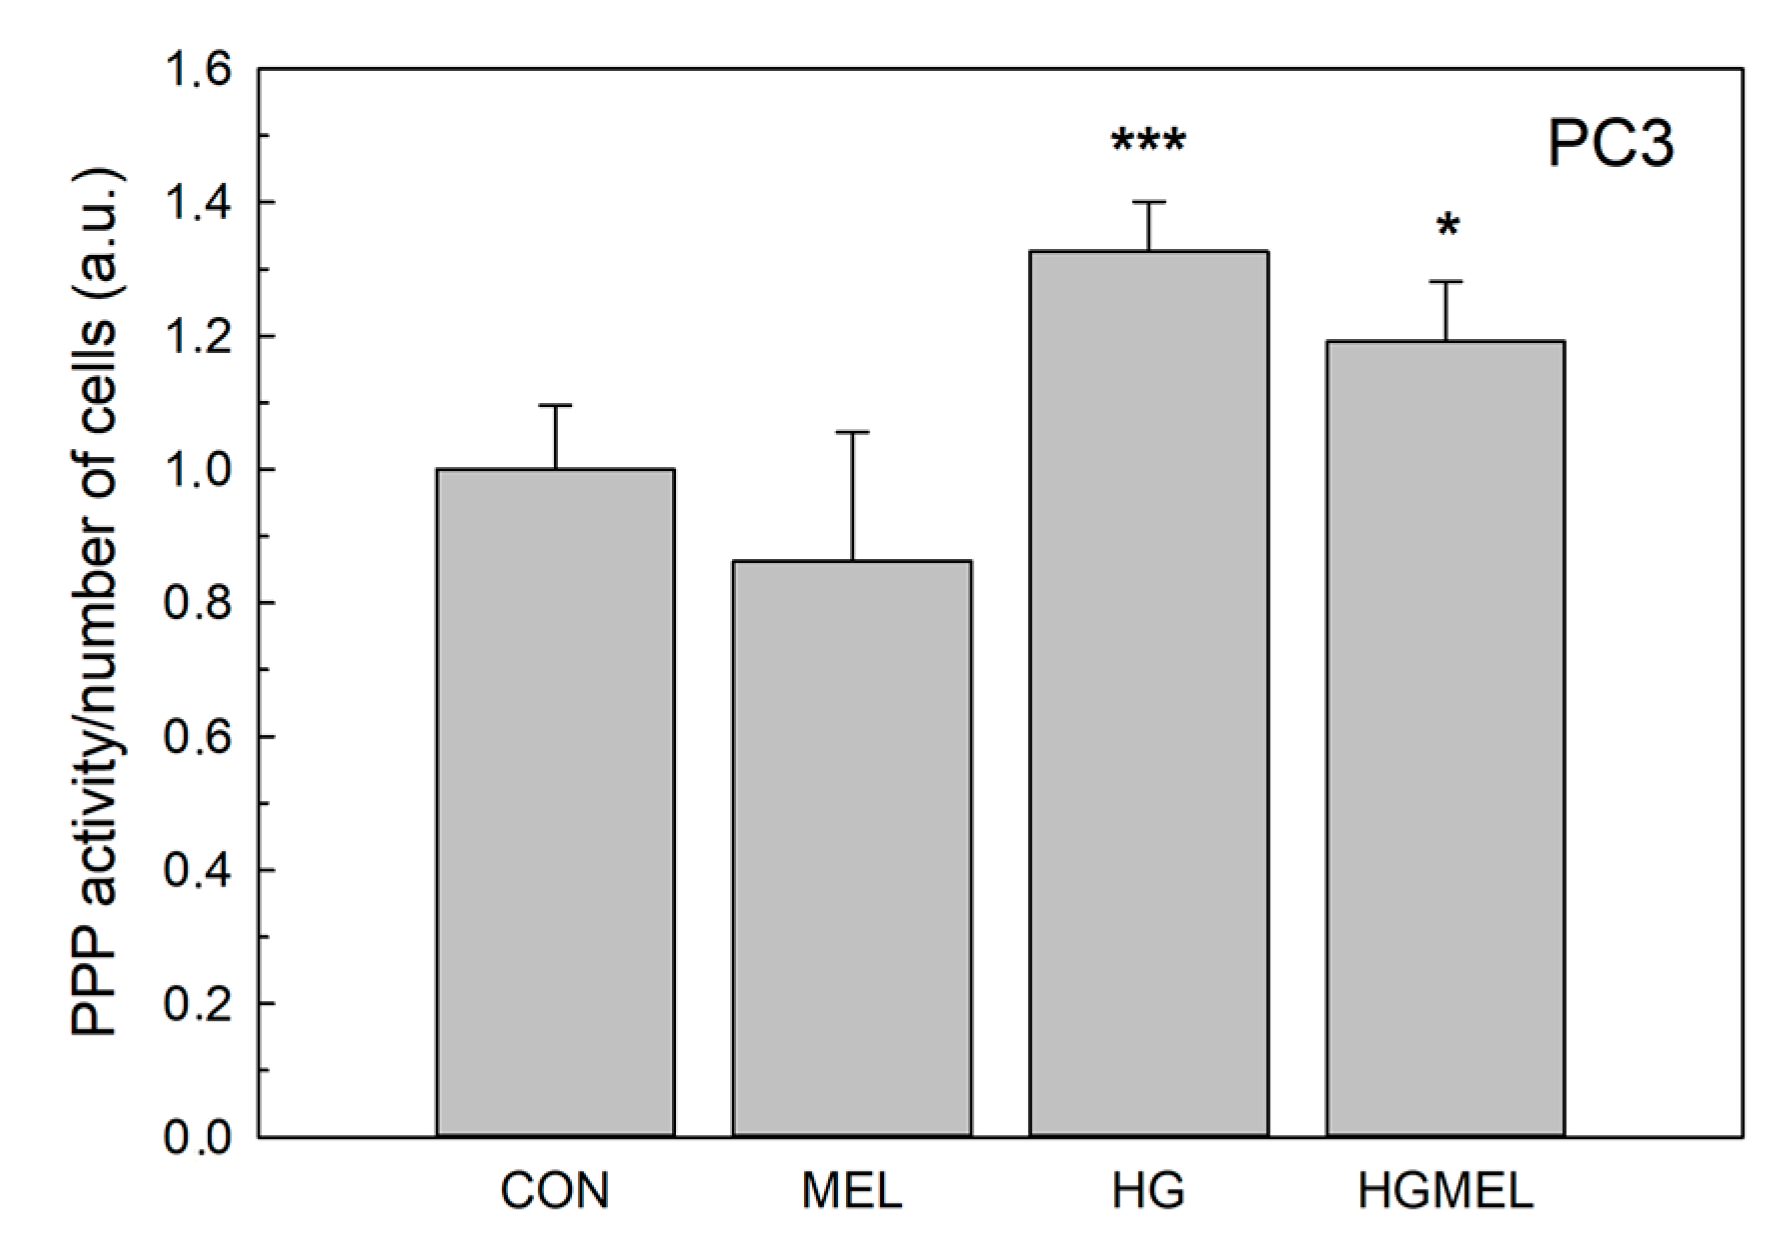
2.6. Melatonin Reduces Glucose-6-Phosphate Dehydrogenase (G6PDH)
3. Discussion
4. Materials and Methods
4.1. Cell Culture
4.2. Glucose Uptake
4.3. ATP Analysis
4.4. Measurement of the 13CO2 Production in Cell Culture
4.5. Stable Isotope Labeling Experiments
4.6. GA6PDH Activity
4.7. LDH Activity
4.8. Statistics
5. Conclusions
Acknowledgments
Author Contributions
Conflicts of Interest
References
- Stehle, J.H.; Saade, A.; Rawashdeh, O.; Ackermann, K.; Jilg, A.; Sebestény, T.; Maronde, E. A survey of molecular details in the human pineal gland in the light of phylogeny, structure, function and chronobiological diseases. J. Pineal Res. 2011, 51, 17–43. [Google Scholar] [CrossRef] [PubMed]
- Iriti, M.; Varoni, E.M.; Vitalini, S. Melatonin in traditional Mediterranean diets. J. Pineal Res. 2010, 49, 101–105. [Google Scholar] [CrossRef] [PubMed]
- Hardeland, R.; Poeggeler, B. Non-vertebrate melatonin. J. Pineal Res. 2003, 34, 233–241. [Google Scholar] [CrossRef] [PubMed]
- Singh, M.; Jadhav, H.R. Melatonin: Functions and ligands. Drug Discov. Today 2014, 19, 1410–1418. [Google Scholar] [CrossRef] [PubMed]
- Tan, D.-X.; Hardeland, R.; Manchester, L.C.; Paredes, S.D.; Korkmaz, A.; Sainz, R.M.; Mayo, J.C.; Fuentes-Broto, L.; Reiter, R.J. The changing biological roles of melatonin during evolution: From an antioxidant to signals of darkness, sexual selection and fitness. Biol. Rev. Camb. Philos. Soc. 2010, 85, 607–623. [Google Scholar] [CrossRef] [PubMed]
- Reiter, R.J.; Mayo, J.C.; Tan, D.-X.; Sainz, R.M.; Alatorre-Jimenez, M.; Qin, L. Melatonin as an antioxidant: Under promises but over delivers. J. Pineal Res. 2016, 61, 253–278. [Google Scholar] [CrossRef] [PubMed]
- Ren, W.; Liu, G.; Chen, S.; Yin, J.; Wang, J.; Tan, B.; Wu, G.; Bazer, F.W.; Peng, Y.; Li, T.; et al. Melatonin signaling in T cells: Functions and applications. J. Pineal Res. 2017, 62, e12394. [Google Scholar] [CrossRef]
- Sainz, R.M.; Mayo, J.C.; Rodriguez, C.; Tan, D.X.; Lopez-Burillo, S.; Reiter, R.J. Melatonin and cell death: Differential actions on apoptosis in normal and cancer cells. Cell. Mol. Life Sci. 2003, 60, 1407–1426. [Google Scholar] [CrossRef] [PubMed]
- Tan, D.; Reiter, R.J.; Chen, L.D.; Poeggeler, B.; Manchester, L.C.; Barlow-Walden, L.R. Both physiological and pharmacological levels of melatonin reduce DNA adduct formation induced by the carcinogen safrole. Carcinogenesis 1994, 15, 215–218. [Google Scholar] [CrossRef] [PubMed]
- Sainz, R.M.; Mayo, J.C.; Tan, D.-X.; Lopez-Burillo, S.; Natarajan, M.; Reiter, R.J. Antioxidant activity of melatonin in Chinese hamster ovarian cells: Changes in cellular proliferation and differentiation. Biochem. Biophys. Res. Commun. 2003, 302, 625–634. [Google Scholar] [PubMed]
- Boutin, J.A.; Audinot, V.; Ferry, G.; Delagrange, P. Molecular tools to study melatonin pathways and actions. Trends Pharmacol. Sci. 2005, 26, 412–419. [Google Scholar] [CrossRef] [PubMed]
- Erşahin, C.; Masana, M.I.; Dubocovich, M.L. Constitutively active melatonin MT(1) receptors in male rat caudal arteries. Eur. J. Pharmacol. 2002, 439, 171–182. [Google Scholar] [CrossRef]
- Tengattini, S.; Reiter, R.J.; Tan, D.-X.; Terron, M.P.; Rodella, L.F.; Rezzani, R. Cardiovascular diseases: Protective effects of melatonin. J. Pineal Res. 2008, 44, 16–25. [Google Scholar] [CrossRef] [PubMed]
- Tan, D.-X.; Manchester, L.C.; Fuentes-Broto, L.; Paredes, S.D.; Reiter, R.J. Significance and application of melatonin in the regulation of brown adipose tissue metabolism: Relation to human obesity. Obes. Rev. 2011, 12, 167–188. [Google Scholar] [CrossRef] [PubMed]
- Acuña Castroviejo, D.; López, L.C.; Escames, G.; López, A.; García, J.A.; Reiter, R.J. Melatonin-mitochondria interplay in health and disease. Curr. Top. Med. Chem. 2011, 11, 221–240. [Google Scholar] [CrossRef] [PubMed]
- Tan, D.-X.; Manchester, L.C.; Terron, M.P.; Flores, L.J.; Reiter, R.J. One molecule, many derivatives: A never-ending interaction of melatonin with reactive oxygen and nitrogen species? J. Pineal Res. 2007, 42, 28–42. [Google Scholar] [CrossRef] [PubMed]
- Rodriguez, C.; Mayo, J.C.; Sainz, R.M.; Antolín, I.; Herrera, F.; Martín, V.; Reiter, R.J. Regulation of antioxidant enzymes: A significant role for melatonin. J. Pineal Res. 2004, 36, 1–9. [Google Scholar] [CrossRef] [PubMed]
- Korkmaz, A.; Topal, T.; Tan, D.-X.; Reiter, R.J. Role of melatonin in metabolic regulation. Rev. Endocr. Metab. Disord. 2009, 10, 261–270. [Google Scholar] [CrossRef] [PubMed]
- Hevia, D.; Sainz, R.M.; Blanco, D.; Quiros, I.; Tan, D.-X.; Rodríguez, C.; Mayo, J.C. Melatonin uptake in prostate cancer cells: Intracellular transport versus simple passive diffusion. J. Pineal Res. 2008, 45, 247–257. [Google Scholar] [CrossRef] [PubMed]
- Hevia, D.; González-Menéndez, P.; Quiros-González, I.; Miar, A.; Rodríguez-García, A.; Tan, D.-X.; Reiter, R.J.; Mayo, J.C.; Sainz, R.M. Melatonin uptake through glucose transporters: A new target for melatonin inhibition of cancer. J. Pineal Res. 2015, 58, 234–250. [Google Scholar] [CrossRef] [PubMed]
- Dauchy, R.T.; Hoffman, A.E.; Wren-Dail, M.A.; Hanifin, J.P.; Warfield, B.; Brainard, G.C.; Xiang, S.; Yuan, L.; Hill, S.M.; Belancio, V.P.; et al. Daytime blue light enhances the nighttime circadian melatonin inhibition of human prostate cancer growth. Comp. Med. 2015, 65, 473–485. [Google Scholar] [PubMed]
- Bazwinsky-Wutschke, I.; Bieseke, L.; Mühlbauer, E.; Peschke, E. Influence of melatonin receptor signalling on parameters involved in blood glucose regulation. J. Pineal Res. 2014, 56, 82–96. [Google Scholar] [CrossRef] [PubMed]
- Scheer, F.A.J.L.; Hilton, M.F.; Mantzoros, C.S.; Shea, S.A. Adverse metabolic and cardiovascular consequences of circadian misalignment. Proc. Natl. Acad. Sci. USA 2009, 106, 4453–4458. [Google Scholar] [CrossRef] [PubMed]
- Nishida, S.; Segawa, T.; Murai, I.; Nakagawa, S. Long-term melatonin administration reduces hyperinsulinemia and improves the altered fatty-acid compositions in type 2 diabetic rats via the restoration of Delta-5 desaturase activity. J. Pineal Res. 2002, 32, 26–33. [Google Scholar] [CrossRef] [PubMed]
- Nishida, S.; Sato, R.; Murai, I.; Nakagawa, S. Effect of pinealectomy on plasma levels of insulin and leptin and on hepatic lipids in type 2 diabetic rats. J. Pineal Res. 2003, 35, 251–256. [Google Scholar] [CrossRef] [PubMed]
- Espino, J.; Pariente, J.A.; Rodríguez, A.B. Role of melatonin on diabetes-related metabolic disorders. World J. Diabetes 2011, 2, 82–91. [Google Scholar] [CrossRef] [PubMed]
- Rondanelli, M.; Faliva, M.A.; Perna, S.; Antoniello, N. Update on the role of melatonin in the prevention of cancer tumorigenesis and in the management of cancer correlates, such as sleep-wake and mood disturbances: Review and remarks. Aging Clin. Exp. Res. 2013, 25, 499–510. [Google Scholar] [CrossRef] [PubMed]
- Bouatia-Naji, N.; Bonnefond, A.; Cavalcanti-Proença, C.; Sparsø, T.; Holmkvist, J.; Marchand, M.; Delplanque, J.; Lobbens, S.; Rocheleau, G.; Durand, E.; et al. A variant near MTNR1B is associated with increased fasting plasma glucose levels and type 2 diabetes risk. Nat. Genet. 2009, 41, 89–94. [Google Scholar] [CrossRef] [PubMed]
- Sainz, R.M.; Mayo, J.C.; Tan, D.; León, J.; Manchester, L.; Reiter, R.J. Melatonin reduces prostate cancer cell growth leading to neuroendocrine differentiation via a receptor and PKA independent mechanism. Prostate 2005, 63, 29–43. [Google Scholar] [CrossRef] [PubMed]
- Mayo, J.C.; Hevia, D.; Quiros-Gonzalez, I.; Rodriguez-Garcia, A.; Gonzalez-Menendez, P.; Cepas, V.; Gonzalez-Pola, I.; Sainz, R.M. IGFBP3 and MAPK/ERK signaling mediates melatonin-induced antitumor activity in prostate cancer. J. Pineal Res. 2016, 62, 1–17. [Google Scholar] [CrossRef] [PubMed]
- Hanahan, D.; Weinberg, R.A. Hallmarks of cancer: The next generation. Cell 2011, 144, 646–674. [Google Scholar] [CrossRef] [PubMed]
- Pavlova, N.N.; Thompson, C.B. The emerging hallmarks of cancer metabolism. Cell Metab. 2016, 23, 27–47. [Google Scholar] [CrossRef] [PubMed]
- Cutruzzolà, F.; Giardina, G.; Marani, M.; Macone, A.; Paiardini, A.; Rinaldo, S.; Paone, A. Glucose metabolism in the progression of prostate cancer. Front. Physiol. 2017, 8, 97. [Google Scholar] [CrossRef] [PubMed]
- Acuña-Castroviejo, D.; Escames, G.; Venegas, C.; Díaz-Casado, M.E.; Lima-Cabello, E.; López, L.C.; Rosales-Corral, S.; Tan, D.-X.; Reiter, R.J. Extrapineal melatonin: Sources, regulation, and potential functions. Cell Mol. Life Sci. 2014, 71, 2997–3025. [Google Scholar] [CrossRef] [PubMed]
- Yuan, L.; Collins, A.R.; Dai, J.; Dubocovich, M.L.; Hill, S.M. MT(1) melatonin receptor overexpression enhances the growth suppressive effect of melatonin in human breast cancer cells. Mol. Cell Endocrinol. 2002, 192, 147–156. [Google Scholar] [CrossRef]
- Schöder, H.; Larson, S.M. Positron emission tomography for prostate, bladder, and renal cancer. Semin. Nucl. Med. 2004, 34, 274–292. [Google Scholar] [CrossRef] [PubMed]
- Vaz, C.V.; Marques, R.; Alves, M.G.; Oliveira, P.F.; Cavaco, J.E.; Maia, C.J.; Socorro, S. Androgens enhance the glycolytic metabolism and lactate export in prostate cancer cells by modulating the expression of GLUT1, GLUT3, PFK, LDH and MCT4 genes. J. Cancer Res. Clin. Oncol. 2016, 142, 5–16. [Google Scholar] [CrossRef] [PubMed]
- Parks, S.K.; Chiche, J.; Pouysségur, J. Disrupting proton dynamics and energy metabolism for cancer therapy. Nat. Rev. Cancer 2013, 13, 611–623. [Google Scholar] [CrossRef] [PubMed]
- Beckner, M.E.; Stracke, M.L.; Liotta, L.A.; Schiffmann, E. Glycolysis as primary energy source in tumor cell chemotaxis. J. Natl. Cancer Inst. 1990, 82, 1836–1840. [Google Scholar] [CrossRef] [PubMed]
- Buchakjian, M.R.; Kornbluth, S. The engine driving the ship: Metabolic steering of cell proliferation and death. Nat. Rev. Mol. Cell Biol. 2010, 11, 715–727. [Google Scholar] [CrossRef] [PubMed]
- Gordan, J.D.; Lal, P.; Dondeti, V.R.; Letrero, R.; Parekh, K.N.; Oquendo, C.E.; Greenberg, R.A.; Flaherty, K.T.; Rathmell, W.K.; Keith, B.; et al. HIF-α effects on c-Myc distinguish two subtypes of sporadic VHL-deficient clear cell renal carcinoma. Cancer Cell 2008, 14, 435–446. [Google Scholar] [CrossRef] [PubMed]
- Gatenby, R.A.; Gillies, R.J. Why do cancers have high aerobic glycolysis? Nat. Rev. Cancer 2004, 4, 891–899. [Google Scholar] [CrossRef] [PubMed]
- Singh, K.K.; Desouki, M.M.; Franklin, R.B.; Costello, L.C. Mitochondrial aconitase and citrate metabolism in malignant and nonmalignant human prostate tissues. Mol. Cancer 2006, 5, 14. [Google Scholar] [CrossRef] [PubMed]
- Costello, L.C.; Franklin, R.B. A comprehensive review of the role of zinc in normal prostate function and metabolism; and its implications in prostate cancer. Arch. Biochem. Biophys. 2016, 611, 100–112. [Google Scholar] [CrossRef] [PubMed]
- Vriend, J.; Reiter, R.J. Melatonin and the von Hippel-Linday/HIF-1 oxygen sensing mechanism: A review. Biochim. Biophys. Acta 2016, 1865, 176–183. [Google Scholar] [PubMed]
- Semenza, G.L. HIF-1 mediates metabolic responses to intratumoral hypoxia and oncogenic mutations. J. Clin. Investig. 2013, 123, 3664–3671. [Google Scholar] [CrossRef] [PubMed]
- Semenza, G.L. Hypoxia-inducible factors: Coupling glucose metabolism and redox regulation with induction of the breast cancer stem cell phenotype. EMBO J. 2017, 36, 252–259. [Google Scholar] [CrossRef] [PubMed]
- Barron, C.C.; Bilan, P.J.; Tsakiridis, T.; Tsiani, E. Facilitative glucose transporters: Implications for cancer detection, prognosis and treatment. Metabolism 2016, 65, 124–139. [Google Scholar] [CrossRef] [PubMed]
- Frigo, D.E.; Howe, M.K.; Wittmann, B.M.; Brunner, A.M.; Cushman, I.; Wang, Q.; Brown, M.; Means, A.R.; McDonnell, D.P. CaM kinase kinase β-mediated activation of the growth regulatory kinase AMPK is required for androgen-dependent migration of prostate cancer cells. Cancer Res. 2011, 71, 528–537. [Google Scholar] [CrossRef] [PubMed]
- Petrelli, F.; Cabiddu, M.; Coinu, A.; Borgonovo, K.; Ghilardi, M.; Lonati, V.; Barni, S. Prognostic role of lactate dehydrogenase in solid tumors: A systematic review and meta-analysis of 76 studies. Acta Oncol. 2015, 54, 1–10. [Google Scholar] [CrossRef] [PubMed]
- Fiume, L.; Manerba, M.; Vettraino, M.; di Stefano, G. Inhibition of lactate dehydrogenase activity as an approach to cancer therapy. Future Med. Chem. 2014, 6, 429–445. [Google Scholar] [CrossRef] [PubMed]
- Jiang, T.; Chang, Q.; Zhao, Z.; Yan, S.; Wang, L.; Cai, J.; Xu, G. Melatonin-mediated cytoprotection against hyperglycemic injury in Müller cells. PLoS ONE 2012, 7, e50661. [Google Scholar] [CrossRef] [PubMed]
- Sartori, C.; Dessen, P.; Mathieu, C.; Monney, A.; Bloch, J.; Nicod, P.; Scherrer, U.; Duplain, H. Melatonin improves glucose homeostasis and endothelial vascular function in high-fat diet-fed insulin-resistant mice. Endocrinology 2009, 150, 5311–5317. [Google Scholar] [CrossRef] [PubMed]
- Kato, H.; Tanaka, G.; Masuda, S.; Ogasawara, J.; Sakurai, T.; Kizaki, T.; Ohno, H.; Izawa, T. Melatonin promotes adipogenesis and mitochondrial biogenesis in 3T3-L1 preadipocytes. J. Pineal Res. 2015, 59, 267–275. [Google Scholar] [CrossRef] [PubMed]
- Song, J.; Kang, S.M.; Lee, K.M.; Lee, J.E. The protective effect of melatonin on neural stem cell against LPS-induced inflammation. BioMed Res. Int. 2015, 2015. [Google Scholar] [CrossRef] [PubMed]
- Wu, H.; Song, C.; Zhang, J.; Zhao, J.; Fu, B.; Mao, T.; Zhang, Y. Melatonin-mediated upregulation of GLUT1 blocks exit from pluripotency by increasing the uptake of oxidized vitamin C in mouse embryonic stem cells. FASEB J. 2017, 31, 1731–1743. [Google Scholar] [CrossRef] [PubMed]
- Chandler, J.D.; Williams, E.D.; Slavin, J.L.; Best, J.D.; Rogers, S. Expression and localization of GLUT1 and GLUT12 in prostate carcinoma. Cancer 2003, 97, 2035–2042. [Google Scholar] [CrossRef] [PubMed]
- Gonzalez-Menendez, P.; Hevia, D.; Rodriguez-Garcia, A.; Mayo, J.C.; Sainz, R.M. Regulation of GLUT transporters by flavonoids in androgen-sensitive and -insensitive prostate cancer cells. Endocrinology 2014, 155, 3238–3250. [Google Scholar] [CrossRef] [PubMed]
- Georgescu, I.; Gooding, R.J.; Doiron, R.C.; Day, A.; Selvarajah, S.; Davidson, C.; Berman, D.M.; Park, P.C. Molecular characterization of Gleason patterns 3 and 4 prostate cancer using reverse Warburg effect-associated genes. Cancer Metab. 2016, 4, 8. [Google Scholar] [CrossRef] [PubMed]
- Qu, W.; Ding, S.; Cao, G.; Wang, S.; Zheng, X.; Li, G. MiR-132 mediates a metabolic shift in prostate cancer cells by targeting Glut1. FEBS Open Bio 2016, 6, 735–741. [Google Scholar] [CrossRef] [PubMed]
- Fernandez-Fernandez, M.; Rodriguez-Gonzalez, P.; Hevia, D.; Gonzalez-Menendez, P.; Sainz, R.M.; Garcia Alonso, J.I. Accurate and sensitive determination of molar fractions of 13C-Labeled intracellular metabolites in cell cultures grown in the presence of isotopically-labeled glucose. Anal. Chim. Acta 2017, 969, 35–48. [Google Scholar] [CrossRef] [PubMed]
- Zhao, S.; Guo, Y.; Sheng, Q.; Shyr, Y. Advanced heat map and clustering analysis using heatmap3. BioMed Res. Int. 2014, 2014. [Google Scholar] [CrossRef] [PubMed]
- Tian, W.N.; Braunstein, L.D.; Apse, K.; Pang, J.; Rose, M.; Tian, X.; Stanton, R.C. Importance of glucose-6-phosphate dehydrogenase activity in cell death. Am. J. Physiol. 1999, 276, 1121–1131. [Google Scholar]


© 2017 by the authors. Licensee MDPI, Basel, Switzerland. This article is an open access article distributed under the terms and conditions of the Creative Commons Attribution (CC BY) license (http://creativecommons.org/licenses/by/4.0/).
Share and Cite
Hevia, D.; Gonzalez-Menendez, P.; Fernandez-Fernandez, M.; Cueto, S.; Rodriguez-Gonzalez, P.; Garcia-Alonso, J.I.; Mayo, J.C.; Sainz, R.M. Melatonin Decreases Glucose Metabolism in Prostate Cancer Cells: A 13C Stable Isotope-Resolved Metabolomic Study. Int. J. Mol. Sci. 2017, 18, 1620. https://0-doi-org.brum.beds.ac.uk/10.3390/ijms18081620
Hevia D, Gonzalez-Menendez P, Fernandez-Fernandez M, Cueto S, Rodriguez-Gonzalez P, Garcia-Alonso JI, Mayo JC, Sainz RM. Melatonin Decreases Glucose Metabolism in Prostate Cancer Cells: A 13C Stable Isotope-Resolved Metabolomic Study. International Journal of Molecular Sciences. 2017; 18(8):1620. https://0-doi-org.brum.beds.ac.uk/10.3390/ijms18081620
Chicago/Turabian StyleHevia, David, Pedro Gonzalez-Menendez, Mario Fernandez-Fernandez, Sergio Cueto, Pablo Rodriguez-Gonzalez, Jose I. Garcia-Alonso, Juan C. Mayo, and Rosa M. Sainz. 2017. "Melatonin Decreases Glucose Metabolism in Prostate Cancer Cells: A 13C Stable Isotope-Resolved Metabolomic Study" International Journal of Molecular Sciences 18, no. 8: 1620. https://0-doi-org.brum.beds.ac.uk/10.3390/ijms18081620