Caffeic Acid and Metformin Inhibit Invasive Phenotype Induced by TGF-β1 in C-4I and HTB-35/SiHa Human Cervical Squamous Carcinoma Cells by Acting on Different Molecular Targets


Abstract
:
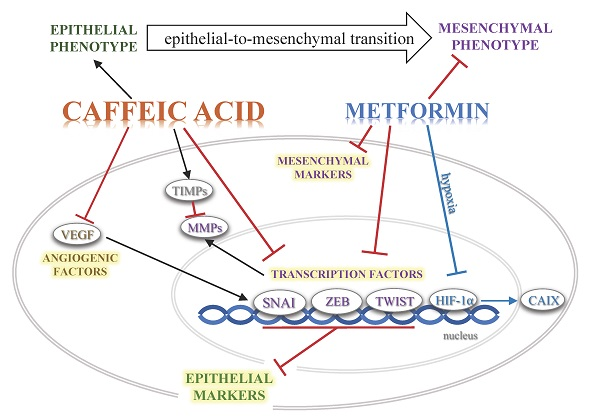
1. Introduction
2. Results
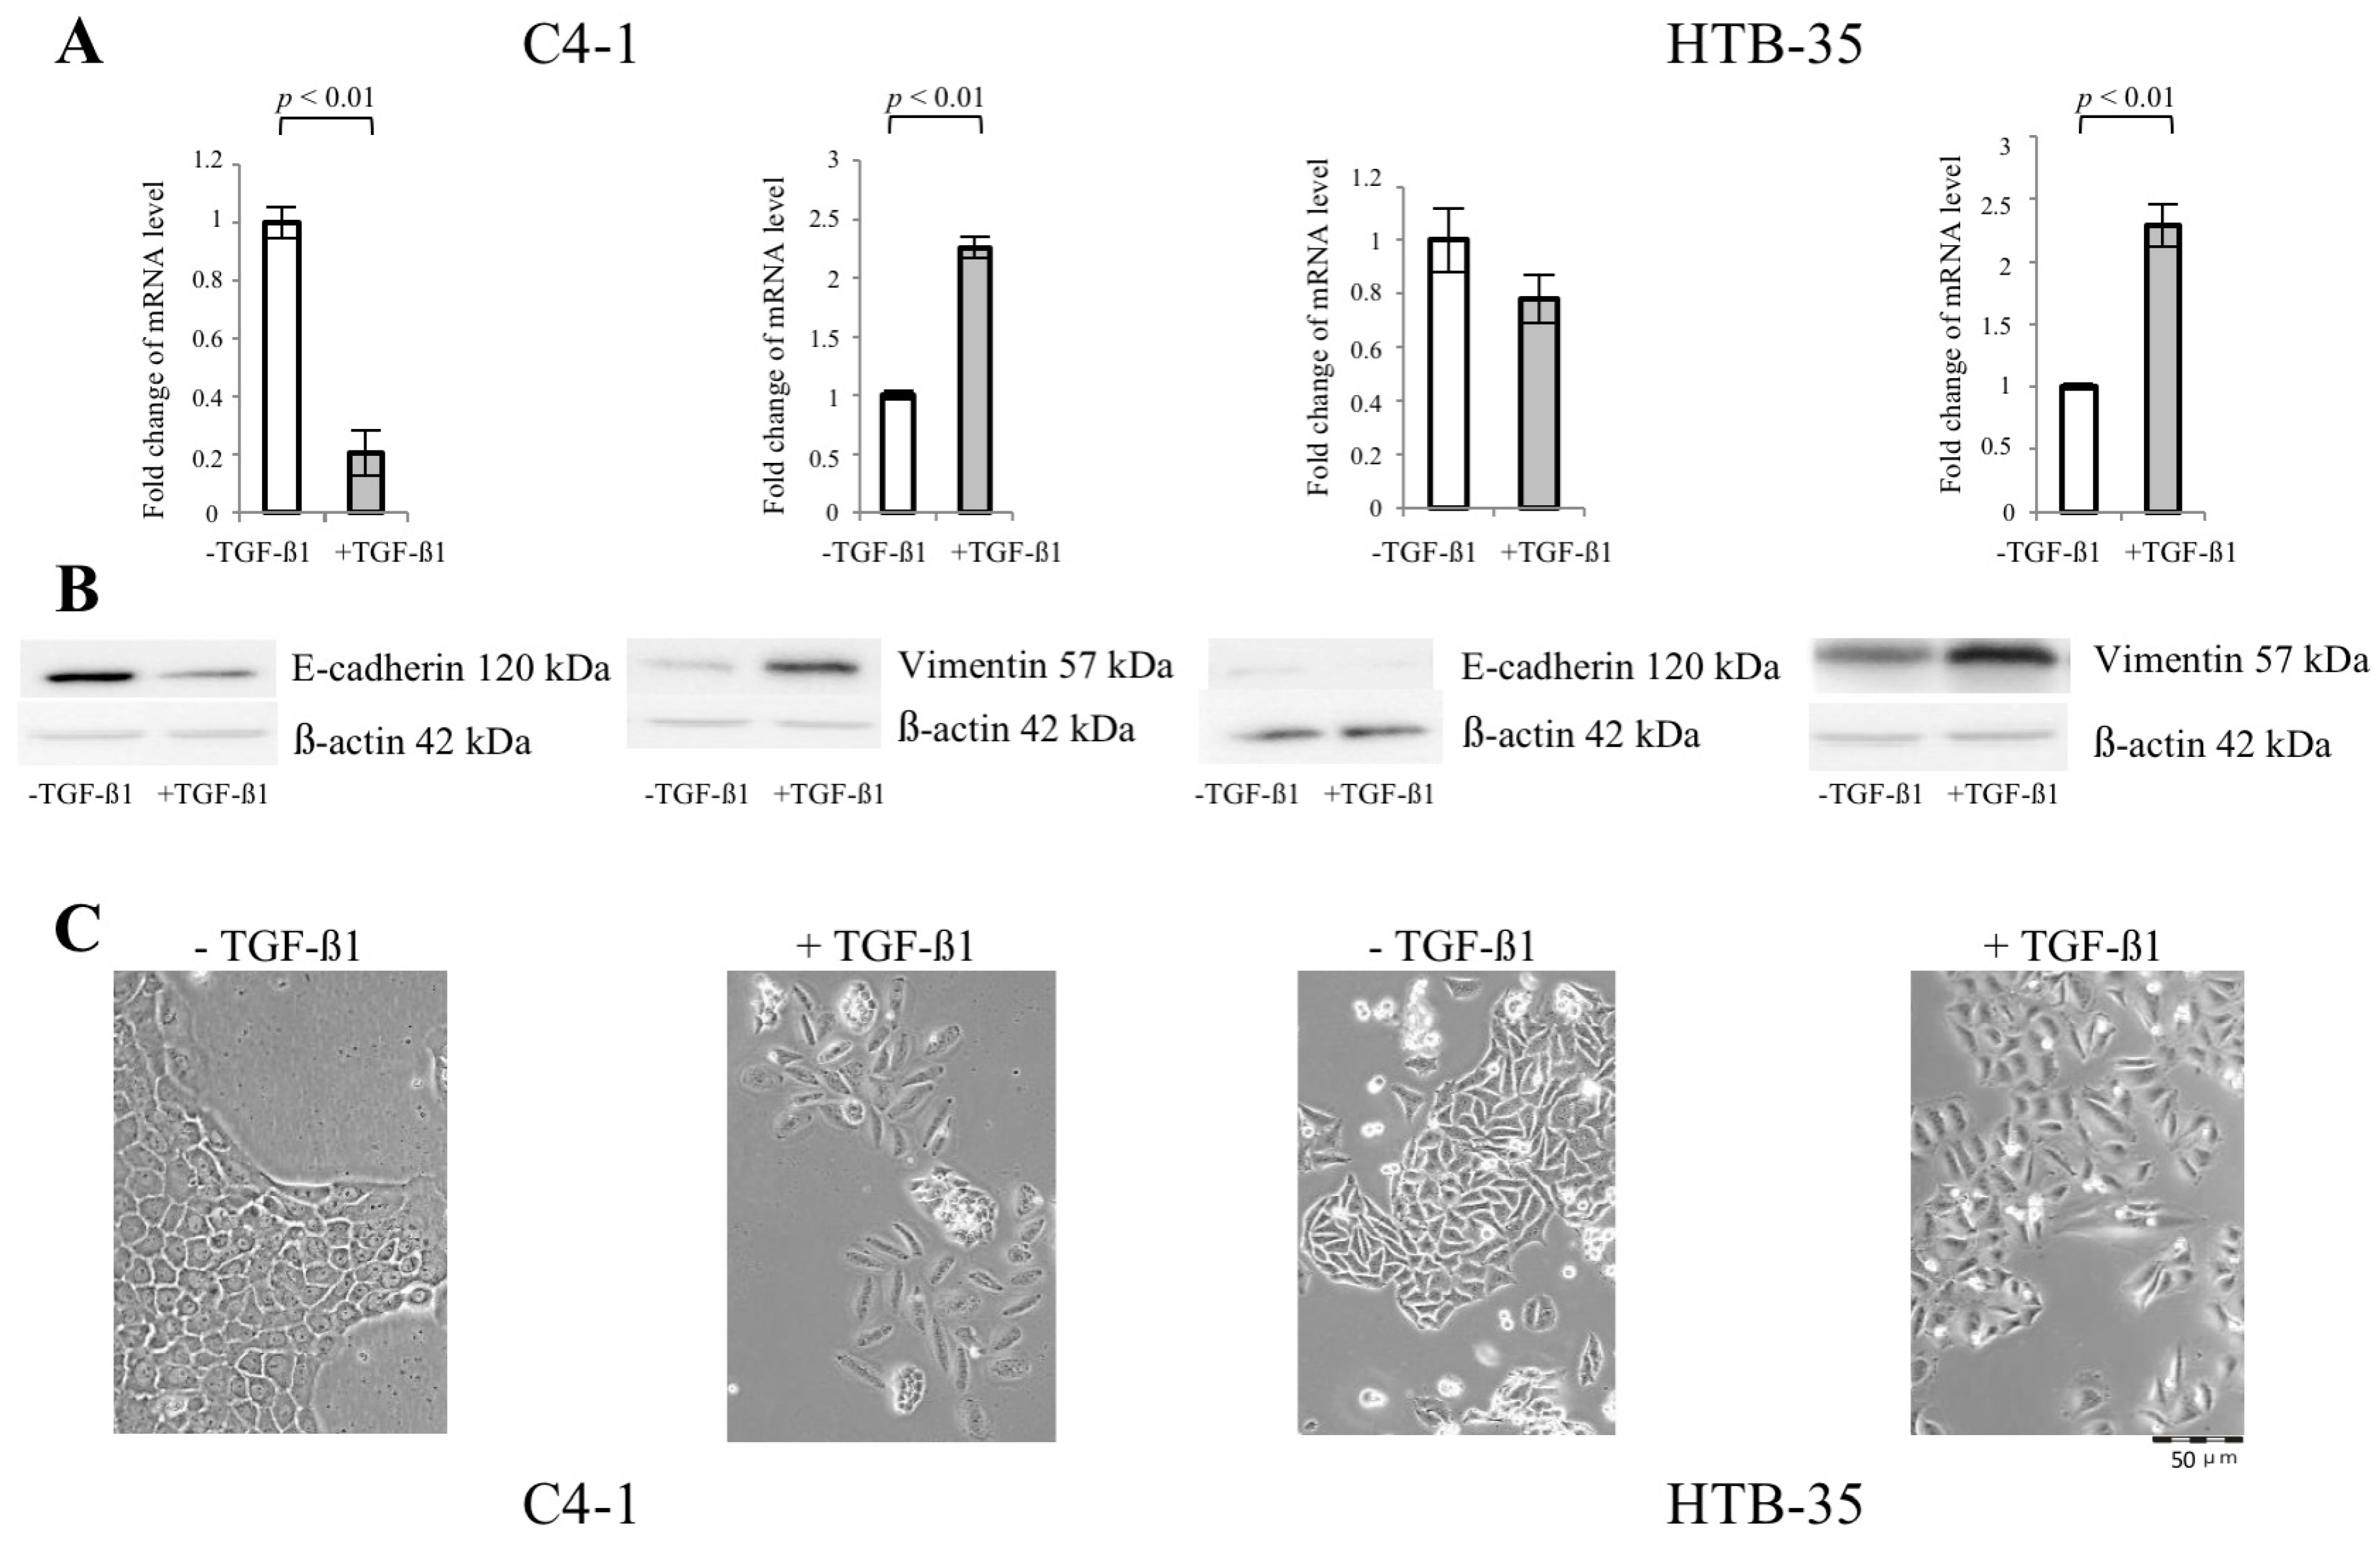
2.1. Transforming Growth Factor Beta 1 (TGF-β1) Induces Epithelial-to-Mesenchymal Transition (EMT) in C4-I and HTB-35 Cells
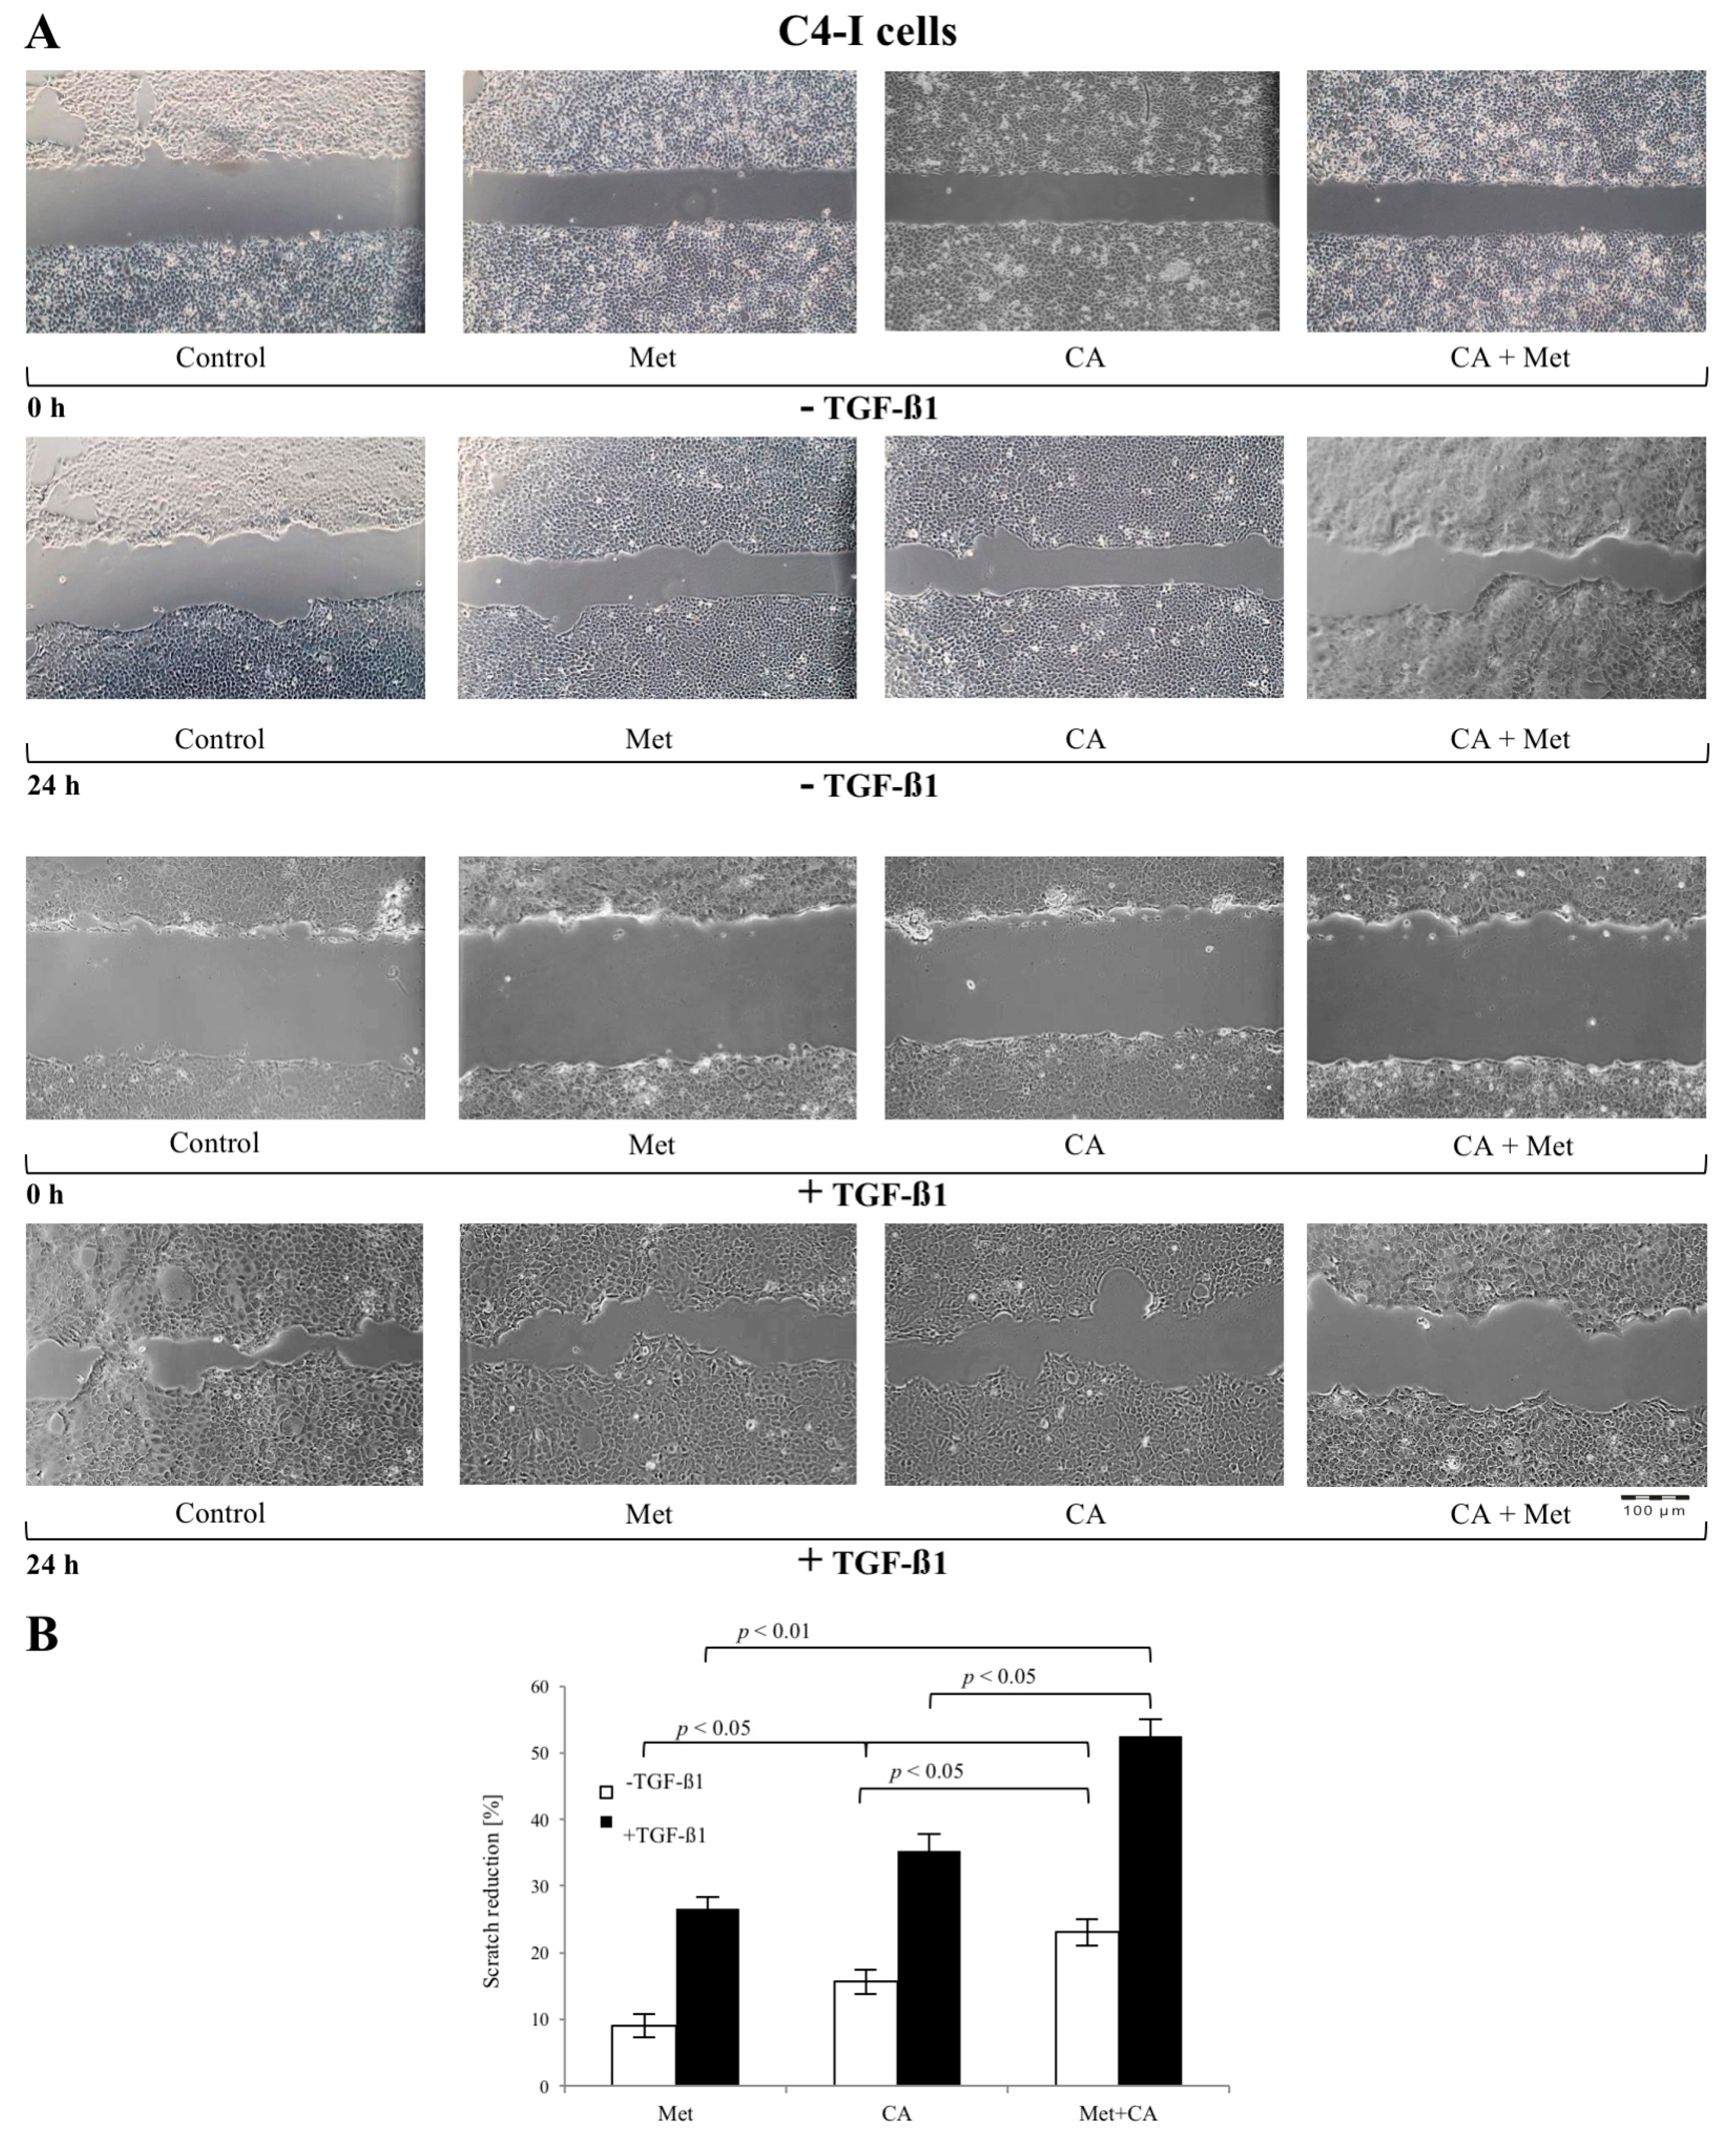
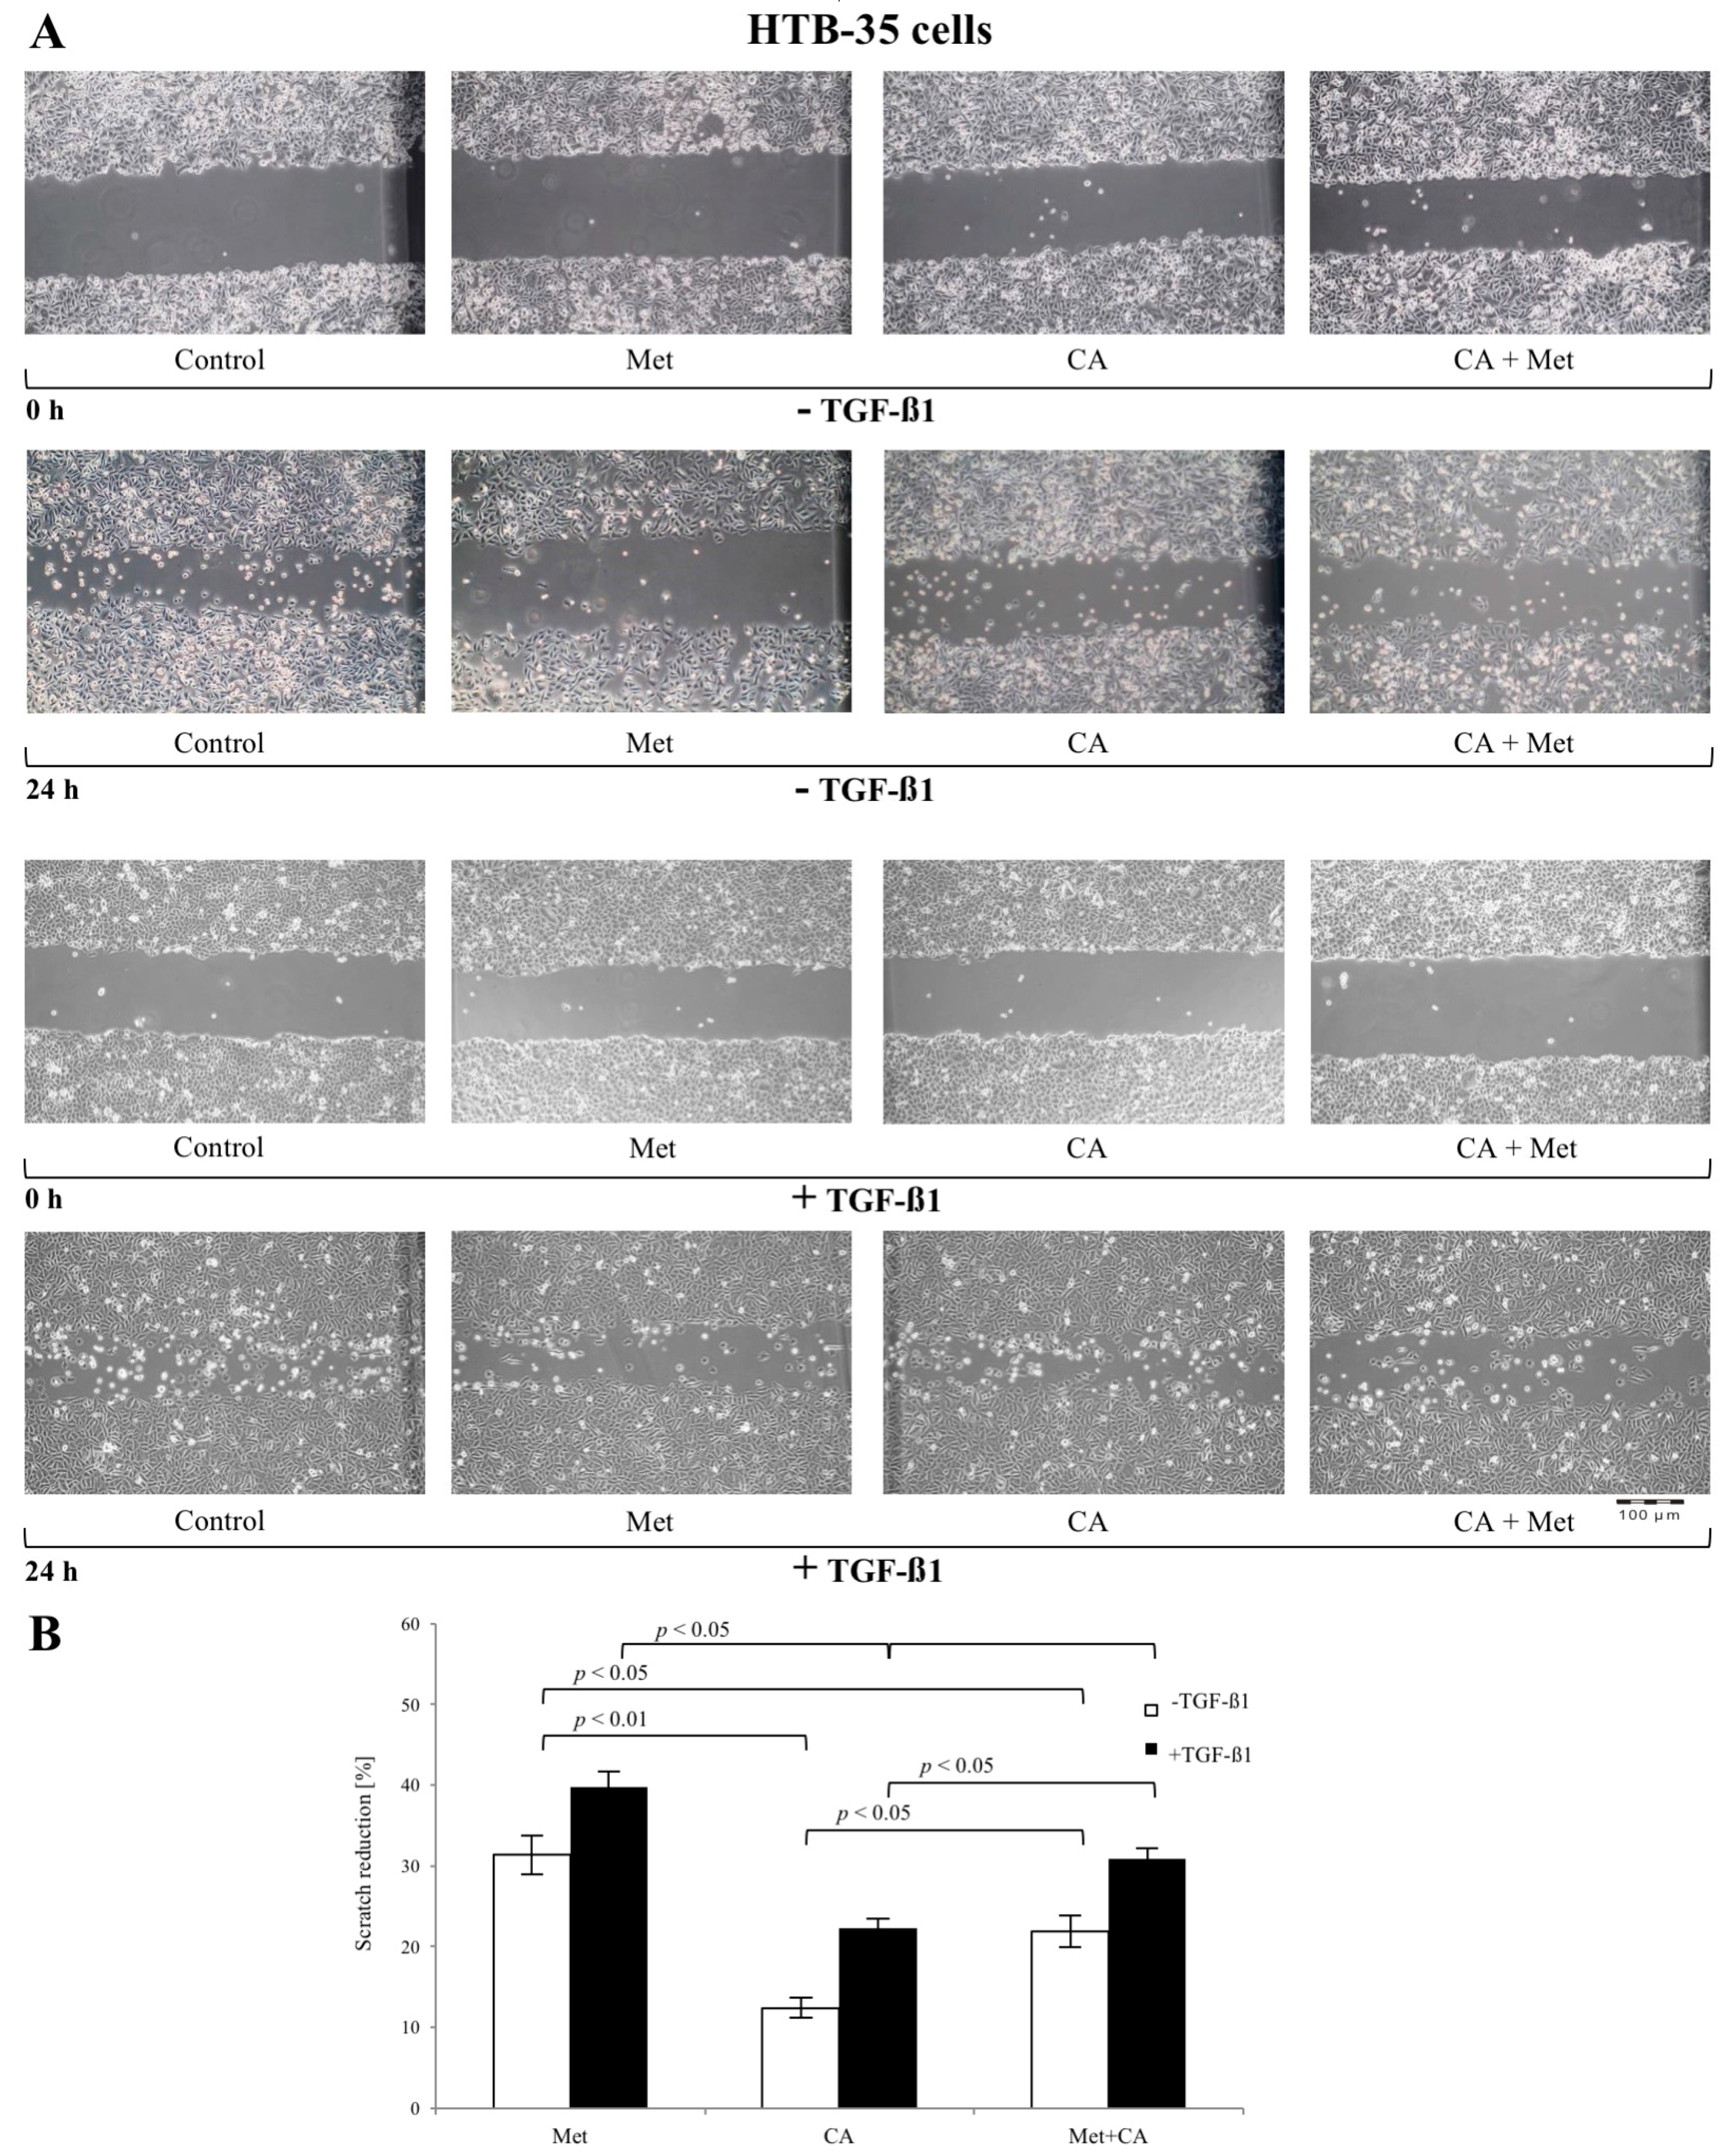
2.2. CA Attenuates the Migratory Capacity of C4-I and Met Inhibits Motility of HTB-35 Cells
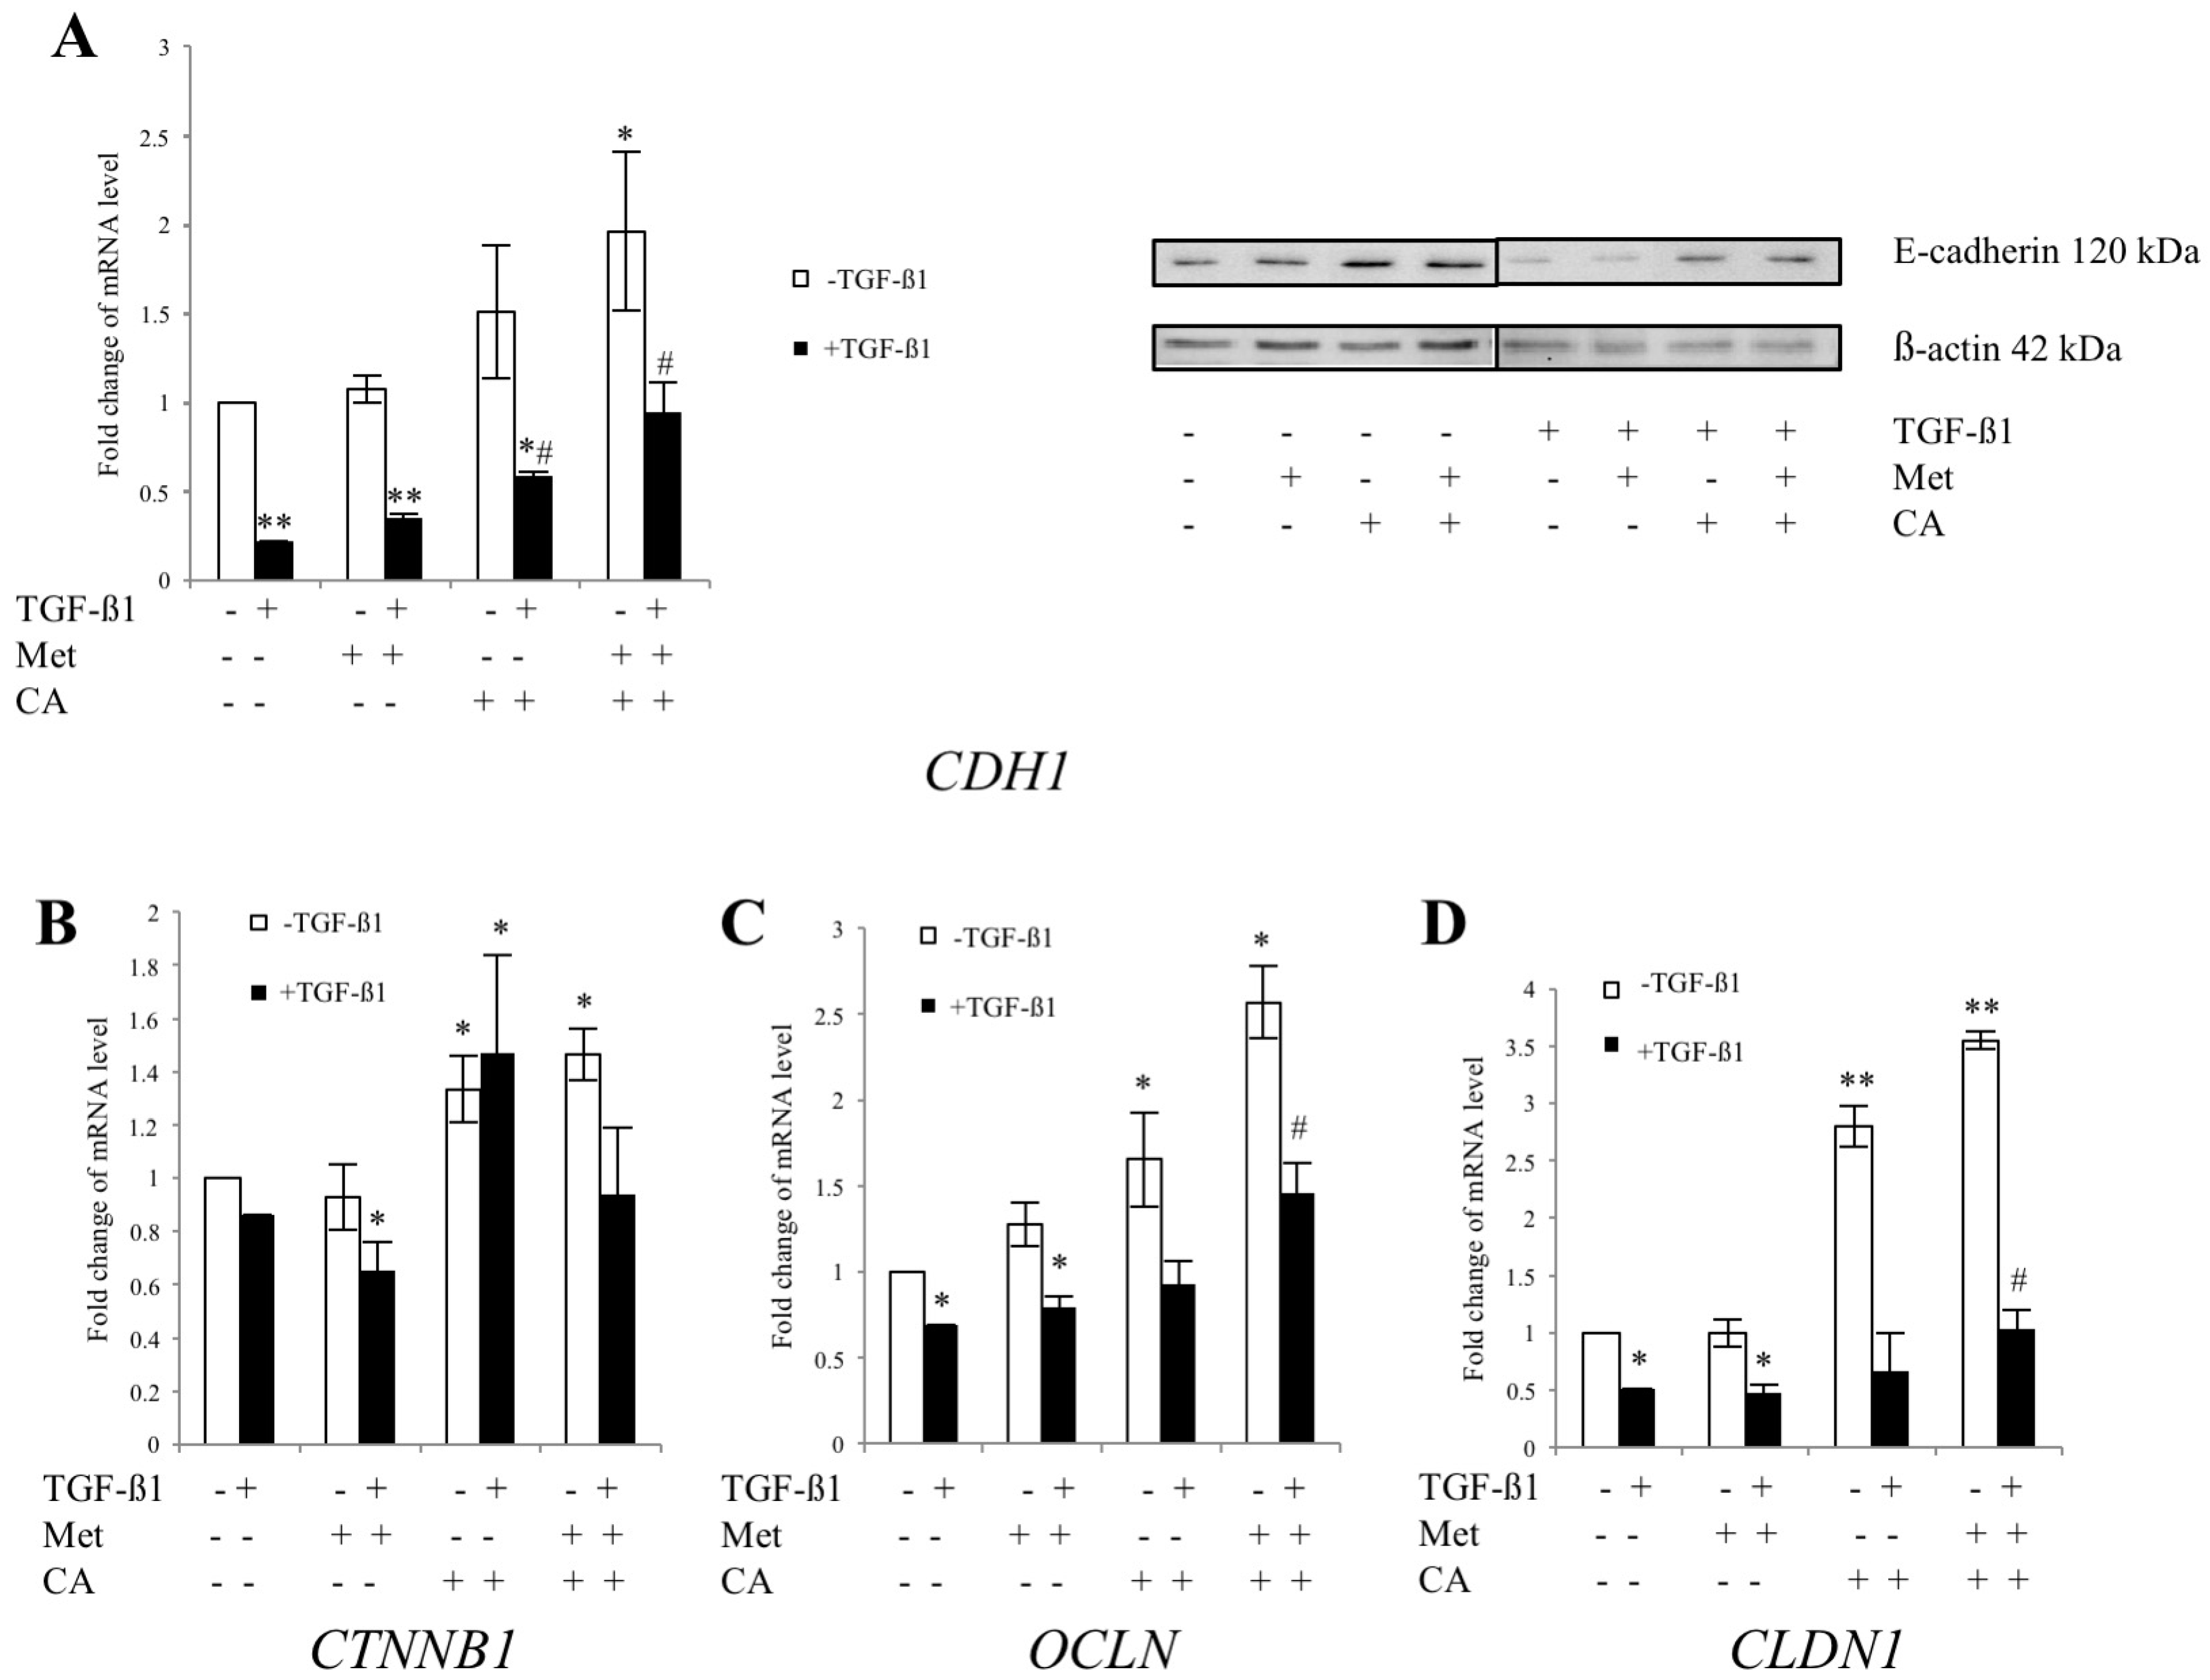
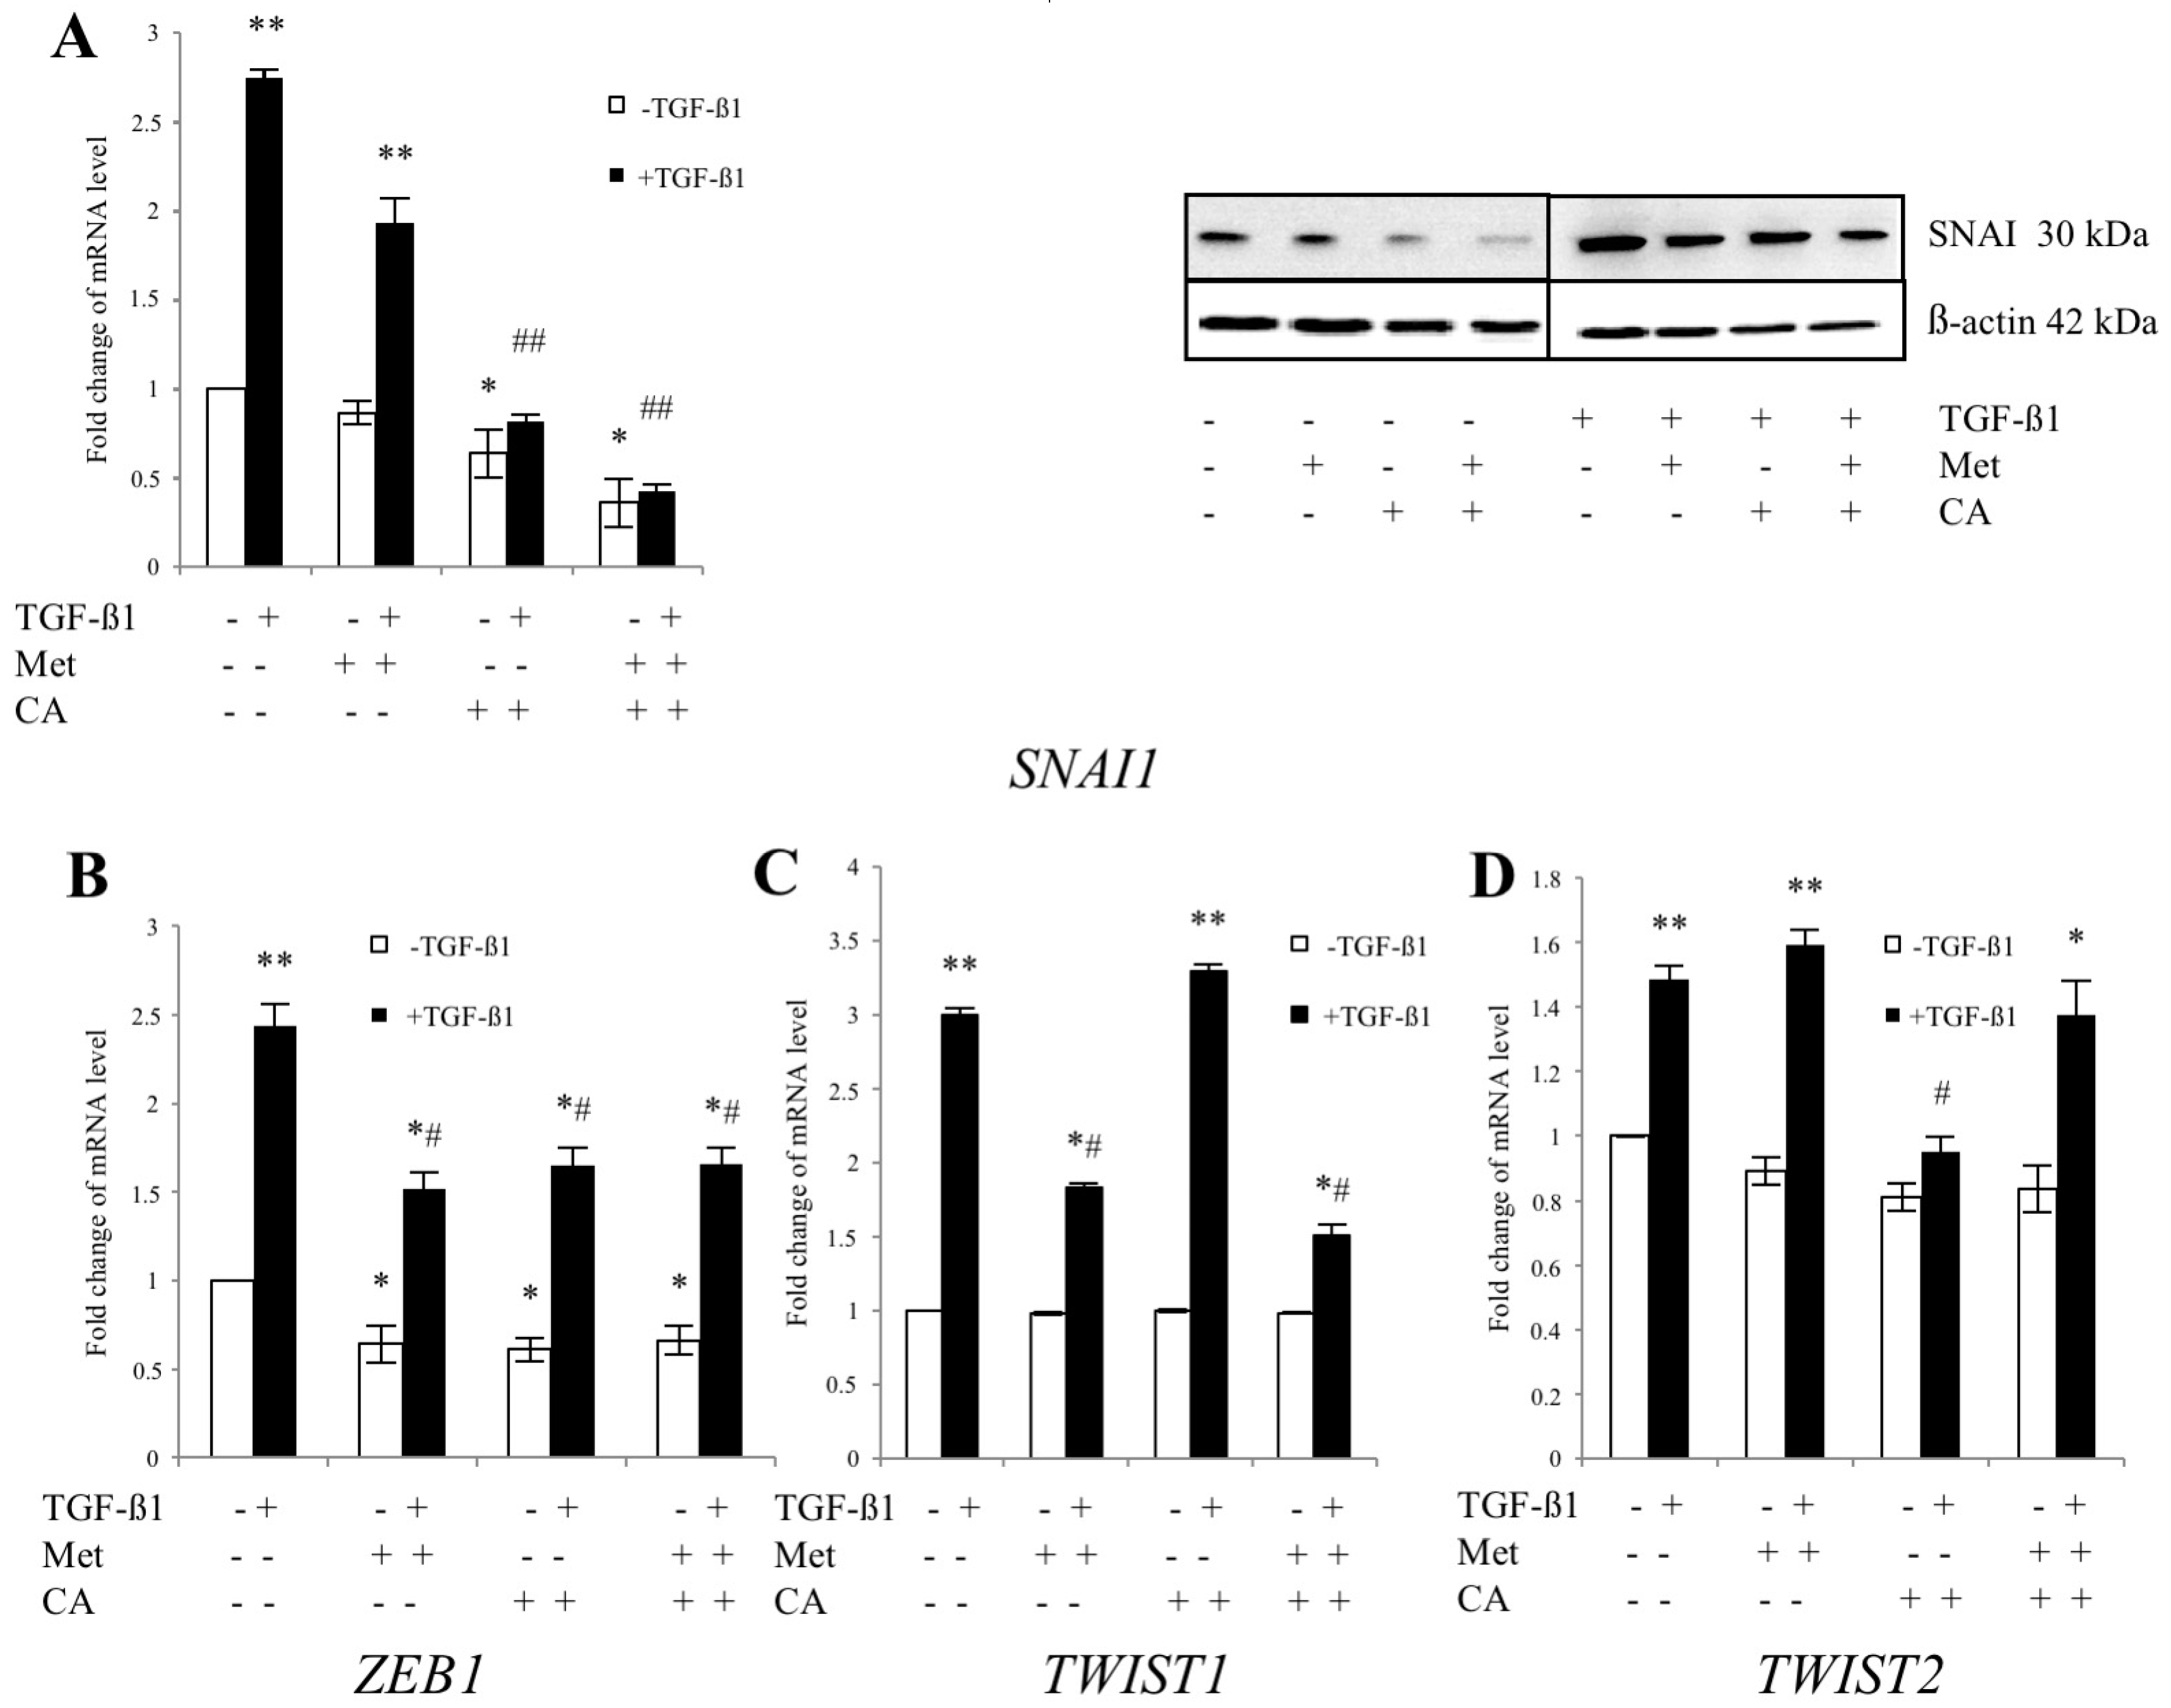
2.3. CA and Met Treatment of C4-I Cells Increases Epithelial Adhesive Markers and Decreases Mesenchymal Transcription Factors Regulating EMT
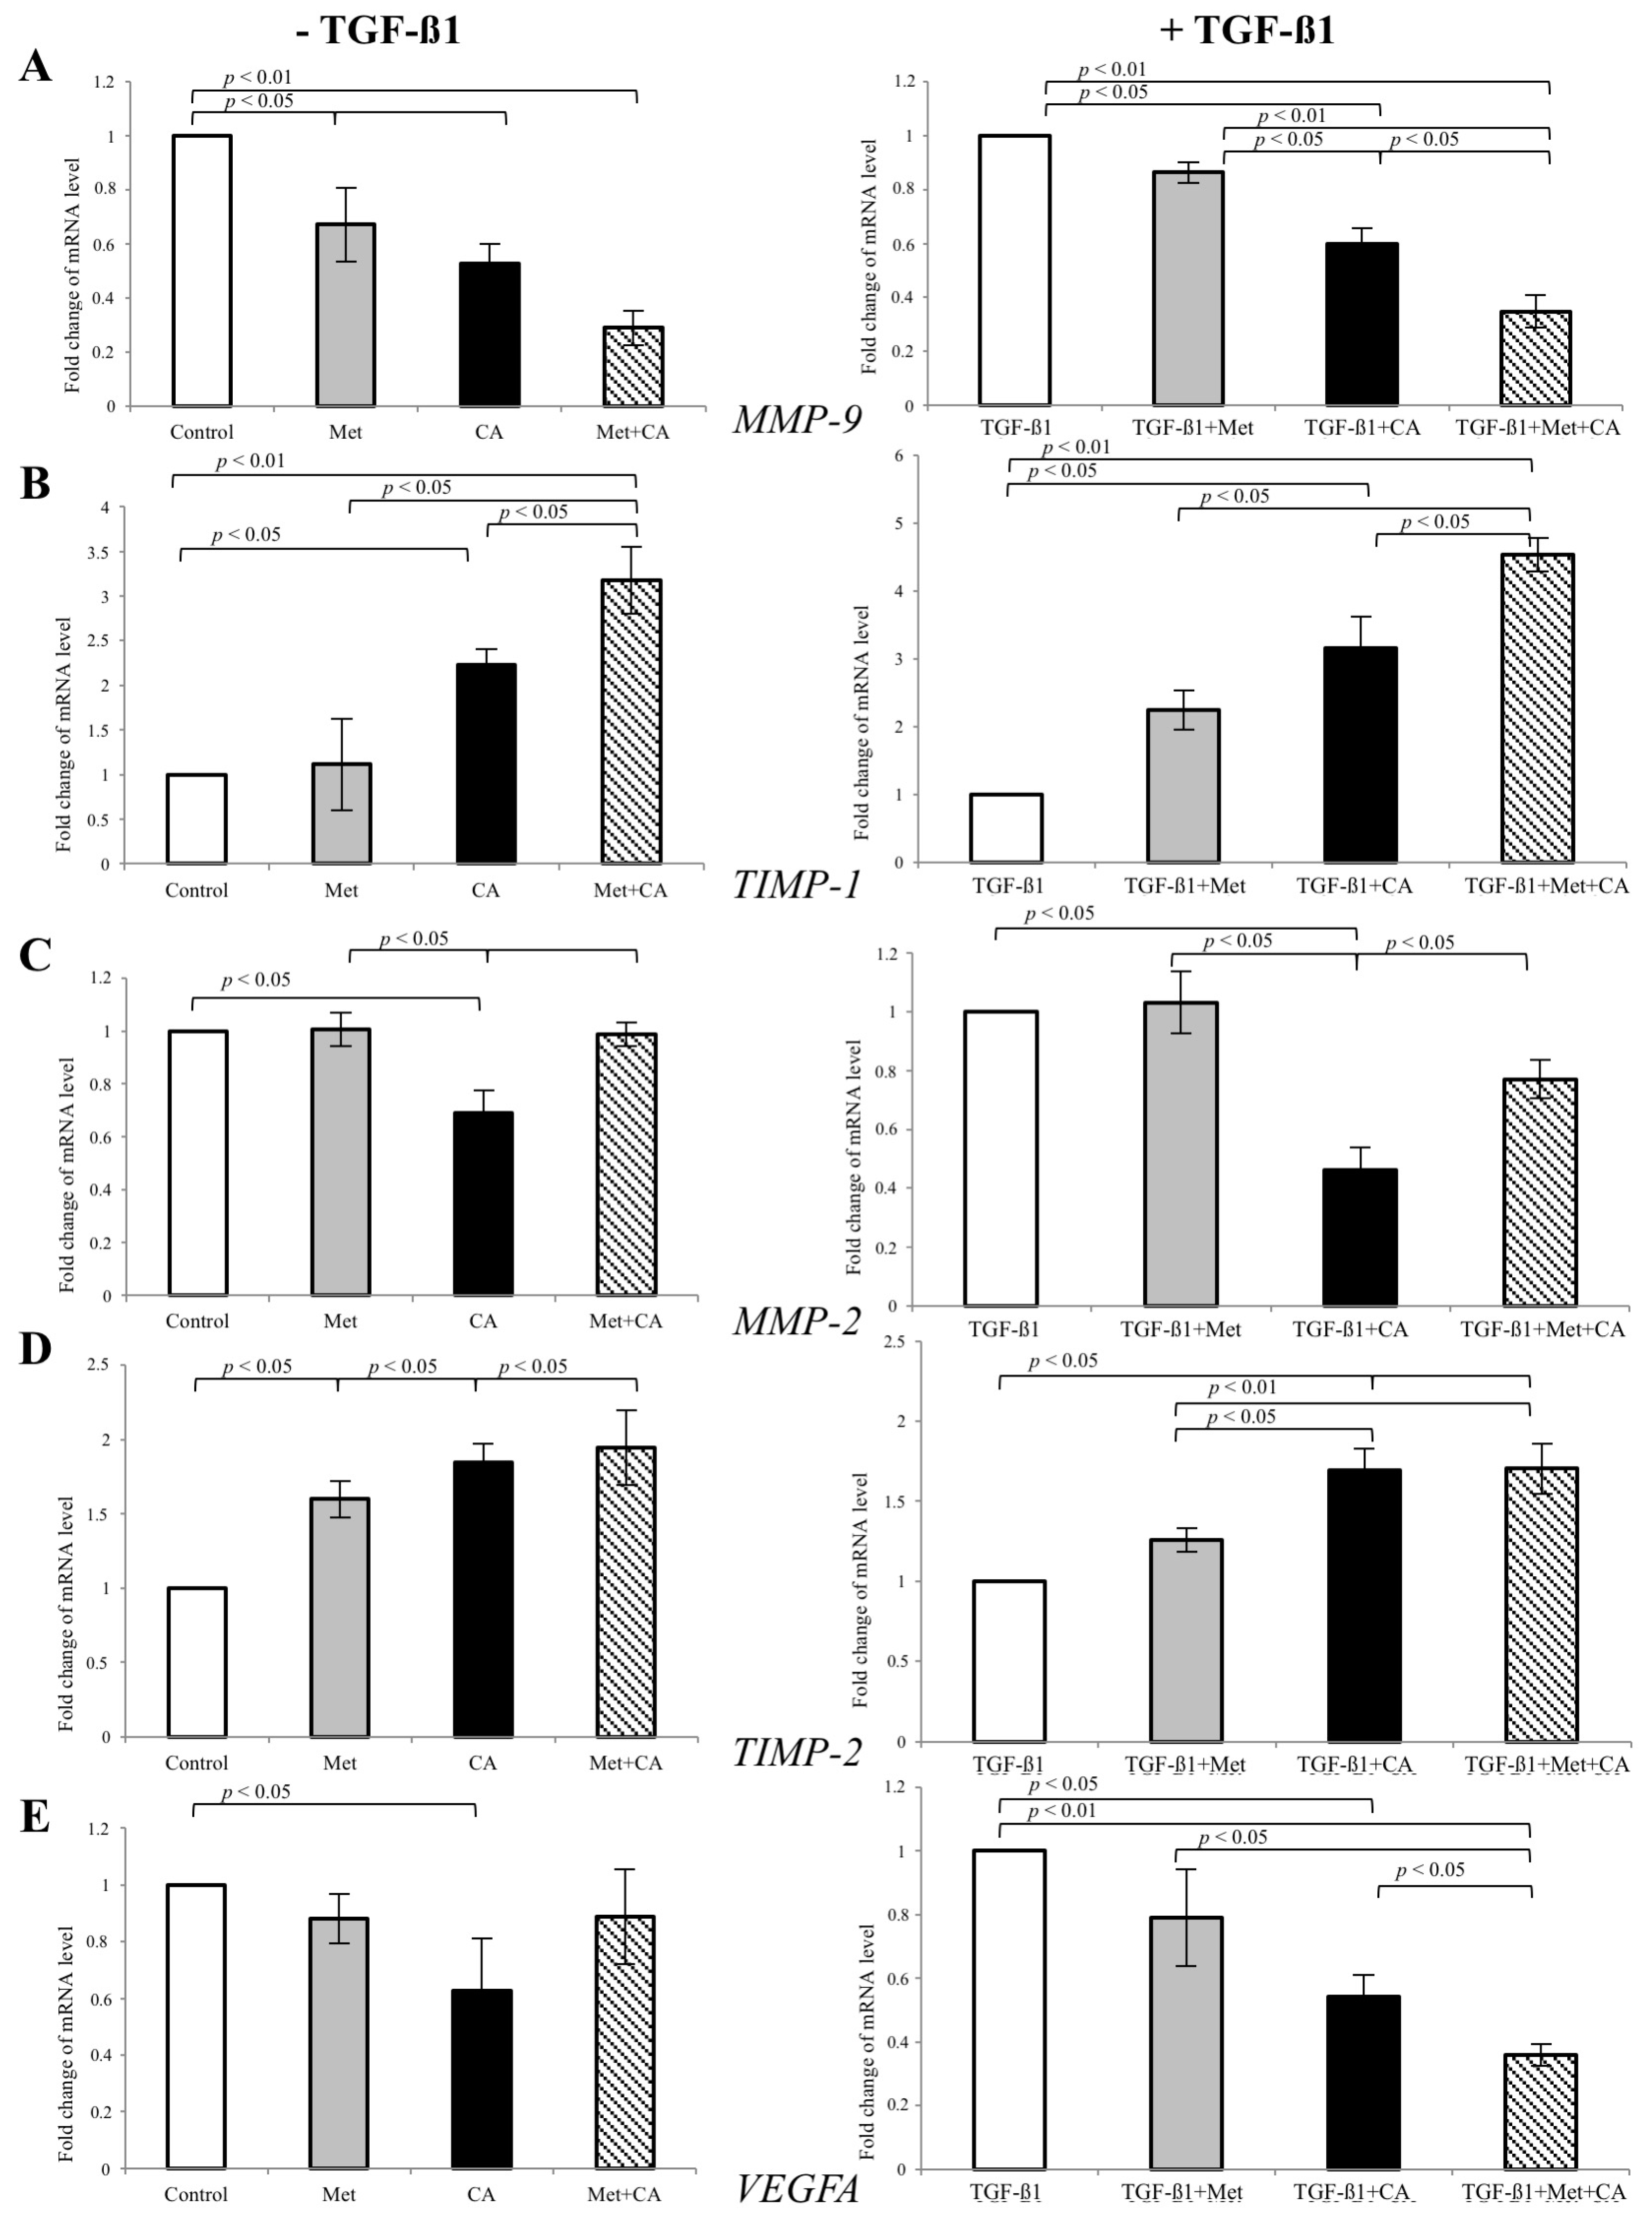
2.4. CA Downregulate the Expression of MMP-9 and Specific Tissue Inhibitor of Matrix Metalloproteinases TIMP-1 in C4-I Cells
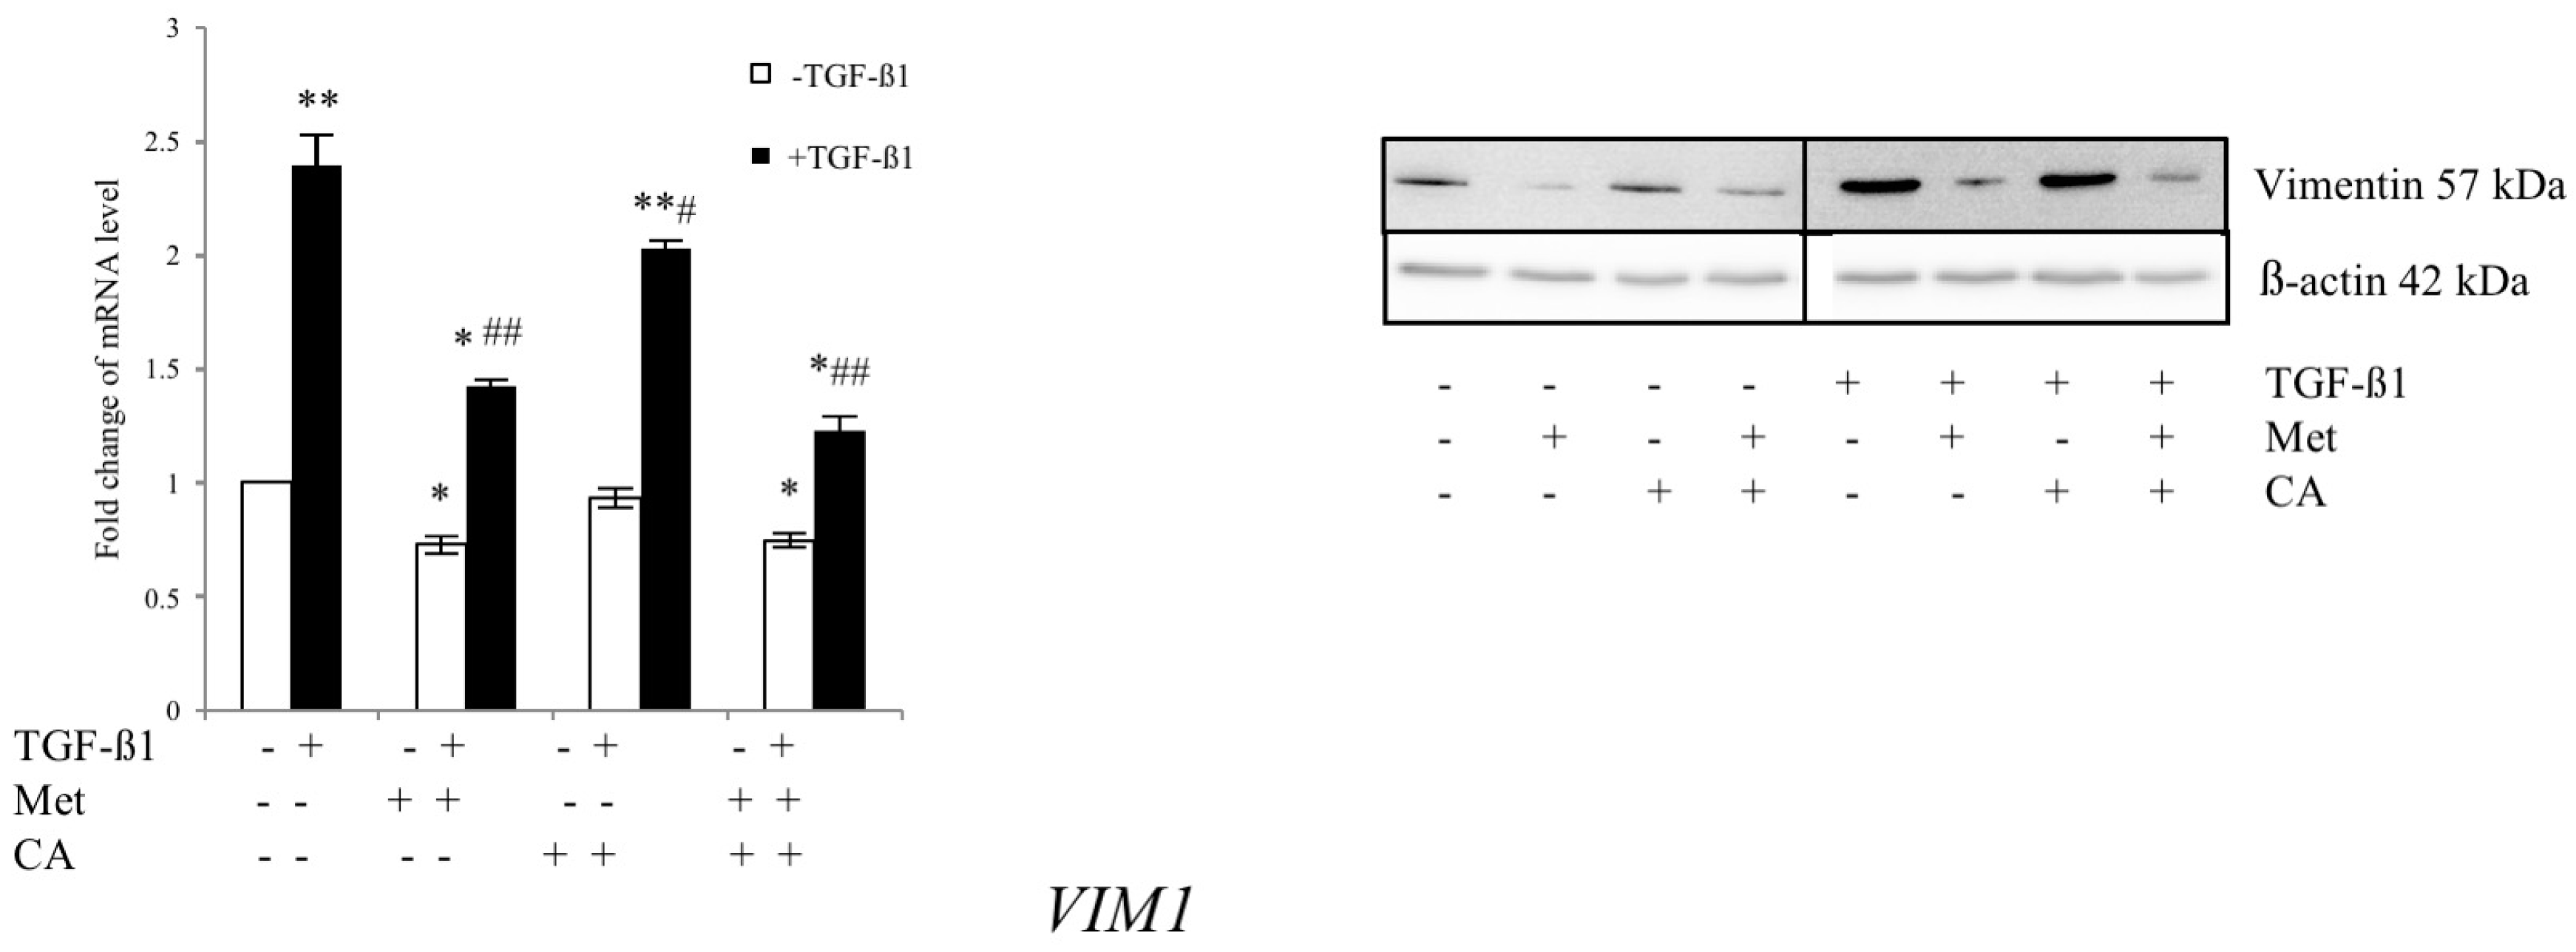
2.5. Met Attenuates Mesenchymal Marker of Malignant HTB-35 Cells
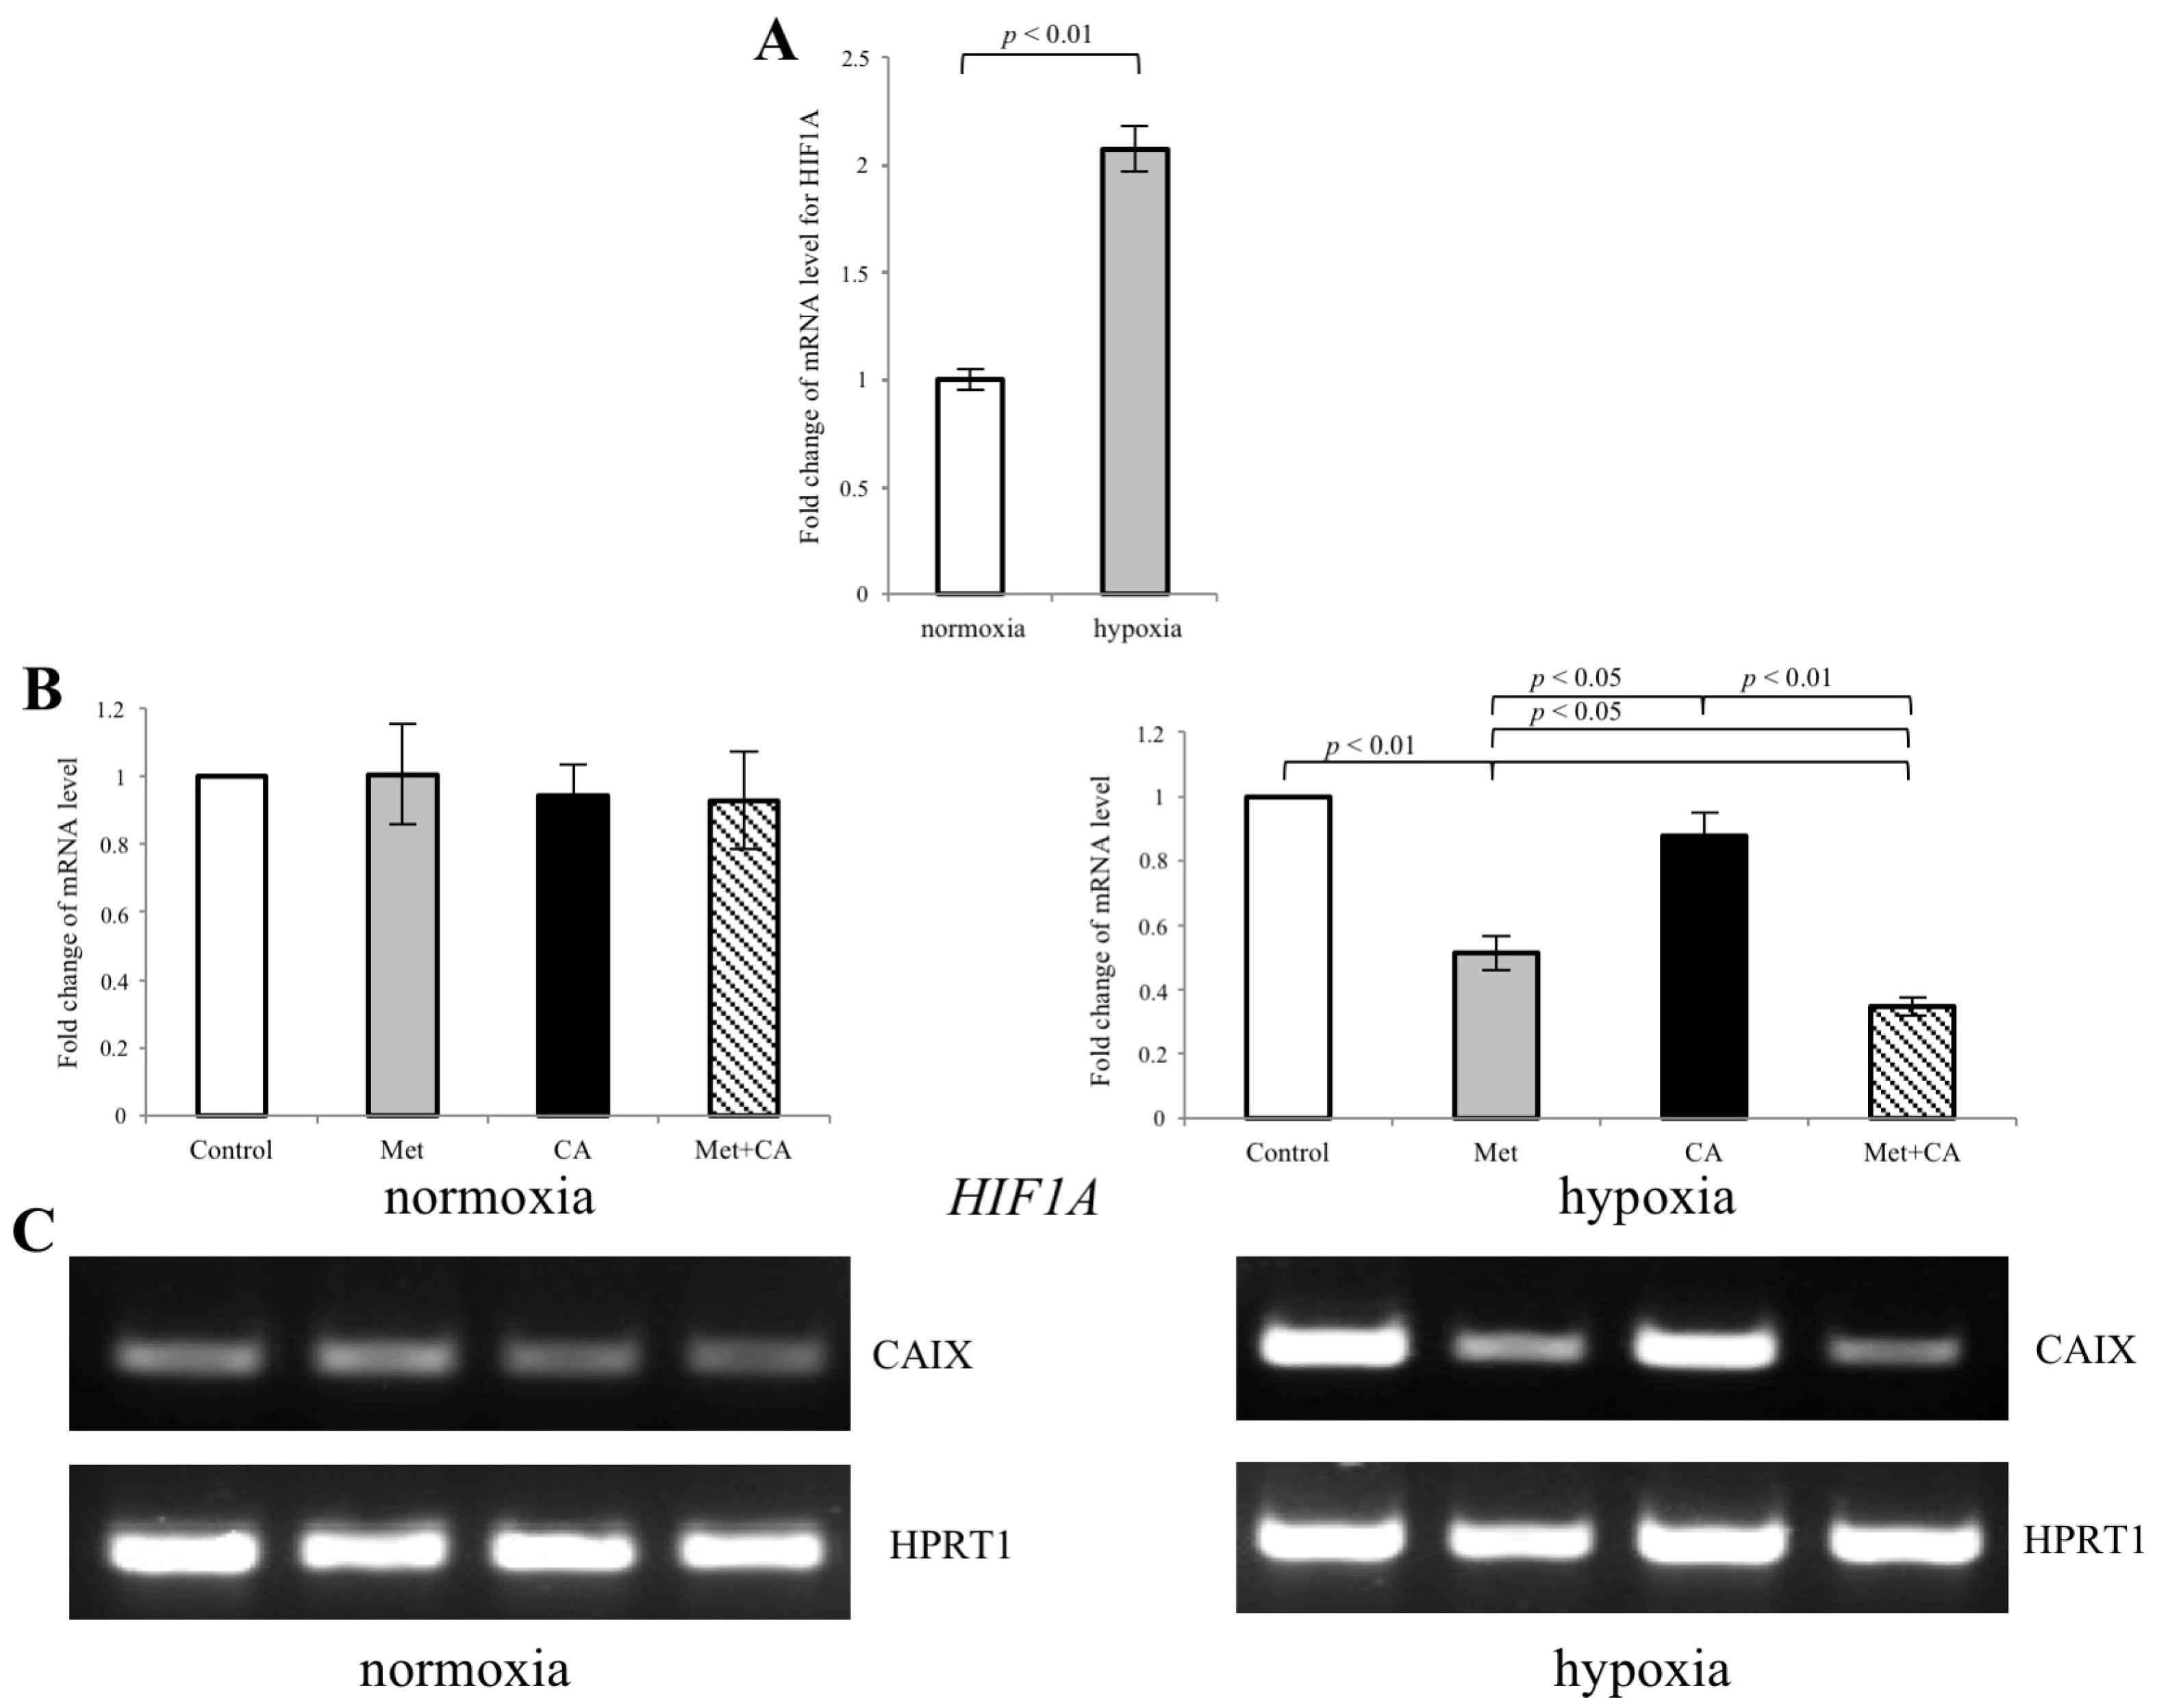
2.6. Met Inhibits the Expression of CAIX in HTB-35 Cells under Hypoxic Conditions
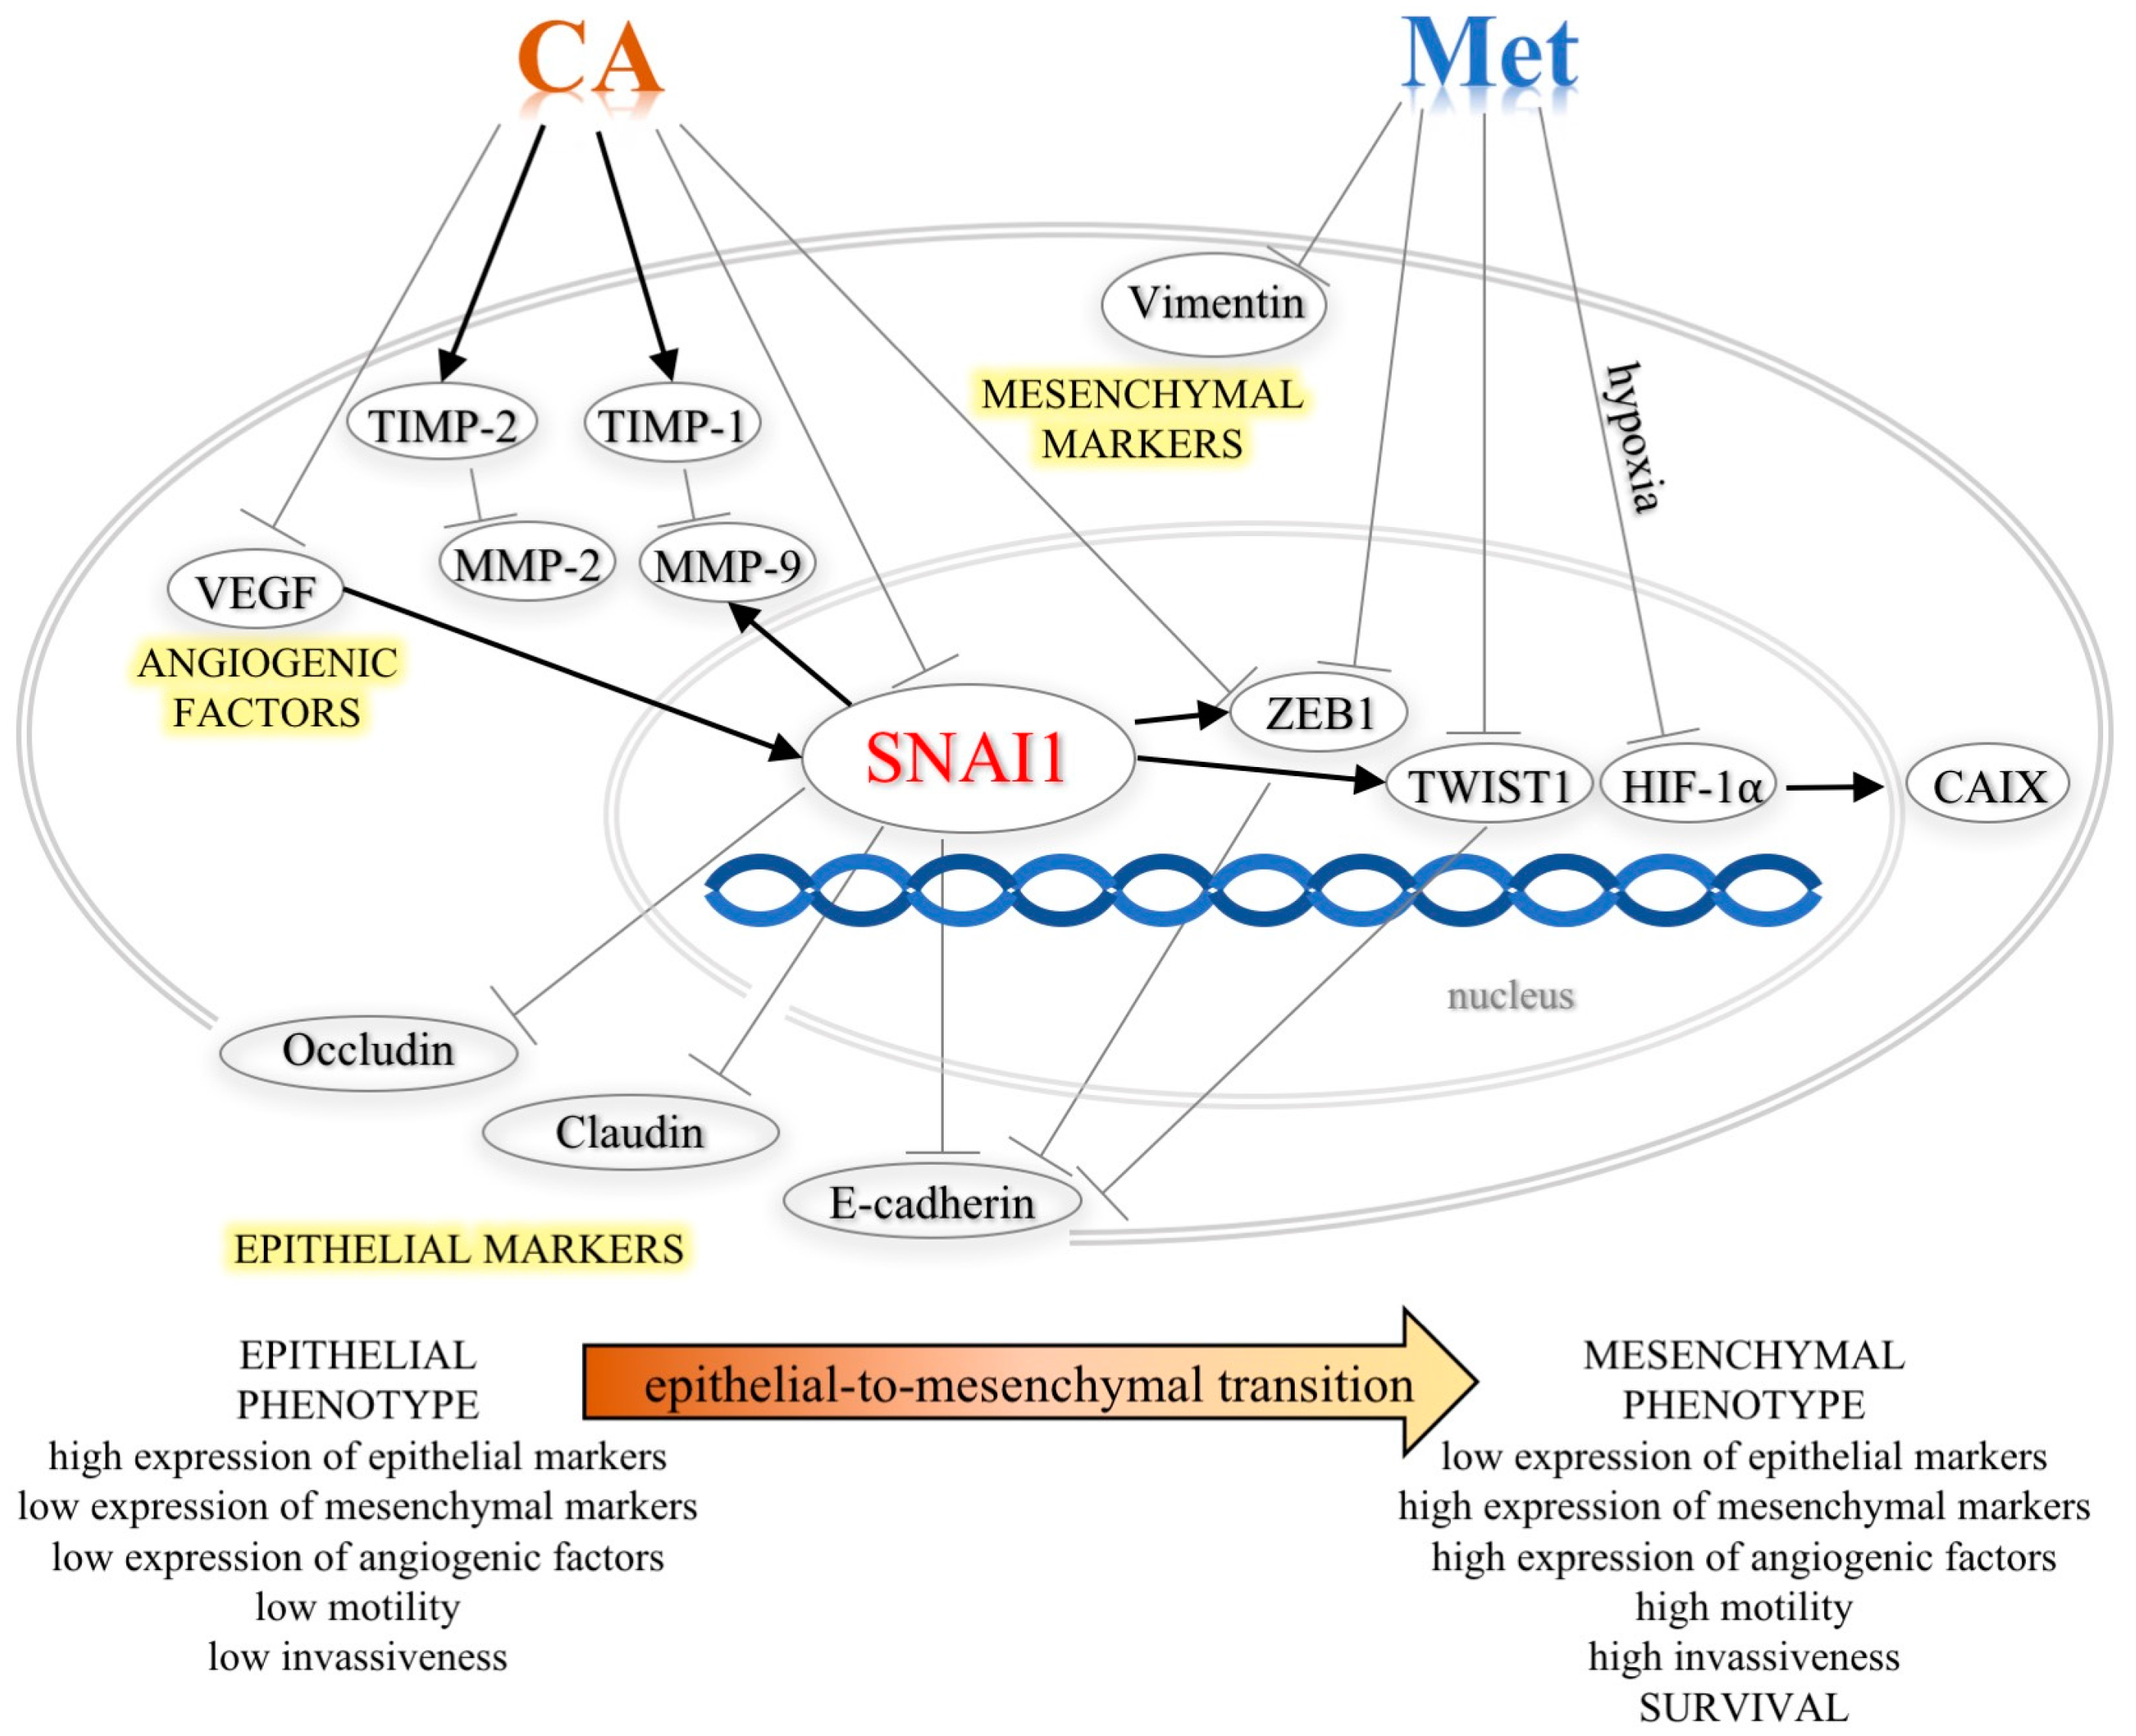
3. Discussion
4. Materials and Methods
4.1. Cell Culture and Treatment
4.2. Immunoblotting
4.3. Quantitative Polymerase Chain Reaction (qPCR)
4.4. Wound Healing Migration
4.5. Hypoxia Conditions
4.6. Reverse Transcription-Polymerase Chain Reaction (RT-PCR)
4.7. Statistical Analysis
5. Conclusions
Supplementary Materials
Acknowledgments
Author Contributions
Conflicts of Interest
References
- Lee, M.Y.; Shen, M.R. Epithelial-mesenchymal transition in cervical carcinoma. Am. J. Transl. Res. 2012, 4, 1–13. [Google Scholar] [PubMed]
- Vessey, C.; Wilding, J.; Folarin, N.; Hirano, S.; Takeichi, M.; Soutter, P.; Stamp, G.; Pignatelli, M. Altered expression and function of E-cadherin in cervical intraepithelial neoplasia and invasive squamous cell carcinoma. J. Pathol. 1995, 176, 151–159. [Google Scholar] [CrossRef] [PubMed]
- Cheng, K.; Hao, M. Metformin Inhibits TGF-β1-Induced Epithelial-to-Mesenchymal Transition via PKM2 Relative-mTOR/p70s6k Signaling Pathway in Cervical Carcinoma Cells. Int. J. Mol. Sci. 2016, 17, 2000. [Google Scholar] [CrossRef] [PubMed]
- Kalluri, R.; Weinberg, R.A. The basics of epithelial-mesenchymal transition. J. Clin. Investig. 2009, 119, 1420–1428. [Google Scholar] [CrossRef] [PubMed]
- Tseng, J.; Lin, C.; Su, L.; Fu, H.; Yang, S.; Chuu, C. CAPE suppresses migration and invasion of prostate cancer cells via activation of non-canonical Wnt signaling. Oncotarget 2016, 7, 38010–38024. [Google Scholar] [CrossRef] [PubMed]
- Dziedzic, A.; Kubina, R.; Kabała-Dzik, A.; Wojtyczka, R.D.; Morawiec, T.; Bułdak, R.J. Caffeic acid reduces the viability and migration rate of oral carcinoma cells (SCC-25) exposed to low concentrations of ethanol. Int. J. Mol. Sci. 2014, 15, 18725–18741. [Google Scholar] [CrossRef] [PubMed]
- Yang, Y.; Li, Y.; Wang, K.; Wang, Y.; Yin, W.; Li, L. P38/NF-κB/snail pathway is involved in caffeic acid-induced inhibition of cancer stem cells-like properties and migratory capacity in malignant human keratinocyte. PLoS ONE 2013, 8, e58915. [Google Scholar] [CrossRef] [PubMed]
- Sirota, R.; Gibson, D.; Kohen, R. The timing of caffeic acid treatment with cisplatin determines sensitization or resistance of ovarian carcinoma cell lines. Redox Biol. 2017, 11, 170–175. [Google Scholar] [CrossRef] [PubMed]
- Kuo, Y.Y.; Lin, H.P.; Huo, C.; Su, L.C.; Yang, J.; Hsiao, P.H.; Chiang, H.C.; Chung, C.J.; Wang, H.D.; Chang, J.Y.; et al. Caffeic acid phenethyl ester suppresses proliferation and survival of TW2.6 human oral cancer cells via inhibition of Akt signaling. Int. J. Mol. Sci. 2013, 14, 8801–8817. [Google Scholar] [CrossRef] [PubMed]
- Cai, H.; Huang, X.; Xu, S.; Shen, H.; Zhang, P.; Huang, Y.; Jiang, J.; Sun, Y.; Jiang, B.; Wu, X.; et al. Discovery of novel hybrids of diaryl-1,2,4-triazoles and caffeic acid as dual inhibitors of cyclooxygenase-2 and 5-lipoxygenase for cancer therapy. Eur. J. Med. Chem. 2016, 108, 89–103. [Google Scholar] [CrossRef] [PubMed]
- Kao, H.; Chang-Chien, P.; Chang, W.; Yeh, T.; Wang, J. Propolis inhibits TGF-β1-induced epithelial-mesenchymal transition in human alveolar epithelial cells via PPARγ activation. Int. Immunopharmacol. 2013, 3, 565–574. [Google Scholar] [CrossRef] [PubMed]
- Imai, A.; Ichigo, S.; Matsunami, K.; Takagi, H.; Yasuda, K. Clinical benefits of metformin in gynecologic oncology. Oncol. Lett. 2015, 10, 577–582. [Google Scholar] [CrossRef] [PubMed]
- Del Barco, S.; Vazquez-Martin, A.; Cufí, S.; Oliveras-Ferraros, C.; Bosch-Barrer, J.; Joven, J.; Martin-Castillo, B.; Menendez, J. Metformin: Multi-faceted protection against cancer. Oncotarget 2011, 2, 896–917. [Google Scholar] [CrossRef] [PubMed]
- Auersperg, N. Histogenetic behavior of tumors. I. Morphologic variation in vitro and in vivo of two related human carcinoma cell lines. J. Natl. Cancer Inst. 1969, 43, 151–173. [Google Scholar] [PubMed]
- Sedlakova, O.; Svastova, E.; Takacova, M.; Kopacek, J.; Pastorek, J.; Pastorekova, S. Carbonic anhydrase IX, a hypoxia-induced catalytic component of the pH regulating machinery in tumors. Front. Physiol. 2014, 4, e400. [Google Scholar] [CrossRef] [PubMed]
- Svastova, E.; Pastorekova, S. Carbonic anhydrase IX: A hypoxia-controlled “catalyst” of cell migration. Cell Adh. Migr. 2013, 7, 226–231. [Google Scholar] [CrossRef] [PubMed]
- Kalluri, R. EMT: When epithelial cells decide to become mesenchymal-like cells. J. Clin. Investig. 2009, 119, 1417–1419. [Google Scholar] [CrossRef] [PubMed]
- Carlson, M.W.; Iyer, V.R.; Marcotte, E.M. Quantitative gene expression assessment identifies appropriate cell line models for individual cervical cancer pathways. BMC Genom. 2007, 10, 2–13. [Google Scholar] [CrossRef] [PubMed]
- Lee, J.M.; Dedhar, S.; Kalluri, R.; Thompson, E.W. The epithelial-mesenchymal transition: New insights in signaling, development, and disease. J. Cell Biol. 2006, 172, 973–981. [Google Scholar] [CrossRef] [PubMed]
- Miekus, K.; Pawlowska, M.; Sekuła, M.; Drabik, G.; Madeja, Z.; Adamek, D.; Majka, M. MET receptor is a potential therapeutic target in high grade cervical cancer. Oncotarget 2015, 12, 10086–10101. [Google Scholar] [CrossRef] [PubMed]
- Katsuno, Y.; Lamouille, S.; Derynck, R. TGF-β signaling and epithelial-mesenchymal transition in cancer progression. Curr. Opin. Oncol. 2013, 25, 76–84. [Google Scholar] [CrossRef] [PubMed]
- Zeisberg, M.; Neilson, E.G. Biomarkers for epithelial-mesenchymal transitions. Cell 2009, 119, 1429–1437. [Google Scholar] [CrossRef] [PubMed]
- Hu, D.; Zhou, J.; Wang, F.; Shi, H.; Li, Y.; Li, B. HPV-16 E6/E7 promotes cell migration and invasion in cervical cancer via regulating cadherin switch in vitro and in vivo. Arch. Gynecol. Obstet. 2015, 292, 1345–1354. [Google Scholar] [CrossRef] [PubMed]
- Chang, B.; Kim, J.; Jeong, D.; Jeong, Y.; Jeon, S.; Jung, S.; Yang, Y.; Kim, K.; Lim, J.; Kim, C.; et al. Klotho inhibits the capacity of cell migration and invasion in cervical cancer. Oncol. Rep. 2012, 28, 1022–1028. [Google Scholar] [CrossRef] [PubMed]
- Meng, F.; Wu, G. The rejuvenated scenario of epithelial-mesenchymal transition (EMT) and cancer metastasis. Cancer Metastasis Rev. 2012, 31, 455–467. [Google Scholar] [CrossRef] [PubMed]
- Wahdan-Alaswad, R.; Harrell, J.; Fan, Z.; Edgerton, S.; Liu, B.; Thor, A. Metformin attenuates transforming growth factor beta (TGF-β) mediated oncogenesis in mesenchymal stem-like/claudin-low triple negative breast cancer. Cell Cycle 2016, 8, 1046–1059. [Google Scholar] [CrossRef] [PubMed]
- Wu, W.S.; You, R.I.; Cheng, C.C.; Lee, M.C.; Lin, T.Y.; Hu, C.T. Snail collaborates with EGR-1 and SP-1 to directly activate transcription of MMP 9 and ZEB1. Sci. Rep. 2017, 7, 17753. [Google Scholar] [CrossRef] [PubMed]
- Zavadil, J.; Böttinger, E.P. TGF-β and epithelial-to-mesenchymal transitions. Oncogene 2005, 24, 5764–5774. [Google Scholar] [CrossRef] [PubMed]
- Stanciu, A.; Zamfir-Chiru-Anton, A.; Stanciu, M.; Popescu, C.; Gheorghe, D. Imbalance between Matrix Metalloproteinases and Tissue Inhibitors of Metalloproteinases Promotes Invasion and Metastasis of Head and Neck Squamous Cell Carcinoma. Clin. Lab. 2017, 63, 1613–1620. [Google Scholar] [CrossRef] [PubMed]
- Roomi, M.; Kalinovsky, T.; Rath, M.; Niedzwiecki, A. Modulation of u-PA, MMPs and their inhibitors by a novel nutrient mixture in human female cancer cell lines. Oncol. Rep. 2012, 28, 768–776. [Google Scholar] [CrossRef] [PubMed]
- Jin, U.; Lee, J.; Kang, S.; Kim, J.; Park, W.; Kim, J.; Moon, S.; Kim, C. A phenolic compound, 5-caffeoylquinic acid (chlorogenic acid), is a new type and strong matrix metalloproteinase-9 inhibitor: Isolation and identification from methanol extract of Euonymus alatus. Life Sci. 2005, 77, 2760–2769. [Google Scholar] [CrossRef] [PubMed]
- Mahecha, A.; Wang, H. The influence of vascular endothelial growth factor-A and matrix metalloproteinase-2 and -9 in angiogenesis, metastasis, and prognosis of endometrial cancer. Onco Targets Ther. 2017, 10, 4617–4624. [Google Scholar] [CrossRef] [PubMed]
- Wanami, L.S.; Chen, H.Y.; Peiró, S.; García de Herreros, A.; Bachelder, R.E. Vascular endothelial growth factor-A stimulates Snail expression in breast tumor cells: Implications for tumor progression. Exp. Cell Res. 2008, 314, 2448–2453. [Google Scholar] [CrossRef] [PubMed]
- Olive, P.; Aquino-Parsons, C.; MacPhail, S.; Liao, S.; Raleigh, J.; Lerman, M.; Stanbridge, E. Carbonic anhydrase 9 as an endogenous marker for hypoxic cells in cervical cancer. Cancer Res. 2001, 61, 8924–8929. [Google Scholar] [PubMed]
- Andreucci, E.; Peppicelli, S.; Carta, F.; Brisotto, G.; Biscontin, E.; Ruzzolini, J.; Bianchini, F.; Biagioni, A.; Supuran, C.; Calorini, L. Carbonic anhydrase IX inhibition affects viability of cancer cells adapted to extracellular acidosis. J. Mol. Med. 2017, 95, 1341–1353. [Google Scholar] [CrossRef] [PubMed]
- Pastorek, J.; Pastorekova, S. Hypoxia-induced carbonic anhydrase IX as a target for cancer therapy: From biology to clinical use. Semin. Cancer Biol. 2015, 31, 52–64. [Google Scholar] [CrossRef] [PubMed]
- Karthikeyan, S.; Kanimozhi, G.; Prasad, N.R.; Mahalakshmi, R. Radiosensitizing effect of ferulic acid on human cervical carcinoma cells in vitro. Toxicol. In Vitro 2011, 25, 1366–1375. [Google Scholar] [CrossRef] [PubMed]
- Lopez, J.S.; Banerji, U. Combine and conquer: Challenges for targeted therapy combinations in early phase trials. Nat. Rev. Clin. Oncol. 2017, 14, 57–66. [Google Scholar] [CrossRef] [PubMed]
- Tyszka-Czochara, M.; Bukowska-Strakova, K.; Majka, M. Metformin and caffeic acid regulate metabolic reprogramming in human cervical carcinoma SiHa/HTB-35 cells and augment anticancer activity of Cisplatin via cell cycle regulation. Food Chem. Toxicol. 2017, 106, 260–272. [Google Scholar] [CrossRef] [PubMed]
- Tyszka-Czochara, M.; Konieczny, P.; Majka, M. Caffeic Acid Expands Anti-Tumor Effect of Metformin in Human Metastatic Cervical Carcinoma HTB-34 Cells: Implications of AMPK Activation and Impairment of Fatty Acids De Novo Biosynthesis. Int. J. Mol. Sci. 2017, 18, 462. [Google Scholar] [CrossRef] [PubMed]
- Skrzypek, K.; Kusienicka, A.; Szewczyk, B.; Adamus, T.; Lukasiewicz, E.; Miekus, K.; Majka, M. Constitutive activation of MET signaling impairs myogenic differentiation of rhabdomyosarcoma and promotes its development and progression. Oncotarget 2015, 6, 31378–31398. [Google Scholar] [CrossRef] [PubMed]


© 2018 by the authors. Licensee MDPI, Basel, Switzerland. This article is an open access article distributed under the terms and conditions of the Creative Commons Attribution (CC BY) license (http://creativecommons.org/licenses/by/4.0/).
Share and Cite
Tyszka-Czochara, M.; Lasota, M.; Majka, M. Caffeic Acid and Metformin Inhibit Invasive Phenotype Induced by TGF-β1 in C-4I and HTB-35/SiHa Human Cervical Squamous Carcinoma Cells by Acting on Different Molecular Targets. Int. J. Mol. Sci. 2018, 19, 266. https://0-doi-org.brum.beds.ac.uk/10.3390/ijms19010266
Tyszka-Czochara M, Lasota M, Majka M. Caffeic Acid and Metformin Inhibit Invasive Phenotype Induced by TGF-β1 in C-4I and HTB-35/SiHa Human Cervical Squamous Carcinoma Cells by Acting on Different Molecular Targets. International Journal of Molecular Sciences. 2018; 19(1):266. https://0-doi-org.brum.beds.ac.uk/10.3390/ijms19010266
Chicago/Turabian StyleTyszka-Czochara, Malgorzata, Malgorzata Lasota, and Marcin Majka. 2018. "Caffeic Acid and Metformin Inhibit Invasive Phenotype Induced by TGF-β1 in C-4I and HTB-35/SiHa Human Cervical Squamous Carcinoma Cells by Acting on Different Molecular Targets" International Journal of Molecular Sciences 19, no. 1: 266. https://0-doi-org.brum.beds.ac.uk/10.3390/ijms19010266