Article

Differential Effect of Cobalt and Chromium Ions as Well as CoCr Particles on the Expression of Osteogenic Markers and Osteoblast Function

by
Andreas Drynda
1,†,
Susanne Drynda
1,2,†,
Jörn Kekow
2,
Christoph Hubertus Lohmann
1 and
Jessica Bertrand
1,*
1
Department of Orthopaedic Surgery, Otto-von-Guericke University, Leipziger Straße 44, D-39120 Magdeburg, Germany
2
Clinic for Rheumatology, Otto-von-Guericke University, Leipziger Straße 44, D-39120 Magdeburg, Germany
*
Author to whom correspondence should be addressed.
These authors contributed equally to this work.
Int. J. Mol. Sci. 2018, 19(10), 3034; https://0-doi-org.brum.beds.ac.uk/10.3390/ijms19103034
Submission received: 25 September 2018 / Revised: 30 September 2018 / Accepted: 1 October 2018 / Published: 5 October 2018
(This article belongs to the Special Issue Effects of Metal Ion Exposure from Joint Prostheses on Organ Systems)

Abstract

:
The balance of bone formation and resorption is the result of a regulated crosstalk between osteoblasts, osteoclasts, and osteocytes. Inflammation, mechanical load, and external stimuli modulate this system. Exposure of bone cells to metal ions or wear particles are thought to cause osteolysis via activation of osteoclasts and inhibition of osteoblast activity. Co2+ ions have been shown to impair osteoblast function and the expression of the three transforming growth factor (TGF)-β isoforms. The current study was performed to analyze how Co2+ and Cr3+ influence the expression, proliferation, and migration profile of osteoblast-like cells. The influence of Co2+, Cr3+, and CoCr particles on gene expression was analyzed using an osteogenesis PCR Array. The expression of different members of the TGF-β signaling cascade were down-regulated by Co2+, as well as several TGF-β regulated collagens, however, Cr3+ had no effect. CoCr particles partially affected similar genes as the Co2+treatment. Total collagen production of Co2+ treated osteoblasts was reduced, which can be explained by the reduced expression levels of various collagens. While proliferation of MG63 cells appears unaffected by Co2+, the migration capacity was impaired. Our data may improve the knowledge of changes in gene expression patterns, and the proliferation and migration effects caused by artificial materials.

1. Introduction

Total hip arthroplasty (THA) is an effective and safe technique to treat degenerative, post-traumatic, and other diseases of the hip joint. One of the main reasons for a limited lifespan of THAs is aseptic loosening due to increased bone resorption [1,2]. The tight regulation of bone formation and resorption is therefore of great importance to ensure the THA function. Osteoblast activity is important during implant ingrowth and the prevention of implant loosening, which requires mature osteoblasts to deposit bone with remarkable spatial precision.
Many metal implant devices used in orthopaedic surgery are manufactured from cobalt and chromium alloys. Metal particles can be degraded into their respective ions in periprosthetic tissue [3,4,5]. Abrasive wear particles liberated from the articulation surfaces or cone-taper connections of metal-containing implants can induce adverse biological reactions in periprosthetic tissue as well as systemic effects caused by released metal ions (Co2+/Cr3+) and metal degradation products (e.g., oxides, insoluble metal salts, and metal-protein complexes) [6,7,8]. Particles and metal ions affect the cells of the surrounding tissues, including immune cells (lymphocytes, macrophages), bone cells (osteoblasts, osteoclasts), and fibroblasts [9]. These abrasive wear particles are thought to induce osteolysis by shifting the sensitive balance of bone homeostasis towards bone resorption or reduced osteoblast activity. The exact mechanisms of this interaction are only partially understood.
Bone homeostasis is tightly regulated by growth factors, cytokines, hormones, mechanical load, and other variables. Among these factors, transforming growth factor (TGF)-β and bone marrow proteins (BMPs) play an important role. BMP morphogen gradients regulate bone formation during embryogenesis [10]. Disruptions of TGF-β/BMP signaling have been implicated in multiple bone diseases including tumor metastasis [11]. It is known that TGF-β activates COL1A1 synthesis thereby providing the matrix for mineralization and bone formation [12,13]. Bone tissue is mainly composed of type I collagen, which is also thought to be a marker for osteoblast activity [14]. However, other collagens are also expressed in bone tissue to a smaller amount contributing either to the mechanical properties of the bone or regulating bioavailability of morphogens and cytokines. One of these collagens is type III collagen (Col3), which can be found in heterotypic fibrils with type I collagen (Col1) [15,16,17]. Other non-fibrilar collagens are also found in bone tissue, e.g., collagen XIV, which is found mainly in tissues containing type I collagen [18], and collagen XV which participates in extracellular matrix (ECM) organization in the early-phases of the osteogenic process and that is a prerequisite to promote the subsequent deposition of the mineral matrix [19]. The osteoblast, as the bone forming and remodelling cell, produces a variety of cytokines and chemokines, both under physiologic and pathological conditions regulating the osteoblast migration to the exact site of bone formation [20,21]. Alrabeah and co-workers demonstrated that Co2+ metal ions in the culture media induced the production of pro-inflammatory cytokines in human osteoblastic cells, thereby inducing a shift of bone homeostasis towards bone resorption [22]. Furthermore, it is known that Co2+ ions reduce the expression of all three TGF-β isoforms in osteosarcoma cell lines MG63 and SaOs-2 in a dose-dependent manner, with the strongest impact on TGF-β2 resulting in a change of the TGF-β isoform pattern [23]. It is still unknown whether these changes in the expression pattern of TGF-β isoforms are involved in the dysregulation of the periprosthetic bone metabolism and function of osteoblasts.
It was the aim of the study to investigate the effect of Co2+ and Cr3+ ions on signaling pathways of bone metabolism and osteoblast functions. We hypothesized that Co2+ and Cr3+ ions have different influence on cell migration and the expression of osteoblast related genes that may induce bone loss. Therefore, we used the osteoblast-like cell line MG63, stimulated these cells with Co2+ and Cr3+ ions (0–250 µM) as well as CoCr particles, and analyzed the migration properties and gene expression on a low density Profiler PCR Array.

2. Results

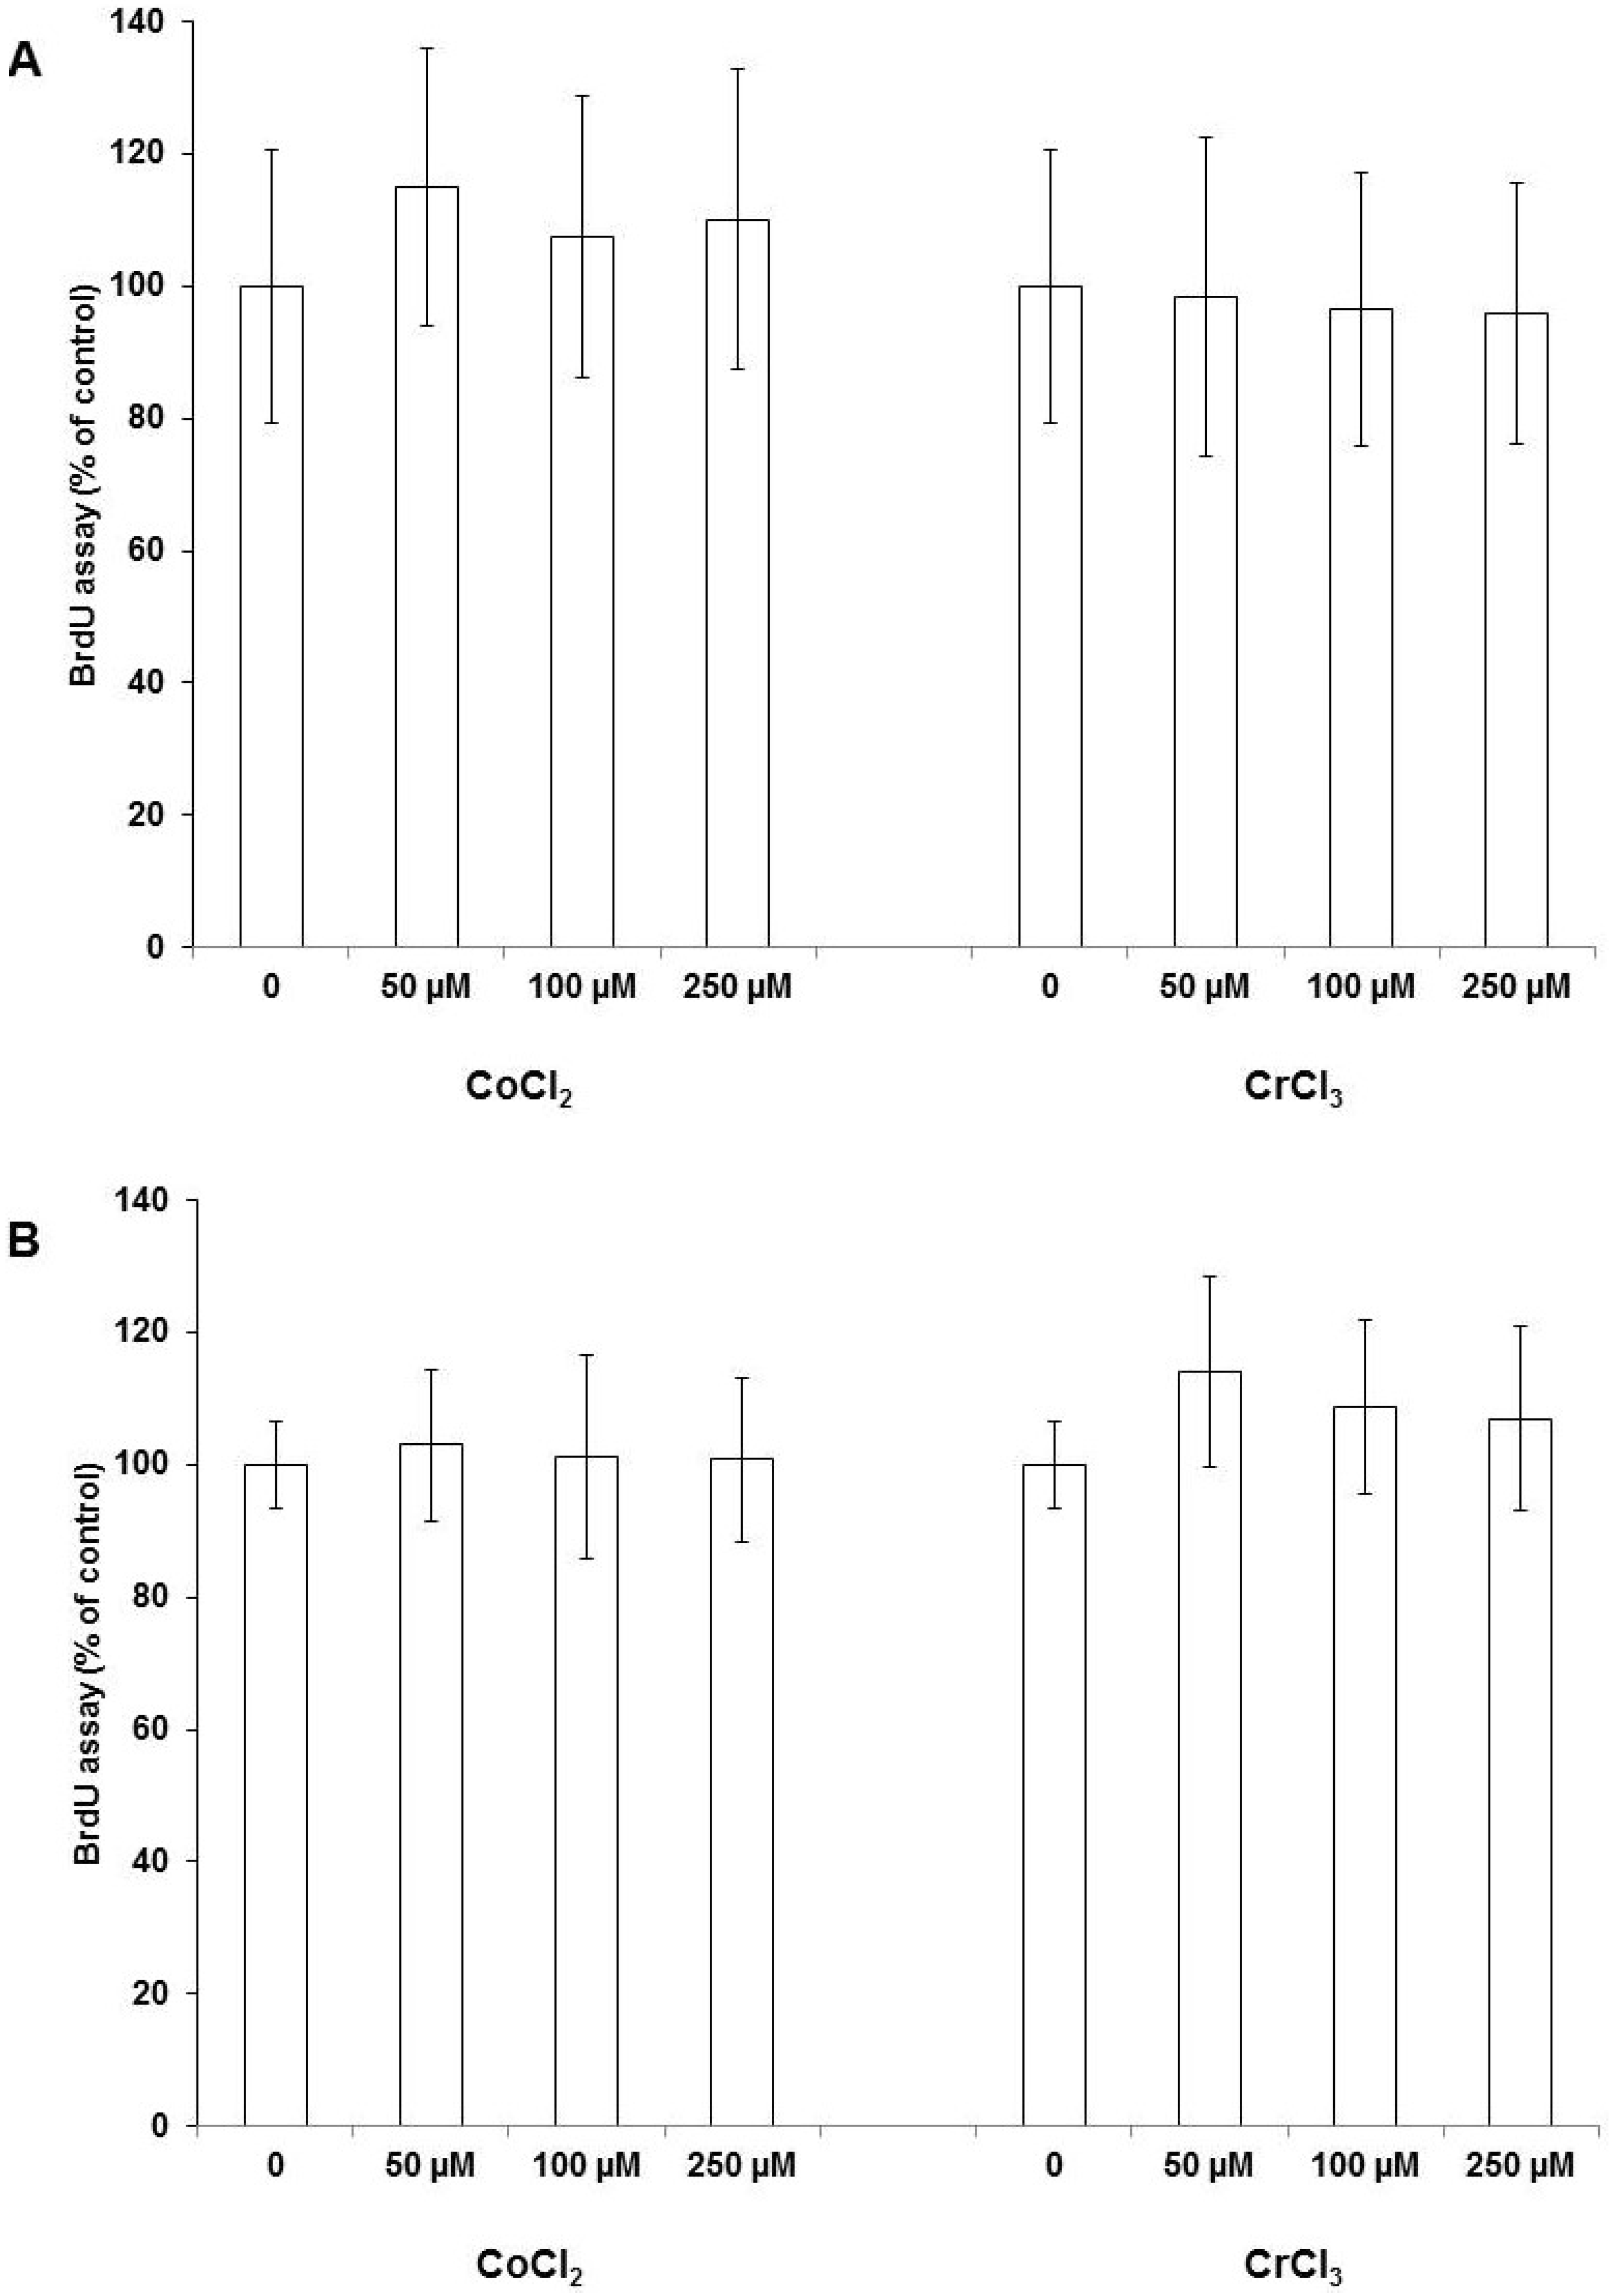
2.1. Cell Proliferation
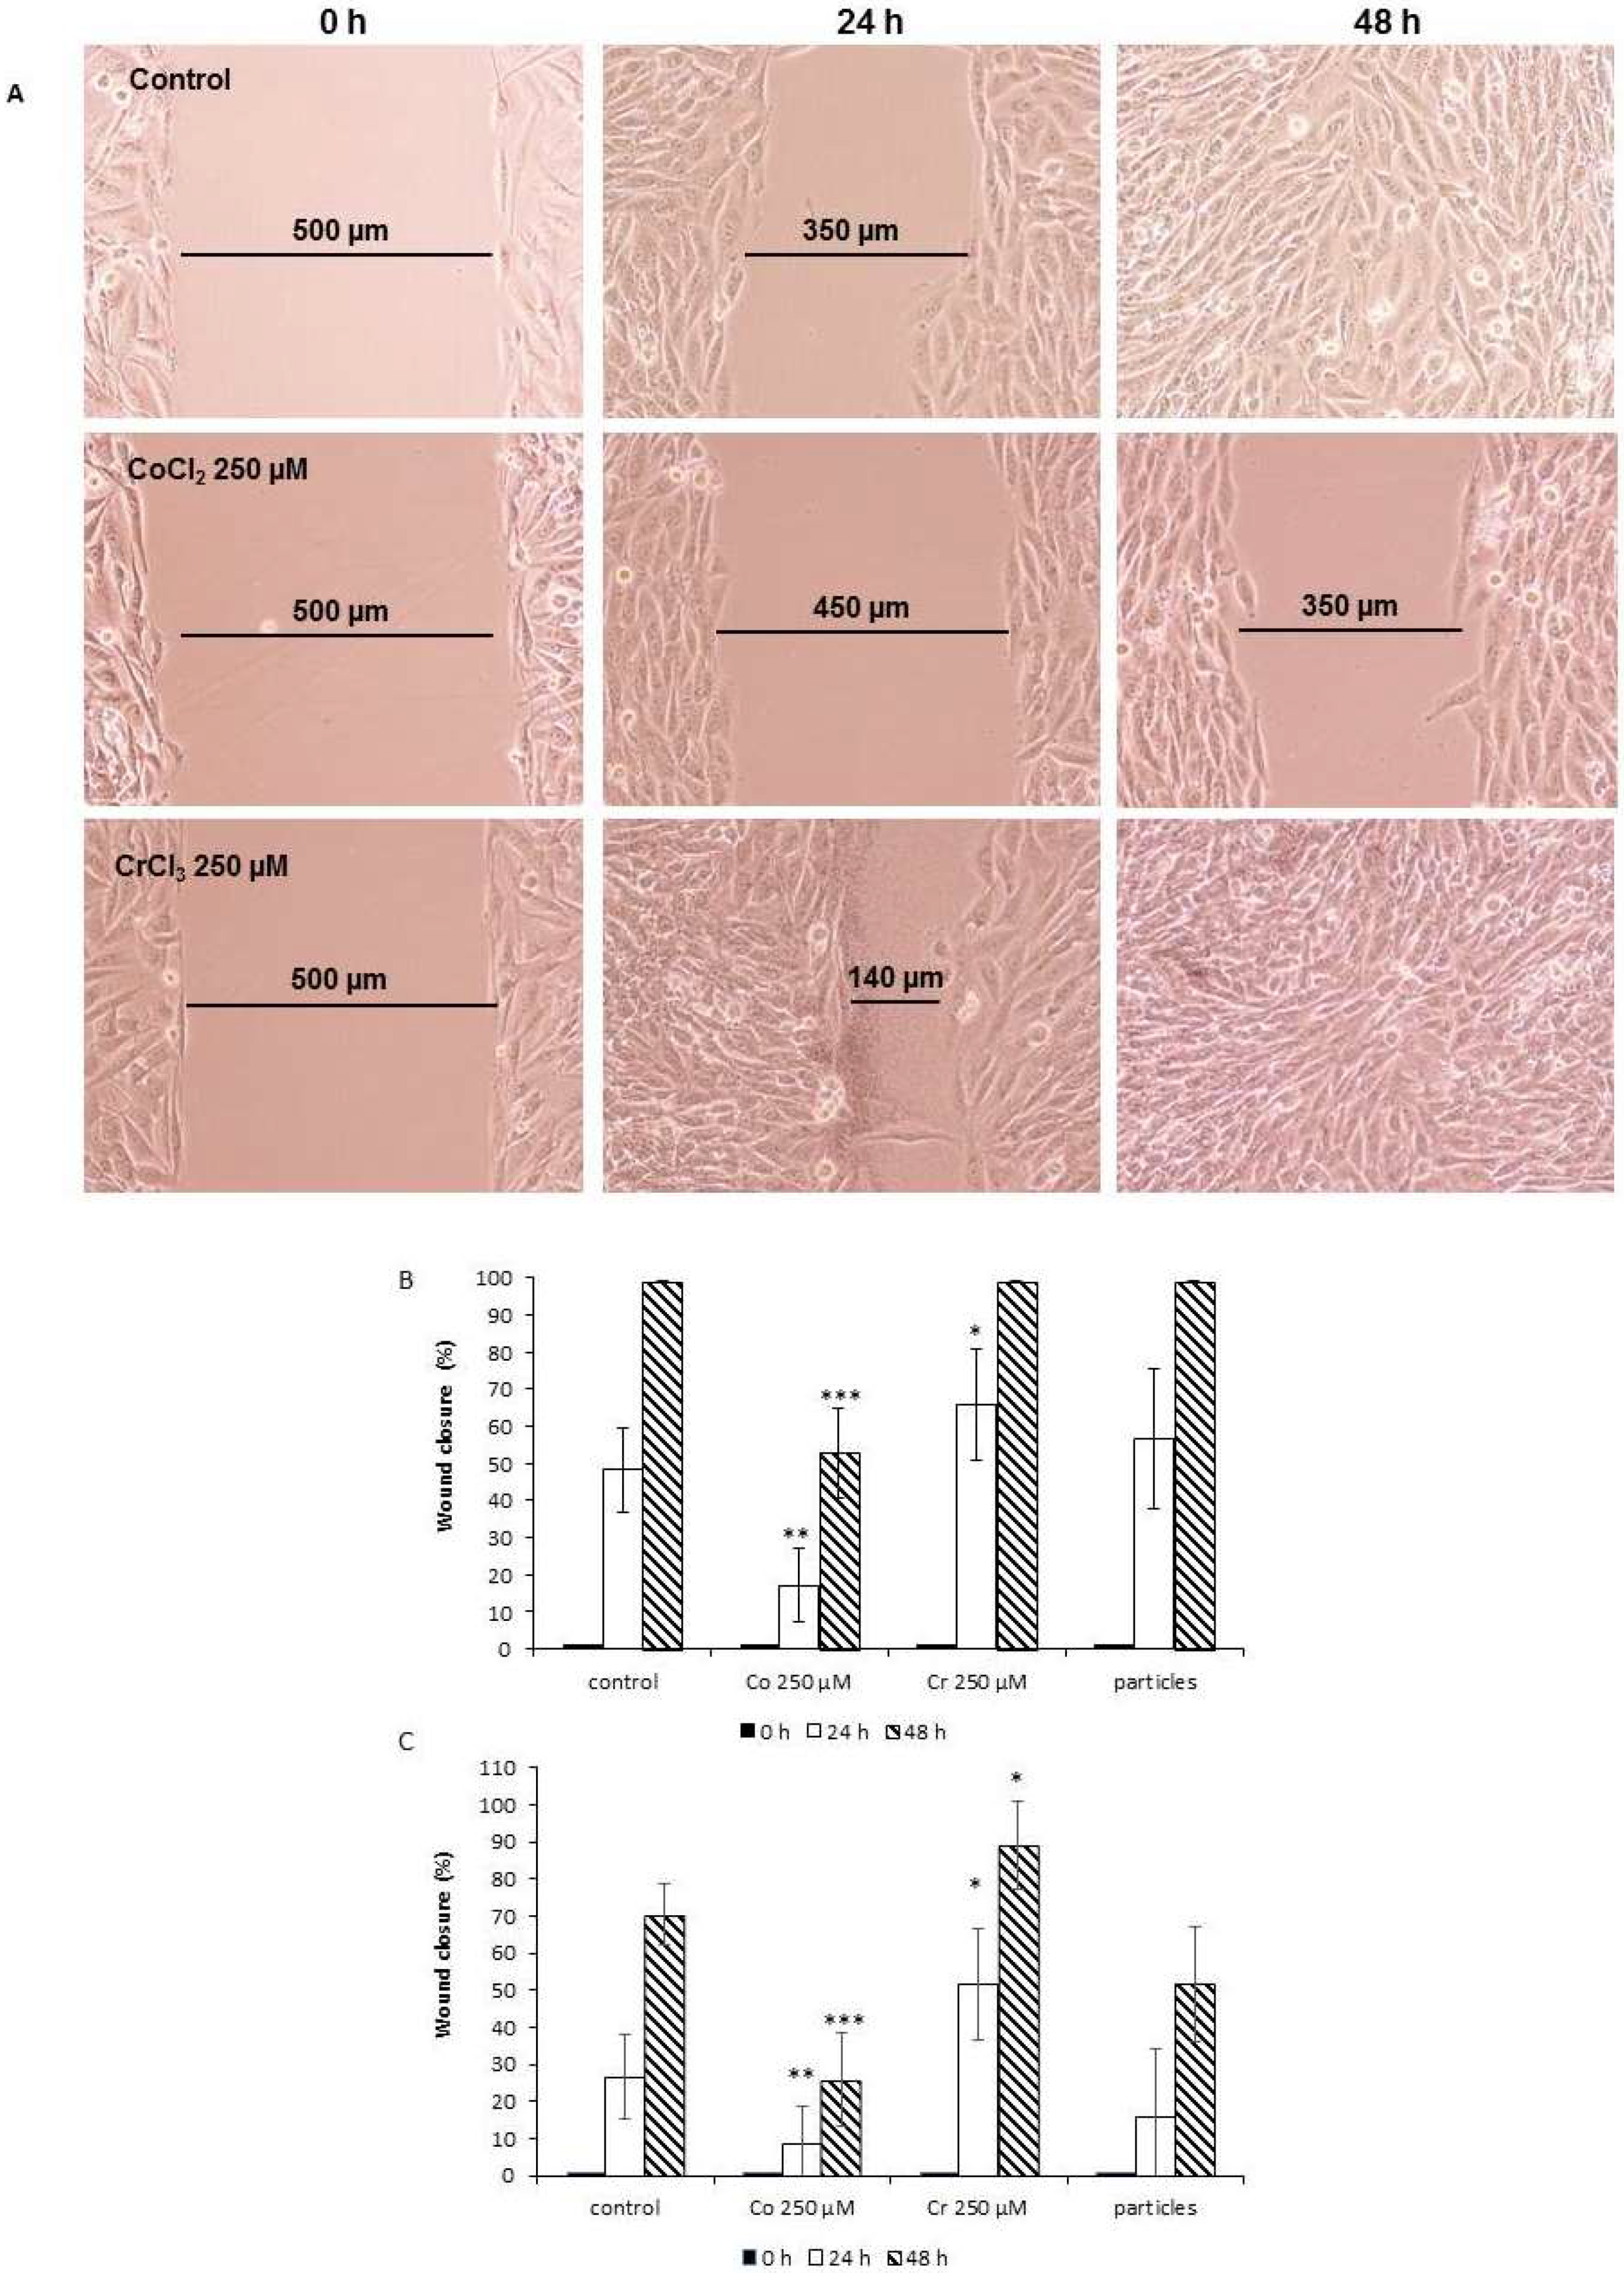
Proliferation of osteoblasts was determined by quantification of Bromodeoxyuridine (BrdU) incorporation. As shown in Figure 1, all Co2+ concentrations induced a slight, but not significant, increase in proliferation activity for MG63 as well as SaOs-2 cells.
Additionally, for Cr3+ treatment, no effects on cell proliferation were observed for any ion concentration. To further validate this result, we investigated the expression of the proliferation marker proliferating cell nuclear antigen (PCNA) using quantitative RT-PCR in MG63 cells. We observed no change in PCNA expression at a sub-confluent concentration of 1 × 10⁵ cells upon stimulation with Co2+ in a concentration range between 0–250 µM

2.2. Cell Migration

The influence of Co2+ and Cr3+ ions and CoCr particles on the migration capability of MG63 and SaOs-2 cells was analyzed using a wound healing assay. In MG63 cells, the standardized gap was reduced by 50 ± 11.3%, and after 48 h, a complete closure of the gap was seen. Co2+ treatment of cells resulted in a deceleration of this process, even after 48 h, the gap was still open. In contrast, Cr3+ accelerated this process in comparison to the unstimulated control. After 24 h, the gap was reduced by 67.0 ± 15.1% and completely closed after 48 h. Representative images for Co2+ and Cr3+ treated MG63 cells are shown in Figure 2A. The treatment of cells with CoCr particles (1 × 10⁶/well) had no significant effect. The summary of the wound healing assay in MG63 and SaOs-2 cells are summarized in Figure 2B,C.

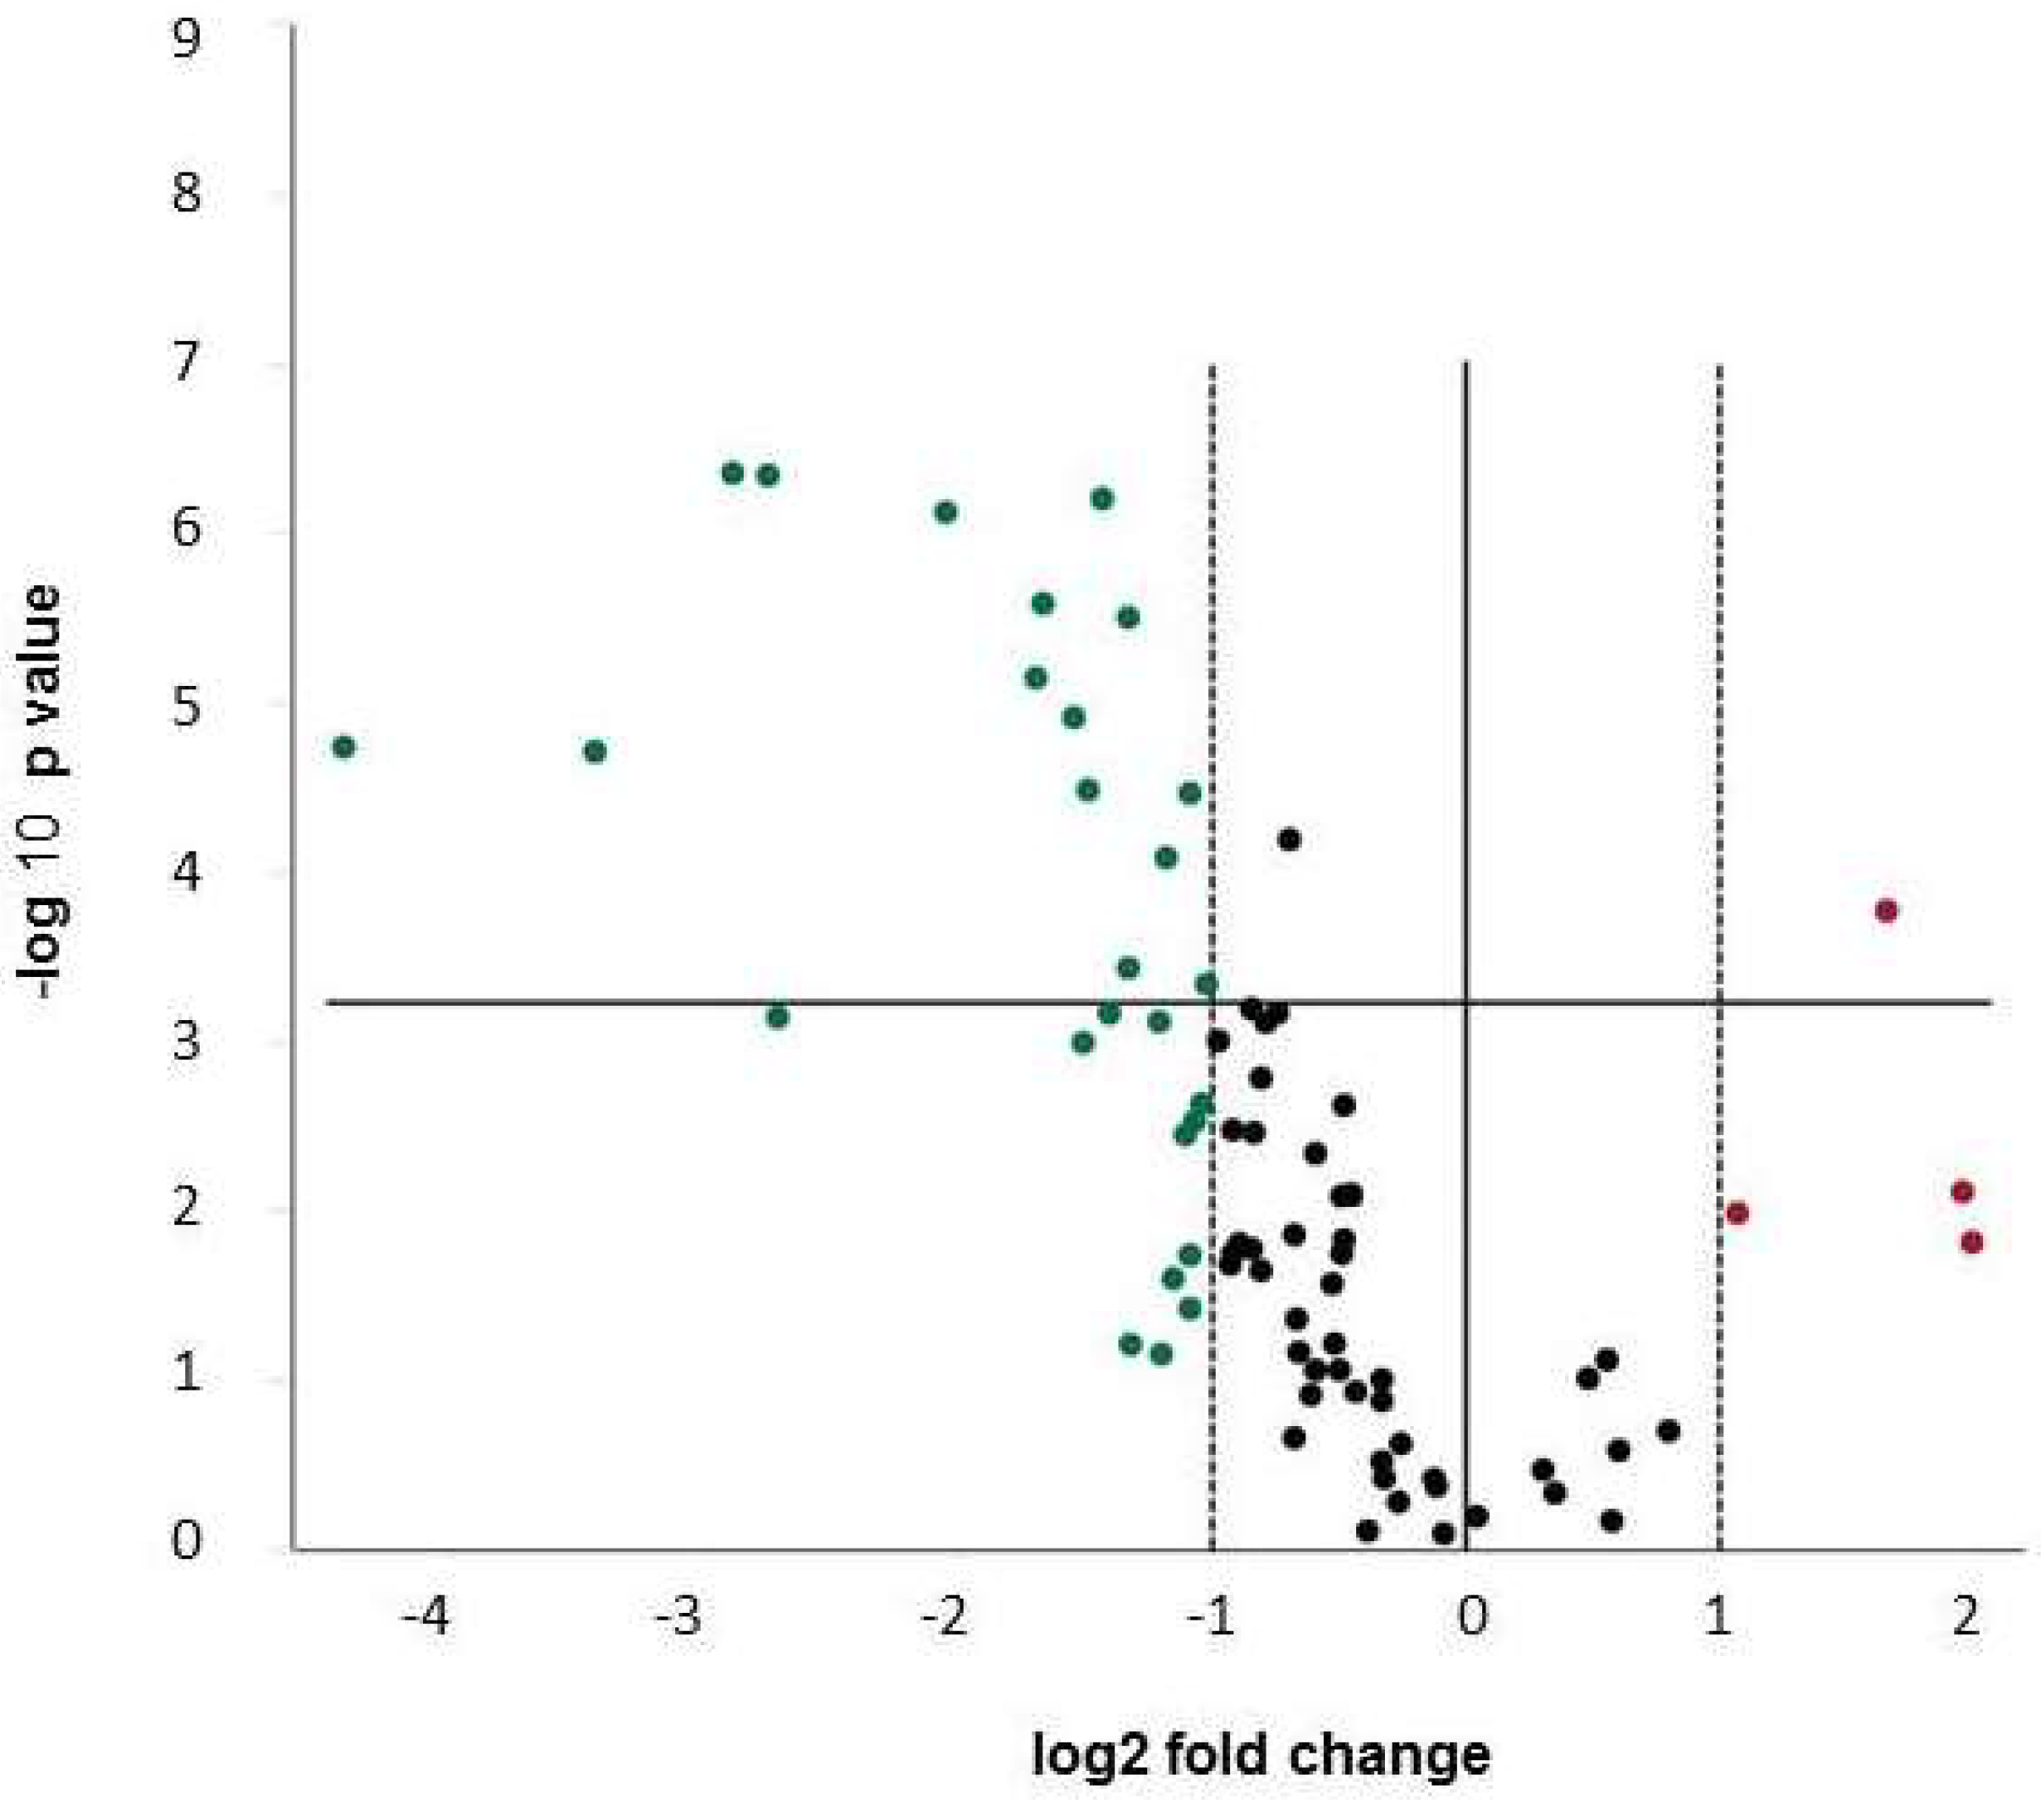
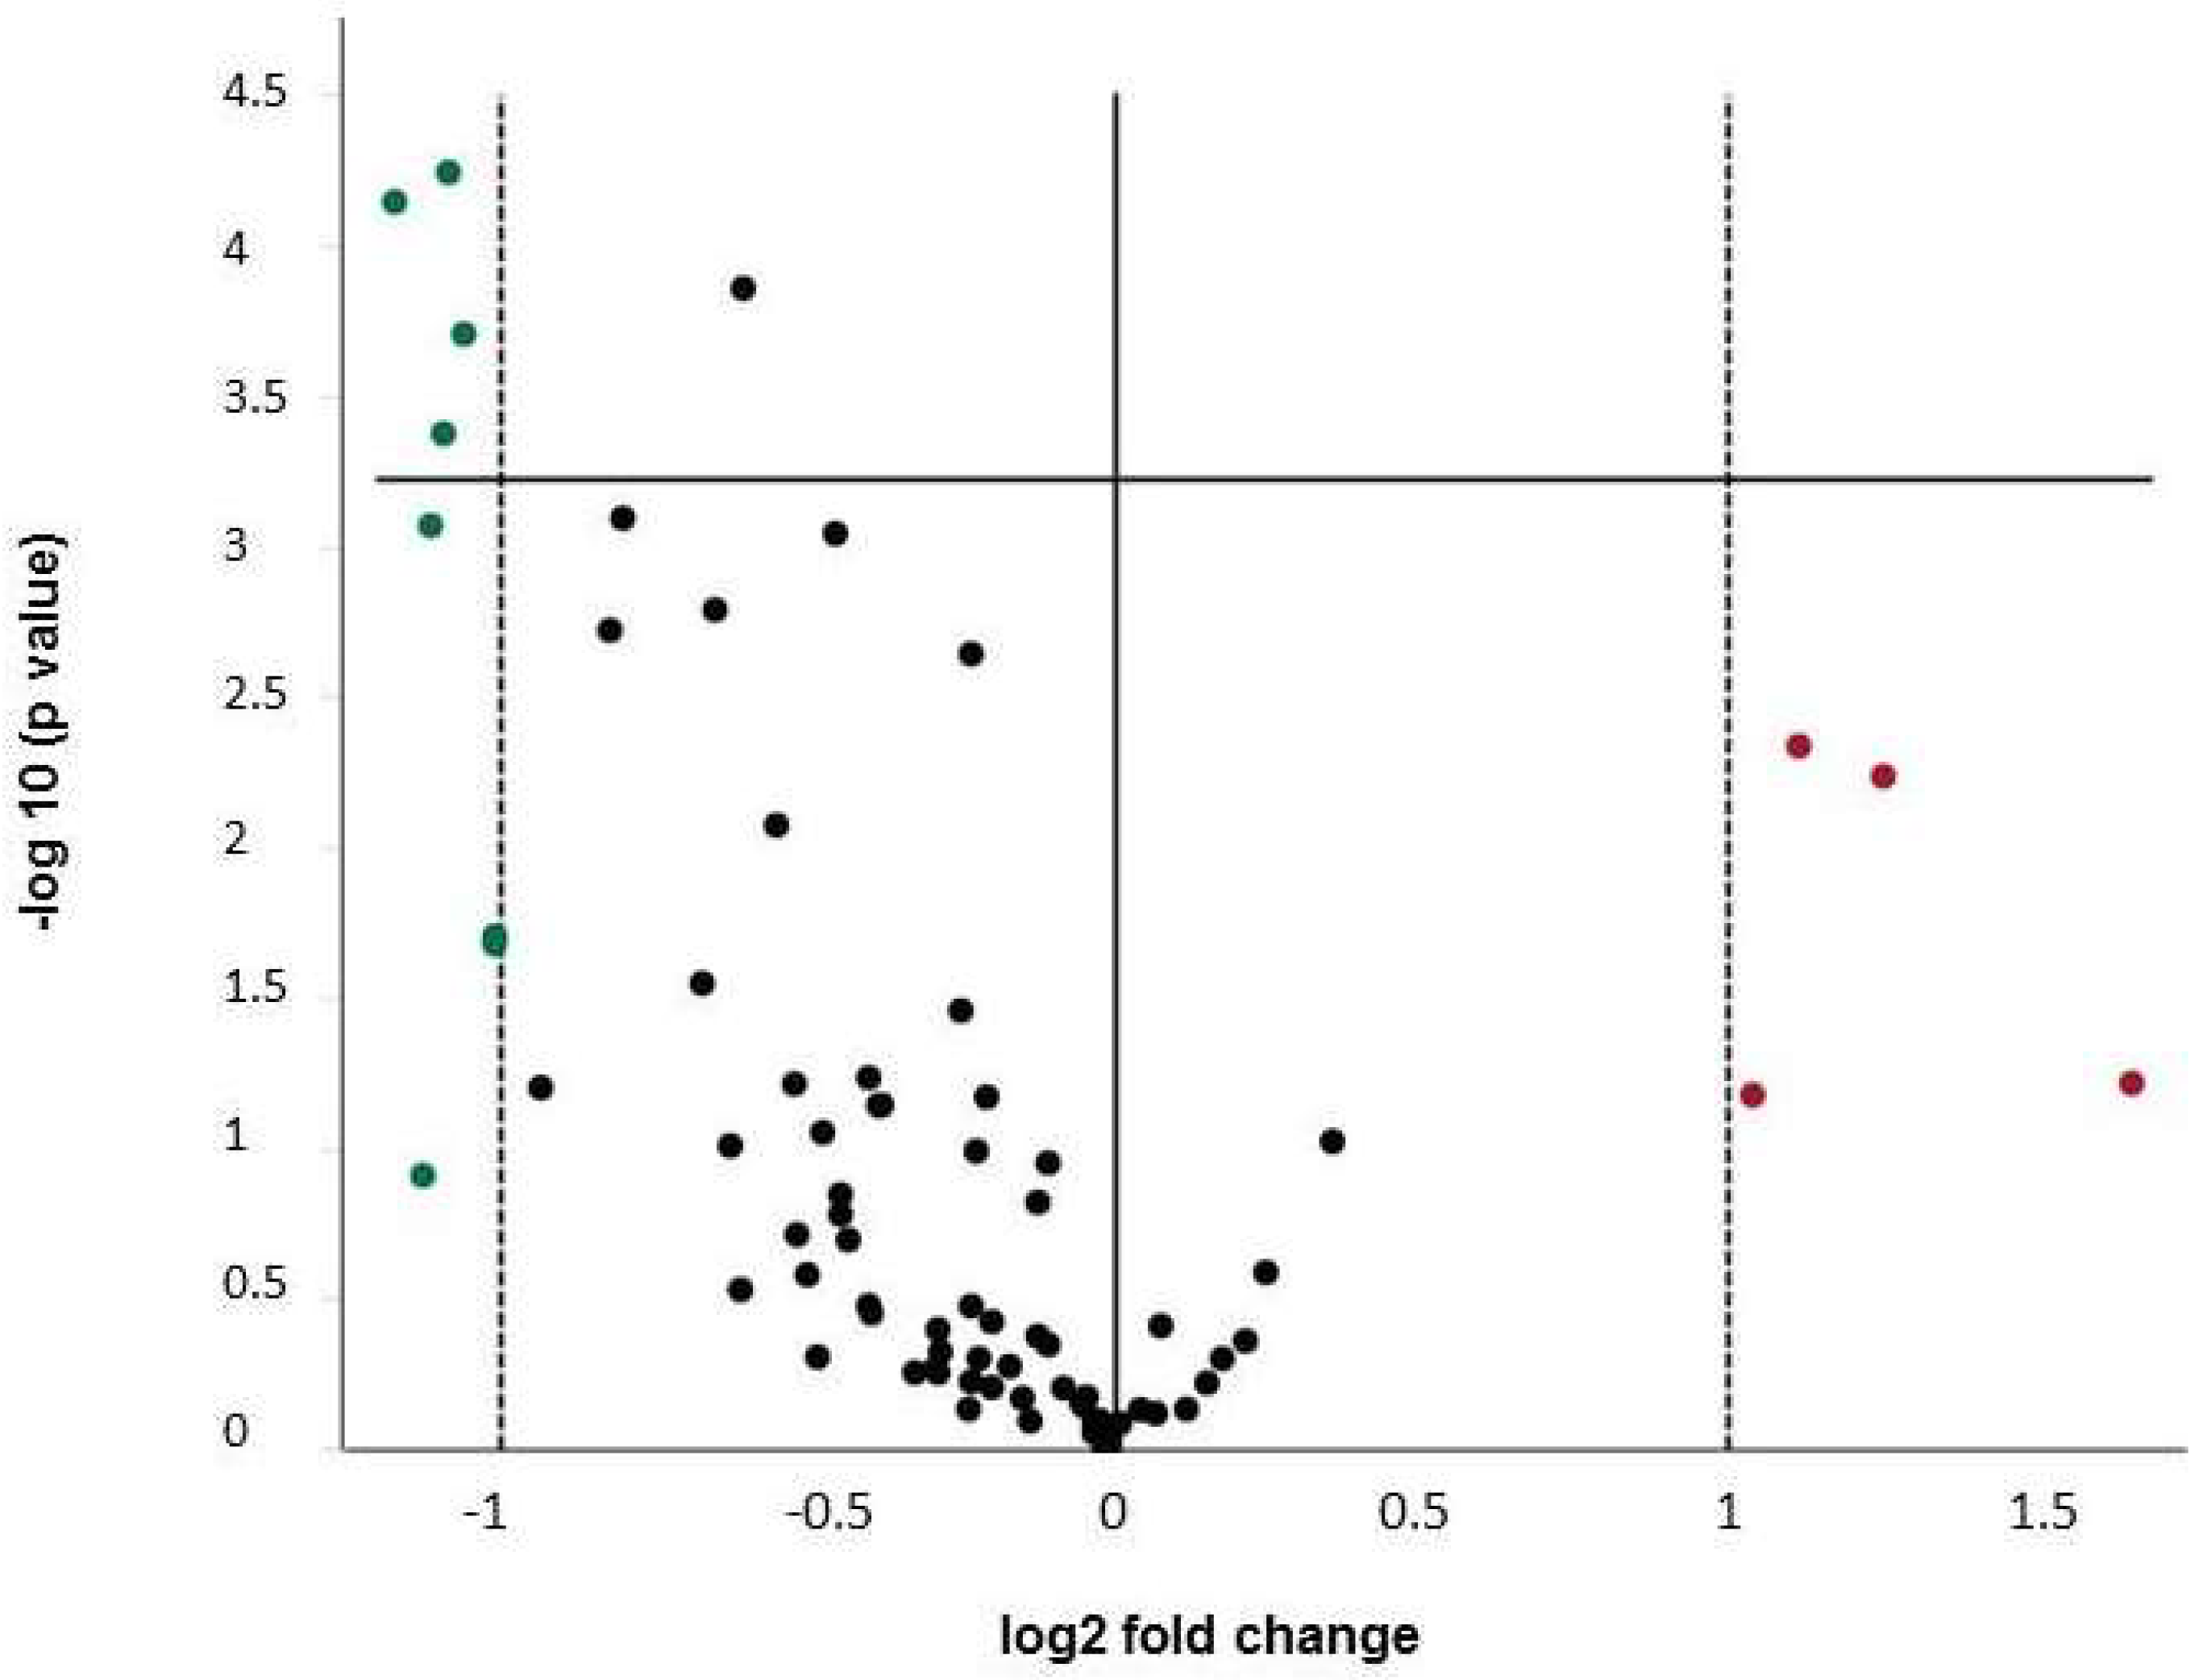
2.3. Expression of Osteogenic Markers

Human osteoblast-like MG63 cells were incubated without stimulus (control), and with CoCl2 (250 µM), CrCl3 (250 µM), and CoCr-particles (1 × 10⁶/well) in 12-well plates for 24 h.
Fifteen out of 84 genes were found to be expressed at a low level (Ct > 35 cycles), which was considered as non-detected. After normalization of the gene target expression to glyceraldehyde 3-phosphate dehydrogenase (GAPDH), 29 genes were found to be differentially regulated in CoCl2 treated MG63 cells compared to the untreated control by at least a factor of 2. The majority of genes were down-regulated (n = 25) (Table 1), whereas only four genes were found to be up-regulated (Table 2).
The volcano plot (Figure 3) reflects the predominant down-regulation of transcription of osteogenic markers.
The strongest effect was seen on the expression of different collagens e.g., collagen 14A1 (−6.5-fold down-regulation, p = 0.0007), Col15A1 (−6.7-fold down-regulation, p = 4.58 × 10⁻⁷), and Col3A1 (−10.8-fold down-regulation, p = 1.96 × 10⁻⁵), but also Col1A1 (−2.5-fold down-regulation, p = 0.00037) and Col1A2 (−3.2-fold down-regulation, p = 7.20 × 10⁻⁵) as well as other extracellular matrix proteins, such as COMP (−2.65-fold down-regulation, p = 0.00068) and biglycan (−2.1-fold down-regulation, p = 3.45 × 10⁻⁵). Interestingly, different cytokines also involved in the regulation of bone homeostasis were decreased in expression e.g., members of the TGF-β family (TGF-β2 −7.4-fold, p = 4.5 × 10⁻⁵ and TGF-β3 −2.3-fold, p = 8.3 × 10⁻⁵) and BMPs (BMP4 −2.8-fold, p = 3.3 × 10⁻⁵ BMP5 −21.5-fold, p = 1.8 × 10⁻⁵). Co2+ ions also down-regulated the expression of downstream targets of the TGF-β family signaling cascade SMAD1 (−2.9-fold) and SMAD2 (−2.1-fold).
MG63 cells treated with Cr3+ did not show a significant change in the expression in any of the 84 genes tested.
CoCr particles at a concentration of 1 × 10⁶/well (3.83 cm2) affected the gene expression of several genes by at least a factor of 2 (Figure 4, Table 3 and Table 4), eight genes were down-regulated, four genes up-regulated. Interestingly, down-regulation of Col14A1 (−2.01-fold) and Col15A1 (−2.1-fold) was also seen, along with down-regulation of Co2+ treated cells, although to a lesser extent. Additionally, the down-regulation of BMP5 (−2.2-fold) was reproducible in particle treated cells.

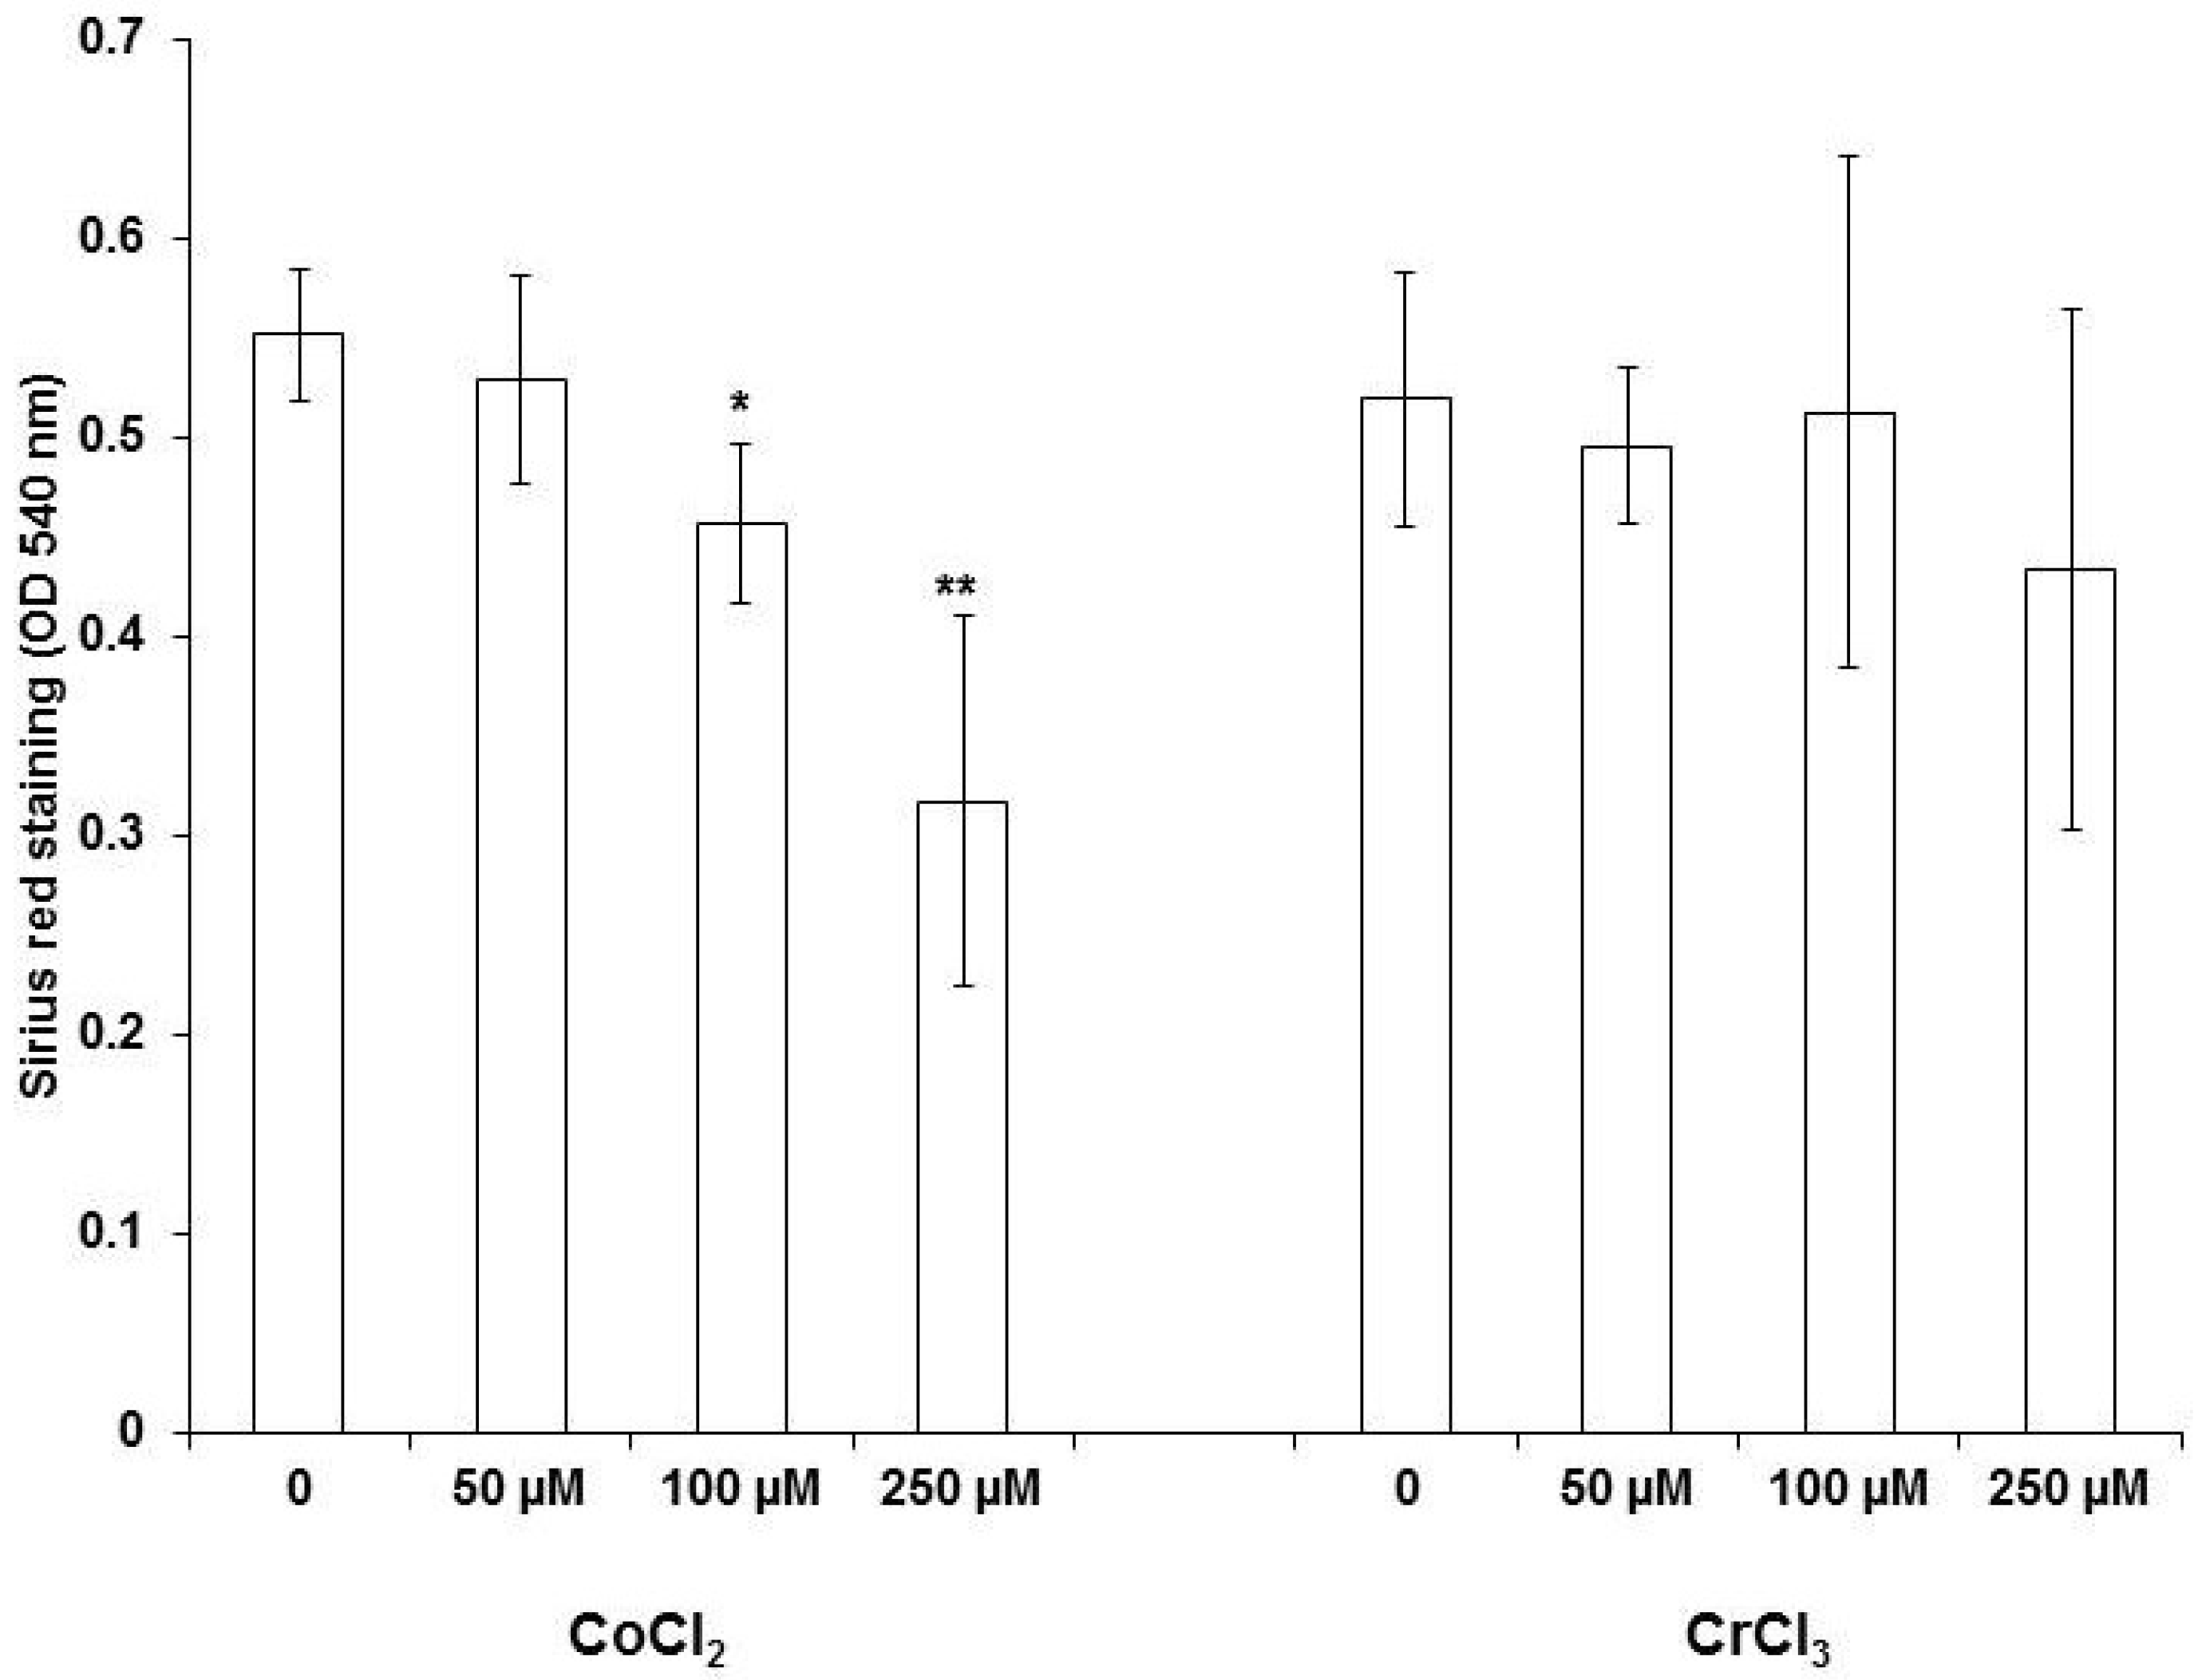
2.4. Collagen Staining with Sirius Red

In line with the array data, we found that CoCl2 reduced the total collagen production significantly in MG63 cells as shown by Sirius red staining. Figure 5 shows the dose-dependent decrease in collagen release upon Co2+ ion stimulation. As expected, no effect on collagen production was found in Cr3+ treated cells.

3. Discussion

Abrasive wear particles from endoprosthetic implants are known to induce adverse reactions in periprosthetic tissues (ARMD) such as osteolysis [24,25]. It has been shown that ARMD is associated with elevated serum levels of cobalt and chromium [25]. Cobalt measurements in the synovial fluid of failed metal on metal (M-o-M) hip replacements revealed a cobalt concentration of up to 30 µM [26]. Furthermore, a median concentration of 6.4 µg/g cobalt (range: 0.2–262 µg) within periprosthetic tissue was found around failed M-o-M hip implants [27]. For this reason, the Co2+ and Cr3+ ion concentrations were chosen in this manuscript. Co2+ and Cr3+ have been shown to modulate the expression of cytokines and chemokines in bone cells, inducing osteolytic processes or changes in osteoblast migration along chemokine gradients [9]. Interestingly, we have shown before that the C-X-C chemokine receptor type 4 (CXCR4) is up-regulated by different types of CoCr particles as well as dose-dependently by soluble Co2+ ions dose-dependently in osteoblast-like cells (MG63 and SaOs-2) [28,29]. CXCR4 is known to regulate osteoblast migration along chemokine gradients [30]. It has been shown that members of the TGF-β family are important cytokines involved in the maturation of osteoclasts and osteocytes [31], as well as regulation of bone formation by regulating extra cellular matrix deposition. In a previous study, we analyzed the influence of Co2+ and Cr3+ on the expression of the three TGF-β isoforms. After the binding of TGF-β to its cell surface, receptor Smad2 and Smad3 are phosphorylated and form complexes with Smad4 [32]. These complexes translocate to the nucleus and activate target genes including those required for assembly of the collagen extracellular matrix [32,33]. Our previous data show that bivalent cobalt ions and trivalent chromium ions have different effects on bone forming cells. While Co2+ down-regulated the expression of all three TGF-β isoforms in osteoblast-like cells, no inhibitory effect on mineralization was seen in the tested concentrations. Cr3+, however, did not influence the expression of TGF-β but strongly inhibited the mineralization in vitro [23]. These data suggest that the influence of Co2+ ions on bone homeostasis may be related to the inhibitory effect on the transcription of the bone formation regulating cytokines e.g., TGF-β1-3 and thereby on the bone forming activity of osteoblasts e.g., collagen production. The level of mineralization is determined by the expression of genes such as collagen, however, other post-transcriptional factors seem to have a stronger effect on mineralization.
One possible explanation for this effect might be that CoCl2 initiates HIF-1α signaling [34]. HIF-1α has been shown to regulate fibrotic tissue changes by inducing collagen expression, as well as TGF-β signaling [35,36].
Cr3+ ions, however, did not influence the gene expression and therefore most likely interact with the mineralization process directly. Shah et al. showed comparable effects of cobalt and chromium on the mineralization of murine “osteoblast to osteocyte-like” cell line MLO-A5 [37]. The inhibition of mineralization by soluble Cr3+ or on soluble CrPO4 might be due to the binding of phosphate to Cr3+, thereby reducing the availability of the ionic form [23]. However, this interaction needs to be analyzed in further studies.
To further investigate the underlying mechanisms we performed the RT2 human osteogenesis PCR Profiler Array covering 84 genes involved in osteogenesis. Twenty-nine genes were found regulated in CoCl2 treated MG63 cells compared to the untreated control by at least a factor of 2. These present data strengthen our recently published findings of a down-regulation of all TGF-β isoforms by Co2+, with the strongest effect on the expression of TGF-β2. Additionally, we observed that the expression of two other members of the TGF-β superfamily, BMP4 and BMP5, was significantly down-regulated by Co2+. Interestingly, BMP5 has been shown to up-regulate osteoclast formation, thereby inducing increased bone loss [38]. In contrast to Co2+/Cr3+-ions, CoCr particles showed no significant effect on migration and only a moderate effect on gene expression. There might be an effect after a prolonged exposure of osteoblasts to metal particles as a result of the intracellular corrosion, however, this was not investigated in this study.
The current study gives deeper insights into the mechanisms of how divalent Co2+ and trivalent Cr3+ alter bone homeostasis and contribute to osteolysis. Experiments using osteoclasts were beyond the scope of the study—nevertheless bone resorption caused by osteoclasts is a very important topic in bone homeostasis. Beside the canonical osteoclasts differentiation by receptor activator of NF-κB–receptor activator of NF-κB ligand (RANK–RANKL) interaction, Sabokbar et al. described a non-canonical, RANKL independent way of osteoclast differentiation [39]. The migration experiments showed that Co2+ (250 µM) decelerated migration whereas Cr3+ at the same concentration accelerates the migration rate compared to untreated MG63 cells. One reason for this effect could be changes in proliferation or metabolic activity. As shown previously the metabolic activity was slightly up-regulated by Co2+, whereas Cr3+ exhibited no effects on the cell metabolisms measured by water soluble tetrazolium (WST)-1 test [23]. Since metabolic activity determined using the WST-1 assay cannot be equated with proliferation, the proliferative activity of MG63 and SaOs-2 cells was measured after 48 h by determination of DNA replication using the BrdU assay—the results are similar to those of the WST-1 data, as well as the quantitative RT-PCR for the proliferation marker PCNA. These results are in agreement with the findings of other groups. Li and Wang reported that migration of smooth muscle cells is inhibited by Co2+ ions, whereas cell proliferation was only slightly increased [40].
As changes in proliferation of osteoblasts could not explain the decreased migratory capacity upon Co2+ ion stimulation, other pathways must be involved. The deposition of the extracellular matrix is important for cell migration. The extracellular matrix influences cellular migration, besides acting as a major reservoir of releasable chemokines it also provides guidance and confinement of the cell body resulting in a shape adaptation in order to move [41]. Therefore, the observed down-regulation of various extracellular matrix molecules, e.g., collagens and biglycan, could explain the reduced migratory capacity. The down-regulation of different collagen genes is in agreement with our observation that the production of total collagen is significantly reduced by CoCl2. Interestingly, TGF-β has been shown to play a crucial role in the expression regulation of various collagens. TGF-β/Smad3 stimulation favored the secretion of collagen-3 versus collagen-1 [42]. A critical role for Col3 in skeletal development is suggested by its appearance in mesenchymal condensations preceding cartilage and bone formation [43], its requirement for growth acceleration of osteoblasts [44] thus making a role of Col3 in fracture healing or ingrowth of prosthesis possible [45].
Interestingly, TGF-β 1 significantly up-regulated collagen type XIV expression [46]. These changes in ECM production could explain the reduced migratory capacity of MG63 and SaOs-2 cells after incubation with Co2+ ions.
We are aware that our study is limited by several factors. The use of the osteogenic array for the analysis of the effects of Co2+ and Cr3+ on gene expression limits our findings to genes which are involved in functions of osteoblasts. As shown earlier, other genes are also affected [28,29]. Furthermore, instead of primary osteoblasts which exhibit large inter-individual variability as well as limited cell division, we used osteoblast-like cell lines for our experiments. MG63 and SaOs-2 cells do not have the limitations of primary cells but their tumor derived origin must be taken into account. The concentrations of Co2+ and Cr3+ used in this study are within a range described in literature [9] e.g., Mabilleau et al. used concentrations up to 100 µM and observed no cytotoxic effects [47], some other authors worked with even higher concentrations up to 370 µM for Co2+ and 2.8 mM for Cr3+ [48,49]. In previous studies, we tested all three concentrations and found no adverse effects in PCR experiments [23].
Besides contributing to the understanding of osteoblast functional pathways, our data contribute to the knowledge of changes in gene expression patterns induced by metallic implants and/or their corrosion products. These findings may also have a clinical impact and may support the development of so called “smart surfaces” that may recognize pathological conditions e.g., osteolysis in periprosthetic tissues or bacterial colonization on implant surfaces at early stages. Rebound strategies may be then introduced by eluting for example anti-inflammatory or antimicrobial drugs. All these interesting topics should be the focus of further studies.

4. Material and Methods

4.1. Cell Culture

MG63 and SaOs-2 osteoblast-like cells were cultured in Dulbecco’s modified eagle medium (DMEM), supplemented with 10% fetal calf serum (FCS), 1% penicillin/streptomycin at 37 °C, and in 5% CO2 in a humidified atmosphere. For all experiments the cells were used from the 3th to the 7th passage.
Cell culture experiments for cell migration, RT2 Profiler PCR Array, and experiments for collagen determination were performed in 12-well cell culture plates (growing area: 3.83 cm2, final volume: 2 mL). For the determination of proliferation, 5 × 10³ cells were seeded into 96-well plates (growing area: 0.32 cm2, final volume 100 µL). After overnight adherence of the cells, the medium was changed and the cells were treated with the given concentrations of cobalt(II)chloride and chromium(III)chloride, as well as with Co-35Ni-20Cr-10Mo particles. The MG63 and SaOs-2 cell lines are well-characterized [50,51]—they share properties with primary human osteoblasts. The response to parathyroid hormone is similar, as well as the inhibition of proliferation with 1,25-(OH)2D3, the 1,25-(OH)2D3 dependent increase of alkaline phosphatase activity and osteocalcin mRNA, and protein expression [52,53,54,55]. Therefore, MG63 and SaOs-2 cell lines can be considered as well-established models for osteoblast experiments and have been used in previous studies by us [28,29].

4.2. Preparation of CoCl2 and CrCl3 Solutions

For the application of Co2+ and Cr3+ ions in the cell culture experiments, 100 mM stock solutions were prepared. For the preparation of Co2+, CoCl2 (Sigma Aldrich, Taufkirchen, Germany) was dissolved in water. For the preparation of Cr3+, CrCl3 × 6 H2O was dissolved in water. When this takes place, CrCl3 × 6 H2O forms as in initial species trans-[Cr3+(H2O)4Cl2]Cl × 2 H2O which appears emerald green. Within a time period of two weeks, this complex is reorganized to the final species [Cr3+(H2O)6]Cl3 (purple)—this stable species was used for all chromium experiments.

4.3. Preparation of Particles

The wear particles of the Co-35Ni-20Cr-10Mo alloy (CoCr) were produced according to Buchhorn et al. [56] and as described previously [55]. Briefly, Co-35Ni-20Cr-10Mo containers were filled with bars of the same material and filled with absolute ethanol followed by eccentrical and continuous rotation at room temperature. By tumbling in this way, the bars rubbed against the wall of the container and generated the particles. The chemical composition and relative purity of the particles was validated by energy-dispersive X-ray (EDX) spectroscopy. The particle size spectra in the basic stock-suspension ranged from less than 0.1 µm to about 200 µm. More than 80% of all particles were smaller than 5 µm and the maximum size distribution was about 2 µm [57].
One milliliter of the metal suspension was applied on a suction filter using a 200 nm pore size polyester membrane (Steritech, Charlotte, NC, USA). The dried filters were applied to sterile glass vials containing 10 mL DMEM medium (without any supplements) and irradiated under UV-light overnight in a laminar flow. For the experiments, stock solutions of all particle types containing 1 × 10⁸ particles per mL were prepared—the highest concentration used in cell culture was 1 × 10⁶ particles/well. All particle solutions tested endotoxin free using the E-TOXATE test (Sigma-Aldrich, Taufkirchen, Germany).

4.4. Cell Viability

The viability of MG63 and SaOs-2 cells after stimulation with CoCl2 and CrCl3 was measured by Trypan blue exclusion test. In viable cells Trypan blue is not absorbed, however, it traverses the cells membranes in dead cells. Cells used for experiments exhibited a viability of >95%.

4.5. RT2 Profiler PCR Array (PAHS-026ZF)—Human Osteogenesis

The RT2 Profiler PCR Array “Human Osteogenesis” (Qiagen, Hilden, Germany) covers 84 genes involved in osteogenesis. The arrays were performed according to the manufacturer´s instructions. Human osteoblast-like MG63 cells were incubated without stimulus (control), and with CoCl2 (250 µM), CrCl3 (250 µM), and CoCr-particles (1 × 10⁶/well) in 12-well plates for 24 h. This experimental design was repeated in 4 independent experiments. RNA was extracted using the RNeasy kit with an on-column DNAse digestion (Qiagen). For cDNA synthesis with the RT2 First Strand Kit (Qiagen) 1 µg of total RNA was used. Briefly, following a genomic elimination step of 5 min incubation with Buffer GE at 42 °C, the reverse transcription was performed for 15 min at 42 °C. For the PCR reaction the cDNA reaction volume of 20 µL was mixed with water, and the 2× RT2 SYBR green mastermix. 25 µL of this mixture were consistently pipetted into all wells of the 96-well preloaded PCR plate. The PCR was performed on a Roche Light Cycler 480 (software 1.5.0 SP4) (Roche, Rotkreuz, Switzerland) according to protocol F of the manufacturer´s manual.

4.6. Cell Migration Assay

For the cell migration assays, 2-well silicone inserts with a defined free gap (ibidi®, Martinsried, Germany) were placed on 12-well cell culture plates. 70 µL of a cell suspension, containing 3 × 10⁵ MG63 or SaOs-2 cells/mL, were filled into the chambers and incubated overnight. After removal of the inserts, a cell free gap of 500 µm was visible under the light microscope. After addition of Co2+, Cr3+, and CoCr particles, the closure of the gap was analyzed over a period of 48 h.

4.7. Detection of Proliferation

The proliferation of MG63 and SaO-2 cells was measured using the BrdU cell Proliferation Assay Kit (Cell Signaling Technology, Frankfurt, Germany) according to the manufacturer´s instructions. This kit detects 5-bromo-2′-deoxyuridine (BrdU) incorporated into cellular DNA during cell proliferation using an anti-BrdU antibody. Briefly, 5 × 10³ cells were seeded into 96-well cell culture plates and stimulated with CoCl2 and CrCl3 (0–250 µM) for 48 h. The fixed and permeabilized cells were subsequently incubated with the anti-BrdU antibody and then with the horseradish peroxidase (HRP)-conjugated secondary antibody. Incubation with 3,3′,5,5′-tetramethylbenzidine (TMB) stained the cells blue—it’s intensity correlates with BrdU incorporation. After 30 min the reaction was stopped by adding sulphuric acid. The absorbance was measured at 450 nm using a Tecan Infinite F200 Pro multiplate reader (Tecan, Männedorf, Switzerland).

4.8. Detection of Collagen Secretion

For determination of collagen secretion, 3 × 10⁵ cells per well in a 12-well plate were incubated for 48 h with CoCl2 and CrCl3, respectively. Then the cells were washed three times with PBS, fixed for 30 min with formalin and washed three times with destilled water. 400 µL of Sirius Red staining solution (0.1% direct red 80 (Sigma, Taufkirchen, Germany) in water-saturated picric acid) was added to each well and incubated for 30 min. Unbound dye was removed by repeated washing with 2.5% acetic acid. To quantify collagen staining the dye was extracted with 0.1 N NaOH and the absorption was measured at 540 nm.

4.9. Statistics

The statistical analysis was performed using SPSS 24. If not stated otherwise data were expressed as mean ± standard deviation (SD). Data from the stimulation experiments were analyzed using the one-way analysis of Variance (ANOVA) with different metal concentrations or with different time points as independent factors, and with post hoc Bonferroni test for pairwise analysis.

4.10. Analysis of Array Data

For analysis of RT2 Profiler PCR array data, a web-based software (available online: https://www.qiagen.com/de/shop/genes-and-pathways/data-analysis-center) was used.
The ΔΔCt method was used to calculate fold changes between treated groups and control group in which delta Ct is calculated between gene of interest and GAPDH as a housekeeper. The statistical significance of differences among the treated groups vs. untreated control was examined by Student’s t test. As a result of multiple testing the p value for significance was adjusted to 0.0006.

Author Contributions

Conceptualization: A.D., S.D., J.K., C.H.L.; Methodology: A.D. and S.D., Experimental design and conduction: A.D., S.D. and J.B., Data Writing—Original Draft Preparation A.D. and S.D.; Writing—Review & Editing; Visualization: A.D., S.D., J.K., C.H.L., and J.B. Supervision: C.H.L. and J.B., Funding Acquisition, A.D. and C.H.L.

Funding

This work was supported by a grant from Stiftung Endoprothetik (S 01/16) and from the European Union Seventh Framework Program FP7/2007–2013 (grant agreement No. 602398).

Acknowledgments

The authors acknowledge the expert technical assistance of Mandy Könnecke in the cell culture work and Gottfried Buchhorn for the preparation of the CoCr particles.

Conflicts of Interest

The authors declare no conflict of interests.

Abbreviations

ANOVAAnalysis of Variance
ARMDAdverse Reactions on Metallic wear Debris
BMPBone Marrow Protein
BrdUBromodeoxyuridine
COLCollagen
COMPCartilage Oligomeric Matrix Protein
CXCR4C-X-C chemokine Receptor type 4
DMEMDulbecco’s Modified Eagle Medium
ECMExtracellular Matrix
EDXEnergy Dispersive X-ray spectroscopy
FCSFetal Calf Serum
GAPDHGlyceraldehyde 3-phosphate dehydrogenase
HIFHypoxia-Inducible Factor(s)
HRPHorseradish peroxidase
M-o-MMetal-on-metal
PBSPhosphate Buffered Saline
PCNAProliferating Cell Nuclear Antigen
PCRPolymerase Chain Reaction
RANKReceptor Activator of NF-κB
RANKLReceptor Activator of NF-κB Ligand
RT-PCRReal-Time PCR
SMADrelated to “MAD”(mothers against decapentaplegic) of D. Melanogaster and “Sma”(small body size) of C. elegans
TGFTransforming Growth Factor
THATotal Hip Arthroplasty
WSTWater Soluble Tetrazolium

References

  1. Ebramzadeh, E.; Campbell, P.A.; Takamura, K.M.; Lu, Z.; Sangiorgio, S.N.; Kalma, J.J.; De Smet, K.A.; Amstutz, H.C. Failure modes of 433 metal-on-metal hip implants: How, why and wear. Orthop. Clin. N. Am. 2012, 42, 241–250. [Google Scholar] [CrossRef] [PubMed]
  2. Morrey, B.F.; Berry, D.J.; An, K.N.; Kitaoka, H.B.; Pagnano, M.W. Joint Replacement Arthroplasty Basic Science, Hip, Knee and Ankle; Lippincott, Williams & Wilkins: Philadelphia, PA, USA, 2011; Volume 2, Chapter 51; pp. 510–514. [Google Scholar]
  3. Brodner, W.; Bitzan, P.; Meisinger, V.; Kaider, A.; Gottsauner-Wolf, F.; Kotz, R.M. Serum cobalt levels after metal-on metal total hip arthroplasty. J. Bone Joint Surg. Am. 2003, 85, 2168–2173. [Google Scholar] [CrossRef] [PubMed]
  4. Willert, H.G.; Semlitsch, M. Reactions of the articular capsule to wear products of artificial joint prostheses. J. Biomed. Mater. Res. 1977, 11, 157–164. [Google Scholar] [CrossRef] [PubMed]
  5. Catelas, I.; Wimmer, M.A.; Utzschneider, S. Polyethylene and metal wear particles: Characteristics and biological effects. Semin. Immunopathol. 2011, 33, 257–271. [Google Scholar] [CrossRef] [PubMed]
  6. Lhotka, C.; Szekeres, T.; Steffan, I.; Zhuber, K.; Zweymüller, K. Four-year study of cobalt and chromium blood levels in patients managed with two different metal-on-metal total hip replacements. J. Orthop. Res. 2003, 21, 189–195. [Google Scholar] [CrossRef] [Green Version]
  7. Back, D.L.; Young, D.A.; Shimmin, A.J. How do serum cobalt and chromium levels change after metal-on-metal hip resurfacing? Clin. Orthop. Relat. Res. 2005, 438, 177–181. [Google Scholar] [CrossRef] [PubMed]
  8. Hallab, N.J.; Anderson, S.; Caicedo, M.; Skipor, A.; Campbell, P.; Jacobs, J.J. Immune responses correlate with serum-metal in metal-on-metal hip arthroplasty. J. Arthroplasty 2004, 8, 88–93. [Google Scholar] [CrossRef]
  9. Andrews, R.E.; Shah, K.M.; Wilkinson, J.M.; Gartland, A. Effects of cobalt and chromium ions at clinically equivalent concentrations after metal-on-metal hip replacement on human osteoblasts and osteoclasts: Implications for skeletal health. Bone 2011, 49, 717–723. [Google Scholar] [CrossRef] [PubMed] [Green Version]
  10. Lapraz, F.; Besnardeau, L.; Lepage, T. Patterning of the dorsal-ventral axis in echinoderms: Insights into the evolution of the BMP-chordin signaling network. PLoS Biol. 2009, 7, e1000248. [Google Scholar] [CrossRef] [PubMed]
  11. Siegel, P.M.; Massagué, J. Cytostatic and apoptotic actions of TGF-beta in homeostasis and cancer. Nat. Rev. Cancer 2003, 3, 807–821. [Google Scholar] [CrossRef] [PubMed]
  12. Leask, A.; Abraham, D.J. TGF-beta signaling and the fibrotic response. FASEB J. 2004, 18, 816–827. [Google Scholar] [CrossRef] [PubMed]
  13. Loeys, B.L.; Mortier, G.; Dietz, H.C. Bone lessons from Marfan syndrome and related disorders: Fibrillin, TGF-B and BMP at the balance of too long and too short. Pediatr. Endocrinol. Rev. 2013, 10, 417–423. [Google Scholar] [PubMed]
  14. Li, G.; Virdi, A.S.; Ashhurst, D.E.; Simpson, A.H.; Triffitt, J.T. Tissues formed during distraction osteogenesis in the rabbit are determined by the distraction rate: Localization of the cells that express the mRNAs and the distribution of types I and II. Cell Biol. Int. 2000, 24, 25–33. [Google Scholar] [CrossRef] [PubMed]
  15. Birk, D.E.; Mayne, R. Localization of collagen types I, III and V during tendon development. Changes in collagen types I and III are correlated with changes in fibril diameter. Eur. J. Cell Biol. 1997, 72, 352–361. [Google Scholar] [PubMed]
  16. Henkel, W.; Glanville, R.W. Covalent crosslinking between molecules of type I and type III collagen. The involvement of the N-terminal, nonhelical regions of the alpha 1 (I) and alpha 1 (III) chains in the formation of intermolecular crosslinks. Eur. J. Biochem. 1982, 122, 205–213. [Google Scholar] [CrossRef] [PubMed]
  17. Keene, D.R.; Sakai, L.Y.; Bächinger, H.P.; Burgeson, R.E. Type III collagen can be present on banded collagen fibrils regardless of fibril diameter. J. Cell Biol. 1987, 105, 2393–2402. [Google Scholar] [CrossRef] [PubMed] [Green Version]
  18. Wälchli, C.; Koch, M.; Chiquet, M.; Odermatt, B.F.; Trueb, B. Tissue-specific expression of the fibril-associated collagens XII and XIV. J. Cell Sci. 1994, 107, 669–681. [Google Scholar] [PubMed]
  19. Lisignoli, G.; Lambertini, E.; Manferdini, C.; Gabusi, E.; Penolazzi, L.; Paolella, F.; Angelozzi, M.; Casagranda, V.; Piva, R. Collagen type XV and the ‘osteogenic status’. J. Cell Mol. Med. 2017, 21, 2236–2244. [Google Scholar] [CrossRef] [PubMed] [Green Version]
  20. Goodman, S.B.; Ma, T. Cellular chemotaxis induced by wear particles from joint replacements. Biomaterials 2010, 31, 5045–5050. [Google Scholar] [CrossRef] [PubMed] [Green Version]
  21. Dyskova, T.; Gallo, J.; Kriegova, E. The Role of the Chemokine System in Tissue Response to Prosthetic By-products Leading to Periprosthetic Osteolysis and Aseptic Loosening. Front. Immunol. 2017, 8, 1026. [Google Scholar] [CrossRef] [PubMed]
  22. Alrabeah, G.O.; Brett, P.; Knowles, J.C.; Petridis, H. The effect of metal ions released from different dental implant-abutment couples on osteoblast function and secretion of bone resorbing mediators. J. Dent. 2017, 66, 91–101. [Google Scholar] [CrossRef] [PubMed]
  23. Drynda, S.; Drynda, A.; Feuerstein, B.; Kekow, J.; Lohmann, C.H.; Bertrand, J. The effects of cobalt and chromium ions on transforming growth factor-beta patterns and mineralization in human osteoblast-like MG63 and SaOs-2 cells. J. Biomed. Mater. Res. A 2018. [Google Scholar] [CrossRef] [PubMed]
  24. Willert, H.G.; Buchhorn, G.H.; Fayyazi, A.; Flury, R.; Windler, M.; Köster, G.; Lohmann, C.H. Metal-on-metal bearings and hypersensitivity in patients with artificial hip joints. A clinical and histomorphological study. J. Bone Joint Surg. Am. 2005, 87, 28–36. [Google Scholar] [CrossRef] [PubMed]
  25. Natu, S.; Sidaginamale, R.P.; Gandhi, J.; Langton, D.J.; Nargol, A.V. Adverse reactions to metal debris: Histopathological features of periprosthetic soft tissue reactions seen in association with failed metal on metal hip arthroplasties. J. Clin. Pathol. 2012, 65, 409–418. [Google Scholar] [CrossRef] [PubMed]
  26. Kwon, Y.M.; Ostlere, S.J.; McLardy-Smith, P.; Athanasou, N.A.; Gill, H.S.; Murray, D.W. “Asymptomatic” pseudotumors after metal-on-metal hip resurfacing arthroplasty: Prevalence and metal ion study. Arthroplasty 2011, 26, 511–518. [Google Scholar] [CrossRef] [PubMed]
  27. Lehtovirta, L.; Reito, A.; Parkkinen, J.; Peräniemi, S.; Vepsäläinen, J.; Eskelinen, A. Association between periprosthetic tissue metal content, whole blood and synovial fluid metal ion levels and histopathological findings in patients with failed metal-on metal hip replacement. PLoS ONE 2018, 13, e0197614. [Google Scholar] [CrossRef] [PubMed]
  28. Drynda, A.; Singh, G.; Buchhorn, G.H.; Awiszus, F.; Ruetschi, M.; Feuerstein, B.; Kliche, S.; Lohmann, C.H. Metallic wear debris may regulate CXCR4 expression in vitro and in vivo. J. Biomed. Mater. Res. A 2015, 103, 1940–1948. [Google Scholar] [CrossRef] [PubMed]
  29. Drynda, A.; Ren, Q.; Buchhoern, G.H.; Lohmann, C.H. The induction of CXCR4 expression in human osteoblast-like cells (MG63) by CoCr particles is regulated by the PLC-DAG-PKC pathway. J. Biomed. Mater. Res. B Appl. Biomater. 2017, 105, 2326–2332. [Google Scholar] [CrossRef] [PubMed]
  30. Ryu, C.H.; Park, S.A.; Kim, S.M.; Lim, J.Y.; Jeong, C.H.; Jun, J.A.; Oh, J.H.; Park, S.H.; Oh, W.I.; Jeun, S.S. Migration of human umbilical cord blood mesenchymal stem cells mediated by stromal cell-derived factor-1/CXCR4 axis via Akt, ERK, and p38 signal transduction pathways. Biochem. Biophys. Res. Commun. 2010, 398, 105–110. [Google Scholar] [CrossRef] [PubMed]
  31. Heino, T.J.; Hentunen, T.A.; Väänänen, H.K. Osteocytes inhibit osteoclastic bone resorption through transforming growth factor-beta: Enhancement by estrogen. J. Cell Biochem. 2002, 85, 185–197. [Google Scholar] [CrossRef] [PubMed]
  32. Massagué, J. TGFβ signalling in context. Nat. Rev. Mol. Cell Biol. 2012, 13, 616–630. [Google Scholar] [CrossRef] [PubMed]
  33. Burch, M.L.; Zheng, W.; Little, P.J. Smad linker region phosphorylation in the regulation of extracellular matrix synthesis. Cell. Mol. Life Sci. 2011, 68, 97–107. [Google Scholar] [CrossRef] [PubMed]
  34. Wang, G.L.; Semenza, G.L. Desferrioxamine induces erythropoietin gene expression and hypoxia-inducible factor 1 DNA-binding activity: Implications for models of hypoxia signal transduction. Blood 1993, 82, 3610–3615. [Google Scholar] [PubMed]
  35. Hu, Y.; Hu, D.; Yu, H.; Xu, W.; Fu, R. Hypoxia-inducible factor 1a and ROCK1 regulate proliferation and collagen synthesis in hepatic stellate cells under hypoxia. Mol. Med. Rep. 2018. [Google Scholar] [CrossRef] [PubMed]
  36. Raykhel, I.; Moafi, F.; Myllymäki, S.M.; Greciano, P.G.; Matlin, K.S.; Moyano, J.V.; Manninen, A.; Myllyharju, J. BAMBI is a novel HIF1-dependent modulator of TGFβ-mediated disruption of cell polarity during hypoxia. J. Cell Sci. 2018, 131. [Google Scholar] [CrossRef] [PubMed]
  37. Shah, K.M.; Orton, P.; Mani, N.; Wilkinson, J.M.; Gartland, A. Osteocyte physiology and response to fluid shear stress are impaired following exposure to cobalt and chromium: Implications for bone health following joint replacement. J. Orthop. Res. 2017, 35, 1716–1723. [Google Scholar] [CrossRef] [PubMed]
  38. Wutzl, A.; Brozek, W.; Lernbass, I.; Rauner, M.; Hofbauer, G.; Schopper, C.; Watzinger, F.; Peterlik, M.; Pietschmann, P. Bone morphogenetic proteins 5 and 6 stimulate osteoclast generation. J. Biomed. Mater. Res. A 2006, 77, 75–83. [Google Scholar] [CrossRef] [PubMed]
  39. Sabokbar, A.; Mahoney, D.J.; Hemingway, F.; Athanasou, N.A. Non-Canonical (RANKL-Independent) Pathways of Osteoclast Differentiation and Their Role in Musculoskeletal Diseases. Clin. Rev. Allergy Immunol. 2016, 51, 16–26. [Google Scholar] [CrossRef] [PubMed]
  40. Li, J.; Wang, H.M. Effects of cobalt chloride on phenotypes of normal human saphenous vein smooth muscle cells. Int. J. Clin. Exp. Med. 2014, 7, 4933–4941. [Google Scholar] [PubMed]
  41. Poole, K.; Khairy, K.; Friedrichs, J.; Franz, C.; Cisneros, D.A.; Howard, J.; Mueller, D. Molecular-scale topographic cues induce the orientation and directional movement of fibroblasts on two-dimensional collagen surfaces. J. Mol. Biol. 2005, 349, 380–386. [Google Scholar] [CrossRef] [PubMed]
  42. Goel, S.A.; Guo, L.W.; Shi, X.D.; Kundi, R.; Sovinski, G.; Seedial, S.; Liu, B.; Kent, K.C. Preferential secretion of collagen type 3 versus type 1 from adventitial fibroblasts stimulated by TGF-β/Smad3-treated medial smooth muscle cells. Cell. Signal. 2013, 25, 955–960. [Google Scholar] [CrossRef] [PubMed] [Green Version]
  43. Silver, M.H.; Foidart, J.M.; Pratt, R.M. Distribution of fibronectin and collagen during mouse limb and palate development. Differentiation 1981, 18, 141–149. [Google Scholar] [CrossRef] [PubMed]
  44. Maehata, Y.; Takamizawa, S.; Ozawa, S.; Izukuri, K.; Kato, Y.; Sato, S.; Lee, M.C.; Kimura, A.; Hata, R. Type III collagen is essential for growth acceleration of human osteoblastic cells by ascorbic acid 2-phosphate, a long-acting vitamin C derivative. Matrix Biol. 2007, 26, 371–381. [Google Scholar] [CrossRef] [PubMed]
  45. Chen, X.D.; Dusevich, V.; Feng, J.Q.; Manolagas, S.C.; Jilka, R.L. Extracellular matrix made by bone marrow cells facilitates expansion of marrow-derived mesenchymal progenitor cells and prevents their differentiation into osteoblasts. J. Bone Miner. Res. 2007, 22, 1943–1956. [Google Scholar] [CrossRef] [PubMed]
  46. Kivirikko, S.; Mauviel, A.; Pihlajaniemi, T.; Uitto, J. Cytokine modulation of type XV collagen gene expression in human dermal fibroblast cultures. Exp. Dermatol. 1999, 8, 407–412. [Google Scholar] [CrossRef] [PubMed]
  47. Mabilleau, G.; Gill, H.S.; Sabokbar, A. Cobalt and chromium ions affect human osteoclast and human osteoblast physiology in vitro. In Vitro 2012, 1, 219. [Google Scholar] [CrossRef]
  48. Catelas, I.; Petit, A.; Vali, H.; Fragiskatos, C.; Meilleur, R.; Zukor, D.J.; Antoniou, J.; Huk, O.L. Quantitative analysis of macrophage apoptosis vs. necrosis induced by cobalt and chromium ions in vitro. Biomaterials 2007, 26, 2441–2453. [Google Scholar] [CrossRef] [PubMed]
  49. Fleury, C.; Petit, A.; Mwale, F.; Antoniou, J.; Zukor, D.J.; Tabrizian, M.; Huk, O.L. Effect of cobalt and chromium ions on human MG-63 osteoblasts in vitro: Morphology, cytotoxicity, and oxidative stress. Biomaterials 2006, 27, 3351–3360. [Google Scholar] [CrossRef] [PubMed]
  50. Franceschi, R.T.; James, W.M.; Zerlauth, G. 1 alpha, 25-dihydroxyvitamin D3 specific regulation of growth, morphology, and fibronectin in a human osteosarcoma cell line. J. Cell Physiol. 1985, 123, 401–409. [Google Scholar] [CrossRef] [PubMed]
  51. Pautke, C.; Schieker, M.; Tischer, T.; Kolk, A.; Neth, P.; Mutschler, W.; Milz, S. Characterization of osteosarcoma cell lines MG-63, Saos-2 and U-2 OS in comparison to human osteoblasts. Anticancer Res. 2004, 24, 3743–3748. [Google Scholar] [PubMed]
  52. Schwartz, Z.; Lohmann, C.H.; Oefinger, J.; Bonewald, L.F.; Dean, D.D.; Boyan, B.D. Implant surface characteristics modulate differentiation behavior of cells in the osteoblastic lineage. Adv. Dent. Res. 1999, 13, 38–48. [Google Scholar] [CrossRef] [PubMed]
  53. Boyan, B.D.; Schwartz, Z.; Bonewald, L.F.; Swain, L.D. Localization of 1,25-(OH)2D3-responsive alkaline phosphatase in osteoblast-like cells (ROS 17/2.8, MG 63, and MC 3T3) and growth cartilage cells in culture. J. Biol. Chem. 1989, 264, 11879–11886. [Google Scholar] [PubMed]
  54. Boyan, B.D.; Schwartz, Z.; Lohmann, C.H.; Sylvia, V.L.; Cochran, D.L.; Dean, D.D.; Puzas, J.E. Pretreatment of bone with osteoclasts affects phenotypic expression of osteoblast-like cells. J. Orthop. Res. 2003, 21, 638–647. [Google Scholar] [CrossRef] [Green Version]
  55. Lohmann, C.H.; Dean, D.D.; Köster, G.; Casasola, D.; Buchhorn, G.H.; Fink, U.; Schwartz, Z.; Boyan, B.D. Ceramic and PMMA particles differentially affect osteoblast phenotype. Biomaterials 2002, 23, 1855–1863. [Google Scholar] [CrossRef]
  56. Buchhorn, G.H.; Willert, H.G.; Semlitsch, M.; Schön, S.; Steinemann, S.; Schmidt, M. Preparation, characterization, and animal testing for biocompatibility of metal particles of iron-, cobalt-, and titanium-based implant alloys. In Particulate Debris from Medical Implants: Mechanisms of Formation and Histological Consequences; John, K.R.S., Ed.; ASTM International: West Conshohocken, PA, USA, 1992; Volume 1144, pp. 177–188. [Google Scholar]
  57. Katzer, A.; Hockertz, S.; Buchhorn, G.H.; Loehr, J.F. In vitro toxicity and mutagenicity of CoCrMo and TiAl wear particles. Toxicology 2003, 190, 145–154. [Google Scholar] [CrossRef]
Figure 1. Proliferation activity of MG63 (A) and SaOs-2 (B) cells after 48 h stimulation with CoCl2 and CrCl3. Data represent the mean and standard deviation of four independent experiments, each performed in triplicate.
Ijms 19 03034 g001
Figure 2. Effect of treatment with CoCl2, CrCl3, and CoCr particles on relative wound closure in MG63 and SaOs2 cells, measured using ibidi® silicone inserts in an in vitro wound healing assay over 48 h. (A) Representative images of MG63 cells. Summary of the wound healing assay results for (B) MG63 and (C) SaOs-2 cells. Data represent the mean of four independent experiments. Data were examined in the time course using ANOVA (MG63: Co2+ p < 0.0001, Cr3+ p < 0.05, CoCr particles not significant; SaOs-2: Co2+ p < 0.001, Cr3+ p < 0.01, CoCr particles p < 0.01). For comparison of paired samples of treated cells vs. untreated control the post-hoc Bonferroni test was used (* p < 0.05, ** p < 0.01, *** p < 0.001).
Ijms 19 03034 g002
Figure 3. Volcano Plot for changes of gene expression in MG63 cells after 24 h incubation with CoCl2 vs. unstimulated control. Expression data are normalized vs. glyceraldehyde 3-phosphate dehydrogenase (GAPDH). The statistical significance is plotted versus fold-change on the y- and x-axes, respectively. The horizontal line represents the significance level (p = 0.0006). Up-regulated genes are depicted in red, down-regulated genes in green and genes regulated by less than factor 2 in black. Low abundant transcripts are included. Data are summarized from four independent experiments.
Ijms 19 03034 g003
Figure 4. Volcano Plot for changes of gene expression in MG63 cells after 24 h incubation with Co/Cr particles vs. unstimulated control. Expression data are normalized to GAPDH. The statistical significance is plotted versus fold-change on the y- and x-axes, respectively. The horizontal line represents the significance level (p = 0.0006). Up-regulated genes are depicted in red, down-regulated genes in green and genes regulated by less than factor 2 in black. Data are summarized from four independent experiments.
Ijms 19 03034 g004
Figure 5. Influence of Co2+ and Cr3+ on collagen secretion by MG63 cells determined using Sirius red staining, one-way ANOVA p < 0.001 for CoCl2 treatment. For pairwise comparison a post hoc Bonferroni test was applied (* p < 0.05, ** p < 0.01 vs. unstimulated control). Data represent results of four independent experiments, each performed in triplicate.
Ijms 19 03034 g005
Table 1. Genes down-regulated by CoCl2 after 24 h by at least a factor of 2 (normalization of Ct-values to glyceraldehyde 3-phosphate dehydrogenase (GAPDH)). The significance level was adjusted for multiple testing to 0.0006 (bold p-values are significant). A = in either the control or the test sample, the average Ct is high (>30 cycles).
Gene SymbolFold RegulationCommentsp-Value
BGN−2.12 3.45254 × 10⁻⁵
BMP4−2.81 3.30439 × 10⁻⁵
BMP5−21.52A1.83701 × 10−5
BMPR2−2.15 0.003576291
CDH11−4.14 7.55543 × 10⁻⁷
CHRD−2.22 0.025290803
COL14A1−6.54 0.000723157
COL15A1−6.74A4.58304 × 10−7
COL1A1−2.52 0.000370615
COL1A2−3.23 7.20666 × 10⁻⁶
COL3A1−10.78 1.96377 × 10⁻⁵
COL5A1−2.03 0.000462367
COMP−2.65 0.000687369
IGF1R−2.85 0.001021934
ITGA1−2.13 0.037993599
ITGA3−2.12 0.018352525
MMP2−2.7 6.30662 × 10−7
RUNX2−2.51 3.16733 × 10⁻⁶
SMAD1−2.93 1.23015 × 10⁻⁵
SMAD2−2.06 0.002343501
SOX9−3.18 2.62519 × 10⁻⁶
TGFB2−7.4A4.4503 × 10−7
TGFB3−2.27 8.28135 × 10⁻⁵
TWIST1−2.32 0.00077027
VEGFB−2.1 0.002973727
Table 2. Genes up-regulated by CoCl2 after 24 h by at least a factor of 2 (normalization of Ct-values to GAPDH). The significance level was adjusted for multiple testing to 0.0006 (bold p-values are significant), A = in either the control or the test sample, the average Ct is high (>30 cycles).
Gene SymbolFold RegulationCommentsp-Value
BMP64 0.015432431
EGF3.89 0.00777753
FGF12.11 0.010384109
PDGFA3.15A0.000170489
Table 3. Genes down-regulated after 24 h of stimulation with particles by at least a factor of 2 (normalization of Ct-values to GAPDH). The significance level was adjusted for multiple testing to 0.0006 (bold p-values are significant), A = in either the control or the test sample, the average Ct is high (>30 cycles).
Gene SymbolFold RegulationCommentsp-Value
BMP5−2.16 0.0008533
BMP6−2.01 0.0209783
COL14A1−2.01 0.0197225
COL15A1−2.12A5.71 × 10−5
PDGFA−2.13 0.0004219
SMAD1−2.25 7.161 × 10⁻⁵
SMAD4−2.18 0.1233691
VDR−2.08 0.0001971
Table 4. Genes up-regulated after 24 h of stimulation with particles by at least a factor of 2 (normalization of Ct-values with GAPDH). At a significance level of 0.0006 (adjusted for multiple testing) no significant up-regulation was found, A = in either the control or the test sample, the average Ct is high (>30 cycles) B: the relative expression level is low (Ct > 30, in both control and test samples).
Gene SymbolFold RegulationCommentsp-Value
FGF12.06B0.0666043
GDF103.15B0.0609019
NOG2.39A0.0058095
VEGFA2.17 0.0046092

