Current Trends of Microfluidic Single-Cell Technologies

 , , and
Abstract
:
1. Introduction
2. Single-Cell Manipulation
2.1. Fluidic-Based Manipulation
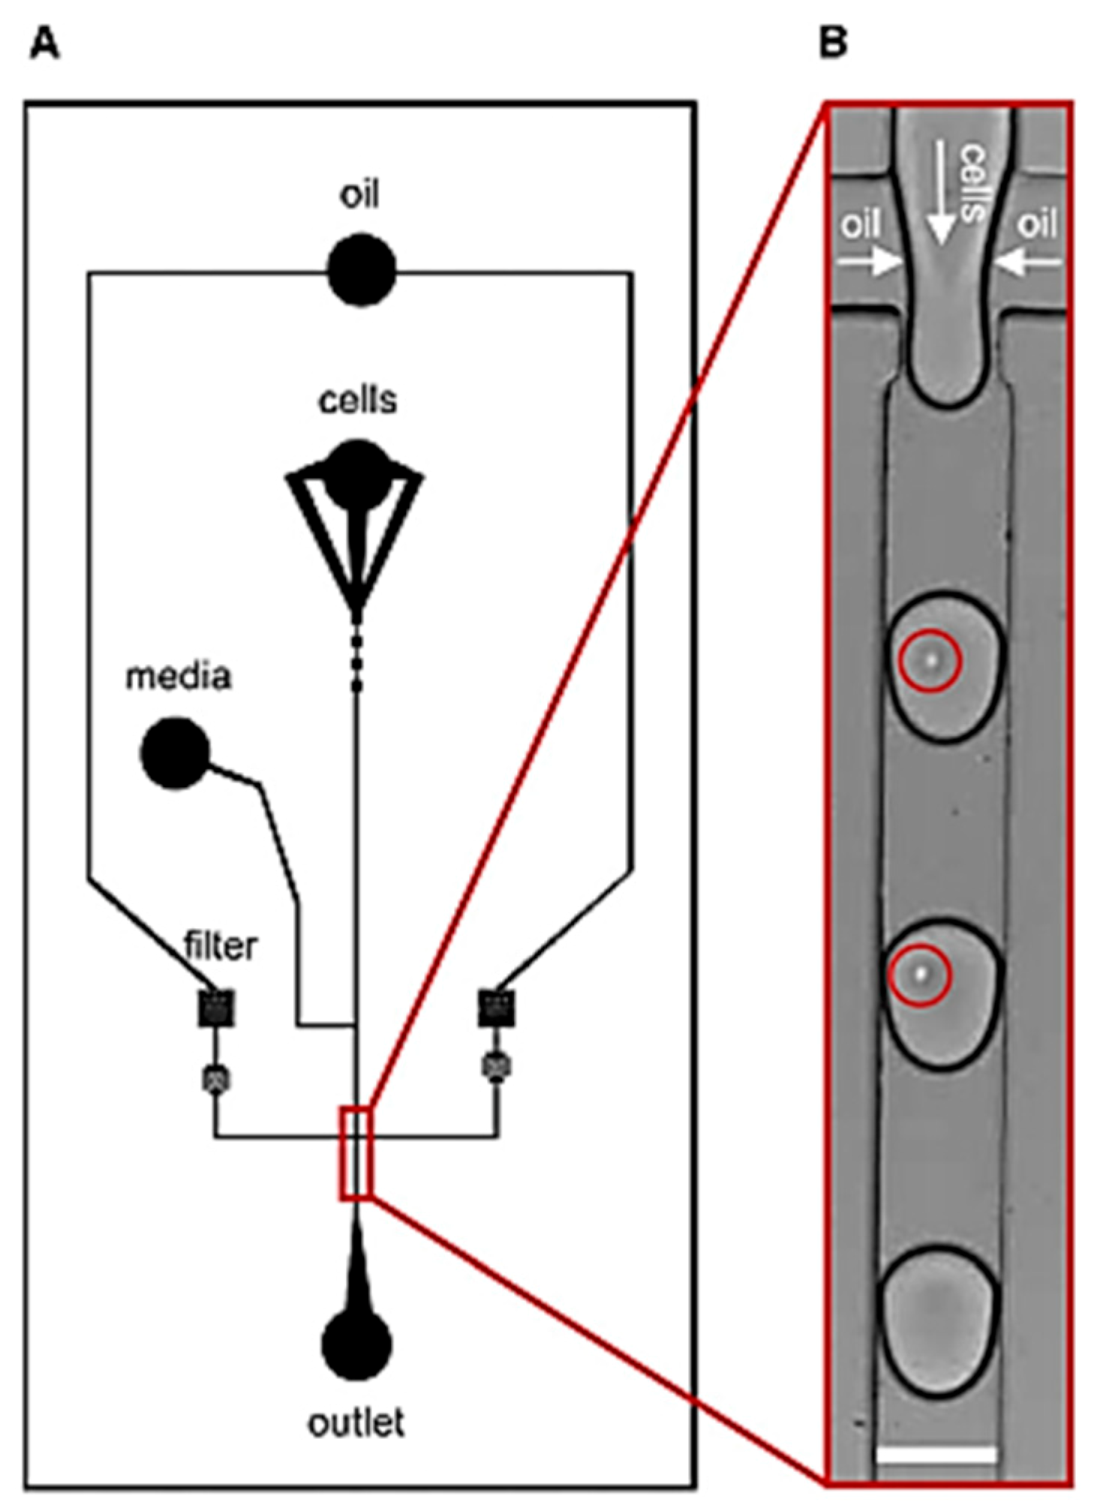
2.1.1. Droplet Microfluidics
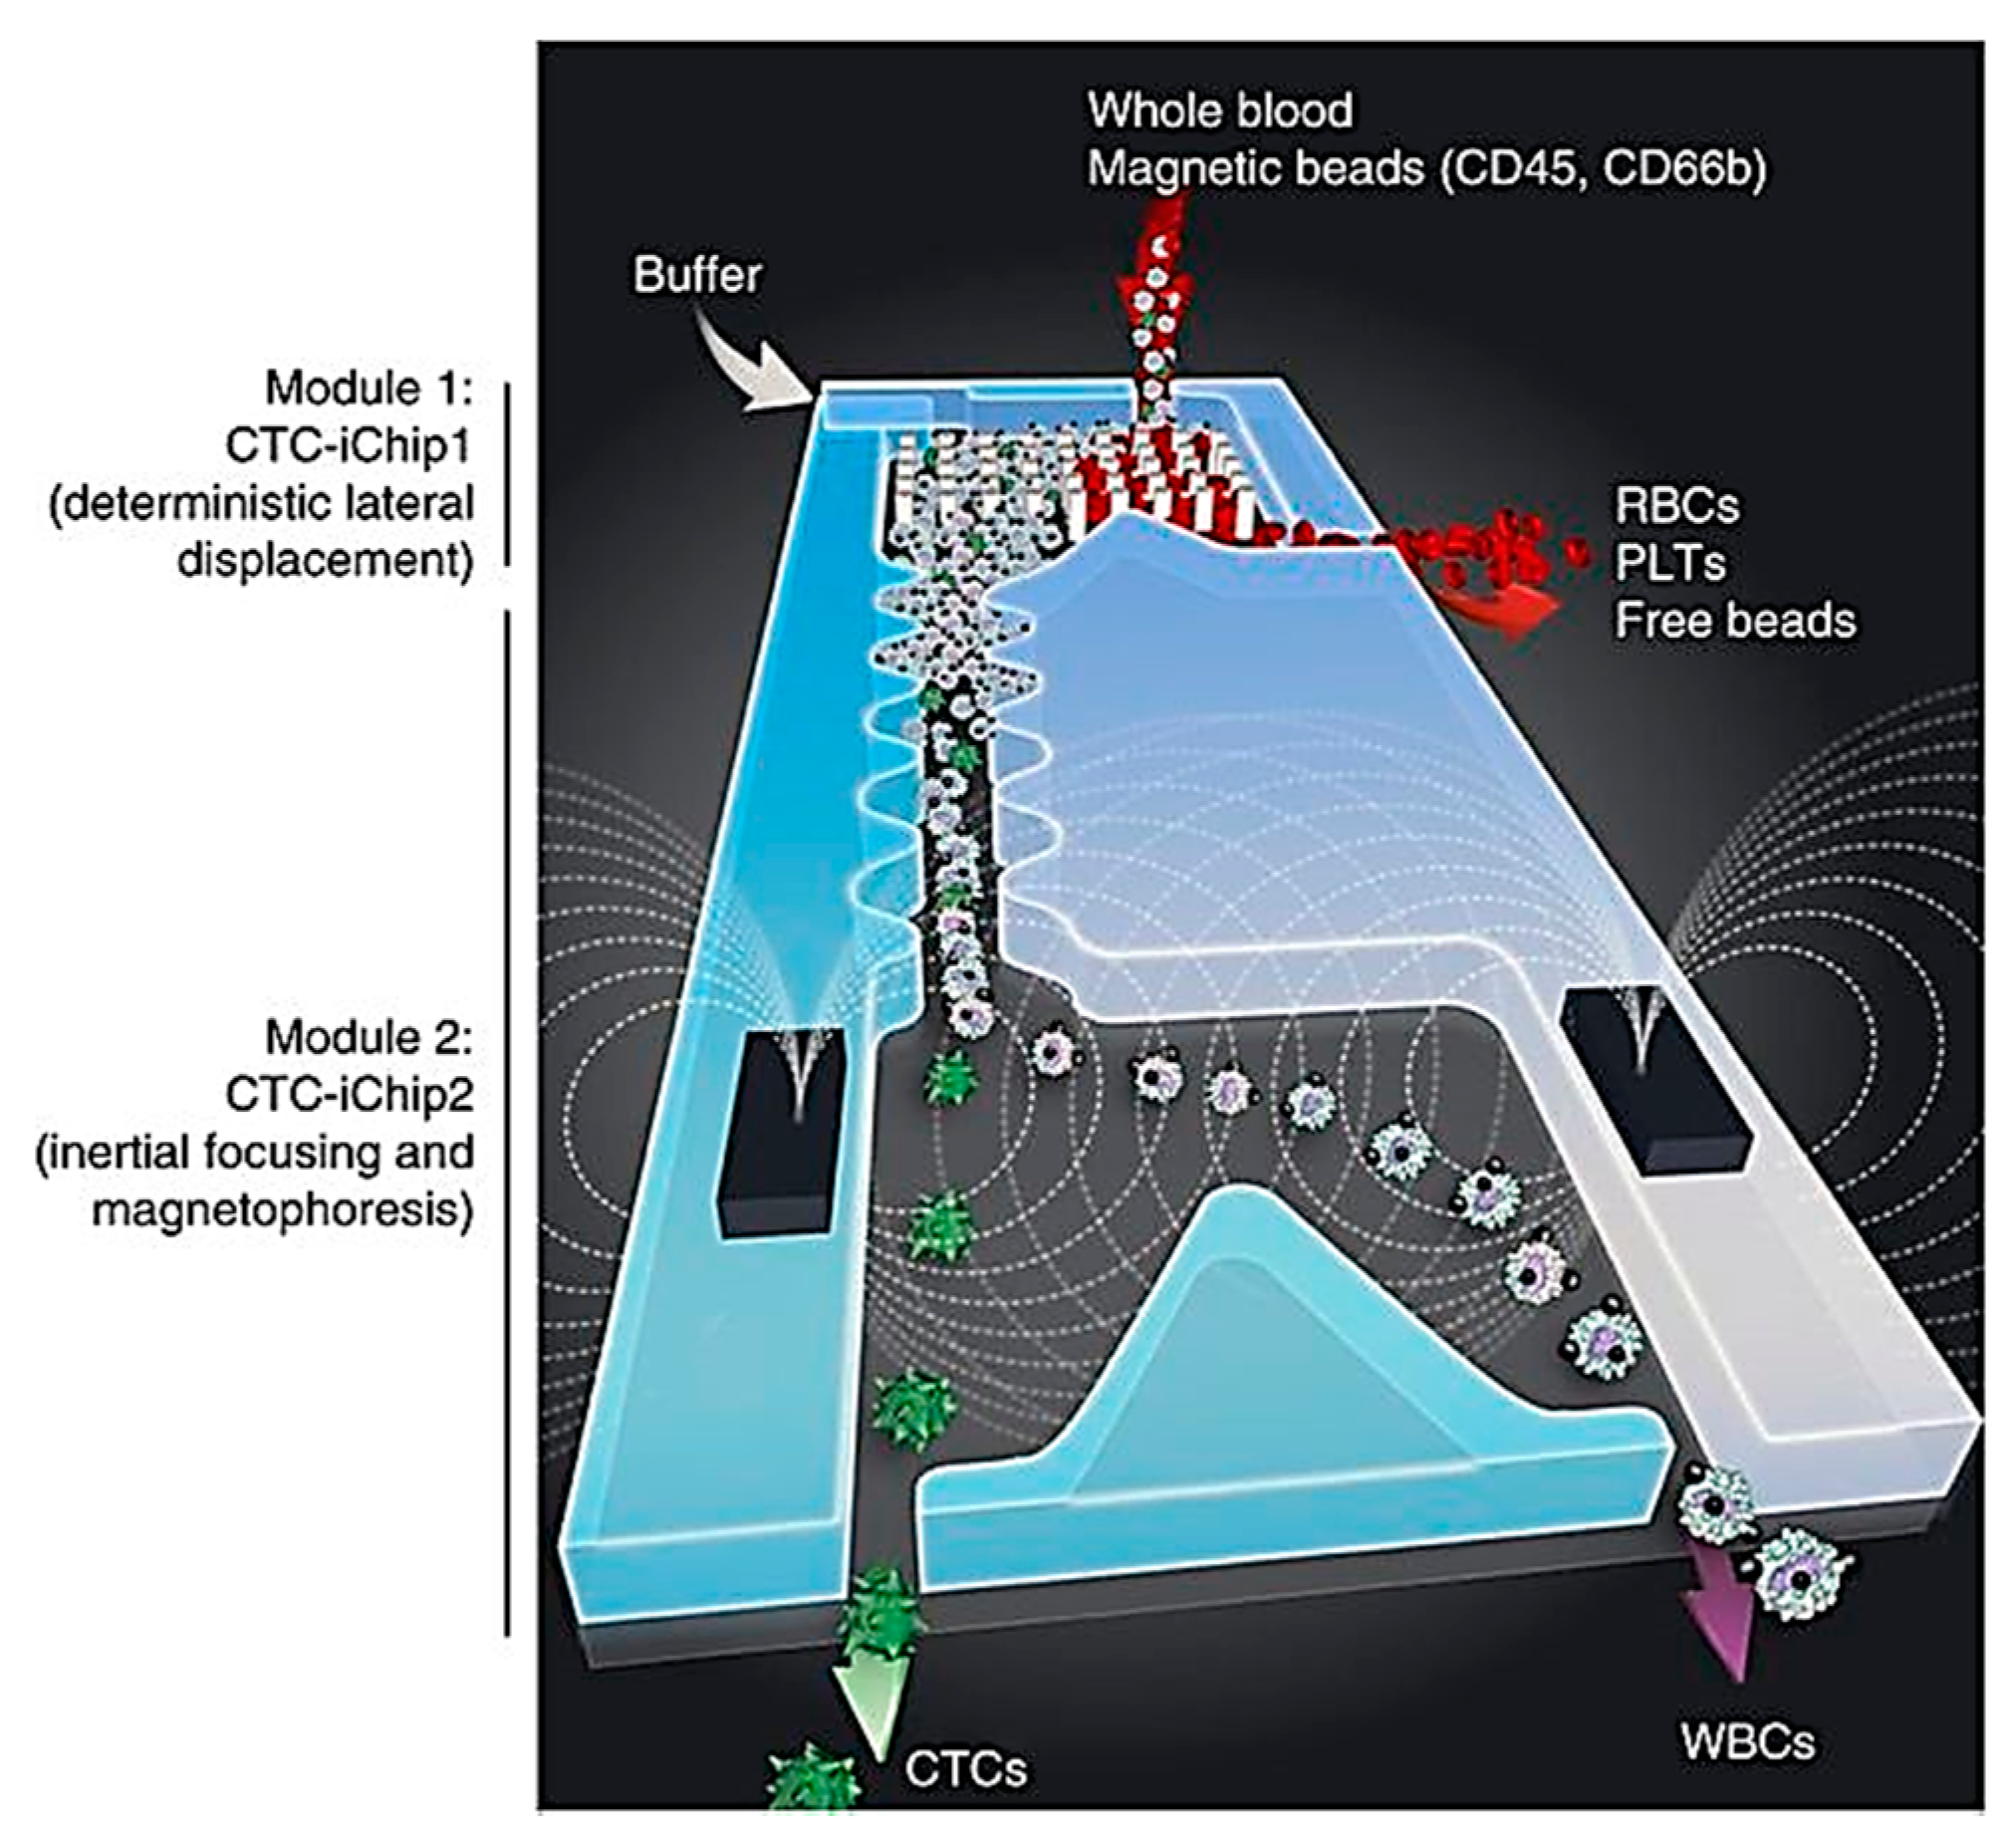
2.1.2. Microfluidic Deterministic Lateral Displacement Technology
2.1.3. Hydrodynamic Pressure Based Fluidic Manipulation
2.1.4. Fluidic Microarray Chip for Cellular Manipulation
2.2. Electric Field-Driven Manipulation
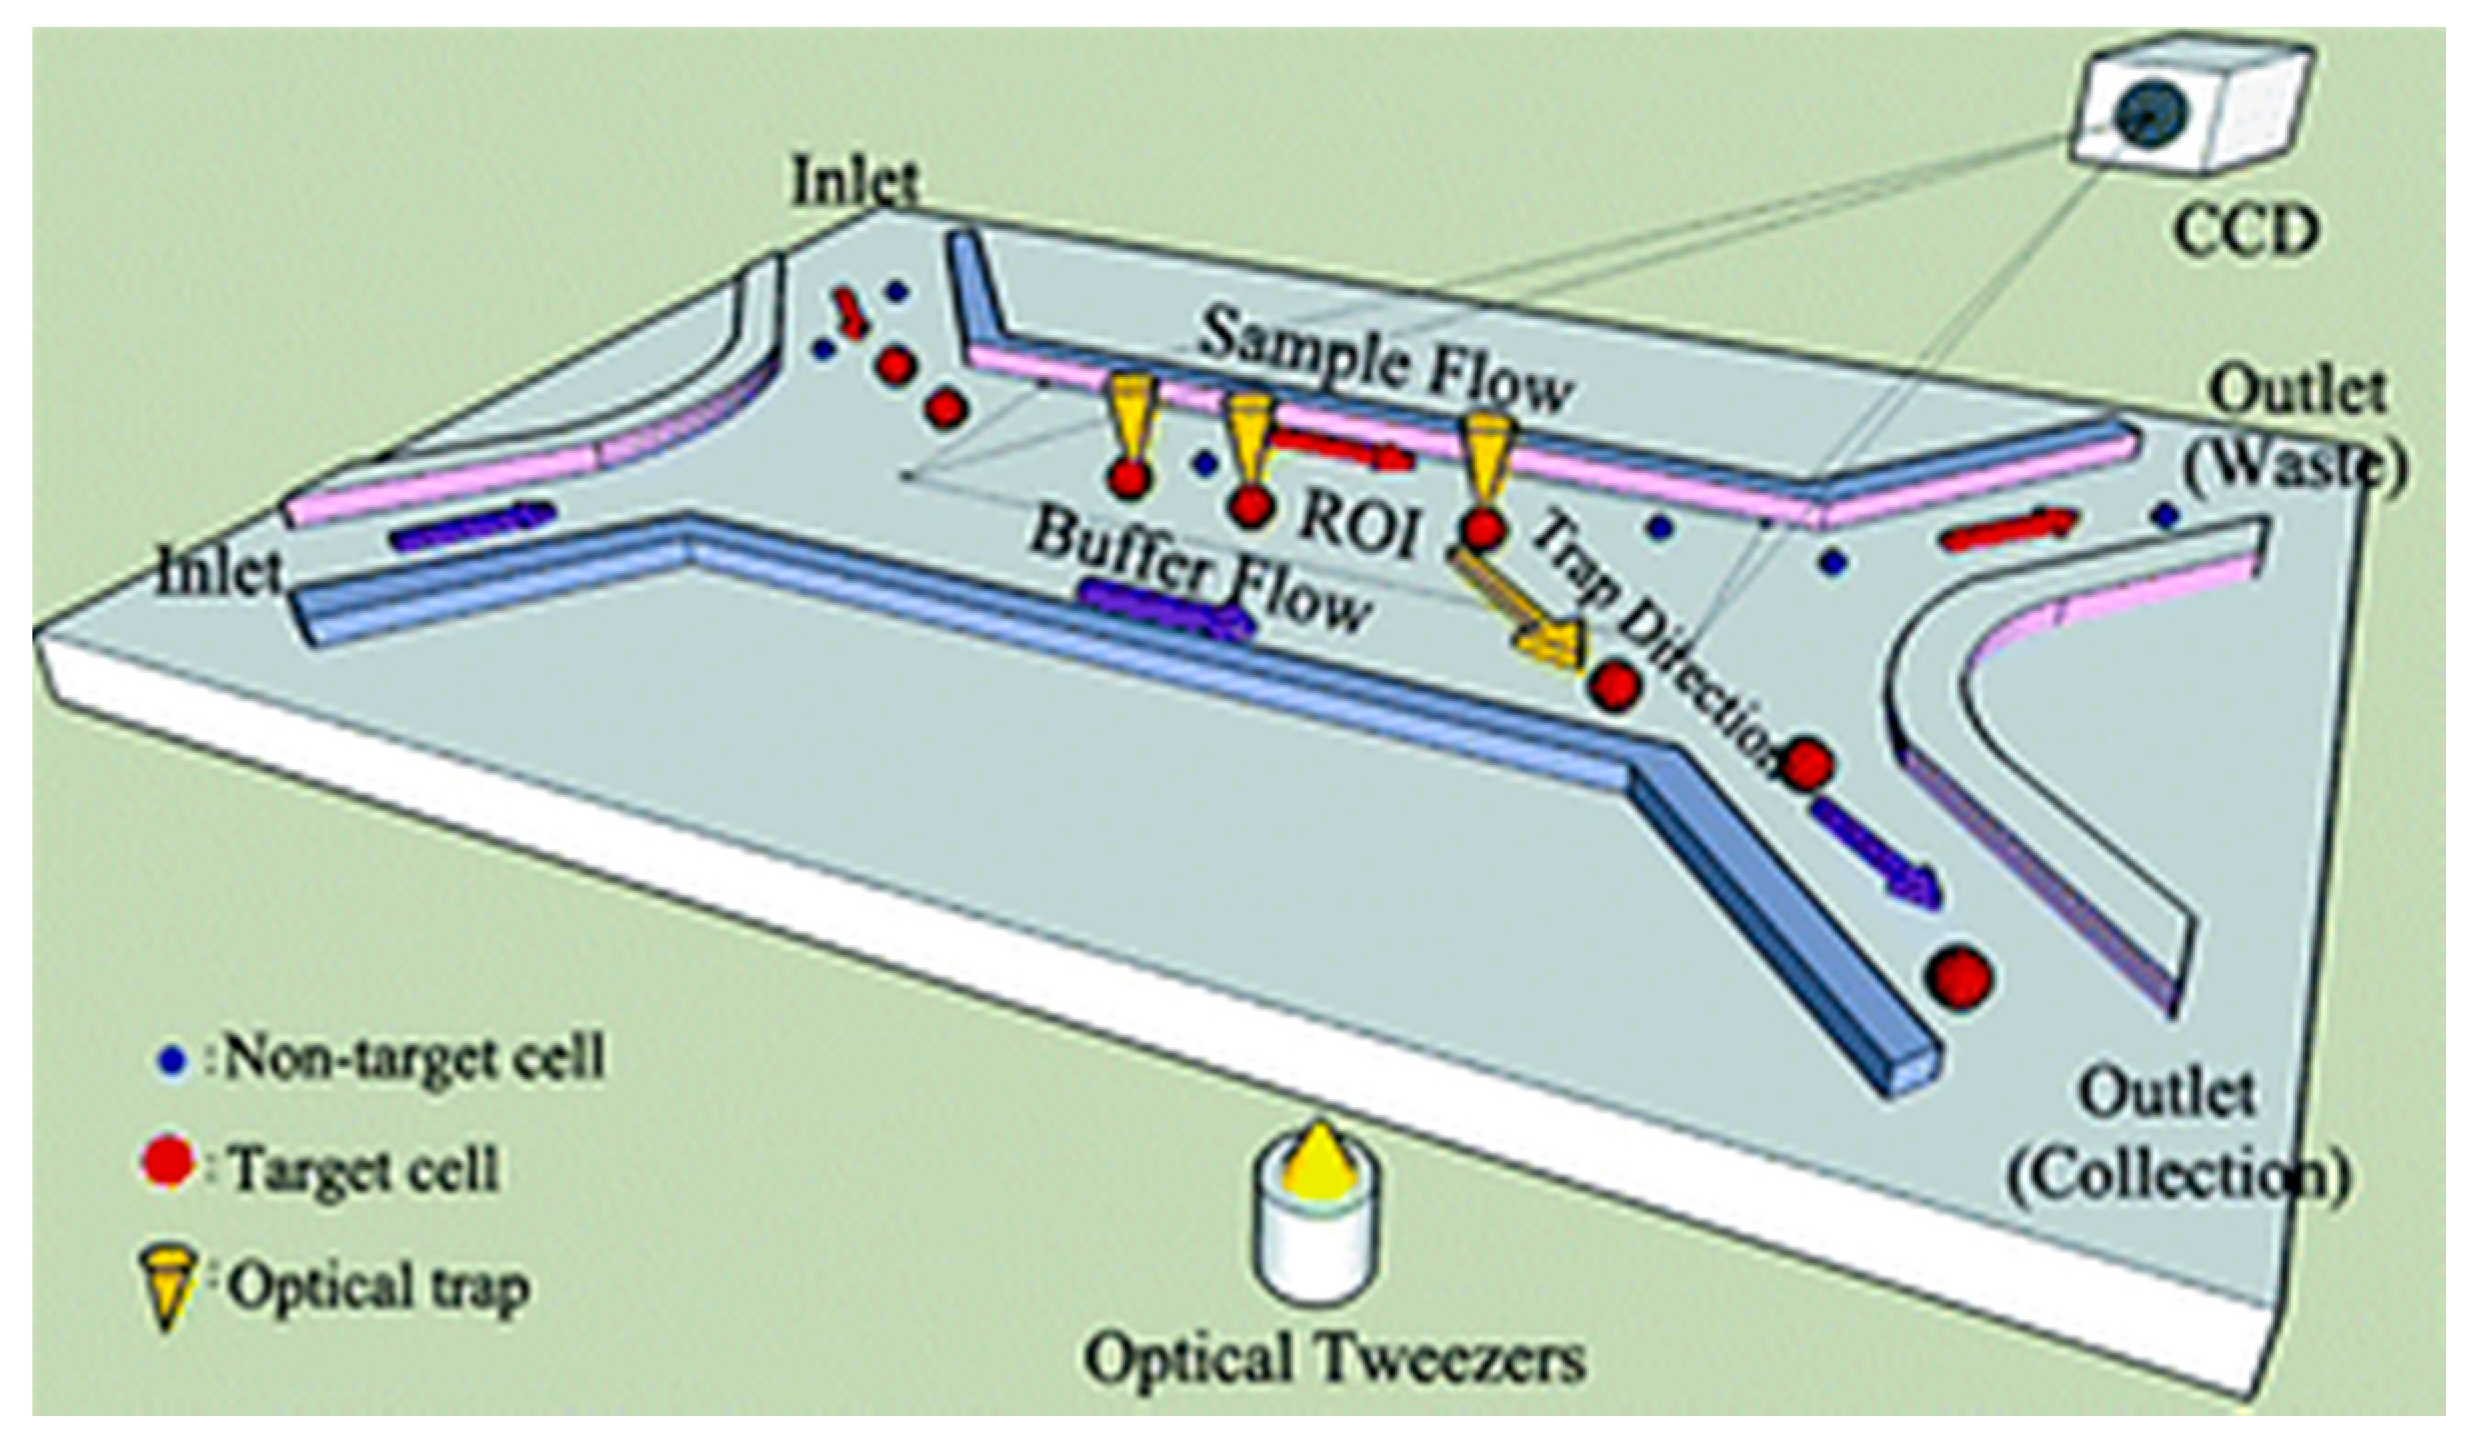
2.3. Optical Manipulation
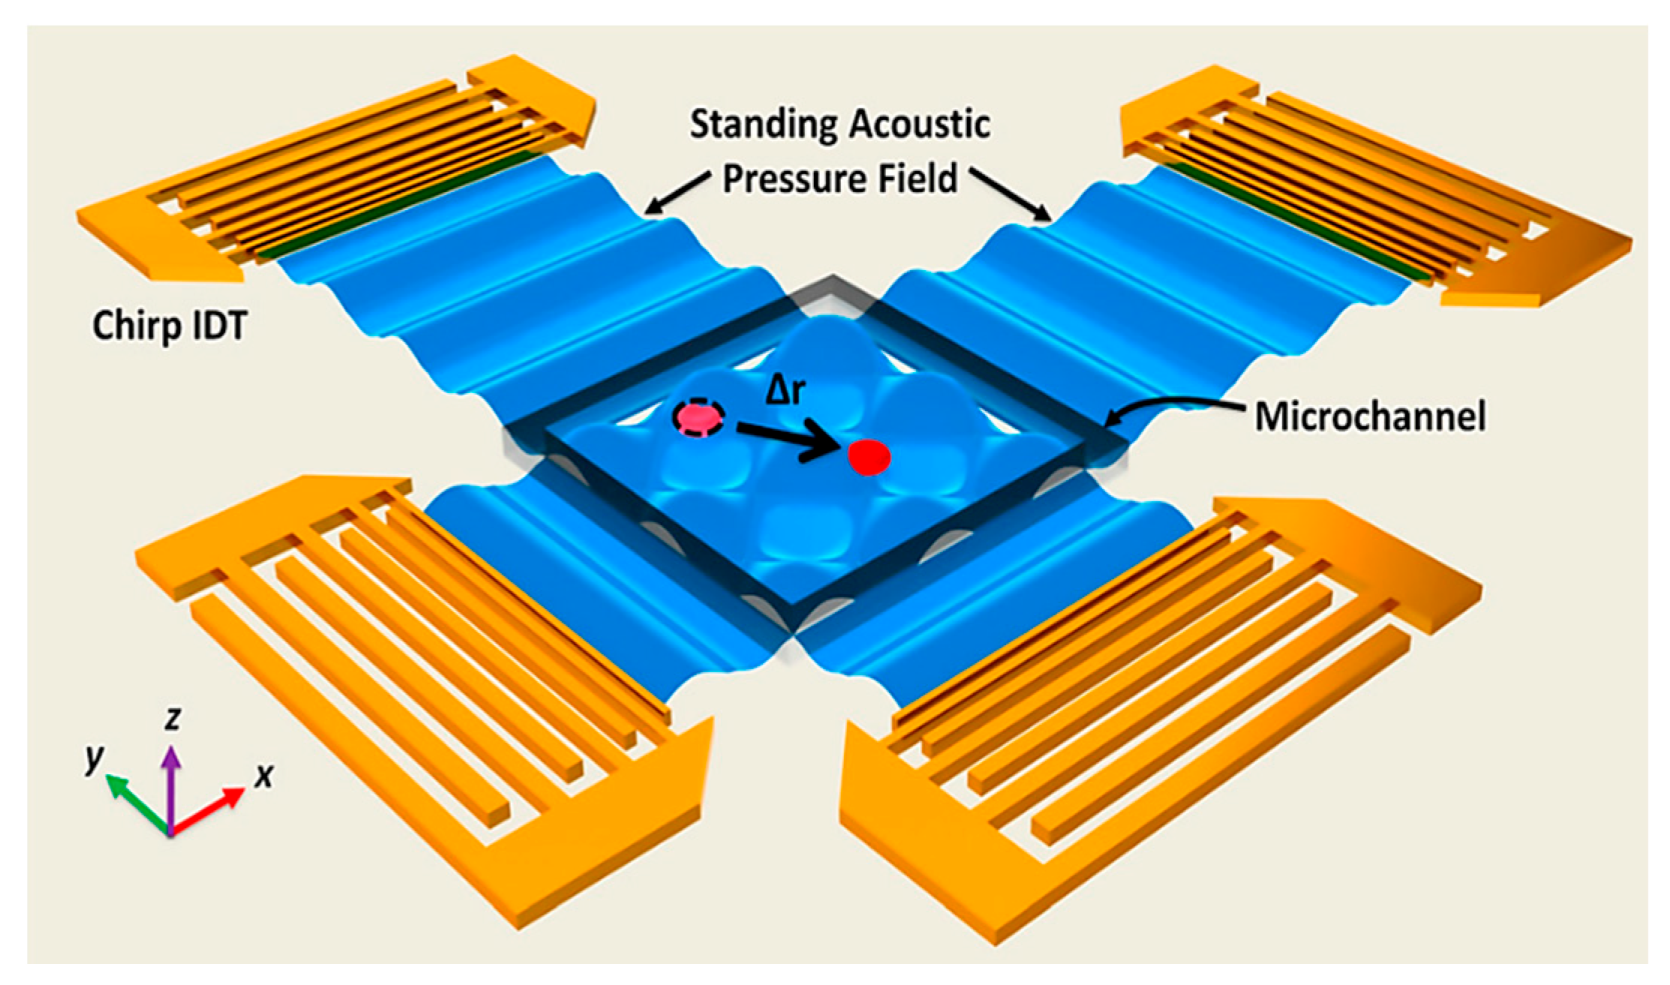
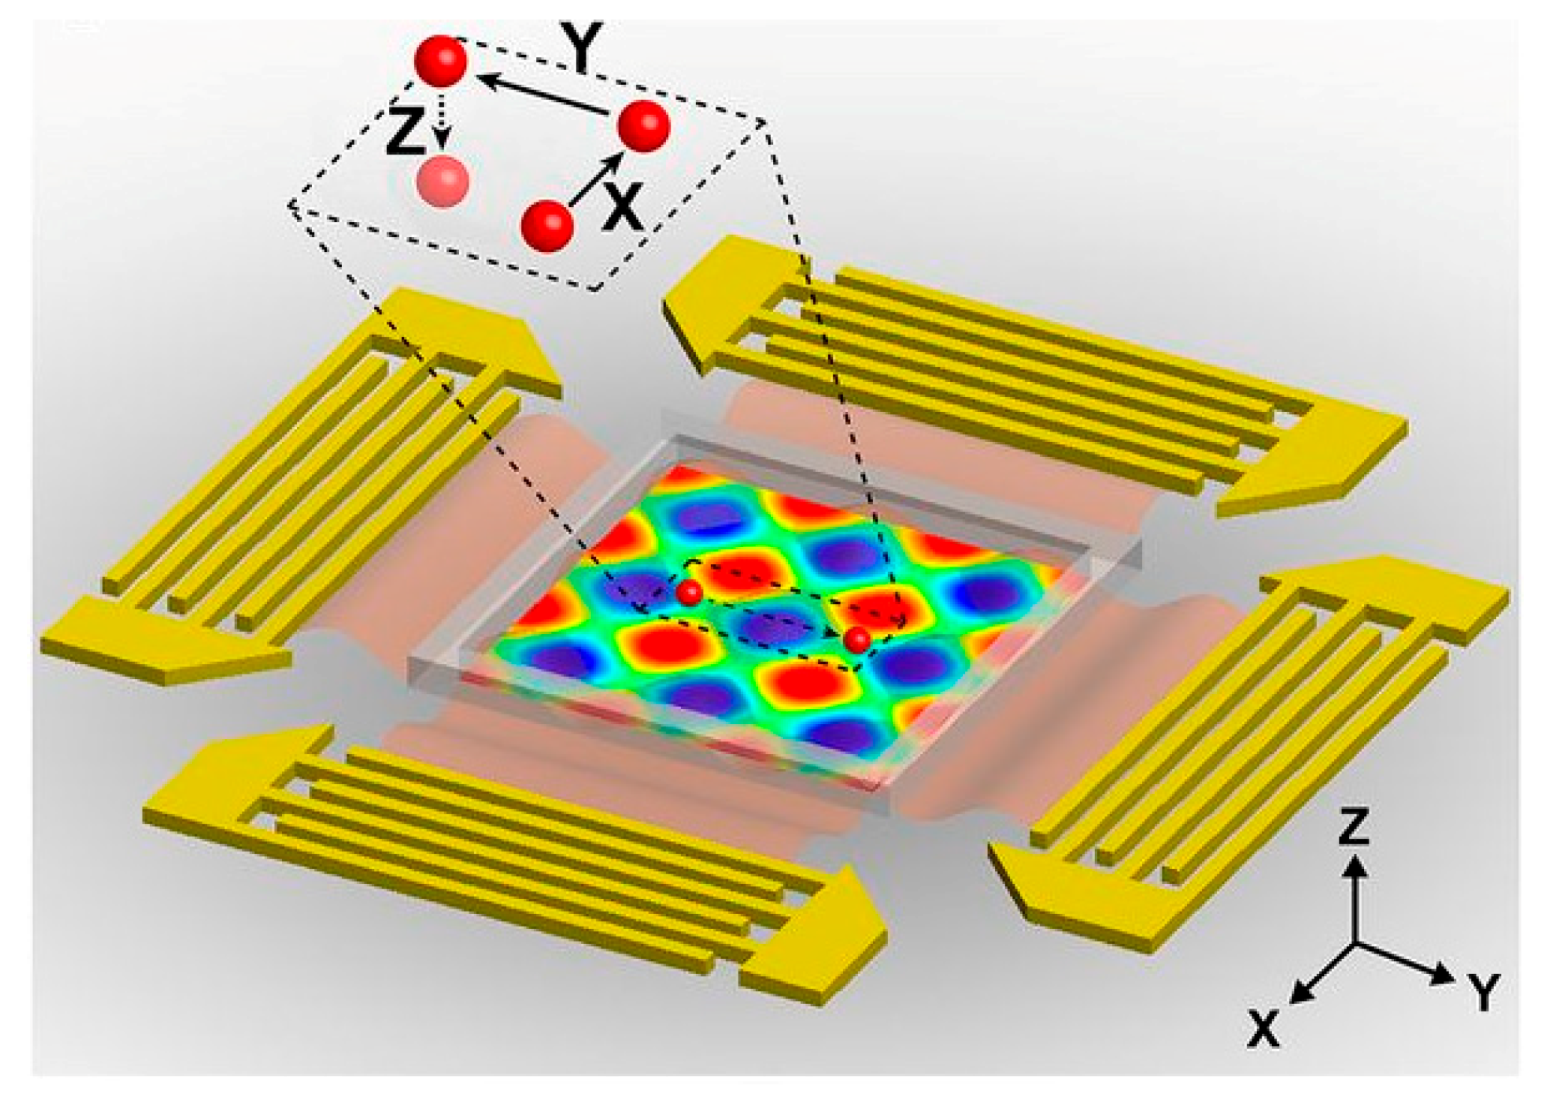
2.4. Acoustic Based Mainpulation
3. Single-Cell Technologies (SCT) for Research and Diagnosis
3.1. Single-Cell Separation and Detection
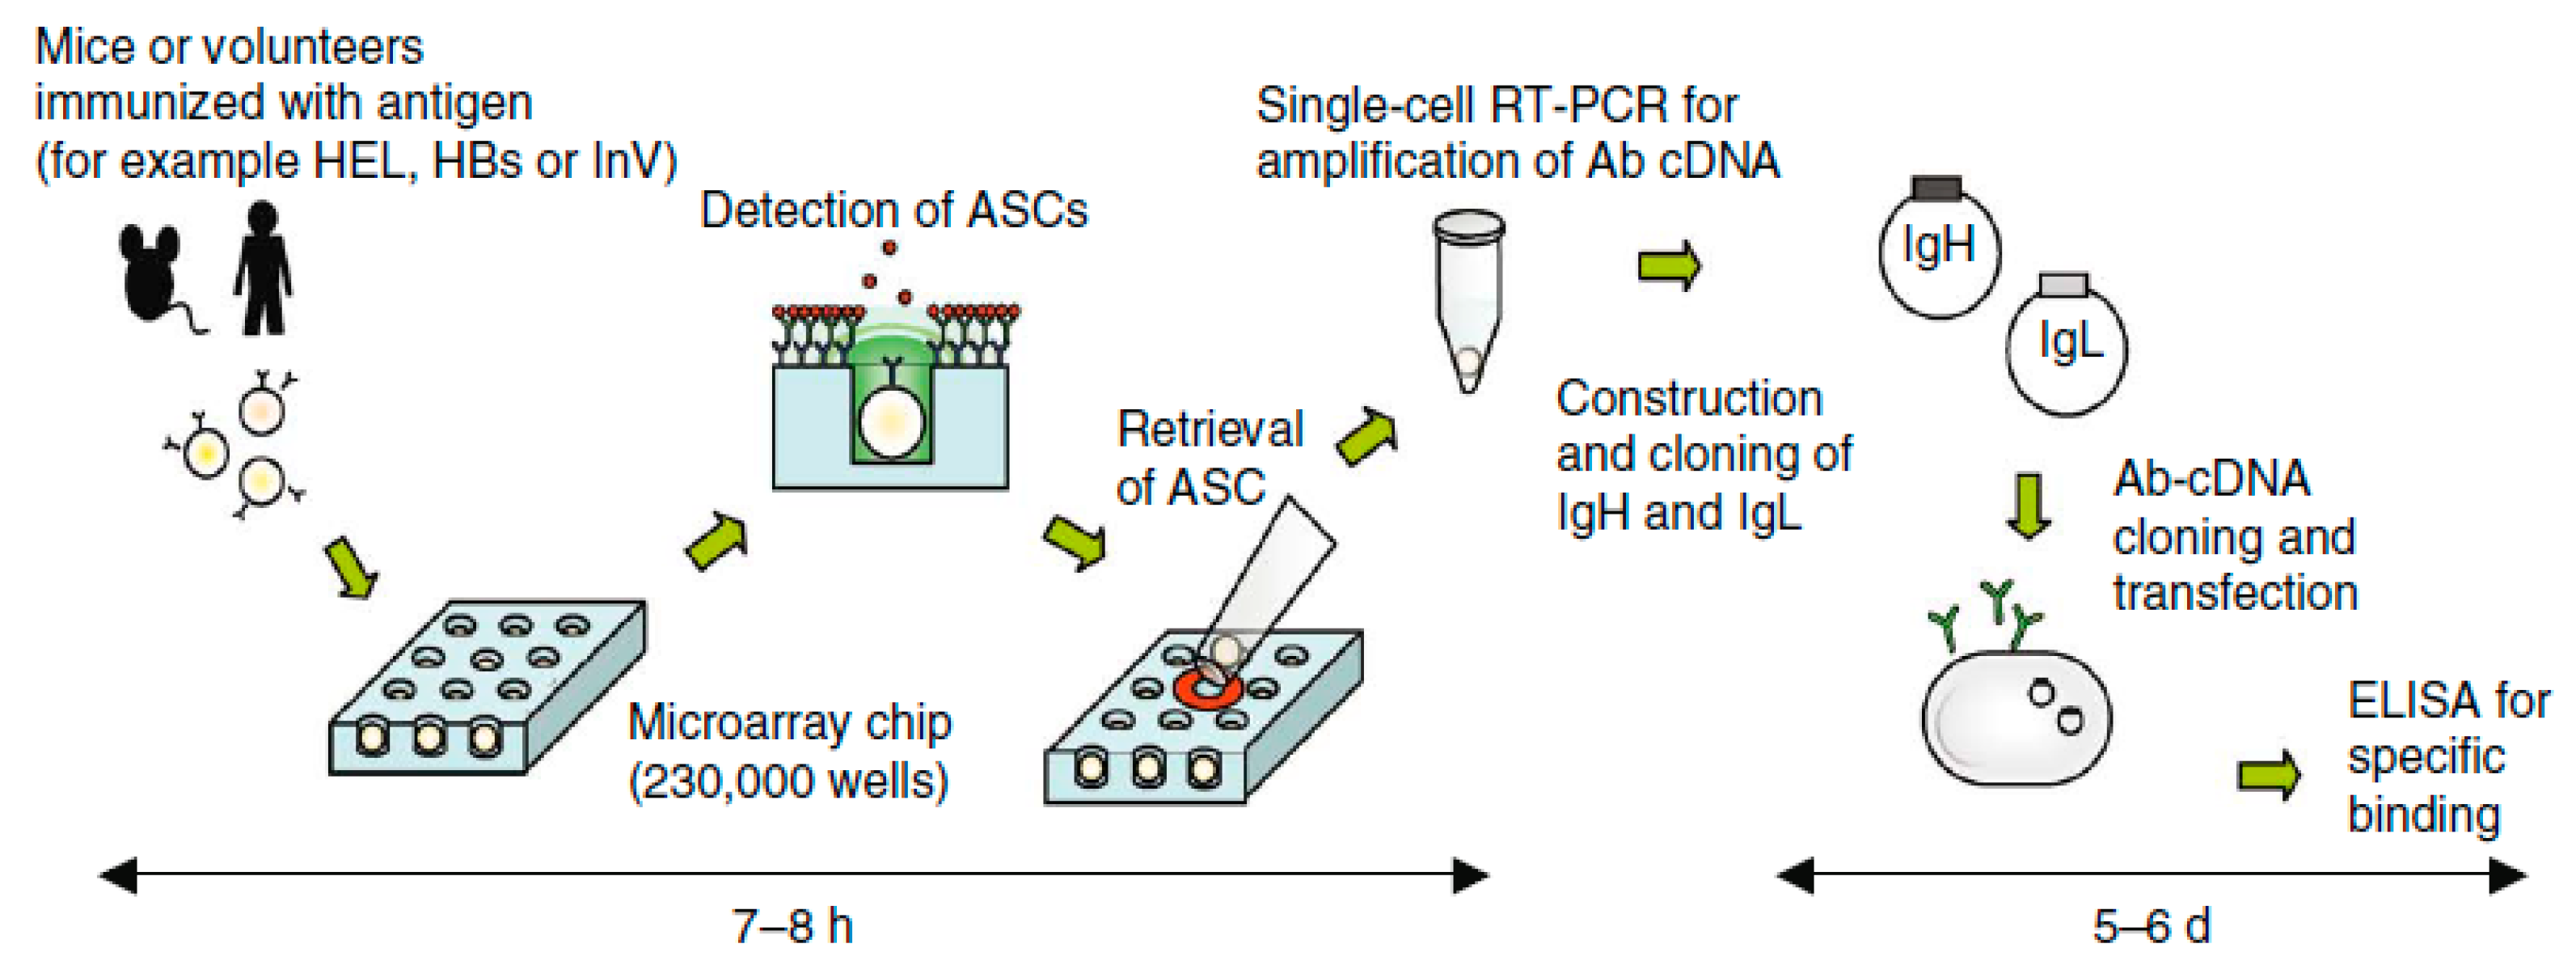
3.2. Antibody-Based Single-Cell Screening
3.2.1. NanoVelcro Microchip
3.2.2. Microarray Chip Based Screening
3.2.3. Micro Vortex Based Cell Isolation
4. SCT for Therapeutics Development
4.1. Single-Cell Electroporation
4.2. Optoporation
4.2.1. Bulk Optoporation
4.2.2. Focused Laser Beam Based Single-Cell Optoporation
4.2.3. Metal Nanostructure Assisted Single-Cell Optoporation
4.3. Single-Cell Mechanoporation
5. SCT Analytical Strategies
5.1. Better Visualization of Single-Cell Differentiation
5.2. Quantifying Single-Cell Growth
5.3. Single-Cells in 3D View
5.4. Cell Membrane Potential Measurement
5.5. Cytometry
5.6. Single Cell Sequencing
5.7. Intracellular Access
6. Development, Challenges, Applications and Future Prospects of Single-cell Technologies
7. Conclusions
Author Contributions
Acknowledgments
Conflicts of Interest
References
- Jorissen, R.N.; Walker, F.; Pouliot, N.; Garrett, T.P.J.; Ward, C.W.; Burgess, A.W. Epidermal growth factor receptor: Mechanisms of activation and signalling. Exp. Cell Res. 2003, 284, 31–53. [Google Scholar] [CrossRef]
- Santra, T.S.; Tseng, F.G. Recent trends on micro/nanofluidic single cell electroporation. Micromachines 2013, 4, 333–356. [Google Scholar] [CrossRef]
- Parsons, J.T.; Slack-Davis, J.K.; Tilghman, R.W.; Iwanicki, M.; Martin, K.H. Integrin signaling: Cell migration, proliferation, and survival. In Handbook of Cell Signaling; Elsevier: New York, NY, USA, 2011. [Google Scholar]
- Liu, Y.; Liu, F.; Grundke-Iqbal, I.; Iqbal, K.; Gong, C.-X. Deficient brain insulin signalling pathway in Alzheimer’s disease and diabetes. J. Pathol. 2011, 225, 54–62. [Google Scholar] [CrossRef] [PubMed]
- Zeidán-Chuliá, F.; de Oliveira, B.-H.; Salmina, A.B.; Casanova, M.F.; Gelain, D.P.; Noda, M.; Verkhratsky, A.; Moreira, J.C.F. Altered expression of Alzheimer’s disease-related genes in the cerebellum of autistic patients: A model for disrupted brain connectome and therapy. Cell Death Dis. 2014, 5, e1250. [Google Scholar] [CrossRef] [PubMed]
- Zuchner, T.; Schliebs, R.; Perez-Polo, J.R. Down-regulation of muscarinic acetylcholine receptor M2 adversely affects the expression of Alzheimer’s disease-relevant genes and proteins. J. Neurochem. 2005, 95, 20–32. [Google Scholar] [CrossRef] [PubMed]
- Jiang, P.; Li, C.; Xiang, Z.; Jiao, B. Tanshinone IIA reduces the risk of Alzheimer’s disease by inhibiting iNOS, MMP-2 and NF-κBp65 transcription and translation in the temporal lobes of rat models of Alzheimer’s disease. Mol. Med. Rep. 2014, 10, 689–694. [Google Scholar] [CrossRef] [PubMed]
- Bhagwat, A.S.; Vakoc, C.R. Targeting transcription factors in cancer. Trends Cancer 2015, 1, 53–65. [Google Scholar] [CrossRef] [PubMed]
- Wu, J.-H.; Sun, Y.-J.; Hsieh, P.-H.; Shieh, G.S. Inferring coregulation of transcription factors and microRNAs in breast cancer. Gene 2013, 518, 139–144. [Google Scholar] [CrossRef] [PubMed]
- Maulik, S.; Patel, S.D. Molecular Biotechnology: Therapeutic Applications and Strategies; John Wiley & Sons: Hoboken, NJ, USA, 1997. [Google Scholar]
- Cooper, G.M.; Ganem, D. The Cell: A Molecular Approach. Nat. Med. 1997, 3, 1042. [Google Scholar]
- Hamon, M.; Hong, J.W. New tools and new biology: Recent miniaturized systems for molecular and cellular biology. Mol. Cells 2013, 36, 485–506. [Google Scholar] [CrossRef] [PubMed] [Green Version]
- Swedlow, J.R. Innovation in biological microscopy: Current status and future directions. Bioessays 2012, 34, 333–340. [Google Scholar] [CrossRef] [PubMed] [Green Version]
- Akhtar, A.; Fuchs, E.; Mitchison, T.; Shaw, R.J.; St Johnston, D.; Strasser, A.; Taylor, S.; Walczak, C.; Zerial, M. A decade of molecular cell biology: Achievements and challenges. Nat. Rev. Mol. Cell Biol. 2011, 12, 669–674. [Google Scholar] [CrossRef] [PubMed]
- Kanapathipillai, M.; Brock, A.; Ingber, D.E. Nanoparticle targeting of anti-cancer drugs that alter intracellular signaling or influence the tumor microenvironment. Adv. Drug Deliv. Rev. 2014, 79, 107–118. [Google Scholar] [CrossRef] [PubMed]
- Allen, T.M.; Cullis, P.R. Liposomal drug delivery systems: From concept to clinical applications. Adv. Drug Deliv. Rev. 2013, 65, 36–48. [Google Scholar] [CrossRef] [PubMed]
- Agarwal, P.; Bertozzi, C.R. Site-specific antibody-drug conjugates: The nexus of bioorthogonal chemistry, protein engineering, and drug development. Bioconjug. Chem. 2015, 26, 176–192. [Google Scholar] [CrossRef] [PubMed]
- Wen, L.; Tang, F. Single-cell sequencing in stem cell biology. Genome Biol. 2016, 17, 71. [Google Scholar] [CrossRef] [PubMed]
- Korthauer, K.D.; Chu, L.-F.; Newton, M.A.; Li, Y.; Thomson, J.; Stewart, R.; Kendziorski, C. A statistical approach for identifying differential distributions in single-cell RNA-seq experiments. Genome Biol. 2016, 17, 222. [Google Scholar] [CrossRef] [PubMed] [Green Version]
- Kim, K.-T.; Lee, H.W.; Lee, H.-O.; Song, H.J.; Shin, S.; Kim, H.; Shin, Y.; Nam, D.-H.; Jeong, B.C.; Kirsch, D.G.; et al. Application of single-cell RNA sequencing in optimizing a combinatorial therapeutic strategy in metastatic renal cell carcinoma. Genome Biol. 2016, 17, 80. [Google Scholar] [CrossRef] [PubMed]
- Jahn, K.; Kuipers, J.; Beerenwinkel, N. Tree inference for single-cell data. Genome Biol. 2016, 17, 86. [Google Scholar] [CrossRef] [PubMed] [Green Version]
- Heath, J.R.; Ribas, A.; Mischel, P.S. Single-cell analysis tools for drug discovery and development. Nat. Rev. Drug Discov. 2016, 15, 204–216. [Google Scholar] [CrossRef] [PubMed]
- Neužil, P.; Campos, C.D.M.; Wong, C.C.; Soon, J.B.W.; Reboud, J.; Manz, A. From chip-in-a-lab to lab-on-a-chip: Towards a single handheld electronic system for multiple application-specific lab-on-a-chip (ASLOC). Lab Chip 2014, 14, 2168–2176. [Google Scholar] [CrossRef] [PubMed]
- Whitesides, G. The lab finally comes to the chip! Lab Chip 2014, 14, 3125–3126. [Google Scholar] [CrossRef] [PubMed]
- Schulte, T.H.; Bardell, R.L.; Weigl, B.H. Microfluidic technologies in clinical diagnostics. Clin. Chim. Acta 2002, 321, 1–10. [Google Scholar] [CrossRef]
- Tseng, F.-G.; Santra, T.S. Micro/Nano Fluidic Devices for Single Cell Analysis. Micromachines 2014, 5, 154–157. [Google Scholar]
- Tseng, F.-G.; Santra, T.S. Essentials of Single-Cell Analysis: Concepts, Applications and Future Prospects. In Essentials of Single-Cell Analysis: Concepts, Applications and Future Prospects; Springer: Berlin/Heidelberg, Germany, 2016; pp. 85–129. [Google Scholar]
- Chattopadhyay, P.K.; Gierahn, T.M.; Roederer, M.; Love, J.C. Single-cell technologies for monitoring immune systems. Nat. Immunol. 2014, 15, 128–135. [Google Scholar] [CrossRef] [PubMed] [Green Version]
- Liang, S.-B.; Fu, L.-W. Application of single-cell technology in cancer research. Biotechnol. Adv. 2017, 35, 443–449. [Google Scholar] [CrossRef] [PubMed]
- Fritzsch, F.S.O.; Dusny, C.; Frick, O.; Schmid, A. Single-cell analysis in biotechnology, systems biology, and biocatalysis. Annu. Rev. Chem. Biomol. Eng. 2012, 3, 129–155. [Google Scholar] [CrossRef] [PubMed]
- Tseng, F.-G.; Santra, T.S. Single Cell Analysis in Biotechnology and System Biology; MDPI AG: Basel, Switzerland, 2016. [Google Scholar]
- Kar, S.; Mohan, L.; Dey, K.; Shinde, P.; Chang, H.-Y.; Nagai, M.; Santra, T.S. Single Cell Electroporation-Current Trends, Applications and Future prospects. J. Micromech. Microeng. 2018, in press. [Google Scholar] [CrossRef]
- Kumar, A.; Mohan, L.; Shinde, P.; Chang, H.Y.; Nagai, M.; Santra, T.S. Mechanoporation: Toward Single Cell Approaches. In Handbook of Single Cell Technologies; Santra, T., Tseng, F.G., Eds.; Springer: Singapore, 2018. [Google Scholar]
- Skelley, A.M.; Kirak, O.; Suh, H.; Jaenisch, R.; Voldman, J. Microfluidic control of cell pairing and fusion. Nat. Methods 2009, 6, 147–152. [Google Scholar] [CrossRef] [PubMed] [Green Version]
- Frimat, J.-P.; Becker, M.; Chiang, Y.-Y.; Marggraf, U.; Janasek, D.; Hengstler, J.G.; Franzke, J.; West, J. A microfluidic array with cellular valving for single cell co-culture. Lab Chip 2011, 11, 231–237. [Google Scholar] [CrossRef] [PubMed] [Green Version]
- Hong, S.; Pan, Q.; Lee, L.P. Single-cell level co-culture platform for intercellular communication. Integr. Biol. 2012, 4, 374–380. [Google Scholar] [CrossRef] [PubMed]
- Chen, Y.-C.; Cheng, Y.-H.; Kim, H.S.; Ingram, P.N.; Nor, J.E.; Yoon, E. Paired single cell co-culture microenvironments isolated by two-phase flow with continuous nutrient renewal. Lab Chip 2014, 14, 2941–2947. [Google Scholar] [CrossRef] [PubMed] [Green Version]
- Huang, W.-H.; Cheng, W.; Zhang, Z.; Pang, D.-W.; Wang, Z.-L.; Cheng, J.-K.; Cui, D.-F. Transport, location, and quantal release monitoring of single cells on a microfluidic device. Anal. Chem. 2004, 76, 483–488. [Google Scholar] [CrossRef] [PubMed]
- Thielecke, H.; Stieglitz, T.; Beutel, H.; Matthies, T.; Ruf, H.H.; Meyer, J.-U. Fast and precise positioning of single cells on planar electrode substrates. IEEE Eng. Med. Biol. Mag. 1999, 18, 48–52. [Google Scholar] [CrossRef] [PubMed]
- Wheeler, A.R.; Throndset, W.R.; Whelan, R.J.; Leach, A.M.; Zare, R.N.; Liao, Y.H.; Farrell, K.; Manger, I.D.; Daridon, A. Microfluidic device for single-cell analysis. Anal. Chem. 2003, 75, 3581–3586. [Google Scholar] [CrossRef] [PubMed]
- Yun, K.-S.; Yoon, E. Micro/nanofluidic device for single-cell-based assay. Biomed. Microdevices 2005, 7, 35–40. [Google Scholar] [CrossRef] [PubMed]
- Müller, T.; Gradl, G.; Howitz, S.; Shirley, S.; Schnelle, T.; Fuhr, G. A 3-D microelectrode system for handling and caging single cells and particles. Biosens. Bioelectron. 1999, 14, 247–256. [Google Scholar] [CrossRef]
- Taff, B.M.; Voldman, J. A scalable addressable positive-dielectrophoretic cell-sorting array. Anal. Chem. 2005, 77, 7976–7983. [Google Scholar] [CrossRef] [PubMed]
- Manaresi, N.; Romani, A.; Medoro, G.; Altomare, L.; Leonardi, A.; Tartagni, M.; Guerrieri, R. A CMOS chip for individual cell manipulation and detection. IEEE J. Solid-State Circuits 2003, 38, 2297–2305. [Google Scholar] [CrossRef]
- Park, H.; Kim, D.; Yun, K.S. Single-cell manipulation on microfluidic chip by dielectrophoretic actuation and impedance detection. Sens. Actuators B Chem. 2010, 150, 167–173. [Google Scholar] [CrossRef]
- Gray, D.S.; Tan, J.L.; Voldman, J.; Chen, C.S. Dielectrophoretic registration of living cells to a microelectrode array. Biosens. Bioelectron. 2004, 19, 771–780. [Google Scholar] [CrossRef] [PubMed]
- Albrecht, D.R.; Tsang, V.L.; Sah, R.L.; Bhatia, S.N. Photo-and electropatterning of hydrogel-encapsulated living cell arrays. Lab Chip 2005, 5, 111–118. [Google Scholar] [CrossRef] [PubMed]
- Toriello, N.M.; Douglas, E.S.; Mathies, R.A. Microfluidic device for electric field-driven single-cell capture and activation. Anal. Chem. 2005, 77, 6935–6941. [Google Scholar] [CrossRef] [PubMed]
- Juan, M.L.; Righini, M.; Quidant, R. Plasmon nano-optical tweezers. Nat. Photonics 2011, 5, 349–356. [Google Scholar] [CrossRef]
- Chiou, P.Y.; Ohta, A.T.; Wu, M.C. Massively parallel manipulation of single cells and microparticles using optical images. Nature 2005, 436, 370–372. [Google Scholar] [CrossRef] [PubMed]
- Mirsaidov, U.; Scrimgeour, J.; Timp, W.; Beck, K.; Mir, M.; Matsudaira, P.; Timp, G. Live cell lithography: Using optical tweezers to create synthetic tissue. Lab Chip 2008, 8, 2174–2181. [Google Scholar] [CrossRef] [PubMed]
- Ashkin, A.; Dziedzic, J.M.; Yamane, T. Optical trapping and manipulation of single cells using infrared laser beams. Nature 1987, 330, 769–771. [Google Scholar] [CrossRef] [PubMed]
- Arai, F.; Ichikawa, A.; Ogawa, M.; Fukuda, T.; Horio, K.; Itoigawa, K. High-speed separation system of randomly suspended single living cells by laser trap and dielectrophoresis. Electrophoresis 2001, 22, 283–288. [Google Scholar] [CrossRef]
- Schroder, B.W.; Johnson, B.M.; Garrity, D.M.; Dasi, L.P.; Krapf, D. Force spectroscopy in the bloodstream of live embryonic zebrafish with optical tweezers. In Frontiers in Optics; Optical Society of America: Washington, DC, USA, 2014. [Google Scholar]
- Theberge, A.B.; Courtois, F.; Schaerli, Y.; Fischlechner, M.; Abell, C.; Hollfelder, F.; Huck, W.T.S. Microdroplets in microfluidics: An evolving platform for discoveries in chemistry and biology. Angew. Chem. Int. Ed. 2010, 49, 5846–5868. [Google Scholar] [CrossRef] [PubMed]
- Shang, L.; Cheng, Y.; Zhao, Y. Emerging droplet microfluidics. Chem. Rev. 2017, 117, 7964–8040. [Google Scholar] [CrossRef] [PubMed]
- Clausell-Tormos, J.; Lieber, D.; Baret, J.-C.; El-Harrak, A.; Miller, O.J.; Frenz, L.; Blouwolff, J.; Humphry, K.J.; Köster, S.; Duan, H.; et al. Droplet-based microfluidic platforms for the encapsulation and screening of mammalian cells and multicellular organisms. Chem. Biol. 2008, 15, 427–437. [Google Scholar] [CrossRef] [PubMed]
- Sukhatme, S.; Agarwal, A. Digital microfluidics: Techniques, their applications and advantages. J. Bioeng. Biomed. Sci. 2012, 8, 2. [Google Scholar]
- Karabacak, N.M.; Spuhler, P.S.; Fachin, F.; Lim, E.J.; Pai, V.; Ozkumur, E.; Martel, J.M.; Kojic, N.; Smith, K.; Chen, P.; et al. Microfluidic, marker-free isolation of circulating tumor cells from blood samples. Nat. Protoc. 2014, 9, 694. [Google Scholar] [CrossRef] [PubMed]
- Kirby, B.J.; Jodari, M.; Loftus, M.S.; Gakhar, G.; Pratt, E.D.; Chanel-Vos, C.; Gleghorn, J.P.; Santana, S.M.; Liu, H.; Smith, J.P.; et al. Functional characterization of circulating tumor cells with a prostate-cancer-specific microfluidic device. PLoS ONE 2012, 7, e35976. [Google Scholar] [CrossRef]
- Sheng, W.; Ogunwobi, O.O.; Chen, T.; Zhang, J.; George, T.J.; Liu, C.; Fan, Z.H. Capture, release and culture of circulating tumor cells from pancreatic cancer patients using an enhanced mixing chip. Lab Chip 2014, 14, 89–98. [Google Scholar] [CrossRef] [PubMed] [Green Version]
- Arakawa, T.; Noguchi, M.; Sumitomo, K.; Yamaguchi, Y.; Shoji, S. High-throughput single-cell manipulation system for a large number of target cells. Biomicrofluidics 2011, 5, 14114. [Google Scholar] [CrossRef] [PubMed] [Green Version]
- Bragheri, F.; Osellame, R. Hydrodynamic lift for single cell manipulation in a femtosecond laser fabricated optofluidic chip. Optofluidics Microfluidics Nanofluidics 2017, 4, 14–17. [Google Scholar] [CrossRef] [Green Version]
- Lincoln, B.; Schinkinger, S.; Travis, K.; Wottawah, F.; Ebert, S.; Sauer, F.; Guck, J. Reconfigurable microfluidic integration of a dual-beam laser trap with biomedical applications. Biomed. Microdevices 2007, 9, 703–710. [Google Scholar] [CrossRef] [PubMed]
- Di Carlo, D.; Wu, L.Y.; Lee, L.P. Dynamic single cell culture array. Lab Chip 2006, 6, 1445–1449. [Google Scholar] [CrossRef] [PubMed]
- Wlodkowic, D.; Faley, S.; Zagnoni, M.; Wikswo, J.P.; Cooper, J.M. Microfluidic single-cell array cytometry for the analysis of tumor apoptosis. Anal. Chem. 2009, 81, 5517–5523. [Google Scholar] [CrossRef] [PubMed]
- Faley, S.L.; Copland, M.; Wlodkowic, D.; Kolch, W.; Seale, K.T.; Wikswo, J.P.; Cooper, J.M. Microfluidic single cell arrays to interrogate signalling dynamics of individual, patient-derived hematopoietic stem cells. Lab Chip 2009, 9, 2659–2664. [Google Scholar] [CrossRef] [PubMed]
- Xu, X.; Sarder, P.; Li, Z.; Nehorai, A. Optimization of microfluidic microsphere-trap arrays. Biomicrofluidics 2013, 7, 14112. [Google Scholar] [CrossRef] [PubMed] [Green Version]
- Yusof, A.; Keegan, H.; Spillane, C.D.; Sheils, O.M.; Martin, C.M.; O’Leary, J.J.; Zengerle, R.; Koltay, P. Inkjet-like printing of single-cells. Lab Chip 2011, 11, 2447–2454. [Google Scholar] [CrossRef] [PubMed]
- Nagai, M.; Oohara, K.; Kato, K.; Kawashima, T.; Shibata, T. Development and characterization of hollow microprobe array as a potential tool for versatile and massively parallel manipulation of single cells. Biomed. Microdevices 2015, 17. [Google Scholar] [CrossRef] [PubMed]
- Dastani, K.; Moghimi Zand, M.; Hadi, A. Dielectrophoretic effect of nonuniform electric fields on the protoplast cell. J. Comput. Appl. Mech. 2017, 48, 1–14. [Google Scholar]
- Fernádez-Morales, F.H.; Duarte, J.E.; Samitier-Mart’i, J. Bacterial handling under the influence of non-uniform electric fields: Dielectrophoretic and electrohydrodynamic effects. An. Acad. Bras. Cienc. 2008, 80, 627–638. [Google Scholar] [CrossRef] [PubMed]
- Wang, X.; Yan, X.; Chen, S.; Sun, D. Automated parallel cell isolation and deposition using microwell array and optical tweezers. In Proceedings of the 2012 IEEE International Conference on Robotics and Automation (ICRA), Saint Paul, MN, USA, 14–18 May 2012; pp. 4571–4576. [Google Scholar]
- Guo, F.; Mao, Z.; Chen, Y.; Xie, Z.; Lata, J.P.; Li, P.; Ren, L.; Liu, J.; Yang, J.; Dao, M.; et al. Three-dimensional manipulation of single cells using surface acoustic waves. Proc. Natl. Acad. Sci. USA 2016, 113, 1522–1527. [Google Scholar] [CrossRef] [PubMed] [Green Version]
- Brouzes, E.; Medkova, M.; Savenelli, N.; Marran, D.; Twardowski, M.; Hutchison, J.B.; Rothberg, J.M.; Link, D.R.; Perrimon, N.; Samuels, M.L. Droplet microfluidic technology for single-cell high-throughput screening. Proc. Natl. Acad. Sci. USA 2009, 106, 14195–14200. [Google Scholar] [CrossRef] [PubMed] [Green Version]
- Zhu, Z.; Yang, C.J. Hydrogel droplet microfluidics for high-throughput single molecule/cell analysis. Acc. Chem. Res. 2016, 50, 22–31. [Google Scholar] [CrossRef] [PubMed]
- Mandrycky, C.; Wang, Z.; Kim, K.; Kim, D.-H. 3D bioprinting for engineering complex tissues. Biotechnol. Adv. 2016, 34, 422–434. [Google Scholar] [CrossRef] [PubMed] [Green Version]
- Zheng, S.; Lin, H.K.; Lu, B.; Williams, A.; Datar, R.; Cote, R.J.; Tai, Y.-C. 3D microfilter device for viable circulating tumor cell (CTC) enrichment from blood. Biomed. Microdevices 2011, 13, 203–213. [Google Scholar] [CrossRef] [PubMed]
- Tang, Y.; Shi, J.; Li, S.; Wang, L.; Cayre, Y.E.; Chen, Y. Microfluidic device with integrated microfilter of conical-shaped holes for high efficiency and high purity capture of circulating tumor cells. Sci. Rep. 2014, 4, srep06052. [Google Scholar] [CrossRef] [PubMed]
- Nagrath, S.; Sequist, L.V.; Maheswaran, S.; Bell, D.W.; Irimia, D.; Ulkus, L.; Smith, M.R.; Kwak, E.L.; Digumarthy, S.; Muzikansky, A.; et al. Isolation of rare circulating tumour cells in cancer patients by microchip technology. Nature 2007, 450, 1235–1239. [Google Scholar] [CrossRef] [PubMed] [Green Version]
- Biran, I.; Walt, D.R. Optical imaging fiber-based single live cell arrays: A high-density cell assay platform. Anal. Chem. 2002, 74, 3046–3054. [Google Scholar] [CrossRef] [PubMed]
- Revzin, A.; Sekine, K.; Sin, A.; Tompkins, R.G.; Toner, M. Development of a microfabricated cytometry platform for characterization and sorting of individual leukocytes. Lab Chip 2005, 5, 30–37. [Google Scholar] [CrossRef] [PubMed]
- Yun, K.-S.; Yoon, E. A micro/nano-fluidic chip-based micro-well array for high-throughput cell analysis and drug screening. In Proceedings of the International Conference on Miniaturized Chemical and Blochemlcal Analysts Systems, Squaw Valley, CA, USA, 5–9 October 2003; pp. 861–864. [Google Scholar]
- Wilson, C.F.; Simpson, G.J.; Chiu, D.T.; Strömberg, A.; Orwar, O.; Rodriguez, N.; Zare, R.N. Nanoengineered structures for holding and manipulating liposomes and cells. Anal. Chem. 2001, 73, 787–791. [Google Scholar] [CrossRef] [PubMed]
- Sarder, P.; Nehorai, A. Statistical design of position-encoded microsphere arrays. IEEE Trans. Nanobiosci. 2011, 10, 16–29. [Google Scholar] [CrossRef] [PubMed]
- Hunt, T.P.; Westervelt, R.M. Dielectrophoresis tweezers for single cell manipulation. Biomed. Microdevices 2006, 8, 227–230. [Google Scholar] [CrossRef] [PubMed]
- Kodama, T.; Osaki, T.; Kawano, R.; Kamiya, K.; Miki, N.; Takeuchi, S. Round-tip dielectrophoresis-based tweezers for single micro-object manipulation. Biosens. Bioelectron. 2013, 47, 206–212. [Google Scholar] [CrossRef] [PubMed]
- Park, I.S.; Eom, K.; Son, J.; Chang, W.-J.; Park, K.; Kwon, T.; Yoon, D.S.; Bashir, R.; Lee, S.W. Microfluidic multifunctional probe array dielectrophoretic force spectroscopy with wide loading rates. ACS Nano 2012, 6, 8665–8673. [Google Scholar] [CrossRef] [PubMed]
- Kim, M.H.; Lee, J.; Nam, K.; Park, I.S.; Son, M.; Ko, H.; Lee, S.; Yoon, D.S.; Chang, W.-J.; Lee, S.Y.; et al. Automated Dielectrophoretic Tweezers-Based Force Spectroscopy System in a Microfluidic Device. Sensors 2017, 17, 2272. [Google Scholar] [CrossRef] [PubMed]
- Chuang, H.-S.; Ku, H.-Y.; Li, F.-T.; Kumar, A.; Wang, J.-C.; Wang, K.-C. Optoelectrokinetic Manipulation for Cell Analysis. In Essentials of Single-Cell Analysis; Springer: Berlin/Heidelberg, Germany, 2016; pp. 159–194. [Google Scholar]
- Casey, D.; Dooley, J. Optical tools for single-cell manipulation and analysis. In Essentials of Single-Cell Analysis; Springer: Berlin/Heidelberg, Germany, 2016; pp. 131–157. [Google Scholar]
- Liberale, C.; Cojoc, G.; Bragheri, F.; Minzioni, P.; Perozziello, G.; La Rocca, R.; Ferrara, L.; Rajamanickam, V.; Di Fabrizio, E.; Cristiani, I. Integrated microfluidic device for single-cell trapping and spectroscopy. Sci. Rep. 2013, 3, 1258. [Google Scholar] [CrossRef] [PubMed]
- Wang, X.; Gou, X.; Chen, S.; Yan, X.; Sun, D. Cell manipulation tool with combined microwell array and optical tweezers for cell isolation and deposition. J. Micromech. Microeng. 2013, 23, 75006. [Google Scholar] [CrossRef]
- Wang, X.; Chen, S.; Kong, M.; Wang, Z.; Costa, K.D.; Li, R.A.; Sun, D. Enhanced cell sorting and manipulation with combined optical tweezer and microfluidic chip technologies. Lab Chip 2011, 11, 3656–3662. [Google Scholar] [CrossRef] [PubMed]
- Ding, X.; Lin, S.-C.S.; Kiraly, B.; Yue, H.; Li, S.; Chiang, I.-K.; Shi, J.; Benkovic, S.J.; Huang, T.J. On-chip manipulation of single microparticles, cells, and organisms using surface acoustic waves. Proc. Natl. Acad. Sci. USA 2012, 109, 11105–11109. [Google Scholar] [CrossRef] [PubMed] [Green Version]
- Fulwyler, M.J. Status quo in flow-through cytometry. J. Histochem. Cytochem. 1974, 22, 605–606. [Google Scholar] [CrossRef] [PubMed]
- Wilkerson, M.J. Principles and applications of flow cytometry and cell sorting in companion animal medicine. Vet. Clin. Small Anim. Pract. 2012, 42, 53–71. [Google Scholar] [CrossRef] [PubMed]
- Reggeti, F.; Bienzle, D. Flow cytometry in veterinary oncology. Vet. Pathol. 2011, 48, 223–235. [Google Scholar] [CrossRef] [PubMed]
- Adan, A.; Alizada, G.; Kiraz, Y.; Baran, Y.; Nalbant, A. Flow cytometry: Basic principles and applications. Crit. Rev. Biotechnol. 2017, 37, 163–176. [Google Scholar] [CrossRef] [PubMed]
- Hu, P.; Zhang, W.; Xin, H.; Deng, G. Single cell isolation and analysis. Front. Cell Dev. Biol. 2016, 4, 116. [Google Scholar] [CrossRef] [PubMed]
- Herling, T.W.; O’Connell, D.J.; Bauer, M.C.; Persson, J.; Weininger, U.; Knowles, T.P.J.; Linse, S. A microfluidic platform for real-time detection and quantification of protein-ligand interactions. Biophys. J. 2016, 110, 1957–1966. [Google Scholar] [CrossRef] [PubMed]
- Rajan, S.; Kierny, M.R.; Mercer, A.; Wu, J.; Tovchigrechko, A.; Wu, H.; Dall, W.F.; Xiao, X.; Chowdhury, P.S.; et al. Recombinant human B cell repertoires enable screening for rare, specific, and natively paired antibodies. Commun. Biol. 2018, 1, 5. [Google Scholar] [CrossRef] [PubMed]
- Khojah, R.; Stoutamore, R.; Di Carlo, D. Size-tunable microvortex capture of rare cells. Lab Chip 2017, 17, 2542–2549. [Google Scholar] [CrossRef] [PubMed]
- Chen, J.; Li, J.; Sun, Y. Microfluidic approaches for cancer cell detection, characterization, and separation. Lab Chip 2012, 12, 1753–1767. [Google Scholar] [CrossRef] [PubMed]
- Chen, Y.C.; Baac, H.W.; Lee, K.T.; Fouladdel, S.; Teichert, K.; Ok, J.G.; Cheng, Y.H.; Ingram, P.N.; Hart, A.J.; Azizi, E.; et al. Selective Photomechanical Detachment and Retrieval of Divided Sister Cells from Enclosed Microfluidics for Downstream Analyses. ACS Nano 2017, 11, 4660–4668. [Google Scholar] [CrossRef] [PubMed]
- Chung, S.H.; Shen, W. Laser capture microdissection: From its principle to applications in research on neurodegeneration. Neural Regen. Res. 2015, 10, 897. [Google Scholar] [CrossRef] [PubMed]
- Adams, J.D.; Kim, U.; Soh, H.T. Multitarget magnetic activated cell sorter. Proc. Natl. Acad. Sci. USA 2008, 105, 18165–18170. [Google Scholar] [CrossRef] [PubMed] [Green Version]
- Taylor, S.C.; Laperriere, G.; Germain, H. Droplet Digital PCR versus qPCR for gene expression analysis with low abundant targets: From variable nonsense to publication quality data. Sci. Rep. 2017, 7, 2409. [Google Scholar] [CrossRef] [PubMed]
- Piyasena, M.E.; Graves, S.W. The intersection of flow cytometry with microfluidics and microfabrication. Lab Chip 2014, 14, 1044–1059. [Google Scholar] [CrossRef] [PubMed] [Green Version]
- Croker, A.K.; Goodale, D.; Chu, J.; Postenka, C.; Hedley, B.D.; Hess, D.A.; Allan, A.L. High aldehyde dehydrogenase and expression of cancer stem cell markers selects for breast cancer cells with enhanced malignant and metastatic ability. J. Cell. Mol. Med. 2009, 13, 2236–2252. [Google Scholar] [CrossRef] [PubMed]
- Prestegarden, L.; Svendsen, A.; Wang, J.; Sleire, L.; Skaftnesmo, K.O.; Bjerkvig, R.; Yan, T.; Askland, L.; Persson, A.; Sakariassen, P.Ø.; et al. Glioma cell populations grouped by different cell type markers drive brain tumor growth. Cancer Res. 2010, 70, 4274–4279. [Google Scholar] [CrossRef] [PubMed]
- Gracz, A.D.; Williamson, I.A.; Roche, K.C.; Johnston, M.J.; Wang, F.; Wang, Y.; Attayek, P.J.; Balowski, J.; Liu, X.F.; Laurenza, R.J.; et al. A high-throughput platform for stem cell niche co-cultures and downstream gene expression analysis. Nat. Cell Biol. 2015, 17, 340–349. [Google Scholar] [CrossRef] [PubMed] [Green Version]
- Mahdieh, N.; Rabbani, B. An overview of mutation detection methods in genetic disorders. Iran. J. Pediatr. 2013, 23, 375. [Google Scholar] [PubMed]
- Hung, P.J.; Lee, P.J.; Sabounchi, P.; Lin, R.; Lee, L.P. Continuous perfusion microfluidic cell culture array for high-throughput cell-based assays. Biotechnol. Bioeng. 2005, 89, 1–8. [Google Scholar] [CrossRef] [PubMed]
- Cheng, Y.-H.; Chen, Y.-C.; Brien, R.; Yoon, E. Scaling and automation of a high-throughput single-cell-derived tumor sphere assay chip. Lab Chip 2016, 16, 3708–3717. [Google Scholar] [CrossRef] [PubMed]
- Whitesides, G.M. The origins and the future of microfluidics. Nature 2006, 442, 368–373. [Google Scholar] [CrossRef] [PubMed]
- Chen, Y.-C.; Ingram, P.N.; Fouladdel, S.; McDermott, S.P.; Azizi, E.; Wicha, M.S.; Yoon, E. High-Throughput Single-Cell Derived Sphere Formation for Cancer Stem-Like Cell Identification and Analysis. Sci. Rep. 2016, 6, 27301. [Google Scholar] [CrossRef] [PubMed] [Green Version]
- Lecault, V.; VanInsberghe, M.; Sekulovic, S.; Knapp, D.J.H.F.; Wohrer, S.; Bowden, W.; Viel, F.; McLaughlin, T.; Jarandehei, A.; Miller, M.; et al. High-throughput analysis of single hematopoietic stem cell proliferation in microfluidic cell culture arrays. Nat. Methods 2011, 8, 581–586. [Google Scholar] [CrossRef] [PubMed]
- Zhang, Z.; Chen, Y.-C.; Cheng, Y.-H.; Luan, Y.; Yoon, E. Microfluidics 3D gel-island chip for single cell isolation and lineage-dependent drug responses study. Lab Chip 2016, 16, 2504–2512. [Google Scholar] [CrossRef] [PubMed] [Green Version]
- Choi, Y.-J.; Ingram, P.N.; Yang, K.; Coffman, L.; Iyengar, M.; Bai, S.; Thomas, D.G.; Yoon, E.; Buckanovich, R.J. Identifying an ovarian cancer cell hierarchy regulated by bone morphogenetic protein 2. Proc. Natl. Acad. Sci. USA 2015, 112, E6882–E6888. [Google Scholar] [CrossRef] [PubMed] [Green Version]
- Reya, T.; Morrison, S.J.; Clarke, M.F.; Weissman, I.L. Stem cells, cancer, and cancer stem cells. Nature 2001, 414, 105–111. [Google Scholar] [CrossRef] [PubMed]
- Canavan, H.E.; Cheng, X.; Graham, D.J.; Ratner, B.D.; Castner, D.G. Cell sheet detachment affects the extracellular matrix: A surface science study comparing thermal liftoff, enzymatic, and mechanical methods. J. Biomed. Mater. Res. Part A 2005, 75, 1–13. [Google Scholar] [CrossRef] [PubMed]
- Sumaru, K.; Kikuchi, K.; Takagi, T.; Yamaguchi, M.; Satoh, T.; Morishita, K.; Kanamori, T. On-demand killing of adherent cells on photo-acid-generating culture substrates. Biotechnol. Bioeng. 2013, 110, 348–352. [Google Scholar] [CrossRef] [PubMed]
- Guillaume-Gentil, O.; Zambelli, T.; Vorholt, J.A. Isolation of single mammalian cells from adherent cultures by fluidic force microscopy. Lab Chip 2014, 14, 402–414. [Google Scholar] [CrossRef] [PubMed]
- Kudo, L.C.; Vi, N.; Ma, Z.; Fields, T.; Avliyakulov, N.K.; Haykinson, M.J.; Bragin, A.; Karsten, S.L. Novel cell and tissue acquisition system (CTAS): Microdissection of live and frozen brain tissues. PLoS ONE 2012, 7, e41564. [Google Scholar] [CrossRef] [PubMed]
- Sada, T.; Fujigaya, T.; Niidome, Y.; Nakazawa, K.; Nakashima, N. Near-IR laser-triggered target cell collection using a carbon nanotube-based cell-cultured substrate. ACS Nano 2011, 5, 4414–4421. [Google Scholar] [CrossRef] [PubMed]
- Baac, H.W.; Lee, T.; Guo, L.J. Micro-ultrasonic cleaving of cell clusters by laser-generated focused ultrasound and its mechanisms. Biomed. Opt. Express 2013, 4, 1442–1450. [Google Scholar] [CrossRef] [PubMed]
- Baac, H.W.; Ok, J.G.; Maxwell, A.; Lee, K.-T.; Chen, Y.-C.; Hart, A.J.; Xu, Z.; Yoon, E.; Guo, L.J. Carbon-nanotube optoacoustic lens for focused ultrasound generation and high-precision targeted therapy. Sci. Rep. 2012, 2, 989. [Google Scholar] [CrossRef] [PubMed] [Green Version]
- Beaudet, A.L. Using fetal cells for prenatal diagnosis: History and recent progress. Am. J. Med. Genet. Part C 2016, 172, 123–127. [Google Scholar] [CrossRef] [PubMed]
- Emad, A.; Bouchard, E.F.; Lamoureux, J.; Ouellet, A.; Dutta, A.; Klingbeil, U.; Drouin, R. Validation of automatic scanning of microscope slides in recovering rare cellular events: Application for detection of fetal cells in maternal blood. Prenat. Diagn. 2014, 34, 538–546. [Google Scholar] [CrossRef] [PubMed]
- Breman, A.M.; Chow, J.C.; U’ren, L.; Normand, E.A.; Qdaisat, S.; Zhao, L.; Henke, D.M.; Chen, R.; Shaw, C.A.; Jackson, L.; et al. Evidence for feasibility of fetal trophoblastic cell-based noninvasive prenatal testing. Prenat. Diagn. 2016, 36, 1009–1019. [Google Scholar] [CrossRef] [PubMed] [Green Version]
- Mouawia, H.; Saker, A.; Jais, J.-P.; Benachi, A.; Bussières, L.; Lacour, B.; Bonnefont, J.-P.; Frydman, R.; Simpson, J.L.; Paterlini-Brechot, P. Circulating trophoblastic cells provide genetic diagnosis in 63 fetuses at risk for cystic fibrosis or spinal muscular atrophy. Reprod. Biomed. Online 2012, 25, 508–520. [Google Scholar] [CrossRef] [PubMed]
- Kølvraa, S.; Singh, R.; Normand, E.A.; Qdaisat, S.; Veyver, I.B.; Jackson, L.; Hatt, L.; Schelde, P.; Uldbjerg, N.; Vestergaard, E.M.; et al. Genome-wide copy number analysis on DNA from fetal cells isolated from the blood of pregnant women. Prenat. Diagn. 2016, 36, 1127–1134. [Google Scholar] [CrossRef] [PubMed]
- Mavrou, A.; Kouvidi, E.; Antsaklis, A.; Souka, A.; Kitsiou Tzeli, S.; Kolialexi, A. Identification of nucleated red blood cells in maternal circulation: A second step in screening for fetal aneuploidies and pregnancy complications. Prenat. Diagn. 2007, 27, 150–153. [Google Scholar] [CrossRef] [PubMed]
- Kwon, K.H.; Jeon, Y.J.; Hwang, H.S.; Lee, K.A.; Kim, Y.J.; Chung, H.W.; Pang, M.G. A high yield of fetal nucleated red blood cells isolated using optimal osmolality and a double-density gradient system. Prenat. Diagn. 2007, 27, 1245–1250. [Google Scholar] [CrossRef] [PubMed]
- Bhat, N.M.; Bieber, M.M.; Teng, N.N.H. One-step enrichment of nucleated red blood cells: A potential application in perinatal diagnosis. J. Immunol. Methods 1993, 158, 277–280. [Google Scholar] [CrossRef]
- De Wit, H.; Nabbe, K.C.A.M.; Kooren, J.A.; Adriaansen, H.J.; Roelandse-Koop, E.A.; Schuitemaker, J.H.N.; Hoffmann, J.J.M.L. Reference values of fetal erythrocytes in maternal blood during pregnancy established using flow cytometry. Am. J. Clin. Pathol. 2011, 136, 631–636. [Google Scholar] [CrossRef] [PubMed]
- Herzenberg, L.A.; Bianchi, D.W.; Schröder, J.; Cann, H.M.; Iverson, G.M. Fetal cells in the blood of pregnant women: Detection and enrichment by fluorescence-activated cell sorting. Proc. Natl. Acad. Sci. USA 1979, 76, 1453–1455. [Google Scholar] [CrossRef] [PubMed]
- He, Z.; Guo, F.; Feng, C.; Cai, B.; Lata, J.P.; He, R.; Huang, Q.; Yu, X.; Rao, L.; Liu, H.; et al. Fetal nucleated red blood cell analysis for non-invasive prenatal diagnostics using a nanostructure microchip. J. Mater. Chem. B 2017, 5, 226–235. [Google Scholar] [CrossRef]
- Kantak, C.; Chang, C.-P.; Wong, C.C.; Mahyuddin, A.; Choolani, M.; Rahman, A. Lab-on-a-chip technology: Impacting non-invasive prenatal diagnostics (NIPD) through miniaturisation. Lab Chip 2014, 14, 841–854. [Google Scholar] [CrossRef] [PubMed]
- Chen, J.-F.; Zhu, Y.; Lu, Y.-T.; Hodara, E.; Hou, S.; Agopian, V.G.; Tomlinson, J.S.; Posadas, E.M.; Tseng, H.-R. Clinical applications of NanoVelcro rare-cell assays for detection and characterization of circulating tumor cells. Theranostics 2016, 6, 1425. [Google Scholar] [CrossRef] [PubMed]
- Lin, M.; Chen, J.-F.; Lu, Y.-T.; Zhang, Y.; Song, J.; Hou, S.; Ke, Z.; Tseng, H.-R. Nanostructure embedded microchips for detection, isolation, and characterization of circulating tumor cells. Acc. Chem. Res. 2014, 47, 2941–2950. [Google Scholar] [CrossRef] [PubMed]
- Ke, Z.; Lin, M.; Chen, J.-F.; Choi, J.; Zhang, Y.; Fong, A.; Liang, A.-J.; Chen, S.-F.; Li, Q.; Fang, W.; et al. Programming thermoresponsiveness of NanoVelcro substrates enables effective purification of circulating tumor cells in lung cancer patients. ACS Nano 2014, 9, 62–70. [Google Scholar] [CrossRef] [PubMed]
- Hou, M.; Zhang, Y.; Chen, J.-F.; Lin, M.; Wang, L.; Hou, S.; Tseng, H.-R.; Kuang, M.; Ke, Z. Detecting ALK-rearrangement of CTC enriched by nanovelcro chip in advanced NSCLC patients. Oncotarget 2016. [Google Scholar] [CrossRef]
- Zhao, L.; Tang, C.; Xu, L.; Zhang, Z.; Li, X.; Hu, H.; Cheng, S.; Zhou, W.; Huang, M.; Fong, A.; et al. Enhanced and differential capture of circulating tumor cells from lung cancer patients by microfluidic assays using aptamer cocktail. Small 2016, 12, 1072–1081. [Google Scholar] [CrossRef] [PubMed]
- Liu, S.; Tian, Z.; Zhang, L.; Hou, S.; Hu, S.; Wu, J.; Jing, Y.; Sun, H.; Yu, F.; Zhao, L.; et al. Combined cell surface carbonic anhydrase 9 and CD147 antigens enable high-efficiency capture of circulating tumor cells in clear cell renal cell carcinoma patients. Oncotarget 2016, 7, 59877. [Google Scholar] [CrossRef] [PubMed]
- Ankeny, J.S.; Hou, S.; Li, Q.; Song, M.; Wu, D.; Chen, J.F.; Lee, T.; Lin, M.; Sho, S.; Rochefort, M.M.; et al. Circulating tumour cells as a biomarker for diagnosis and staging in pancreatic cancer. Br. J. Cancer 2016, 114, 1367–1375. [Google Scholar] [CrossRef] [PubMed] [Green Version]
- Wang, S.; Liu, K.; Liu, J.; Yu, Z.T.-F.; Xu, X.; Zhao, L.; Lee, T.; Lee, E.K.; Reiss, J.; Lee, Y.-K.; et al. Highly efficient capture of circulating tumor cells by using nanostructured silicon substrates with integrated chaotic micromixers. Angew. Chem. Int. Ed. 2011, 50, 3084–3088. [Google Scholar] [CrossRef] [PubMed]
- Chen, J.-F.; Ho, H.; Lichterman, J.; Lu, Y.-T.; Zhang, Y.; Garcia, M.A.; Chen, S.-F.; Liang, A.-J.; Hodara, E.; Zhau, H.E.; et al. Subclassification of prostate cancer circulating tumor cells by nuclear size reveals very small nuclear circulating tumor cells in patients with visceral metastases. Cancer 2015, 121, 3240–3251. [Google Scholar] [CrossRef] [PubMed] [Green Version]
- Lu, Y.-T.; Zhao, L.; Shen, Q.; Garcia, M.A.; Wu, D.; Hou, S.; Song, M.; Xu, X.; OuYang, W.-H.; OuYang, W.W.-L.; et al. NanoVelcro Chip for CTC enumeration in prostate cancer patients. Methods 2013, 64, 144–152. [Google Scholar] [CrossRef] [PubMed] [Green Version]
- Hou, S.; Chen, J.-F.; Song, M.; Zhu, Y.; Jan, Y.J.; Chen, S.H.; Weng, T.-H.; Ling, D.-A.; Chen, S.-F.; Ro, T.; et al. Imprinted NanoVelcro Microchips for Isolation and Characterization of Circulating Fetal Trophoblasts: Toward Noninvasive Prenatal Diagnostics. ACS Nano 2017. [Google Scholar] [CrossRef]
- Yamamura, S.; Kishi, H.; Tokimitsu, Y.; Kondo, S.; Honda, R.; Rao, S.R.; Omori, M.; Tamiya, E.; Muraguchi, A. Single-cell microarray for analyzing cellular response. Anal. Chem. 2005, 77, 8050–8056. [Google Scholar] [CrossRef] [PubMed]
- Song, Q.; Han, Q.; Bradshaw, E.M.; Kent, S.C.; Raddassi, K.; Nilsson, B.; Nepom, G.T.; Hafler, D.A.; Love, J.C. On-chip activation and subsequent detection of individual antigen-specific T cells. Anal. Chem. 2009, 82, 473–477. [Google Scholar] [CrossRef] [PubMed]
- Jin, A.; Ozawa, T.; Tajiri, K.; Obata, T.; Kondo, S.; Kinoshita, K.; Kadowaki, S.; Takahashi, K.; Sugiyama, T.; Kishi, H.; et al. A rapid and efficient single-cell manipulation method for screening antigen-specific antibody-secreting cells from human peripheral blood. Nat. Med. 2009, 15, 1088. [Google Scholar] [CrossRef] [PubMed]
- Stott, S.L.; Hsu, C.-H.; Tsukrov, D.I.; Yu, M.; Miyamoto, D.T.; Waltman, B.A.; Rothenberg, S.M.; Shah, A.M.; Smas, M.E.; Korir, G.K.; et al. Isolation of circulating tumor cells using a microvortex-generating herringbone-chip. Proc. Natl. Acad. Sci. USA 2010, 107, 18392–18397. [Google Scholar] [CrossRef] [PubMed] [Green Version]
- Stroock, A.D.; Dertinger, S.K.W.; Ajdari, A.; Mezić, I.; Stone, H.A.; Whitesides, G.M. Chaotic mixer for microchannels. Science 2002, 295, 647–651. [Google Scholar] [CrossRef] [PubMed]
- Leslie, M. The power of one. Science 2011, 331, 24–26. [Google Scholar] [CrossRef] [PubMed]
- Yin, L.; Fu, S.Q.; Nanakorn, T.; Garcia-Sanchez, F.; Chung, I.; Pizzorno, G.; Hanania, E.; Deisseroth, A.; Cote, R.; Heimfeld, S.; et al. Results of retroviral and adenoviral approaches to cancer gene therapy. Stem Cells 1998, 16, 247–250. [Google Scholar] [CrossRef] [PubMed]
- Schmid, R.M.; Weidenbach, H.; Draenert, G.F.; Liptay, S.; Lührs, H.; Adler, G. Liposome mediated gene transfer into the rat oesophagus. Gut 1997, 41, 549–556. [Google Scholar] [CrossRef] [PubMed] [Green Version]
- Capecchi, M.R. High efficiency transformation by direct microinjection of DNA into cultured mammalian cells. Cell 1980, 22, 479–488. [Google Scholar] [CrossRef]
- Ohta, S.; Suzuki, K.; Ogino, Y.; Miyagawa, S.; Murashima, A.; Matsumaru, D.; Yamada, G. Gene transduction by sonoporation. Dev. Growth Differ. 2008, 50, 517–520. [Google Scholar] [CrossRef] [PubMed] [Green Version]
- Santra, T.S.; Wang, P.-C.; Chang, H.-Y.; Tseng, F.-G. Tuning nano electric field to affect restrictive membrane area on localized single cell nano-electroporation. Appl. Phys. Lett. 2013, 103, 233701. [Google Scholar] [CrossRef]
- Santra, T.S.; Chang, H.-Y.; Wang, P.-C.; Tseng, F.-G. Impact of pulse duration on localized single-cell nano-electroporation. Analyst 2014, 139, 6249–6258. [Google Scholar] [CrossRef] [PubMed]
- Takahata, K. Advances in Micro/Nano Electromechanical Systems and Fabrication Technologies; InTech: London, UK, 2013. [Google Scholar]
- Longo, P.A.; Kavran, J.M.; Kim, M.-S.; Leahy, D.J. Generating mammalian stable cell lines by electroporation. In Methods in Enzymology; Elsevier: New York, NY, USA, 2013; Volume 529, pp. 209–226. [Google Scholar]
- Waleed, M.; Hwang, S.-U.; Kim, J.-D.; Shabbir, I.; Shin, S.-M.; Lee, Y.-G. Single-cell optoporation and transfection using femtosecond laser and optical tweezers. Biomed. Opt. Express 2013, 4, 1533–1547. [Google Scholar] [CrossRef] [PubMed]
- Wu, T.-H.; Teslaa, T.; Kalim, S.; French, C.T.; Moghadam, S.; Wall, R.; Miller, J.F.; Witte, O.N.; Teitell, M.A.; Chiou, P.-Y. Photothermal nanoblade for large cargo delivery into mammalian cells. Anal. Chem. 2011, 83, 1321–1327. [Google Scholar] [CrossRef] [PubMed]
- Chun, K.; Hashiguchi, G.; Hiroyuki Fujita, H.T. Fabrication of array of hollow microcapillaries used for injection of genetic materials into animal/plant cells. Jpn. J. Appl. Phys. 1999, 38, L279. [Google Scholar] [CrossRef]
- Guenat, O.T.; Generelli, S.; Dadras, M.; Berdondini, L.; de Rooij, N.F.; Koudelka-Hep, M. Generic technological platform for microfabricating silicon nitride micro-and nanopipette arrays. J. Micromech. Microeng. 2005, 15, 2372. [Google Scholar] [CrossRef]
- Sharei, A.; Zoldan, J.; Adamo, A.; Sim, W.Y.; Cho, N.; Jackson, E.; Mao, S.; Schneider, S.; Han, M.-J.; Lytton-Jean, A.; et al. A vector-free microfluidic platform for intracellular delivery. Proc. Natl. Acad. Sci. USA 2013, 110, 2082–2087. [Google Scholar] [CrossRef] [PubMed] [Green Version]
- Lee Szeto, G.; Van Egeren, D.; Worku, H.; Sharei, A.; Alejandro, B.; Park, C.; Frew, K.; Brefo, M.; Mao, S.; Heimann, M.; et al. Microfluidic squeezing for intracellular antigen loading in polyclonal B-cells as cellular vaccines. Sci. Rep. 2015, 5, 10276. [Google Scholar] [CrossRef] [PubMed] [Green Version]
- Teissie, J.; Golzio, M.; Rols, M.P. Mechanisms of cell membrane electropermeabilization: A minireview of our present (lack of?) knowledge. Biochim. Biophys. Acta Gen. Subj. 2005, 1724, 270–280. [Google Scholar] [CrossRef] [PubMed]
- Lundqvist, J.A.; Sahlin, F.; Åberg, M.A.I.; Strömberg, A.; Eriksson, P.S.; Orwar, O. Altering the biochemical state of individual cultured cells and organelles with ultramicroelectrodes. Proc. Natl. Acad. Sci. USA 1998, 95, 10356–10360. [Google Scholar] [CrossRef] [PubMed] [Green Version]
- Haas, K.; Sin, W.-C.; Javaherian, A.; Li, Z.; Cline, H.T. Single-cell electroporationfor gene transfer in vivo. Neuron 2001, 29, 583–591. [Google Scholar] [CrossRef]
- Huang, Y.; Rubinsky, B. Microfabricated electroporation chip for single cell membrane permeabilization. Sens. Actuators A Phys. 2001, 89, 242–249. [Google Scholar] [CrossRef]
- Khine, M.; Lau, A.; Ionescu-Zanetti, C.; Seo, J.; Lee, L.P. A single cell electroporation chip. Lab Chip 2005, 5, 38–43. [Google Scholar] [CrossRef] [PubMed]
- Potter, H.; Heller, R. Transfection by electroporation. Curr. Protoc. Mol. Biol. 2018, 121, 3–9. [Google Scholar] [PubMed]
- Prasanna, G.L.; Panda, T. Electroporation: Basic principles, practical considerations and applications in molecular biology. Bioprocess Biosyst. Eng. 1997, 16, 261–264. [Google Scholar] [CrossRef]
- Santra, T.S.; Chen, C.-W.; Chang, H.-Y.; Tseng, F.-G. Dielectric passivation layer as a substratum on localized single-cell electroporation. Rsc Adv. 2016, 6, 10979–10986. [Google Scholar] [CrossRef]
- Kang, W.; Yavari, F.; Minary-Jolandan, M.; Giraldo-Vela, J.P.; Safi, A.; McNaughton, R.L.; Parpoil, V.; Espinosa, H.D. Nanofountain probe electroporation (NFP-E) of single cells. Nano Lett. 2013, 13, 2448–2457. [Google Scholar] [CrossRef] [PubMed]
- Santra, T.S.; Kar, S.; Borana, J.; Wang, P.-C.; Tseng, F.-G. Nanolocalized Single-Cell-Membrane Nanoelectroporation: For higher efficiency with high cell viability. IEEE Nanotechnol. Mag. 2014, 8, 30–34. [Google Scholar] [CrossRef]
- Jiang, H. Optical MEMS for Chemical Analysis and Biomedicine; Institution of Engineering and Technology: Stevenage, UK, 2016. [Google Scholar]
- Xiong, R.; Samal, S.K.; Demeester, J.; Skirtach, A.G.; De Smedt, S.C.; Braeckmans, K. Laser-assisted photoporation: Fundamentals, technological advances and applications. Adv. Phys. X 2016, 1, 596–620. [Google Scholar] [CrossRef]
- Tsukakoshi, M.; Kurata, S.; Nomiya, Y.; Ikawa, Y.; Kasuya, T. A novel method of DNA transfection by laser microbeam cell surgery. Appl. Phys. B Lasers Opt. 1984, 35, 135–140. [Google Scholar] [CrossRef]
- Nikolskaya, A.V.; Nikolski, V.P.; Efimov, I.R. Transfection of Cardiac Cells by Means of Laser-Assisted Optoporation. In Handbook of Biophotonics; Wiley: Hoboken, NJ, USA, 2013; pp. 901–910. [Google Scholar]
- Davis, A.A.; Farrar, M.J.; Nishimura, N.; Jin, M.M.; Schaffer, C.B. Optoporation and genetic manipulation of cells using femtosecond laser pulses. Biophys. J. 2013, 105, 862–871. [Google Scholar] [CrossRef] [PubMed]
- Lalonde, B.S.-L.; Boulais, É.; Lebrun, J.-J.; Meunier, M. Visible and near infrared resonance plasmonic enhanced nanosecond laser optoporation of cancer cells. Biomed. Opt. Express 2013, 4, 490–499. [Google Scholar] [CrossRef] [PubMed]
- Xiong, R.; Raemdonck, K.; Peynshaert, K.; Lentacker, I.; De Cock, I.; Demeester, J.; De Smedt, S.C.; Skirtach, A.G.; Braeckmans, K. Comparison of gold nanoparticle mediated photoporation: Vapor nanobubbles outperform direct heating for delivering macromolecules in live cells. ACS Nano 2014, 8, 6288–6296. [Google Scholar] [CrossRef] [PubMed]
- Lakshmanan, S.; Gupta, G.K.; Avci, P.; Chandran, R.; Sadasivam, M.; Jorge, A.E.S.; Hamblin, M.R. Physical energy for drug delivery; poration, concentration and activation. Adv. Drug Deliv. Rev. 2014, 71, 98–114. [Google Scholar] [CrossRef] [PubMed] [Green Version]
- Wu, T.-H.; Teslaa, T.; Teitell, M.A.; Chiou, P.-Y. Photothermal nanoblade for patterned cell membrane cutting. Opt. Express 2010, 18, 23153–23160. [Google Scholar] [CrossRef] [PubMed]
- Peer, E.; Artzy-Schnirman, A.; Gepstein, L.; Sivan, U. Hollow nanoneedle array and its utilization for repeated administration of biomolecules to the same cells. ACS Nano 2012, 6, 4940–4946. [Google Scholar] [CrossRef] [PubMed]
- Park, S.; Kim, Y.-S.; Kim, W.B.; Jon, S. Carbon nanosyringe array as a platform for intracellular delivery. Nano Lett. 2009, 9, 1325–1329. [Google Scholar] [CrossRef] [PubMed]
- Shibata, T.; Yamanaka, S.; Kato, N.; Kawashima, T.; Nomura, M.; Mineta, T.; Makino, E. Fabrication of micromanipulator array for cell patterning. Microelectron. Eng. 2009, 86, 1439–1442. [Google Scholar] [CrossRef]
- Lai, D.; Labuz, J.M.; Kim, J.; Luker, G.D.; Shikanov, A.; Takayama, S. Simple multi-level microchannel fabrication by pseudo-grayscale backside diffused light lithography. RSC Adv. 2013, 3, 19467–19473. [Google Scholar] [CrossRef] [PubMed] [Green Version]
- Peng, T.; Thorn, K.; Schroeder, T.; Wang, L.; Theis, F.J.; Marr, C.; Navab, N. A BaSiC tool for background and shading correction of optical microscopy images. Nat. Commun. 2017, 8, 14836. [Google Scholar] [CrossRef] [PubMed] [Green Version]
- Cermak, N.; Olcum, S.; Delgado, F.F.; Wasserman, S.C.; Payer, K.R.; Murakami, M.A.; Knudsen, S.M.; Kimmerling, R.J.; Stevens, M.M.; Kikuchi, Y.; et al. High-throughput measurement of single-cell growth rates using serial microfluidic mass sensor arrays. Nat. Biotechnol. 2016, 34, 1052–1059. [Google Scholar] [CrossRef] [PubMed] [Green Version]
- Liu, R.; Chen, R.; Elthakeb, A.T.; Lee, S.H.; Hinckley, S.; Khraiche, M.L.; Scott, J.; Pre, D.; Hwang, Y.; Tanaka, A.; et al. High Density Individually Addressable Nanowire Arrays Record Intracellular Activity from Primary Rodent and Human Stem Cell Derived Neurons. Nano Lett. 2017, 17, 2757–2764. [Google Scholar] [CrossRef] [PubMed]
- Cao, Y.; Hjort, M.; Chen, H.; Birey, F.; Leal-Ortiz, S.A.; Han, C.M.; Santiago, J.G.; Pacsca, S.P.; Wu, J.C.; Melosh, N.A. Nondestructive nanostraw intracellular sampling for longitudinal cell monitoring. Proc. Natl. Acad. Sci. USA 2017, 114, E1866–E1874. [Google Scholar] [CrossRef] [PubMed] [Green Version]
- Horgan, R.P.; Kenny, L.C. ‘Omic’ technologies: Genomics, transcriptomics, proteomics and metabolomics. Obstet. Gynaecol. 2011, 13, 189–195. [Google Scholar] [CrossRef]
- Li, L.; Garden, R.W.; Sweedler, J. V Single-cell MALDI: A new tool for direct peptide profiling. Trends Biotechnol. 2000, 18, 151–160. [Google Scholar] [CrossRef]
- Kay, A.W.; Strauss-Albee, D.M.; Blish, C.A. Application of mass cytometry (CyTOF) for functional and phenotypic analysis of natural killer cells. In Natural Killer Cells; Springer: Berlin/Heidelberg, Germany, 2016; pp. 13–26. [Google Scholar]
- Glynn, M.; King, D.; Ducrée, J. Systems Biology in Single Cells. In Essentials of Single-Cell Analysis; Springer: Berlin/Heidelberg, Germany, 2016; pp. 31–53. [Google Scholar]
- Smith, K.; Li, Y.; Piccinini, F.; Csucs, G.; Balazs, C.; Bevilacqua, A.; Horvath, P. CIDRE: An illumination-correction method for optical microscopy. Nat. Methods 2015, 12, 404. [Google Scholar] [CrossRef] [PubMed] [Green Version]
- Liu, D.C.; Nocedal, J. On the limited memory BFGS method for large scale optimization. Math. Program. 1989, 45, 503–528. [Google Scholar] [CrossRef] [Green Version]
- Labhsetwar, P.; Cole, J.A.; Roberts, E.; Price, N.D.; Luthey-Schulten, Z.A. Heterogeneity in protein expression induces metabolic variability in a modeled Escherichia coli population. Proc. Natl. Acad. Sci. USA 2013, 110, 14006–14011. [Google Scholar] [CrossRef] [PubMed] [Green Version]
- Balaban, N.Q.; Merrin, J.; Chait, R.; Kowalik, L.; Leibler, S. Bacterial persistence as a phenotypic switch. Science 2004, 305, 1622–1625. [Google Scholar] [CrossRef] [PubMed]
- Di Talia, S.; Skotheim, J.M.; Bean, J.M.; Siggia, E.D.; Cross, F.R. The effects of molecular noise and size control on variability in the budding yeast cell cycle. Nature 2007, 448, 947–951. [Google Scholar] [CrossRef] [PubMed]
- Van Heerden, J.H.; Wortel, M.T.; Bruggeman, F.J.; Heijnen, J.J.; Bollen, Y.J.M.; Planqué, R.; Hulshof, J.; O’Toole, T.G.; Wahl, S.A.; Teusink, B. Lost in transition: Start-up of glycolysis yields subpopulations of nongrowing cells. Science 2014, 343, 1245114. [Google Scholar] [CrossRef] [PubMed]
- Sandler, O.; Mizrahi, S.P.; Weiss, N.; Agam, O.; Simon, I.; Balaban, N.Q. Lineage correlations of single cell division time as a probe of cell-cycle dynamics. Nature 2015, 519, 468–471. [Google Scholar] [CrossRef] [PubMed]
- Godin, M.; Delgado, F.F.; Son, S.; Grover, W.H.; Bryan, A.K.; Tzur, A.; Jorgensen, P.; Payer, K.; Grossman, A.D.; Kirschner, M.W.; et al. Using buoyant mass to measure the growth of single cells. Nat. Methods 2010, 7, 387–390. [Google Scholar] [CrossRef] [PubMed] [Green Version]
- Son, S.; Tzur, A.; Weng, Y.; Jorgensen, P.; Kim, J.; Kirschner, M.W.; Manalis, S.R. Direct observation of mammalian cell growth and size regulation. Nat. Methods 2012, 9, 910–912. [Google Scholar] [CrossRef] [PubMed] [Green Version]
- Yang, Q.; Pando, B.F.; Dong, G.; Golden, S.S.; van Oudenaarden, A. Circadian gating of the cell cycle revealed in single cyanobacterial cells. Science 2010, 327, 1522–1526. [Google Scholar] [CrossRef] [PubMed] [Green Version]
- Nagoshi, E.; Saini, C.; Bauer, C.; Laroche, T.; Naef, F.; Schibler, U. Circadian gene expression in individual fibroblasts: Cell-autonomous and self-sustained oscillators pass time to daughter cells. Cell 2004, 119, 693–705. [Google Scholar] [CrossRef] [PubMed]
- Huang, F.; Sirinakis, G.; Allgeyer, E.S.; Schroeder, L.K.; Duim, W.C.; Kromann, E.B.; Phan, T.; Rivera-Molina, F.E.; Myers, J.R.; Irnov, I.; et al. Ultra-high resolution 3D imaging of whole cells. Cell 2016, 166, 1028–1040. [Google Scholar] [CrossRef] [PubMed]
- Lantz, A.W.; Bao, Y.; Armstrong, D.W. Single-cell detection: Test of microbial contamination using capillary electrophoresis. Anal. Chem. 2007, 79, 1720–1724. [Google Scholar] [CrossRef] [PubMed]
- Bao, N.; Wang, J.; Lu, C. Recent advances in electric analysis of cells in microfluidic systems. Anal. Bioanal. Chem. 2008, 391, 933–942. [Google Scholar] [CrossRef] [PubMed]
- Legendre, L.A.; Morris, C.J.; Bienvenue, J.M.; Barron, A.; McClure, R.; Landers, J.P. Toward a simplified microfluidic device for ultra-fast genetic analysis with sample-in/answer-out capability: Application to T-cell lymphoma diagnosis. JALA J. Assoc. Lab. Autom. 2008, 13, 351–360. [Google Scholar] [CrossRef]
- Zheng, X.T.; Yang, H.B.; Li, C.M. Optical detection of single cell lactate release for cancer metabolic analysis. Anal. Chem. 2010, 82, 5082–5087. [Google Scholar] [CrossRef] [PubMed]
- Woods, L.A.; Powell, P.R.; Paxon, T.L.; Ewing, A.G. Analysis of mammalian cell cytoplasm with electrophoresis in nanometer inner diameter capillaries. Electroanalysis 2005, 17, 1192–1197. [Google Scholar] [CrossRef] [PubMed]
- Omiatek, D.M.; Santillo, M.F.; Heien, M.L.; Ewing, A.G. Hybrid capillary-microfluidic device for the separation, lysis, and electrochemical detection of vesicles. Anal. Chem. 2009, 81, 2294–2302. [Google Scholar] [CrossRef] [PubMed]
- Wu, R.-G.; Yang, C.-S.; Cheing, C.-C.; Tseng, F.-G. Nanocapillary electrophoretic electrochemical chip: Towards analysis of biochemicals released by single cells. Interface Focus 2011. [Google Scholar] [CrossRef] [PubMed]
- Majonis, D.; Herrera, I.; Ornatsky, O.; Schulze, M.; Lou, X.; Soleimani, M.; Nitz, M.; Winnik, M.A. Synthesis of a functional metal-chelating polymer and steps toward quantitative mass cytometry bioassays. Anal. Chem. 2010, 82, 8961–8969. [Google Scholar] [CrossRef] [PubMed]
- Thomas, R. Practical guide to ICP-MS: A tutorial for beginners; CRC press: Bocaton, FL, USA, 2013. [Google Scholar]
- Bendall, S.C.; Nolan, G.P.; Roederer, M.; Chattopadhyay, P.K. A deep profiler’s guide to cytometry. Trends Immunol. 2012, 33, 323–332. [Google Scholar] [CrossRef] [PubMed]
- Gerdtsson, E.; Pore, M.; Thiele, J.-A.; Gerdtsson, A.S.; Malihi, P.D.; Nevarez, R.; Kolatkar, A.; Velasco, C.R.; Wix, S.; Singh, M.; et al. Multiplex protein detection on circulating tumor cells from liquid biopsies using imaging mass cytometry. Converg. Sci. Phys. Oncol. 2018, 4, 15002. [Google Scholar] [CrossRef] [Green Version]
- Marrinucci, D.; Bethel, K.; Kolatkar, A.; Luttgen, M.S.; Malchiodi, M.; Baehring, F.; Voigt, K.; Lazar, D.; Nieva, J.; Bazhenova, L.; et al. Fluid biopsy in patients with metastatic prostate, pancreatic and breast cancers. Phys. Biol. 2012, 9, 16003. [Google Scholar] [CrossRef] [PubMed] [Green Version]
- Wang, H.A.O.; Grolimund, D.; Giesen, C.; Borca, C.N.; Shaw-Stewart, J.R.H.; Bodenmiller, B.; Gunther, D. Fast chemical imaging at high spatial resolution by laser ablation inductively coupled plasma mass spectrometry. Anal. Chem. 2013, 85, 10107–10116. [Google Scholar] [CrossRef] [PubMed]
- Behjati, S.; Tarpey, P.S. What is next generation sequencing? Arch. Dis. Child.-Educ. Pract. 2013, 98, 236–238. [Google Scholar] [CrossRef] [PubMed] [Green Version]
- Gawad, C.; Koh, W.; Quake, S.R. Single-cell genome sequencing: Current state of the science. Nat. Rev. Genet. 2016, 17, 175–188. [Google Scholar] [CrossRef] [PubMed]
- Buenrostro, J.D.; Giresi, P.G.; Zaba, L.C.; Chang, H.Y.; Greenleaf, W.J. Transposition of native chromatin for fast and sensitive epigenomic profiling of open chromatin, DNA-binding proteins and nucleosome position. Nat. Methods 2013, 10, 1213. [Google Scholar] [CrossRef] [PubMed]
- Deng, Q.; Ramsköld, D.; Reinius, B.; Sandberg, R. Single-cell RNA-seq reveals dynamic, random monoallelic gene expression in mammalian cells. Science 2014, 343, 193–196. [Google Scholar] [CrossRef] [PubMed]
- Osada, T.; Uehara, H.; Kim, H.; Ikai, A. mRNA analysis of single living cells. J. Nanobiotechnol. 2003, 1, 2. [Google Scholar] [CrossRef]
- Saha-Shah, A.; Weber, A.E.; Karty, J.A.; Ray, S.J.; Hieftje, G.M.; Baker, L.A. Nanopipettes: Probes for local sample analysis. Chem. Sci. 2015, 6, 3334–3341. [Google Scholar] [CrossRef] [PubMed]
- Pool, R. Trapping with optical tweezers. Science 1988, 241, 1042–1043. [Google Scholar] [CrossRef] [PubMed]
- Ryttsen, F.; Farre, C.; Brennan, C.; Weber, S.G.; Nolkrantz, K.; Jardemark, K.; Chiu, D.T.; Orwar, O. Characterization of single-cell electroporation by using patch-clamp and fluorescence microscopy. Biophys. J. 2000, 79, 1993–2001. [Google Scholar] [CrossRef]
- Shojaei-Baghini, E.; Zheng, Y.; Sun, Y. Automated micropipette aspiration of single cells. Ann. Biomed. Eng. 2013, 41, 1208–1216. [Google Scholar] [CrossRef] [PubMed]
- Wong, C.Y.; Mills, J.K. Cleavage-stage embryo rotation tracking and automated micropipette control: Towards automated single cell manipulation. In Proceedings of the 2016 IEEE/RSJ International Conference on Intelligent Robots and Systems (IROS), Daejeon, Korea, 9–14 October 2016; pp. 2351–2356. [Google Scholar]
- Ungai-Salánki, R.; Gerecsei, T.; Fürjes, P.; Orgovan, N.; Sándor, N.; Holczer, E.; Horvath, R.; Szabó, B. Automated single cell isolation from suspension with computer vision. Sci. Rep. 2016, 6, 20375. [Google Scholar] [CrossRef] [PubMed] [Green Version]
- Morishima, K.; Arai, F.; Fukuda, T.; Matsuura, H.; Yoshikawa, K. Screening of single Escherichia coli in a microchannel system by electric field and laser tweezers. Anal. Chim. Acta 1998, 365, 273–278. [Google Scholar] [CrossRef]
- Schnelle, T.; Müller, T.; Hagedorn, R.; Voigt, A.; Fuhr, G. Single micro electrode dielectrophoretic tweezers for manipulation of suspended cells and particles. Biochim. Biophys. Acta (BBA)-Gen. Subj. 1999, 1428, 99–105. [Google Scholar] [CrossRef]
- Schnelle, T.; Müller, T.; Reichle, C.; Fuhr, G. Combined dielectrophoretic field cages and laser tweezers for electrorotation. Appl. Phys. B 2000, 70, 267–274. [Google Scholar] [CrossRef]
- Baumann, C.G.; Bloomfield, V.A.; Smith, S.B.; Bustamante, C.; Wang, M.D.; Block, S.M. Stretching of single collapsed DNA molecules. Biophys. J. 2000, 78, 1965–1978. [Google Scholar] [CrossRef]
- Leckband, D. Measuring the forces that control protein interactions. Annu. Rev. Biophys. Biomol. Struct. 2000, 29, 1–26. [Google Scholar] [CrossRef] [PubMed]
- Raucher, D.; Sheetz, M.P. Cell spreading and lamellipodial extension rate is regulated by membrane tension. J. Cell Biol. 2000, 148, 127–136. [Google Scholar] [CrossRef] [PubMed]
- Greulich, K.O.; Pilarczyk, G.; Hoffmann, A.; Meyer Zu Hörste, G.; Schäfer, B.; Uhl, V.; Monajembashi, S. Micromanipulation by laser microbeam and optical tweezers: From plant cells to single molecules. J. Microsc. 2000, 198, 182–187. [Google Scholar] [CrossRef] [PubMed]
- Kwon, J.-S.; Wereley, S.T. Towards new methodologies for manipulation of colloidal particles in a miniaturized fluidic device: Optoelectrokinetic manipulation technique. J. Fluids Eng. 2013, 135, 21306. [Google Scholar] [CrossRef]
- Work, A.H.; Williams, S.J. Characterization of 2D colloid aggregations created by optically induced electrohydrodynamics. Electrophoresis 2015, 36, 1674–1680. [Google Scholar] [CrossRef] [PubMed]
- Kumar, A.; Williams, S.J.; Wereley, S.T. Rapid electrokinetic patterning of colloidal particles with optical landscapes. In Proceedings of the 12th International Conference on Miniaturized Systems for Chemistry and Life Sciences (MicroTAS’08), San Diego, CA, USA, 12–16 October 2008. [Google Scholar]
- Yuan, G.-C.; Cai, L.; Elowitz, M.; Enver, T.; Fan, G.; Guo, G.; Irizarry, R.; Kharchenko, P.; Kim, J.; Orkin, S.; et al. Challenges and emerging directions in single-cell analysis. Genome Biol. 2017, 18, 84. [Google Scholar] [CrossRef] [PubMed]
- Dincer, C.; Bruch, R.; Kling, A.; Dittrich, P.S.; Urban, G.A. Multiplexed point-of-care testing—xPOCT. Trends Biotechnol. 2017, 35, 728–742. [Google Scholar] [CrossRef] [PubMed]
- Tomizawa, M.; Shinozaki, F.; Motoyoshi, Y.; Sugiyama, T.; Yamamoto, S.; Sueishi, M. Sonoporation: Gene transfer using ultrasound. World J. Methodol. 2013, 3, 39. [Google Scholar] [CrossRef] [PubMed] [Green Version]
- Alsaggar, M.; Liu, D. Physical methods for gene transfer. In Advances in Genetics; Elsevier: New York, NY, USA, 2015; Volume 89, pp. 1–24. [Google Scholar]
- Liu, D.; Wang, L.; Wang, Z.; Cuschieri, A. Magnetoporation and magnetolysis of cancer cells via carbon nanotubes induced by rotating magnetic fields. Nano Lett. 2012, 12, 5117–5121. [Google Scholar] [CrossRef] [PubMed]
- Chow, Y.T.; Chen, S.; Wang, R.; Liu, C.; Kong, C.; Li, R.A.; Cheng, S.H.; Sun, D. Single cell transfection through precise microinjection with quantitatively controlled injection volumes. Sci. Rep. 2016, 6, 24127. [Google Scholar] [CrossRef] [PubMed]
- Zhang, D.; Lee, H.; Zhu, Z.; Minhas, J.K.; Jin, Y. Enrichment of selective miRNAs in exosomes and delivery of exosomal miRNAs in vitro and in vivo. Am. J. Physiol. Cell. Mol. Physiol. 2016, 312, L110–L121. [Google Scholar] [CrossRef] [PubMed]
- Han, X.; Liu, Z.; Chan Jo, M.; Zhang, K.; Li, Y.; Zeng, Z.; Li, N.; Zu, Y.; Qin, L. CRISPR-Cas9 delivery to hard-to-transfect cells via membrane deformation. Sci. Adv. 2015, 1, e1500454. [Google Scholar] [CrossRef] [PubMed]
- Ding, X.; Stewart, M.P.; Sharei, A.; Weaver, J.C.; Langer, R.S.; Jensen, K.F. High-throughput nuclear delivery and rapid expression of DNA via mechanical and electrical cell-membrane disruption. Nat. Biomed. Eng. 2017, 1, 39. [Google Scholar] [CrossRef] [PubMed] [Green Version]
- Patel, A.P.; Tirosh, I.; Trombetta, J.J.; Shalek, A.K.; Gillespie, S.M.; Wakimoto, H.; Cahill, D.P.; Nahed, B.V.; Curry, W.T.; Martuza, R.L.; et al. Single-cell RNA-seq highlights intratumoral heterogeneity in primary glioblastoma. Science 2014, 344, 1396–1401. [Google Scholar] [CrossRef] [PubMed] [Green Version]
- Janiszewska, M.; Liu, L.; Almendro, V.; Kuang, Y.; Paweletz, C.; Sakr, R.A.; Weigelt, B.; Hanker, A.B.; Chandarlapaty, S.; King, T.A.; et al. In situ single-cell analysis identifies heterogeneity for PIK3CA mutation and HER2 amplification in HER2-positive breast cancer. Nat. Genet. 2015, 47, 1212. [Google Scholar] [CrossRef] [PubMed]
- Hou, Y.; Guo, H.; Cao, C.; Li, X.; Hu, B.; Zhu, P.; Wu, X.; Wen, L.; Tang, F.; Huang, Y.; et al. Single-cell triple omics sequencing reveals genetic, epigenetic, and transcriptomic heterogeneity in hepatocellular carcinomas. Cell Res. 2016, 26, 304. [Google Scholar] [CrossRef] [PubMed]
- Llorens-Bobadilla, E.; Zhao, S.; Baser, A.; Saiz-Castro, G.; Zwadlo, K.; Martin-Villalba, A. Single-cell transcriptomics reveals a population of dormant neural stem cells that become activated upon brain injury. Cell Stem Cell 2015, 17, 329–340. [Google Scholar] [CrossRef] [PubMed]


| S. No. | Single-Cell Manipulation Techniques Using | Features | Advantages | Disadvantages | References |
|---|---|---|---|---|---|
| 1 | Microfluidics | Droplet microfluidics. | Cell isolation, precise control on small volumes, high throughput screening. | Transportation of droplets is tedious. Special care is required in material choice for functions. | [55,56,57,58] |
| Microfluidic DLD, GEDI, GEM. | Efficient cell separation based on size, surface proteins. | Sophisticated fabrication. | [59,60,61] | ||
| Hydrodynamic pressure. | Same chip can be used for multiple process. | Tedious design and fabrication. | [62,63,64] | ||
| Fluidic microarray chip. | High throughput cell manipulation. | Less flexibility in single cell manipulation. | [65,66,67,68] | ||
| Ink jet printing. | Cells can be displaced in the desired pattern. | Small volume of cell culture (8 µL) | [69] | ||
| Micropipette array. | Increased throughput, useful for transporting cells within different microenvironments. | Trapping and release rates are compromised to increase cell viability. | [70] | ||
| 2 | Electric field | Dielectrophoresis. | Useful in handling inside microfluidic channels. | Complex electrode fabrication. | [71,72] |
| 3 | Optical energy | Optical tweezers. | Contactless handling, label-free, contamination-free. | Low throughput, high setup cost, substrate-specifi.c | [49,50,51] |
| Multiple 3D optical traps. | Increases throughput as compared to optical tweezers, cell detection is incorporated. | Sophisticated instrument setup, diffraction of light limits the maximum number of cells that can be handled at one time. | [73] | ||
| 4 | Acoustic energy | 3D acoustic tweezer. | Label-free, contact less, contamination free, safer as compared to the optical technique. | Sophisticated fabrication and calibration process. | [74] |
| S. No. | Single-Cell Diagnosis Techniques Using | Features | Advantages | Disadvantages | References |
|---|---|---|---|---|---|
| 1 | Microfluidics | Flow cytometry, A microfluidic technique to sort cells based on their size, granularity, and fluorescence (FACS). | High throughput technique to analyze heterogeneous cell population. Gives high accuracy in sorting. | Not reliable for intracellular diagnosis. Spectral overlap observed in screening of multiple parameters. | [100] |
| Cell affinity micro chromatography, a technique based on binding with surface immobilized ligands. | Targeted cells sorted based on surface proteins. Higher sensitivity and selectivity. | Low throughput. Limited by Surface interaction. Complex cell retrieval mechanism. | [101] | ||
| Droplet microfluidics. | Microreactors for individual cells within a droplet, rare cell detection possible. | Huge data analysis required. | [102] | ||
| Micro vortex. | Rare cell isolation is possible. High throughput is possible. | Purity of output is low. | [103] | ||
| 2 | Electric field | Dielectrophoresis technique uses non-uniform electric field. | Useful in the study of neural cells, cancer cells. High efficiency. | Limited to cells showing a response to electric fields. Low throughput. | [104] |
| 3 | Optical energy | Photomechanical cell detachment. | single-cell captured per microfluidic chamber allows tracking of individual cells. Surface proteins are preserved. Genetic analysis can provide information about key altering genes in cell lineage. | Low throughput. Expensive setup. | [105] |
| Laser capture microdissection. | Allows live single-cell isolation. Even cell organelles can be isolated. Contactless technique. | Requires good optical resolution. Expensive setup. | [106] | ||
| 5 | Magnetic energy | MACS uses functionalized super-paramagnetic nanoparticles to tag cells. | High efficiency. Based on surface markers allows high selectivity and sensitivity. Allows sorting of multiple target cells. | Low throughput. Cell retrieval is difficult. | [107] |
| 6 | Omics technology | In Digital droplet, PCR sample is fractionated into droplets using water oil emulsion droplet technology. Each droplet is then allowed to react with the specific primer and probe. The droplets showing positive reaction are quantified. | Very high accuracy and sensitivity in detection of rare DNA target. Quantification of the concentration of targeted cell is possible. | Lengthy process. Redesigning of the process required if results are inconsistent. | [108] |
| S. No. | Single-Cell Therapeutic Techniques Using | Features | Advantages | Disadvantages | References |
|---|---|---|---|---|---|
| 1 | Viral vector | Genetically engineered viruses are used for transfection. | Promising intracellular uptake, targeted delivery. | Immunogenic effects, limitation in genetic material carrying capacity. | [158] |
| 2 | Electroporation | Use of electric field for making cell pores. | Cost effective, high delivery efficiency. | Low cell viability, formation of irreversible pore. | [158,165] |
| 3 | Optoporation | Use of laser for creating transient cell membrane pores. | Contactless delivery method, high transfection efficiency. | Low throughput for single cell delivery. | [166,167] |
| 4 | Mechanoporation | Transient membrane pores are formed by applying mechanical forces on cells. | High cell viability, high transfection efficiency. | Sometimes there is a compromise between high transfection efficiency and high cell viability. | [168,169,170,171] |
| S No. | Single-cell Analysis Techniques | Features | References |
|---|---|---|---|
| 1 | Single-cell differentiation | 4D recording Allows tracking of targeted cell in X, Y and Z directions along with time. Software controlled motorized stage. BaSiC software allows detection of transcription factors as the stem cell undergoes differentiation. W-4PiSMSN allows imaging of cell cross section to view cell organelles based on high-resolution fluorescence microscopy. | [27,195] |
| 2 | Single-cell growth | SMR Cell mass and growth rate can be quantified. Quantification based on the resonance of suspended cantilever before and after cell growth cycle. Low-cost technique. | [196] |
| 3 | Cell membrane potential measurement | The localized potential of and within a cell can be measured. Useful in the study of neurons. | [197] |
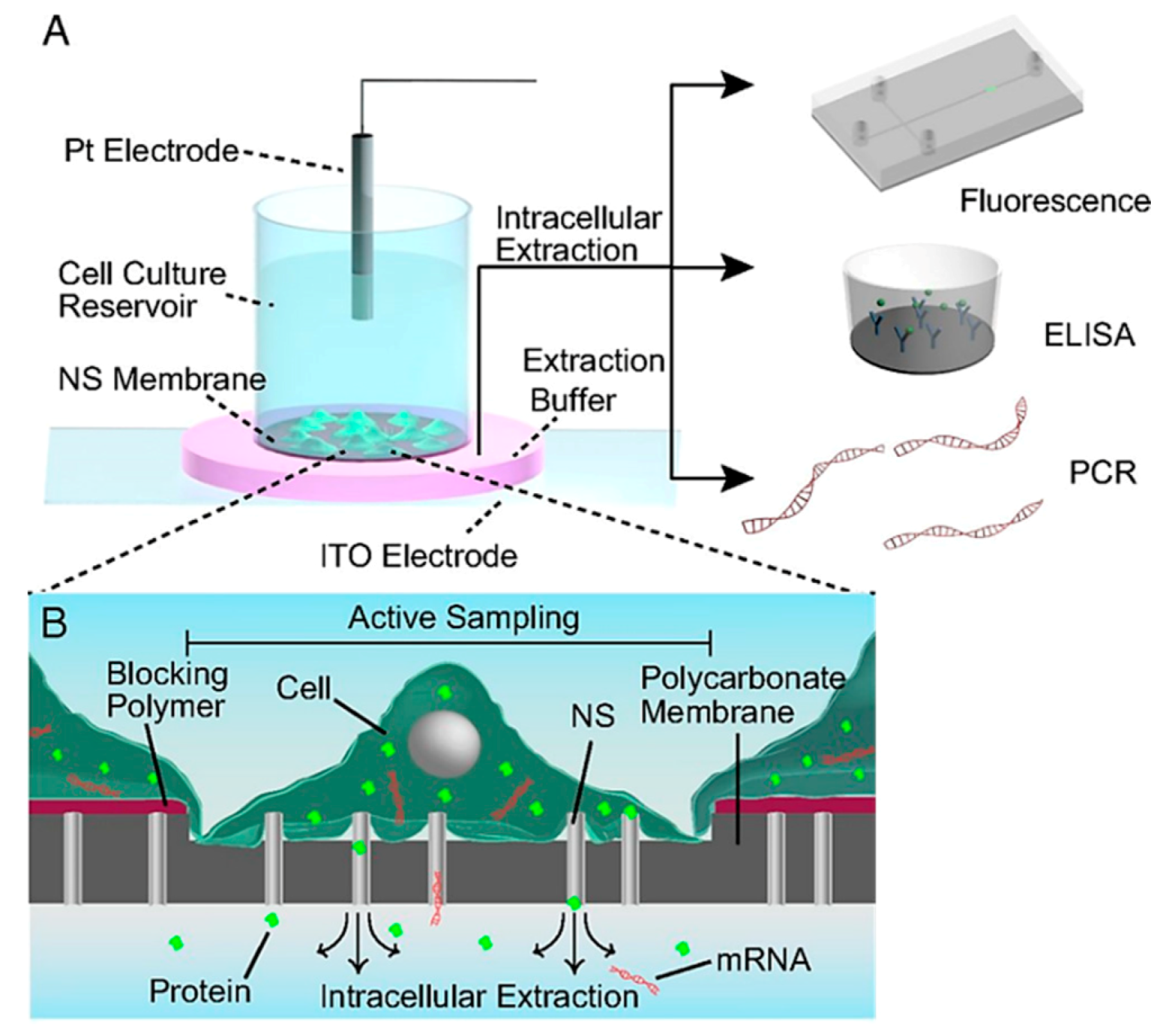
| 4 | Intracellular access | This is a live cell extraction technique. Intracellular contents can be extracted over the cell cycle for analysis. | [198] |
| 5 | Genomics and Transcriptomics | Study of structure, function, and expression of cell genome/transcriptome (mRNA) in phenotypically varying cells. The transcriptomic study can give connecting link between the genetic makeup and phenotypic characteristics of cells. Uses Whole genome/transcriptome amplification (WGA/WTA) for NGS. | [199] |
| 6 | Proteomics | It is the study of cellular protein structure and functions. Uses techniques like mass spectroscopy and antigen-antibody reactions for the study of proteins. | [199] |
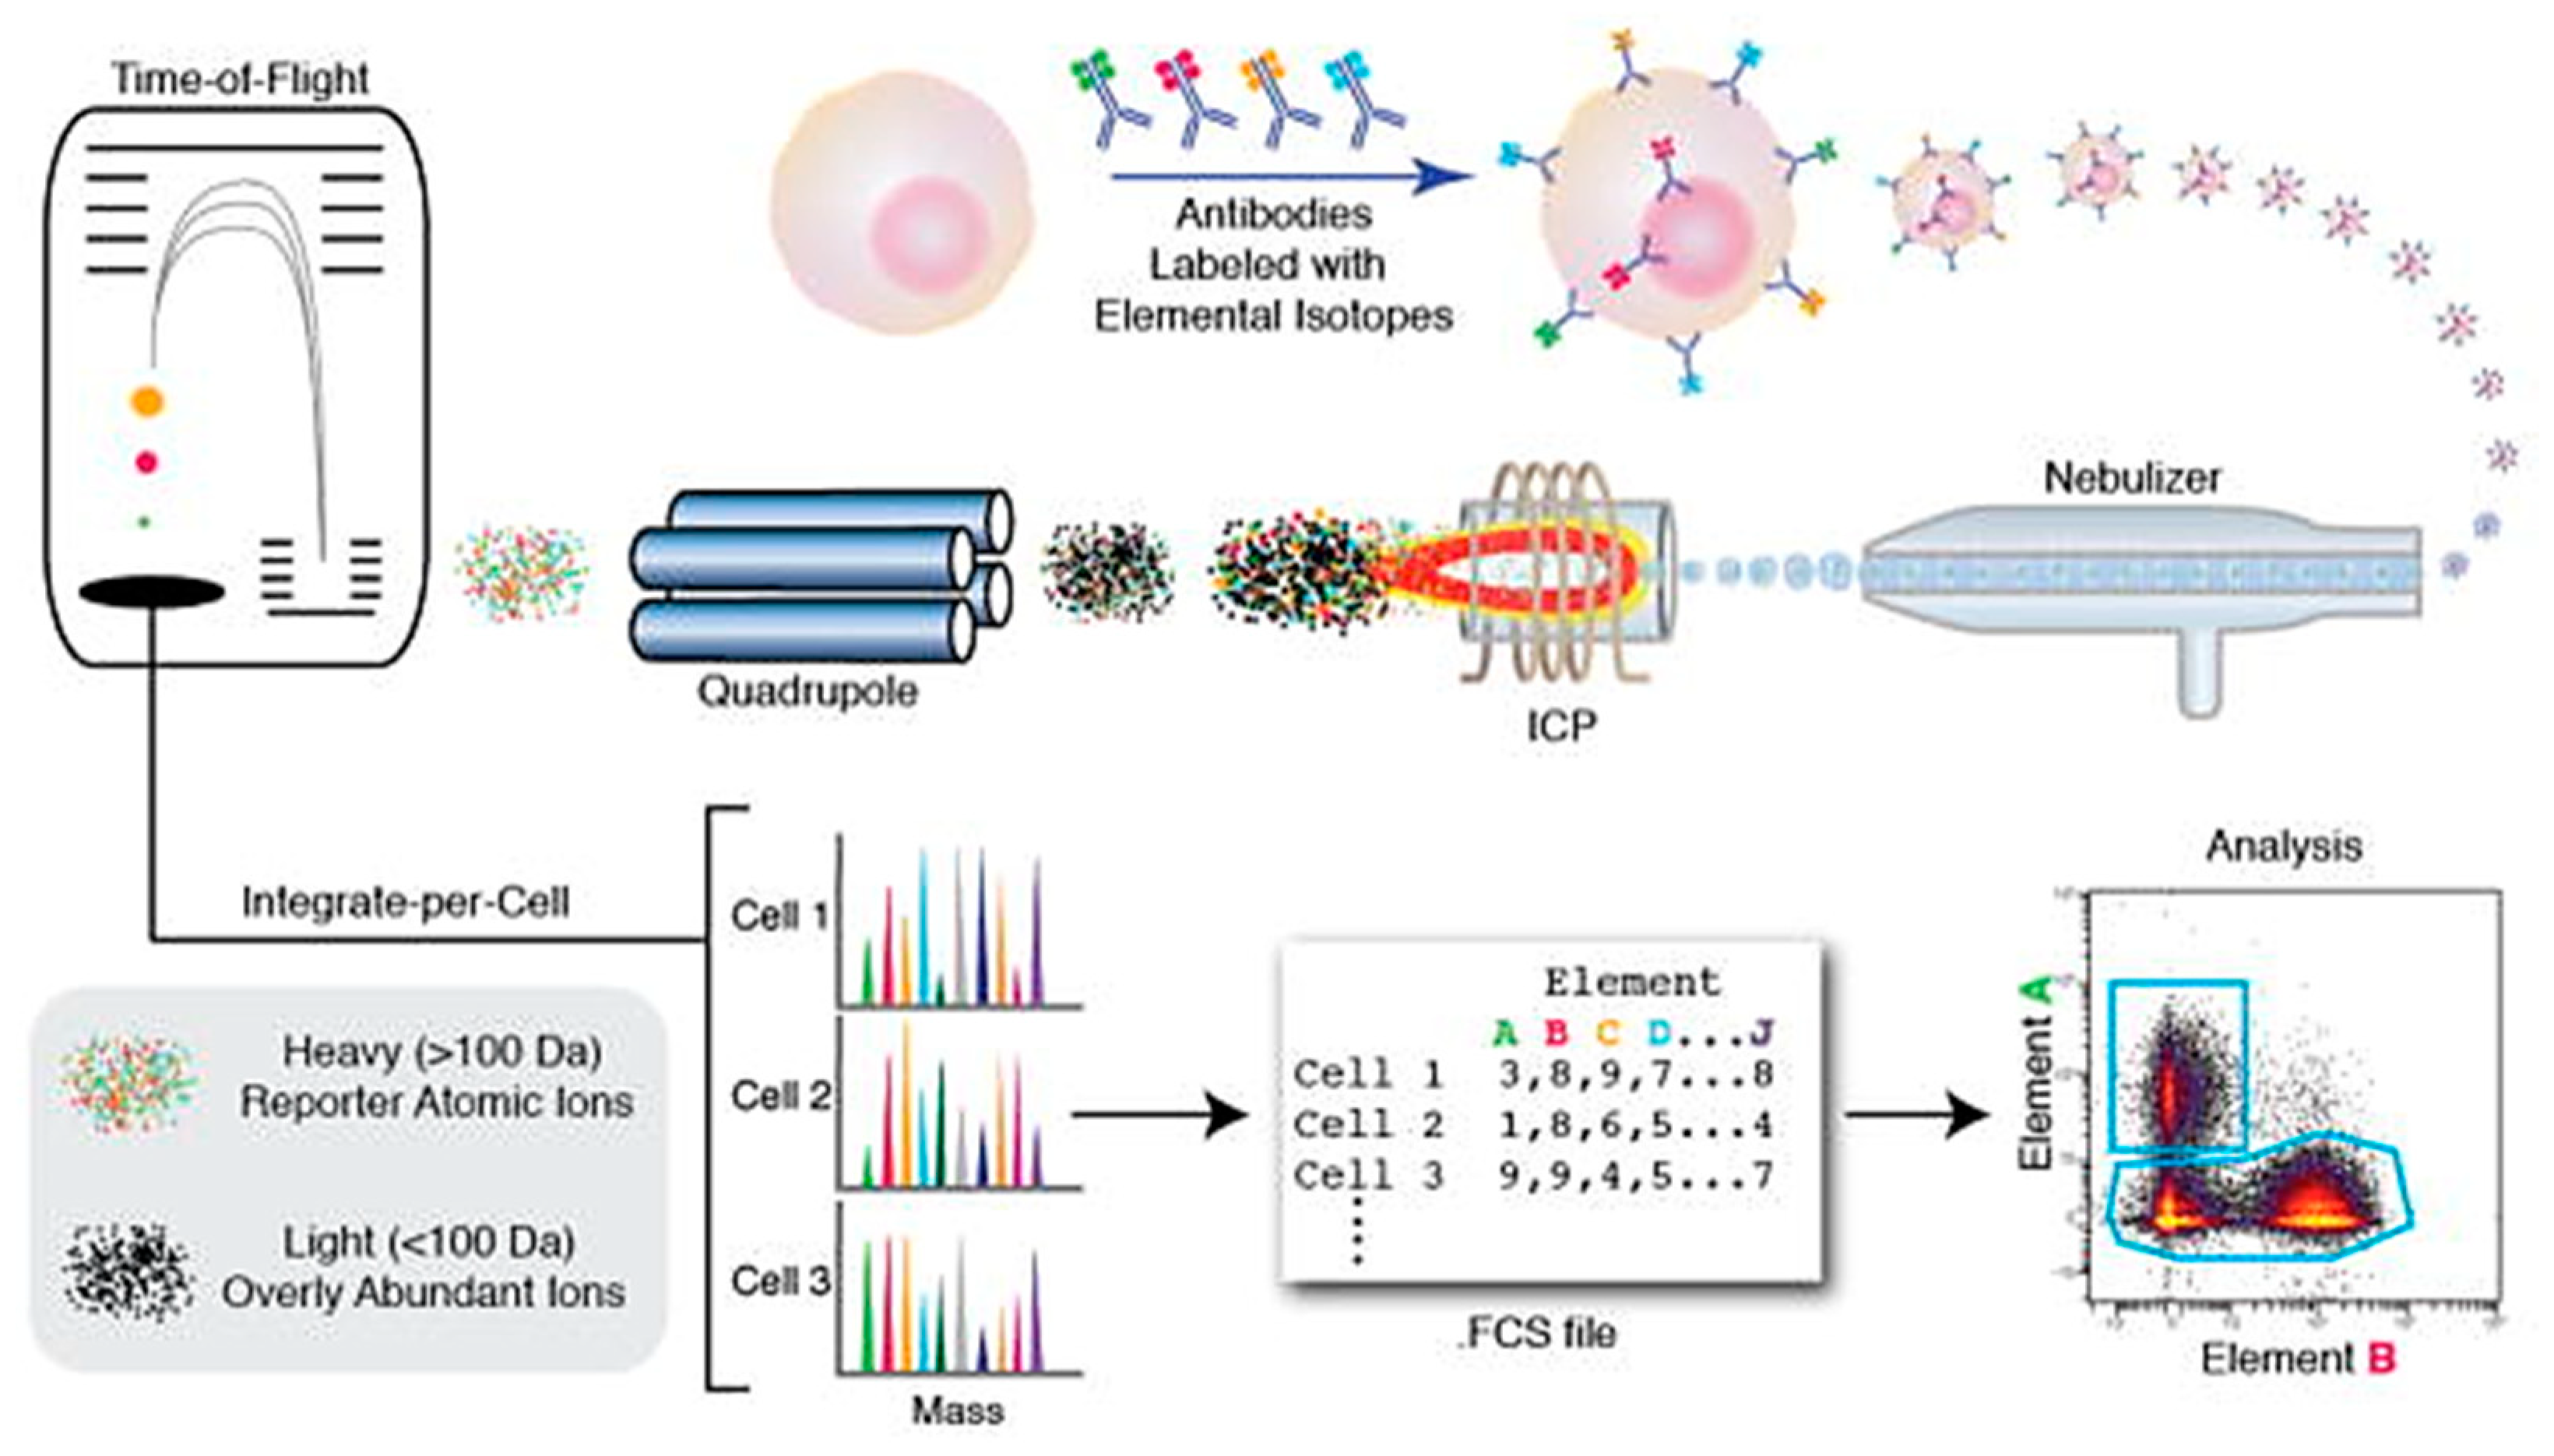
| 7 | Mass Spectrometry | Useful for analyzing and separating cellular components like DNA, RNA, proteins, metabolites based on their mass. CyTOF useful for detecting single cell surface and intracellular markers. | [200,201] |
© 2018 by the authors. Licensee MDPI, Basel, Switzerland. This article is an open access article distributed under the terms and conditions of the Creative Commons Attribution (CC BY) license (http://creativecommons.org/licenses/by/4.0/).
Share and Cite
Shinde, P.; Mohan, L.; Kumar, A.; Dey, K.; Maddi, A.; Patananan, A.N.; Tseng, F.-G.; Chang, H.-Y.; Nagai, M.; Santra, T.S. Current Trends of Microfluidic Single-Cell Technologies. Int. J. Mol. Sci. 2018, 19, 3143. https://0-doi-org.brum.beds.ac.uk/10.3390/ijms19103143
Shinde P, Mohan L, Kumar A, Dey K, Maddi A, Patananan AN, Tseng F-G, Chang H-Y, Nagai M, Santra TS. Current Trends of Microfluidic Single-Cell Technologies. International Journal of Molecular Sciences. 2018; 19(10):3143. https://0-doi-org.brum.beds.ac.uk/10.3390/ijms19103143
Chicago/Turabian StyleShinde, Pallavi, Loganathan Mohan, Amogh Kumar, Koyel Dey, Anjali Maddi, Alexander N. Patananan, Fan-Gang Tseng, Hwan-You Chang, Moeto Nagai, and Tuhin Subhra Santra. 2018. "Current Trends of Microfluidic Single-Cell Technologies" International Journal of Molecular Sciences 19, no. 10: 3143. https://0-doi-org.brum.beds.ac.uk/10.3390/ijms19103143