Distinct Signatures of Host Defense Suppression by Plant-Feeding Mites

 , , ,
, , , 
Abstract
:
1. Introduction
2. Results
2.1. Defense-Associated Phytohormones
2.2. Transcriptomic Profiles
2.2.1. General Overview of Mite-Induced Transcriptomic Changes in Tomato
2.2.2. Detailed Analysis of Selected Defense-Associated Pathways
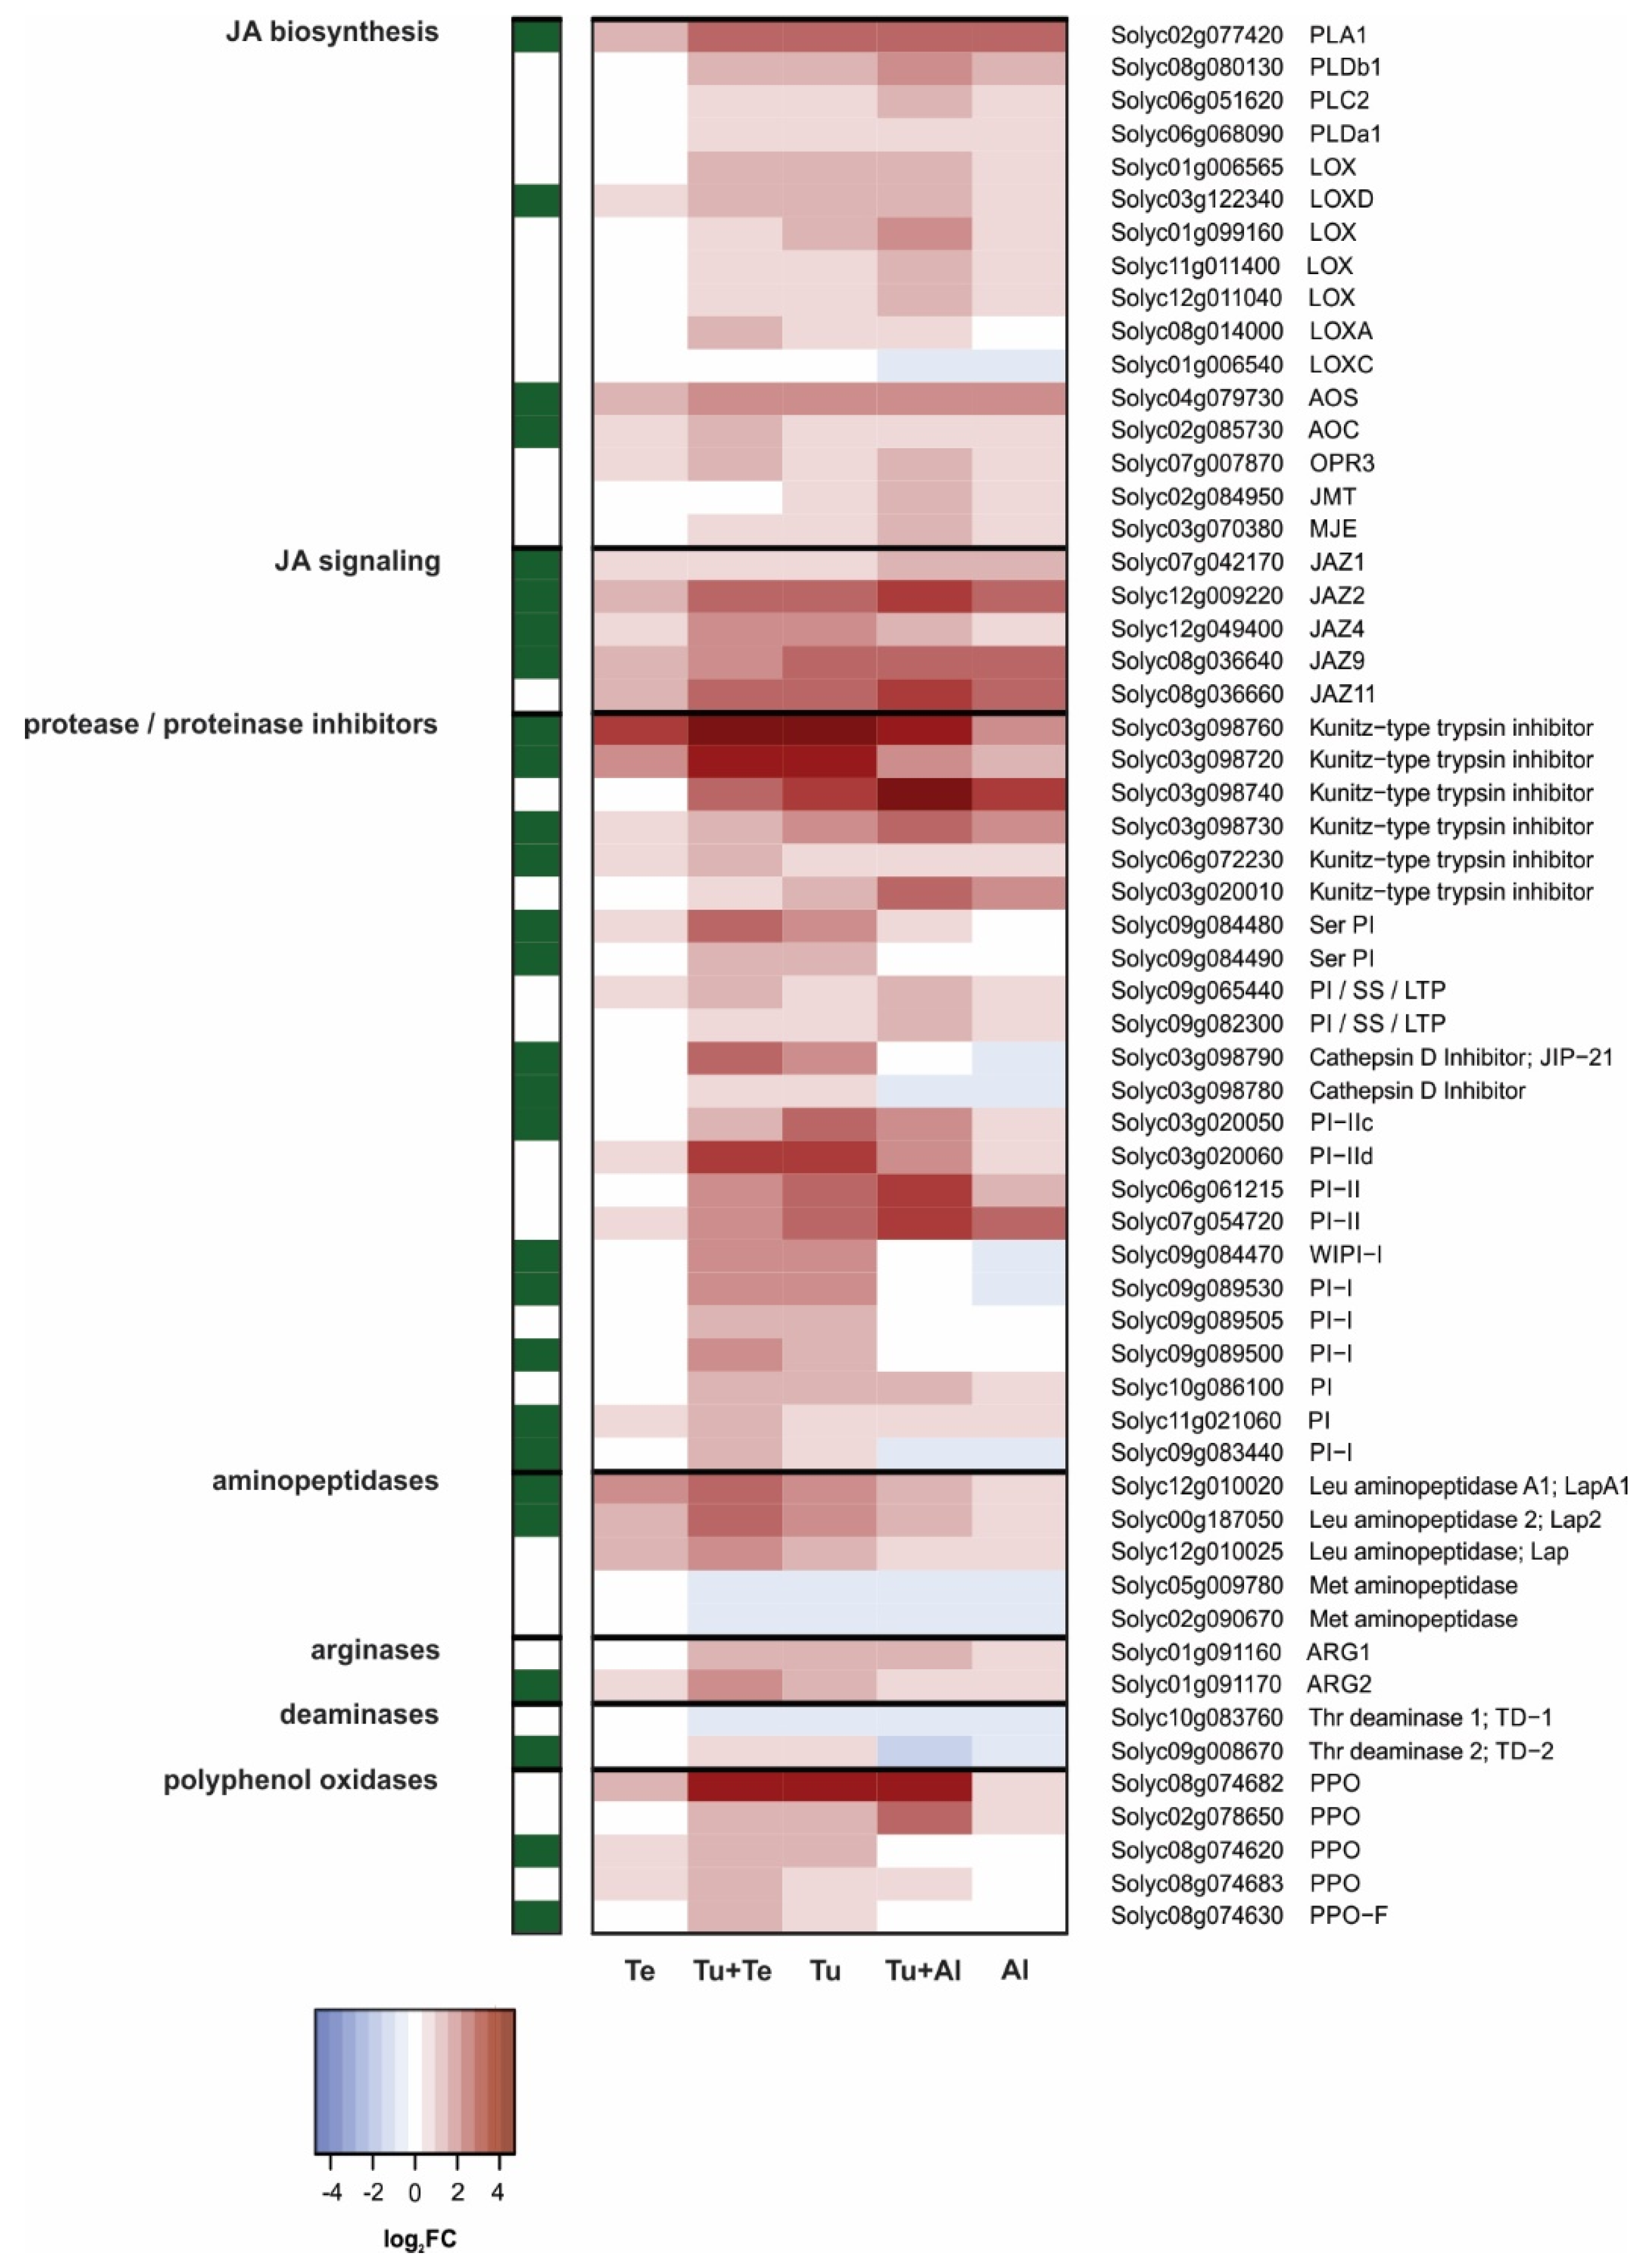
JA Pathway
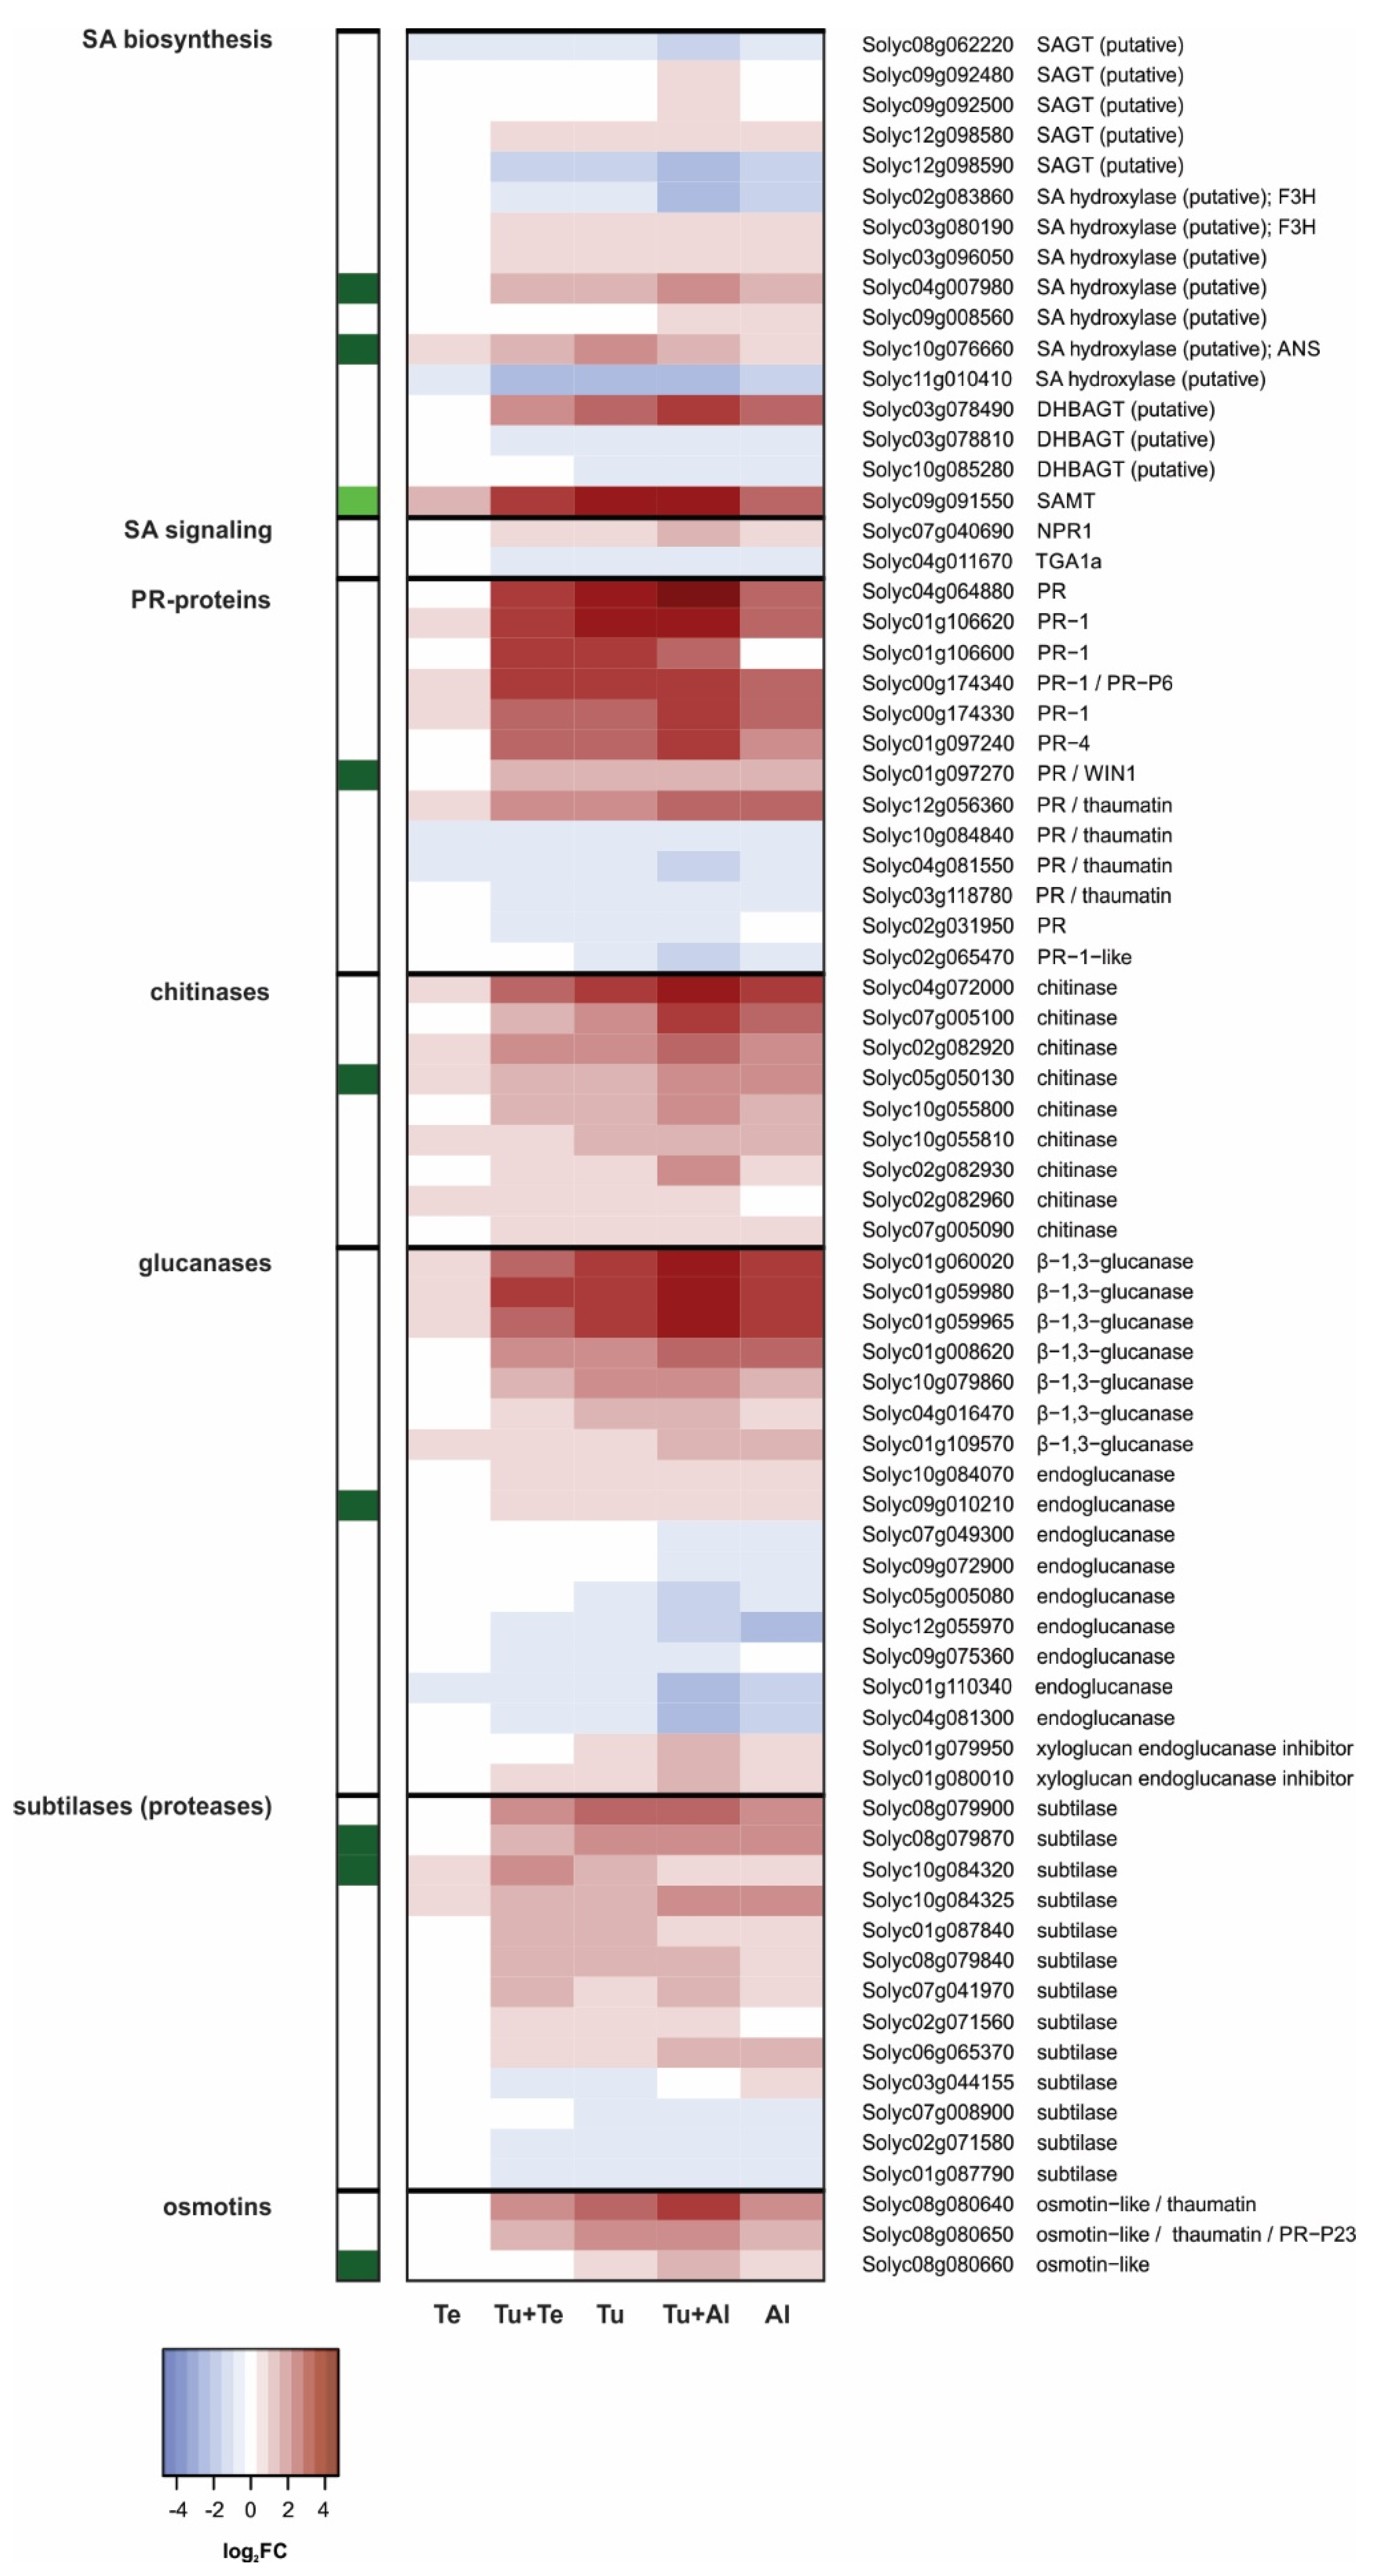
SA Pathway
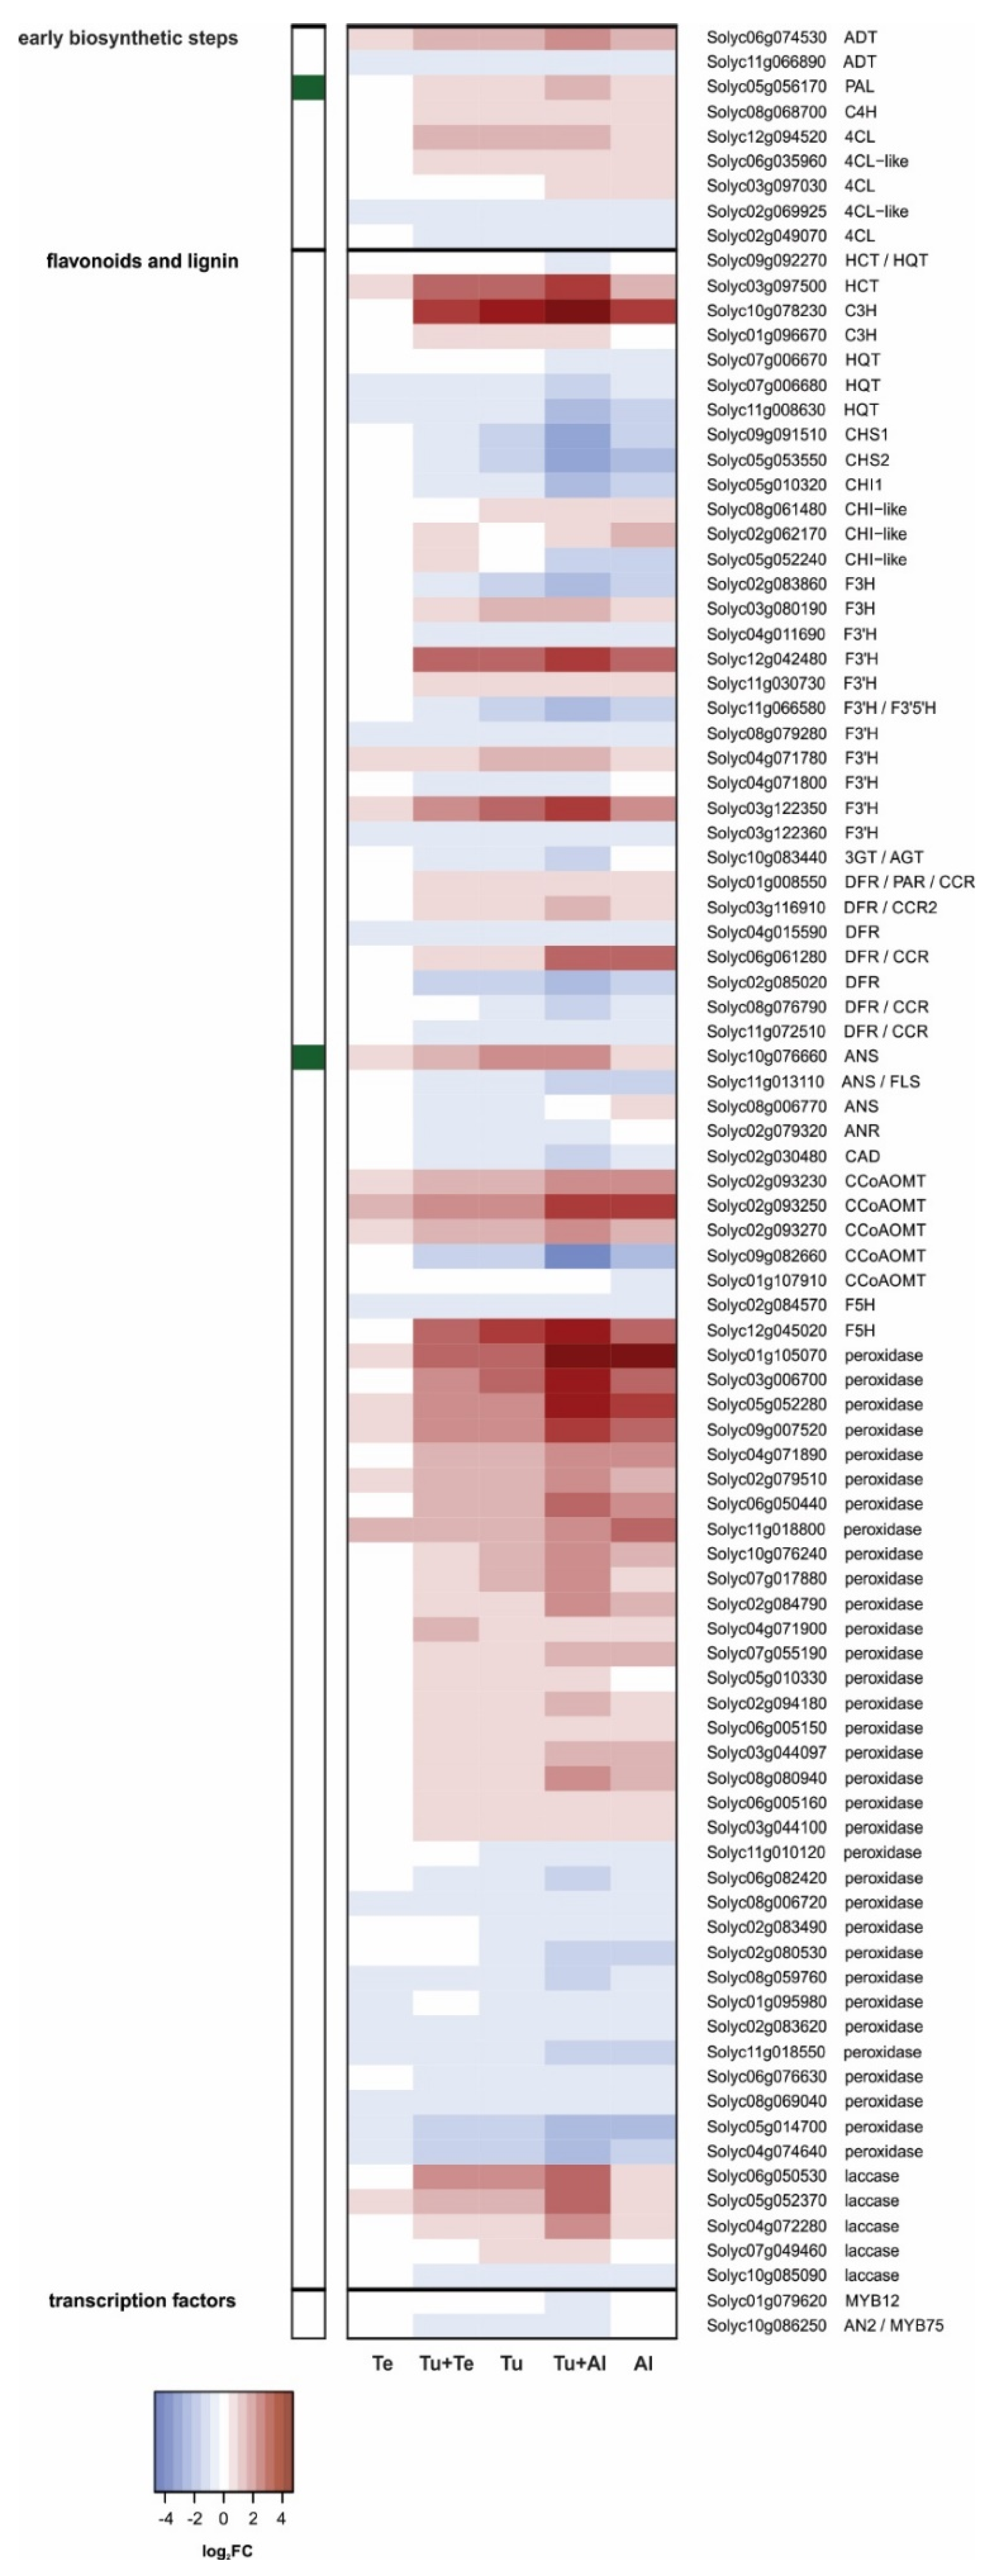
Phenylpropanoid Pathway
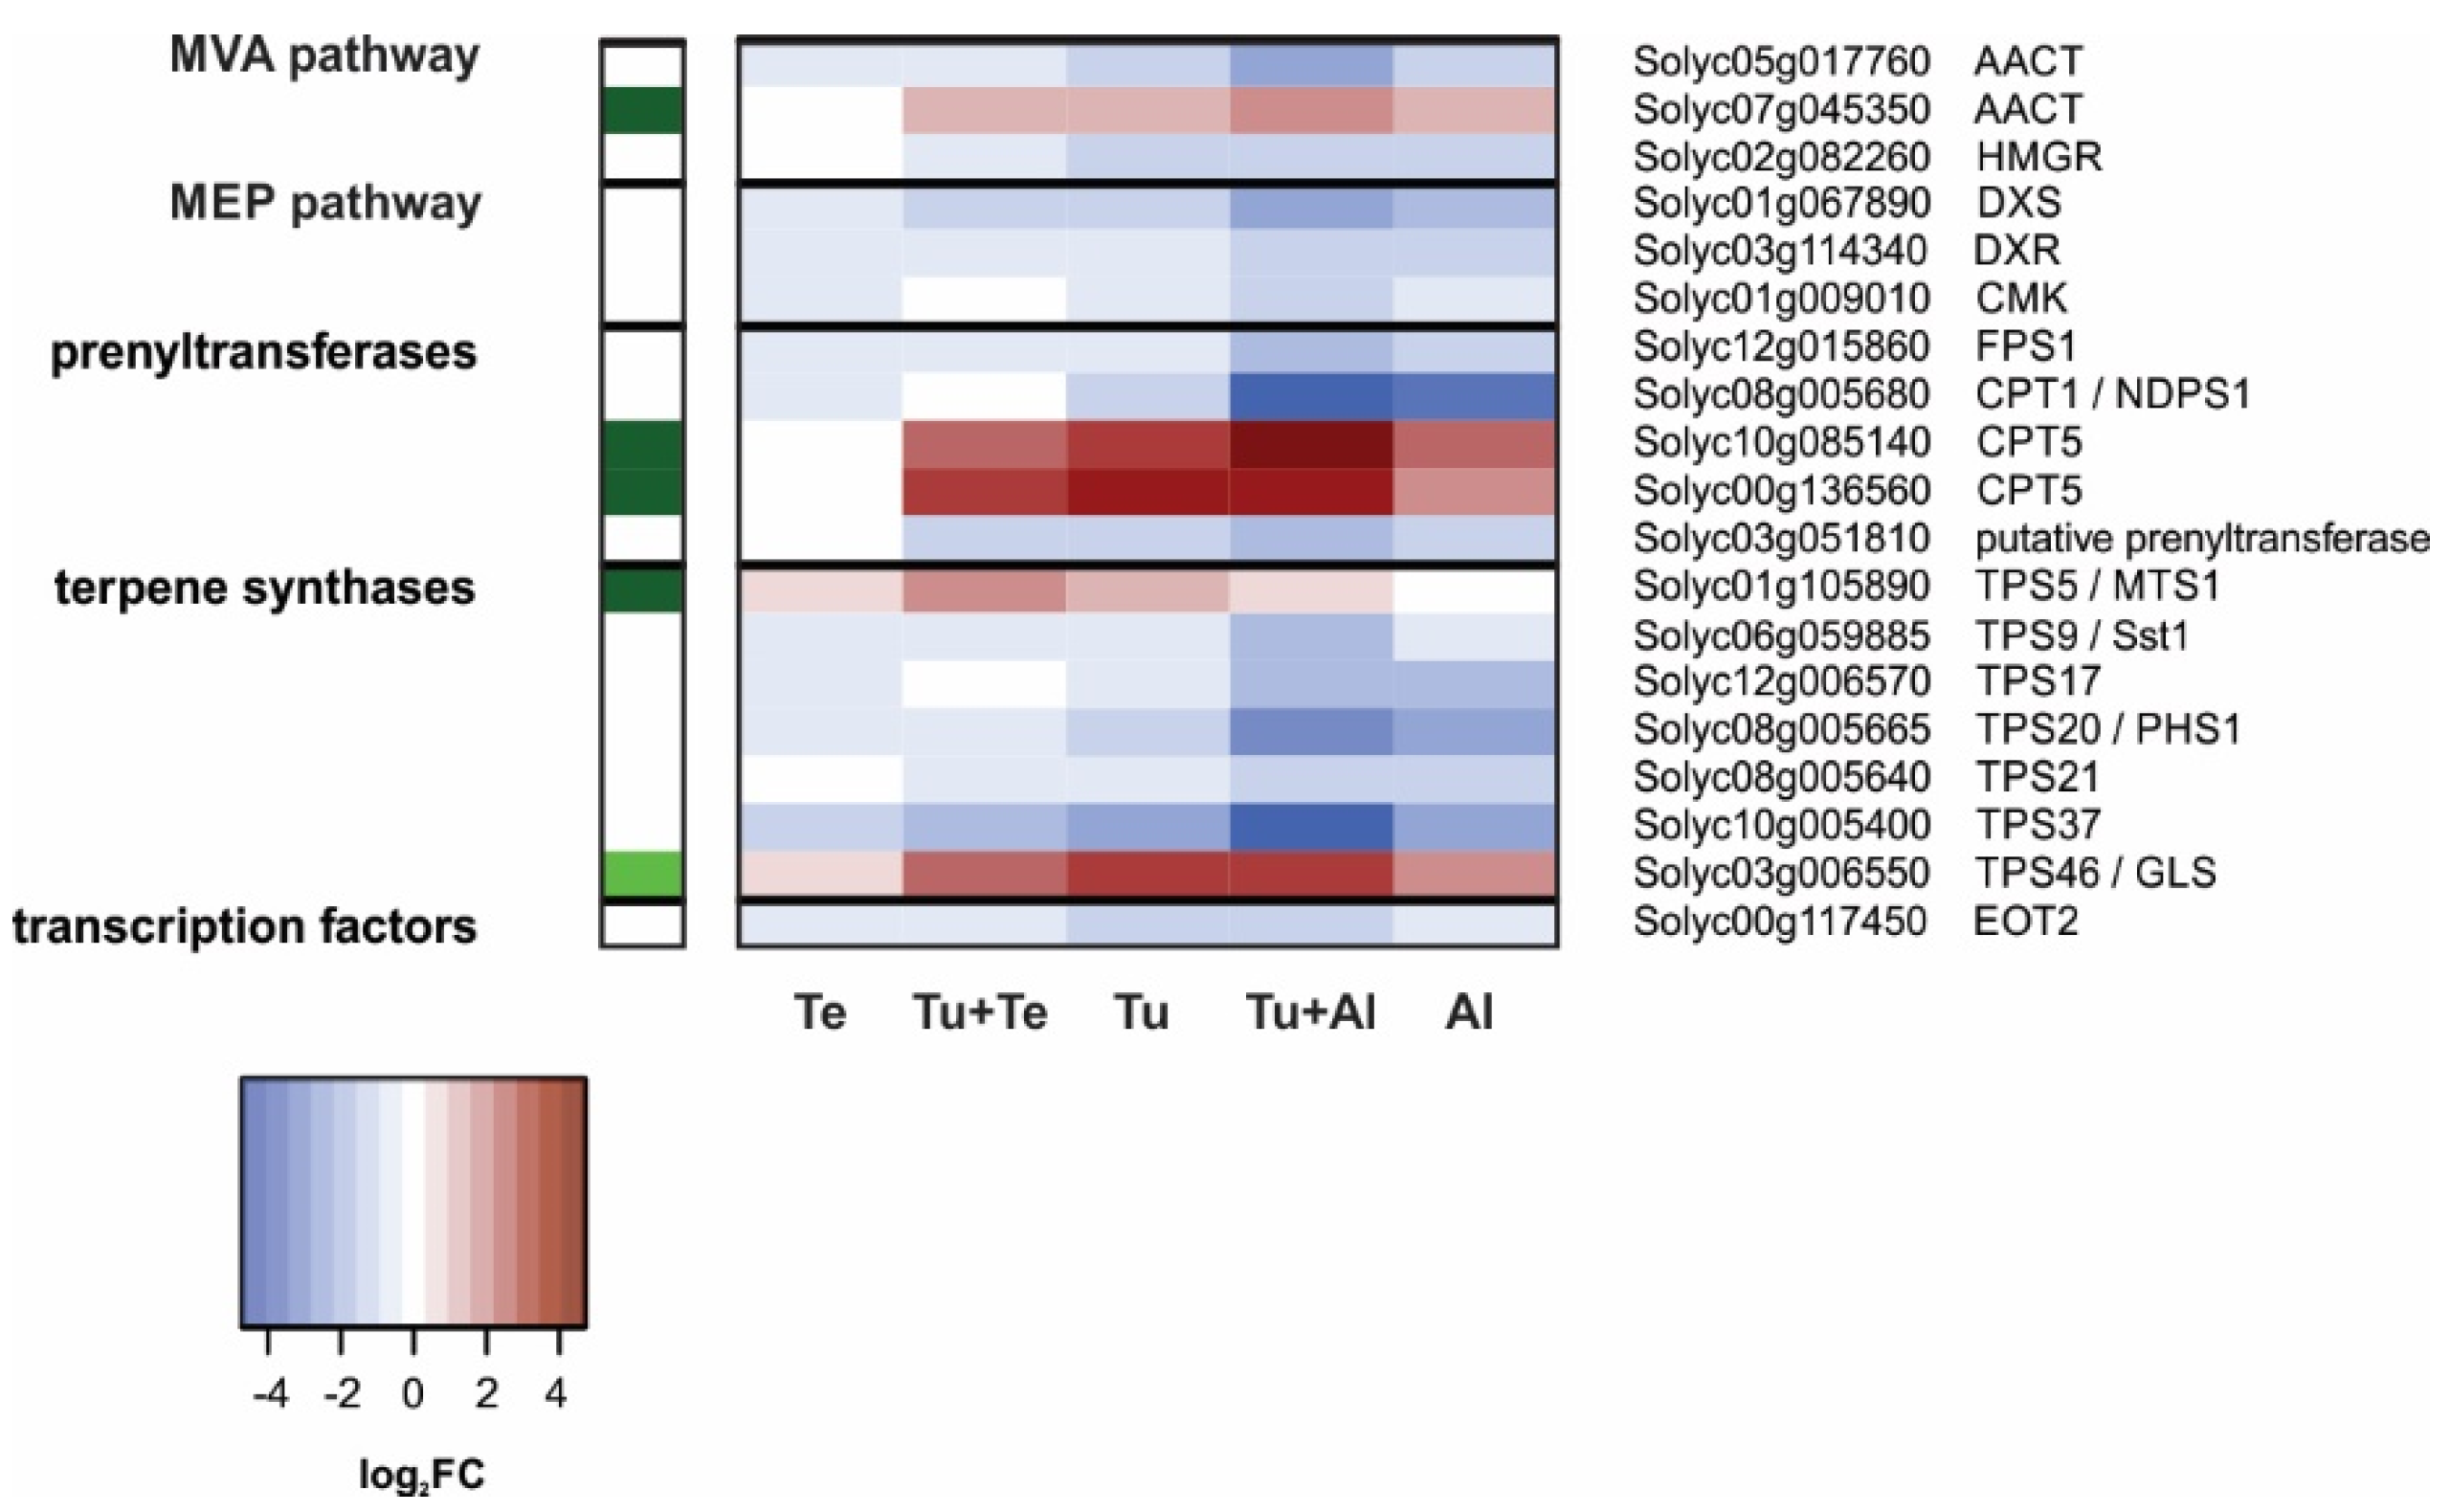
Terpenoids
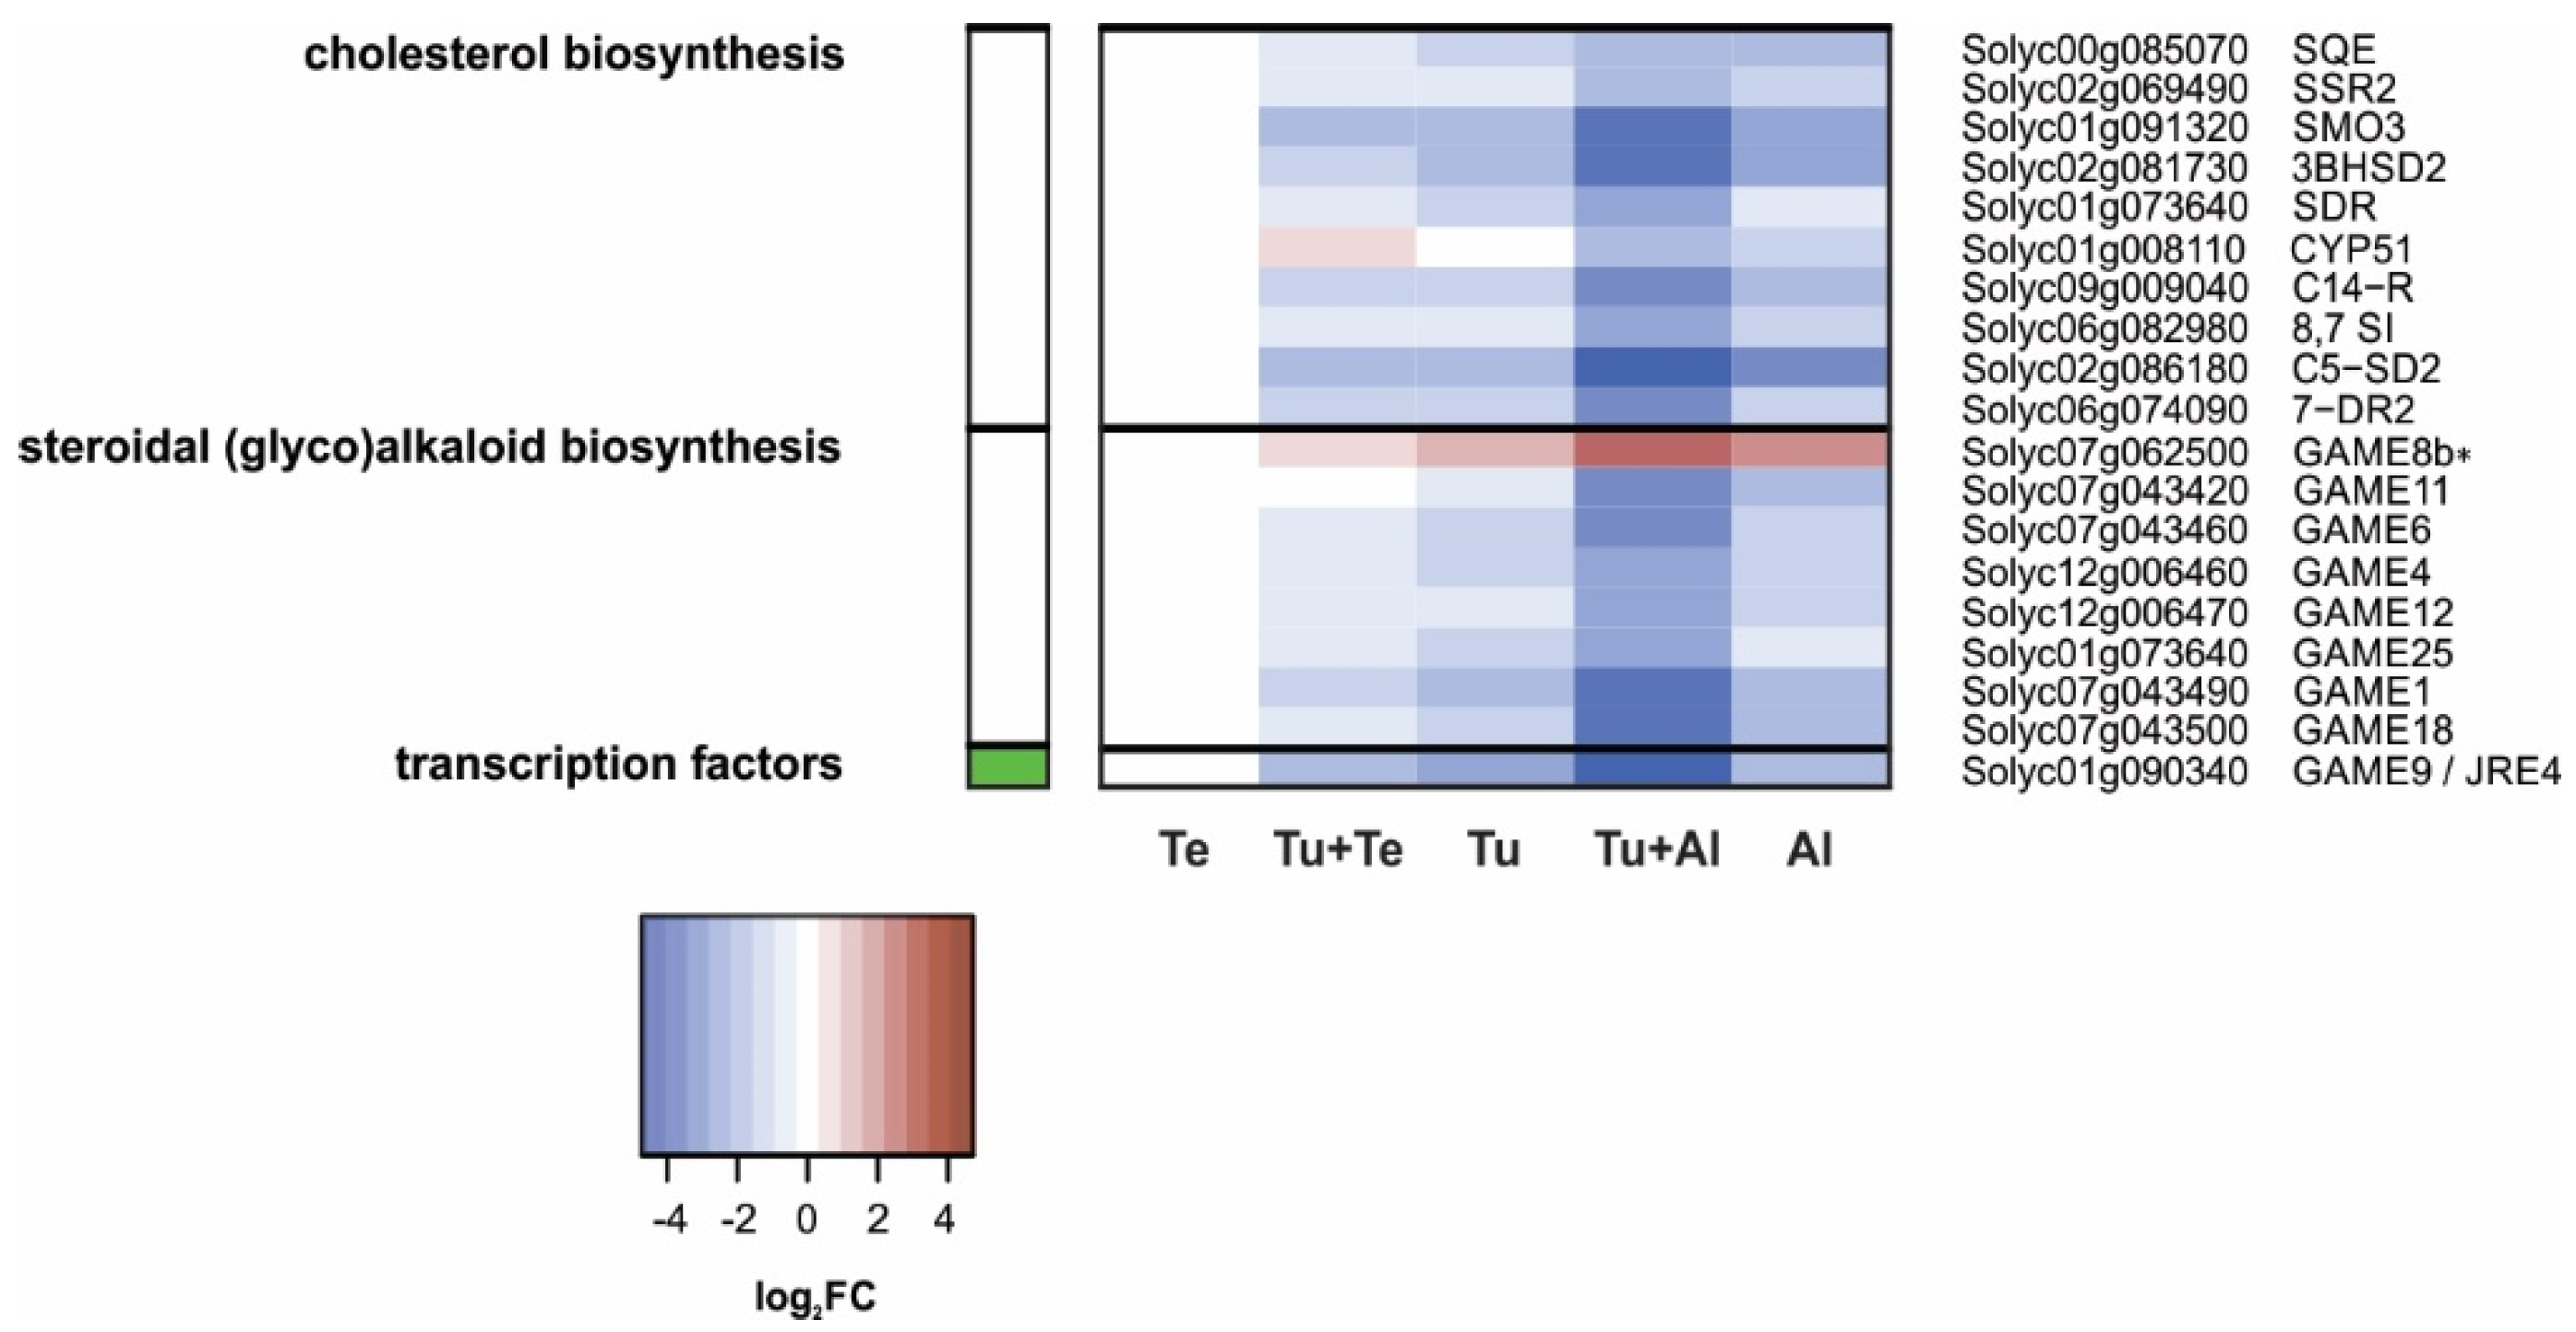
Steroidal (glyco)alkaloids
2.2.3. Hormonal Crosstalk
2.2.4. Beyond Suppression of T. urticae-Induced Genes
3. Discussion
4. Material and Methods
4.1. Plants
4.2. Mites
4.3. Tomato Infestation and Sampling
4.4. Tomato Phytohormone Isolation and Analysis
4.5. Tomato RNA Isolation
4.6. Microarray Hybridizations
4.7. Microarray Analysis
4.8. Real-Time Quantitative Reverse-Transcriptase Polymerase Chain Reaction (qPCR)
Supplementary Materials
Author Contributions
Funding
Acknowledgments
Conflicts of Interest
Data Availability
References
- Jones, J.D.; Dangl, J.L. The plant immune system. Nature 2006, 444, 323–329. [Google Scholar] [CrossRef] [PubMed] [Green Version]
- Schuman, M.C.; Baldwin, I.T. The Layers of plant responses to insect herbivores. Annu. Rev. Entomol. 2016, 61, 373–394. [Google Scholar] [CrossRef] [PubMed]
- Glazebrook, J. Contrasting mechanisms of defense against biotrophic and necrotrophic pathogens. Annu. Rev. Phytopathol. 2005, 43, 205–227. [Google Scholar] [CrossRef] [PubMed]
- Erb, M.; Meldau, S.; Howe, G.A. Role of phytohormones in insect-specific plant reactions. Trends Plant Sci. 2012, 17, 250–259. [Google Scholar] [CrossRef] [PubMed] [Green Version]
- Thaler, J.S.; Humphrey, P.T.; Whiteman, N.K. Evolution of jasmonate and salicylate signal crosstalk. Trends Plant Sci. 2012, 17, 260–270. [Google Scholar] [CrossRef] [PubMed]
- Karasov, T.; Chae, E.; Herman, J.; Bergelson, J. Mechanisms to mitigate the tradeoff between growth and defense. Plant Cell 2017. [Google Scholar] [CrossRef] [PubMed]
- Züst, T.; Agrawal, A.A. Trade-offs between plant growth and defense against insect herbivory: An emerging mechanistic synthesis. Annu. Rev. Plant Biol. 2017, 68, 513–534. [Google Scholar] [CrossRef] [PubMed]
- Alba, J.M.; Glas, J.J.; Schimmel, B.C.J.; Kant, M.R. Avoidance and suppression of plant defenses by herbivores and pathogens. J. Plant Interact. 2011, 6, 221–227. [Google Scholar] [CrossRef] [Green Version]
- Khan, M.; Seto, D.; Subramaniam, R.; Desveaux, D. Oh, the places they’ll go! A survey of phytopathogen effectors and their host targets. Plant J. 2018, 93, 651–663. [Google Scholar] [CrossRef] [PubMed]
- Stahl, E.; Hilfiker, O.; Reymond, P. Plant–arthropod interactions: Who is the winner? Plant J. 2018, 93, 703–728. [Google Scholar] [CrossRef] [PubMed]
- Van der Putten, W.H.; Vet, L.E.; Harvey, J.A.; Wäckers, F.L. Linking above-and belowground multitrophic interactions of plants, herbivores, pathogens, and their antagonists. Trends Ecol. Evol. 2001, 16, 547–554. [Google Scholar] [CrossRef]
- Stout, M.J.; Thaler, J.S.; Thomma, B.P. Plant-mediated interactions between pathogenic microorganisms and herbivorous arthropods. Annu. Rev. Entomol. 2006, 51, 663–689. [Google Scholar] [CrossRef] [PubMed]
- Biere, A.; Goverse, A. Plant-mediated systemic interactions between pathogens, parasitic nematodes, and herbivores above and belowground. Annu. Rev. Phytopathol. 2016, 54, 499–527. [Google Scholar] [CrossRef] [PubMed]
- Kessler, A.; Baldwin, I.T. Herbivore-induced plant vaccination. Part I. The orchestration of plant defenses in nature and their fitness consequences in the wild tobacco Nicotiana attenuata. Plant J. 2004, 38, 639–649. [Google Scholar] [CrossRef] [PubMed]
- Van Zandt, P.A.; Agrawal, A.A. Community-wide impacts of herbivore-induced plant responses in milkweed (Asclepias syriaca). Ecology 2004, 85, 2616–2629. [Google Scholar] [CrossRef]
- Rodriguez-Saona, C.; Chalmers, J.A.; Raj, S.; Thaler, J.S. Induced plant responses to multiple damagers: Differential effects on an herbivore and its parasitoid. Oecologia 2005, 143, 566–577. [Google Scholar] [CrossRef] [PubMed]
- Soler, R.; Bezemer, T.; Van Der Putten, W.H.; Vet, L.E.; Harvey, J.A. Root herbivore effects on above-ground herbivore, parasitoid and hyperparasitoid performance via changes in plant quality. J. Anim. Ecol. 2005, 74, 1121–1130. [Google Scholar] [CrossRef] [Green Version]
- Kaplan, I.; Denno, R.F. Interspecific interactions in phytophagous insects revisited: A quantitative assessment of competition theory. Ecol. Lett. 2007, 10, 977–994. [Google Scholar] [CrossRef] [PubMed]
- Poelman, E.H.; Broekgaarden, C.; Van Loon, J.J.; Dicke, M. Early season herbivore differentially affects plant defence responses to subsequently colonizing herbivores and their abundance in the field. Mol. Ecol. 2008, 17, 3352–3365. [Google Scholar] [CrossRef] [PubMed]
- Mauck, K.E.; de Moraes, C.M.; Mescher, M.C. Deceptive chemical signals induced by a plant virus attract insect vectors to inferior hosts. Proc. Natl. Acad. Sci. USA 2010, 107, 3600–3605. [Google Scholar] [CrossRef] [PubMed] [Green Version]
- Erb, M.; Robert, C.A.M.; Hibbard, B.E.; Turlings, T.C.J. Sequence of arrival determines plant-mediated interactions between herbivores. J. Ecol. 2011, 99, 7–15. [Google Scholar] [CrossRef] [Green Version]
- Tack, A.J.; Gripenberg, S.; Roslin, T. Cross-kingdom interactions matter: Fungal-mediated interactions structure an insect community on oak. Ecol. Lett. 2012, 15, 177–185. [Google Scholar] [CrossRef] [PubMed]
- Glas, J.J.; Alba, J.M.; Simoni, S.; Villarroel, C.A.; Stoops, M.; Schimmel, B.C.J.; Schuurink, R.C.; Sabelis, M.W.; Kant, M.R. Defense suppression benefits herbivores that have a monopoly on their feeding site but can backfire within natural communities. BMC Biol. 2014, 12, 98. [Google Scholar] [CrossRef] [PubMed]
- Huang, W.; Siemann, E.; Xiao, L.; Yang, X.; Ding, J. Species-specific defence responses facilitate conspecifics and inhibit heterospecifics in above-belowground herbivore interactions. Nat. Commun. 2014, 5, 4851. [Google Scholar] [CrossRef] [PubMed]
- Chrétien, L.T.; David, A.; Daikou, E.; Boland, W.; Gershenzon, J.; Giron, D.; Dicke, M.; Lucas-Barbosa, D. Caterpillars induce jasmonates in flowers and alter plant responses to a second attacker. New Phytol. 2018, 217, 1279–1291. [Google Scholar] [CrossRef] [PubMed]
- Stam, J.M.; Kroes, A.; Li, Y.; Gols, R.; Van Loon, J.J.; Poelman, E.H.; Dicke, M. Plant interactions with multiple insect herbivores: From community to genes. Annu. Rev. Plant Biol. 2014, 65, 689–713. [Google Scholar] [CrossRef] [PubMed]
- Soler, R.; Erb, M.; Kaplan, I. Long distance root-shoot signalling in plant-insect community interactions. Trends Plant Sci. 2013, 18, 149–156. [Google Scholar] [CrossRef] [PubMed]
- Poelman, E.H.; Dicke, M. Plant-Mediated Interactions among Insects within a Community Ecological Perspective. In Annual Plant Reviews; Voelckel, C., Jander, G., Eds.; Wiley-Blackwell: Hoboken, NJ, USA, 2014; Volume 47, pp. 309–337. [Google Scholar]
- Johnson, S.N.; Clark, K.E.; Hartley, S.E.; Jones, T.H.; McKenzie, S.W.; Koricheva, J. Aboveground–belowground herbivore interactions: A meta-analysis. Ecology 2012, 93, 2208–2215. [Google Scholar] [CrossRef] [PubMed] [Green Version]
- Sarmento, R.A.; Lemos, F.; Bleeker, P.M.; Schuurink, R.C.; Pallini, A.; Oliveira, M.G.; Lima, E.R.; Kant, M.; Sabelis, M.W.; Janssen, A. A herbivore that manipulates plant defence. Ecol. Lett. 2011, 14, 229–236. [Google Scholar] [CrossRef] [PubMed] [Green Version]
- Wakil, W.; Brust, G.E.; Perring, T. Sustainable Management of Arthropod Pests of Tomato; Academic Press: Cambridge, MA, USA, 2017. [Google Scholar]
- Sarmento, R.A.; Lemos, F.; Dias, C.R.; Kikuchi, W.T.; Rodrigues, J.C.; Pallini, A.; Sabelis, M.W.; Janssen, A. A herbivorous mite down-regulates plant defence and produces web to exclude competitors. PLoS ONE 2011, 6, e23757. [Google Scholar] [CrossRef] [PubMed] [Green Version]
- Alba, J.M.; Schimmel, B.C.J.; Glas, J.J.; Ataide, L.M.; Pappas, M.L.; Villarroel, C.A.; Schuurink, R.C.; Sabelis, M.W.; Kant, M.R. Spider mites suppress tomato defenses downstream of jasmonate and salicylate independently of hormonal crosstalk. New Phytol. 2015, 205, 828–840. [Google Scholar] [CrossRef] [PubMed]
- Li, C.; Williams, M.M.; Loh, Y.T.; Lee, G.I.; Howe, G.A. Resistance of cultivated tomato to cell content-feeding herbivores is regulated by the octadecanoid-signaling pathway. Plant Physiol. 2002, 130, 494–503. [Google Scholar] [CrossRef] [PubMed]
- Li, L.; Zhao, Y.; McCaig, B.C.; Wingerd, B.A.; Wang, J.; Whalon, M.E.; Pichersky, E.; Howe, G.A. The tomato homolog of CORONATINE-INSENSITIVE1 is required for the maternal control of seed maturation, jasmonate-signaled defense responses, and glandular trichome development. Plant Cell 2004, 16, 126–143. [Google Scholar] [CrossRef] [PubMed]
- Ament, K.; Kant, M.R.; Sabelis, M.W.; Haring, M.A.; Schuurink, R.C. Jasmonic acid is a key regulator of spider mite-induced volatile terpenoid and methyl salicylate emission in tomato. Plant Physiol. 2004, 135, 2025–2037. [Google Scholar] [CrossRef] [PubMed]
- Kant, M.R.; Ament, K.; Sabelis, M.W.; Haring, M.A.; Schuurink, R.C. Differential timing of spider mite-induced direct and indirect defenses in tomato plants. Plant Physiol. 2004, 135, 483–495. [Google Scholar] [CrossRef] [PubMed]
- Kant, M.R.; Sabelis, M.W.; Haring, M.A.; Schuurink, R.C. Intraspecific variation in a generalist herbivore accounts for differential induction and impact of host plant defences. Proc. R. Soc. B 2008, 275, 443–452. [Google Scholar] [CrossRef] [PubMed] [Green Version]
- Martel, C.; Zhurov, V.; Navarro, M.; Martinez, M.; Cazaux, M.; Auger, P.; Migeon, A.; Santamaria, M.E.; Wybouw, N.; Diaz, I.; et al. Tomato whole genome transcriptional response to tetranychus urticae identifies divergence of spider mite-induced responses between tomato and arabidopsis. Mol. Plant Microbe Interact. 2015, 28, 343–361. [Google Scholar] [CrossRef] [PubMed]
- Villarroel, C.A.; Jonckheere, W.; Alba, J.M.; Glas, J.J.; Dermauw, W.; Haring, M.A.; Van Leeuwen, T.; Schuurink, R.C.; Kant, M.R. Salivary proteins of spider mites suppress defenses in Nicotiana benthamiana and promote mite reproduction. Plant J. 2016, 86, 119–131. [Google Scholar] [CrossRef] [PubMed] [Green Version]
- Schimmel, B.C.J.; Ataide, L.M.S.; Chafi, R.; Villarroel, C.A.; Alba, J.M.; Schuurink, R.C.; Kant, M.R. Overcompensation of herbivore reproduction through hyper-suppression of plant defenses in response to competition. New Phytol. 2017, 214, 1688–1701. [Google Scholar] [CrossRef] [PubMed]
- Brading, P.A.; Hammond-Kosack, K.E.; Parr, A.; Jones, J.D. Salicylic acid is not required for Cf-2-and Cf-9-dependent resistance of tomato to Cladosporium fulvum. Plant J. 2000, 23, 305–318. [Google Scholar] [CrossRef] [PubMed]
- Zhurov, V.; Navarro, M.; Bruinsma, K.A.; Arbona, V.; Santamaria, M.E.; Cazaux, M.; Wybouw, N.; Osborne, E.J.; Ens, C.; Rioja, C.; et al. Reciprocal responses in the interaction between Arabidopsis and the cell-content-feeding chelicerate herbivore spider mite. Plant Physiol. 2014, 164, 384–399. [Google Scholar] [CrossRef] [PubMed] [Green Version]
- Díaz-Riquelme, J.; Zhurov, V.; Rioja, C.; Pérez-Moreno, I.; Torres-Pérez, R.; Grimplet, J.; Carbonell-Bejerano, P.; Bajda, S.; Van Leeuwen, T.; Martínez-Zapater, J.M. Comparative genome-wide transcriptome analysis of Vitis vinifera responses to adapted and non-adapted strains of two-spotted spider mite, Tetranyhus urticae. BMC Genom. 2016, 17, 74. [Google Scholar] [CrossRef] [PubMed] [Green Version]
- Schimmel, B.C.J.; Ataide, L.M.S.; Kant, M.R. Spatiotemporal heterogeneity of tomato induced defense responses affects spider mite performance and behavior. Plant Signal. Behav. 2017, 12, 1688–1701. [Google Scholar] [CrossRef] [PubMed]
- Agut, B.; Gamir, J.; Jacas, J.A.; Hurtado, M.; Flors, V. Different metabolic and genetic responses in citrus may explain relative susceptibility to Tetranychus urticae. Pest Manag. Sci. 2014, 70, 1728–1741. [Google Scholar] [CrossRef] [PubMed]
- Bui, H.; Greenhalgh, R.; Ruckert, A.; Gill, G.S.; Lee, S.; Ramirez, R.A.; Clark, R.M. Generalist and Specialist Mite Herbivores Induce Similar Defense Responses in Maize and Barley but Differ in Susceptibility to Benzoxazinoids. Front. Plant Sci. 2018, 9. [Google Scholar] [CrossRef] [PubMed]
- Santamaria, M.E.; Diaz, I.; Martinez, M. Dehydration stress contributes to the enhancement of plant defense response and mite performance on barley. Front. Plant Sci. 2018, 9, 458. [Google Scholar] [CrossRef] [PubMed]
- Godinho, D.P.; Janssen, A.; Dias, T.; Cruz, C.; Magalhaes, S. Down-regulation of plant defence in a resident spider mite species and its effect upon con- and heterospecifics. Oecologia 2016, 180, 161–167. [Google Scholar] [CrossRef] [PubMed]
- Blaazer, C.J.H.; Villacis-Perez, E.; Chafi, R.; Van Leeuwen, T.; Kant, M.R.; Schimmel, B.C.J. Why do herbivorous mites suppress plant defenses? Front. Plant Sci. 2018, 9, 1057. [Google Scholar] [CrossRef] [PubMed]
- Liu, J.; Legarrea, S.; Kant, M.R. Tomato reproductive success is equally affected by herbivores that induce or that suppress defenses. Front. Plant Sci. 2017, 8, 2128. [Google Scholar] [CrossRef] [PubMed]
- Paulo, J.; Godinho, D.; Silva, A.; Branquinho, C.; Magalhães, S. Suppression of plant defenses by herbivorous mites is not associated with adaptation to host plants. Int. J. Mol. Sci. 2018, 19, 1783. [Google Scholar] [CrossRef] [PubMed]
- Ataide, L.M.; Pappas, M.L.; Schimmel, B.C.J.; Lopez-Orenes, A.; Alba, J.M.; Duarte, M.V.; Pallini, A.; Schuurink, R.C.; Kant, M.R. Induced plant-defenses suppress herbivore reproduction but also constrain predation of their offspring. Plant Sci. 2016, 252, 300–310. [Google Scholar] [CrossRef] [PubMed] [Green Version]
- Staudacher, H.; Schimmel, B.C.J.; Lamers, M.M.; Wybouw, N.; Groot, A.T.; Kant, M.R. Independent effects of a herbivore’s bacterial symbionts on its performance and induced plant defences. Int. J. Mol. Sci. 2017, 18, 182. [Google Scholar] [CrossRef] [PubMed]
- Wasternack, C.; Song, S. Jasmonates: Biosynthesis, metabolism, and signaling by proteins activating and repressing transcription. J. Exp. Bot. 2016, 68, 1303–1321. [Google Scholar] [CrossRef] [PubMed]
- Suza, W.P.; Rowe, M.L.; Hamberg, M.; Staswick, P.E. A tomato enzyme synthesizes (+)-7-iso-jasmonoyl-l-isoleucine in wounded leaves. Planta 2010, 231, 717–728. [Google Scholar] [CrossRef] [PubMed]
- Howe, G.A.; Major, I.T.; Koo, A.J. Modularity in jasmonate signaling for multistress resilience. Annu. Rev. Plant Biol. 2018, 69, 387–415. [Google Scholar] [CrossRef] [PubMed]
- Zhu-Salzman, K.; Luthe, D.S.; Felton, G.W. Arthropod-inducible proteins: Broad spectrum defenses against multiple herbivores. Plant Physiol. 2008, 146, 852–858. [Google Scholar] [CrossRef] [PubMed]
- Green, T.; Ryan, C.A. Wound-induced proteinase inhibitor in plant leaves: A possible defense mechanism against insects. Science 1972, 175, 776–777. [Google Scholar] [CrossRef] [PubMed]
- Johnson, R.; Narvaez, J.; An, G.; Ryan, C. Expression of proteinase inhibitors I and II in transgenic tobacco plants: Effects on natural defense against Manduca sexta larvae. Proc. Natl. Acad. Sci. USA 1989, 86, 9871–9875. [Google Scholar] [CrossRef] [PubMed]
- Lisón, P.; Rodrigo, I.; Conejero, V. A novel function for the cathepsin D inhibitor in tomato. Plant Physiol. 2006, 142, 1329–1339. [Google Scholar] [CrossRef] [PubMed]
- Chen, H.; Wilkerson, C.G.; Kuchar, J.A.; Phinney, B.S.; Howe, G.A. Jasmonate-inducible plant enzymes degrade essential amino acids in the herbivore midgut. Proc. Natl. Acad. Sci. USA 2005, 102, 19237–19242. [Google Scholar] [CrossRef] [PubMed]
- Gonzales-Vigil, E.; Bianchetti, C.M.; Phillips, G.N., Jr.; Howe, G.A. Adaptive evolution of threonine deaminase in plant defense against insect herbivores. Proc. Natl. Acad. Sci. USA 2011, 108, 5897–5902. [Google Scholar] [CrossRef] [PubMed]
- Mahanil, S.; Attajarusit, J.; Stout, M.J.; Thipyapong, P. Overexpression of tomato polyphenol oxidase increases resistance to common cutworm. Plant Sci. 2008, 174, 456–466. [Google Scholar] [CrossRef]
- Fowler, J.H.; Narvaez-Vasquez, J.; Aromdee, D.N.; Pautot, V.; Holzer, F.M.; Walling, L.L. Leucine aminopeptidase regulates defense and wound signaling in tomato downstream of jasmonic acid. Plant Cell 2009, 21, 1239–1251. [Google Scholar] [CrossRef] [PubMed]
- Lomate, P.R.; Jadhav, B.R.; Giri, A.P.; Hivrale, V.K. Alterations in the Helicoverpa armigera midgut digestive physiology after ingestion of pigeon pea inducible leucine aminopeptidase. PLoS ONE 2013, 8, e74889. [Google Scholar] [CrossRef] [PubMed]
- Howe, G.A.; Herde, M. Interaction of plant defense compounds with the insect gut: New insights from genomic and molecular analyses. Curr. Opin. Insect Sci. 2015, 9, 62–68. [Google Scholar] [CrossRef]
- Seyfferth, C.; Tsuda, K. Salicylic acid signal transduction: The initiation of biosynthesis, perception and transcriptional reprogramming. Front. Plant Sci. 2014, 5, 697. [Google Scholar] [CrossRef] [PubMed]
- Widhalm, J.R.; Dudareva, N. A familiar ring to it: Biosynthesis of plant benzoic acids. Mol. Plant 2015, 8, 83–97. [Google Scholar] [CrossRef] [PubMed]
- Lim, E.-K.; Doucet, C.J.; Li, Y.; Elias, L.; Worrall, D.; Spencer, S.P.; Ross, J.; Bowles, D.J. The activity of Arabidopsis glycosyltransferases towards salicylic acid, 4-hydroxybenzoic acid and other benzoates. J. Biol. Chem. 2001, 277, 586–592. [Google Scholar] [CrossRef] [PubMed]
- Dean, J.V.; Delaney, S.P. Metabolism of salicylic acid in wild-type, ugt74f1 and ugt74f2 glucosyltransferase mutants of Arabidopsis thaliana. Physiol. Plant. 2008, 132, 417–425. [Google Scholar] [CrossRef] [PubMed]
- Zhang, K.; Halitschke, R.; Yin, C.; Liu, C.J.; Gan, S.S. Salicylic acid 3-hydroxylase regulates Arabidopsis leaf longevity by mediating salicylic acid catabolism. Proc. Natl. Acad. Sci. USA 2013, 110, 14807–14812. [Google Scholar] [CrossRef] [PubMed]
- Zhang, Y.; Zhao, L.; Zhao, J.; Li, Y.; Wang, J.; Guo, R.; Gan, S.-S.; Liu, C.-J.; Zhang, K. S5H/DMR6 encodes a salicylic acid 5-hydroxylase that fine-tunes salicylic acid homeostasis. Plant Physiol. 2017, 175, 1082–1093. [Google Scholar] [CrossRef] [PubMed]
- Huang, X.; Zhu, G.-Q.; Liu, Q.; Chen, L.; Li, Y.-J.; Hou, B.-K. Modulation of plant salicylic acid-associated immune responses via glycosylation of dihydroxybenzoic acids. Plant Physiol. 2018, 176, 3103–3119. [Google Scholar] [CrossRef] [PubMed]
- Ament, K.; Krasikov, V.; Allmann, S.; Rep, M.; Takken, F.L.; Schuurink, R.C. Methyl salicylate production in tomato affects biotic interactions. Plant J. 2010, 62, 124–134. [Google Scholar] [CrossRef] [PubMed] [Green Version]
- Tieman, D.; Zeigler, M.; Schmelz, E.; Taylor, M.G.; Rushing, S.; Jones, J.B.; Klee, H.J. Functional analysis of a tomato salicylic acid methyl transferase and its role in synthesis of the flavor volatile methyl salicylate. Plant J. 2010, 62, 113–123. [Google Scholar] [CrossRef] [PubMed] [Green Version]
- Ding, Y.; Sun, T.; Ao, K.; Peng, Y.; Zhang, Y.; Li, X.; Zhang, Y. Opposite roles of salicylic acid receptors NPR1 and NPR3/NPR4 in transcriptional regulation of plant immunity. Cell 2018, 173, 1454–1467. [Google Scholar] [CrossRef] [PubMed]
- Van Loon, L.C.; Rep, M.; Pieterse, C.M.J. Significance of inducible defense-related proteins in infected plants. Annu. Rev. Phytopathol. 2006, 44, 135–162. [Google Scholar] [CrossRef] [PubMed]
- Vogt, T. Phenylpropanoid biosynthesis. Mol. Plant 2010, 3, 2–20. [Google Scholar] [CrossRef] [PubMed]
- Tohge, T.; Watanabe, M.; Hoefgen, R.; Fernie, A.R. The evolution of phenylpropanoid metabolism in the green lineage. Crit. Rev. Biochem. Mol. Biol. 2013, 48, 123–152. [Google Scholar] [CrossRef] [PubMed]
- Van der Rest, B.; Danoun, S.; Boudet, A.-M.; Rochange, S.F. Down-regulation of cinnamoyl-CoA reductase in tomato (Solanum lycopersicum L.) induces dramatic changes in soluble phenolic pools. J. Exp. Bot. 2006, 57, 1399–1411. [Google Scholar] [CrossRef] [PubMed]
- Kang, J.H.; Liu, G.; Shi, F.; Jones, A.D.; Beaudry, R.M.; Howe, G.A. The tomato odorless-2 mutant is defective in trichome-based production of diverse specialized metabolites and broad-spectrum resistance to insect herbivores. Plant Physiol. 2010, 154, 262–272. [Google Scholar] [CrossRef] [PubMed]
- Balcke, G.; Bennewitz, S.; Bergau, N.; Athmer, B.; Henning, A.; Majovsky, P.; Jiménez-Gómez, J.M.; Hoehenwarter, W.; Tissier, A.F. Multiomics of tomato glandular trichomes reveals distinct features of central carbon metabolism supporting high productivity of specialized metabolites. Plant Cell 2017, 29, 960–983. [Google Scholar] [CrossRef] [PubMed]
- Isman, M.B.; Duffey, S.S. Toxicity of tomato phenolic compounds to the fruitworm, Heliothis zea. Entomol. Exp. Appl. 1982, 31, 370–376. [Google Scholar] [CrossRef]
- Felton, G.; Donato, K.; Del Vecchio, R.; Duffey, S. Activation of plant foliar oxidases by insect feeding reduces nutritive quality of foliage for noctuid herbivores. J. Chem. Ecol. 1989, 15, 2667–2694. [Google Scholar] [CrossRef] [PubMed]
- Felton, G.; Donato, K.; Broadway, R.; Duffey, S. Impact of oxidized plant phenolics on the nutritional quality of dietar protein to a noctuid herbivore, Spodoptera exigua. J. Insect Physiol. 1992, 38, 277–285. [Google Scholar] [CrossRef]
- Niggeweg, R.; Michael, A.J.; Martin, C. Engineering plants with increased levels of the antioxidant chlorogenic acid. Nat. Biotechnol. 2004, 22, 746–754. [Google Scholar] [CrossRef] [PubMed]
- O’Neill, S.D.; Tong, Y.; Spörlein, B.; Forkmann, G.; Yoder, J.I. Molecular genetic analysis of chalcone synthase in Lycopersicon esculentum and an anthocyanin-deficient mutant. Mol. Gen. Genet. 1990, 224, 279–288. [Google Scholar] [CrossRef] [PubMed]
- Schijlen, E.G.; de Vos, C.R.; Martens, S.; Jonker, H.H.; Rosin, F.M.; Molthoff, J.W.; Tikunov, Y.M.; Angenent, G.C.; van Tunen, A.J.; Bovy, A.G. RNA interference silencing of chalcone synthase, the first step in the flavonoid biosynthesis pathway, leads to parthenocarpic tomato fruits. Plant Physiol. 2007, 144, 1520–1530. [Google Scholar] [CrossRef] [PubMed]
- Kang, J.H.; McRoberts, J.; Shi, F.; Moreno, J.E.; Jones, A.D.; Howe, G.A. The flavonoid biosynthetic enzyme chalcone isomerase modulates terpenoid production in glandular trichomes of tomato. Plant Physiol. 2014, 164, 1161–1174. [Google Scholar] [CrossRef] [PubMed]
- Luo, J.; Butelli, E.; Hill, L.; Parr, A.; Niggeweg, R.; Bailey, P.; Weisshaar, B.; Martin, C. AtMYB12 regulates caffeoyl quinic acid and flavonol synthesis in tomato: Expression in fruit results in very high levels of both types of polyphenol. Plant J. 2008, 56, 316–326. [Google Scholar] [CrossRef] [PubMed]
- Adato, A.; Mandel, T.; Mintz-Oron, S.; Venger, I.; Levy, D.; Yativ, M.; Domínguez, E.; Wang, Z.; de Vos, R.C.; Jetter, R. Fruit-surface flavonoid accumulation in tomato is controlled by a SlMYB12-regulated transcriptional network. PLoS Genet. 2009, 5, e1000777. [Google Scholar] [CrossRef] [PubMed]
- Ballester, A.-R.; Molthoff, J.; de Vos, R.; te Lintel Hekkert, B.; Orzaez, D.; Fernández-Moreno, J.-P.; Tripodi, P.; Grandillo, S.; Martin, C.; Heldens, J. Biochemical and molecular analysis of pink tomatoes: Deregulated expression of the gene encoding transcription factor SlMYB12 leads to pink tomato fruit color. Plant Physiol. 2010, 152, 71–84. [Google Scholar] [CrossRef] [PubMed]
- Fernandez-Moreno, J.-P.; Tzfadia, O.; Forment, J.; Presa, S.; Rogachev, I.; Meir, S.; Orzaez, D.; Aharoni, A.; Granell, A. Characterization of a new pink fruit tomato mutant result in the identification of a null allele of the SlMYB12 transcription factor. Plant Physiol. 2016. [Google Scholar] [CrossRef] [PubMed]
- Kiferle, C.; Fantini, E.; Bassolino, L.; Povero, G.; Spelt, C.; Buti, S.; Giuliano, G.; Quattrocchio, F.; Koes, R.; Perata, P. Tomato R2R3-MYB Proteins SlANT1 and SlAN2: Same protein activity, different roles. PLoS ONE 2015, 10, e0136365. [Google Scholar] [CrossRef] [PubMed]
- Mathews, H.; Clendennen, S.K.; Caldwell, C.G.; Liu, X.L.; Connors, K.; Matheis, N.; Schuster, D.K.; Menasco, D.; Wagoner, W.; Lightner, J. Activation tagging in tomato identifies a transcriptional regulator of anthocyanin biosynthesis, modification, and transport. Plant Cell 2003, 15, 1689–1703. [Google Scholar] [CrossRef] [PubMed]
- Falara, V.; Alba, J.M.; Kant, M.R.; Schuurink, R.C.; Pichersky, E. Geranyllinalool synthases in solanaceae and other angiosperms constitute an ancient branch of diterpene synthases involved in the synthesis of defensive compounds. Plant Physiol. 2014, 166, 428–441. [Google Scholar] [CrossRef] [PubMed]
- Schilmiller, A.L.; Schauvinhold, I.; Larson, M.; Xu, R.; Charbonneau, A.L.; Schmidt, A.; Wilkerson, C.; Last, R.L.; Pichersky, E. Monoterpenes in the glandular trichomes of tomato are synthesized from a neryl diphosphate precursor rather than geranyl diphosphate. Proc. Natl. Acad. Sci. USA 2009, 106, 10865–10870. [Google Scholar] [CrossRef] [PubMed] [Green Version]
- Bleeker, P.M.; Spyropoulou, E.A.; Diergaarde, P.J.; Volpin, H.; de Both, M.T.; Zerbe, P.; Bohlmann, J.; Falara, V.; Matsuba, Y.; Pichersky, E. RNA-seq discovery, functional characterization, and comparison of sesquiterpene synthases from Solanum lycopersicum and Solanum habrochaites trichomes. Plant Mol. Biol. 2011, 77, 323–326. [Google Scholar] [CrossRef] [PubMed]
- Matsuba, Y.; Zi, J.; Jones, A.D.; Peters, R.J.; Pichersky, E. Biosynthesis of the diterpenoid lycosantalonol via nerylneryl diphosphate in Solanum lycopersicum. PLoS ONE 2015, 10, e0119302. [Google Scholar] [CrossRef] [PubMed]
- Van Schie, C.C.; Haring, M.A.; Schuurink, R.C. Tomato linalool synthase is induced in trichomes by jasmonic acid. Plant Mol. Biol. 2007, 64, 251–263. [Google Scholar] [CrossRef] [PubMed] [Green Version]
- Falara, V.; Akhtar, T.A.; Nguyen, T.T.; Spyropoulou, E.A.; Bleeker, P.M.; Schauvinhold, I.; Matsuba, Y.; Bonini, M.E.; Schilmiller, A.L.; Last, R.L.; et al. The tomato terpene synthase gene family. Plant Physiol. 2011, 157, 770–789. [Google Scholar] [CrossRef] [PubMed]
- Van Schie, C.C.; Ament, K.; Schmidt, A.; Lange, T.; Haring, M.A.; Schuurink, R.C. Geranyl diphosphate synthase is required for biosynthesis of gibberellins. Plant J. 2007, 52, 752–762. [Google Scholar] [CrossRef] [PubMed] [Green Version]
- Gaffe, J.; Bru, J.-P.; Causse, M.; Vidal, A.; Stamitti-Bert, L.; Carde, J.-P.; Gallusci, P. LEFPS1, a tomato farnesyl pyrophosphate gene highly expressed during early fruit development. Plant Physiol. 2000, 123, 1351–1362. [Google Scholar] [CrossRef] [PubMed]
- Ament, K.; Van Schie, C.C.; Bouwmeester, H.J.; Haring, M.A.; Schuurink, R.C. Induction of a leaf specific geranylgeranyl pyrophosphate synthase and emission of (E,E)-4,8,12-trimethyltrideca-1,3,7,11-tetraene in tomato are dependent on both jasmonic acid and salicylic acid signaling pathways. Planta 2006, 224, 1197–1208. [Google Scholar] [CrossRef] [PubMed]
- Akhtar, T.A.; Matsuba, Y.; Schauvinhold, I.; Yu, G.; Lees, H.A.; Klein, S.E.; Pichersky, E. The tomato cis-prenyltransferase gene family. Plant J. 2013, 73, 640–652. [Google Scholar] [CrossRef] [PubMed]
- Itkin, M.; Rogachev, I.; Alkan, N.; Rosenberg, T.; Malitsky, S.; Masini, L.; Meir, S.; Iijima, Y.; Aoki, K.; de Vos, R.; et al. GLYCOALKALOID METABOLISM1 is required for steroidal alkaloid glycosylation and prevention of phytotoxicity in tomato. Plant Cell 2011, 23, 4507–4525. [Google Scholar] [CrossRef] [PubMed]
- Itkin, M.; Heinig, U.; Tzfadia, O.; Bhide, A.J.; Shinde, B.; Cardenas, P.D.; Bocobza, S.E.; Unger, T.; Malitsky, S.; Finkers, R.; et al. Biosynthesis of antinutritional alkaloids in solanaceous crops is mediated by clustered genes. Science 2013, 341, 175–179. [Google Scholar] [CrossRef] [PubMed]
- Sonawane, P.D.; Pollier, J.; Panda, S.; Szymanski, J.; Massalha, H.; Yona, M.; Unger, T.; Malitsky, S.; Arendt, P.; Pauwels, L. Plant cholesterol biosynthetic pathway overlaps with phytosterol metabolism. Nat. Plants 2017, 3, 16205. [Google Scholar] [CrossRef] [PubMed]
- Nakayasu, M.; Umemoto, N.; Ohyama, K.; Fujimoto, Y.; Lee, H.J.; Watanabe, B.; Muranaka, T.; Saito, K.; Sugimoto, Y.; Mizutani, M. A dioxygenase catalyzes steroid 16α-hydroxylation in steroidal glycoalkaloid biosynthesis. Plant Physiol. 2017, 175, 120–133. [Google Scholar] [CrossRef] [PubMed]
- Sonawane, P.D.; Heinig, U.; Panda, S.; Gilboa, N.S.; Yona, M.; Kumar, S.P.; Alkan, N.; Unger, T.; Bocobza, S.; Pliner, M. Short-chain dehydrogenase/reductase governs steroidal specialized metabolites structural diversity and toxicity in the genus Solanum. Proc. Natl. Acad. Sci. USA 2018, 115, E5419–E5428. [Google Scholar] [CrossRef] [PubMed]
- Nakayasu, M.; Shioya, N.; Shikata, M.; Thagun, C.; Abdelkareem, A.; Okabe, Y.; Ariizumi, T.; Arimura, G.I.; Mizutani, M.; Ezura, H. JRE 4 is a master transcriptional regulator of defense-related steroidal glycoalkaloids in tomato. Plant J. 2018, 94, 975–990. [Google Scholar] [CrossRef] [PubMed]
- Cárdenas, P.D.; Sonawane, P.D.; Pollier, J.; Bossche, R.V.; Dewangan, V.; Weithorn, E.; Tal, L.; Meir, S.; Rogachev, I.; Malitsky, S. GAME9 regulates the biosynthesis of steroidal alkaloids and upstream isoprenoids in the plant mevalonate pathway. Nat. Commun. 2016, 7, 10654. [Google Scholar] [CrossRef] [PubMed] [Green Version]
- Thagun, C.; Imanishi, S.; Kudo, T.; Nakabayashi, R.; Ohyama, K.; Mori, T.; Kawamoto, K.; Nakamura, Y.; Katayama, M.; Nonaka, S. Jasmonate-responsive ERF transcription factors regulate steroidal glycoalkaloid biosynthesis in tomato. Plant Cell Physiol. 2016, 57, 961–975. [Google Scholar] [CrossRef] [PubMed]
- Umemoto, N.; Nakayasu, M.; Ohyama, K.; Yotsu-Yamashita, M.; Mizutani, M.; Seki, H.; Saito, K.; Muranaka, T. Two cytochrome P450 monooxygenases catalyze early hydroxylation steps in the potato steroid glycoalkaloid biosynthetic pathway. Plant Physiol. 2016, 17, 2458–2467. [Google Scholar] [CrossRef] [PubMed]
- Stitz, M.; Baldwin, I.T.; Gaquerel, E. Diverting the flux of the JA pathway in Nicotiana attenuata compromises the plant’s defense metabolism and fitness in nature and glasshouse. PLoS ONE 2011, 6, e25925. [Google Scholar] [CrossRef] [PubMed]
- Stitz, M.; Gase, K.; Baldwin, I.T.; Gaquerel, E. Ectopic expression of AtJMT in Nicotiana attenuata: Creating a metabolic sink has tissue-specific consequences for the jasmonate metabolic network and silences downstream gene expression. Plant Physiol. 2011, 157, 341–354. [Google Scholar] [CrossRef] [PubMed]
- Qi, J.; Li, J.; Han, X.; Li, R.; Wu, J.; Yu, H.; Hu, L.; Xiao, Y.; Lu, J.; Lou, Y. Jasmonic acid carboxyl methyltransferase regulates development and herbivory-induced defense response in rice. J. Integr. Plant Biol. 2016, 58, 564–576. [Google Scholar] [CrossRef] [PubMed]
- Zhou, S.; Lou, Y.R.; Tzin, V.; Jander, G. Alteration of plant primary metabolism in response to insect herbivory. Plant Physiol. 2015, 169, 1488–1498. [Google Scholar] [CrossRef] [PubMed]
- Sanabria, N.; Goring, D.; Nürnberger, T.; Dubery, I. Self/nonself perception and recognition mechanisms in plants: A comparison of self-incompatibility and innate immunity. New Phytol. 2008, 178, 503–514. [Google Scholar] [CrossRef] [PubMed]
- Liu, Y.; Wu, H.; Chen, H.; Liu, Y.; He, J.; Kang, H.; Sun, Z.; Pan, G.; Wang, Q.; Hu, J.; et al. A gene cluster encoding lectin receptor kinases confers broad-spectrum and durable insect resistance in rice. Nat. Biotechnol. 2015, 33, 301–305. [Google Scholar] [CrossRef] [PubMed]
- Wang, Y.; Bouwmeester, K. L-type lectin receptor kinases: New forces in plant immunity. PLoS Path. 2017, 13, e1006433. [Google Scholar] [CrossRef] [PubMed]
- Couto, D.; Zipfel, C. Regulation of pattern recognition receptor signalling in plants. Nat. Rev. Immunol. 2016, 16, 537–552. [Google Scholar] [CrossRef] [PubMed]
- Su, Q.; Chen, G.; Mescher, M.C.; Peng, Z.; Xie, W.; Wang, S.; Wu, Q.; Liu, J.; Li, C.; Wang, W. Whitefly aggregation on tomato is mediated by feeding-induced changes in plant metabolites that influence the behaviour and performance of conspecifics. Funct. Ecol. 2018, 32, 1180–1193. [Google Scholar] [CrossRef]
- Van Houten, Y.; Glas, J.; Hoogerbrugge, H.; Rothe, J.; Bolckmans, K.; Simoni, S.; Van Arkel, J.; Alba, J.; Kant, M.; Sabelis, M. Herbivory-associated degradation of tomato trichomes and its impact on biological control of Aculops lycopersici. Exp. Appl. Acarol. 2013, 60, 127–138. [Google Scholar] [CrossRef] [PubMed]
- Bensoussan, N.; Santamaria, M.E.; Zhurov, V.; Diaz, I.; Grbic, M.; Grbic, V. Plant-herbivore interaction: Dissection of the cellular pattern of Tetranychus urticae feeding on the host plant. Front. Plant Sci. 2016, 7, 1105. [Google Scholar] [CrossRef] [PubMed]
- Chandran, D.; Inada, N.; Hather, G.; Kleindt, C.K.; Wildermuth, M.C. Laser microdissection of Arabidopsis cells at the powdery mildew infection site reveals site-specific processes and regulators. Proc. Natl. Acad. Sci. USA 2010, 107, 460–465. [Google Scholar] [CrossRef] [PubMed]
- Chandran, D.; Rickert, J.; Cherk, C.; Dotson, B.R.; Wildermuth, M.C. Host cell ploidy underlying the fungal feeding site is a determinant of powdery mildew growth and reproduction. Mol. Plant Microbe Interact. 2013, 26, 537–545. [Google Scholar] [CrossRef] [PubMed]
- Chen, L.Q.; Hou, B.H.; Lalonde, S.; Takanaga, H.; Hartung, M.L.; Qu, X.Q.; Guo, W.J.; Kim, J.G.; Underwood, W.; Chaudhuri, B.; et al. Sugar transporters for intercellular exchange and nutrition of pathogens. Nature 2010, 468, 527–532. [Google Scholar] [CrossRef] [PubMed]
- Lutay, N.; Ambite, I.; Hernandez, J.G.; Rydström, G.; Ragnarsdóttir, B.; Puthia, M.; Nadeem, A.; Zhang, J.; Storm, P.; Dobrindt, U. Bacterial control of host gene expression through RNA polymerase II. J. Clin. Investig. 2013, 123, 2366–2379. [Google Scholar] [CrossRef] [PubMed] [Green Version]
- Brosch, G.; Ransom, R.; Lechner, T.; Walton, J.D.; Loidl, P. Inhibition of maize histone deacetylases by HC toxin, the host-selective toxin of Cochliobolus carbonum. Plant Cell 1995, 7, 1941–1950. [Google Scholar] [CrossRef] [PubMed]
- Castillo-Gonzalez, C.; Liu, X.; Huang, C.; Zhao, C.; Ma, Z.; Hu, T.; Sun, F.; Zhou, Y.; Zhou, X.; Wang, X.J.; et al. Geminivirus-encoded TrAP suppressor inhibits the histone methyltransferase SUVH4/KYP to counter host defense. eLife 2015, 4, e06671. [Google Scholar] [CrossRef] [PubMed]
- Jonckheere, W.; Dermauw, W.; Zhurov, V.; Wybouw, N.; Van den Bulcke, J.; Villarroel, C.A.; Greenhalgh, R.; Grbić, M.; Schuurink, R.C.; Tirry, L. The salivary protein repertoire of the polyphagous spider mite Tetranychus urticae: A quest for effectors. Mol. Cell. Proteom. 2016, 15, 3594–3613. [Google Scholar] [CrossRef] [PubMed]
- Glas, J.J. Consequences of Russet Mite-Induced Tomato Defenses for Community Interactions; University of Amsterdam: Amsterdam, The Netherlands, 2014. [Google Scholar]
- Helle, W.; Sabelis, M.W. Spider Mites: Their Biology, Natural Enemies and Control; Elsevier: Amsterdam, The Netherlands, 1985; Volume 1A, p. 405. [Google Scholar]
- Lindquist, E.E.; Bruin, J.; Sabelis, M.W. Eriophyoid Mites: Their Biology, Natural Enemies and Control; Elsevier: Amsterdam, The Netherlands, 1996; Volume 6, p. 787. [Google Scholar]
- Verwoerd, T.C.; Dekker, B.; Hoekema, A. A small-scale procedure for the rapid isolation of plant RNAs. Nucleic Acids Res. 1989, 17, 2362. [Google Scholar] [CrossRef] [PubMed]
- Fernandez-Pozo, N.; Menda, N.; Edwards, J.D.; Saha, S.; Tecle, I.Y.; Strickler, S.R.; Bombarely, A.; Fisher-York, T.; Pujar, A.; Foerster, H. The Sol Genomics Network (SGN)—From genotype to phenotype to breeding. Nucleic Acids Res. 2014, 43, D1036–D1041. [Google Scholar] [CrossRef] [PubMed]
- Langmead, B.; Salzberg, S.L. Fast gapped-read alignment with Bowtie 2. Nat. Methods 2012, 9, 357–359. [Google Scholar] [CrossRef] [PubMed] [Green Version]
- Smyth, G.K. Linear models and empirical Bayes methods for assessing differential expression in microarray experiments. Stat. Appl. Genet. Mol. Biol. 2004, 3, 1–25. [Google Scholar] [CrossRef] [PubMed]
- Tibshirani, R.; Walther, G.; Hastie, T. Estimating the number of clusters in a data set via the gap statistic. J. R. Stat. Soc. Ser. B. (Stat. Method.) 2001, 63, 411–423. [Google Scholar] [CrossRef] [Green Version]
- Carlson, M.; Falcon, S.; Pages, H.; Li, N. A set of annotation maps describing the entire Gene Ontology. Bioconductor 2007. [Google Scholar] [CrossRef]
- Alexa, A.; Rahnenfuhrer, J. topGO: Enrichment analysis for Gene Ontology. R package version 2.28. Bioconductor 2016. [Google Scholar] [CrossRef]
- Väremo, L.; Nielsen, J.; Nookaew, I. Enriching the gene set analysis of genome-wide data by incorporating directionality of gene expression and combining statistical hypotheses and methods. Nucleic Acids Res. 2013, 41, 4378–4391. [Google Scholar] [CrossRef] [PubMed] [Green Version]
- Ramšak, Ž.; Baebler, Š.; Rotter, A.; Korbar, M.; Mozetič, I.; Usadel, B.; Gruden, K. GoMapMan: Integration, consolidation and visualization of plant gene annotations within the MapMan ontology. Nucleic Acids Res. 2013, 42, D1167–D1175. [Google Scholar] [CrossRef] [PubMed]
- Wickham, H. ggplot2: Elegant Graphics for Data Analysis; Springer: Berlin, Germany, 2016. [Google Scholar]
- Gadea, J.; Mayda, M.E.; Conejero, V.; Vera, P. Characterization of defense-related genes ectopically expressed in viroid-infected tomato plants. Mol. Plant Microbe Interact. 1996, 9, 409–415. [Google Scholar] [CrossRef] [PubMed]
- Chao, W.S.; Gu, Y.-Q.; Pautot, V.; Bray, E.A.; Walling, L.L. Leucine aminopeptidase RNAs, proteins, and activities increase in response to water deficit, salinity, and the wound signals systemin, methyl jasmonate, and abscisic acid. Plant Physiol. 1999, 120, 979–992. [Google Scholar] [CrossRef] [PubMed]


| Te | Tu+Te | Tu | Tu+Al | Al | |||||||||||||
|---|---|---|---|---|---|---|---|---|---|---|---|---|---|---|---|---|---|
| # | Locus Identifier | Annotation (ITAG 3.2) | JA | Log2FC | BH-adj p | Log2FC | BH-adj p | Log2FC | BH-adj p | Log2FC | BH-adj p | Log2FC | BH-adj p | ||||
| 1 | Solyc03g098760 | Kunitz-type trypsin inhibitor | YES | 2.85 | <0.0001 | 4.64 | <0.0001 | 4.70 | <0.0001 | 3.48 | <0.0001 | 2.16 | <0.0001 | ||||
| 2 | Solyc03g098720 | Kunitz-type trypsin inhibitor | YES | 2.04 | 0.0104 | 3.70 | <0.0001 | 3.69 | <0.0001 | 1.59 | 0.0025 | 1.13 | 0.0527 | ||||
| 3 | Solyc04g074770 | Unknown protein | YES | 1.64 | <0.0001 | 3.25 | <0.0001 | 3.26 | <0.0001 | 2.54 | <0.0001 | 1.22 | 0.0001 | ||||
| 4 | Solyc03g020060 | Proteinase inhibitor IId | 0.91 | 0.6783 | 3.02 | <0.0001 | 3.17 | <0.0001 | 1.75 | <0.0001 | 0.62 | 0.2031 | |||||
| 5 | Solyc10g078360 | Short-chain dehydrogenase/reductase | YES | 1.34 | <0.0001 | 2.40 | <0.0001 | 2.34 | <0.0001 | 1.60 | <0.0001 | 1.03 | <0.0001 | ||||
| 6 | Solyc01g095960 | Diacylglycerol O-acyltransferase | YES | 0.23 | 0.9994 | 1.90 | <0.0001 | 2.21 | <0.0001 | 1.16 | <0.0001 | 0.45 | 0.0687 | ||||
| 7 | Solyc03g098790 | Jasmonate-inducible protein 21 | YES | −0.26 | 0.9994 | 2.36 | 0.0001 | 2.18 | 0.0003 | 0.05 | 0.9582 | −0.71 | 0.3061 | ||||
| 8 | Solyc12g010020 | Leucine aminopeptidase A1 | YES | 1.58 | 0.0316 | 2.63 | <0.0001 | 2.17 | <0.0001 | 1.35 | 0.0024 | 0.70 | 0.1912 | ||||
| 9 | Solyc09g084480 | Proteinase inhibitor I | YES | 0.46 | 0.9994 | 2.23 | <0.0001 | 2.10 | <0.0001 | 0.50 | 0.2820 | −0.12 | 0.8912 | ||||
| 10 | Solyc00g187050 | Leucine aminopeptidase 2 | YES | 1.40 | 0.0595 | 2.47 | <0.0001 | 2.06 | <0.0001 | 1.15 | 0.0065 | 0.52 | 0.3414 | ||||
| 11 | Solyc09g089530 | Proteinase inhibitor I | YES | −0.12 | 0.9994 | 1.79 | 0.0019 | 1.78 | 0.0013 | −0.19 | 0.8004 | −0.63 | 0.3401 | ||||
| 12 | Solyc09g084470 | Proteinase inhibitor I | YES | −0.12 | 0.9994 | 1.73 | 0.0013 | 1.72 | 0.0009 | 0.22 | 0.7452 | −0.55 | 0.3860 | ||||
| 13 | Solyc01g006400 | Cysteine-rich extensin-like protein | YES | 0.39 | 0.9994 | 1.76 | <0.0001 | 1.65 | <0.0001 | 0.52 | 0.1883 | 0.01 | 0.9868 | ||||
| 14 | Solyc01g091170 | Arginase 2 | YES | 0.53 | 0.9994 | 1.60 | <0.0001 | 1.53 | <0.0001 | 0.72 | 0.0298 | 0.69 | 0.0563 | ||||
| 15 | Solyc10g084320 | Subtilase | YES | 0.48 | 0.9994 | 1.78 | <0.0001 | 1.50 | 0.0002 | 0.90 | 0.0146 | 0.40 | 0.4223 | ||||
| 16 | Solyc09g089505 | Proteinase inhibitor I | 0.03 | 0.9994 | 1.48 | 0.0009 | 1.49 | 0.0005 | 0.11 | 0.8607 | 0.02 | 0.9817 | |||||
| 17 | Solyc12g010025 | Leucine aminopeptidase | 1.18 | 0.7638 | 1.73 | 0.0055 | 1.48 | 0.0142 | 0.67 | 0.2778 | 0.42 | 0.6154 | |||||
| 18 | Solyc09g089500 | Proteinase inhibitor I | YES | 0.15 | 0.9994 | 1.69 | 0.0010 | 1.40 | 0.0049 | 0.18 | 0.7905 | −0.28 | 0.7205 | ||||
| 19 | Solyc02g071700 | GDSL esterase/lipase | YES | 0.51 | 0.9994 | 1.50 | 0.0061 | 1.32 | 0.0125 | 0.54 | 0.3295 | −0.17 | 0.8606 | ||||
| 20 | Solyc04g018110 | Calmodulin-like protein | 0.31 | 0.9994 | 1.14 | 0.0420 | 1.31 | 0.0121 | 0.52 | 0.3539 | 1.05 | 0.0439 | |||||
| 21 | Solyc01g087840 | Subtilase | 0.18 | 0.9994 | 1.33 | 0.0042 | 1.30 | 0.0035 | 0.76 | 0.0707 | 0.41 | 0.4702 | |||||
| 22 | Solyc01g105650 | 2-Oxoglutarate and Fe(II)-dependent oxygenase | 0.32 | 0.9994 | 1.12 | <0.0001 | 1.25 | <0.0001 | 0.71 | 0.0001 | 0.34 | 0.0970 | |||||
| 23 | Solyc06g083900 | R2R3 MYB transcription factor 13 | YES | 0.55 | 0.9994 | 1.54 | <0.0001 | 1.18 | 0.0010 | 0.51 | 0.1473 | 0.07 | 0.9186 | ||||
| 24 | Solyc01g006390 | Cysteine-rich extensin-like protein | YES | 0.40 | 0.9994 | 1.36 | <0.0001 | 1.16 | <0.0001 | 0.44 | 0.0801 | 0.01 | 0.9806 | ||||
| 25 | Solyc09g084490 | Proteinase inhibitor I | YES | 0.25 | 0.9994 | 1.01 | 0.0114 | 1.13 | 0.0027 | 0.23 | 0.6315 | −0.10 | 0.8940 | ||||
| 26 | Solyc08g076980 | Acetylornithine deacetylase | YES | 0.38 | 0.9994 | 0.87 | 0.0323 | 0.96 | 0.0125 | 0.15 | 0.7688 | −0.01 | 0.9929 | ||||
| 27 | Solyc01g006300 | Peroxidase CEVI1 | 0.32 | 0.9994 | 0.87 | 0.0014 | 0.88 | 0.0008 | 0.33 | 0.2103 | −0.07 | 0.8844 | |||||
| 28 | Solyc08g076970 | Acetylornithine deacetylase | YES | 0.37 | 0.9994 | 0.94 | 0.0210 | 0.83 | 0.0348 | 0.05 | 0.9272 | 0.02 | 0.9827 | ||||
| 29 | Solyc08g074630 | Polyphenol oxidase F | YES | 0.19 | 0.9994 | 1.00 | 0.0079 | 0.78 | 0.0357 | 0.10 | 0.8418 | −0.09 | 0.8950 | ||||
| 30 | Solyc07g007250 | Metallocarboxypeptidase inhibitor | YES | 0.22 | 0.9994 | 0.82 | 0.0110 | 0.77 | 0.0134 | −0.10 | 0.8219 | −0.25 | 0.5489 | ||||
| Te | Tu+Te | Tu | Tu+Al | Al | |||||||||||||
|---|---|---|---|---|---|---|---|---|---|---|---|---|---|---|---|---|---|
| # | Locus Identifier | Annotation (ITAG 3.2) | JA | Log2FC | BH-adj p | Log2FC | BH-adj p | Log2FC | BH-adj p | Log2FC | BH-adj p | Log2FC | BH-adj p | ||||
| 1 | Solyc10g083690 | Cytochrome P450 | 0.54 | 0.9994 | 3.49 | <0.0001 | 4.29 | <0.0001 | 5.30 | <0.0001 | 3.29 | <0.0001 | |||||
| 2 | Solyc01g080570 | Inosine/uridine-preferring nucleoside hydrolase | 0.72 | 0.9994 | 3.61 | <0.0001 | 4.22 | <0.0001 | 4.65 | <0.0001 | 3.29 | <0.0001 | |||||
| 3 | Solyc04g064880 | Pathogenesis-related protein | 0.17 | 0.9994 | 3.28 | <0.0001 | 3.92 | <0.0001 | 4.90 | <0.0001 | 2.58 | <0.0001 | |||||
| 4 | Solyc01g060020 | β-1,3-glucanase | 0.43 | 0.9994 | 2.90 | <0.0001 | 3.53 | <0.0001 | 4.13 | <0.0001 | 3.26 | <0.0001 | |||||
| 5 | Solyc05g050350 | Cyclic nucleotide-gated channel | 0.97 | 0.0558 | 2.89 | <0.0001 | 3.42 | <0.0001 | 3.98 | <0.0001 | 3.23 | <0.0001 | |||||
| 6 | Solyc12g049030 | Fatty acid desaturase | 0.33 | 0.9994 | 2.75 | 0.0006 | 3.36 | <0.0001 | 3.11 | <0.0001 | 2.98 | 0.0001 | |||||
| 7 | Solyc01g059965 | β-1,3-glucanase | 0.34 | 0.9994 | 2.82 | <0.0001 | 3.33 | <0.0001 | 3.81 | <0.0001 | 2.96 | <0.0001 | |||||
| 8 | Solyc03g044830 | Transducin/WD40 repeat-like protein | 0.28 | 0.9994 | 2.64 | <0.0001 | 3.23 | <0.0001 | 3.79 | <0.0001 | 2.57 | <0.0001 | |||||
| 9 | Solyc10g078230 | Cytochrome P450 | −0.01 | 0.9994 | 2.66 | <0.0001 | 3.17 | <0.0001 | 4.32 | <0.0001 | 3.16 | <0.0001 | |||||
| 10 | Solyc11g007980 | Cytochrome P450 | 0.13 | 0.9994 | 2.28 | <0.0001 | 2.99 | <0.0001 | 3.68 | <0.0001 | 2.32 | <0.0001 | |||||
| 11 | Solyc12g045020 | Cytochrome P450 | −0.09 | 0.9994 | 2.23 | <0.0001 | 2.90 | <0.0001 | 3.41 | <0.0001 | 2.17 | <0.0001 | |||||
| 12 | Solyc03g098740 | Kunitz-type trypsin inhibitor | 0.04 | 0.9994 | 2.27 | 0.0007 | 2.90 | <0.0001 | 4.47 | <0.0001 | 2.84 | <0.0001 | |||||
| 13 | Solyc06g061215 | Proteinase inhibitor II | 0.02 | 0.9994 | 2.08 | 0.0002 | 2.67 | <0.0001 | 3.43 | <0.0001 | 1.43 | 0.0077 | |||||
| 14 | Solyc08g066880 | 5’-methylthioadenosine/S-adenosyl-homocysteine nucleosidase, putative | YES | −0.11 | 0.9994 | 1.87 | 0.0146 | 2.66 | 0.0002 | 3.45 | <0.0001 | 0.93 | 0.2547 | ||||
| 15 | Solyc10g083700 | Cytochrome P450 | 0.30 | 0.9994 | 1.83 | 0.0022 | 2.58 | <0.0001 | 3.72 | <0.0001 | 2.03 | 0.0003 | |||||
| 16 | Solyc10g083290 | Extracellular invertase LIN6 | 0.36 | 0.9994 | 1.93 | <0.0001 | 2.55 | <0.0001 | 3.62 | <0.0001 | 3.29 | <0.0001 | |||||
| 17 | Solyc05g008220 | Unknown protein | 0.19 | 0.9994 | 2.00 | <0.0001 | 2.55 | <0.0001 | 3.58 | <0.0001 | 2.18 | <0.0001 | |||||
| 18 | Solyc02g093180 | N-hydroxycinnamoyl/benzoyl-transferase | YES | 0.67 | 0.9994 | 1.74 | 0.0041 | 2.37 | 0.0001 | 3.08 | <0.0001 | 2.12 | 0.0002 | ||||
| 19 | Solyc03g020050 | Proteinase inhibitor IIc | YES | 0.13 | 0.9994 | 1.51 | 0.0010 | 2.20 | <0.0001 | 2.15 | <0.0001 | 0.54 | 0.2953 | ||||
| 20 | Solyc08g067610 | ABC transporter | −0.13 | 0.9994 | 1.60 | 0.0004 | 2.18 | <0.0001 | 2.72 | <0.0001 | 1.34 | 0.0016 | |||||
| 21 | Solyc07g005100 | Chitinase | 0.26 | 0.9994 | 1.59 | 0.0001 | 2.11 | <0.0001 | 3.05 | <0.0001 | 2.34 | <0.0001 | |||||
| 22 | Solyc06g066590 | Unknown protein | 0.05 | 0.9994 | 1.49 | 0.0001 | 2.04 | <0.0001 | 2.83 | <0.0001 | 1.89 | <0.0001 | |||||
| 23 | Solyc03g098100 | NAD(P)H-dependent oxidoreductase | 0.38 | 0.9994 | 0.73 | 0.2857 | 1.53 | 0.0051 | 2.53 | <0.0001 | 1.51 | 0.0043 | |||||
| 24 | Solyc04g016470 | β-1,3-glucanase | −0.11 | 0.9994 | 0.71 | 0.1603 | 1.38 | 0.0014 | 1.56 | 0.0001 | 0.96 | 0.0269 | |||||
| 25 | Solyc11g007390 | Glycosyltransferase | −0.04 | 0.9994 | 0.72 | 0.0791 | 1.38 | 0.0002 | 1.98 | <0.0001 | 0.98 | 0.0061 | |||||
| 26 | Solyc03g020010 | Kunitz-type trypsin inhibitor | −0.17 | 0.9994 | 0.82 | 0.1136 | 1.34 | 0.0031 | 2.71 | <0.0001 | 1.60 | 0.0003 | |||||
| 27 | Solyc07g006500 | Trehalose-6-phosphate synthase | −0.16 | 0.9994 | 0.76 | 0.1422 | 1.34 | 0.0027 | 2.11 | <0.0001 | 0.96 | 0.0310 | |||||
| 28 | Solyc11g044910 | β-xylosidase | YES | −0.29 | 0.9994 | 0.54 | 0.3539 | 1.29 | 0.0040 | 1.95 | <0.0001 | 0.83 | 0.0698 | ||||
| 29 | Solyc08g078650 | Glycosyltransferase | −0.02 | 0.9994 | 0.67 | 0.0368 | 1.19 | 0.0001 | 1.73 | <0.0001 | 0.89 | 0.0019 | |||||
| 30 | Solyc07g045000 | Unknown protein | −0.11 | 0.9994 | 0.49 | 0.1225 | 1.05 | 0.0001 | 1.73 | <0.0001 | 0.72 | 0.0072 | |||||
| 31 | Solyc09g082230 | Ribosomal-protein-alanine N-acetyl-transferase | 0.22 | 0.9994 | 0.05 | 0.9354 | 0.61 | 0.0273 | 0.62 | 0.0128 | 0.64 | 0.0166 | |||||
© 2018 by the authors. Licensee MDPI, Basel, Switzerland. This article is an open access article distributed under the terms and conditions of the Creative Commons Attribution (CC BY) license (http://creativecommons.org/licenses/by/4.0/).
Share and Cite
Schimmel, B.C.J.; Alba, J.M.; Wybouw, N.; Glas, J.J.; Meijer, T.T.; Schuurink, R.C.; Kant, M.R. Distinct Signatures of Host Defense Suppression by Plant-Feeding Mites. Int. J. Mol. Sci. 2018, 19, 3265. https://0-doi-org.brum.beds.ac.uk/10.3390/ijms19103265
Schimmel BCJ, Alba JM, Wybouw N, Glas JJ, Meijer TT, Schuurink RC, Kant MR. Distinct Signatures of Host Defense Suppression by Plant-Feeding Mites. International Journal of Molecular Sciences. 2018; 19(10):3265. https://0-doi-org.brum.beds.ac.uk/10.3390/ijms19103265
Chicago/Turabian StyleSchimmel, Bernardus C. J., Juan M. Alba, Nicky Wybouw, Joris J. Glas, Tomas T. Meijer, Robert C. Schuurink, and Merijn R. Kant. 2018. "Distinct Signatures of Host Defense Suppression by Plant-Feeding Mites" International Journal of Molecular Sciences 19, no. 10: 3265. https://0-doi-org.brum.beds.ac.uk/10.3390/ijms19103265