Article

Identification and Expression Analyses of SBP-Box Genes Reveal Their Involvement in Abiotic Stress and Hormone Response in Tea Plant (Camellia sinensis)

College of Horticulture, Key Laboratory of Tea Science, Fujian Agriculture and Forestry University, Fuzhou 350002, China
*
Authors to whom correspondence should be addressed.
Int. J. Mol. Sci. 2018, 19(11), 3404; https://0-doi-org.brum.beds.ac.uk/10.3390/ijms19113404
Submission received: 14 September 2018 / Revised: 26 October 2018 / Accepted: 28 October 2018 / Published: 30 October 2018
(This article belongs to the Section Molecular Genetics and Genomics)

Abstract

:
The SQUAMOSA promoter binding protein (SBP)-box gene family is a plant-specific transcription factor family. This family plays a crucial role in plant growth and development. In this study, 20 SBP-box genes were identified in the tea plant genome and classified into six groups. The genes in each group shared similar exon-intron structures and motif positions. Expression pattern analyses in five different tissues demonstrated that expression in the buds and leaves was higher than that in other tissues. The cis-elements and expression patterns of the CsSBP genes suggested that the CsSBP genes play active roles in abiotic stress responses; these responses may depend on the abscisic acid (ABA), gibberellic acid (GA), and methyl jasmonate (MeJA) signaling pathways. Our work provides a comprehensive understanding of the CsSBP family and will aid in genetically improving tea plants.

1. Introduction

Tea is the oldest natural, nonalcoholic, caffeine-containing beverage and benefits human health due to its wealth of secondary metabolites, including catechins, theanine, polysaccharides, caffeine, and volatiles [1]. The tea plant, Camellia sinensis (L.) O. Kuntze, is an economically valuable perennial evergreen crop that has been widely cultivated in more than 100 countries [2]. In many areas, tea plants are continuously challenged by a wide variety of abiotic stresses, such as low temperature, drought, and salinity [3,4]. One or a combination of several environmental stresses can lead to substantial losses in tea production and reduced tea quality [5].
In higher plants, transcription factors (TFs) play critical roles in the regulation of physiological processes and adaptation to environmental stresses through various signal transduction pathways [6]. SQUAMOSA promoter binding protein (SBP)-box genes encode a plant-specific family of TFs that have a highly conserved SBP domain of approximately 76 amino acid residues. This conserved domain comprises three functionally important motifs, including two zinc-finger structures and a bipartite nuclear localization signal (NLS) that partially overlaps with the second zinc-finger [7]. Two SBP genes (AmSBP1 and AmSBP2) were first isolated from Antirrhinum majus based on their direct interaction with a region in the promoter of the floral meristem identity gene SQUAMOSA [8]. The AtSPL3 gene was the first SBP gene identified in Arabidopsis, where it plays a pivotal role in promoting flowering under long-day conditions. In addition, AtSPL3 recognizes a conserved element in the promoter region of APETALA1 (AP1), an ortholog of SQUAMOSA [9].
Previous studies have indicated that the SBP genes play essential role in diverse developmental processes in plants, such as sporogenesis [10], shoot and leaf development [11,12], flowering [13], fertility [14], fruit ripening [15], plant hormone signal transduction [16,17], and copper homeostasis [18]. Moreover, OsSPL14 and OsSPL16 were reported to promote grain quality and yield in rice [19,20]. Recent studies have shown that the SBP genes are involved in hormone signal transduction and responses to abiotic and biotic stress in many plant species. For example, VpSBP16 overexpression enhances salt and drought stress tolerance during seed germination, as well in seedlings and mature plants, by regulating the salt overly sensitive (SOS) and reactive oxygen species (ROS) signaling cascades in transgenic Arabidopsis [21]. Co-expression analysis revealed that the expression of AtSPL genes is significantly correlated with that of genes involved in the defense response pathway in response to various biotic and abiotic stresses [22]. Arabidopsis AtSPL14 has been found to be involved in the development of normal plant architecture and to play a role in sensitivity to the fungal toxin fumonisin B1 [23]. At5g43270 (AtSPL2) is modified in transgenic Arabidopsis overexpressing the AtJMT gene in response to the jasmonic acid (JA)-mediated resistance pathway [24]. The BpSPL9 gene in birch was reported to increase resistance to abiotic stress by increasing the accumulation of superoxide dismutase (SOD) and peroxidase (POD) in transgenic lines [25]. Additionally, the preliminary expression profiles of 31 maize SBP genes indicated that some were affected by several stress stimuli, including cold, drought, salinity, and abscisic acid (ABA) exposure [26].
With the rapid development of next-generation sequencing technologies, SBP-box gene families have been identified in many plant species to date, including 16 SBP genes in Arabidopsis [27], 19 in rice [28], 18 in grape [29], 12 in birch [25], 16 in jujube [30], 32 in moso bamboo [31], and 27 in apple [32]. However, no systematic identification or characterization of SBPs has been conducted in tea plants to find indications of candidate SBP genes involved in responses to stress and hormones. Tea plant genome sequences (vars. assamica and sinensis) [33,34] completed and released in 2017 and 2018 can provide an opportunity to identify all tea plant SBP genes. In the present study, we conducted the genome-wide identification of CsSBP genes in tea plants and analyzed their classification, structure, conserved motifs, cis-elements, and expression patterns in five different tissues. Furthermore, we investigated the expression profiles of CsSBP genes in response to several abiotic stresses and plant hormones to determine their potential functions in stress tolerance. These results will facilitate the further exploration of CsSBP gene functions and responses to environmental stress in tea plants.

2. Results

2.1. Identification of CsSBP Gene Family Members in Tea Plants

In this study, 20 SBP-box genes were identified in the tea plant genome. We named the 20 SBP-box genes CsSBP1 to CsSBP20 based on their phylogenetic distance. The details of the CsSBP gene family in tea plant are given in Table 1 and Table S1. The lengths of the genomic sequences ranged from 373 bp (CsSBP16) to 9742 bp (CsSBP13), and the average was 3920 bp. The coding sequences (CDS) of the CsSBP genes varied from 338 bp (CsSBP16) to 3399 bp (CsSBP16) and had predicted proteins of 110–1132 amino acids, which is consistent with the length of AtSPL genes from Arabidopsis widely ranging from 396 (AtSPL3) to 3108 bp (AtSPL14) with the deduced proteins of 131 to 1035 amino acids. The molecular weight (MW) of CsSBP proteins ranged from 11.60 (CsSBP12) to 124.64 (CsSBP8) kDa, the isoelectric point (pI) ranged from 5.60 (CsSBP13) to 9.14 (CsSBP19), indicating that 13 CsSBP proteins were basic proteins with pI value more than 7.0, and the remaining seven proteins were acidic proteins. The percentage identity matrix of CsSBP proteins based on the sequence alignment is listed in Figure 1 and Table S2. CsSBP10 and CsSBP11, CsSBP8 and CsSB9, CsSBP6, and CsSBP7 share the highest identity 70%, 68%, and 56%, respectively. Additionally, most CsSBP proteins have low identity to each other, suggesting the diversity of this family during evolution.

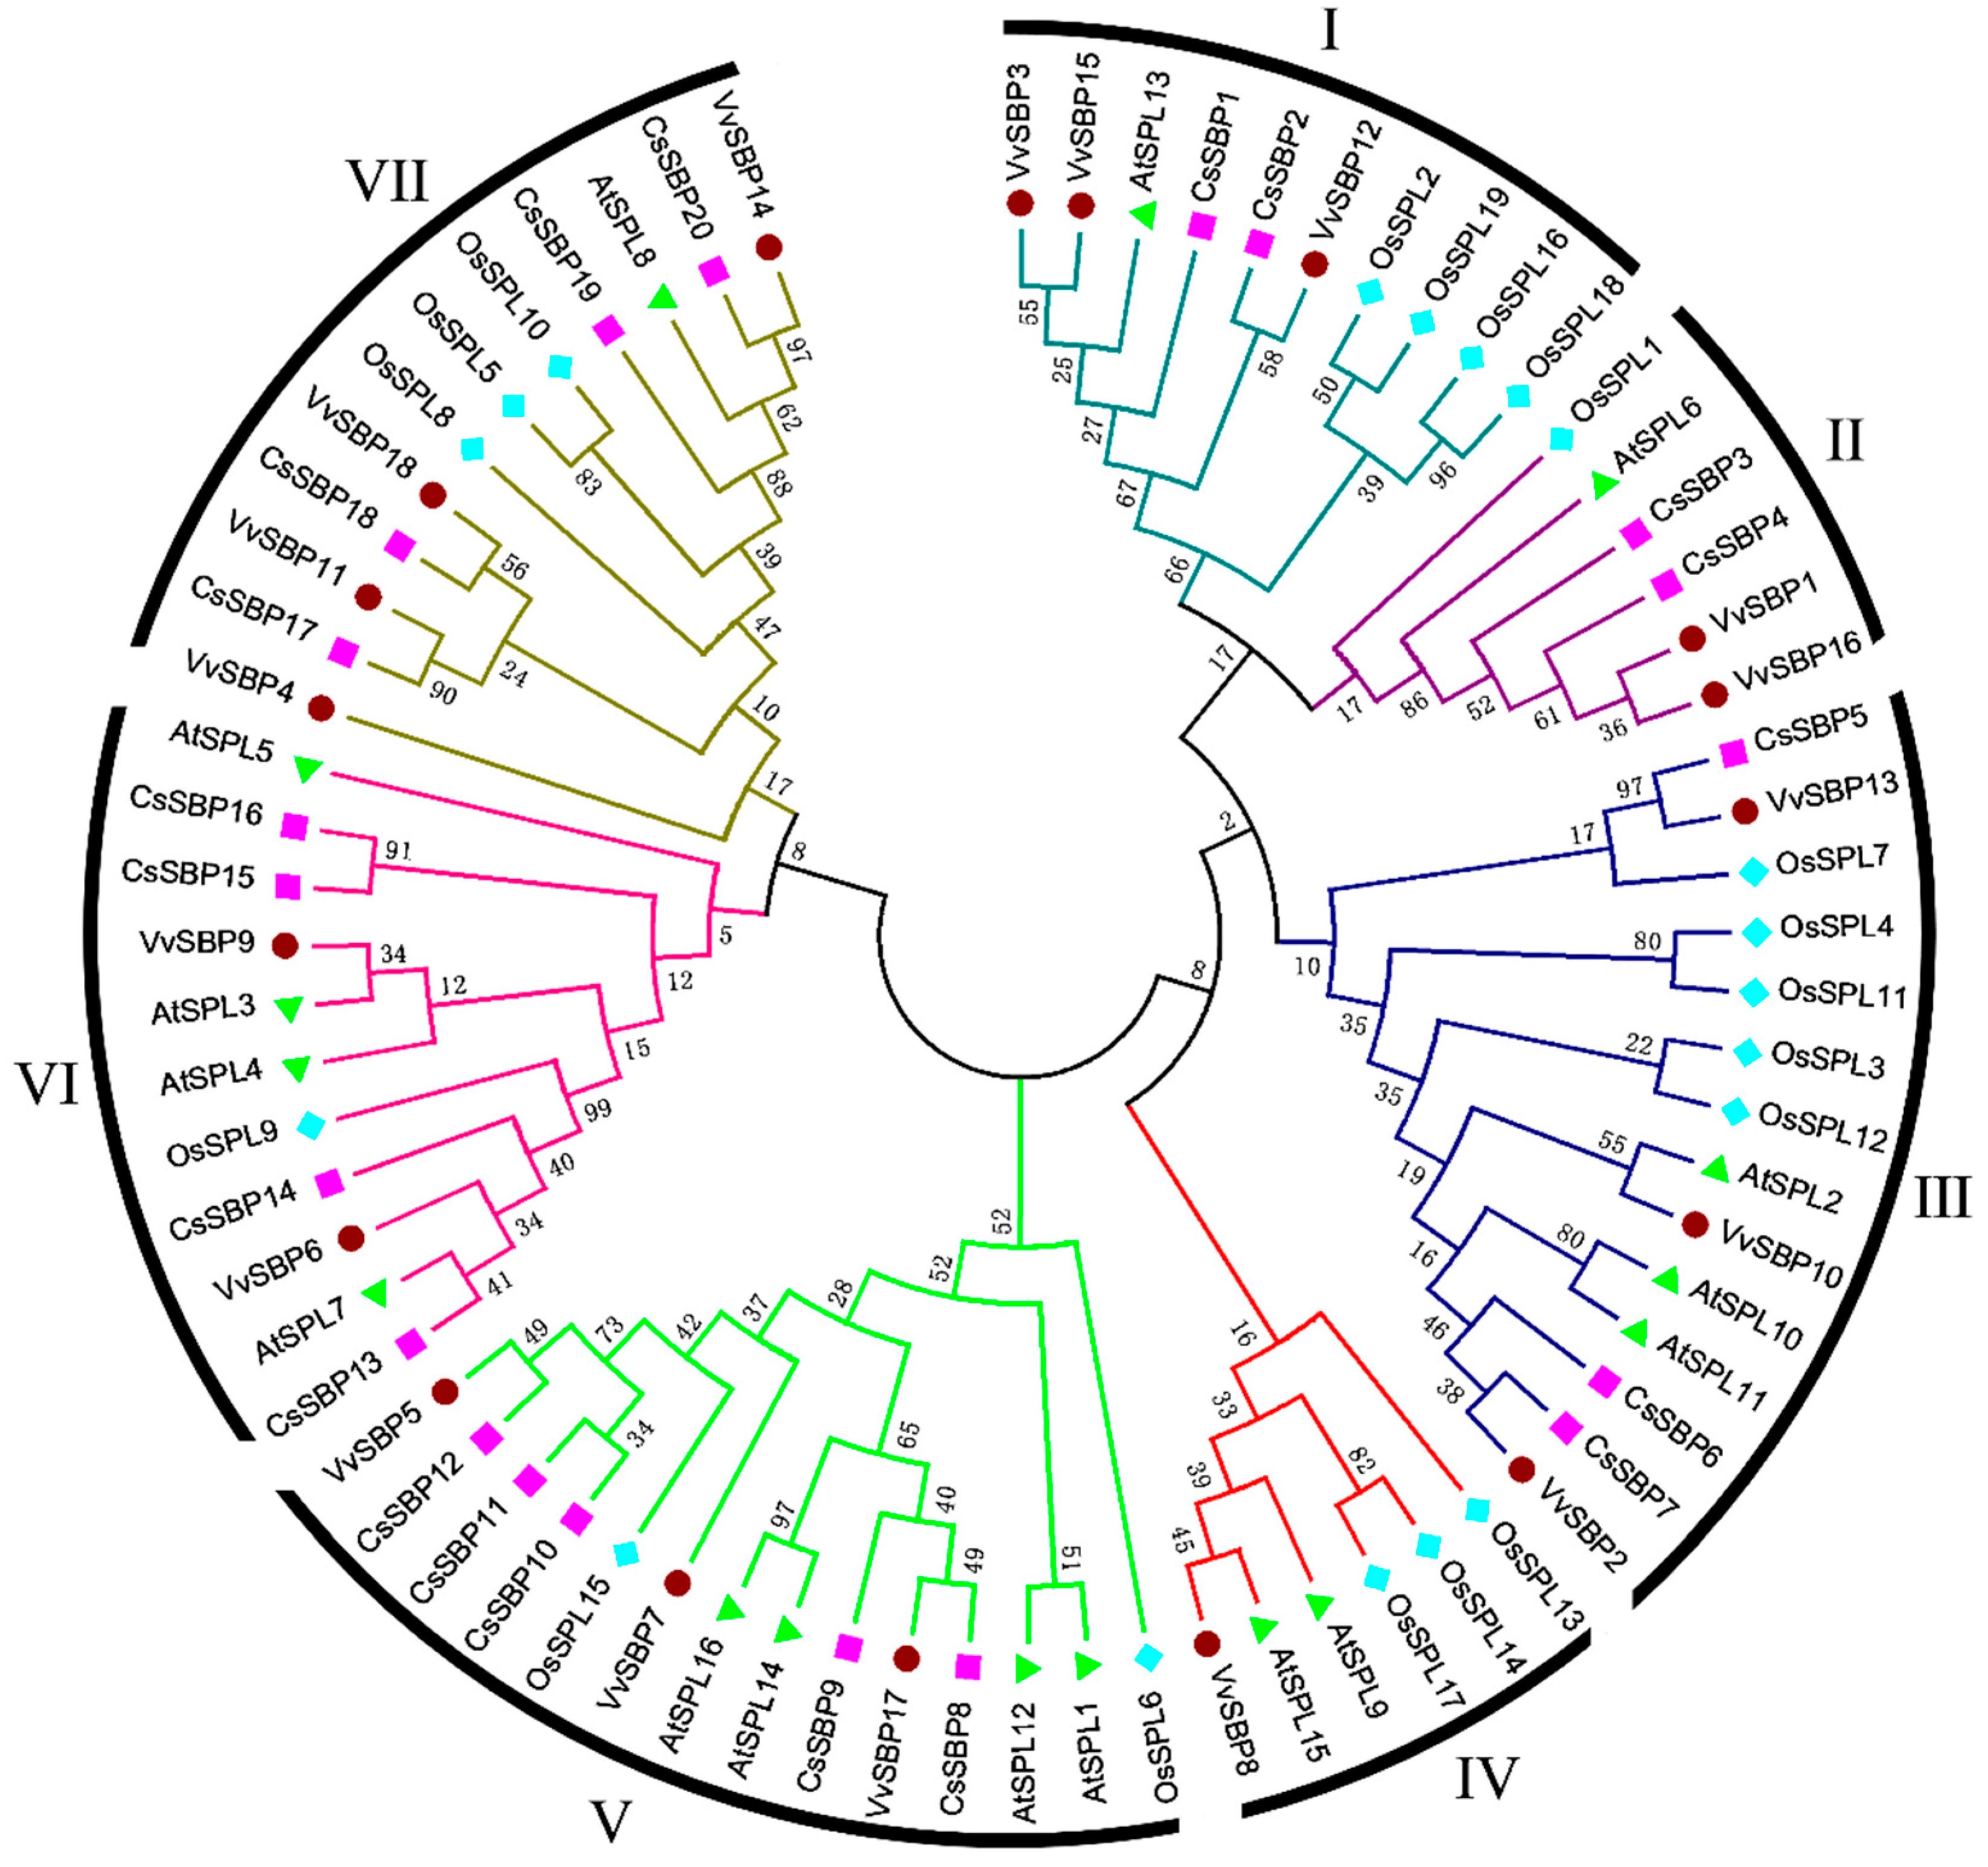
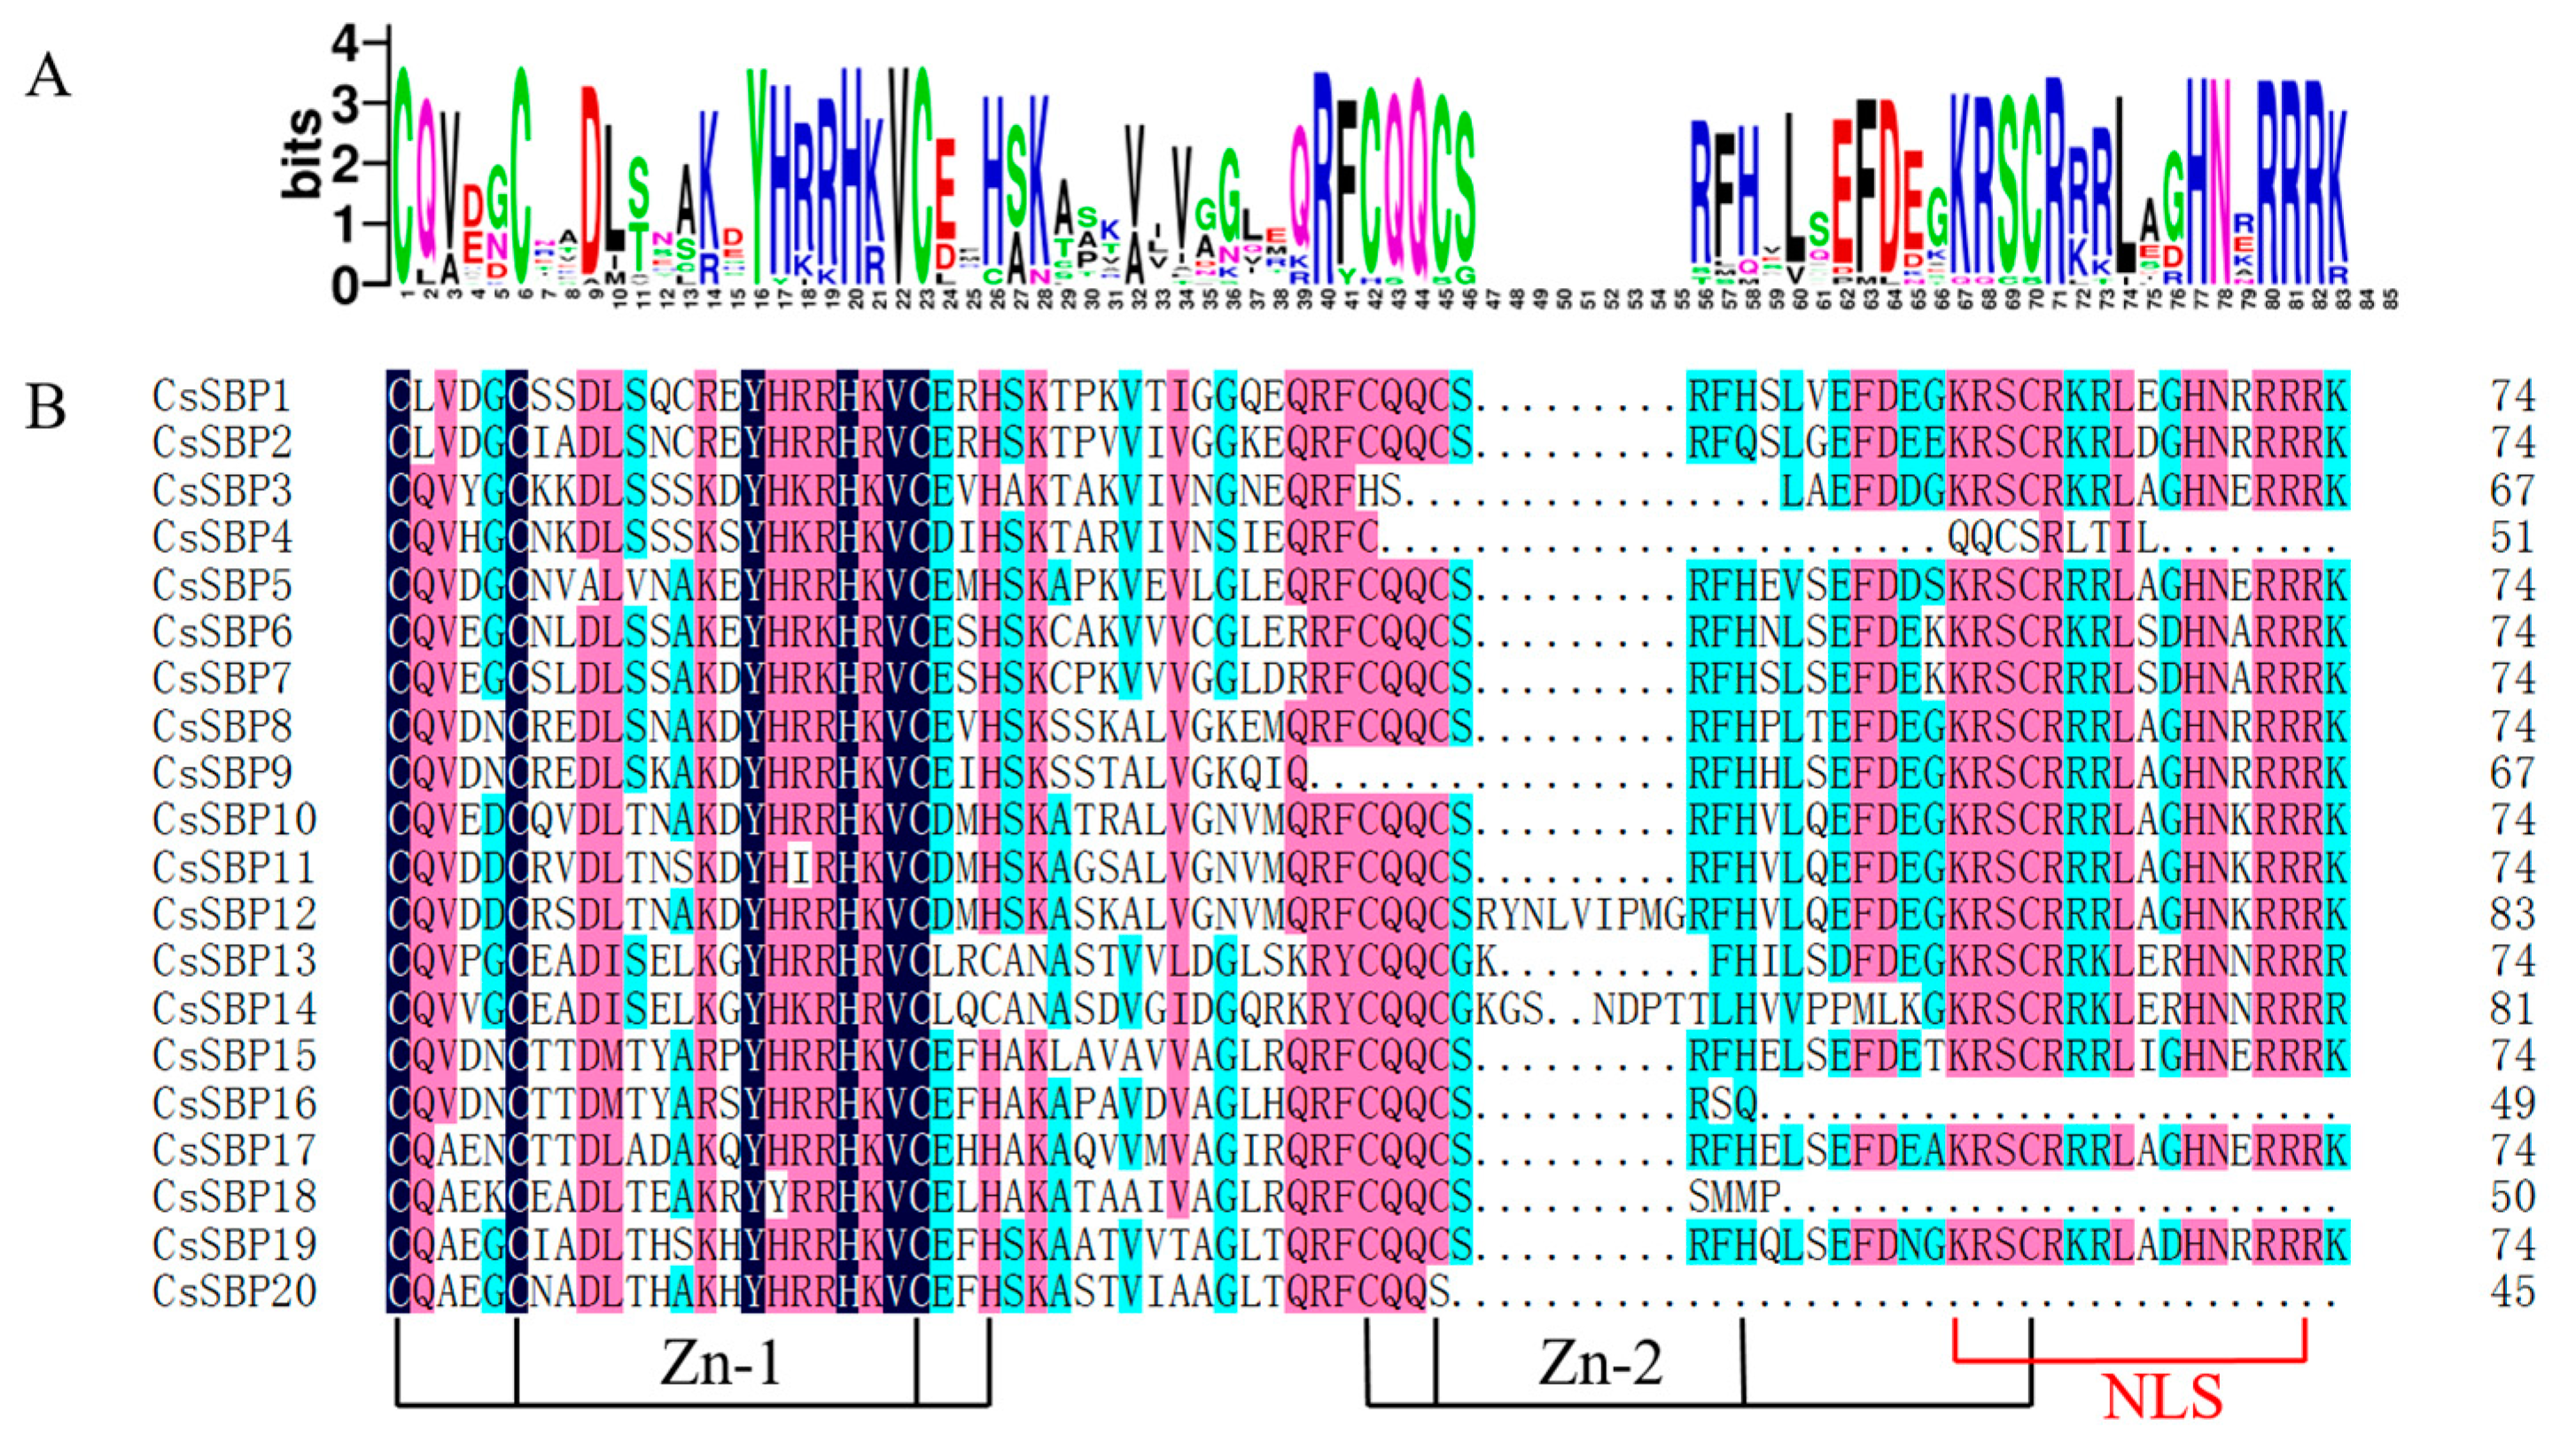
2.2. Sequence Alignments and Phylogenetic Analysis of SBP Domains

To determine the SBP domains in each CsSBP protein, we performed sequence alignment using the DNAMAN 7.0 program (Figure 2). All SBP domains from the CsSBP proteins contain two zinc-finger structures (C3H, C2HC) and a bipartite nuclear localization signal, with the exceptions of CsSBP3, CsSBP4, CsSBP9, CsSBP16, CsSBP18, and CsSBP20, which lack the C2HC or NLS (Figure 2B). Analysis by NLS Mapper online software found that this CsSBP proteins did not have other possible high-confidence NLSs. Furthermore, we predicted the subcellular localization of these proteins and found that these proteins were also most likely to be located in the nucleus (Table S3). Interestingly, most SBP domains were consecutive and lacked insertions; the exceptions were CsSBP12 and CsSBP14, whose SBP domains were interrupted by a short sequence. Furthermore, the sequence logos of these SBP domain sequences showed that some positions were highly conserved (Figure 2A); these included YHRRHKVC, CQQC, KRSCR, and RRR sequences.
To investigate the molecular evolution of and phylogenetic relationships among SBP genes in plants, 73 conserved SBP domain sequences from four species were used to construct a phylogenetic tree (Table S4); the tree included 19 sequences from a monocotyledonous angiosperm (rice) and 54 sequences from dicotyledonous angiosperms (Arabidopsis, grape and tea plant). As shown in Figure 3, all SBP-box genes were able to be categorized into seven groups (I–VII). Each group, except for group IV, contained at least one SBP member from each of the four species; group IV lacked SBP members from tea plant. Groups III and V composed the largest clade, which included fourteen members and almost 19% of all SBP genes, while groups II and IV had the smallest clade, which contained only six members. Additionally, all of the OsSPL genes in each group were very dissimilar compared to those of other dicotyledons, and most of the CsSBP genes were closer to those of grape.

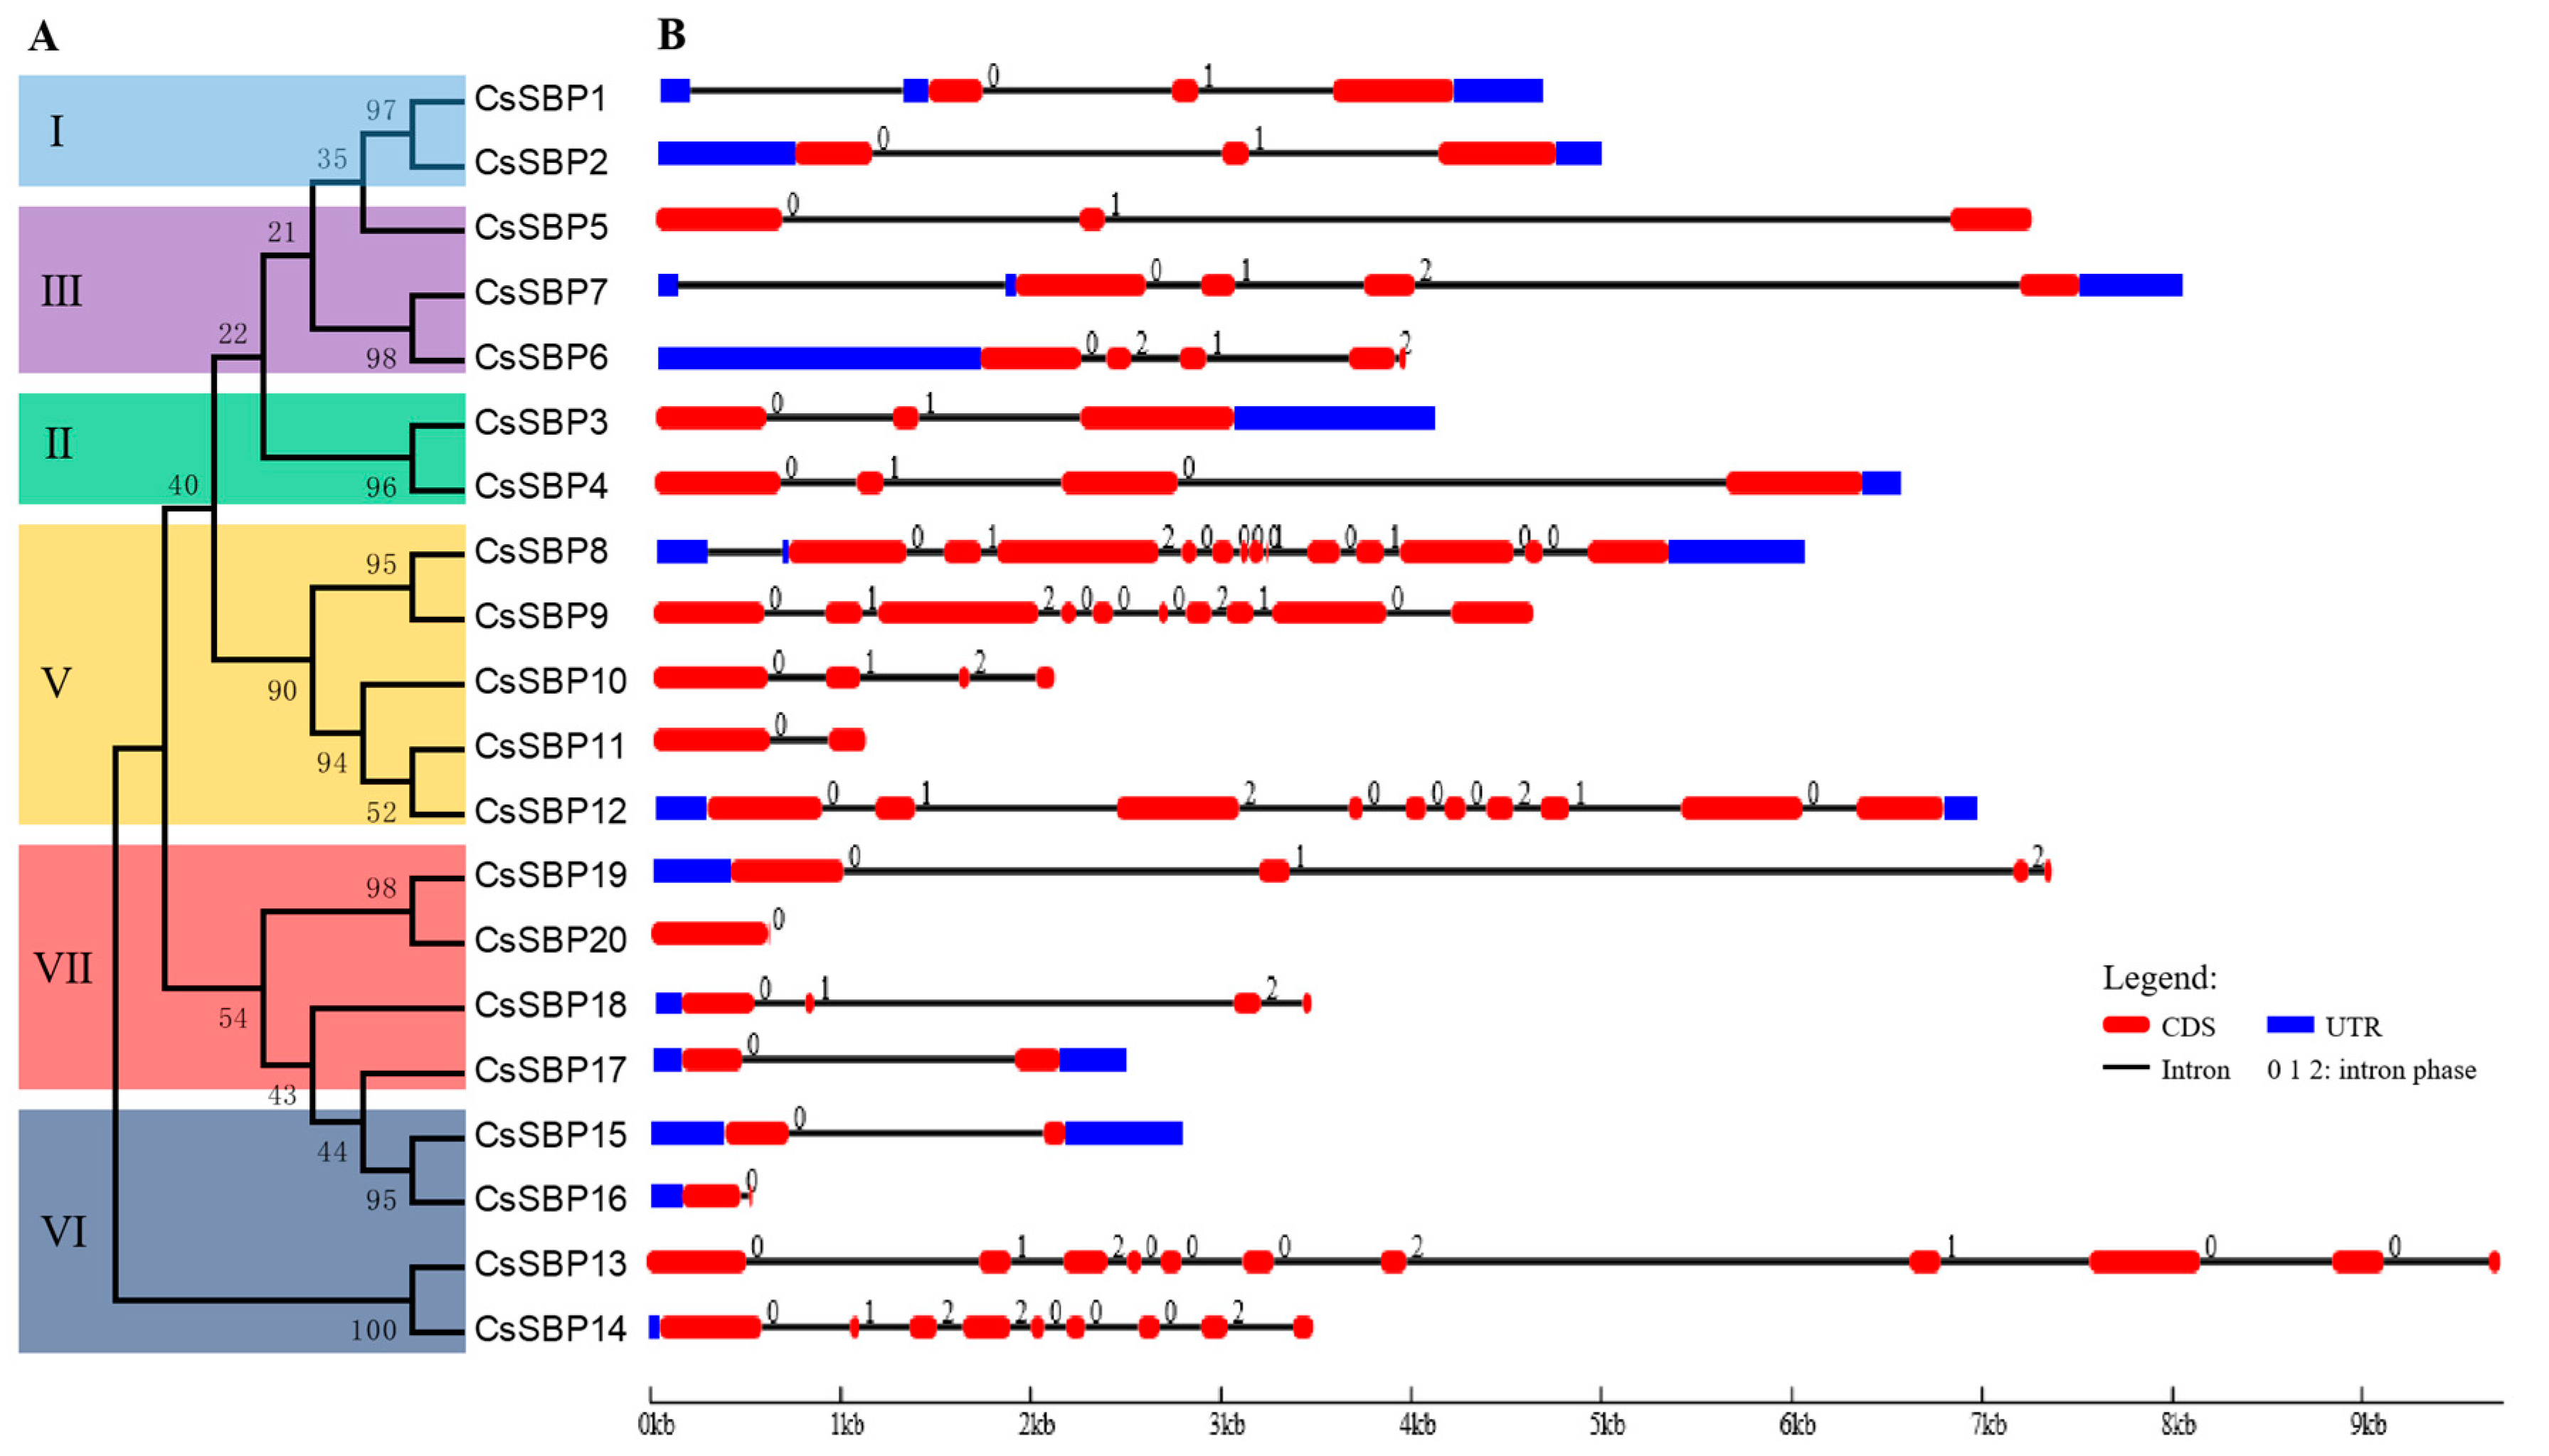
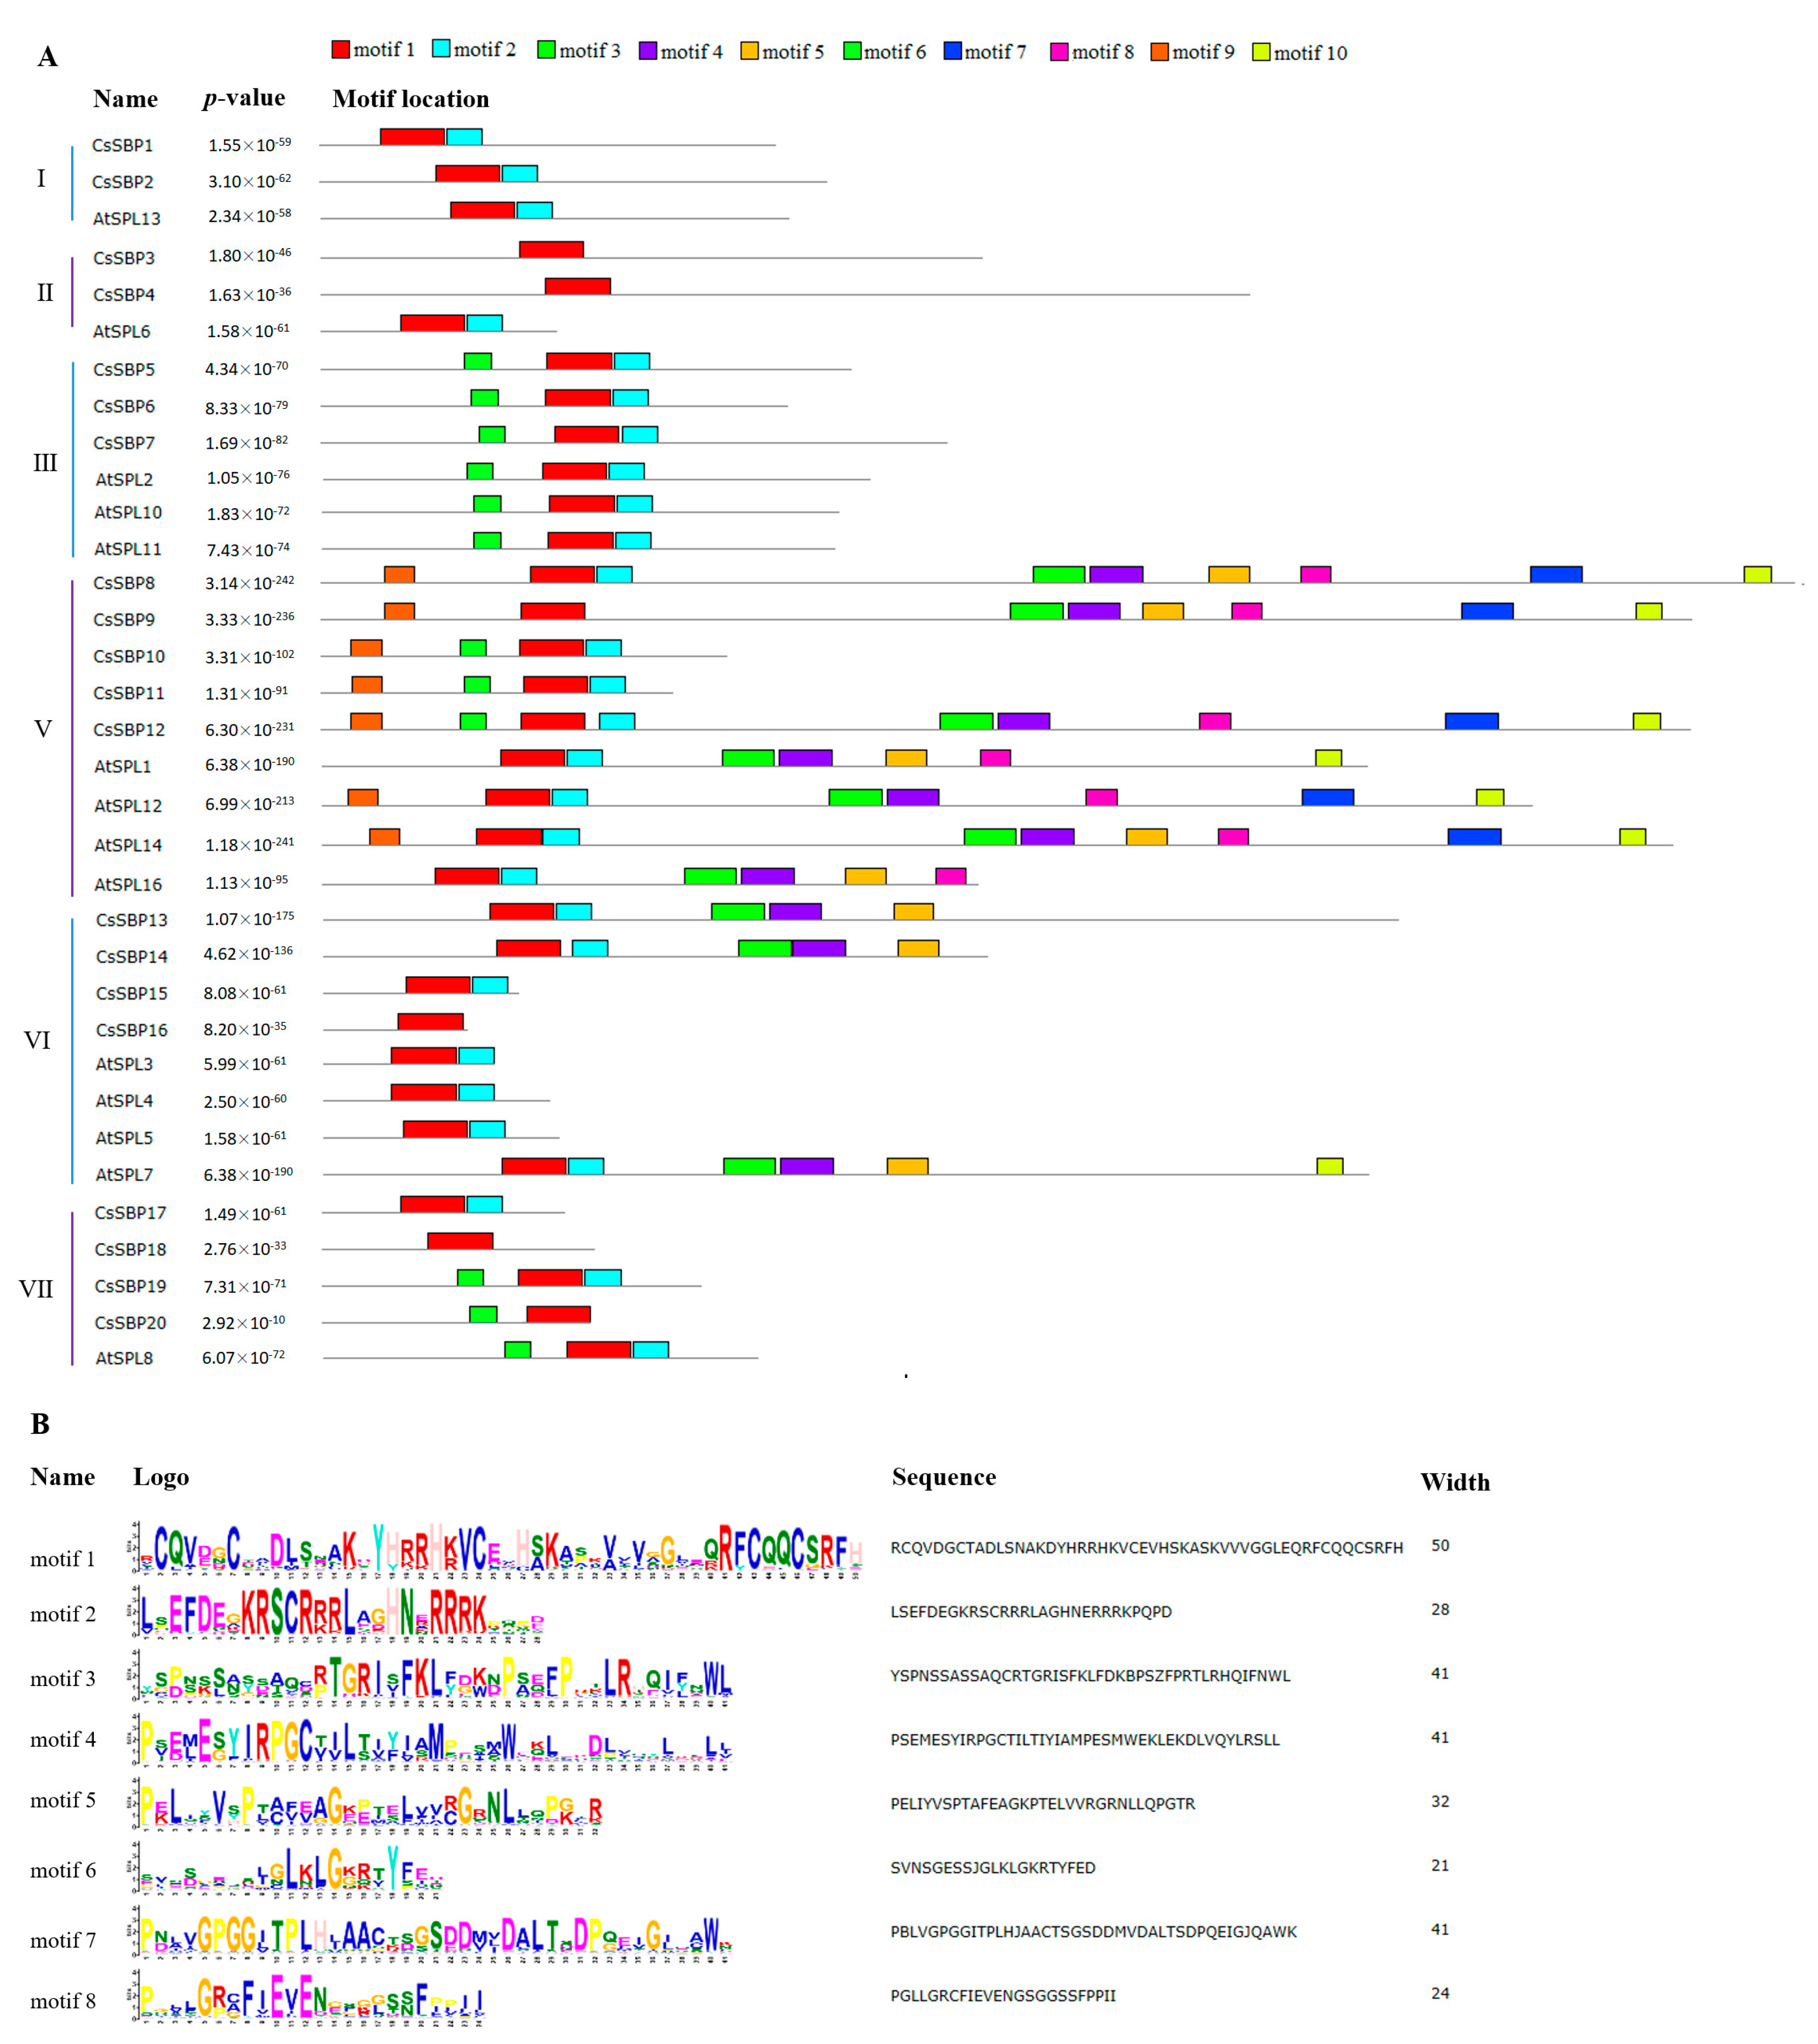
2.3. Structural Organization and Conserved Motif Analysis of CsSBP Genes

To assess the structural diversity among the six groups, we constructed a phylogenetic tree using the predicted full-length CsSBP protein sequences (Figure 4A). The exon-intron structures of all 20 CsSBP genes were generated based on their corresponding coding and genome sequences (Figure 4B). The number of exons in the CsSBP genes varied from one (CsSBP20) to twelve (CsSBP8), with an average of 4.85 introns per CsSBP gene. Additionally, many CsSBP genes had two to four exons: 4 out of 20 had two exons, 4 had three exons, and 6 had four exons. In general, most CsSBP genes had exon structures similar to those of the common group, with some exceptions, such as CsSBP10 and CsSBP11 in group V (Figure 4B). For example, the CsSBP genes within group I had three exons, whereas those within group III contained more than three exons. It is notable that the CDS lengths and gene structures of some CsSBP gene pairs were quite similar, including CsSBP1 and CsSBP2, CsSBP3 and CsSBP4, CsSBP9 and CsSBP12, CsSBP13 and CsSBP14, CsSBP18 and CsSBP19 (Figure 4B), suggesting that these gene pairs may be tandem duplicated gene pairs within the tea plant CsSBP genes. However, due to the lack of chromosomal localization information in the tea plant genome, no further analysis can be performed.
We further searched for the presence of conserved motifs in the 20 CsSBP proteins using MEME software compared to Arabidopsis, and ten most conserved motif were presented and designated motif 1 to motif 10 (Figure 5A). The details of the conserved motifs and their lengths are shown in Figure 5B. Motif 1 and motif 2 represent the SBP domains and were present in all SBP sequences; however, six SBP domains (CsSBP3, CsSBP4, CsSBP9, CsSBP16, CsSBP18 and CsSBP20) were incomplete (Figure 5A). Furthermore, motif 8 consisted of an ankyrin-repeat-containing domain and was found exclusively in three CsSBP proteins (CsSBP8, CsSBP9 and CsSBP12) and four AtSPL proteins (AtSPL1, AtSPL12, AtSPL14 and AtSPL16) from group V, indicating that these CsSBP proteins may interact with other proteins in their functions in plant cells [35]. Members of the same group usually had similar motif compositions, and some motifs were specifically present in one or more groups. For example, the members of group I only contained motifs 1 and 2, and the locations of the motifs were similar. Motifs 7, 8 and 9 were unique to group V. Four motifs (motifs 3, 4, 5 and 10) were exclusively present in groups V and VI (Figure 5A).

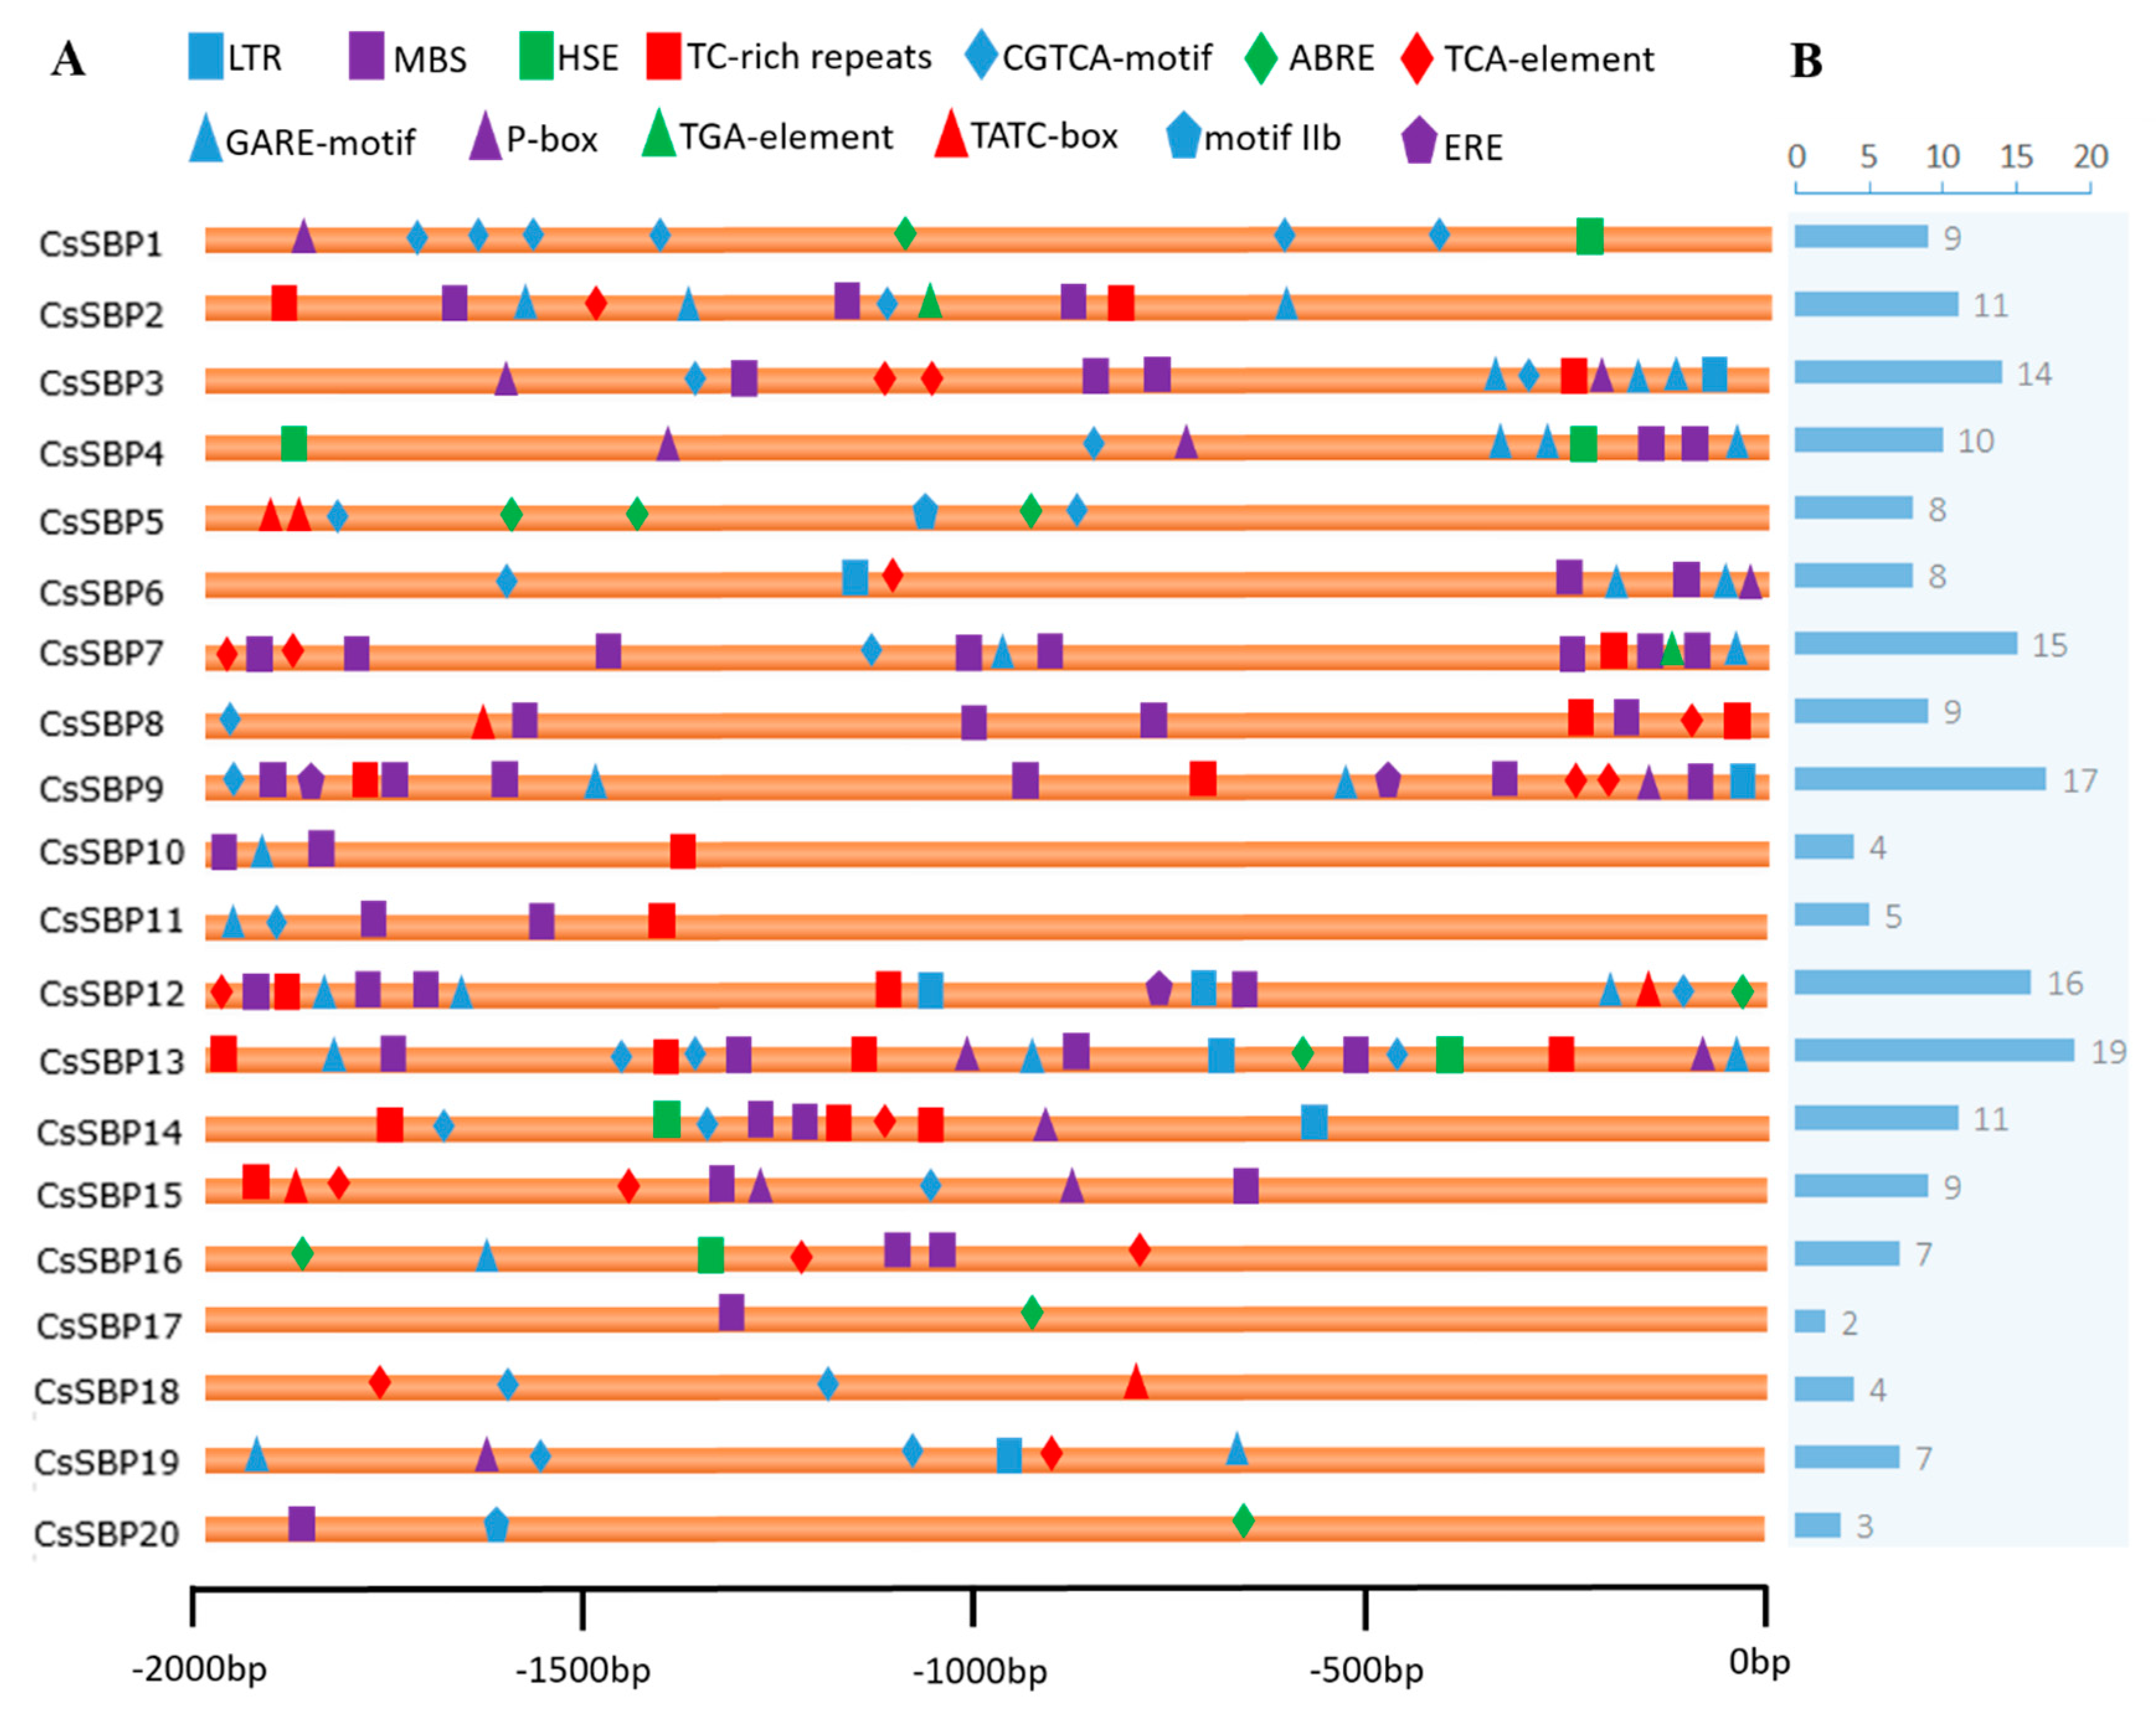
2.4. cis-Element Analysis of CsSBP Genes

The analysis of cis-elements in promoter sequences is extremely important for understanding gene regulation and function. Thirteen types of stress- and hormone-related cis-elements were identified in the 2000 bp promoter sequences of the CsSBP genes (Figure 6A). These cis-elements included low-temperature-responsive element (LTR), MYB binding sites involved in drought inducibility (MBS), heat-stress-responsive element (HSE), defense- and stress-responsive elements (TC-rich repeats), MeJA-responsive element (CGTCA-motif), abscisic acid-responsive element (ABRE and motif IIb), salicylic-acid-responsive element (TCA-element), gibberellin-responsive element (GARE motif, P-box, and TATC-box), auxin-responsive element (TGA-element), and ethylene-responsive element (ERE) (Figure 6A). All CsSBP promoter sequences possessed stress- and hormone-associated cis-elements, but the number varied from 2 (CsSBP17) to 19 (CsSBP13) (Figure 6B). In total, 48 MBS were found in 16 (80%) CsSBP promoter sequences, composing the largest proportion of all elements and suggesting a potential role in drought inducibility. In addition, low-temperature-, heat-, ABA-, MeJA-, GA-, and SA-responsive elements were abundant in the promoter sequences of the CsSBP genes, suggesting that these genes may be involved in the transcriptional control of abiotic stress and hormone responses.

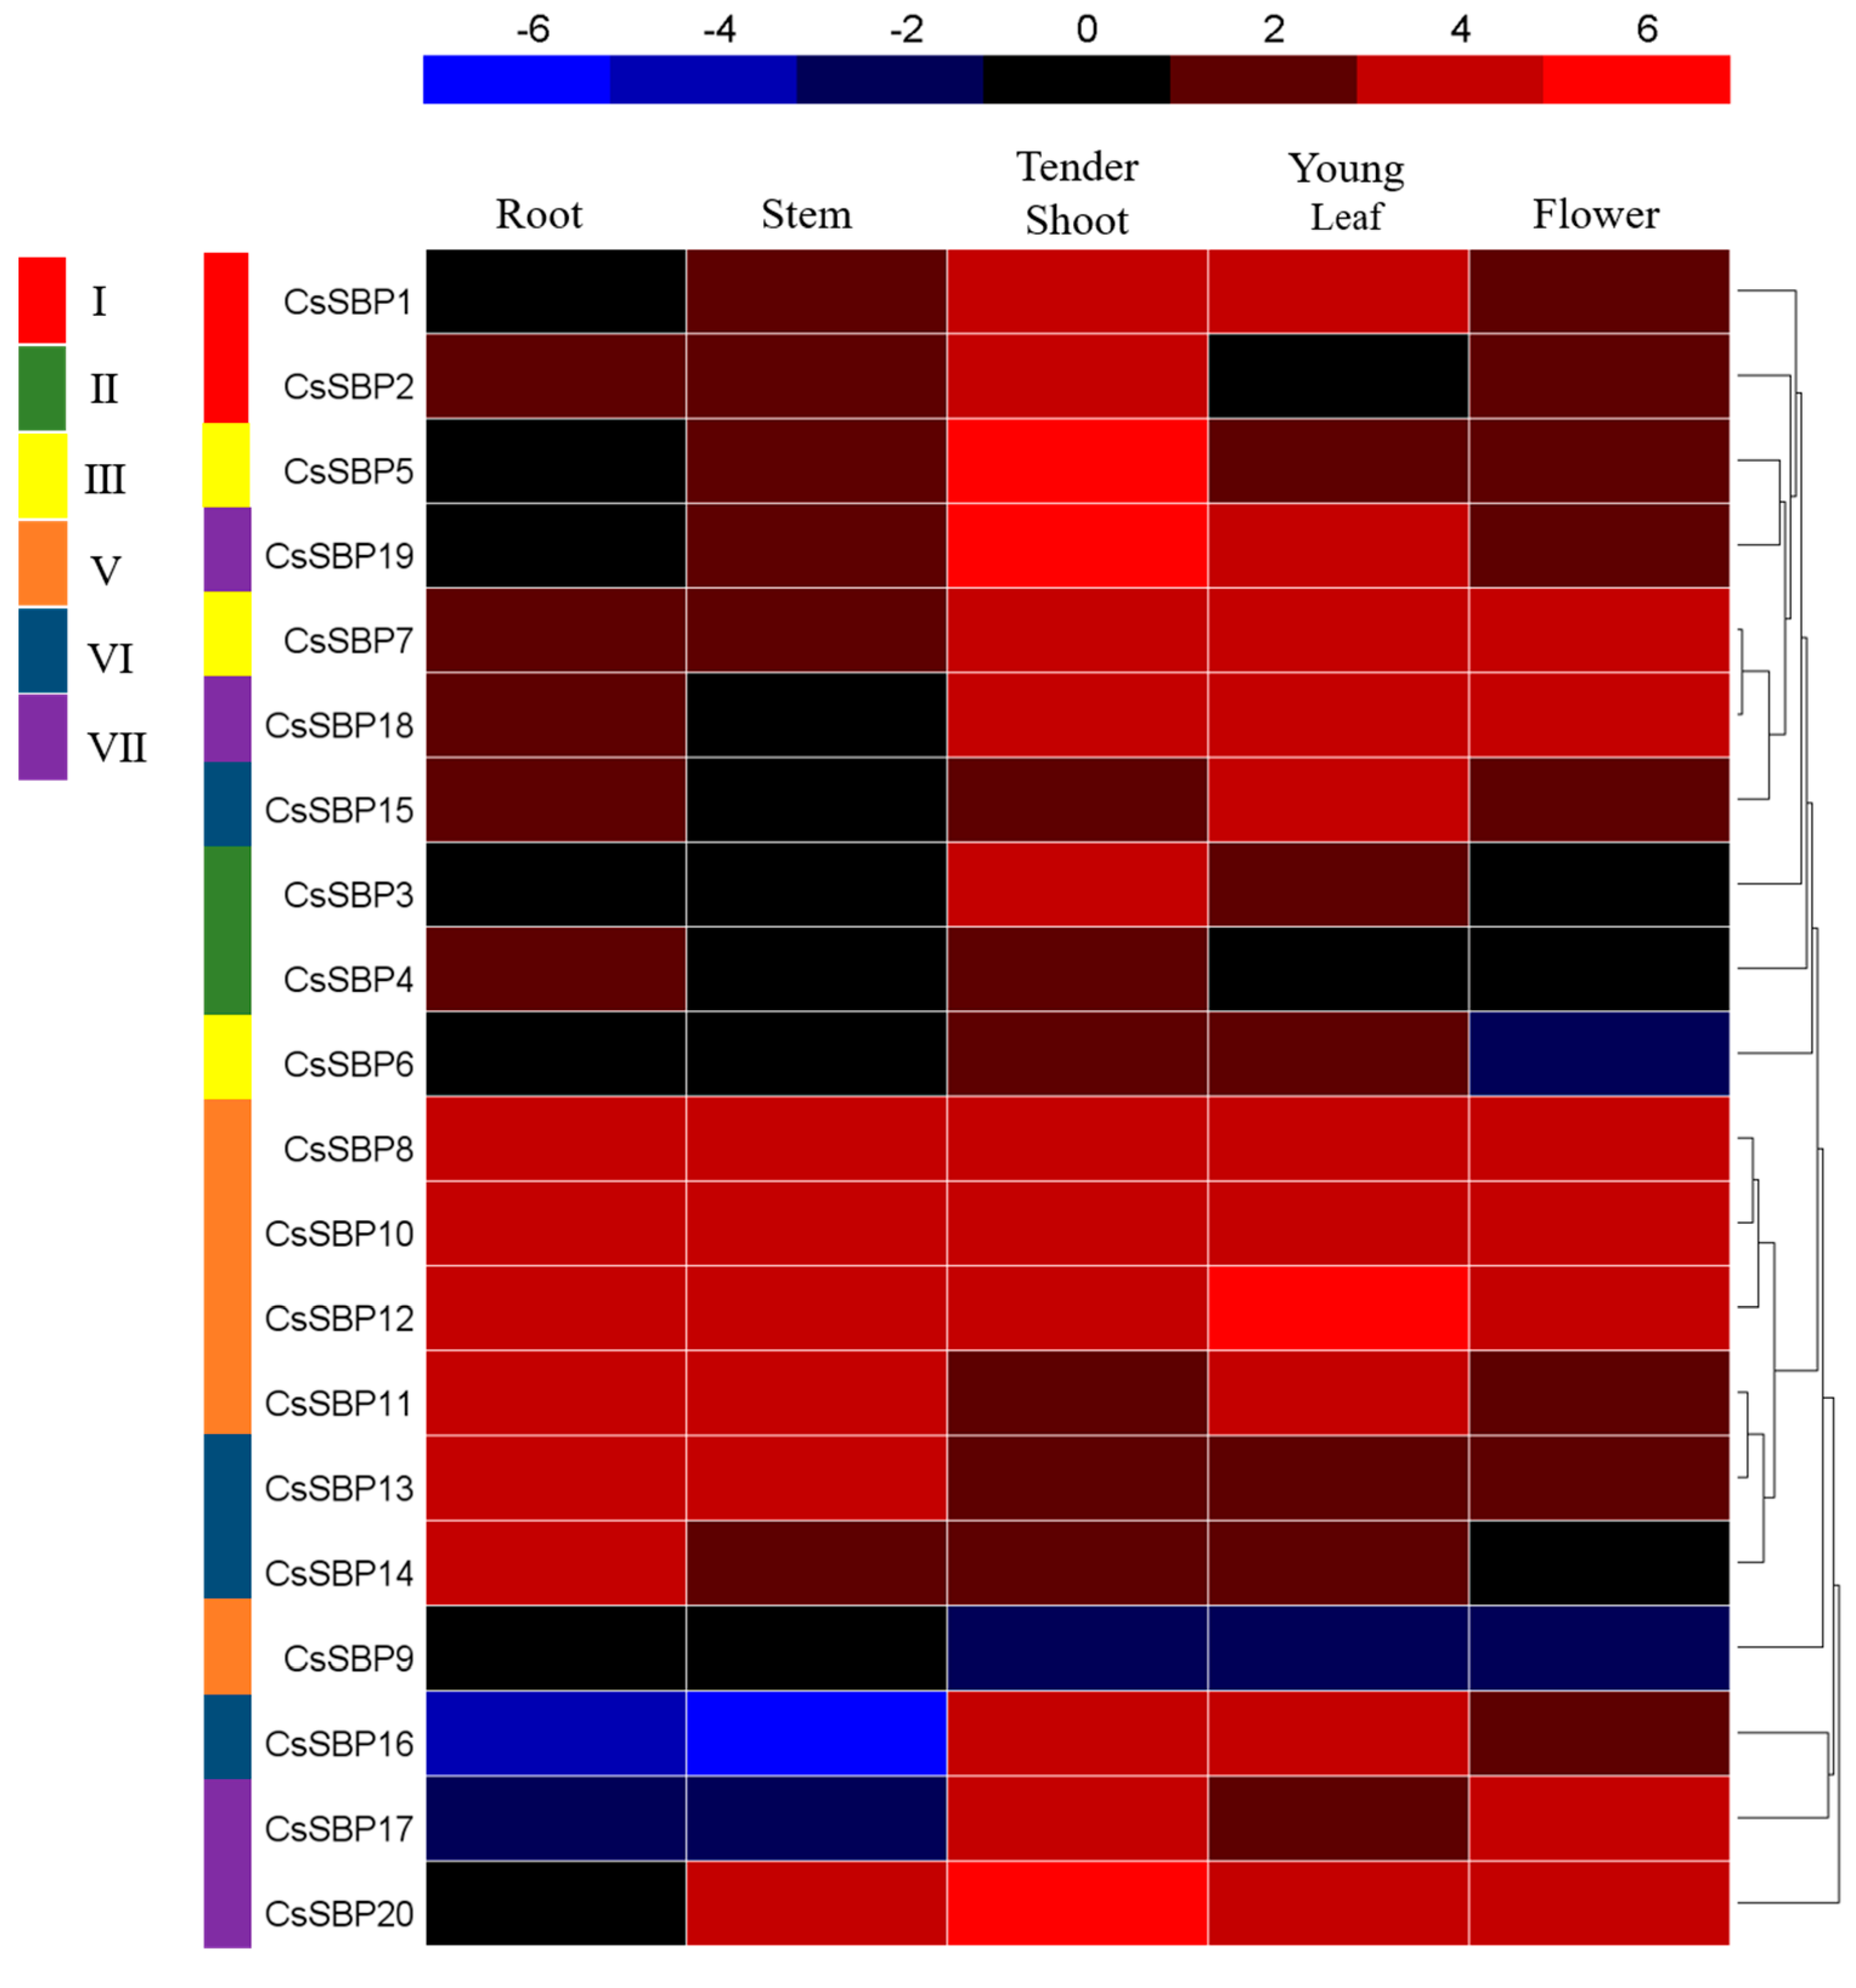
2.5. Expression Patterns of CsSBP Genes in Different Tissues Based on Transcriptome Data

The transcriptomes of five tea plant tissues are available online and were downloaded to investigate the expression patterns of CsSBP genes (Figure 7). The fragments per kilobase million (FPKM) values of the CsSBP genes in different tissues are listed in Table S5. All CsSBP genes were expressed in the five tested tissues at diverse expression levels; the exception was CsSBP16 in the stem. The transcripts of CsSBP7, CsSBP8, CsSBP10, CsSBP11, CsSBP12, and CsSBP13 were highly expressed (value > 2) in these five tissues, suggesting that CsSBP genes play essential roles in plant growth and development. Several CsSBP genes exhibited a degree of tissue specificity. For instance, CsSBP16 and CsSBP17 were only highly expressed (value > 2) in tender shoots, young leaves, and flowers, while the transcripts of CsSBP3 and CsSBP6 largely accumulated in tender shoots and young leave rather than in other tissues. In general, the expression of CsSBP genes was highest in the tender shoots, followed by the young leaves, flowers, roots, and stems. This expression pattern implied that CsSBP genes might have important functions in the buds and leaves.

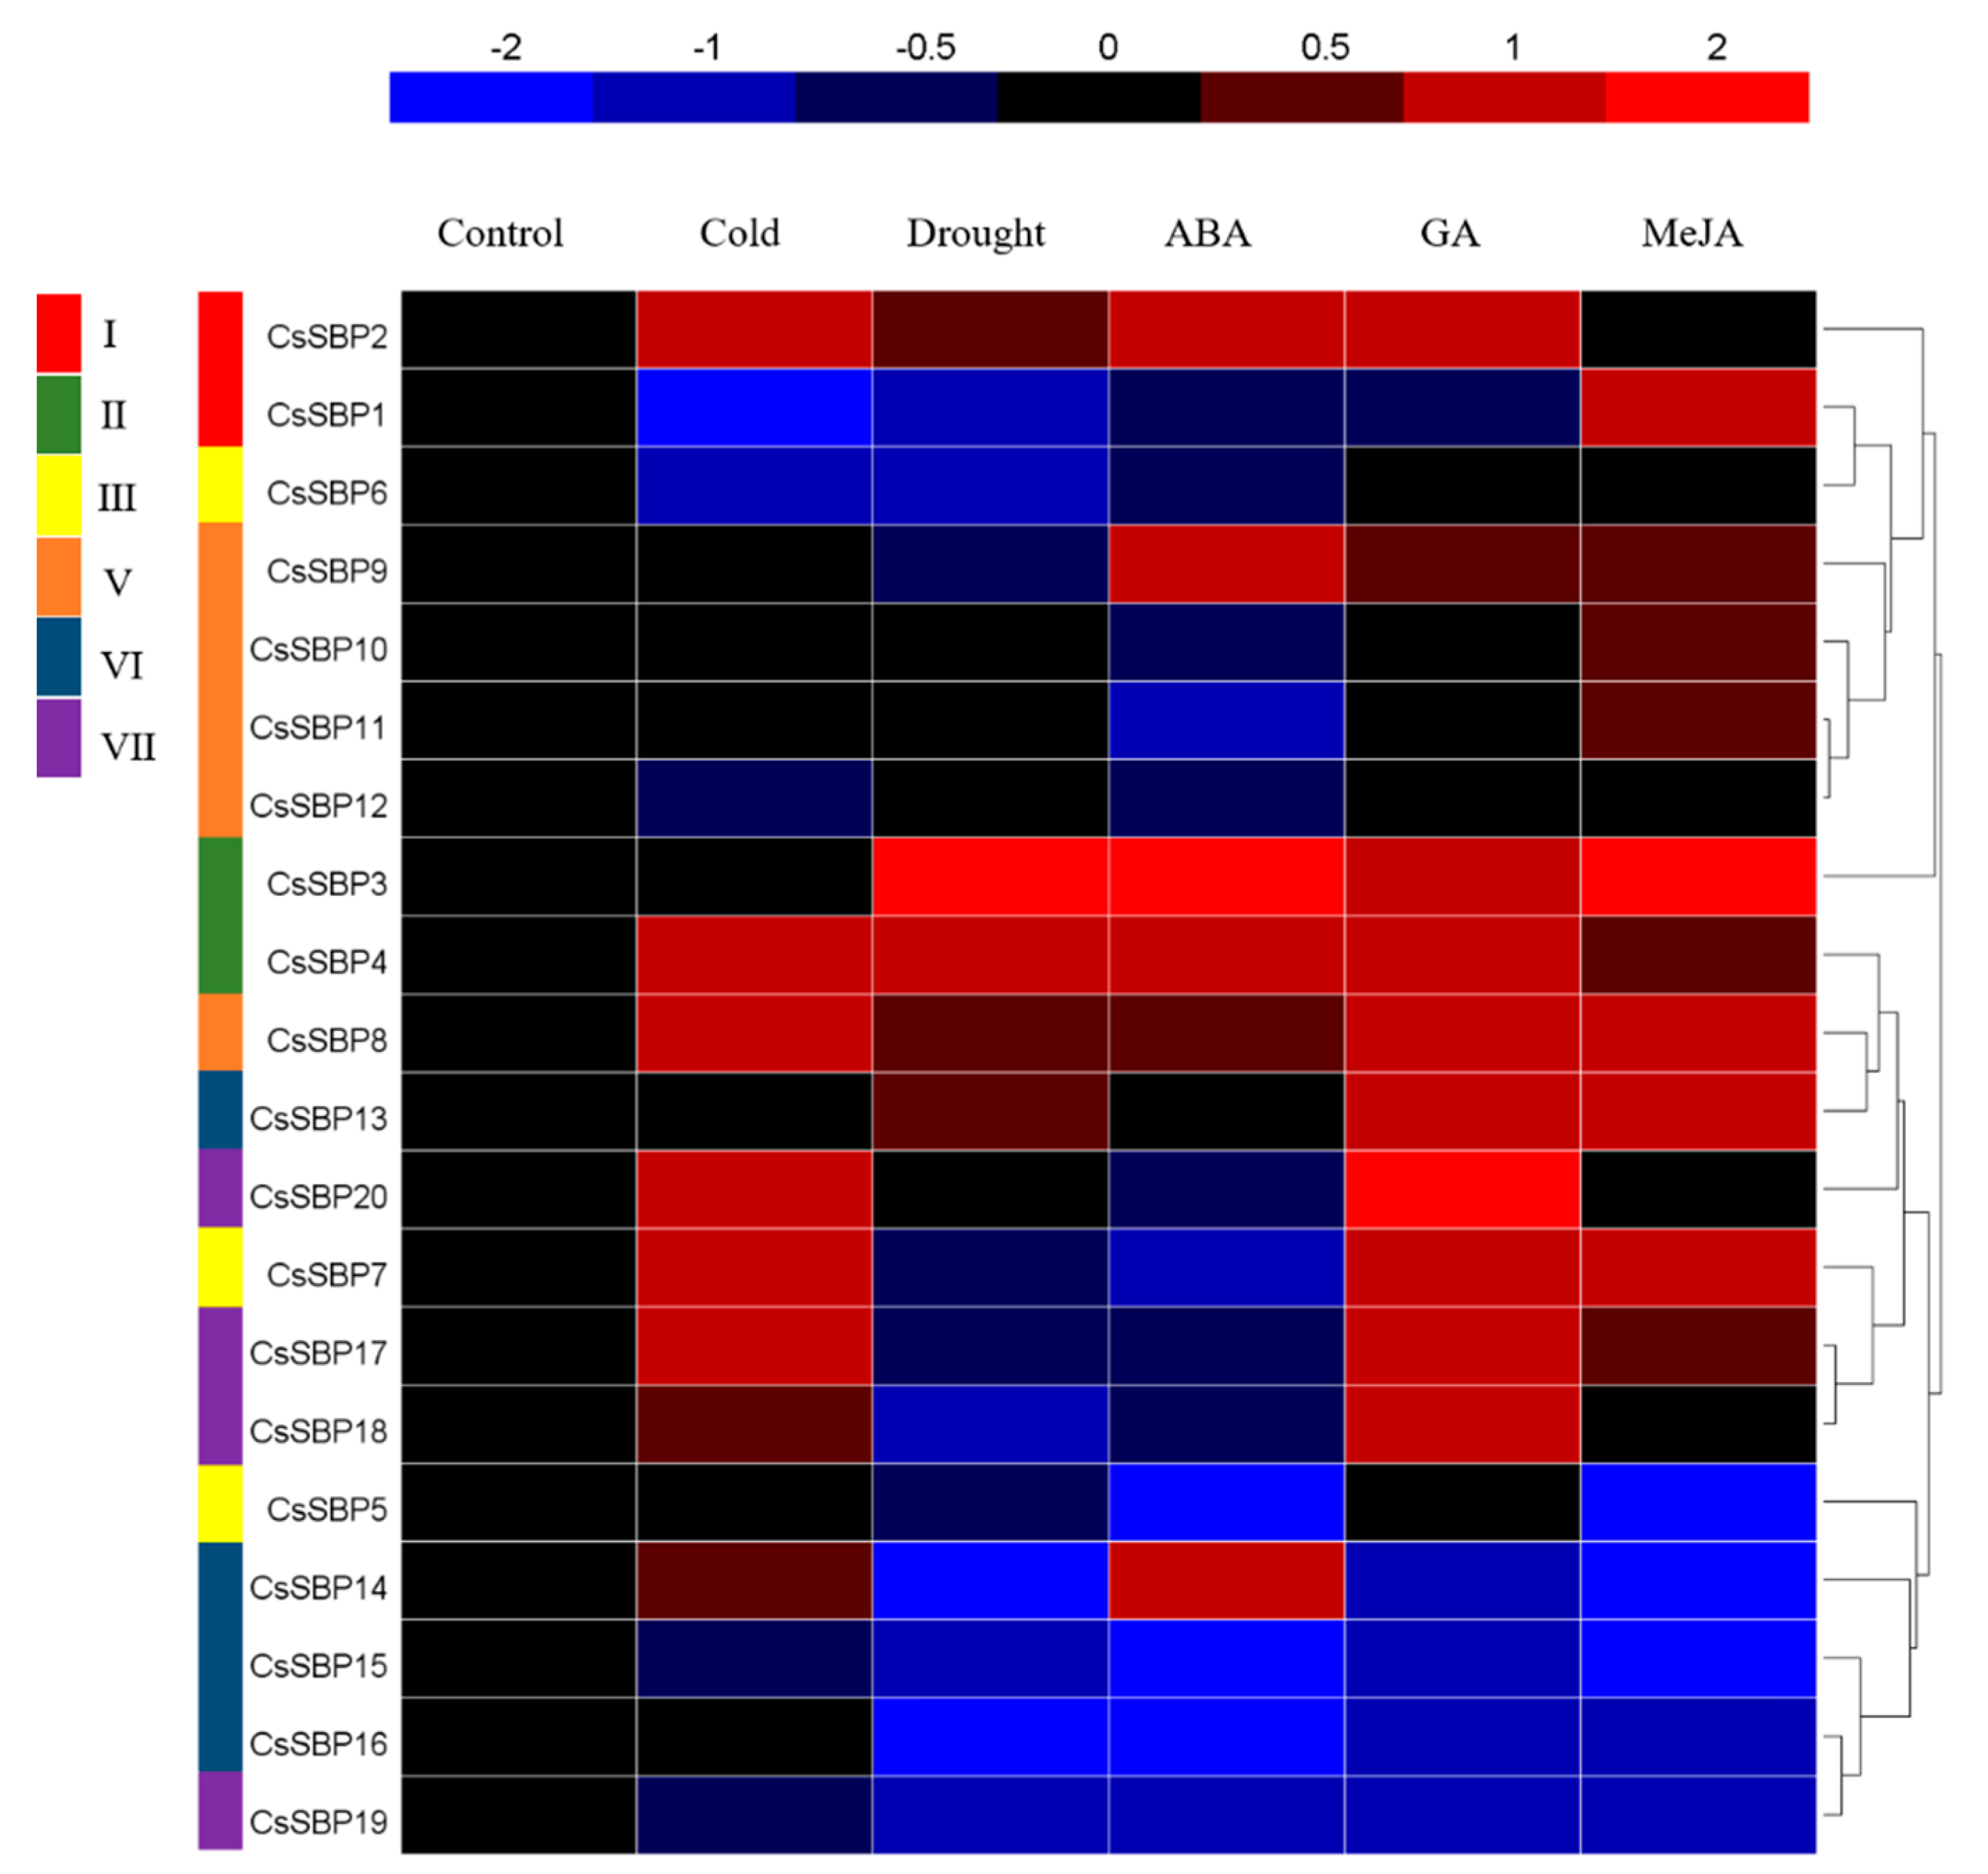
2.6. Expression Patterns of CsSBP Genes under Cold, Drought, ABA, GA, and MeJA Treatment as Evaluated by qRT-PCR

To investigate the potential role of CsSBP genes in the responses to various abiotic stresses and hormones, qRT-PCR was used to analyze the expression of 20 CsSBPs under cold, drought, ABA, GA, and MeJA treatment, and the expression values under five treatments are listed in Table S6. A heat map based on their expression levels is shown in Figure 8. CsSBPs with normalized expression values ≥0.5 were considered up-regulated genes, and those with values ≤−0.5 were defined as down-regulated. Overall, compared to their expression in the control (untreated group), the expression of the 20 CsSBP genes was significantly affected by these treatments, implying that these genes may have multiple functions in the response to stress stimuli. In detail, eight (CsSBP2, CsSBP4, CsSBP7, CsSBP8, CsSBP14, CsSBP17, CsSBP18, and CsSBP20) and five (CsSBP2, CsSBP3, CsSBP4, CsSBP8, and CsSBP13) CsSBP genes were significantly up-regulated under cold and drought stresses, respectively (Figure 8). Furthermore, 11, 14, and 15 genes were found to potentially be affected by ABA, GA, and MeJA, respectively. For these treatments, the most up-regulated gene was CsSBP3, while the most down-regulated gene was CsSBP15. Stress-specific responses were also found; the transcripts of three genes (CsSBP1, CsSBP10, and CsSBP11) were significantly elevated only under MeJA treatment. Several genes, such as CsSBP5, CsSBP15, CsSBP16, and CsSBP19, were generally down-regulated under these treatments.

3. Discussion

Because of the active role of SBP-box genes in plant growth and environmental responses, many SBP-box families have been identified in various plant species based on whole-genome sequencing [27,28,29]. However, there have been no studies about the SBP genes in tea plants. In this study, we conducted comprehensive research on this important transcription factor family in tea plants, including the identification of CsSBP gene family members and the analysis of their physical and chemical parameters, their classification, exon-intron structure, conserved motifs, cis-elements, expression patterns in different tissues, and their responses to various stresses and hormones.
A total of 20 CsSBP genes were identified in the tea plant genome. There were 16, 19, 18, and 12 SBP members in Arabidopsis [27], rice [28], grape [29], and birch [25], respectively. The number of CsSBPs is greater than that in these plant species but slightly less than that in petunia [36] (21 SBPs) and apple [32] (27 SBPs). Although the tea plant genomes (3.14 Gb and 3.02 Gb) are much larger than those of other plants, such as Arabidopsis [37] (genome size 125 Mb) and rice [38] (390.3 Mb), many studies have confirmed that this size resulted from the long-term amplification of a few LTR retrotransposon families [33,34]. The SBP-box family TFs from tea plant clustered into six groups (Figure 3), but not group IV, which is found in other plants, perhaps because of their ancient and divergent evolutionary patterns [39]. Moreover, this classification was generally consistent with gene structures and motif localizations (Figure 4 and Figure 5) as described previously in rice and apple [28,32]. However, some motifs were found in specific groups. For example, motifs 7, 8, and 9 existed only in group V (Figure 5). These motifs may be associated with the functional diversity of the SBP family.
To further explore the potential functions of the CsSBP family in tea plant growth and development, the expression patterns of the 20 CsSBP members in five different tissues were examined based on published transcriptome data (Figure 7). Our results indicated that most CsSBP genes are highly and widely expressed in the different tissues we tested. The transcripts of six members (CsSBP7, CsSBP-8, CsSBP10, CsSBP11, CsSBP12, and CsSBP13) accumulated to high levels in all tissues, suggesting essential roles. Interestingly, the expression of CsSBP genes in the buds and leaves was higher than that in other tissues. The tender shoots and young leaves are the most economically important tissues and are processed into beverages [40]. Homologous genes of CsSBP6 and CsSBP7 include AtSPL2, AtSPL10, and AtSPL11, which have been reported to affect leaf shape and shoot maturation [41]. The high expression of CsSBP6 and CsSBP7 in shoots and leaves suggests that these genes may play vital roles in shoot and leaf development. Furthermore, AtSPL14 in Arabidopsis, which is an ortholog of CsSBP8 and CsSBP9, is quite active in the development of normal plant architecture [23]. CsSBP1 exhibited high expression levels in tender shoots and clustered closely with AtSPL13 in the phylogenetic tree, while AtSPL13 is predominantly expressed in the hypocotyl and affects leaf primordium development [42]. CsSBP17 was highly expressed in flowers, consistent with the function of its grape ortholog VvSBP11 [43]. Overall, our expression data on CsSBP genes in different tissues showed high expression in shoots and will aid in further functional analysis of SBP members in tea plants.
Although several physiological developmental processes regulated by SBP genes have been discovered in recent years, only a few SBP genes have been shown to act under stress. For instance, combined analyses of co-expression networks and promoters have revealed that AtSPL genes are significantly correlated with genes involved in the defense pathway in response to various biotic and abiotic stresses [22]. Arabidopsis AtSPL14 has been reported to be involved in programmed cell death and to play a role in sensitivity to the fungal toxin fumonisin B1 [23]. Moreover, the BpSPL9 gene in birch has been demonstrated to increase the resistance of transgenic lines to abiotic stress [25]. In tea plants, we found that eight (CsSBP2, CsSBP4, CsSBP7, CsSBP8, CsSBP14, CsSBP17, CsSBP18, and CsSBP20) and five (CsSBP2, CsSBP3, CsSBP4, CsSBP8, and CsSBP13) CsSBP genes were obviously up-regulated under cold and drought stress, respectively (Figure 8). The grape gene VvSBP16 is an ortholog of CsSBP3 and CsSBP4 and enhances tolerance to drought stress by regulating the SOS and ROS signaling cascades [21]. In addition, we observed many stress-related cis-elements in the upstream regulatory sequences of CsSBP genes, especially drought- and low-temperature-related cis-elements (Figure 6), which suggested the involvement of CsSBP family members in abiotic stress. Numerous studies have shown that stress responses are regulated by signal transduction pathways, such as those for the hormonal signals ABA, GA, salicylic acid (SA), and MeJA, which can interact to activate the transcription of diverse stress-related genes [44,45]. Through a comprehensive analysis of the promoter regions of the CsSBP genes, we found numerous hormonal-response-related cis-elements, particularly many ABA-, GA-, and MeJA-responsive cis-elements (Figure 6). Therefore, we investigated the expression profiles of the CsSBP family under treatment with these three hormones. The results indicated that 12, 14, and 15 of the 20 CsSBP genes were regulated by ABA, GA, and MeJA, respectively. Furthermore, we found that members of the same group have similar gene expression patterns, especially group II, group V, and group VI (Figure 7 and Figure 8). Most of the CsSBP genes that were significantly induced by drought, GA, and MeJA treatments contained corresponding cis-elements: 9 of the 12 members significantly induced by drought stress contained corresponding MBS cis-elements; 12 of the 14 members significantly induced by GA treatment contained the corresponding GARE-motif, P-box and TATC-box elements; 12 of the 15 members significantly induced by MeJA contained the corresponding CGTCA cis-elements; suggesting the important role of these cis-elements involved in plant regulatory networks control. In summary, our studies suggest that the CsSBP genes have multiple functions in tea plant and play active roles in responses to abiotic stresses, possibly by relying on the ABA, GA, and MeJA signaling pathways.

4. Materials and Methods

4.1. Database Searches for CsSBP Gene Family Members in Tea Plants

Hidden Markov model (HMM) profiles of all sequences containing an SBP domain (PF03110) were used to search the Tea plant Genome Database (http://www.plantkingdomgdb.com/tea_tree/) [33,46]. To verify the putative CsSBP genes, SMARAT (http://smart.embl-heidelberg.de/) and CCD (https://0-www-ncbi-nlm-nih-gov.brum.beds.ac.uk/cdd/) were used to confirm the existence of the conserved SBP domain. Information on the CsSBP genes and predicted proteins, including the lengths of their genomic sequences, coding sequences (CDS), and open reading frames (ORFs), was obtained from the Tea Plant genome Database. Building a percentage identity matrix of CsSBP proteins based on the sequence alignment using DNAMAN 7.0 software and and presented as heat map in HemI 1.0 software. ExPASy (http://www.expasy.org/) was used to calculate the physical and chemical parameters of the CsSBP proteins. The NLS mapper (http://nls-mapper.iab.keio.ac.jp/cgi-bin/NLS_Mapper_form.cgi) and WoLF PSORT programs (https://wolfpsort.hgc.jp/) were used to analyze the NLS and subcellular localization information of the CsSBP protein, respectively.

4.2. Sequence Alignment and Phylogenetic Analysis

The sequences of the CsSBP proteins obtained from the tea plant genome and their conserved domains were aligned using DNAMAN 7.0 software. The conserved domains were also analyzed using the online platform WebLogo (http://weblogo.berkeley.edu/logo.cgi) [47]. For better classification, a phylogenetic tree was constructed using MEGA 5.0 (https://www.megasoftware.net/index.php) with the neighbor-joining method and 1000 bootstrap replicates based on the conserved SBP domains and the full-length sequences [48].

4.3. Gene Structure and Conserved Motif Analysis

The structures of the CsSBP genes were obtained from gene annotation files (http://www.plantkingdomgdb.com/tea_tree/data/gff3/), and the graph of the exon-intron structures was generated using the web-based Gene Structure Display Server (http://gsds.cbi.pku.edu.cn/) [49]. The full-length sequences of the SBP proteins from tea plant and Arabidopsis were analyzed using the MEME online tool (http://meme-suite.org/tools/meme) to predict conserved motifs. The numbers of motif was set to ten [50].

4.4. Putative Promoter Region Analysis

The cis-acting elements in the putative promoter region were investigated using the online website PlantCARE (http://bioinformatics.psb.ugent.be/webtools/plantcare/html/), and the upstream genomic sequence within 2000 bp of the start codon of each CsSBP gene was analyzed [51].

4.5. Expression Profile Analysis Based on RNA-Seq Data

The raw transcriptomic data from different tissues, including roots, stems, tender shoots, young leaves, and flowers (SRP103063), were downloaded from the NCBI Sequence Read Archive (SRA) website reported previously by Xia et al. [33]. All available reads were mapped to the tea plant genome using TopHat2 version 2.08 with default parameters [52]. HTseq software version 0.9.1 was used to quantify gene expression levels based on FPKM values [53]. The expression profiles were incorporated into heat maps using HemI 1.0 software.

4.6. Tea Plant Materials and Treatments

The experimental materials in this study were three-year-old seedlings grown from cuttings of the cultivar ‘Tieguanyin’ and were cultivated in the plant germplasm collection garden at Fujian Agriculture and Forestry University, Fuzhou, Fujian Province, China. For the low-temperature treatment, tea plants grown under ambient temperatures of 24 ± 2 °C were transferred to a growth chamber at 4 °C. For drought treatment, tea plants were transferred to a 10% (w/v) PEG-6000 solution. For the ABA, methyl jasmonate (MeJA) and gibberellic acid (GA) treatments, a freshly prepared working solution of 100 µM ABA, MeJA, or GA was sprayed on the tea leaves. The second leaves of the plants from the five treatments and from control (untreated) plants were collected after 12 h. Three independent biological replicates were collected, frozen in liquid nitrogen and stored at −80 °C.

4.7. RNA Extraction and qRT-PCR Analysis

Total RNA from second leaves was extracted using an RNAprep Pure Plant kit (DP441, TIANGEN, Beijing, China) in accordance with the manufacturer’s instructions. An EasyScript One-Step gDNA Removal and cDNA Synthesis SuperMix kit (AE311-02, TransGen Biotech, Beijing, China) was used to reverse transcribe the total RNA to cDNA for fluorescence detection. Quantitative real-time PCR (qRT-PCR) was conducted on a CFX96 Touch™ Real-Time PCR detection system (Bio-Rad, Hercules, CA, USA) using SYBR Green. The housekeeping gene GAPDH (accession no. GE651107) was used as an internal control. Gene-specific primers for the CsSBP genes were designed using Primer Premier 6.0 (Table S7). The reactions were conducted according to the method provided with the TransStart® Tip Green qPCR SuperMix kit (AQ141-02, TransGen Biotech, Beijing, China) using the following procedure: 95 °C for 30 s and 40 cycles of 95 °C for 5 s and 60 °C for 30 s. Relative gene expression levels were calculated using the 2−ΔΔCt method [54], normalized using log2 transformation, and depicted in a heat map using HemI 1.0 software.

5. Conclusions

In this study, we conducted a systematic analysis of the SBP-box gene family in tea plants. A total of 20 CsSBP genes were identified and classified into six groups based on phylogenetic relationships. Gene structures and conserved motifs were also examined. The expression patterns of CsSBP genes in different tissues suggested potential functions in tea plant growth and development. In addition, the cis-elements and expression profiles of the CsSBP genes were examined and showed the important roles of CsSBP genes in regulating responses to abiotic stress and hormones. This work provides a solid foundation for further investigating the SBP-mediated molecular mechanisms underlying physiological developmental processes and stress responses.

Supplementary Materials

Author Contributions

N.Y. and J.Y. conceived and designed the project; P.W., D.C., and Y.Z. performed the experiments; P.W. and S.J. analyzed the data; P.W. wrote the paper. All authors reviewed and approved the final manuscript.

Funding

This work was supported by the Fujian Province “2011 Collaborative Innovation Center”, Chinese Oolong Tea Industry Innovation Center (Cultivation) special project (J2015-75), National Natural Science Foundation of China (31270735), Fujian Natural Science Foundation of China (2016J01107).

Acknowledgments

The authors are grateful to the reviewers and editors for their helpful comments on this paper.

Conflicts of Interest

The authors declare no conflict of interest.

Abbreviations

SBPSQUAMOSA promoter binding protein
ABAabscisic acid
GAgibberellic acid
MeJAmethyl jasmonate
TFstranscription factors
NLSnuclear localization signal
UTRuntranslated region
FPKMfragments per kilobase million
SOSsalt overly sensitive
ROSreactive oxygen species
JAjasmonic acid
SODsuperoxide dismutase
PODperoxidase
SAsalicylic acid

References

  1. Wheeler, D.S.; Wheeler, W.J. The medicinal chemistry of tea. Drug Dev. Res. 2010, 61, 45–65. [Google Scholar] [CrossRef]
  2. Liu, Y.; Wang, D.; Zhang, S.; Zhao, H. Global expansion strategy of Chinese herbal tea beverage. Adv. J. Food Sci. Technol. 2015, 7, 739–745. [Google Scholar] [CrossRef]
  3. Rus, A.M.; Bressan, R.A.; Hasegawa, P.M. Unraveling salt tolerance in crops. Nat. Genet. 2005, 37, 1029–1030. [Google Scholar] [CrossRef] [PubMed]
  4. Zheng, C.; Wang, Y.; Ding, Z.; Zhao, L. Global transcriptional analysis reveals the complex relationship between tea quality, leaf senescence and the responses to cold-drought combined stress in Camellia sinensis. Front. Plant Sci. 2016, 7, 1858. [Google Scholar] [CrossRef] [PubMed]
  5. Wang, W.; Xin, H.; Wang, M.; Ma, Q.; Wang, L.; Kaleri, N.A.; Wang, Y.; Li, X. Transcriptomic analysis reveals the molecular mechanisms of drought-stress-induced decreases in Camellia sinensis Leaf quality. Front. Plant Sci. 2016, 7, 385. [Google Scholar] [CrossRef] [PubMed]
  6. Chen, K.; Rajewsky, N. The evolution of gene regulation by transcription factors and microRNAs. Nat. Rev. Genet. 2007, 8, 93–103. [Google Scholar] [CrossRef] [PubMed]
  7. Yamasaki, K.; Kigawa, T.; Inoue, M.; Tateno, M.; Yamasaki, T.; Yabuki, T.; Aoki, M.; Seki, E.; Matsuda, T.; Nunokawa, E. A novel zinc-binding motif revealed by solution structures of DNA-binding domains of Arabidopsis SBP-family transcription factors. J. Mol. Biol. 2004, 337, 49–63. [Google Scholar] [CrossRef] [PubMed]
  8. Klein, J.; Saedler, H.; Huijser, P. A new family of DNA binding proteins includes putative transcriptional regulators of the Antirrhinum majus floral meristem identity gene SQUAMOSA. Mol. Gen. Genet. 1996, 250, 7–16. [Google Scholar] [CrossRef] [PubMed]
  9. Cardon, G.H.; Höhmann, S.; Nettesheim, K.; Saedler, H.; Huijser, P. Functional analysis of the Arabidopsis thaliana SBP-box gene SPL3: A novel gene involved in the floral transition. Plant J. 1997, 12, 367–377. [Google Scholar] [CrossRef] [PubMed]
  10. Unte, U.S.; Sorensen, A.M.; Pesaresi, P.; Gandikota, M.; Leister, D.; Saedler, H.; Huijser, P. SPL8, an SBP-box gene that affects pollen sac development in Arabidopsis. Plant Cell 2003, 15, 1009–1019. [Google Scholar] [CrossRef] [PubMed]
  11. Wu, G.; Poethig, R.S. Temporal regulation of shoot development in Arabidopsis thaliana by miR156 and its target SPL3. Development 2006, 133, 3539–3547. [Google Scholar] [CrossRef] [PubMed]
  12. Usami, T.; Horiguchi, G.; Yano, S.; Tsukaya, H. The more and smaller cells mutants of Arabidopsis thaliana identify novel roles for SQUAMOSA PROMOTER BINDING PROTEIN-LIKE genes in the control of heteroblasty. Development 2009, 136, 955–964. [Google Scholar] [CrossRef] [PubMed]
  13. Gandikota, M.; Birkenbihl, R.P.; Höhmann, S.; Cardon, G.H.; Saedler, H.; Huijser, P. The miRNA156/157 recognition element in the 3’ UTR of the Arabidopsis SBP box gene SPL3 prevents early flowering by translational inhibition in seedlings. Plant J. 2010, 49, 683–693. [Google Scholar] [CrossRef] [PubMed]
  14. Xing, S.; Salinas, M.; Höhmann, S.; Berndtgen, R.; Huijser, P. miR156-targeted and nontargeted SBP-box transcription factors act in concert to secure male fertility in Arabidopsis. Plant Cell 2010, 22, 3935–3950. [Google Scholar] [CrossRef] [PubMed]
  15. Manning, K.; Tör, M.; Poole, M.; Hong, Y.; Thompson, A.J.; King, G.J.; Giovannoni, J.J.; Seymour, G.B. A naturally occurring epigenetic mutation in a gene encoding an SBP-box transcription factor inhibits tomato fruit ripening. Nat. Genet. 2006, 38, 948–952. [Google Scholar] [CrossRef] [PubMed]
  16. Zhang, Y.; Schwarz, S.; Saedler, H.; Huijser, P. SPL8, a local regulator in a subset of gibberellin-mediated developmental processes in Arabidopsis. Plant Mol. Biol. 2007, 63, 429. [Google Scholar] [CrossRef] [PubMed]
  17. Jung, J.H.; Ju, Y.; Seo, P.J.; Lee, J.H.; Park, C.M. The SOC1-SPL module integrates photoperiod and gibberellic acid signals to control flowering time in Arabidopsis. Plant J. 2012, 69, 577–588. [Google Scholar] [CrossRef] [PubMed]
  18. Yamasaki, H.; Hayashi, M.; Fukazawa, M.; Kobayashi, Y.; Shikanai, T. SQUAMOSA promoter binding protein-like7 is a central regulator for copper homeostasis in Arabidopsis. Plant Cell 2009, 21, 347–361. [Google Scholar] [CrossRef] [PubMed]
  19. Miura, K.; Ikeda, M.; Matsubara, A.; Song, X.J.; Ito, M.; Asano, K.; Matsuoka, M.; Kitano, H.; Ashikari, M. OsSPL14 promotes panicle branching and higher grain productivity in rice. Nat. Genet. 2010, 42, 545–549. [Google Scholar] [CrossRef] [PubMed]
  20. Wang, S.; Wu, K.; Yuan, Q.; Liu, X.; Liu, Z.; Lin, X.; Zeng, R.; Zhu, H.; Dong, G.; Qian, Q. Control of grain size, shape and quality by OsSPL16 in rice. Nat. Genet. 2012, 44, 950–954. [Google Scholar] [CrossRef] [PubMed]
  21. Hou, H.; Jia, H.; Yan, Q.; Wang, X. Overexpression of a SBP-Box Gene (VpSBP16) from Chinese wild vitis species in Arabidopsis improves salinity and drought stress tolerance. Int. J. Mol. Sci. 2018, 19, 940. [Google Scholar] [CrossRef] [PubMed]
  22. Wang, Y.; Hu, Z.; Yang, Y.; Chen, X.; Chen, G. Function annotation of an SBP-box gene in Arabidopsis based on analysis of co-expression networks and promoters. Int. J. Mol. Sci. 2009, 10, 116. [Google Scholar] [CrossRef] [PubMed]
  23. Stone, J.M.; Liang, X.; Nekl, E.R.; Stiers, J.J. Arabidopsis AtSPL14, a plant-specific SBP-domain transcription factor, participates in plant development and sensitivity to fumonisin B1. Plant J. 2010, 41, 744–754. [Google Scholar] [CrossRef] [PubMed]
  24. Jung, C.; Song, Y.Y.; Koo, Y.J.; Kim, M.; Yang, D.C.; Cheong, J.J. Transcript profile of transgenic Arabidopsis constitutively producing methyl jasmonate. J. Plant Biol. 2007, 50, 12–17. [Google Scholar] [CrossRef]
  25. Ning, K.; Chen, S.; Huang, H.; Jiang, J.; Yuan, H.; Li, H. Molecular characterization and expression analysis of the SPL gene family with BpSPL9 transgenic lines found to confer tolerance to abiotic stress in Betula platyphylla SUK. Plant Cell Tissue Organ Cult. 2017, 130, 1–13. [Google Scholar] [CrossRef]
  26. Mao, H.D.; Yu, L.J.; Li, Z.J.; Yan, Y.; Han, R.; Liu, H.; Ma, M. Genome-wide analysis of the SPL family transcription factors and their responses to abiotic stresses in maize. Plant Gene 2016, 6, 1–12. [Google Scholar] [CrossRef]
  27. Guo, A.Y.; Zhu, Q.H.; Gu, X.; Ge, S.; Yang, J.; Luo, J. Genome-wide identification and evolutionary analysis of the plant specific SBP-box transcription factor family. Gene 2008, 418, 1–8. [Google Scholar] [CrossRef] [PubMed]
  28. Xie, K.; Wu, C.; Xiong, L. Genomic Organization, Differential expression, and interaction of SQUAMOSA promoter-binding-like transcription factors and microRNA156 in rice. Plant Physiol. 2006, 142, 280–293. [Google Scholar] [CrossRef] [PubMed]
  29. Hou, H.; Li, J.; Gao, M.; Singer, S.D.; Wang, H.; Mao, L.; Fei, Z.; Wang, X. Genomic organization, phylogenetic comparison and differential expression of the SBP-box family genes in grape. PLoS ONE 2013, 8, e59358. [Google Scholar] [CrossRef] [PubMed]
  30. Song, S.; Zhou, H.; Sheng, S.; Cao, M.; Li, Y.; Pang, X. Genome-wide organization and expression profiling of the SBP-Box gene family in Chinese jujube (Ziziphus jujuba Mill.). Int. J. Mol. Sci. 2017, 18, 1734. [Google Scholar] [CrossRef] [PubMed]
  31. Pan, F.; Wang, Y.; Liu, H.; Wu, M.; Chu, W.; Chen, D.; Xiang, Y. Genome-wide identification and expression analysis of SBP-like transcription factor genes in Moso Bamboo (Phyllostachys edulis). BMC Genom. 2017, 18, 486. [Google Scholar] [CrossRef] [PubMed]
  32. Li, J.; Hou, H.; Li, X.; Xiang, J.; Yin, X.; Gao, H.; Zheng, Y.; Bassett, C.L.; Wang, X. Genome-wide identification and analysis of the SBP-box family genes in apple (Malus × domestica Borkh.). Plant Physiol. Biochem. 2013, 70, 100–114. [Google Scholar] [CrossRef] [PubMed]
  33. Xia, E.H.; Zhang, H.B.; Sheng, J.; Li, K.; Zhang, Q.J.; Kim, C.; Zhang, Y.; Liu, Y.; Zhu, T.; Li, W. The Tea Tree Genome provides insights into tea flavor and independent evolution of caffeine biosynthesis. Mol. Plant 2017, 10, 866–877. [Google Scholar] [CrossRef] [PubMed]
  34. Wei, C.; Yang, H.; Wang, S.; Zhao, J.; Liu, C.; Gao, L.; Xia, E.; Lu, Y.; Tai, Y.; She, G. Draft genome sequence of Camellia sinensis var. sinensis provides insights into the evolution of the tea genome and tea quality. Proc. Natl. Acad. Sci. USA 2018, 115. [Google Scholar] [CrossRef]
  35. Michaely, P.; Bennett, V. The ANK repeat: A ubiquitous motif involved in macromolecular recognition. Trends Cell Biol. 1992, 2, 127–129. [Google Scholar] [CrossRef]
  36. Zhou, Q.; Zhang, S.; Chen, F.; Liu, B.; Wu, L.; Li, F.; Zhang, J.; Bao, M.; Liu, G. Genome-wide identification and characterization of the SBP-box gene family in Petunia. BMC Genom. 2018, 19, 193. [Google Scholar] [CrossRef] [PubMed]
  37. Arabidopsis Genome Initiative. Analysis of the genome sequence of the flowering plant Arabidopsis thaliana. Nature 2000, 408, 796–815. [CrossRef] [PubMed]
  38. International Rice Genome Sequencing Project. The map-based sequence of the rice genome. Nature 2005, 436, 793–800. [Google Scholar] [CrossRef] [PubMed] [Green Version]
  39. Shu, D.Z.; Li, Z.L.; Ting, S.Y. Evolution and divergence of SBP-box genes in land plants. BMC Genom. 2015, 16, 787. [Google Scholar] [CrossRef]
  40. Yue, C.; Cao, H.L.; Hao, X.Y.; Zeng, J.M.; Qian, W.J.; Guo, Y.Q.; Ye, N.X.; Yang, Y.J.; Wang, X.C. Differential expression of gibberellin- and abscisic acid-related genes implies their roles in the bud activity-dormancy transition of tea plants. Plant Cell Rep. 2018, 37, 425–441. [Google Scholar] [CrossRef] [PubMed]
  41. Shikata, M.; Koyama, T.; Mitsuda, N.; Ohmetakagi, M. Arabidopsis SBP-box genes SPL10, SPL11 and SPL2 control morphological change in association with shoot maturation in the reproductive phase. Plant Cell Physiol. 2009, 50, 2133–2145. [Google Scholar] [CrossRef] [PubMed]
  42. Martin, R.C.; Asahina, M.; Liu, P.P.; Kristof, J.R.; Coppersmith, J.L.; Pluskota, W.E.; Bassel, G.W.; Goloviznina, N.A.; Nguyen, T.T.; Martínezandújar, C. The regulation of post-germinative transition from the cotyledon- to vegetative-leaf stages by microRNA-targeted SQUAMOSA PROMOTER-BINDING PROTEIN LIKE13 in Arabidopsis. Seed Sci. Res. 2010, 20, 89–96. [Google Scholar] [CrossRef]
  43. Hou, H.; Yan, X.; Sha, T.; Qin, Y.; Wang, X. The SBP-box gene VpSBP11 from Chinese wild vitis is involved in floral transition and affects leaf development. Int. J. Mol. Sci. 2017, 18, 1493. [Google Scholar] [CrossRef] [PubMed]
  44. Dhawan, S.S.; Sharma, A. Analysis of differentially expressed genes in abiotic stress response and their role in signal transduction pathways. Protoplasma 2014, 251, 81–91. [Google Scholar] [CrossRef]
  45. Colebrook, E.H.; Thomas, S.G.; Phillips, A.L.; Hedden, P. The role of gibberellin signalling in plant responses to abiotic stress. J. Exp. Biol. 2014, 217, 67–75. [Google Scholar] [CrossRef] [PubMed]
  46. Finn, R.D.; Clements, J.; Arndt, W.; Miller, B.L.; Wheeler, T.J.; Schreiber, F.; Bateman, A.; Eddy, S.R. HMMER web server: 2015 update. Nucleic Acids Res. 2015, 43, 30–38. [Google Scholar] [CrossRef] [PubMed]
  47. Crooks, G.E.; Hon, G.; Chandonia, J.M.; Brenner, S.E. WebLogo: A sequence logo generator. Genome Res. 2004, 14, 1188–1190. [Google Scholar] [CrossRef] [PubMed]
  48. Hall, B.G. Building phylogenetic trees from molecular data with MEGA. Mol. Biol. Evol. 2013, 30, 1229–1235. [Google Scholar] [CrossRef] [PubMed]
  49. Hu, B.; Jin, J.; Guo, A.; Zhang, H.; Luo, J.; Gao, G. GSDS 2.0: An upgraded gene feature visualization server. Bioinformatics 2015, 31, 1296. [Google Scholar] [CrossRef] [PubMed]
  50. Bailey, T.L.; Boden, M.; Buske, F.A.; Frith, M.; Grant, C.E.; Clementi, L.; Ren, J.; Li, W.W.; Noble, W.S. MEME SUITE: Tools for motif discovery and searching. Nucleic Acids Res. 2009, 37, 202–208. [Google Scholar] [CrossRef] [PubMed]
  51. Lescot, M.; Déhais, P.; Thijs, G.; Marchal, K.; Moreau, Y.; Peer, Y.V.D.; Rouzé, P.; Rombauts, S. PlantCARE, a database of plant cis-acting regulatory elements and a portal to tools for in silico analysis of promoter sequences. Nucleic Acids Res. 2002, 30, 325–327. [Google Scholar] [CrossRef] [PubMed]
  52. Trapnell, C.; Roberts, A.; Goff, L.; Pertea, G.; Kim, D.; Kelley, D.R.; Pimentel, H.; Salzberg, S.L.; Rinn, J.L.; Pachter, L. Differential gene and transcript expression analysis of RNA-seq experiments with TopHat and Cufflinks. Nat. Protoc. 2014, 7, 2513. [Google Scholar] [CrossRef]
  53. Anders, S.; Pyl, P.T.; Huber, W. HTSeq—A Python framework to work with high-throughput sequencing data. Bioinformatics 2015, 31, 166–169. [Google Scholar] [CrossRef] [PubMed]
  54. Livak, K.J.; Schmittgen, T.D. Analysis of relative gene expression data using real-time quantitative PCR and the 2(-Delta Delta C(T)) Method. Methods 2001, 25, 402–408. [Google Scholar] [CrossRef] [PubMed]
Figure 1. The percentage identity matrix of CsSBP proteins. The heatmap was conducted based on the CsSBP protein sequences. The colored bar indicates the correlation of protein sequences of two genes, blue represents a low correlation, red represents a high correlation, and yellow represents a correlation that is 1. The correlated values of the CsSBP proteins are listed in Table S2.
Ijms 19 03404 g001
Figure 2. Multiple sequence alignment of the SQUAMOSA promoter binding protein (SBP) domains in tea plant. (A) The sequence logos of the conserved SBP domains were analyzed using WebLogo. The y axis (measured in bits) depicts the overall height of the stack, indicating the sequence conservation at that position, while the height of the symbols within the stack indicates the relative frequency of each amino at that position. (B) The SBP domain sequences were aligned using DNAMAN 7.0 software; the two zinc-finger structures and nuclear localization signal (NLS) are indicated.
Ijms 19 03404 g002
Figure 3. Phylogenetic tree of SBP domains created in MEGA 5.0. The sequences of the SBP domain are from tea plant (CsSBP), Arabidopsis (AtSPL), rice (OsSPL) and grape (VvSBP). All SBP members were classified into seven groups (I–VII), and their sequences and sources are listed in Table S4.
Ijms 19 03404 g003
Figure 4. Phylogenetic tree of the CsSBP gene family and the exon-intron structures of tea plant SBP proteins. (A) The phylogenetic tree of the CsSBP genes was created using the MEGA 5.0 software with the neighbor-joining method; bootstrap values from 1000 replicates are indicated at each node. (B) Exon-intron structures were described using GSDS 2.0. Red, round-cornered rectangles represent exons, black lines represent introns, and blue rectangles represent untranslated regions (UTRs). The numbers 0, 1, and 2 represent intron phases.
Ijms 19 03404 g004
Figure 5. Conserved motifs of CsSBP proteins from tea plant and Arabidopsis. (A) The different-colored boxes represent different motifs and their positions in each SBP sequence. (B) The sequences and logos of the identified motifs in tea plant and Arabidopsis.
Ijms 19 03404 g005
Figure 6. Predicted cis-elements associated with various stress and hormone responses in the CsSBP promoters. (A) Depiction of the distribution of cis-elements that relate to various stress and hormone responses in the 2 kb upstream promoter regions of CsSBP genes. Different cis-elements are represented by different shapes and colors. (B) Numbers of stress- and hormone-response-related cis-elements in each CsSBP promoter.
Ijms 19 03404 g006
Figure 7. Expression profiles of CsSBP genes in different tissues. The colored bar represents the expression values [log2(FPKM)]. Blue represents low expression, and red represents high expression. Different groups of CsSBP genes are marked with rectangles of different colors. The FPKM values of the CsSBP genes in different tissues are listed in Table S5.
Ijms 19 03404 g007
Figure 8. Expression profiles of CsSBP genes under cold, drought, ABA, GA, and MeJA treatments as determined by qRT-PCR. The relative gene expression levels were calculated using the 2−ΔΔCt method and are expressed as the fold change relative to the expression of the control. Three independent biological replications were performed. The colored bar represents Log2 expression values. Blue represents low expression and red represents high expression. Different groups of CsSBP genes are marked with rectangles of different colors. The expression value of CsSBP genes under five treatments are listed in Table S6.
Ijms 19 03404 g008
Table 1. The 20 CsSBP genes identified in tea plants and their sequence characteristics.
NameGene IDGenomic (bp)ExonsCDS (bp)ORF (aa)MW (kD)pI
CsSBP1CSA01950827583105034938.227.64
CsSBP2CSA02043940003116738843.028.64
CsSBP3CSA00731130353152150655.637.06
CsSBP4CSA03166763494213671177.838.40
CsSBP5CSA02344272293122140644.816.58
CsSBP6CSA01314822394107435739.228.97
CsSBP7CSA01137355944144047952.638.23
CsSBP8CSA01335146291233991132124.648.29
CsSBP9CSA01528646221031501049116.388.01
CsSBP10CSA0340502108493331034.739.02
CsSBP11CSA0340531117281026930.038.69
CsSBP12CSA0345916500103147104811.606.54
CsSBP13CSA025811974211247282392.585.60
CsSBP14CSA00045834399152750856.896.45
CsSBP15CSA0223071789245014916.956.19
CsSBP16CSA036632373233311012.396.09
CsSBP17CSA0096671991255818520.909.05
CsSBP18CSA0317853317462720823.069.12
CsSBP19CSA0344186946487329032.599.14
CsSBP20CSA020672621161820522.776.41

