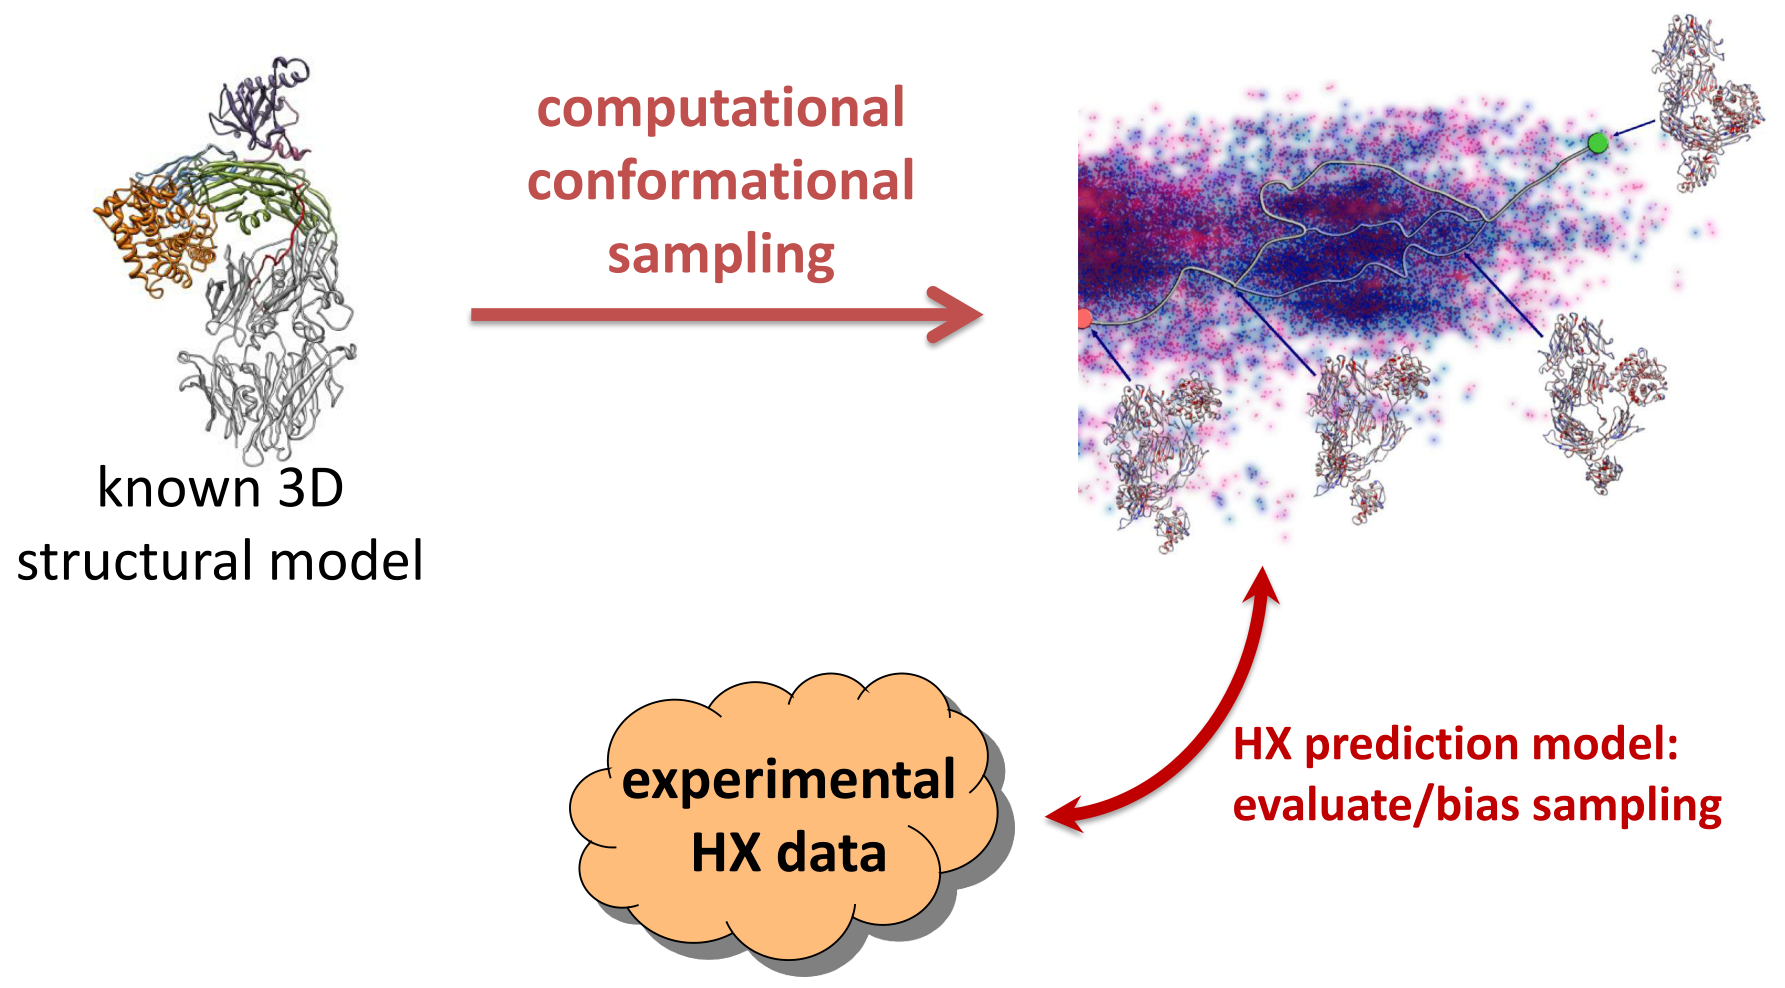
Revealing Unknown Protein Structures Using Computational Conformational Sampling Guided by Experimental Hydrogen-Exchange Data


Abstract
:
1. Introduction
2. Results
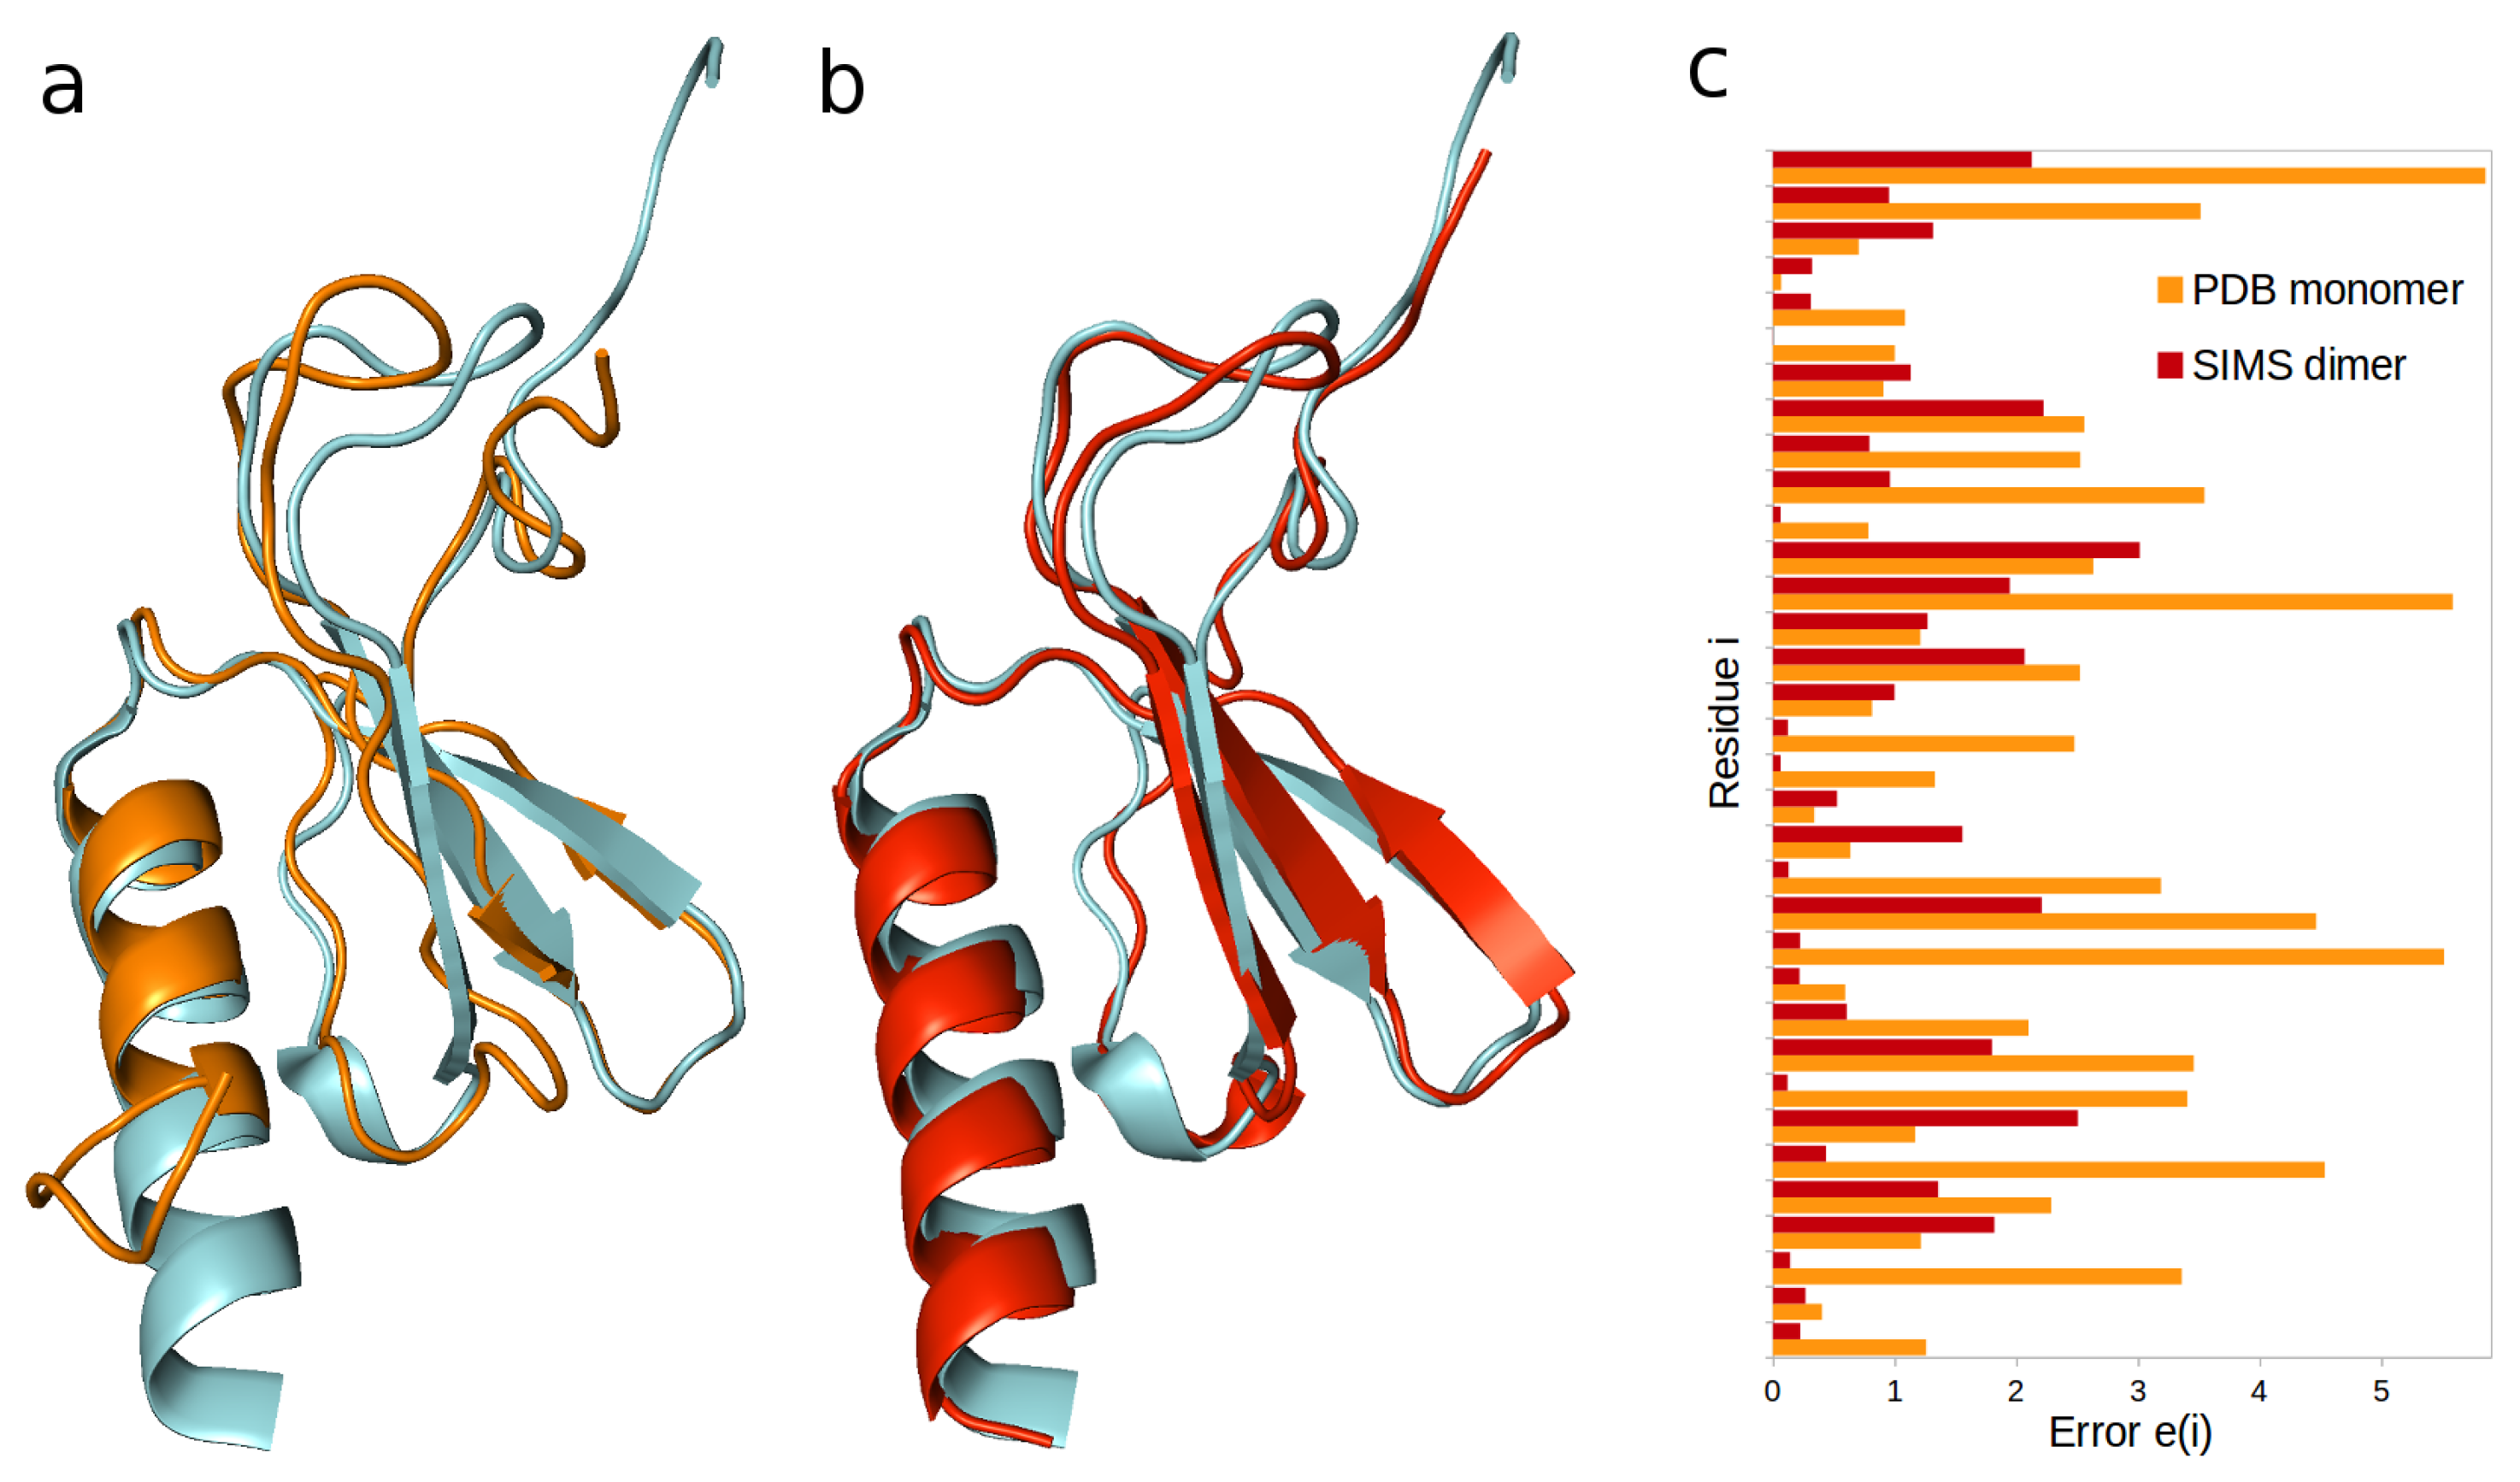
2.1. Interleukin-8
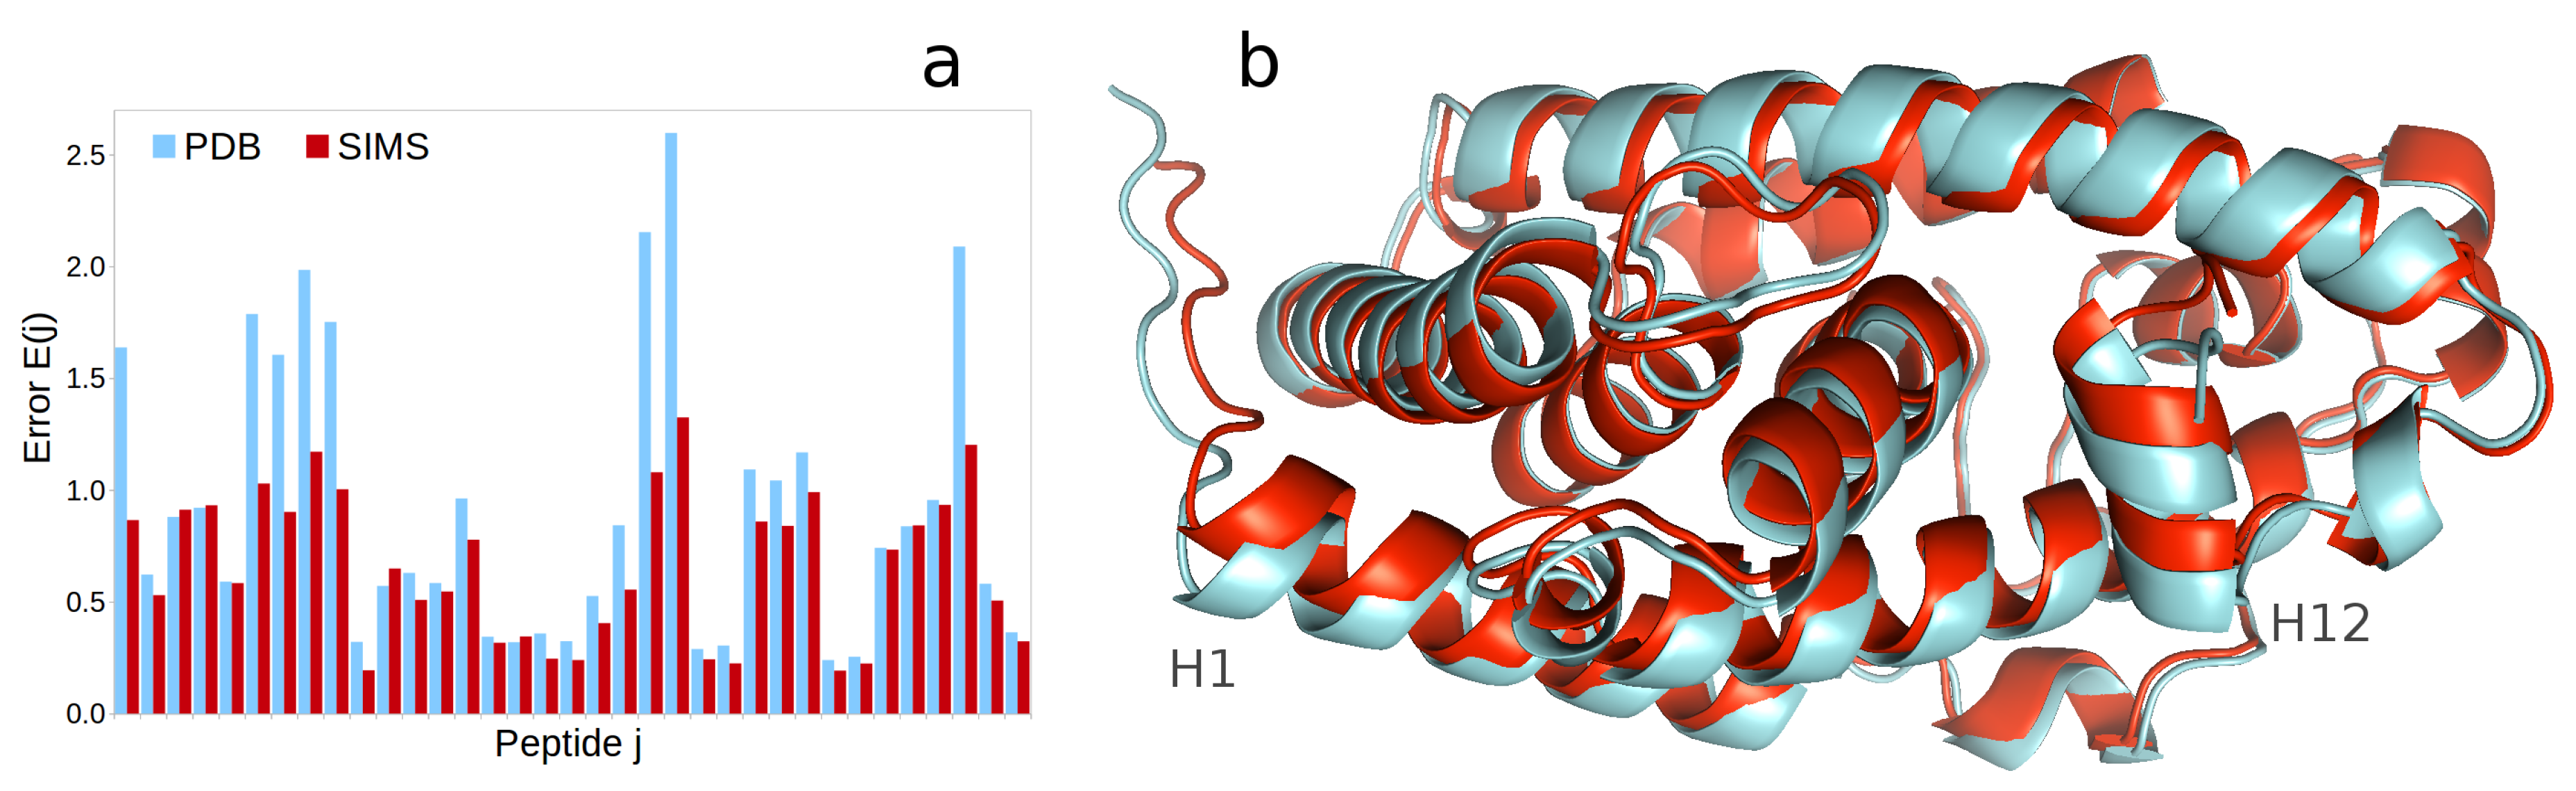
2.2. Vitamin D Receptor
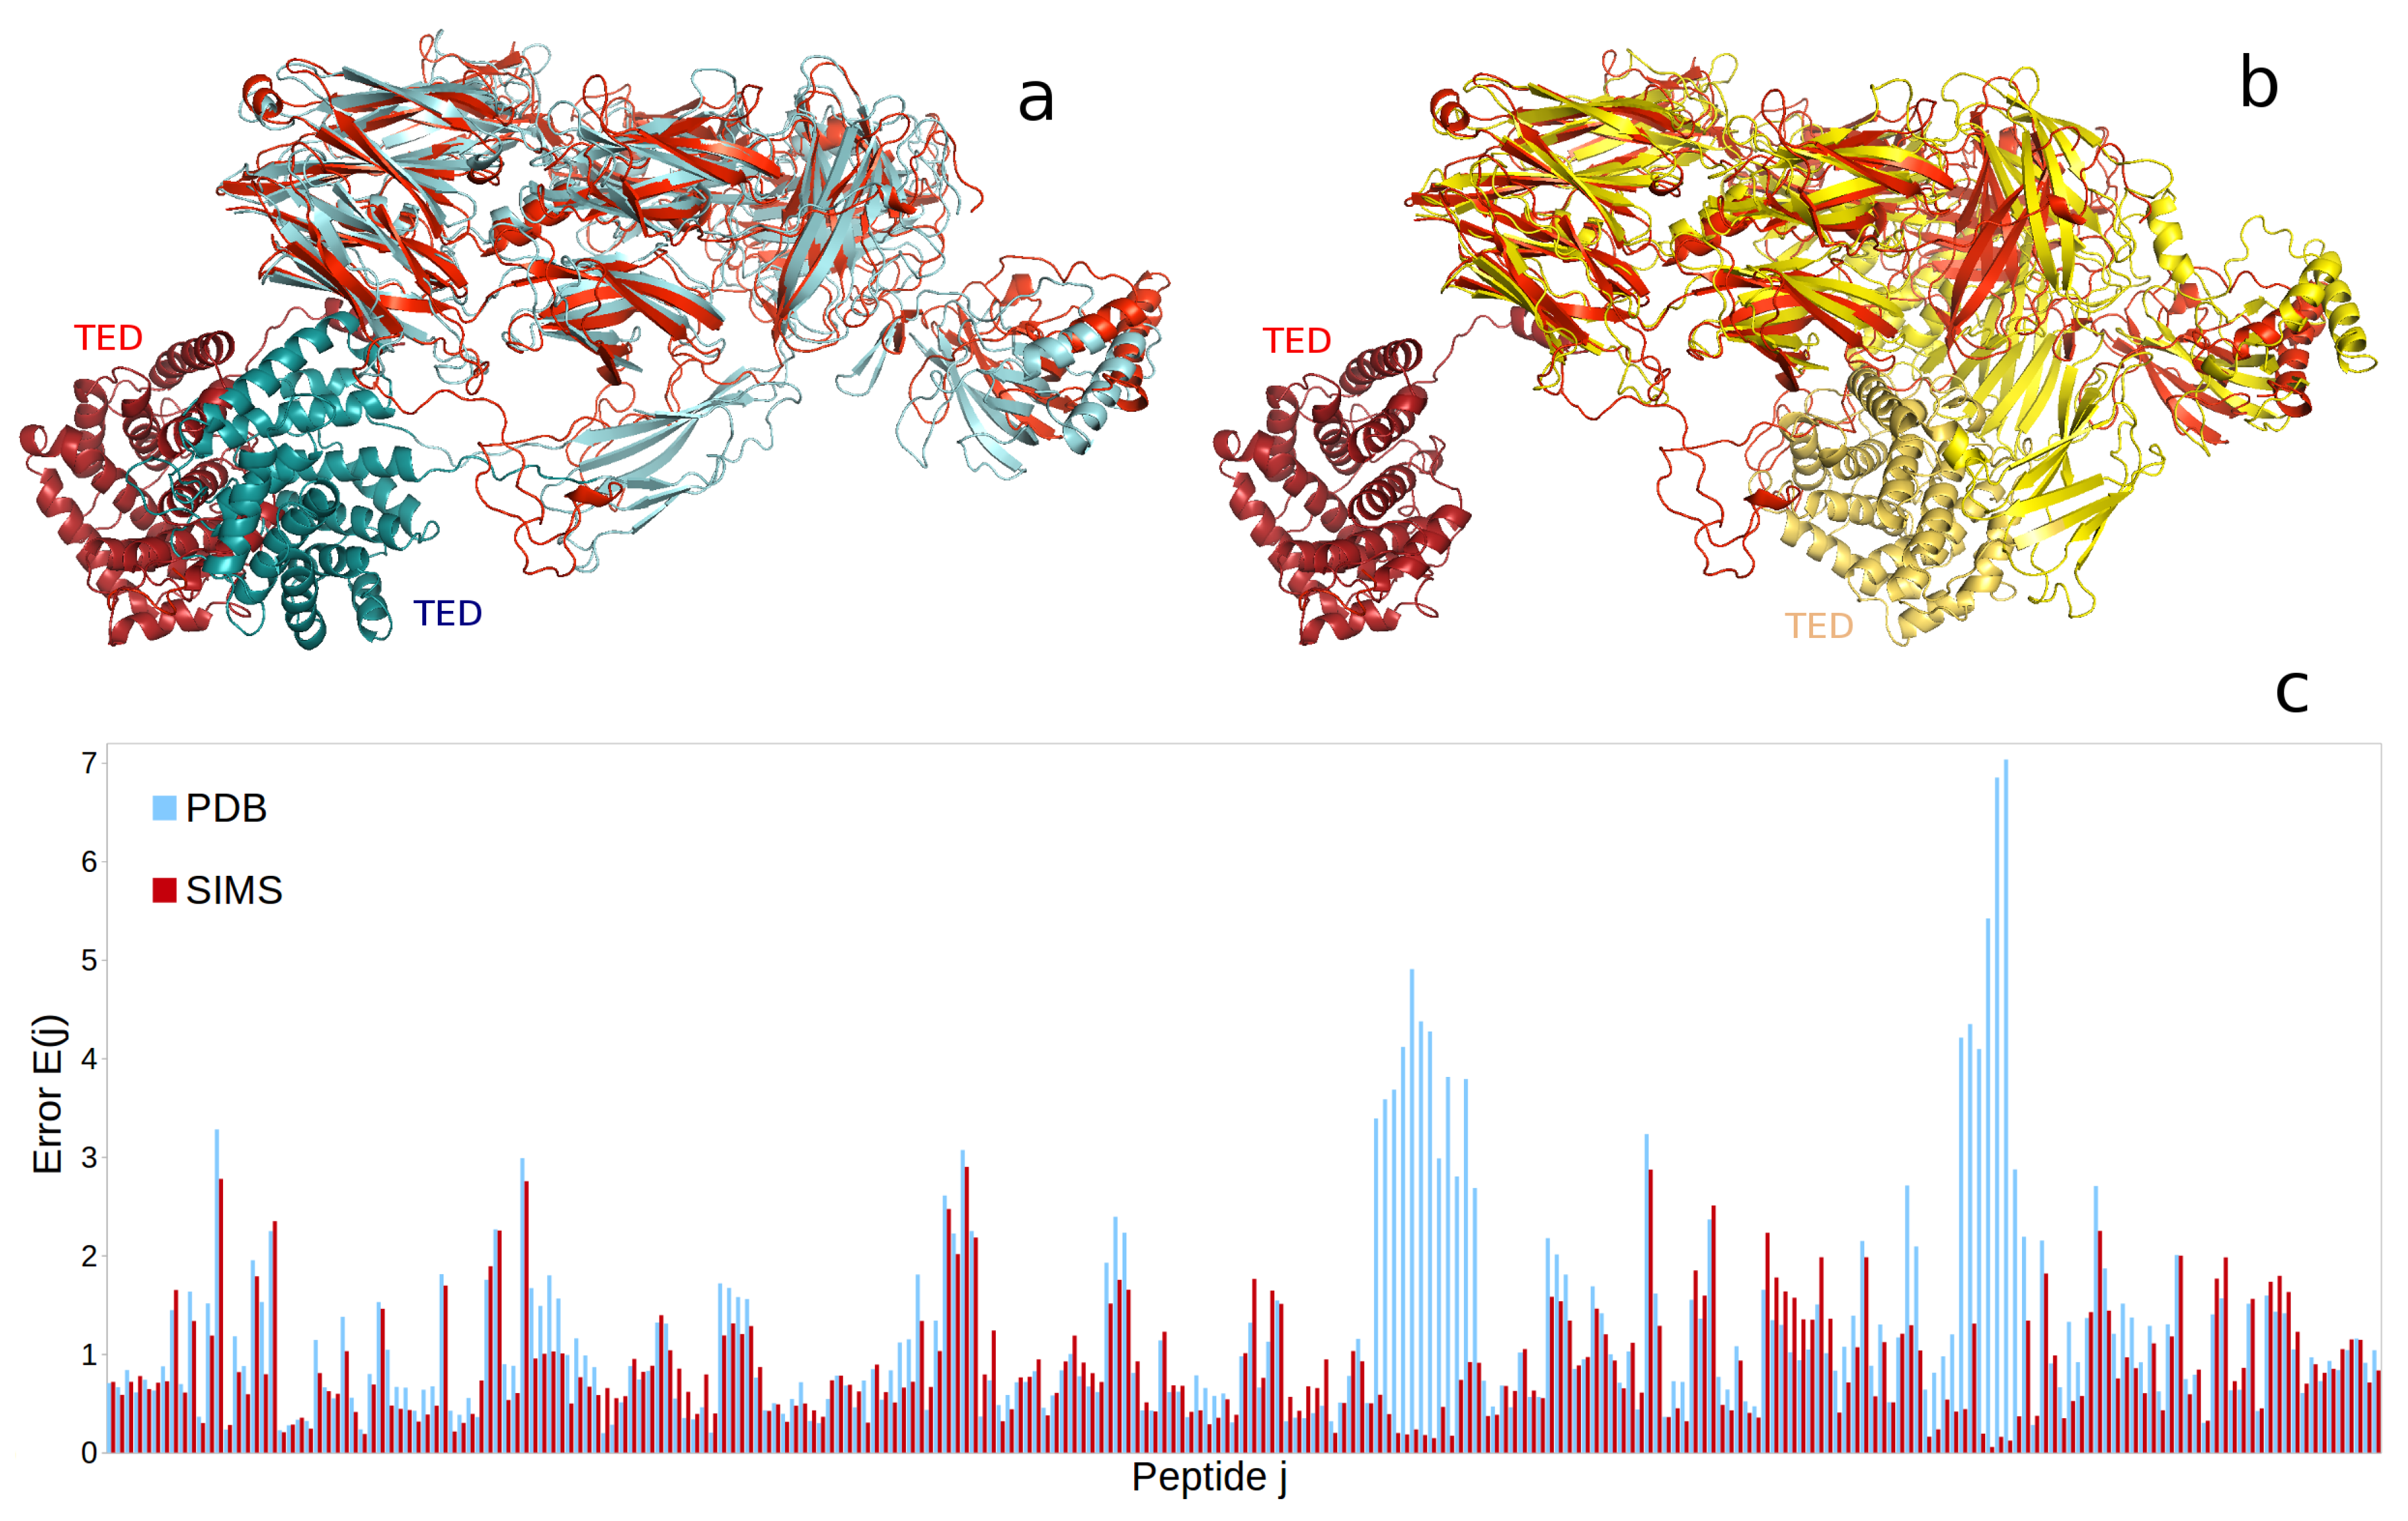
2.3. Complement Protein iC3b
3. Discussion
4. Materials and Methods
4.1. Hydrogen Exchange in Proteins
4.2. Hydrogen Exchange Derived from Protein Structure
4.3. Goodness-of-Fit between Structurally-Derived and Experimental Hydrogen-Exchange Data
- When dealing with HX-NMR data, one can obtain a histogram of errors by computing, for every residue i, the unitless error , where is the structurally-derived protection factor and is the experimentally-observed protection factor. One can also aggregate this histogram into an average error over all relevant residues.
- In the case of HX-MS data, one can obtain a histogram of errors by computing, for each peptide j, the unitless error , where T is the list of experimental time points in the HX-MS experiment, is the structurally-derived deuterium uptake at time t and is the experimentally-observed deuterium uptake at time t. One can also aggregate this histogram into an average error over all peptides.
4.4. Efficient Conformational Sampling of Protein Structure
4.5. Studied Proteins and Experimental Hydrogen-Exchange Data
4.5.1. Interleukin-8
4.5.2. Vitamin D Receptor
4.5.3. Complement Protein iC3b
Supplementary Materials
Author Contributions
Funding
Acknowledgments
Conflicts of Interest
Abbreviations
| EM | electron microscopy | NMR | nuclear magnetic resonance |
| HX | hydrogen exchange | PDB | Protein Data Bank |
| IL-8 | interleukin-8 | RMSD | root-mean-squared deviation |
| LBD | ligand-binding domain | SIMS | Structured Intuitive Move Selector |
| MG | macroglobulin | TED | thioester-containing domain |
| MS | mass spectrometry | VDR | vitamin D receptor |
References
- Hegyi, H.; Gerstein, M. The relationship between protein structure and function: A comprehensive survey with application to the yeast genome. J. Mol. Biol. 1999, 288, 147–164. [Google Scholar] [CrossRef] [PubMed]
- Carlson, H.A. Protein flexibility is an important component of structure-based drug discovery. Curr. Pharm. Des. 2002, 8, 1571–1578. [Google Scholar] [CrossRef] [PubMed]
- Hatfield, M.P.; Lovas, S. Conformational sampling techniques. Curr. Pharm. Des. 2014, 20, 3303–3313. [Google Scholar] [CrossRef] [PubMed]
- Berman, H.M.; Westbrook, J.; Feng, Z.; Gilliland, G.; Bhat, T.N.; Weissig, H.; Shindyalov, I.N.; Bourne, P.E. The protein data bank. Nucl. Acids Res. 2000, 28, 235–242. [Google Scholar] [CrossRef] [PubMed]
- Dror, R.O.; Dirks, R.M.; Grossman, J.P.; Xu, H.; Shaw, D.E. Biomolecular simulation: A computational microscope for molecular biology. Annu. Rev. Biophys. 2012, 41, 429–452. [Google Scholar] [CrossRef] [PubMed]
- Claesen, J.; Burzykowski, T. Computational methods and challenges in hydrogen/deuterium exchange mass spectrometry. Mass Spectrom. Rev. 2017, 36, 649–667. [Google Scholar] [CrossRef] [PubMed]
- Englander, S.W.; Mayne, L.; Kan, Z.Y.; Hu, W. Protein folding–how and why: By hydrogen exchange, fragment separation, and mass spectrometry. Annu. Rev. Biophys. 2016, 45, 135–152. [Google Scholar] [CrossRef] [PubMed]
- Pirrone, G.F.; Iacob, R.E.; Engen, J.R. Applications of hydrogen/deuterium exchange MS from 2012 to 2014. Anal. Chem. 2015, 87, 99–118. [Google Scholar] [CrossRef] [PubMed]
- Vendruscolo, M.; Paci, E.; Dobson, C.M.; Karplus, M. Rare fluctuations of native proteins sampled by equilibrium hydrogen exchange. J. Am. Chem. Soc. 2003, 125, 15686–15687. [Google Scholar] [CrossRef] [PubMed]
- Best, R.B.; Vendruscolo, M. Structural interpretation of hydrogen exchange protection factors in proteins: Characterization of the native state fluctuations of CI2. Structure 2006, 14, 97–106. [Google Scholar] [CrossRef] [PubMed]
- Gsponer, J.; Hopearuoho, H.; Whittaker, S.B.M.; Spence, G.R.; Moore, G.R.; Paci, E.; Radford, S.E.; Vendruscolo, M. Determination of an ensemble of structures representing the intermediate state of the bacterial immunity protein Im7. Proc. Natl. Acad. Sci. USA 2006, 103, 99–104. [Google Scholar] [CrossRef] [PubMed]
- Radou, G.; Dreyer, F.N.; Tuma, R.; Paci, E. Functional dynamics of hexameric helicase probed by hydrogen exchange and simulation. Biophys. J. 2014, 107, 983–990. [Google Scholar] [CrossRef] [PubMed]
- Gipson, B.; Moll, M.; Kavraki, L.E. SIMS: A hybrid method for rapid conformational analysis. PLoS ONE 2013, 8, e68826. [Google Scholar] [CrossRef] [PubMed]
- Al-Bluwi, I.; Siméon, T.; Cortés, J. Motion planning algorithms for molecular simulations: A survey. Comput. Sci. Rev. 2012, 6, 125–143. [Google Scholar] [CrossRef]
- Gipson, B.; Hsu, D.; Kavraki, L.E.; Latombe, J.C. Computational models of protein kinematics and dynamics: Beyond simulation. Annu. Rev. Anal. Chem. 2012, 5, 273–291. [Google Scholar] [CrossRef] [PubMed]
- Das, R.; Baker, D. Macromolecular modeling with Rosetta. Annu. Rev. Biochem. 2008, 77, 363–382. [Google Scholar] [CrossRef] [PubMed]
- Kaufmann, K.W.; Lemmon, G.H.; DeLuca, S.L.; Sheehan, J.H.; Meiler, J. Practically useful: What the Rosetta protein modeling suite can do for you. Biochemistry 2010, 49, 2987–2998. [Google Scholar] [CrossRef] [PubMed]
- Ángyán, A.F.; Gáspári, Z. Ensemble-based interpretations of NMR structural data to describe protein internal dynamics. Molecules 2013, 18, 10548–10567. [Google Scholar] [CrossRef] [PubMed]
- Van den Bedem, H.; Fraser, J.S. Integrative, dynamic structural biology at atomic resolution—It’s about time. Nat. Methods 2015, 12, 307–318. [Google Scholar] [CrossRef] [PubMed]
- López-Blanco, J.R.; Chacón, P. Structural modeling from electron microscopy data. WIREs Comput. Mol. Sci. 2015, 5, 62–81. [Google Scholar] [CrossRef]
- Devaurs, D.; Antunes, D.A.; Papanastasiou, M.; Moll, M.; Ricklin, D.; Lambris, J.D.; Kavraki, L.E. Coarse-grained conformational sampling of protein structure improves the fit to experimental hydrogen-exchange data. Front. Mol. Biosci. 2017, 4. [Google Scholar] [CrossRef] [PubMed]
- Devaurs, D.; Papanastasiou, M.; Antunes, D.A.; Abella, J.R.; Moll, M.; Ricklin, D.; Lambris, J.D.; Kavraki, L.E. Native state of complement protein C3d analysed via hydrogen exchange and conformational sampling. Int. J. Comput. Biol. Drug Des. 2018, 11, 90–113. [Google Scholar] [CrossRef]
- Joseph, P.R.; Poluri, K.M.; Gangavarapu, P.; Rajagopalan, L.; Raghuwanshi, S.; Richardson, R.M.; Garofalo, R.P.; Rajarathnam, K. Proline substitution of dimer interface β-strand residues as a strategy for the design of functional monomeric proteins. Biophys. J. 2013, 105, 1491–1501. [Google Scholar] [CrossRef] [PubMed]
- Zhang, J.; Chalmers, M.J.; Stayrook, K.R.; Burris, L.L.; Garcia-Ordonez, R.D.; Pascal, B.D.; Burris, T.P.; Dodge, J.A.; Griffin, P.R. Hydrogen/deuterium exchange reveals distinct agonist/partial agonist receptor dynamics within vitamin D receptor/retinoid X receptor heterodimer. Structure 2010, 18, 1332–1341. [Google Scholar] [CrossRef] [PubMed]
- Papanastasiou, M.; Koutsogiannaki, S.; Sarigiannis, Y.; Geisbrecht, B.V.; Ricklin, D.; Lambris, J.D. Structural implications for the formation and function of the complement effector protein iC3b. J. Immunol. 2017, 198, 3326–3335. [Google Scholar] [CrossRef] [PubMed]
- Nishida, N.; Walz, T.; Springer, T.A. Structural transitions of complement component C3 and its activation products. Proc. Natl. Acad. Sci. USA 2006, 103, 19737–19742. [Google Scholar] [CrossRef] [PubMed] [Green Version]
- Alcorlo, M.; Martínez-Barricarte, R.; Fernández, F.J.; Rodríguez-Gallego, C.; Round, A.; Vega, M.C.; Harris, C.L.; de Cordoba, S.R.; Llorca, O. Unique structure of iC3b resolved at a resolution of 24 Å by 3D-electron microscopy. Proc. Natl. Acad. Sci. USA 2011, 108, 13236–13240. [Google Scholar] [CrossRef] [PubMed]
- Rochel, N.; Moras, D. Chapter 9—Structural basis for ligand activity in VDR. In Vitamin D, 3rd ed.; Feldman, D., Pike, J., Adams, J., Eds.; Academic Press: Cambridge, MA, USA, 2011; pp. 171–191. [Google Scholar] [CrossRef]
- Griffin, P.R.; Scripps Research Institute, Jupiter, FL, USA. Personal Communication, 2017.
- Engen, J.; Wales, T.; Shi, X. Hydrogen exchange mass spectrometry for conformational analysis of proteins. In Encyclopedia of Analytical Chemistry; Meyers, R., Ed.; John Wiley & Sons, Ltd.: Hoboken, NJ, USA, 2011. [Google Scholar]
- Englander, S.W.; Mayne, L.; Bai, Y.; Sosnick, T.R. Hydrogen exchange: The modern legacy of Linderstrøm-Lang. Protein Sci. 1997, 6, 1101–1109. [Google Scholar] [CrossRef] [PubMed] [Green Version]
- Huang, R.Y.C.; Chen, G. Higher order structure characterization of protein therapeutics by hydrogen/deuterium exchange mass spectrometry. Anal. Bioanal. Chem. 2014, 406, 6541–6558. [Google Scholar] [CrossRef] [PubMed]
- Jaswal, S.S. Biological insights from hydrogen exchange mass spectrometry. Biochim. Biophys. Acta 2013, 1834, 1188–1201. [Google Scholar] [CrossRef] [PubMed]
- Brier, S.; Engen, J. Hydrogen exchange mass spectrometry: Principles and capabilities. In Mass Spectrometry Analysis for Protein-Protein Interactions and Dynamics; Chance, M., Ed.; John Wiley & Sons, Inc.: Hoboken, NJ, USA, 2008; pp. 11–43. [Google Scholar]
- Bai, Y.; Milne, J.S.; Mayne, L.; Englander, S.W. Primary structure effects on peptide group hydrogen exchange. Proteins 1993, 17, 75–86. [Google Scholar] [CrossRef] [PubMed] [Green Version]
- Connelly, G.P.; Bai, Y.; Jeng, M.F.; Englander, S.W. Isotope effects in peptide group hydrogen exchange. Proteins 1993, 17, 87–92. [Google Scholar] [CrossRef] [PubMed]
- Wei, H.; Tymiak, A.; Chen, G. Hydrogen/deuterium exchange mass spectrometry for protein higher order structure characterization. In Characterization of Protein Therapeutics Using Mass Spectrometry; Chen, G., Ed.; Springer: New York, NY, USA, 2013; pp. 305–341. [Google Scholar]
- Skinner, J.J.; Lim, W.K.; Bédard, S.; Black, B.E.; Englander, S.W. Protein hydrogen exchange: Testing current models. Protein Sci. 2012, 21, 987–995. [Google Scholar] [CrossRef] [PubMed] [Green Version]
- Kieseritzky, G.; Morra, G.; Knapp, E.W. Stability and fluctuations of amide hydrogen bonds in a bacterial cytochrome c: A molecular dynamics study. J. Biol. Inorg. Chem. 2006, 11, 26–40. [Google Scholar] [CrossRef] [PubMed]
- Konermann, L.; Pan, J.; Liu, Y.H. Hydrogen exchange mass spectrometry for studying protein structure and dynamics. Chem. Soc. Rev. 2011, 40, 1224–1234. [Google Scholar] [CrossRef] [PubMed]
- Rajarathnam, K.; Clark-Lewis, I.; Sykes, B.D. 1H NMR solution structure of an active monomeric interleukin-8. Biochemistry 1995, 34, 12983–12990. [Google Scholar] [CrossRef] [PubMed]
- Clore, G.M.; Appella, E.; Yamada, M.; Matsushima, K.; Gronenborn, A.M. Three-dimensional structure of interleukin 8 in solution. Biochemistry 1990, 29, 1689–1696. [Google Scholar] [CrossRef] [PubMed]
- Baldwin, E.T.; Weber, I.T.; St Charles, R.; Xuan, J.C.; Appella, E.; Yamada, M.; Matsushima, K.; Edwards, B.F.; Clore, G.M.; Gronenborn, A.M.; et al. Crystal structure of interleukin 8: Symbiosis of NMR and crystallography. Proc. Natl. Acad. Sci. USA 1991, 88, 502–506. [Google Scholar] [CrossRef] [PubMed]
- Wan, L.Y.; Zhang, Y.Q.; Chen, M.D.; Du, Y.Q.; Liu, C.B.; Wu, J.F. Relationship between structure and conformational change of the vitamin D receptor ligand binding domain in 1α,25-dihydroxyvitamin D3 signaling. Molecules 2015, 20, 20473–20486. [Google Scholar] [CrossRef] [PubMed]
- Burris, T.P.; Solt, L.A.; Wang, Y.; Crumbley, C.; Banerjee, S.; Griffett, K.; Lundasen, T.; Hughes, T.; Kojetin, D.J. Nuclear receptors and their selective pharmacologic modulators. Pharmacol. Rev. 2013, 65, 710–778. [Google Scholar] [CrossRef] [PubMed]
- Verlinden, L.; Verstuyf, A.; Eelen, G.; Bouillon, R.; Ordóñez-Morán, P.; Larriba, M.J.; Muñoz, A.; Rochel, N.; Sato, Y.; Moras, D.; et al. Synthesis, structure, and biological activity of des-side chain analogues of 1α,25-dihydroxyvitamin D3 with substituents at C18. ChemMedChem 2011, 6, 788–793. [Google Scholar] [CrossRef] [PubMed] [Green Version]
- Carson, M.W.; Zhang, J.; Chalmers, M.J.; Bocchinfuso, W.P.; Holifield, K.D.; Masquelin, T.; Stites, R.E.; Stayrook, K.R.; Griffin, P.R.; Dodge, J.A. HDX reveals unique fragment ligands for the vitamin D receptor. Bioorg. Med. Chem. Lett. 2014, 24, 3459–3463. [Google Scholar] [CrossRef] [PubMed]
- Zheng, J.; Chang, M.R.; Stites, R.E.; Wang, Y.; Bruning, J.B.; Pascal, B.D.; Novick, S.J.; Garcia-Ordonez, R.D.; Stayrook, K.R.; Chalmers, M.J.; et al. HDX reveals the conformational dynamics of DNA sequence specific VDR co-activator interactions. Nat. Commun. 2017, 8, 923. [Google Scholar] [CrossRef] [PubMed] [Green Version]
- Ricklin, D.; Reis, E.S.; Lambris, J.D. Complement in disease: A defence system turning offensive. Nat. Rev. Nephrol. 2016, 12, 383–401. [Google Scholar] [CrossRef] [PubMed]
- Gros, P.; Milder, F.J.; Janssen, B.J. Complement driven by conformational changes. Nat. Rev. Immunol. 2008, 8, 48–58. [Google Scholar] [CrossRef] [PubMed]
- Janssen, B.J.; Christodoulidou, A.; McCarthy, A.; Lambris, J.D.; Gros, P. Structure of C3b reveals conformational changes that underlie complement activity. Nature 2006, 444, 213–216. [Google Scholar] [CrossRef] [PubMed] [Green Version]
- Schuster, M.C.; Ricklin, D.; Papp, K.; Molnar, K.S.; Coales, S.J.; Hamuro, Y.; Sfyroera, G.; Chen, H.; Winters, M.S.; Lambris, J.D. Dynamic structural changes during complement C3 activation analyzed by hydrogen/deuterium exchange mass spectrometry. Mol. Immunol. 2008, 45, 3142–3151. [Google Scholar] [CrossRef] [PubMed] [Green Version]
- Chen, H.; Ricklin, D.; Hammel, M.; Garcia, B.L.; McWhorter, W.J.; Sfyroera, G.; Wu, Y.Q.; Tzekou, A.; Li, S.; Geisbrecht, B.V.; et al. Allosteric inhibition of complement function by a staphylococcal immune evasion protein. Proc. Natl. Acad. Sci. USA 2010, 107, 17621–17626. [Google Scholar] [CrossRef] [PubMed] [Green Version]
- Sfyroera, G.; Ricklin, D.; Reis, E.S.; Chen, H.; Wu, E.L.; Kaznessis, Y.N.; Ekdahl, K.N.; Nilsson, B.; Lambris, J.D. Rare loss-of-function mutation in complement component C3 provides insight into molecular and pathophysiological determinants of complement activity. J. Immunol. 2015, 194, 3305–3316. [Google Scholar] [CrossRef] [PubMed]
- Lambris, J.D.; University of Pennsylvania, Philadelphia, PA, USA. Personal Communication, 2017.


© 2018 by the authors. Licensee MDPI, Basel, Switzerland. This article is an open access article distributed under the terms and conditions of the Creative Commons Attribution (CC BY) license (http://creativecommons.org/licenses/by/4.0/).
Share and Cite
Devaurs, D.; Antunes, D.A.; Kavraki, L.E. Revealing Unknown Protein Structures Using Computational Conformational Sampling Guided by Experimental Hydrogen-Exchange Data. Int. J. Mol. Sci. 2018, 19, 3406. https://0-doi-org.brum.beds.ac.uk/10.3390/ijms19113406
Devaurs D, Antunes DA, Kavraki LE. Revealing Unknown Protein Structures Using Computational Conformational Sampling Guided by Experimental Hydrogen-Exchange Data. International Journal of Molecular Sciences. 2018; 19(11):3406. https://0-doi-org.brum.beds.ac.uk/10.3390/ijms19113406
Chicago/Turabian StyleDevaurs, Didier, Dinler A. Antunes, and Lydia E. Kavraki. 2018. "Revealing Unknown Protein Structures Using Computational Conformational Sampling Guided by Experimental Hydrogen-Exchange Data" International Journal of Molecular Sciences 19, no. 11: 3406. https://0-doi-org.brum.beds.ac.uk/10.3390/ijms19113406