Article

Uric Acid and Xanthine Levels in Pregnancy Complicated by Gestational Diabetes Mellitus—The Effect on Adverse Pregnancy Outcomes

1
Department of Pathophysiology, Faculty of Medicine, Masaryk University, 625 00 Brno, Czech Republic
2
Department of Biochemistry, Faculty of Medicine, Masaryk University, 625 00 Brno, Czech Republic
*
Author to whom correspondence should be addressed.
Int. J. Mol. Sci. 2018, 19(11), 3696; https://0-doi-org.brum.beds.ac.uk/10.3390/ijms19113696
Submission received: 12 October 2018 / Revised: 17 November 2018 / Accepted: 19 November 2018 / Published: 21 November 2018
(This article belongs to the Special Issue Risk Factors and Molecular Mechanisms of Gestational Diabetes)

Abstract

:
Uric acid (UA) levels are associated with many diseases including those related to lifestyle. The aim of this study was to evaluate the influence of clinical and anthropometric parameters on UA and xanthine (X) levels during pregnancy and postpartum in women with physiological pregnancy and pregnancy complicated by gestational diabetes mellitus (GDM), and to evaluate their impact on adverse perinatal outcomes. A total of 143 participants were included. Analyte levels were determined by HPLC with ultraviolet detection (HPLC-UV). Several single-nucleotide polymorphisms (SNPs) in UA transporters were genotyped using commercial assays. UA levels were higher within GDM women with pre-gestational obesity, those in high-risk groups, and those who required insulin during pregnancy. X levels were higher in the GDM group during pregnancy and also postpartum. Positive correlations between UA and X levels with body mass index (BMI) and glycemia levels were found. Gestational age at delivery was negatively correlated with UA and X levels postpartum. Postpartum X levels were significantly higher in women who underwent caesarean sections. Our data support a possible link between increased UA levels and a high-risk GDM subtype. UA levels were higher among women whose glucose tolerance was severely disturbed. Mid-gestational UA and X levels were not linked to adverse perinatal outcomes.

Graphical Abstract

1. Introduction

Uric acid (UA) is a terminal product of purine metabolism with non-negligible extracellular antioxidant function; however, increased UA levels are established markers of pathological mechanisms involved in a plethora of diseases [1]. UA production is maintained by an enzyme, xanthine oxidoreductase (XOR), which catalyzes the oxidation from hypoxanthine to xanthine (X) and the subsequent oxidation from X to UA [2]. Long-term hyperuricemia (i.e., levels higher than 360 μmol/L in women and 420 μmol/L in men) typically seen in gout or even short-term elevation associated with tumor lysis syndrome may lead to the formation of urate calculi in kidney and other tissues. Despite its limited solubility and a fate of waste product, UA is largely (~90%) reabsorbed in the kidney and the intestine and returned to the blood. Increased UA levels may occur as a result of an increased UA production, impaired renal UA excretion, or both [3]. Hyperuricemia itself is linked to atherosclerosis and basically to all components of metabolic syndrome such as visceral obesity, hypertension, dyslipidemia, insulin resistance, and diabetes mellitus [4], and several studies showed UA to be one of the hallmarks of the metabolic syndrome [5,6,7,8].
Serum UA levels show substantial genetic components; 28 single-nucleotide polymorphisms (SNPs) affecting UA levels were identified so far using a genome-wide association approach [9]. Of those variations, those in the transporters SLC2A9 and ABCG2 seem to have a major effect. The gene SLC2A9 encodes glucose transporter 9 (GLUT9) which is present in the basolateral membrane of proximal tubular cells and mediates release of urate reabsorbed from the primary filtrate. Genetic variation in the SLC2A9 explains 3.5% of UA level variation [10] and is associated with both UA levels and gout. Interestingly, the effect of genetic variation was reported stronger in women [11]. ATP-binding cassette G2 (ABCG2) is a transport protein expressed in the apical membrane of proximal tubular cells where it contributes substantially to the urate efflux in the primary filtrate, as shown by a functional study. A common non-synonymous SNP rs2231142 in the ABCG2 decreases urate efflux by 53% [12].
Insulin resistance increases during the second trimester of pregnancy and resolves upon delivery under physiological conditions. However, reduced β-cell reserve or their maladaptation to higher insulin demands may result in gestational diabetes mellitus (GDM) [13]. GDM is defined as diabetes first diagnosed in the second or third trimester of pregnancy that is not clearly either pre-existing type 1 or type 2 diabetes [14]. Pregnancies affected by GDM pose an increased risk of perinatal complications for both mother and child [15], such as macrosomia, lower gestational age at delivery, the need for induced labor or caesarean section, and further increased perinatal morbidity and mortality. Glucose homeostasis abnormality usually resolves soon after delivery; however, women with a history of previous GDM remain at an increased risk for recurrent GDM in subsequent pregnancies, as well as long-term risk of development of permanent type of diabetes and cardiovascular diseases [16,17]. Furthermore, children from pregnancies affected by GDM tend to have non-optimal body mass index (BMI) and impaired glucose tolerance or type 2 diabetes mellitus (T2DM) in early adulthood more often than those born to non-GDM mothers [18,19].
During physiological pregnancy, serum UA levels normally decrease until approximately the 24th week of gestation due to a substantial increase of glomerular filtration, decreased reabsorption in renal tubules, and the effect of estrogen; however, UA levels later return to normal around the term. UA transfers freely from maternal to fetal circulation, and negative correlations between offspring weight and UA levels were repeatedly described [20,21]. Rasika et al. [22] reported no significant correlation between UA levels in a period of 24–28th week of gestation and the risk of GDM development; however, early-pregnancy UA levels (before the 15th week of gestation) were significantly correlated with GDM risk, and UA levels before the 20th week of pregnancy were associated with GDM and mild preeclampsia [23]. Aker et al. [24] reported linear association of GDM or impaired glucose tolerance with first-trimester serum UA levels in Turkish women. Güngör et al. [25] described higher UA levels in GDM subjects compared to healthy controls in the 24th week of gestation; however, the difference was not statistically significant. Laughon et al. [26] associated increased UA levels with insulin resistance in mid-pregnancy, and hyperuricemia was associated with lower birth weight in the same study. Elevated UA levels were often associated with preeclampsia [27,28], and they were further shown to be a predictor for adverse maternal and perinatal outcomes in women with preeclampsia and hypertensive disorders [20,29,30]. However, a systematic review by Thangaratinam et al. [31] reported UA as a rather poor predictor. Amniotic fluid UA levels were shown to be a predictor of infant birth [32]; furthermore, higher UA levels were also associated with lower birth weight in normotensive women without insulin resistance (determined using a homeostatic model assessment for insulin resistance (HOMA-IR)) [33]. However, the evidence for the pathogenic relationship between gestational UA levels and child weight, preeclampsia, or hypertensive adverse pregnancy outcomes is scarce so far.
In summary, there is strong evidence that hyperuricemia is linked to metabolic syndrome and T2DM in the general population. However, the available knowledge regarding UA levels during pregnancy complicated by GDM and during postpartum period in women with GDM history is controversial so far. Recently, Leng at al. [34] assessed the risks of postpartum T2DM and prediabetes development among Chinese women with previous GDM and found positive linear association of serum UA as a continuous variable with the risks of T2DM or prediabetes in cubic spline models and also increased multivariable-adjusted odds ratios for diabetes risk across quartiles of serum UA. Previously published studies on the relationship between UA and GDM did not take into account other metabolites in the UA pathway (such as X levels) as a possible marker of XOR activity; thus, our aims were (i) to determine mid-gestational and early postpartum UA and X levels and compare them between pregnant women with or without GDM, (ii) to analyze the relationship between mid-gestational and postpartum UA levels and parameters related to glucose intolerance (i.e., fasting plasma glucose (FPG) and oral glucose tolerance test (oGTT) values), (iii) to analyze the relationship between UA levels and selected markers of metabolic syndrome, (iv) to evaluate the effect of UA on perinatal outcomes, and (v) to study possible genetic contributions (i.e., genotype–phenotype relationships) to UA levels in pregnancy mediated by selected SNPs in genes encoding UA transporters (ABCG2 rs2231142 and SLC2A9 rs1014290, rs12498742, rs16890979, and rs734553).

2. Results

2.1. Study Subjects and Stratification Criteria

A total of 143 pregnant Caucasian women were enrolled in the study. Controls (n = 34) were women with physiological pregnancies who passed routine GDM screening in mid-trimester with negative results. GDM cases (n = 109) were women that fulfilled GDM criteria in mid-gestational screening and who also participated in postpartum oGTT (within the period of six weeks to 12 months after delivery). The persistent postpartum disturbance of glucose metabolism was ascertained in 5.9% of post-GDM women within the time frame up to one year after delivery. Clinical and anthropometric characteristics of both study groups are provided in Table 1.
Women with FPG ≥ 7.0 mmol/L in mid-gestational oGTT were considered as having diabetes with the first recognition in pregnancy (DIP) according to reference [35]. DIP was present in 5.5% of our GDM cases. For the purpose of more detailed analysis, we stratified GDM cases for the risk of adverse perinatal outcomes into (a) low-risk group (n = 56; 51.4% of all GDM cases) and (b) high-risk group (n = 53; 48.6%) using the following criteria: need for insulin to compensate GDM and/or abnormal fetal growth and/or pre-gestational BMI > 30 and/or increased weight gain during pregnancy > 20 kg and/or hypertension.
Perinatal characteristics (gestational age at delivery, spontaneous or induced labor, length of delivery, caesarean section, Apgar score, cord-blood pH, and base excess) and data on post-delivery complications (manual lysis, revision of the uterine cavity, and hypotonia) were available for 91 women who gave birth at the Department of Obstetrics and Gynecology in the University Hospital Brno (of those, 57 were GDM cases and 34 controls). Gestational age at delivery before the 37th week was considered a preterm birth. Protracted delivery was considered as delivery exceeding 480 min. Apgar score below 5 in the fifth minute after delivery, an umbilical cord-blood pH immediately after birth below 7.1, and base excess below −12 were considered pathological.

2.2. Comparison of Biochemical and Anthropometrical Data

GDM women were significantly elder than women in the control group; however, there was no statistically significant difference in pre-gestational BMI (p = 0.040 and p = not significant (NS), respectively, Mann–Whitney). History of previous GDM and family history of diabetes mellitus (DM) was higher in GDM women (p = 0.009 and p < 10−4, Fisher exact test). In line with many previous reports, weight gain during pregnancy and also offspring birth weight were lower in the GDM group compared to the control group (p < 10−6 and p = 0.032, respectively, Mann–Whitney), most likely as a result of good compliance of women with newly diagnosed GDM following dietary recommendations (see Table 1). None of our study participants had clinical hyperuricemia either at mid-trimester (the threshold for UA is 262 μmol/L according to Abbassi-Ghanavati et al. [36]) or postpartum (the threshold is 360 μmol/L).
X levels during pregnancy were positively correlated with mid-gestational BMI, 1-h post-load plasma glucose (1-h PPG), and 2-h post load plasma glucose (2-h PPG) (r = 0.18, p = 0.037; r = 0.28, p = 0.033; and r = 0.23, p =0.0092, respectively, Spearman correlation coefficient). In both groups, X levels were higher postpartum compared to mid-gestation (both p < 0.001, Wilcoxon test). Furthermore, X levels were significantly higher in the GDM group compared to the control group during pregnancy, as well as postpartum (p = 0.049 and p = 0.0002, respectively, Mann–Whitney; see Table 1). However, the intrinsic difference (in the nanomolar range) was negligible and, therefore, biologically likely irrelevant despite being statistically significant. Similarly, UA levels were increased in both groups postpartum compared to their mid-pregnancy levels (both p < 10−4, Wilcoxon test); however, no statistically significant differences in UA levels were found between the GDM and control groups during pregnancy or postpartum (both p = NS, Mann–Whitney; see Table 1). UA levels in mid-pregnancy were positively correlated with pre-gestational BMI, FPG, 2-h PPG, and area under the curve (AUC) of oGTT in mid-trimester in group of GDM women (r = 0.23, p = 0.018; r = 0.36, p = 0.00012; r = 0.21, p = 0.029; and r = 0.35, p = 0.00022, respectively, Spearman correlation coefficient), but none of these correlations were significant in the control group (all p = NS, Spearman correlation coefficient). The oGTT in the period of six weeks to 12 months postpartum was available only for post-GDM women whose postpartum UA levels were positively correlated with FPG, 2-h PPG, and AUC of postpartum oGTT (r = 0.25, p = 0.012; r = 0.25, p = 0.011; and r = 0.31, p = 0.0016, respectively, Spearman correlation coefficient) and also with pre-gestational BMI (r = 0.27, p = 0.0041, Spearman correlation coefficient).

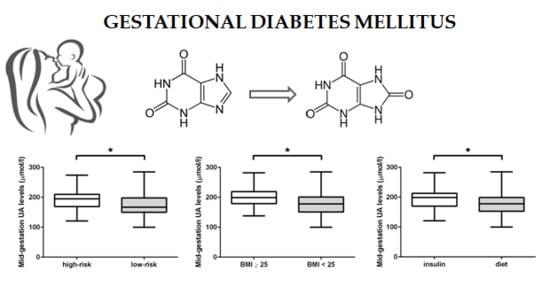
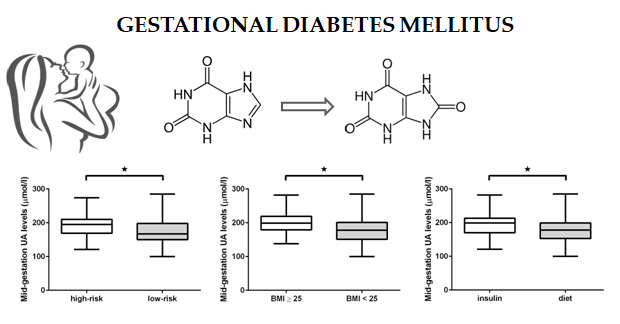
2.3. GDM Sub-Group Analysis

Given that the exact pathophysiological background of GDM is still unclear, and that UA levels exhibit high inter-individual variability, we performed in-depth analyses of UA levels on the stratified patient population, i.e., high vs. low risk of adverse perinatal outcomes GDM groups, and also considering the risk criteria/parameters individually. X levels were intrinsic again (in the nanomolar range) and, therefore, biologically likely irrelevant despite being statistically significant; as such, the results are not shown. Considering individual criteria, UA levels during pregnancy and also postpartum were significantly higher in GDM women with the occurrence of pre-gestational overweight or obesity (BMI ≥ 25) (p = 0.0088 and p = 0.041, respectively, Mann–Whitney). Moreover, when the sub-group of GDM treated by insulin was assessed separately, pre-gestational BMI and UA levels both during pregnancy and postpartum were higher (p = 0.039, p = 0.041, and p = 0.049, respectively, Mann–Whitney) in the sub-group requiring insulin to maintain optimal glucose levels compared to GDM women on diet only. Otherwise, no statistically significant differences between UA levels were found in the sub-group of GDM women with DIP and those who developed postpartum glucose metabolism disturbance within one year after delivery; however, both sub-groups were very small and, thus, both comparisons lack statistical power. Upon stratification of GDM women for increased risk of perinatal outcomes using the multiparametric risk classifier, the high-risk GDM group had higher mid-gestation UA levels (p = 0.02, Mann–Whitney), together with higher FPG, AUC of mid-gestational oGTT, and higher AUC of postpartum oGTT (p = 0.0022, p = 0.0067, and p = 0.049, respectively, Mann–Whitney).

2.4. Labor and Perinatal Outcome Data

Gestational age at delivery, occurrence of premature labor, and the incidence of spontaneous onset of labor, protracted delivery, post-delivery complications (manual lysis, revision of the uterine cavity, and hypotonia), pathological Apgar score, abnormalities of cord-blood pH, and base excess did not differ between women with and without GDM (all p = NS, Mann–Whitney or Fisher exact test; see Table 2). Solely gestational age at delivery was negatively correlated to UA and X levels postpartum (r = −0.22, p = 0.021 and r = −0.22, p =0.020, respectively, Spearman correlation coefficient), but none of the other listed outcomes were associated with either UA or X levels (all p = NS, Mann–Whitney). The caesarean section rate was significantly higher in a group of GDM women (p = 0.043, Fisher exact test; see Table 2), and postpartum X levels were significantly higher in a group of women who underwent caesarean section (p = 0.039, Mann–Whitney).

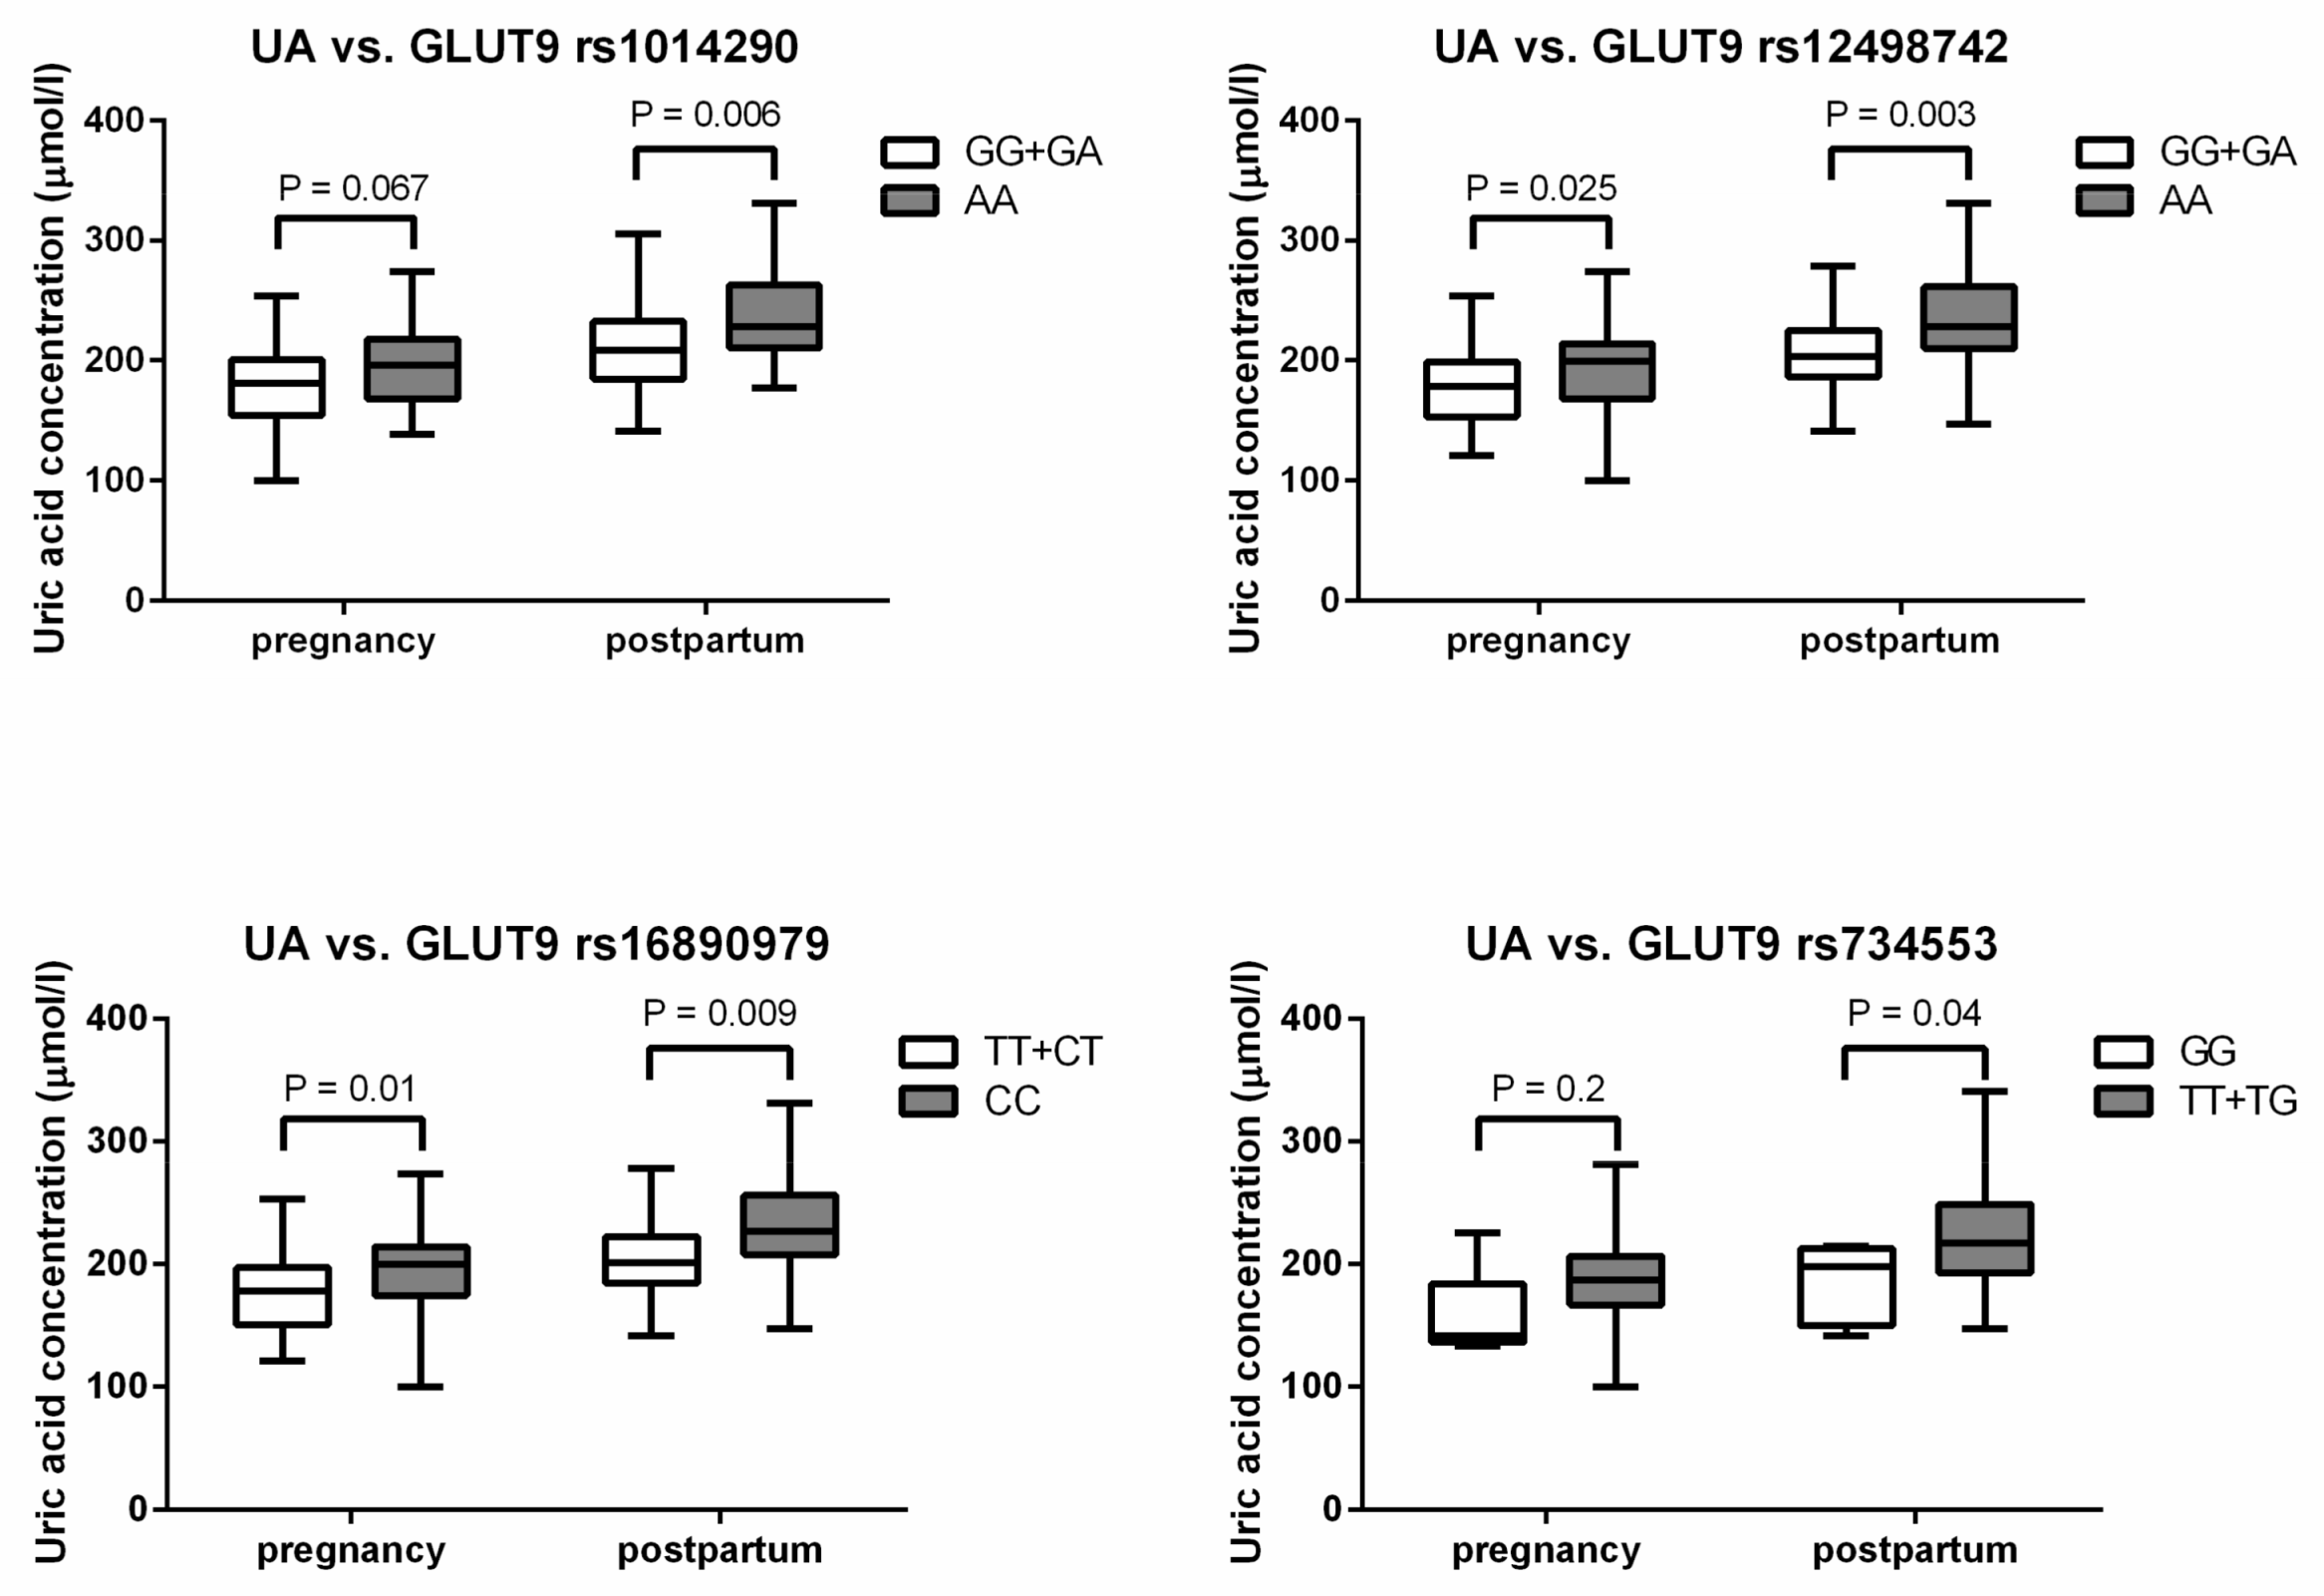
2.5. Analyses of Selected SNPs in UA Transporters

Genotype frequencies of four of a total of five studied SNPs were in Hardy–Weinberg equilibrium (p > 0.05, chi-square); rs12498742 deviated from Hardy–Weinberg equilibrium in the control group due to the small size of this group. Neither genotype nor allele distributions of the studied SNPs differed between GDM women and controls (all p = NS, chi-square; see Table 3).
Furthermore, genotype–phenotype relationships were analyzed for all studied SNPs. UA levels differed significantly between carriers of genotypes of GLUT9 rs1014290 and rs12498742 postpartum, and rs734553 and rs16890979 both during pregnancy and postpartum (p = 0.0053, p = 0.0017, p = 0.024, p = 0.0043, p = 0.024, and p = 0.0043, respectively, Kruskal–Wallis ANOVA). Borderline significance was found for rs1014290 and rs12498742 in GLUT9 during pregnancy (p = 0.050 and p = 0.096, respectively, Kruskal–Wallis ANOVA). Allele G in rs1014290 and rs12498742, allele T in rs16890979, and homozygote GG in rs734553 in GLUT9 were associated with lower UA levels, as shown in Figure 1.
When we analyzed those genotypes that were correlated with increased levels of UA simultaneously (AA in rs1014290 and rs12498742, CC in rs16890979, and allele T in rs734553), we found increased levels of UA during pregnancy and also postpartum (p = 0.035 and p = 0.016, Mann–Whitney test). However, the presence of GDM cases did not differ between those genotype carriers (p = NS, Fisher exact test).

3. Discussion

Abnormalities of UA metabolism and handling are implicated in the pathogenesis of metabolic syndrome and diabetes. Since previous, albeit so far inconclusive, studies on UA metabolism in GDM indicated a possible link, we designed the current study with the aim of replicating eventual findings on another (central European in this case) population and to extend the research on other metabolites (xanthine) and putative genetic determinants. Here, we report the results of the study combining case-control and a follow-up approach including also selected offspring data to provide as complex as possible a picture of UA involvement in most common pregnancy complications and metabolic outcomes. Major findings of the current study can be summarized as follows: (i) UA levels were higher in women with pre-gestational overweight/obesity, in the high-risk group (as defined earlier), and in those who required insulin therapy; (ii) UA levels were positively correlated with BMI and glycemia both during pregnancy and postpartum; (iii) gestational age at delivery was negatively correlated with UA levels postpartum; and (iv) the genetic component for UA levels was confirmed for rs1014290, rs12498742, rs734553, and rs16890979 in GLUT9 (encoded by the SLC2A9 gene).
Unlike in other species and most mammals, both UA and X are waste products in humans and higher primates. Other purines including hypoxanthine can be reincorporated into the cell pool and are salvaged from the blood [37]. UA also undergoes reabsorption in the kidney and serves several physiological purposes including antioxidant/radical-scavenging capacity, blood pressure regulation, or blood–brain barrier stabilization [1,38,39]. On the contrary, hyperuricemia was proposed as a significant contributor to pro-inflammatory endocrine imbalance in adipose tissue leading to a low-grade inflammation and insulin resistance present in metabolic syndrome [40], and the importance of UA metabolism in diabetes was shown as the inhibition of UA synthesis ameliorates metabolic syndrome and increases insulin sensitivity [41,42].
There are two possible mechanisms for hyperuricemia worsening hyperinsulinemia and aggravating glucose metabolism disturbances: (i) through UA-mediated inhibition of NO generation via several mechanisms [43] (insulin-stimulated release of NO from endothelia mediates glucose uptake into the skeletal muscle); and (ii) through UA-mediated inflammatory and oxidative changes in adipocytes [44]. It was shown that mature adipocytes produce and secrete UA [45], and that obesity is associated with increased gene expression of XOR and UA secretion [46]. Moreover, higher waist circumference accompanied by higher leptin production was previously associated with high UA levels [47,48]. An alternative hypothesis assumes that hyperinsulinemia is often associated with hypertriglyceridemia, which is linked to the synthesis of fatty acids in the liver and also to increased de novo purine synthesis, thus giving rise to increased UA levels [49,50]. UA also inhibits AMP-activated protein kinase [51] and stimulates hepatic lipogenesis [52]. Strong positive correlations between UA levels and pre-gestational BMI, and also higher UA levels among GDM women with the occurrence of pre-gestational obesity in our study are, thus, not surprising, because obesity and metabolic syndrome are associated with low-grade chronic inflammation, and increased UA levels could act as a protection against moderate oxidative stress resulting from this situation.
Similarly to others [22,25], we did not find increased UA levels during mid-trimester or postpartum in GDM women compared to controls. Among GDM women, UA levels were positively correlated with pre-gestational BMI, and respective glycemia levels in oGTT and elevated UA levels were also found in women with pre-gestational overweight/obesity, those who required insulin therapy, and women with increased risk for adverse perinatal outcomes. The DIP group and also the group of participants with postpartum glucose metabolism disturbance were unfortunately small, thus impacting on statistical power to detect significant differences in X and UA levels. Therefore, despite a clear association of UA levels with the high-risk GDM subtype regarding the perinatal outcomes, the predictive potential of UA for permanent diabetes development in post-GDM women still remains a question. Molęda et al. [53] reported a possible link between disturbances in carbohydrate metabolism in post-GDM women which were highly correlated with increased UA levels. Similarly to our research, Molęda et al. [53] described a connection between higher UA levels and overweight, obesity, and severity of carbohydrate abnormalities, as well as a positive correlation with respective parameters of oGTT; however, this study did not contain data about UA in an early postpartum period.
Despite the fact that increased insulin resistance (physiologically occurring in the mid-trimester) is positively associated with UA levels even in non-pregnant subjects [54], our results show that X and UA levels raised postpartum in both groups. Lower mid-gestation UA levels are most likely mediated by pregnancy-induced hypervolemia and gestational changes in the renal system (highest increase in extracellular fluid volume, renal blood flow, and glomerular filtration rate coinciding with the second trimester) [55]. Lower UA levels during pregnancy can be also related to higher rates of oxidative stress [56] and subsequent UA consumption as a potent antioxidant. Studied perinatal outcomes of the GDM and non-GDM groups were comparable except for the rate of caesarean section, which was higher in GDM group. No associations of mid-gestational UA levels with pathological values of perinatal outcomes were found; only postpartum levels of X and UA were negatively correlated with gestational age at delivery, and postpartum X levels were significantly higher in a group of women who underwent caesarean section. It should be noted that we registered only several specific neonatal complications; thus, neonatal morbidity may have been higher in total.
In genome-wide association studies, more than 30 loci associated with UA levels were identified, so far explaining 7% of UA variability between individuals [9]. For example, different polymorphisms were identified in the SLC2A9 gene (GLUT9) encoding a glucose and UA transporter [11,57]. Moreover, rs1014290 in this gene was already associated with decreased T2DM risk in women [58]. In our study, there were no differences in genotype or allele frequencies between GDM women and controls in any of the SNPs analyzed. However, UA levels differed between carriers of genotypes in rs1014290, rs12498742, rs16890979, and rs734553 in GLUT9 postpartum; the statistical significance during pregnancy was lower than 10% in rs1014290, rs12498742, and rs16890979, and could be considered as borderline significant. Four different SNPs in GLUT9 were associated with lower UA levels (allele G in rs1014290 and rs12498742, allele T in rs16890979, and genotype GG in rs734553).
Compared to UA, little is known about X levels in human plasma and the effect of XOR activity on them. We described slightly higher X levels in GDM women during pregnancy and postpartum that may point to increased XOR activity, but this result has to be evaluated. The pro-oxidant and pro-inflammatory actions attributed to UA could be a result of the conversion of X dehydrogenase to X oxidase and the consequent accumulation of reactive oxygen species [1]; thus, the role of X requires further studies. There are certain limitations of current study, such as a relatively small size of the control group (probably explaining the disturbance in Hardy–Weinberg equilibrium) and a lack of participants with physiological pregnancy who passed voluntary postpartum oGTT. Furthermore, the one-year-long postpartum follow-up of post-GDM women was probably too short period to observe the conversion into a permanent type of diabetes, as documented by several studies [16,17].

4. Materials and Methods

4.1. Characteristics of Study Subjects

The case-control study comprised a total of 143 pregnant Caucasian women enrolled from a defined geographical area (South Moravian district of Czech Republic). The study was performed in accordance with the principles of the Declaration of Helsinki and was approved by the Ethical Committee of Faculty of Medicine, Masaryk University Brno (approval number 22/2010, date of approval 16 September 2010). Informed consent was obtained from all subjects prior to their inclusion in the study. Exclusion criteria were type 1 diabetes, latent autoimmune diabetes of adults (LADA), maturity-onset diabetes of the young (MODY), or T2DM before pregnancy, non-Caucasian origin, hypertensive disorders prior to pregnancy, multiple pregnancies, and severe comorbidities. Controls (n = 34) were women with physiological pregnancies who passed routine GDM screening in mid-trimester with negative results. GDM cases (n = 109) were women that fulfilled GDM criteria in mid-gestational screening and who also participated in postpartum oGTT (within the period of six weeks to 12 months after delivery). All women underwent mandatory oGTT between the 24th and 28th weeks of pregnancy. Mid-gestational GDM screening was carried out using oGTT with 75 g of glucose load between the 24th and 28th weeks of pregnancy with the following thresholds (modified World Health Organization (WHO) criteria at the time of enrolment in 2012–2013): FPG > 5.6 mmol/L, 1-h PPG > 8.9 mmol/L, and 2-h PPG > 7.8 mmol/L. GDM women were followed from the time of GDM diagnosis until giving birth at the Diabetes Centre of the University Hospital Brno. The treatment for GDM included diet in all cases; 37.8% of GDM cases required insulin therapy. Glucose responses during oGTT were calculated from the area under the curve (AUC) using the trapezoidal rule. Postpartum screening was carried out from six weeks to 12 months after delivery, and diagnosis of diabetes/prediabetes was based on the WHO criteria for non-pregnant subjects: FPG ≥ 7 mmol/L alone or 2-h PPG ≥ 11.1 mmol/L for DM, and FPG 5.6–6.9 mmol/L or 2-h PPG 7.8–11.0 mmol/L for prediabetes.

4.2. Blood Sampling, and Uric Acid and Xanthine Measurement

Samples of peripheral ethylenediaminetetraacetic acid (EDTA)/blood were taken from each study participant during their scheduled visit to the prenatal or diabetes center at mid-trimester (between the 24th and 28th weeks of pregnancy) and repeatedly from six weeks to 12 months postpartum in the post-GDM group only. Plasma was separated by centrifugation (1000× g, 10 min, 4 °C) and stored at −75 °C until analysis. Plasma UA and X levels were determined using reversed-phase HPLC with ultraviolet detector (HPLC-UV) with a photo-diode array detector, as previously published [59].

4.3. Genetic Analysis

The phenol–chloroform method was used for DNA extraction from peripheral blood leukocytes. Five SNPs in genes for UA transporters ABCG2 and SLC2A9 (encoding GLUT9) were selected based on their reported significance for UA transport. SNPs were genotyped by polymerase chain reaction with fluorescent-based chemistry (TaqMan® SNP Genotyping Assay, Applied Biosystems, California, USA) according to the manufacturer’s instructions. Genotyping was performed using ABI Prism 7000 (Thermo Fisher Scientific, Waltham, MA, USA). Details on studied SNPs are provided in Table 3.

4.4. Statistics

Data were expressed as medians and interquartile ranges (IQR) or proportions. Nonparametric tests were used for comparison between and within the groups (Mann–Whitney test, Fisher exact test, Kruskal–Wallis ANOVA, and Wilcoxon test). Correlations were computed using Spearman correlation coefficients. Chi-square test was used for contingency tables. The Statistica software (StatSoft, Tulsa, OK, USA) was used for all analyses. A p-value <0.05 was considered as statistically significant.

5. Conclusions

Our data suggest an association of UA levels with impaired glucose tolerance within GDM women during pregnancy. The correlations of UA levels among GDM women with respective glycemia levels in oGTT show a link between UA levels and impaired glucose metabolism during pregnancy. Furthermore, the positive correlation of pre-gestational BMI with UA levels and GDM diagnosis provides the possible connection among overweight/obesity, low-grade inflammation, hyperuricemia, and impaired glucose tolerance. Higher levels of UA in a sub-group of GDM patients treated by insulin in pregnancy and within the risk group for adverse perinatal outcomes point to possible UA metabolism disturbance associated with a more severe glucose homeostasis problem. We described genotype–phenotype associations between SNPs in UA transporter GLUT9 (encoded by the SLC2A9 gene) and UA levels. The putative effect of UA levels on permanent type diabetes risk requires further study because only 5.9% of women developed a persistent form of DM within the first year after delivery.

Author Contributions

A.P., HPLC analysis, statistics, and writing—original draft preparation; V.B., sample collection, database administration, and conceptualization; K.C., sample processing, and analysis of selected SNPs; L.P., sample processing, and draft preparation; K.K., writing—review and editing, supervision, and funding; J.T., writing—review and editing, and project administration.

Funding

This work was supported by the Ministry of Health of the Czech Republic, grant number 16-28040A.

Acknowledgments

The authors would like to thank Stanislav Brejcha, Zuzana Nova, and Martina Hanouskova for excellent technical assistance, as well as clinical collaborator Jana Belobradkova. Anna Pleskacova was supported by a student project grant of Masaryk University MUNI/A/0910/2017.

Conflicts of Interest

The authors declare no conflicts of interest.

Abbreviations

1-h PPG1-h post-load plasma glucose
2-h PPG2-h post-load plasma glucose
ABCG2ATP-binding cassette subfamily G member 2
AMPadenosine monophosphate
ANOVAanalysis of variance
AUCarea under the curve
BMIbody mass index
DIPdiabetes in pregnancy
DMdiabetes mellitus
DNAdeoxyribonucleic acid
EDTAethylenediaminetetraacetic acid
FPGfasting plasma glucose
GDMgestational diabetes mellitus
GLUT9glucose transporter 9
HOMA-IRhomeostatic model assessment for insulin resistance
HPLC-UVhigh-performance liquid chromatography with ultraviolet detector
IQRinterquartile ranges
LADAlatent autoimmune diabetes of adults
MAFminor allele frequency
MODYmaturity-onset diabetes of the young
NSnot significant
oGTToral glucose tolerance test
pprobability
SLC2A9solute carrier family 2 member 9
SNPssingle-nucleotide polymorphisms
T2DMtype 2 diabetes mellitus
UAuric acid
WHOWorld Health Organization
Xxanthine
XORxanthine oxidoreductase

References

  1. Maiuolo, J.; Oppedisano, F.; Gratteri, S.; Muscoli, C.; Mollace, V. Regulation of uric acid metabolism and excretion. Int. J. Cardiol. 2016, 213, 8–14. [Google Scholar] [CrossRef] [PubMed]
  2. Morgan, E.J.; Stewart, C.P.; Hopkins, F.G. On the Anaerobic and Aerobic Oxidation of Xanthin and Hypoxanthin by Tissues and by Milk. Proc. R. Soc. Lond. B Biol. Sci. 1922, 94, 109–131. [Google Scholar] [CrossRef] [Green Version]
  3. Su, J.; Wei, Y.; Liu, M.; Liu, T.; Li, J.; Ji, Y.; Liang, J. Anti-hyperuricemic and nephroprotective effects of Rhizoma Dioscoreae septemlobae extracts and its main component dioscin via regulation of mOAT1, mURAT1 and mOCT2 in hypertensive mice. Arch. Pharm. Res. 2014, 37, 1336–1344. [Google Scholar] [CrossRef] [PubMed]
  4. Hayden, M.R.; Tyagi, S.C. Uric acid: A new look at an old risk marker for cardiovascular disease, metabolic syndrome, and type 2 diabetes mellitus: The urate redox shuttle. Nutr. Metab. 2004, 1, 10. [Google Scholar] [CrossRef] [PubMed] [Green Version]
  5. Onat, A.; Uyarel, H.; Hergenç, G.; Karabulut, A.; Albayrak, S.; Sari, I.; Yazici, M.; Keleş, I. Serum uric acid is a determinant of metabolic syndrome in a population-based study. Am. J. Hypertens. 2006, 19, 1055–1062. [Google Scholar] [CrossRef] [PubMed]
  6. Sui, X.; Church, T.S.; Meriwether, R.A.; Lobelo, F.; Blair, S.N. Uric acid and the development of metabolic syndrome in women and men. Metabolism 2008, 57, 845–852. [Google Scholar] [CrossRef] [PubMed] [Green Version]
  7. Costa, A.; Igualá, I.; Bedini, J.; Quintó, L.; Conget, I. Uric acid concentration in subjects at risk of type 2 diabetes mellitus: Relationship to components of the metabolic syndrome. Metabolism 2002, 51, 372–375. [Google Scholar] [CrossRef] [PubMed]
  8. Ryo, M.; Nakamura, T.; Kihara, S.; Kumada, M.; Shibazaki, S.; Takahashi, M.; Nagai, M.; Matsuzawa, Y.; Funahashi, T. Adiponectin as a biomarker of the metabolic syndrome. Circ. J. 2004, 68, 975–981. [Google Scholar] [CrossRef] [PubMed]
  9. Köttgen, A.; Albrecht, E.; Teumer, A.; Vitart, V.; Krumsiek, J.; Hundertmark, C.; Pistis, G.; Ruggiero, D.; O’Seaghdha, C.M.; Haller, T.; et al. Genome-wide association analyses identify 18 new loci associated with serum urate concentrations. Nat. Genet. 2013, 45, 145–154. [Google Scholar] [CrossRef] [PubMed] [Green Version]
  10. Li, S.; Sanna, S.; Maschio, A.; Busonero, F.; Usala, G.; Mulas, A.; Lai, S.; Dei, M.; Orrù, M.; Albai, G.; et al. The GLUT9 gene is associated with serum uric acid levels in Sardinia and Chianti cohorts. PLoS Genet. 2007, 3, e194. [Google Scholar] [CrossRef] [PubMed]
  11. Döring, A.; Gieger, C.; Mehta, D.; Gohlke, H.; Prokisch, H.; Coassin, S.; Fischer, G.; Henke, K.; Klopp, N.; Kronenberg, F.; et al. SLC2A9 influences uric acid concentrations with pronounced sex-specific effects. Nat. Genet. 2008, 40, 430–436. [Google Scholar] [CrossRef] [PubMed]
  12. Woodward, O.M.; Köttgen, A.; Coresh, J.; Boerwinkle, E.; Guggino, W.B.; Köttgen, M. Identification of a urate transporter, ABCG2, with a common functional polymorphism causing gout. Proc. Natl. Acad. Sci. USA 2009, 106, 10338–10342. [Google Scholar] [CrossRef] [PubMed] [Green Version]
  13. Chiefari, E.; Arcidiacono, B.; Foti, D.; Brunetti, A. Gestational diabetes mellitus: An updated overview. J. Endocrinol. Investig. 2017, 40, 899–909. [Google Scholar] [CrossRef] [PubMed]
  14. Association, A.D. 2. Classification and Diagnosis of Diabetes. Diabetes Care 2018, 41, S13–S27. [Google Scholar] [CrossRef] [PubMed]
  15. Catalano, P.M.; Ehrenberg, H.M. The short- and long-term implications of maternal obesity on the mother and her offspring. BJOG 2006, 113, 1126–1133. [Google Scholar] [CrossRef] [PubMed]
  16. Bellamy, L.; Casas, J.P.; Hingorani, A.D.; Williams, D. Type 2 diabetes mellitus after gestational diabetes: A systematic review and meta-analysis. Lancet 2009, 373, 1773–1779. [Google Scholar] [CrossRef]
  17. Kaaja, R.; Rönnemaa, T. Gestational diabetes: Pathogenesis and consequences to mother and offspring. Rev. Diabet. Stud. 2008, 5, 194–202. [Google Scholar] [CrossRef] [PubMed]
  18. Group, H.S.C.R. The Hyperglycemia and Adverse Pregnancy Outcome (HAPO) Study. Int. J. Gynaecol. Obstet. 2002, 78, 69–77. [Google Scholar]
  19. Retnakaran, R.; Qi, Y.; Connelly, P.W.; Sermer, M.; Zinman, B.; Hanley, A.J. Glucose intolerance in pregnancy and postpartum risk of metabolic syndrome in young women. J. Clin. Endocrinol. Metab. 2010, 95, 670–677. [Google Scholar] [CrossRef] [PubMed]
  20. Roberts, J.M.; Bodnar, L.M.; Lain, K.Y.; Hubel, C.A.; Markovic, N.; Ness, R.B.; Powers, R.W. Uric acid is as important as proteinuria in identifying fetal risk in women with gestational hypertension. Hypertension 2005, 46, 1263–1269. [Google Scholar] [CrossRef] [PubMed]
  21. Chang, F.M.; Chow, S.N.; Huang, H.C.; Hsieh, F.J.; Chen, H.Y.; Lee, T.Y.; Ouyang, P.C.; Chen, Y.P. The placental transfer and concentration difference in maternal and neonatal serum uric acid at parturition: Comparison of normal pregnancies and gestosis. Biol. Res. Pregnancy Perinatol. 1987, 8, 35–39. [Google Scholar] [PubMed]
  22. Rasika, C.; Samal, S.; Ghose, S. Association of Elevated first Trimester Serum Uric Acid Levels with Development of GDM. J. Clin. Diagn. Res. 2014, 8, OC01–OC05. [Google Scholar] [CrossRef]
  23. Wolak, T.; Sergienko, R.; Wiznitzer, A.; Paran, E.; Sheiner, E. High uric acid level during the first 20 weeks of pregnancy is associated with higher risk for gestational diabetes mellitus and mild preeclampsia. Hypertens. Pregnancy 2012, 31, 307–315. [Google Scholar] [CrossRef] [PubMed]
  24. Şahin Aker, S.; Yüce, T.; Kalafat, E.; Seval, M.; Söylemez, F. Association of first trimester serum uric acid levels gestational diabetes mellitus development. Turk. J. Obstet. Gynecol. 2016, 13, 71–74. [Google Scholar] [CrossRef] [PubMed]
  25. Güngör, E.S.; Danişman, N.; Mollamahmutoğlu, L. Relationship between serum uric acid, creatinine, albumin and gestational diabetes mellitus. Clin. Chem. Lab. Med. 2006, 44, 974–977. [Google Scholar] [CrossRef] [PubMed]
  26. Laughon, S.K.; Catov, J.; Roberts, J.M. Uric acid concentrations are associated with insulin resistance and birthweight in normotensive pregnant women. Am. J. Obstet. Gynecol. 2009, 201, 582.e1–582.e6. [Google Scholar] [CrossRef] [PubMed] [Green Version]
  27. Bainbridge, S.A.; Roberts, J.M. Uric acid as a pathogenic factor in preeclampsia. Placenta 2008, 29 (Suppl. A), S67–S72. [Google Scholar] [CrossRef]
  28. Laughon, S.K.; Catov, J.; Powers, R.W.; Roberts, J.M.; Gandley, R.E. First trimester uric acid and adverse pregnancy outcomes. Am. J. Hypertens. 2011, 24, 489–495. [Google Scholar] [CrossRef] [PubMed]
  29. Livingston, J.R.; Payne, B.; Brown, M.; Roberts, J.M.; Côté, A.M.; Magee, L.A.; von Dadelszen, P.; Group, P.S. Uric Acid as a predictor of adverse maternal and perinatal outcomes in women hospitalized with preeclampsia. J. Obstet. Gynaecol. Can. 2014, 36, 870–877. [Google Scholar] [CrossRef]
  30. Kumar, N.; Singh, A.K.; Maini, B. Impact of maternal serum uric acid on perinatal outcome in women with hypertensive disorders of pregnancy: A prospective study. Pregnancy Hypertens. 2017, 10, 220–225. [Google Scholar] [CrossRef] [PubMed]
  31. Thangaratinam, S.; Ismail, K.M.; Sharp, S.; Coomarasamy, A.; Khan, K.S. Accuracy of serum uric acid in predicting complications of pre-eclampsia: A systematic review. BJOG 2006, 113, 369–378. [Google Scholar] [CrossRef] [PubMed]
  32. Gao, T.; Zablith, N.R.; Burns, D.H.; Skinner, C.D.; Koski, K.G. Second trimester amniotic fluid transferrin and uric acid predict infant birth outcomes. Prenat. Diagn. 2008, 28, 810–814. [Google Scholar] [CrossRef] [PubMed]
  33. Nasri, K.; Razavi, M.; Rezvanfar, M.R.; Mashhadi, E.; Chehrei, A.; Mohammadbeigi, A. Mid-gestational serum uric acid concentration effect on neonate birth weight and insulin resistance in pregnant women. Int. J. Crit. Illn. Inj. Sci. 2015, 5, 17–20. [Google Scholar] [CrossRef] [PubMed]
  34. Leng, J.; Wang, L.; Wang, J.; Li, W.; Liu, H.; Zhang, S.; Li, L.; Tian, H.; Xun, P.; Yang, X.; et al. Uric acid and diabetes risk among Chinese women with a history of gestational diabetes mellitus. Diabetes Res. Clin. Pract. 2017, 134, 72–79. [Google Scholar] [CrossRef] [PubMed]
  35. Corrado, F.; Pintaudi, B.; D'Anna, R.; Santamaria, A.; Giunta, L.; Di Benedetto, A. Perinatal outcome in a Caucasian population with gestational diabetes and preexisting diabetes first diagnosed in pregnancy. Diabetes Metab. 2016, 42, 122–125. [Google Scholar] [CrossRef] [PubMed]
  36. Abbassi-Ghanavati, M.; Greer, L.G.; Cunningham, F.G. Pregnancy and laboratory studies: A reference table for clinicians. Obstet. Gynecol. 2009, 114, 1326–1331. [Google Scholar] [CrossRef] [PubMed]
  37. Stone, T.W.; Simmonds, H.A. Purines: Basic and Clinical Aspects; Kluwer Academic: Dordrecht, The Netherlands; London, UK, 1991; 257p. [Google Scholar]
  38. Fang, P.; Li, X.; Luo, J.J.; Wang, H.; Yang, X.F. A Double-edged Sword: Uric Acid and Neurological Disorders. Brain Disord. Ther. 2013, 2, 109. [Google Scholar] [CrossRef] [PubMed]
  39. Sautin, Y.Y.; Johnson, R.J. Uric acid: The oxidant-antioxidant paradox. Nucleosides Nucleotides Nucleic Acids 2008, 27, 608–619. [Google Scholar] [CrossRef] [PubMed]
  40. Baldwin, W.; McRae, S.; Marek, G.; Wymer, D.; Pannu, V.; Baylis, C.; Johnson, R.J.; Sautin, Y.Y. Hyperuricemia as a mediator of the proinflammatory endocrine imbalance in the adipose tissue in a murine model of the metabolic syndrome. Diabetes 2011, 60, 1258–1269. [Google Scholar] [CrossRef] [PubMed]
  41. Meshkani, R.; Zargari, M.; Larijani, B. The relationship between uric acid and metabolic syndrome in normal glucose tolerance and normal fasting glucose subjects. Acta Diabetol. 2011, 48, 79–88. [Google Scholar] [CrossRef] [PubMed]
  42. Dogan, A.; Yarlioglues, M.; Kaya, M.G.; Karadag, Z.; Dogan, S.; Ardic, I.; Dogdu, O.; Kilinc, Y.; Zencir, C.; Akpek, M.; et al. Effect of long-term and high-dose allopurinol therapy on endothelial function in normotensive diabetic patients. Blood Press. 2011, 20, 182–187. [Google Scholar] [CrossRef] [PubMed]
  43. Johnson, R.J.; Nakagawa, T.; Sanchez-Lozada, L.G.; Shafiu, M.; Sundaram, S.; Le, M.; Ishimoto, T.; Sautin, Y.Y.; Lanaspa, M.A. Sugar, uric acid, and the etiology of diabetes and obesity. Diabetes 2013, 62, 3307–3315. [Google Scholar] [CrossRef] [PubMed]
  44. Sautin, Y.Y.; Nakagawa, T.; Zharikov, S.; Johnson, R.J. Adverse effects of the classic antioxidant uric acid in adipocytes: NADPH oxidase-mediated oxidative/nitrosative stress. Am. J. Physiol. Cell Physiol. 2007, 293, C584–C596. [Google Scholar] [CrossRef] [PubMed]
  45. Tsushima, Y.; Nishizawa, H.; Tochino, Y.; Nakatsuji, H.; Sekimoto, R.; Nagao, H.; Shirakura, T.; Kato, K.; Imaizumi, K.; Takahashi, H.; et al. Uric acid secretion from adipose tissue and its increase in obesity. J. Biol. Chem. 2013, 288, 27138–27149. [Google Scholar] [CrossRef] [PubMed]
  46. Cheung, K.J.; Tzameli, I.; Pissios, P.; Rovira, I.; Gavrilova, O.; Ohtsubo, T.; Chen, Z.; Finkel, T.; Flier, J.S.; Friedman, J.M. Xanthine oxidoreductase is a regulator of adipogenesis and PPARgamma activity. Cell Metab. 2007, 5, 115–128. [Google Scholar] [CrossRef] [PubMed]
  47. Fruehwald-Schultes, B.; Peters, A.; Kern, W.; Beyer, J.; Pfützner, A. Serum leptin is associated with serum uric acid concentrations in humans. Metabolism 1999, 48, 677–680. [Google Scholar] [CrossRef]
  48. Bedir, A.; Topbas, M.; Tanyeri, F.; Alvur, M.; Arik, N. Leptin might be a regulator of serum uric acid concentrations in humans. Jpn. Heart J. 2003, 44, 527–536. [Google Scholar] [CrossRef] [PubMed]
  49. de Oliveira, E.P.; Burini, R.C. High plasma uric acid concentration: Causes and consequences. Diabetol. Metab. Syndr. 2012, 4, 12. [Google Scholar] [CrossRef] [PubMed]
  50. Matsuura, F.; Yamashita, S.; Nakamura, T.; Nishida, M.; Nozaki, S.; Funahashi, T.; Matsuzawa, Y. Effect of visceral fat accumulation on uric acid metabolism in male obese subjects: Visceral fat obesity is linked more closely to overproduction of uric acid than subcutaneous fat obesity. Metabolism 1998, 47, 929–933. [Google Scholar] [CrossRef]
  51. Lanaspa, M.A.; Cicerchi, C.; Garcia, G.; Li, N.; Roncal-Jimenez, C.A.; Rivard, C.J.; Hunter, B.; Andrés-Hernando, A.; Ishimoto, T.; Sánchez-Lozada, L.G.; et al. Counteracting roles of AMP deaminase and AMP kinase in the development of fatty liver. PLoS ONE 2012, 7, e48801. [Google Scholar] [CrossRef] [PubMed]
  52. Lanaspa, M.A.; Sanchez-Lozada, L.G.; Choi, Y.J.; Cicerchi, C.; Kanbay, M.; Roncal-Jimenez, C.A.; Ishimoto, T.; Li, N.; Marek, G.; Duranay, M.; et al. Uric acid induces hepatic steatosis by generation of mitochondrial oxidative stress: Potential role in fructose-dependent and -independent fatty liver. J. Biol. Chem. 2012, 287, 40732–40744. [Google Scholar] [CrossRef] [PubMed]
  53. Molęda, P.; Fronczyk, A.; Safranow, K.; Majkowska, L. Is Uric Acid a Missing Link between Previous Gestational Diabetes Mellitus and the Development of Type 2 Diabetes at a Later Time of Life? PLoS ONE 2016, 11, e0154921. [Google Scholar] [CrossRef] [PubMed]
  54. Modan, M.; Halkin, H.; Karasik, A.; Lusky, A. Elevated serum uric acid—A facet of hyperinsulinaemia. Diabetologia 1987, 30, 713–718. [Google Scholar] [CrossRef] [PubMed]
  55. Pacheco, L.D.; Costantine, M.M.; Hankins, G.D.V. 2—Physiologic Changes During Pregnancy A2—Mattison, Donald R. In Clinical Pharmacology During Pregnancy; Academic Press: Cambridge, MA, USA, 2013; pp. 5–16. [Google Scholar]
  56. Hung, T.H.; Lo, L.M.; Chiu, T.H.; Li, M.J.; Yeh, Y.L.; Chen, S.F.; Hsieh, T.T. A longitudinal study of oxidative stress and antioxidant status in women with uncomplicated pregnancies throughout gestation. Reprod. Sci. 2010, 17, 401–409. [Google Scholar] [CrossRef] [PubMed]
  57. Vitart, V.; Rudan, I.; Hayward, C.; Gray, N.K.; Floyd, J.; Palmer, C.N.; Knott, S.A.; Kolcic, I.; Polasek, O.; Graessler, J.; et al. SLC2A9 is a newly identified urate transporter influencing serum urate concentration, urate excretion and gout. Nat. Genet. 2008, 40, 437–442. [Google Scholar] [CrossRef] [PubMed]
  58. Liu, W.C.; Hung, C.C.; Chen, S.C.; Lin, M.Y.; Chen, L.I.; Hwang, D.Y.; Chang, J.M.; Tsai, J.C.; Chen, H.C.; Hwang, S.J. The rs1014290 polymorphism of the SLC2A9 gene is associated with type 2 diabetes mellitus in Han Chinese. Exp. Diabetes Res. 2011, 2011, 527520. [Google Scholar] [CrossRef] [PubMed]
  59. Pleskacova, A.; Brejcha, S.; Pacal, L.; Kankova, K.; Tomandl, J. Simultaneous Determination of Uric Acid, Xanthine and Hypoxanthine in Human Plasma and Serum by HPLC–UV: Uric Acid Metabolism Tracking. Chromatographia 2016, 80, 529–536. [Google Scholar] [CrossRef]
Figure 1. Uric acid (UA) levels according to single-nucleotide polymorphisms (SNPs) in glucose transporter 9 (GLUT9; SLC2A9 gene). Box and whisker plots were constructed as medians, minimum and maximum values, and interquartile ranges. Statistics were calculated using Mann–Whitney test.
Ijms 19 03696 g001
Table 1. Clinical and anthropometric characteristics of study subjects.
ParameterGDM (n = 109)Controls (n = 34)p
Age (years)33 (30–35)31 (28–33)0.040
Pre-gestational BMI (kg m-2)24.6 (21.2–28.7)22.5 (20.6–27.0)NS
Weight gain during pregnancy (kg)8 (5–10)13 (10–17)<1 × 10⁻⁶
Offspring birth weight (g)3120 (2790–3500)3355 (3070–3700)0.032
Primiparity38.5%44.1%NS
History of previous GDM26.2%0%0.009
Family history of DM72.1%27.3%<1 × 10⁻⁴
FPG (mmol/L) mid-gestation4.8 (4.4–5.2)4.2 (4.0–4.4)<1 × 10⁻⁶
1-h PPG (mmol/L) mid-gestation9.4 (8.9–10.1)5.9 (5.3–6.5)<1 × 10⁻⁶
2-h PPG (mmol/L) mid-gestation8.2 (7.7–8.8)5.5 (4.8–6.1)<1 × 10⁻⁶
AUC (mmol/L/h) mid-gestation13.0 (12.3–13.7)9.6 (8.9–10.3)<1 × 10⁻⁶
FPG (mmol/L) postpartum4.7 (4.4–4.9)--
1-h PPG (mmol/L) postpartum6.3 (5.1–7.8)--
2-h PPG (mmol L-1) postpartum5.0 (4.3–5.9)--
AUC (mmol/L/h) postpartum9.7 (8.8–10.6)--
X levels (μmol/L) mid-gestation3.61 (3.41–3.85)3.41 (3.21–3.70)0.049
X levels (μmol/L) postpartum4.14 (3.91–4.61)3.79 (3.53–4.20)0.0002
UA levels (μmol/L) mid-gestation183 (154–205)178 (168–190)NS
UA levels (μmol/L) postpartum221(195–249)213 (190–248)NS
Data expressed as medians and interquartile ranges (IQR) or proportions (%). Differences were evaluated by nonparametric Mann-Whitney or Fisher exact tests. 1-h PPG—1-h post-load plasma glucose; 2-h PPG—2-h post-load plasma glucose; AUC—area under the curve of oral glucose tolerance test calculated using trapezoidal rule; DM—diabetes mellitus; FPG—fasting plasma glucose; GDM—gestational diabetes mellitus; NS—not significant; UA—uric acid; X—xanthine; - means missing data.
Table 2. Labor and perinatal data of study subjects.
ParameterGDM (n = 57)Controls (n = 34)p
Primiparity57.9%44.1%NS
Gestational age at delivery (weeks)40 (39–40)40 (39–40.5)NS
Premature labor12.3%0%NS
Spontaneous onset of labor54.4%66.0%NS
Protracted labor (>480 min)3.51%4.55%NS
Caesarean section rate33.3%13.6%0.043
Complications following childbirth5.26%4.55%NS
Pathological Apgar score5.26%0%NS
Pathological umbilical cord-blood pH1.75%4.55%NS
Pathological umbilical cord base excess3.51%0%NS
Data are expressed as medians and interquartile ranges (IQR) or proportions (%). Differences were evaluated by nonparametric Mann–Whitney or Fisher exact tests. GDM—gestational diabetes mellitus; NS—not significant.
Table 3. Selected single-nucleotide polymorphisms (SNPs) within genes encoding uric acid transporters.
UA transporter (gene)SNPNucleotide SubstitutionSNP Effect (Position)MAF in GDM Group (%)MAF in Control Group (%)p (Genotype and Allele Frequency)
ABCG2 (ABCG2)rs2231142G/T141 Q/K (exon)T 10.5T 4.69both NS
GLUT9 (SLC2A9)rs1014290A/G(intron)G 35.6G 29.3both NS
rs12498742A/G(intron)G 29.5G 37.9 *both NS
rs16890979C/T253 V/I (exon)T 26.6T 47.9both NS
rs734553G/T(intron)G 28.0G29.0both NS
Chi-square test was used for differences in genotype and allele frequencies. ABCG2 transporter and ABCG—ATP binding cassette subfamily G member 2; GDM—gestational diabetes mellitus; GLUT9—glucose transporter 9; MAF—minor allele frequency; NS—not significant; SLC2A9—solute carrier family 2 member 9; UA—uric acid. * This population is not in Hardy–Weinberg equilibrium.

