Article

Zebrafish Mutants Carrying Leptin a (lepa) Gene Deficiency Display Obesity, Anxiety, Less Aggression and Fear, and Circadian Rhythm and Color Preference Dysregulation

1
Department of Chemistry, Chung Yuan Christian University, Chung-Li 32023, Taiwan
2
Department of Bioscience Technology, Chung Yuan Christian University, Chung-Li 32023, Taiwan
3
Department of Biological Science & Technology College of Medicine, I-Shou University, Kaohsiung 82445, Taiwan
4
Department of Chemistry, Chinese Culture University, Taipei 11114, Taiwan
5
Laboratory of Marine Biology and Ecology, Third Institute of Oceanography, State OceanicAdministration, Xiamen 361005, China
6
Division of Endocrinology and Metabolism, Department of Internal Medicine, Changhua Christian Hospital, Changhua 50094, Taiwan
7
Center of Nanotechnology, Chung Yuan Christian University, Chung-Li 32023, Taiwan
8
Center of Biomedical Technology, Chung Yuan Christian University, Chung-Li 32023, Taiwan
*
Authors to whom correspondence should be addressed.
Int. J. Mol. Sci. 2018, 19(12), 4038; https://0-doi-org.brum.beds.ac.uk/10.3390/ijms19124038
Submission received: 9 November 2018 / Revised: 5 December 2018 / Accepted: 11 December 2018 / Published: 13 December 2018

Abstract

:
Leptin, a hormone secreted by peripheral adipose tissues, regulates the appetite in animals. Recently, evidence has shown that leptin also plays roles in behavioral response in addition to controlling appetite. In this study, we examined the potential function of leptin on non-appetite behaviors in zebrafish model. By using genome editing tool of Transcription activator-like effector nuclease (TALEN), we successfully knocked out leptin a (lepa) gene by deleting 4 bp within coding region to create a premature-translation stop. Morphological and appetite analysis showed the lepa KO fish display a phenotype with obese, good appetite and elevation of Agouti-related peptide (AgRP) and Ghrelin hormones, consistent with the canonical function of leptin in controlling food intake. By multiple behavior endpoint analyses, including novel tank, mirror biting, predator avoidance, social interaction, shoaling, circadian rhythm, and color preference assay, we found the lepa KO fish display an anxiogenic phenotype showing hyperactivity with rapid swimming, less freezing time, less fear to predator, loose shoaling area forming, and circadian rhythm and color preference dysregulations. Using biochemical assays, melatonin, norepinephrine, acetylcholine and serotonin levels in the brain were found to be significantly reduced in lepa KO fish, while the levels of dopamine, glycine and cortisol in the brain were significantly elevated. In addition, the brain ROS level was elevated, and the anti-oxidative enzyme catalase level was reduced. Taken together, by performing loss-of-function multiple behavior endpoint testing and biochemical analysis, we provide strong evidence for a critical role of lepa gene in modulating anxiety, aggression, fear, and circadian rhythm behaviors in zebrafish for the first time.

Graphical Abstract

1. Introduction

1.1. Leptin Plays a Canonical Role on Appetite Control

Leptin, a blood-transported hormone secreted by adipocytes, circulates through blood–brain barrier (BBB) into the brain and binds to its receptor (LepR), which has been known to play a negative role in appetite control [1]. Leptin is encoded by obese (ob) gene, which is highly conserved and shares extensive homology between species [2]. The serum level of leptin is correlated with the mass of adipose tissue and increases when obese [3]. However, leptin resistance results in failure to control weight, with high level of leptin expression in the plasma, and leads to obesity [4]. On the other hand, leptin or LepR deficiency increases appetites, energy uptake, and leads to obesity in animal models and humans [5,6]. Synthetic leptin protein injection significantly reduces body weight and has been used as treatment for overweight symptom in the clinical setting [7].

1.2. Leptin’s Non-Appetite Controlling Characteristic

In addition to the canonical appetite control, previous studies show the effects of leptin go beyond dietary. In rodent models, leptin pathway is found to associate with myriad physiological processes other than dietary control, including body temperature, energy storage, immune response, reproduction and development [1]. Leptin-mediated immunological function is reported to promote T cell differentiation and proliferation [8,9], suggesting that leptin shares structural and functional similarities with cytokines [10,11], and may regulate innate immune responses [12]. Furthermore, evidence demonstrates that leptin regulates pubertal transition in reproduction [13,14]. More recently, leptin has drawn attention with its influences on bone metabolism through activating fibroblast factor 23 (FGF-23) and osteocalcin [15,16]. Interestingly, while leptin is thought to be involved in synaptic plasticity in hippocampus [17,18,19], it also plays versatile roles on behaviors by affecting neural transduction such as anxiety and depression in diabetic rats [20,21]. It has been emphasized that the anxiety- and depression-like behaviors are correlated with serum leptin levels in non-stressed rat model. Acute administration of leptin not only induces weight loss [3,22], but also ameliorates anxious and depressive effects [23,24]. Leptin level in plasma is found to be correlated with emotional status [25].

1.3. Fish Is a New Low Vertebrate Model for Leptin-Associated Study

Numerous mammalian models have contributed to leptin studies [26,27,28]. Based on previous genomic project studies, leptin in tetrapods shows closer relationship with cartilaginous fish than with the bony class [28]. In humans, leptin binds to specific leptin receptor, LepR, which has several isoforms, and mediates different signal pathways associated with dietary and energetic homeostasis, such as Janus Kinase-Signal Transducer and Activator of Transcription-s (JAK-STAT3), Phosphatidylinositol 3-Kinase (PI3K), Mitogen-activated Protein Kinase (MAPK), and 5’Adenosine Monophosphate-activated Protein Kinase (AMPK) [29,30,31].
Fish is a new animal model for functional research for leptin among lower vertebrates. In fish, two leptins (A and B) are encoded from multiple Ob genes that interact with LepR family [32,33]. Both leptin and LepR-knockout model in zebrafish show promise in studying leptin-associated behaviors with leptin/LepR hormone system being evolutionarily conserved between fish and mammals [34]. In addition, leptin and LepR gene deficiencies display an increased food uptake and metabolism, which is similar to dysfunction exhibited in other fasting animal models [33]. In addition, adipogenesis has been well studied in zebrafish model, which greatly facilitates research on obesity [34]. Moreover, the genetic manipulation tools for loss-of-function analysis (TALEN and Clustered Regularly Interspaced Short Palindromic Repeats, CRISPR, genome editing system) [35,36,37] and gain-of-function analysis (i.e., Tol2 transposon system) [38,39] are well developed in fish. The behavioral assays in fish have been significantly improved and standardized during the past years [40,41]. Combining advantages mentioned above, fish is an ideal model for performing behavioral assay in a leptin loss-of-function study.
The aim of this study was to use zebrafish as a model to validate the potential function of leptin gene especially on behavior. Compared to previous studies in rodents, we performed analyses in leptin a (lepa) knockout (KO) zebrafish with novel tank, mirror biting, predator avoidance, social interaction, shoaling, color preference and circadian rhythm tests for multiple behavioral endpoints such as anxiety, new environment exploration, aggressiveness, fear response, social behavior, day/night activity in circadian rhythms and color preference assays. With the observation of the behavioral abnormalities in lepa KO fish, a better understanding of the role of leptin in physiological and behavioral regulations was confirmed.

2. Results

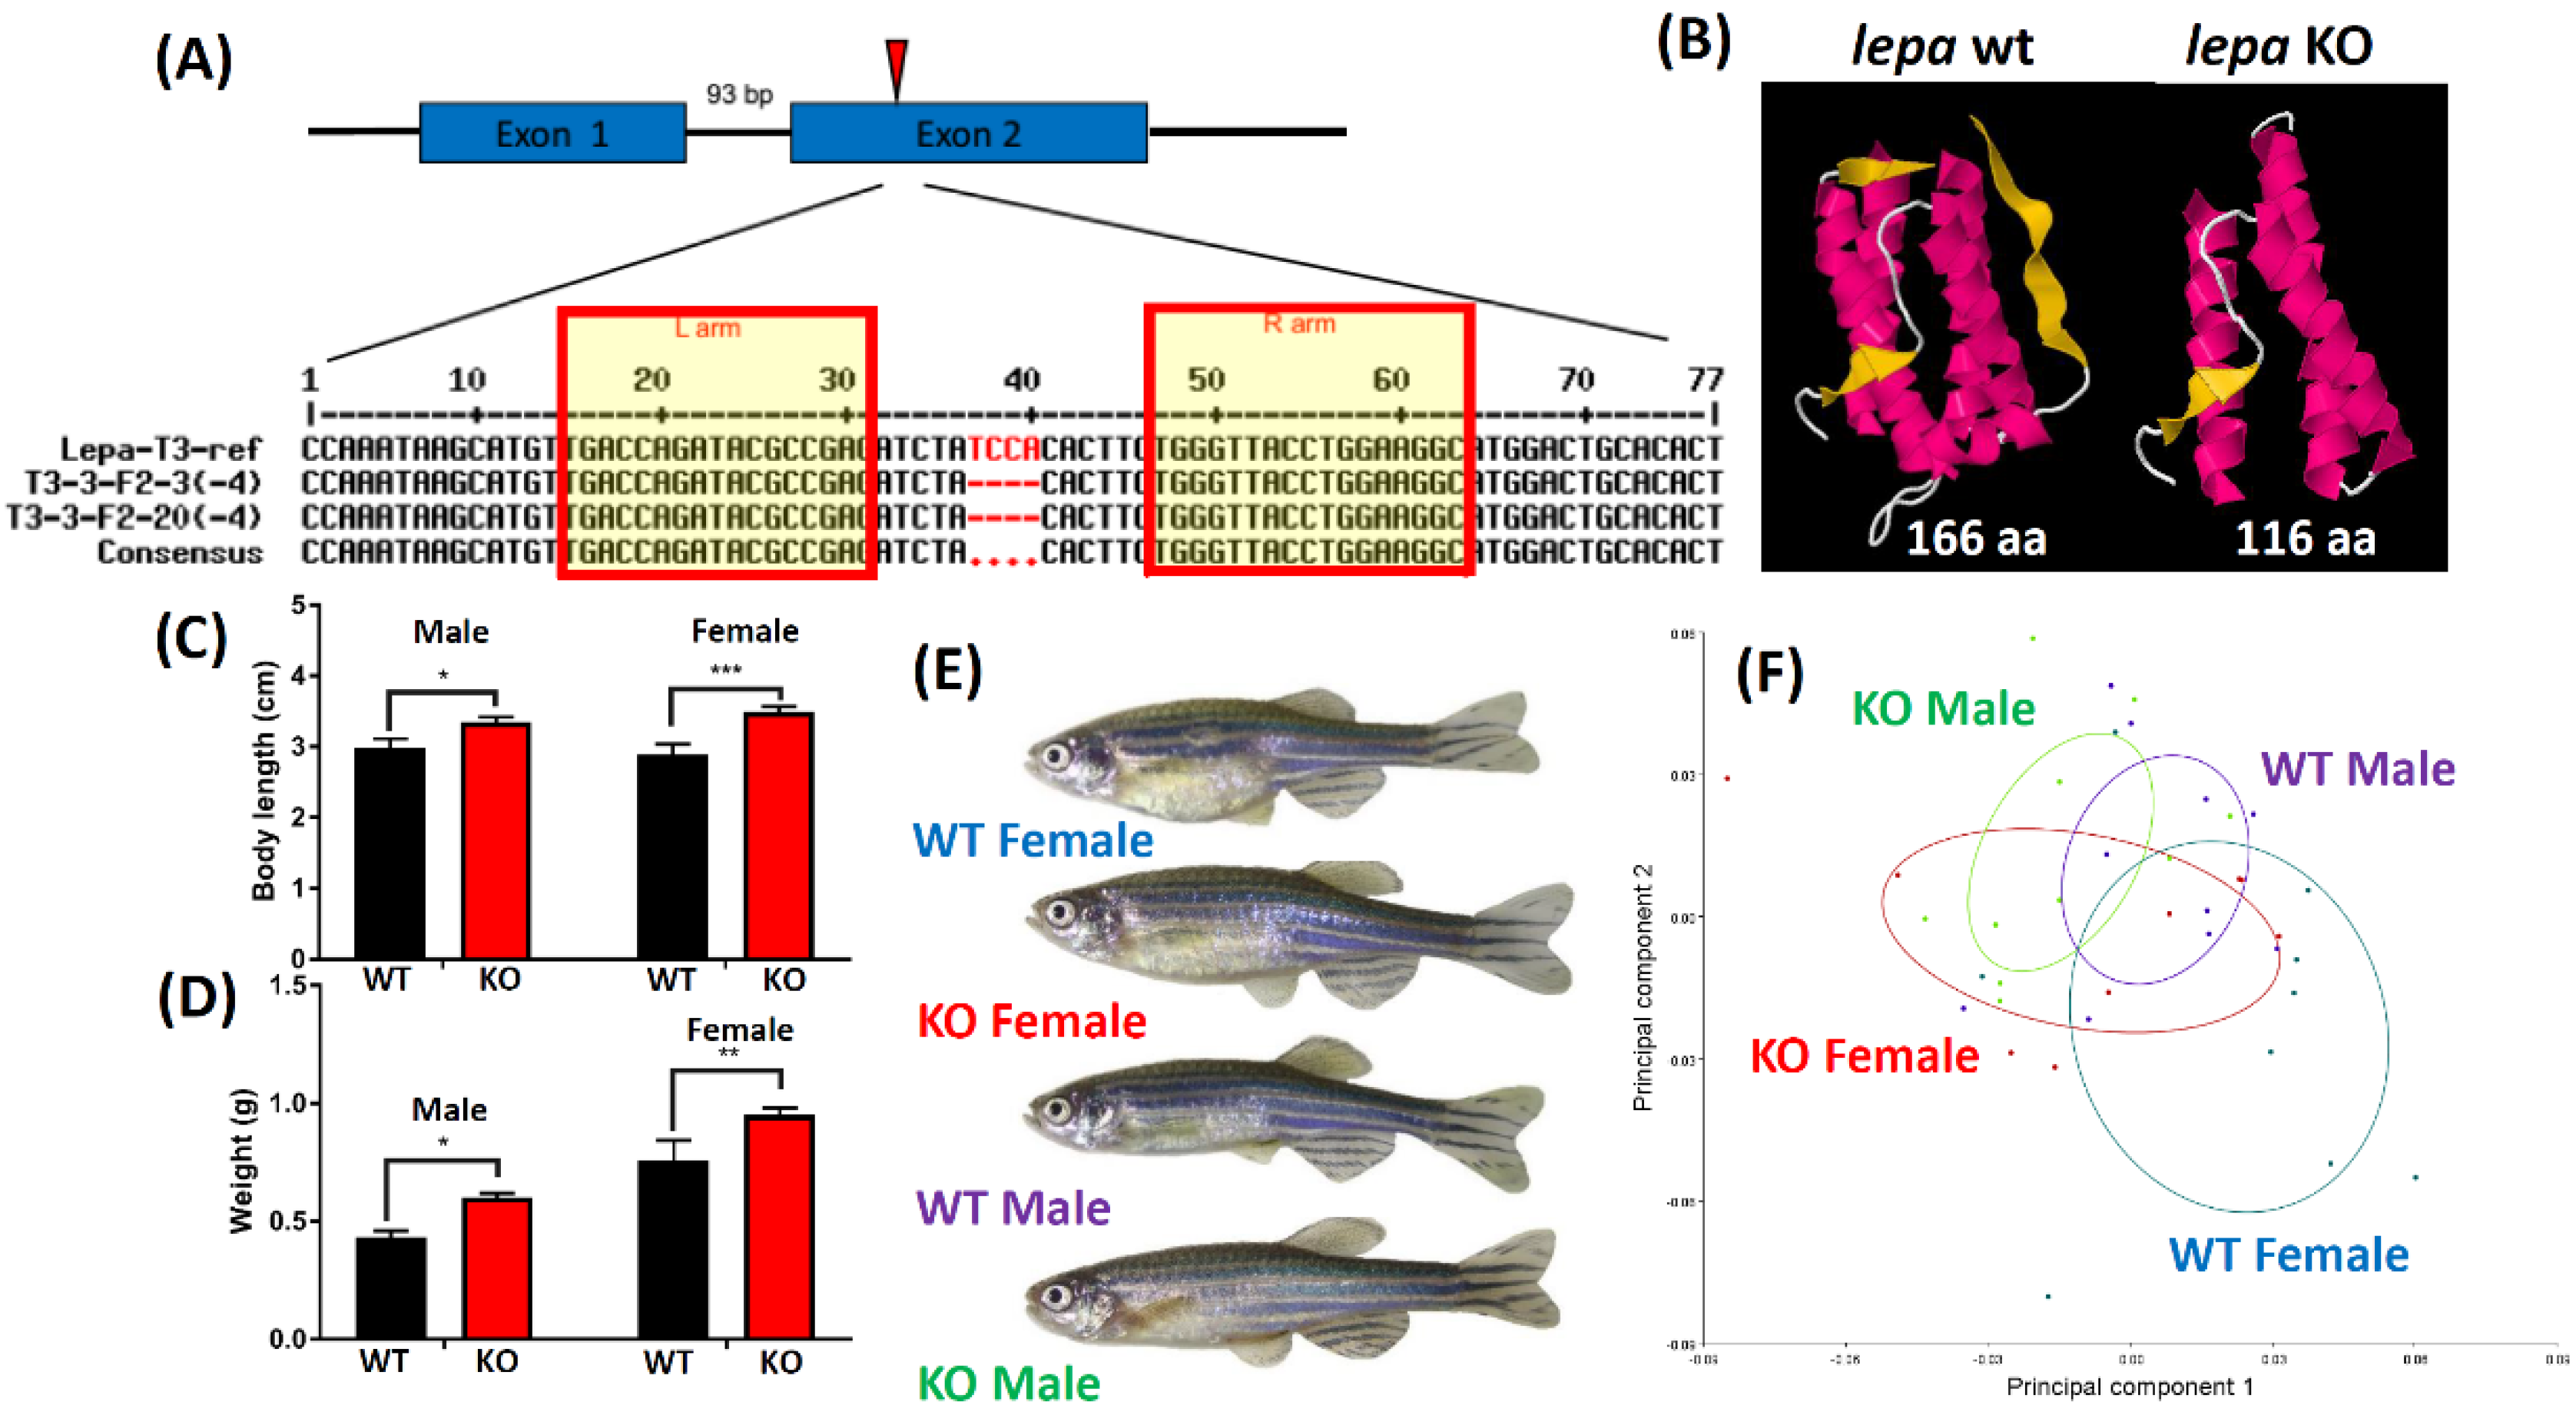
2.1. Lepa KO Zebrafish Displayed Typical Obesity Phenotype

There are two leptin gene duplicates in zebrafish genome. The leptin a (lepa) gene in zebrafish genome is located on chromosome 18 and contains two exons, while the leptin b (lepb) gene is located on chromosome 4 and contains two exons. Based on phylogenetic tree topology, fish lepa is closet to lepb than their mammalian lep counterpart [42]. To generate lepa KO zebrafish, the 5’-capping in vitro synthesized TALEN on the left and the right arms of mRNAs targeting exon 2 were injected into embryos (Figure 1A). The injected embryos were raised to adulthood, and mated with wild-type fish to generate F1 progenies. The potential mutant carriers were screened and sequenced before crossing the F1 pairs with the same genotype to generate homozygotic F2 progenies. Finally, one lepa mutant carrying 4bp deletion (TCCA deletion) was identified (Figure 1A). The corresponding translated protein sizes for mutated lepa gene was shorten from 166 amino acid (aa) to 116 aa. Three-dimensional modeling shows the mutated lepa protein is truncated with only two beta-sheet and one alpha-helix motifs at the C-terminus (Figure 1B). When fish reached sex maturation at nine months old, lepa KO fish displayed obese phenotype within their body length (Figure 1C) and body weight (Figure 1D), significantly larger than the wild type (WT) fish in both genders. The lepa KO fish also had better appetites than control fish (data not shown). Morphometric measurements were taken by labeling several key landmarks according to those previously published [43]. Although lepa KO fish displayed obese phenotype, principle component analysis (PCA) showed that the lepa KO and WT fish exhibited no significant overall change on fish shape (Figure 1E,F).

2.2. Lepa KO Zebrafish Display Hyperactivity with Faster Locomotion and Robust Exploratory Behaviors

In addition to canonical function in obesity, the potential function of lepa gene in behaviors by measuring multiple behavioral endpoints were investigated. Firstly, we tested the three-dimensional (3D) locomotion activity (a test for measuring fish locomotion in three-dimensional space) of the lepa KO fish according to our previously published protocol [44]. After 15 min acclimation in the experiment tank, the lepa KO mutant fish had higher locomotion activity than the control fish, which was manifested in a higher average speed (p < 0.001) (Figure 2A) and a higher average angular velocity (p < 0.01) (Figure 2B). In addition, higher swimming movement, in terms of swimming time movement ratio, and rapid movement time ratio, was also observed in the lepa KO fish (p < 0.0001) (Figure 2E,F). Furthermore, a more robust exploratory behavior was exhibited by lepa KO fish, which was quantified by longer time duration spent in the top portion of the tank compared to the control fish (p < 0.0001) (Figure 2C). The locomotion trajectory tracking can be found in Figure 2M (also see Video S1). There was no difference for movement without a fixed direction or path for both the wild type and lepa KO fish, as demonstrated by similar meandering values (Figure 2D).
During the novel tank exposure test (a test for measuring the anxiety level of fish facing a novel environment), after 5 min of acclimation, the lepa KO mutant fish showed a significantly higher locomotion activity, a higher average speed (p < 0.001), and a lower freezing time movement ratio (p < 0.0001) (Figure 2G,H). The high level of locomotion activity was maintained during the first 20 min of novel tank exposure and gradually subsided afterwards, compared to the wild type fish behavior (Figure 2G,H). The lepa KO fish also exhibited more robust traits of the aforementioned behaviors than the control fish during exploratory behavior observation, namely longer duration spent at the top of the tank, higher number of entries to the top portion of the tank, and longer travelling distance at the top of the tank, as well as lower latency to enter the top of the tank (Figure 2I–L). The locomotion trajectory tracking can be found in Figure 2N.

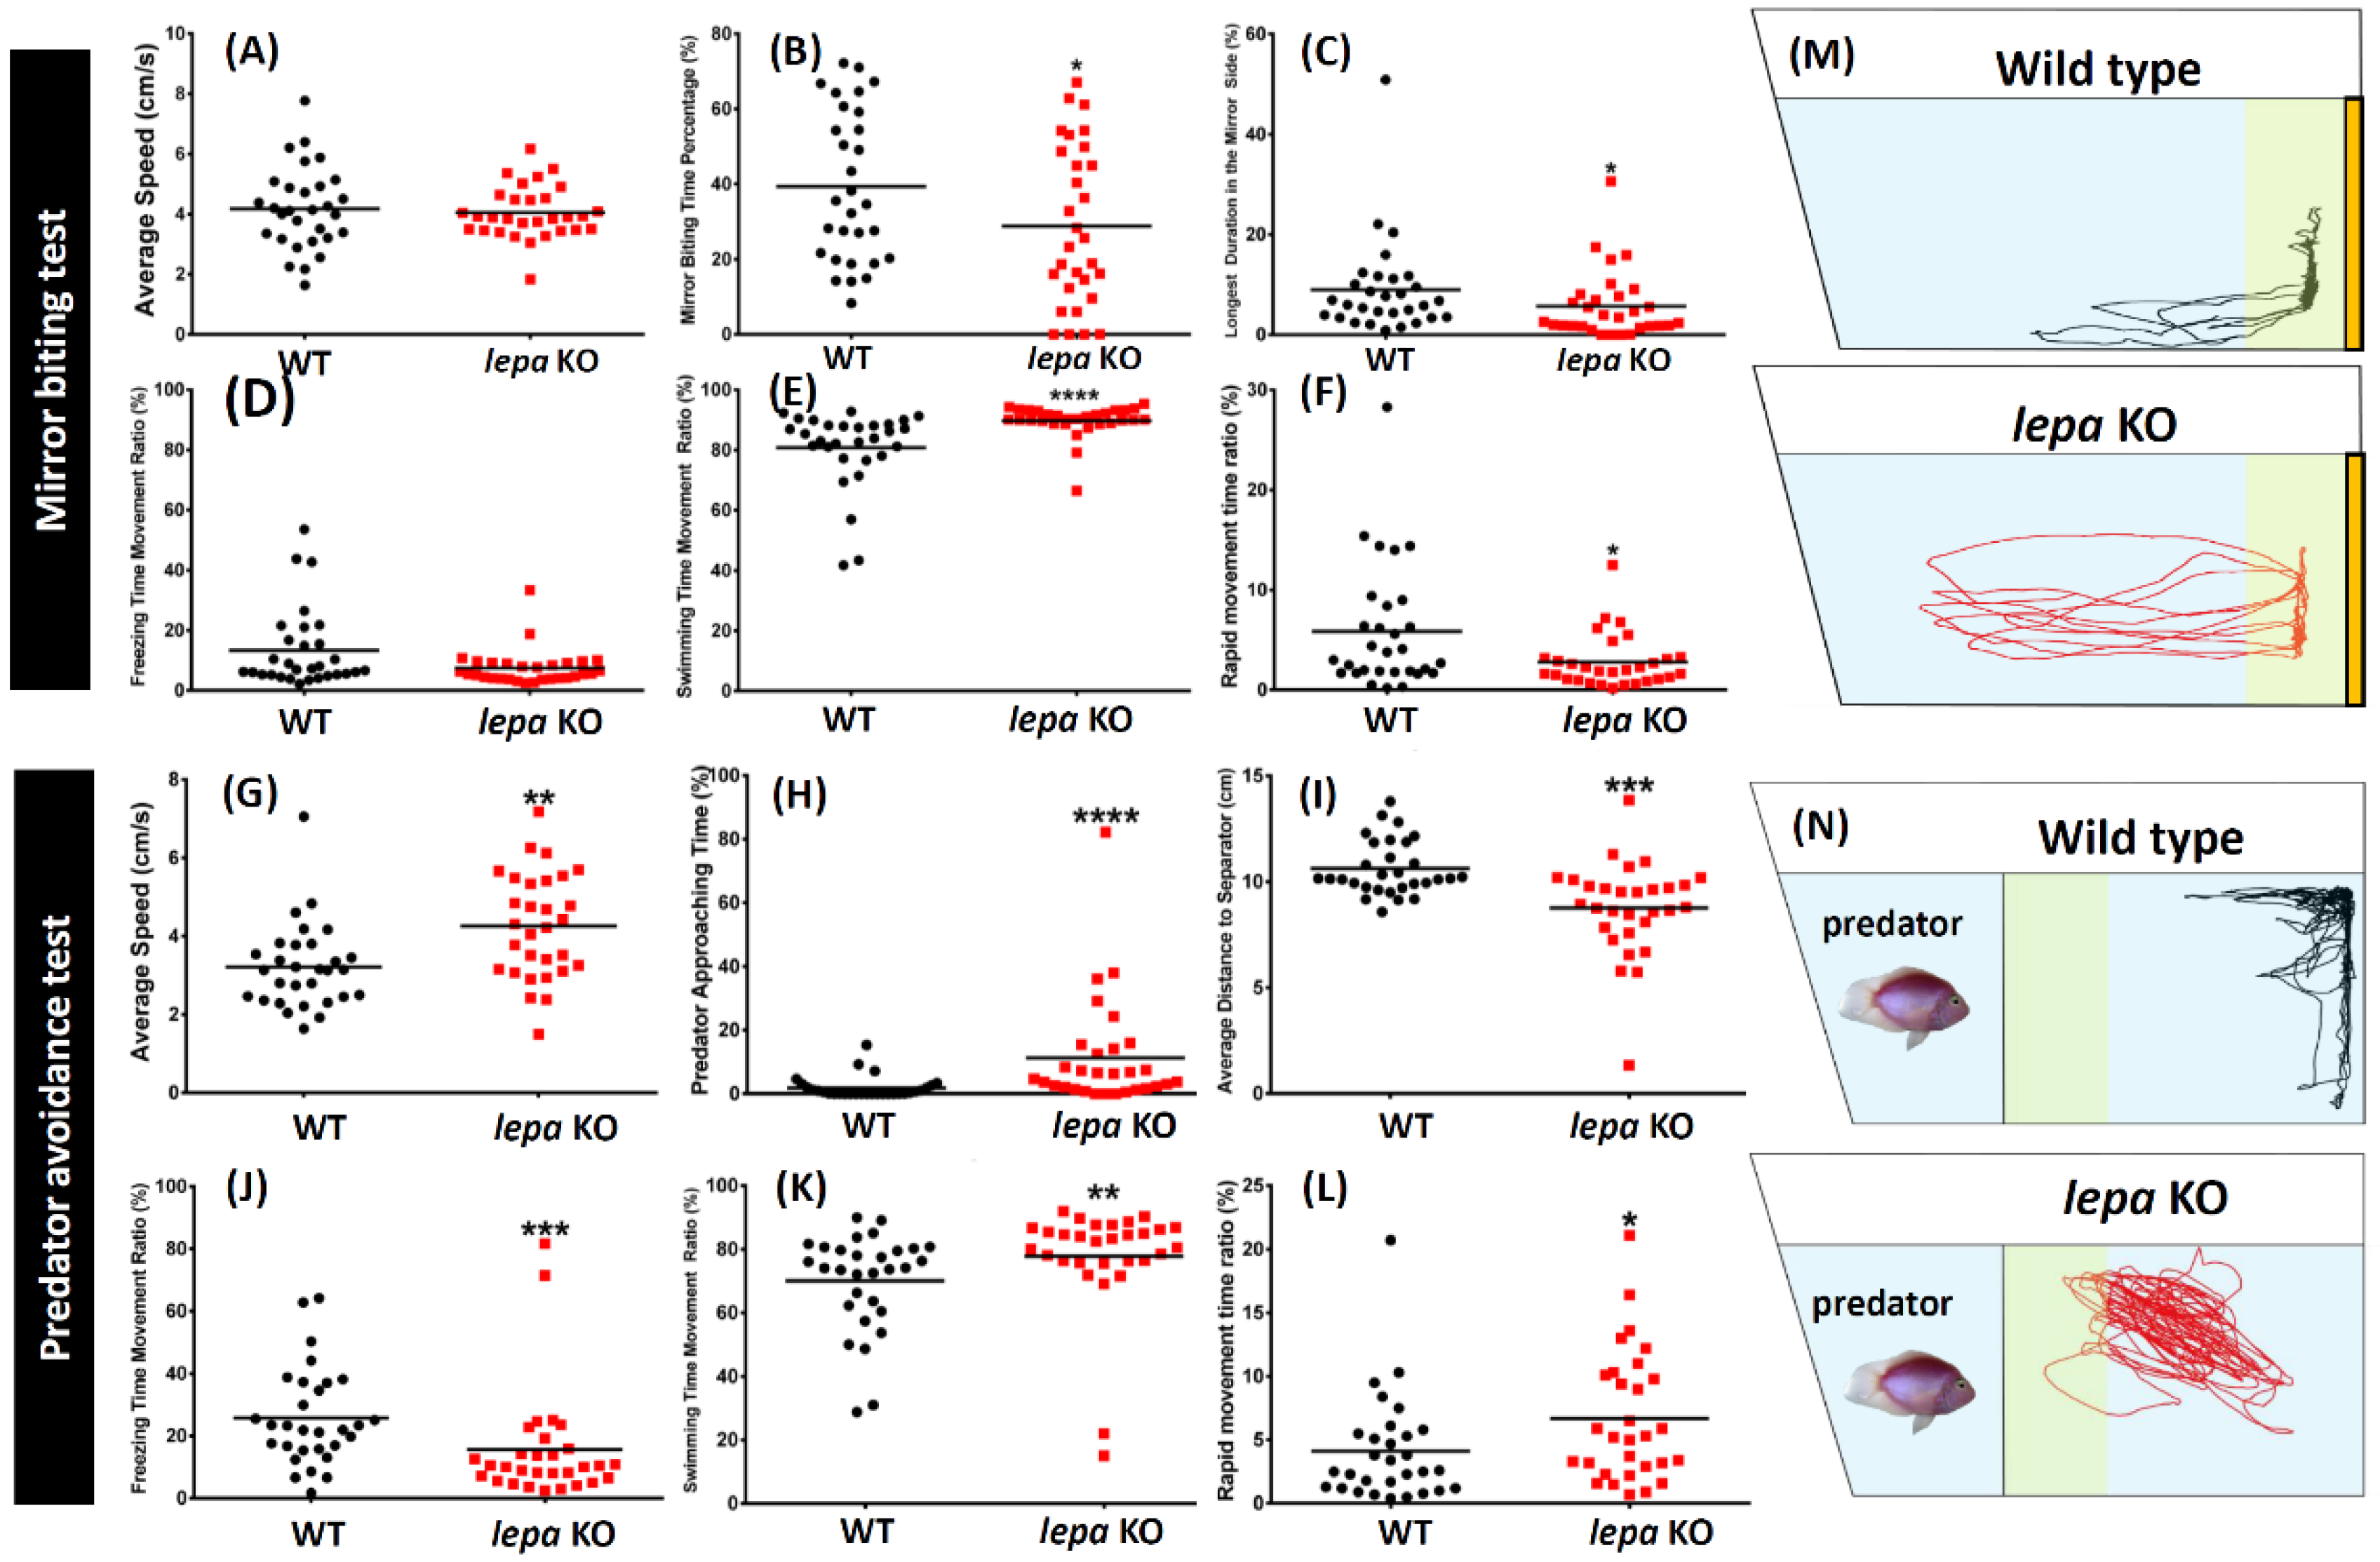
2.3. Lepa KO Zebrafish Displayed Less Aggression and Less Fear to Predator

To investigate aggressive behavior in the lepa KO zebrafish, we performed mirror biting test (a test for measuring the aggressive level of fish to interact with their own image in the mirror). We found that the lepa KO mutant zebrafish displayed significantly less aggression. The lepa KO mutant showed lower mirror biting time percentage and longer duration in the mirror side compared to the wild type control fish (p < 0.05) (Figure 3B,C). The locomotion trajectory tracking can be found in Figure 3M (Video S3). Furthermore, the lepa KO fish did not show any significant difference in their locomotion activity, as indicated by a similar average speed (Figure 3A). However, different distribution of zebrafish movement was noted in the mutant fish with higher swimming time movement ratio (p < 0.0001) (Figure 3E) and lower rapid movement ratio (p < 0.05) (Figure 3F). Meanwhile, there was no difference of freezing time movement ratio between these fish (Figure 3D).
In the predator avoidance test (a test for measuring the fear level when fish face their predator), less fear response within lepa KO mutant fish was observed when predator fish was placed into the experiment tank. This phenomenon was corroborated by several altered anti-predatory avoidance behavioral endpoints, including higher predator approaching time (p < 0.0001) (Figure 3H) and lower average distance to the separator between the predator fish (p < 0.001) (Figure 3I). Furthermore, higher locomotion activity of lepa mutant fish in this predator avoidance test was also observed, which showed a higher average speed (p < 0.01) (Figure 3G). Different distribution of zebrafish movement types, namely short freezing time movement ratio (p < 0.001) (Figure 3J), longer swimming time movement ratio (p < 0.01) (Figure 3K), and rapid movement ratio, were also noted (p < 0.05.) (Figure 3L). The locomotion trajectory tracking can be found in Figure 3N (also see Video S4).

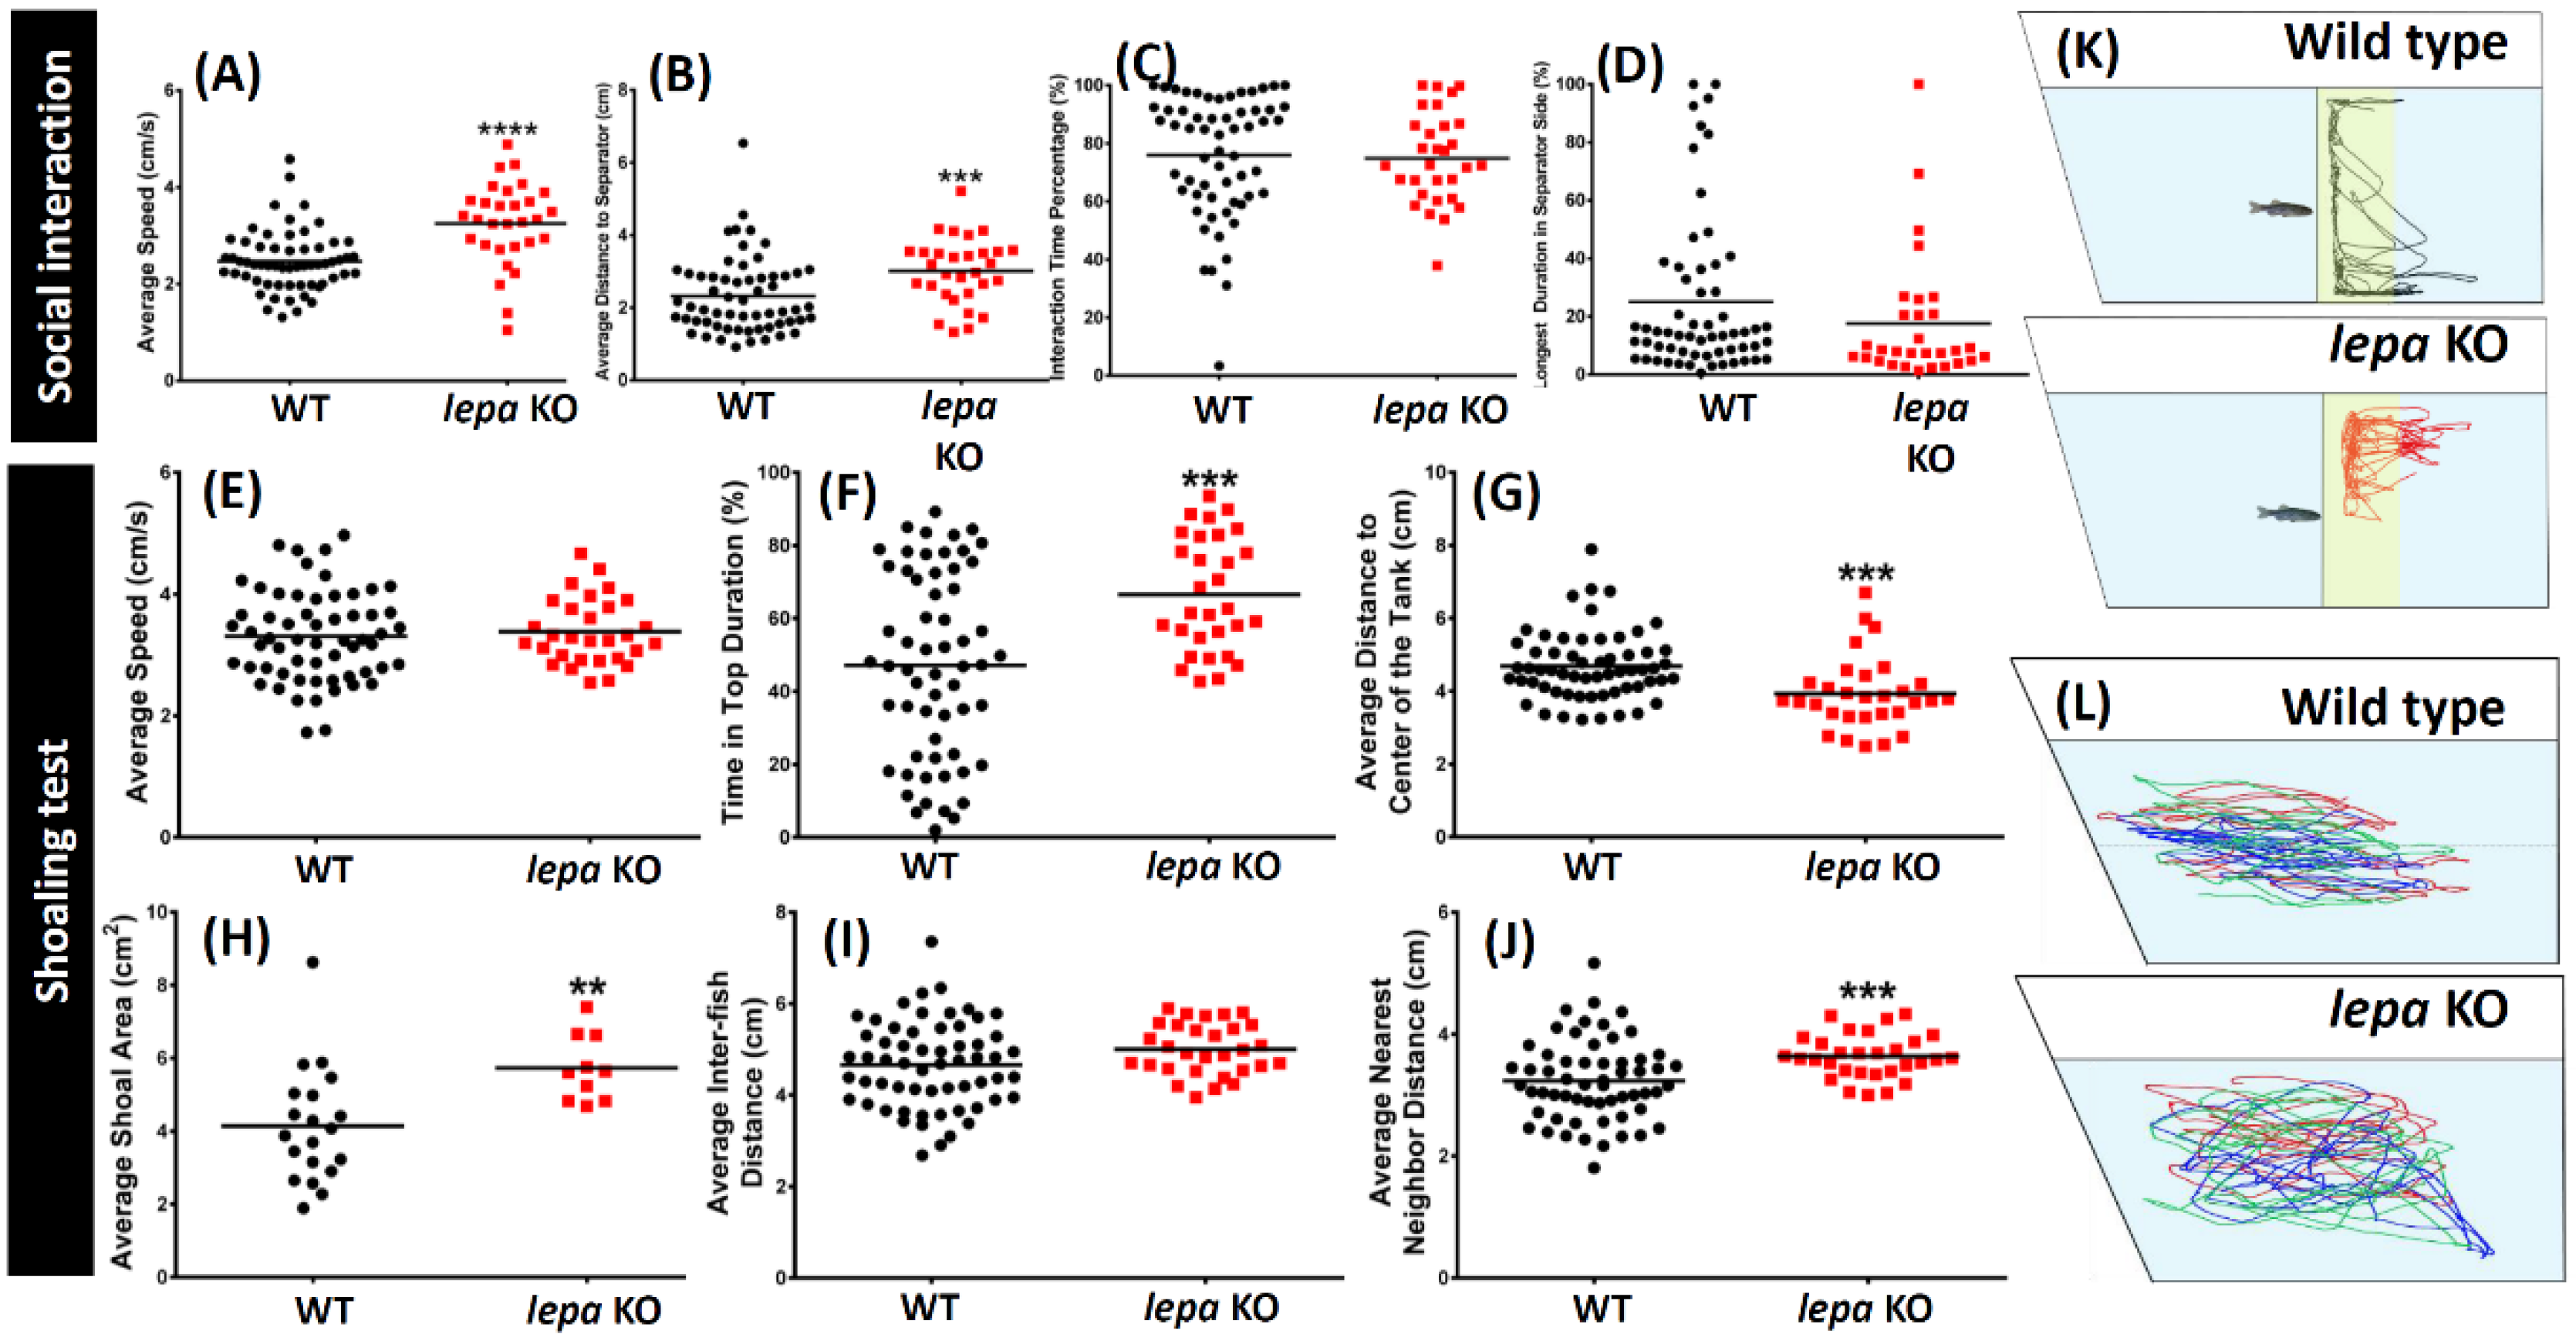
2.4. Lepa KO Zebrafish Displayed Less Social Interaction and Loose Shoaling

In the social interaction test (a test for measuring the social interaction to approach and remain near conspecifics), lepa KO zebrafish showed slightly disrupted ability of interacting with conspecifics. Our results show high locomotion activity, longer average distance to separator (p < 0.001), and long duration to separator side in lepa mutant fish. Together, these data suggest abnormal social interaction with conspecifics (Figure 4A,B,D). The locomotion trajectory tracking can be found in Figure 4K (also see Video S5). However, similar interaction time percentage were recorded (Figure 4C).
Furthermore, deficiency of lepa gene also caused the mutant fish to form different shoaling behavior in shoaling test (a test for measuring the social interaction of multiple zebrafish). We tested the shoaling behavior of three fish and found a loose shoal was formed by the lepa KO fish with larger average shoal area and average nearest neighbor distance (Figure 4H,J). The locomotion trajectory tracking can be found in Figure 4L (also see Video S6). Nonetheless, no significant difference between the control and mutant fish average inter-fish distance was observed (Figure 4I). Consistent with the results from another test (i.e., 3D locomotion and novel tank test), lepa KO fish showed more noticeable top-bottom exploratory behavior with longer time at the top of the tank (Figure 4F). Interestingly, less horizontal exploratory behavior in mutant fish was observed (Figure 4G). The locomotion activity for both fish in this shoaling test was at a similar average speed level and showed no difference (Figure 4E).

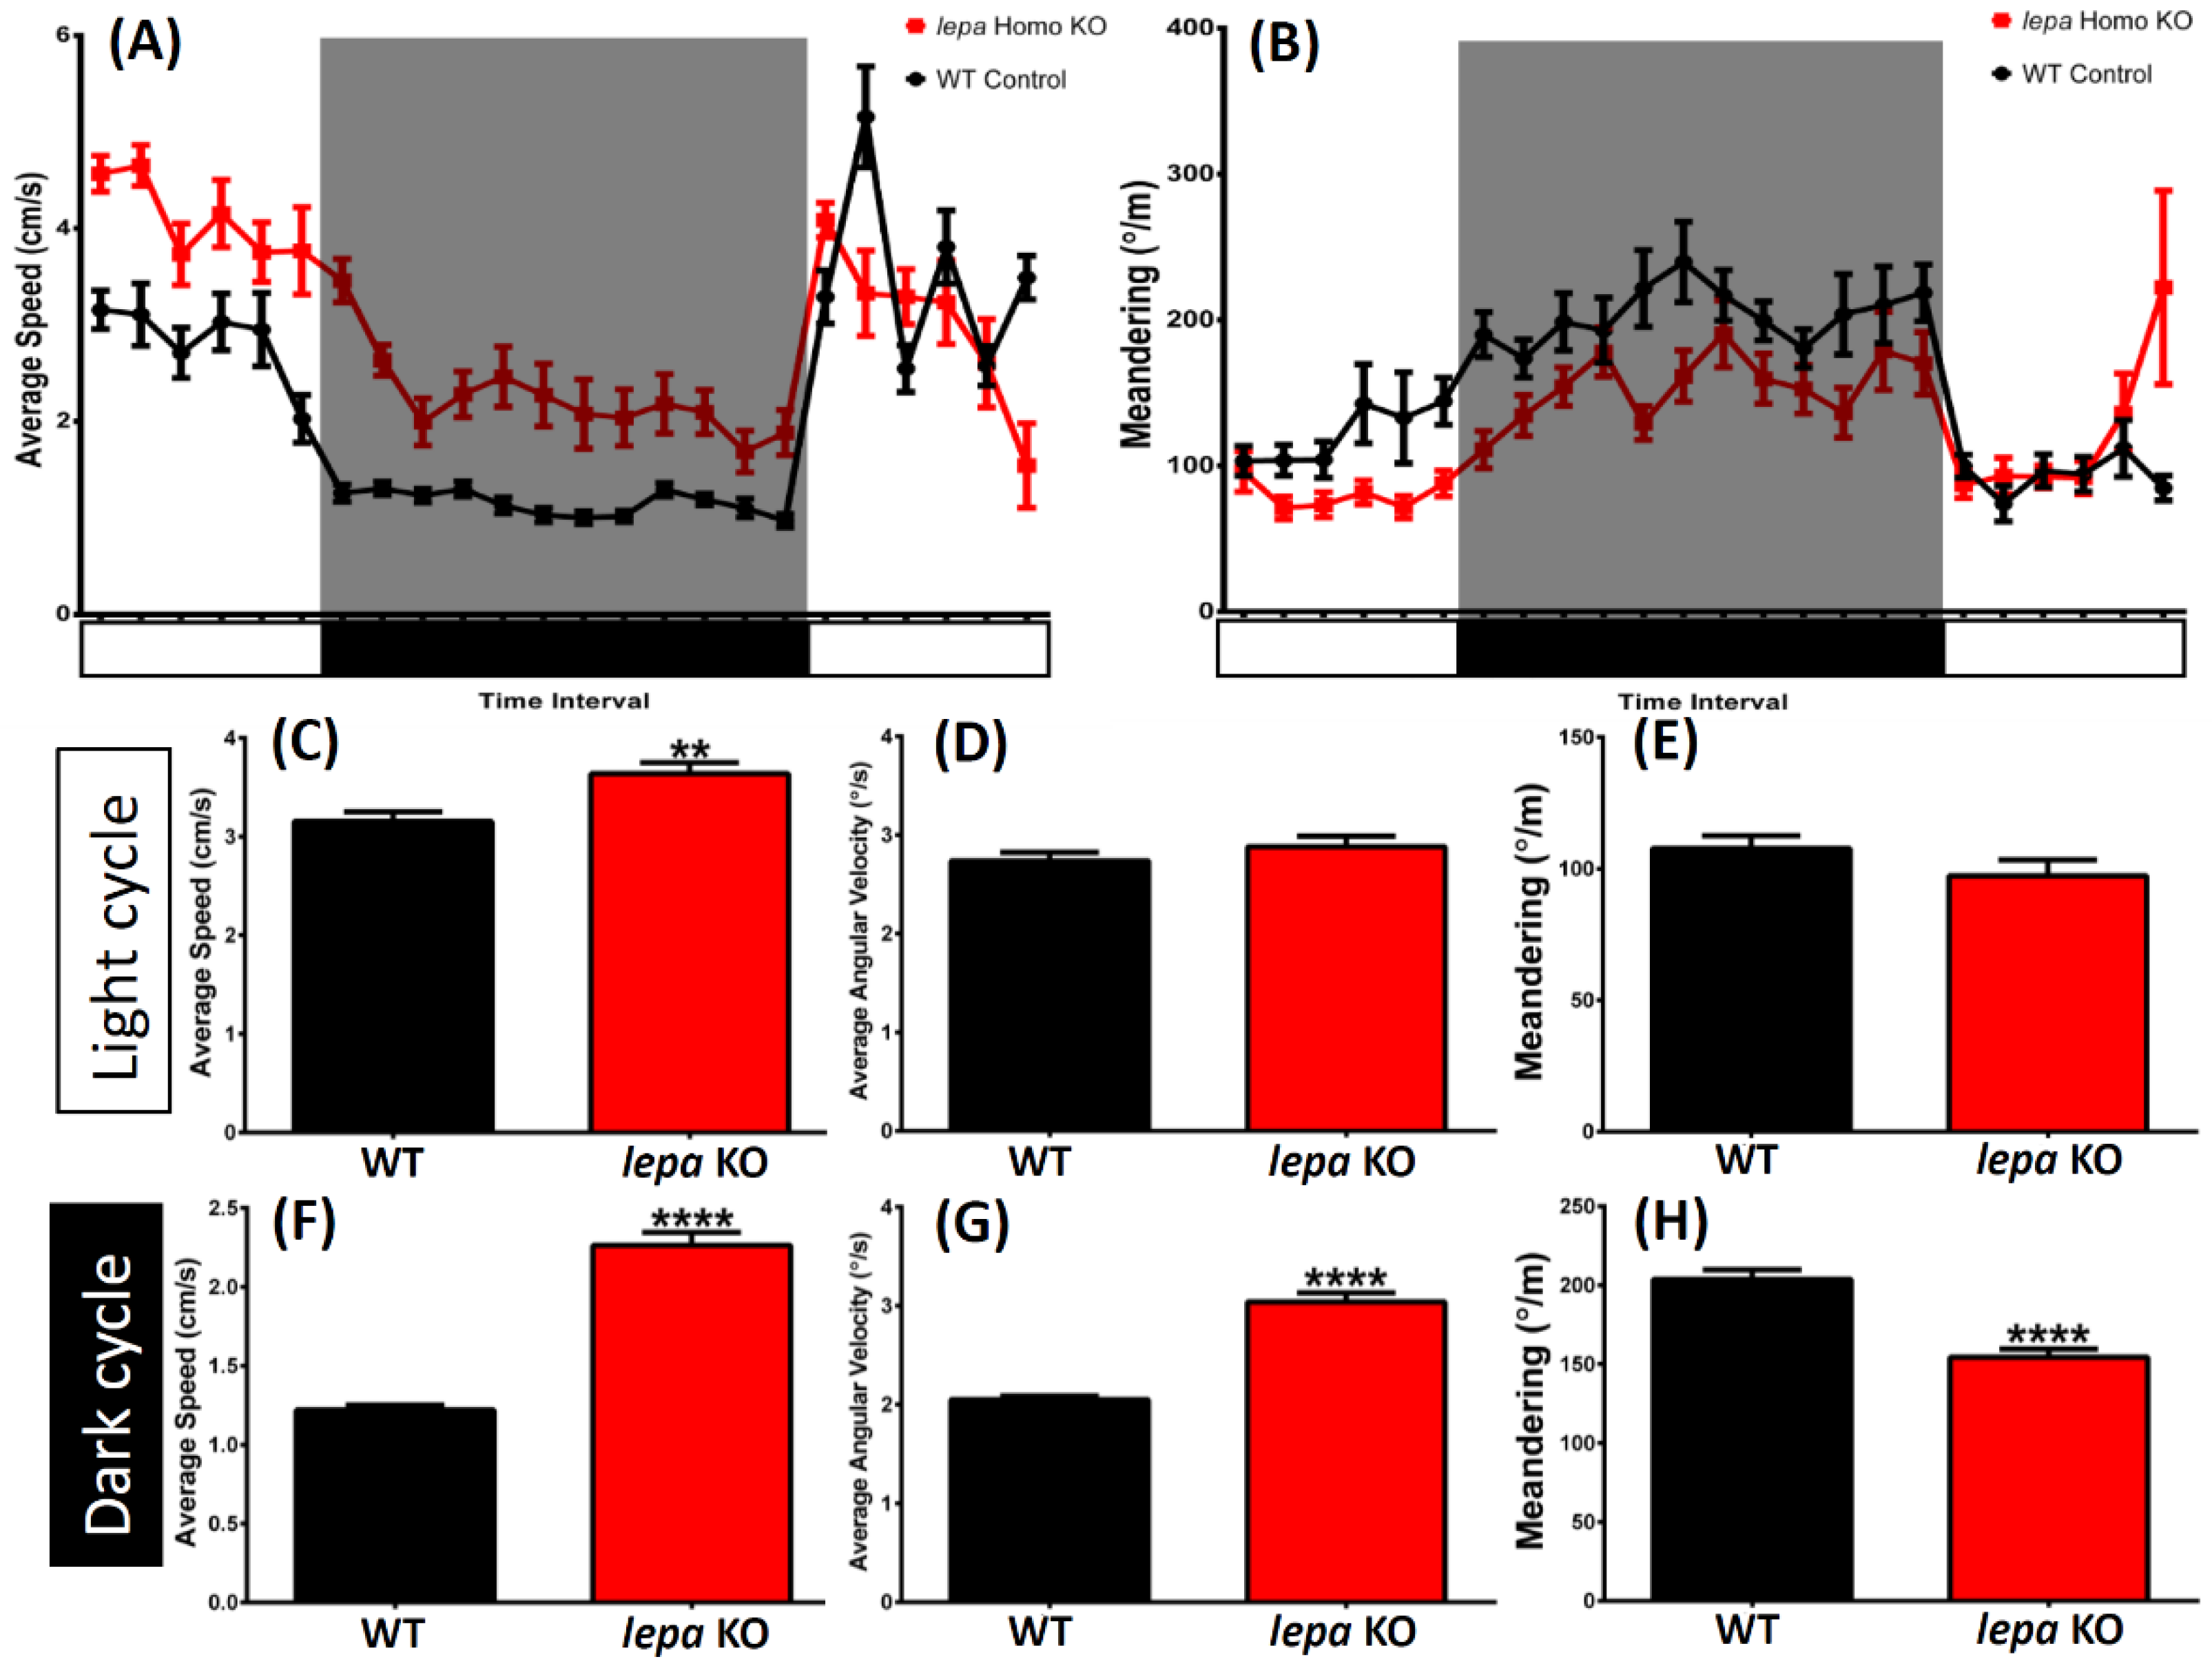
2.5. Lepa KO Zebrafish Display Dysregulation in Circadian Rhythm

During circadian rhythm test with Light/Dark (LD) 12/12 h setting, lepa KO zebrafish generally maintained higher locomotion activity than the control fish most of the time with higher average speed and less meandering within 24 h (Figure 5A,B). Furthermore, when compared the locomotion activity in the light and dark cycles, respectively, higher locomotion activity was observed among the lepa mutant fish during the light cycle compared to the wild type fish. Higher average speed with higher average angular velocity and slightly less meandering was observed in the lepa KO fish. However, the differences were not statistically significant with the control (Figure 5C–E). As expected, during the dark cycle, the lepa KO fish showed a significantly higher average speed, a higher average angular velocity, and significantly less meandering compared to the wild type fish (Figure 5F–H)

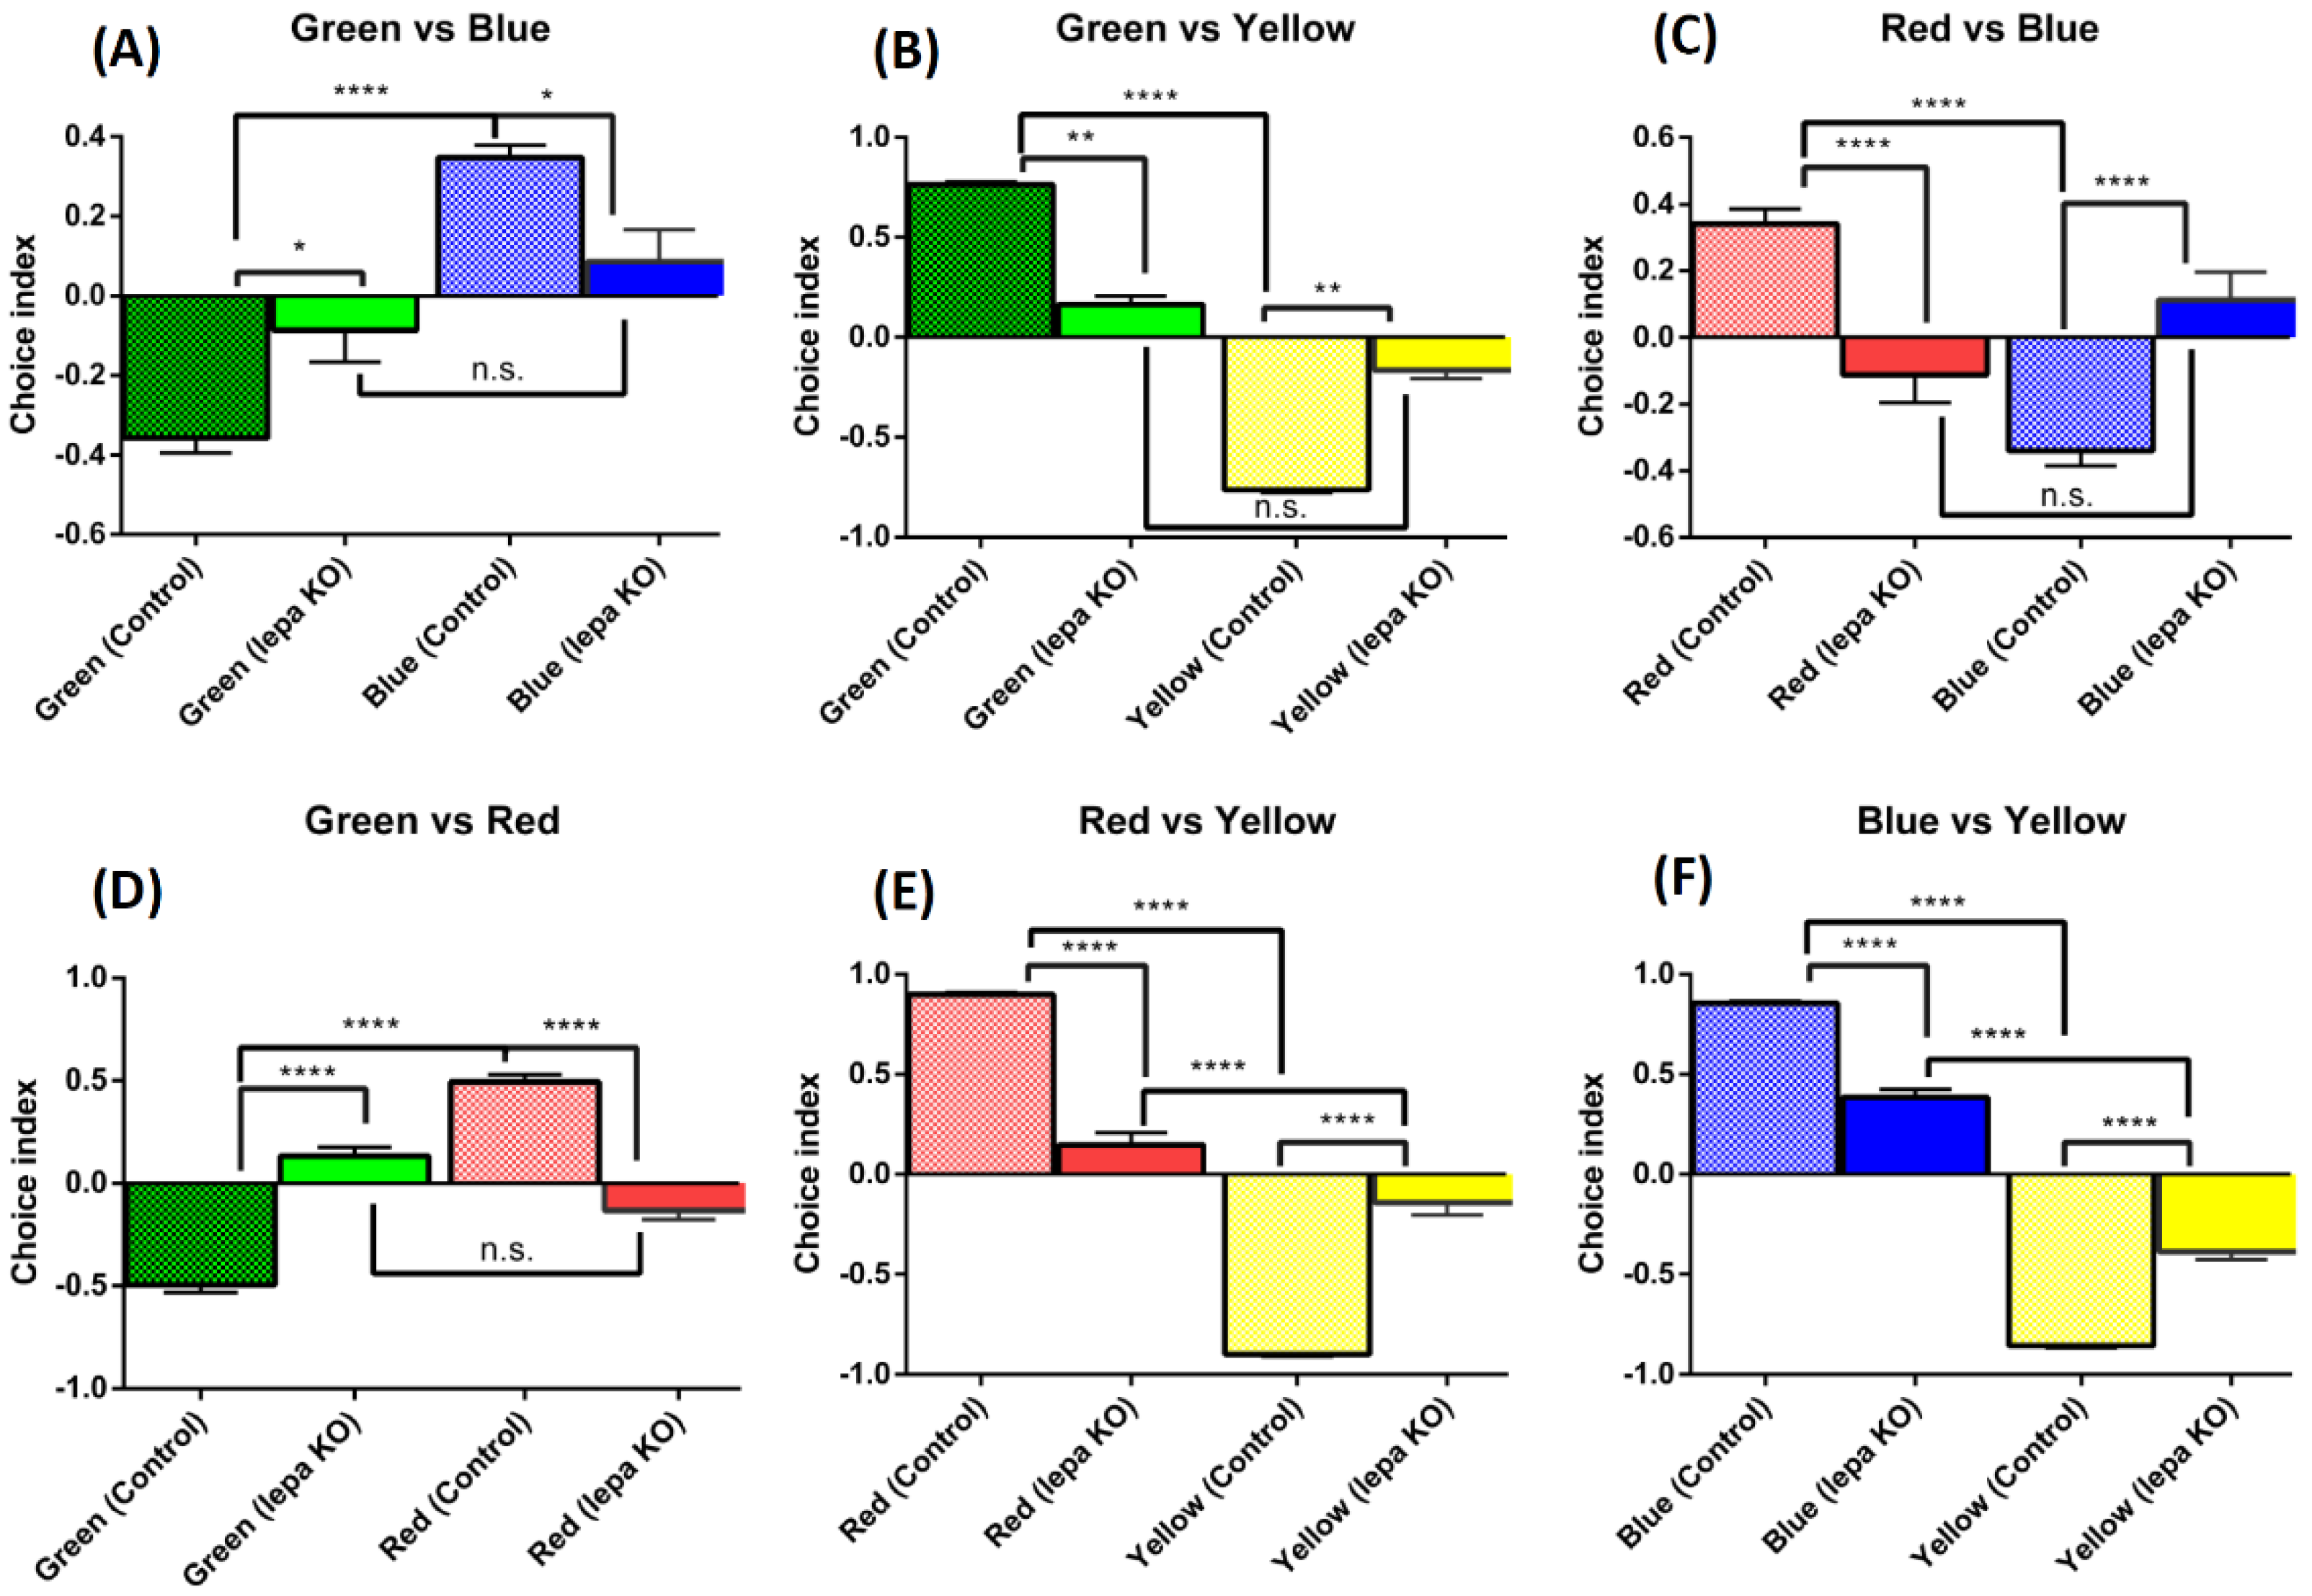
2.6. Lepa KO Zebrafish Displayed Reduction of Color Preference

Since lepa KO fish display less aggression on mirror biting assay, we wondered whether the lepa KO fish would also show less general interest in other issues. We tested this hypothesis by performing color preference test. For normal condition, the wild type fish displayed normal color preference in the following sequence of: red > blue > green > yellow. However, the color preference test showed that the lepa KO zebrafish have different color preferences compared to the wild type zebrafish (Figure 6). Overall, their color preferences were reduced for all color combinations and the preference shifted to: blue = green = red > yellow. In green and blue combination, the wild type preferred blue color (p < 0.0001), but in lepa KO fish the result showed there was no preference between blue or green (p > 0.2048) (Figure 6A). In green and yellow combination, the wild type preferred the green color (p < 0.0001) and lepa KO fish showed no preference for green or yellow (p > 0.1638) (Figure 6B). Wild type zebrafish showed red color preference in red and blue combination (p < 0.0001), but the lepa KO fish showed no preference for either color (p > 0.0895) (Figure 6C). The green and red combination test showed red preference in the wild type (p < 0.0001), but no preference for lepa KO fish (p > 0.0558) (Figure 6D). The red and yellow combination test showed the wild type and lepa KO fish still preferred the red color over yellow color, but their preference intensity was reduced significantly (p < 0.0001) (Figure 6E). The blue and yellow combination test also showed wild type and lepa KO fish prefer blue color over yellow color and the intensity also reduced significantly (p < 0.0001) (Figure 6F).

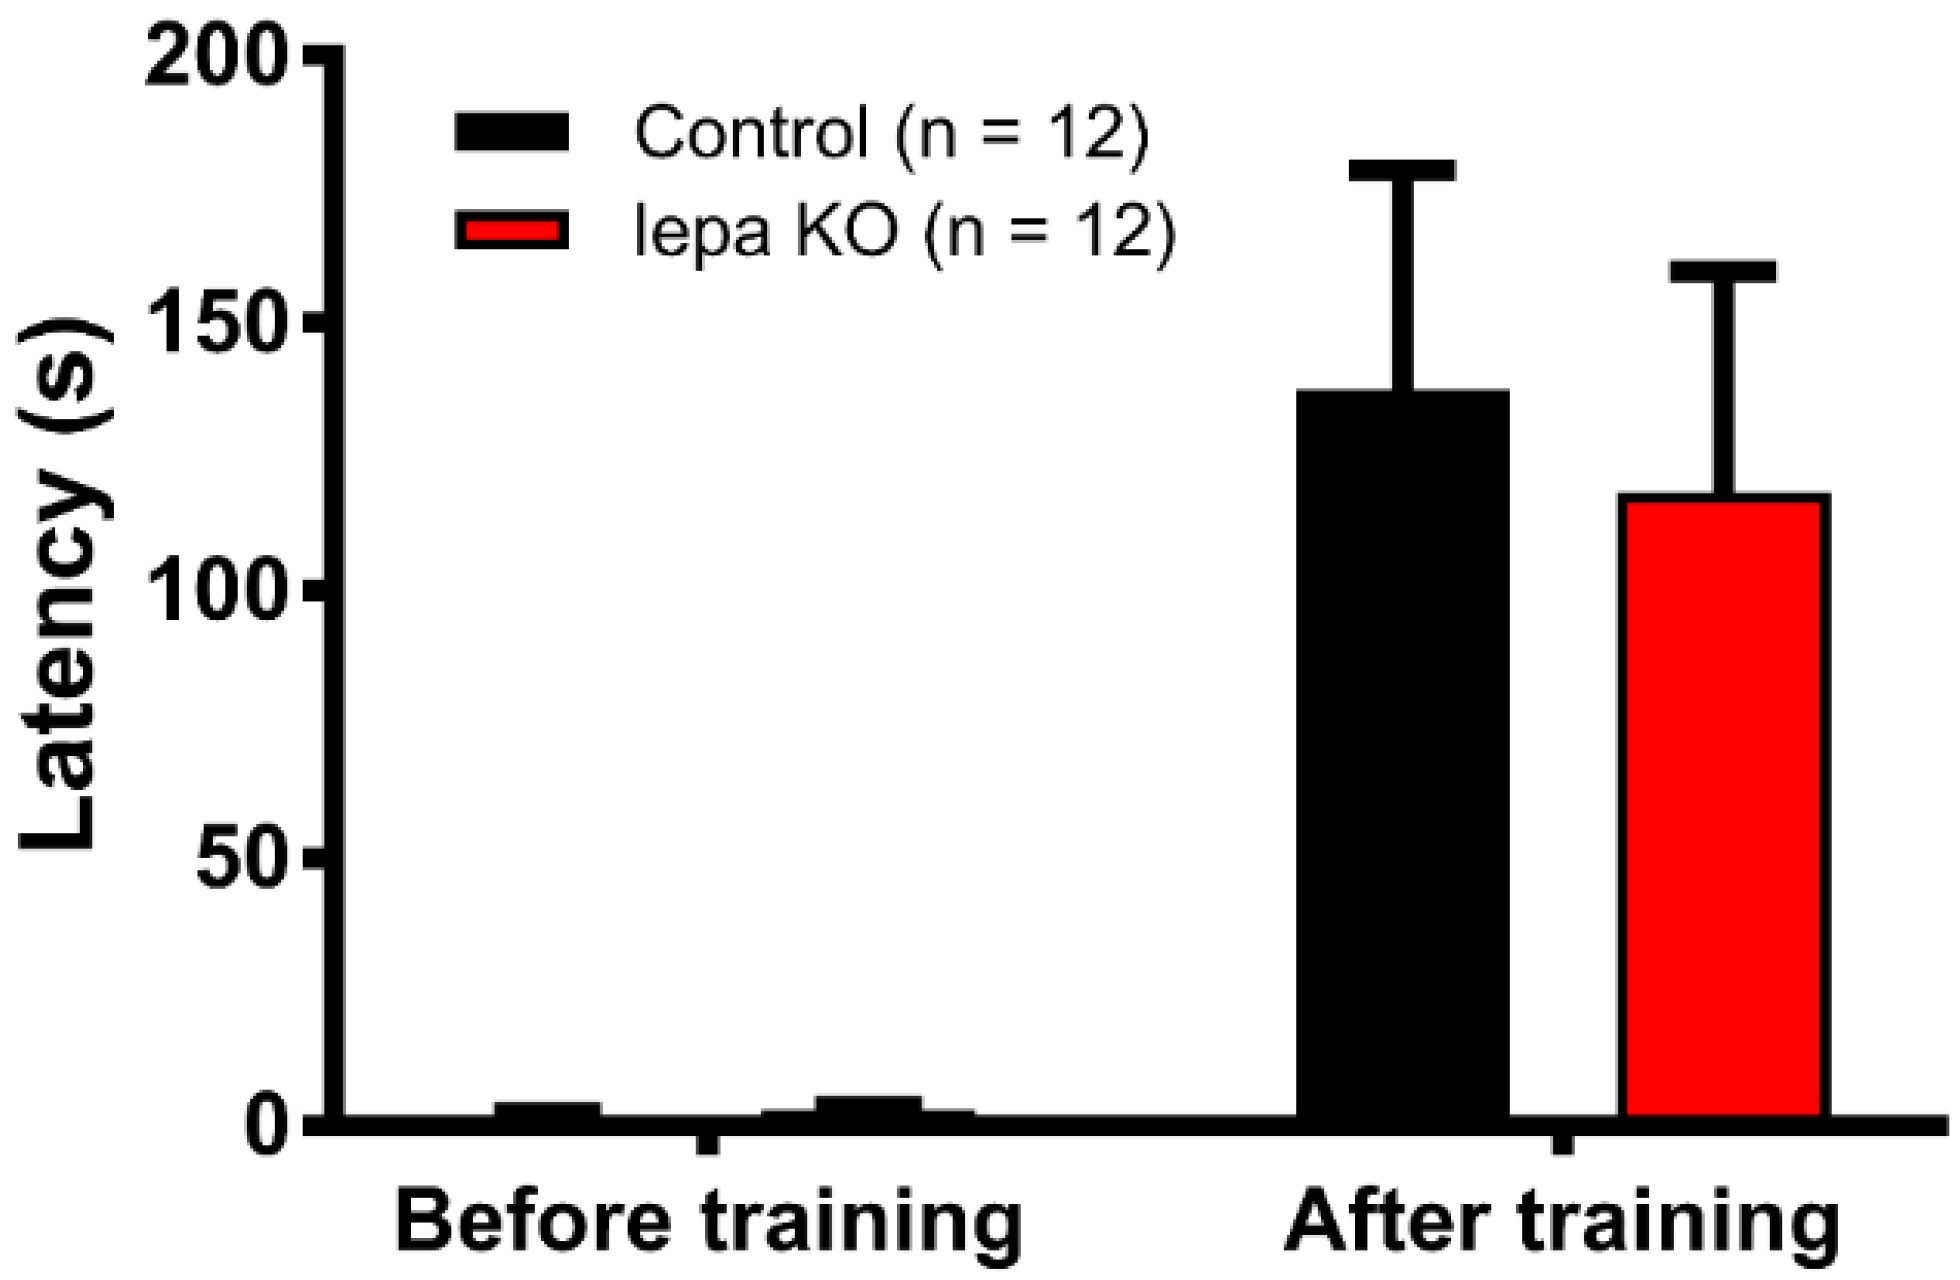
2.7. Lepa KO Zebrafish Display Normal Short-Term Memory

In rodents, the obese rat triggered by high fat diet shows spatial memory impairment [45]. The impairment of long-term potentiation and spatial memory in leptin receptor-deficient rat has been reported [46]. In addition, the administration of leptin can reduce pathology and improve memory in a transgenic mouse model of Alzheimer’s disease [47]. This combinational information suggests leptin might also play a role in memory in zebrafish. We tested this hypothesis by performing passive avoidance assay to test the short-term memory on avoiding the electric shock in the dark chamber. Results show both control and lepa KO fish display similar latency or retention time on moving to the punishment compartment (black box) on both training and testing session, indicating the short-term memory was maintained at same level between control and lepa KO fish (Figure A1). This result indicates that lepa KO fish display similar short-term memory level with wild type fish.

2.8. Dysregulation of Appetite-Controlling Hormones in the Lepa KO Fish

The multiple behavioral abnormalities in lepa KO fish prompted us to address the underlining mechanism. By performing ELISA with antigen-specific antibodies, we quantitatively compared the neurotransmitters and other biochemical markers between control and lepa KO fish (Table 1). We used creatinine as an internal control marker due to its stable production rate. For obesity-related phenotype, first, we measured the leptin content in brain and muscle by ELISA. Results show that the leptin content was about two- and four-fold reduced in brain and muscle tissues, respectively, in the lepa KO fish. Leptin is secreted from peripheral adipose tissue and then feeds back target to the leptin receptor in the brain. For leptin receptor, we found it was two-fold upregulated in lepa KO fish brain, suggesting this upregulation of leptin receptor might function to compensate for the loss of leptin in lepa KO fish. For AgRP and Ghrelin, as two important hormones in stimulating appetite, we found their levels were about two- and four-fold upregulated in lepa KO fish brain. In addition, we also found two-fold upregulation fofor glucose and two-fold reduction of insulin levels in lepa KO fish brain. This result suggests the lepa KO fish failed to maintain constant levels of glucose and insulin compared to the control fish.

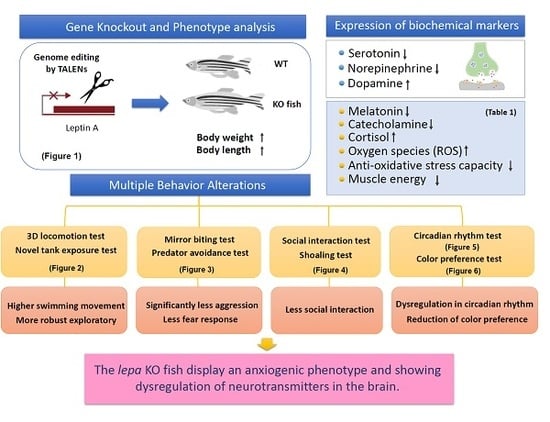
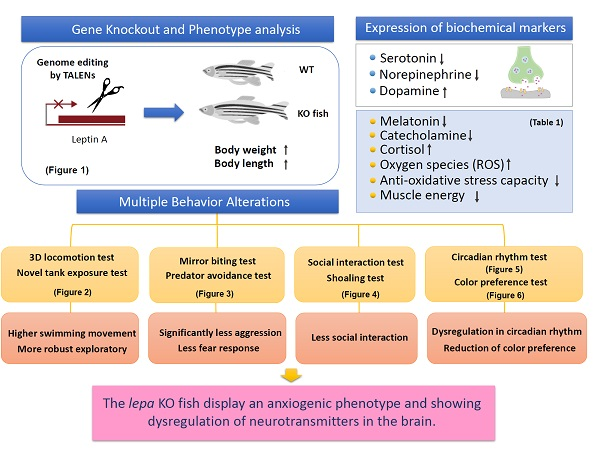
2.9. Dysregulation of Neurotransmitter in the Lepa KO Fish Brain

For behavior alteration issue, we measured seven major brain neurotransmitters, including serotonin, norepinephrine, glycine, dopamine, histamine, acetylcholine and melatonin, by ELISA. Our results show a 12-fold reduction in both serotonin and norepinephrine levels in lepa KO fish brain. Serotonin is known to suppress appetite [48,49,50]. Our data in lepa KO fish were consistent with the findings that induction of depression and greatly enhancement on appetites in higher vertebrates when serotonin level is reduced [51,52,53]. Norepinephrine is a hormone controlling mobilization between brain and muscle. Consistent with previous study demonstrating that animals show depression and lack of motivation due to low level of norepinephrine [54,55], we found that the low level of norepinephrine was expressed in lepa KO fish, which showed reduced aggression and predator avoidance behaviors. In addition, elevation of glycine and dopamine in lepa KO fish brain was observed. The elevation of dopamine in lepa KO fish confirmed that leptin signal plays a role in controlling dopamine-associated system to suppress feeding [56,57]. Dopamine elevation in lepa KO fish may trigger the signal of food cravings (by showing hyperactivity) beyond necessary and therefore weight gain ensued. The hyperactivity in lepa KO fish led us to ask whether this intriguing phenotype was contributed from high energy storage in the muscle. By using ELISA, we found the creatine kinase and ATP levels were four- and three-fold reduced in lepa KO fish muscle. This result indicates the energy storage in the muscle was greatly reduced in lepa KO fish.
Although we did not identify memory impairment in the lepa KO fish, a great reduction for the ACh (acetylcholine), a major memory-related neurotransmitter, was detected in lepa KO fish brain. Other markers for Alzheimer’s disease such as amyloid Aβ and p-Tau showed no difference between wild type and lepa KO fish. In lepa KO fish, we found the circadian rhythm was dysregulated by showing very high locomotion activity during both day and night cycles. By ELISA, we confirmed the sleeping control hormone of melatonin was 12-fold downregulated in lepa KO fish brain, suggesting dysregulation of circadian rhythm in lepa KO fish was due to low level of melatonin.

2.10. Leptin Deficient Zebrafish Exhibited Greater Oxidative Damage in the Brain

The enunciated anxiety and hyperactivity in lepa KO fish led us to hypothesize that the stress hormone levels in the brain tissues were elevated. To this end, we measured the catecholamine and cortisol levels by ELISA. The results show that the level of catecholamine was three-fold decreased in lepa KO fish, while the level of cortisol in lepa KO fish brain was 1.5-fold increased. The intracellular ROS (reactive oxygen species) level was two-fold elevated and the anti-oxidative stress enzyme of catalase level was 22-fold reduced in lepa KO fish. In line with the body of literature suggesting a direct regulatory role of reactive ROS on HIF-1α [58,59], the level of HIF-1α was found to be significantly elevated in muscle tissues of the leptin deficient fish. Oxidative stress and inflammation are concatenated processes that are usually activated in cells due to stress [60]. However, we found that TNF-α, IL1β and histamine showed no significant difference in lepa KO fish brain compared to the wild type fish brain.

3. Discussion

Leptin is a molecular link between fat and the brain. In addition to its canonical role on appetites control, in this study, we provide direct in vivo evidence to support that lepa gene plays important roles in behavior control such as anxiety, aggressiveness, fear and circadian rhythm in zebrafish. By ELISA, we also provide biochemical data showing the dysregulation of neurotransmitters (i.e., serotonin, norepinephrine and dopamine) in the brain of lepa KO fish. Recent works have demonstrated direct leptin effects on dopamine neuron function and behavior, in which peripheral hormones influence behaviors and contributes to a more comprehensive model of neural control over food intake [61,62,63,64]. The lack of control over food intake bears resemblance to drug addiction, where loss of control over behavior leads to compulsive drug use. In addition to leptin, serotonin and dopamine regulate the feeding behavior and metabolic processes that involve energy expenditure through their effects on the activity of the pro-opiomelanocortin (POMC)-expressing neurons of the hypothalamic arcuate nucleus (ARC) [65,66,67,68].

3.1. Leptin and Leptin Receptor Mutant Fish

Two leptin genes and one leptin receptor gene have been identified and characterized in zebrafish genome. In previous studies, by using genome editing approach, zebrafish mutant lines carrying lepa, lepb, or lepR gene deficiency have been generated [69]. However, unexpectedly, there was only slightly pancreaticβ-cell hyperplasia with no obese phenotype reported in all three zebrafish mutant lines. However, in medaka fish, leptin receptor deficiency leads to obesity [70]. In this study, we reported a zebrafish mutant line carrying lepa gene deficiency that displayed a typical obesity phenotype showing faster growth rate, obese, higher appetites and appetites-controlling neuropeptide dysregulation. The discrepancy in lepa KO phenotype reported by different research groups might be due to the different alleles that have been mutated. Similar phenomenon has been reported in human patients showing different degrees of obesity by carrying different mutated leptin genotypes [71]. The lepa KO fish reported in this study provides an excellent and better model for obesity study in the future.

3.2. Behavior Alterations in Lepa KO Fish

In addition to obesity, we reported lepa KO zebrafish displayed hyperactivity, altered aggressiveness, social interaction, and predator avoidance behaviors for the first time. These findings provide strong evidence for a critical role of lepa gene on modulating anxiety-like behaviors in zebrafish, which has been demonstrated by pharmacological studies in rat models showing leptin has anti-depressant-like properties [72]. Diabetic rats expressing low level of leptin show hyperactivity behavior with increase of total movement time, and high anxiety levels than the control group in elevated plus maze test [73]. In zebrafish, hyperactivity or hyperlocomotion has been well addressed as an anxiety-related behavior and related to psychostimulant/convulsant action [73].
The aggression behavior is generally controlled by multiple hormones in the brain, such as neuropeptide hormone oxytocin and several classes of steroid hormone, including androgens and estrogen [74]. In addition, the primary hormone involved in aggressive behavior is the sex hormone testosterone [75]. However, whether leptin plays a role in aggression is rarely investigated. Recent studies reveal that high fat diet and high cholesterol diet cause Göttingen minipigs to become less aggressive and less fearful [76]. However, the leptin level has not been analyzed in this diet-induced-obesity (DIO) minipig model. Our model provides direct evidence that link leptin gene function to aggression using a well-established paradigm of mirror biting that is traditionally used for fish aggressive behavior studies [77]. Our result also showed that the lepa KO mutant fish exhibit similar behavioral deficits in social interaction test, a test to assess zebrafish sociability by observing the interaction between fish and its conspecifics [77]. The anxiogenic effect of loss of lepa gene was corroborated by our finding that slightly increase in average distance to separator between the mutant fish and conspecifics (Figure 3). This phenomenon was observed during the test and might be related to the hyperactivity behavior that they showed during this test. In mouse, leptin’s effects on social interaction have been reported. In agreement with our result, acute administration of leptin at 1 mg/kg reveals that distinct social behavioral components are modulated, as indicated by the increased total time of active social behaviors [77].
A related social behavior, shoaling behavior, is common in many species of fish representing the complex interactions of animals moving together in coordinated movements. This behavior is related to foraging, mating, fear response, and defense against predators [78]. Previously, it has been shown, in zebrafish, that alcohol and nicotine cause anxiolytic behavior, which results in a significantly loosened shoal [79]. In addition, hallucinogenic drug lysergic acid diethylamide (LSD) evoke hallucinogenic and/or anxiolytic-like effects, with disrupted shoaling and increased average inter-fish distance [76]. To shoal, fish must prefer to approach and remain near conspecifics. Behavioral deficits in social interaction of the lepa KO mutant fish may result in loose shoals forming with increased average shoal area and average nearest neighbor distance. Taken together, deficiency of lepa gene in zebrafish showed loose shoal, indicative of social withdrawal behavior in lepa mutant fish.
Fear, as a response to imminent threat, has been studied as reactions to alarm pheromone and predators in zebrafish [80]. Leptin has been identified to play an anxiolytic function by facilitating fear extinction in rat model using a gain-of-function assay [81]. In this study, we provide direct evidence of the role of lepa gene in fear extinction. In our predator avoidance test, lepa KO mutant fish generally did not respond to predatory species with fear reactions and preferred to spend more time close to a predator fish. This interpretation was corroborated by the low level of catecholamine, a stress hormone, found in the mutant fish brain. On the other hand, fat accumulation in body often is associated with an increased risk of predation. Moving phylogenetically closer to humans, it is obvious that excess body fat is not favorable in primates whose defenses against predation depends on the ability to move and the speed of movement [81,82]. In addition, fear response of zebrafish also includes forming stronger shoal cohesion [80]. Therefore, loss of fear response in lepa KO mutant fish could also be a reason for the loose shoal observed in the shoaling test in the present study.
Leptin fluctuation in serum is influenced by circadian rhythm. The leptin level is relatively low during daytime and is high at night [83]. Circadian rhythm disruption leads to leptin dysfunction, implicating the central clock in body weight control [84]. However, little is known about how leptin gene plays a role in zebrafish circadian rhythm control. Here, we showed a novel finding indicating circadian rhythm deregulation in lepa KO fish. It has been shown that obese rats exhibited abnormalities in circadian-related patterns, such as equal distribution of slow-wave sleep and paradoxical sleep throughout the light–dark cycle, abnormality of thyroid-stimulating hormone level, and no circadian rhythms of activity after 30 weeks of age. The abnormal circadian variations in sleep, thyroid-stimulating hormone level and corticosterone seen in mutant rats suggest the possibility of a neural deficit in the circadian timing system [85]. Kohsaka and colleagues also showed that a high-fat diet in mice led to changes in the period of the locomotor activity rhythm and alterations in the expression and cycling of canonical circadian clock genes [86]. Taken together, these results indicate that consumption of a high-calorie diet alters circadian clock in mammals. Melatonin has been reported to have direct effect on inducing sleep in human [87]. The biochemical assay showed the lower expression of melatonin may cause dysregulation of circadian rhythm in zebrafish. Therefore, high activity of lepa KO zebrafish at night may be attributed to low melatonin level.
Color vision is one of the most important modalities in the recognition of biologically important stimulation, and thus it plays a critical role in visual perception. The lepa KO fish showed distinct color preference pattern compared with the wild type fish, with the lepa KO fish losing the preferences for red, green and blue color. Similar to wild type fish, the lepa KO fish also avoided yellow color, suggesting that the lepa KO fish was still able to distinguish different colors. The color preference of depression induced zebrafish was similar to that of the lepa KO fish pattern found in the present study, with no preference among blue, red and green color [88]. It has been reported that humans with depression are likely to choose neutral colors such as grey and black compared with healthy humans who would choose blue and red color [89]. Together, these results lend further support for the notion that lepa mutation may lead to cognitive disorder and depression. Due to its relative simplicity and ease, color preference screening using zebrafish is suitable for high-throughput screening applications. This system may potentially be applied to the analysis of drug effects on zebrafish behavior or the detection of sensory deficits in neurological disorder models, such as autism-related disorders.
Serotonin is believed to influence a variety of psychological conditions and has been implicated in cognition, mood, anxiety and psychosis. This includes brain cells related to mood, sexual desire and function, appetite, sleep, memory and learning, temperature regulation, and some social behaviors [90]. Imbalance in serotonin levels may influence mental condition that leads to depression [91,92]. In this study, the most significant finding is the great reduction of serotonin level in lepa KO fish brain. The low level of serotonin in lepa KO fish brain might be due to low brain cell production of serotonin, a lack of receptor sites able to receive the serotonin that is made, inability of serotonin to reach the receptor sites, or a shortage in tryptophan, and need further studies to clarify this hypothesis. Certain genetic variations may predispose people to develop anxiety disorders. Another neurotransmitter associated with anxiety is norepinephrine, which also showed great reduction in lepa KO fish model. The serotonin system has reciprocal interactions with the norepinephrine system. Patients with anxiety disorders such as panic disorder have increased norepinephrine reactivity and/or tone. In addition, the low norepinephrine level in lepa KO fish may reduce the aggressive response by showing less fear response in predator avoidance test.

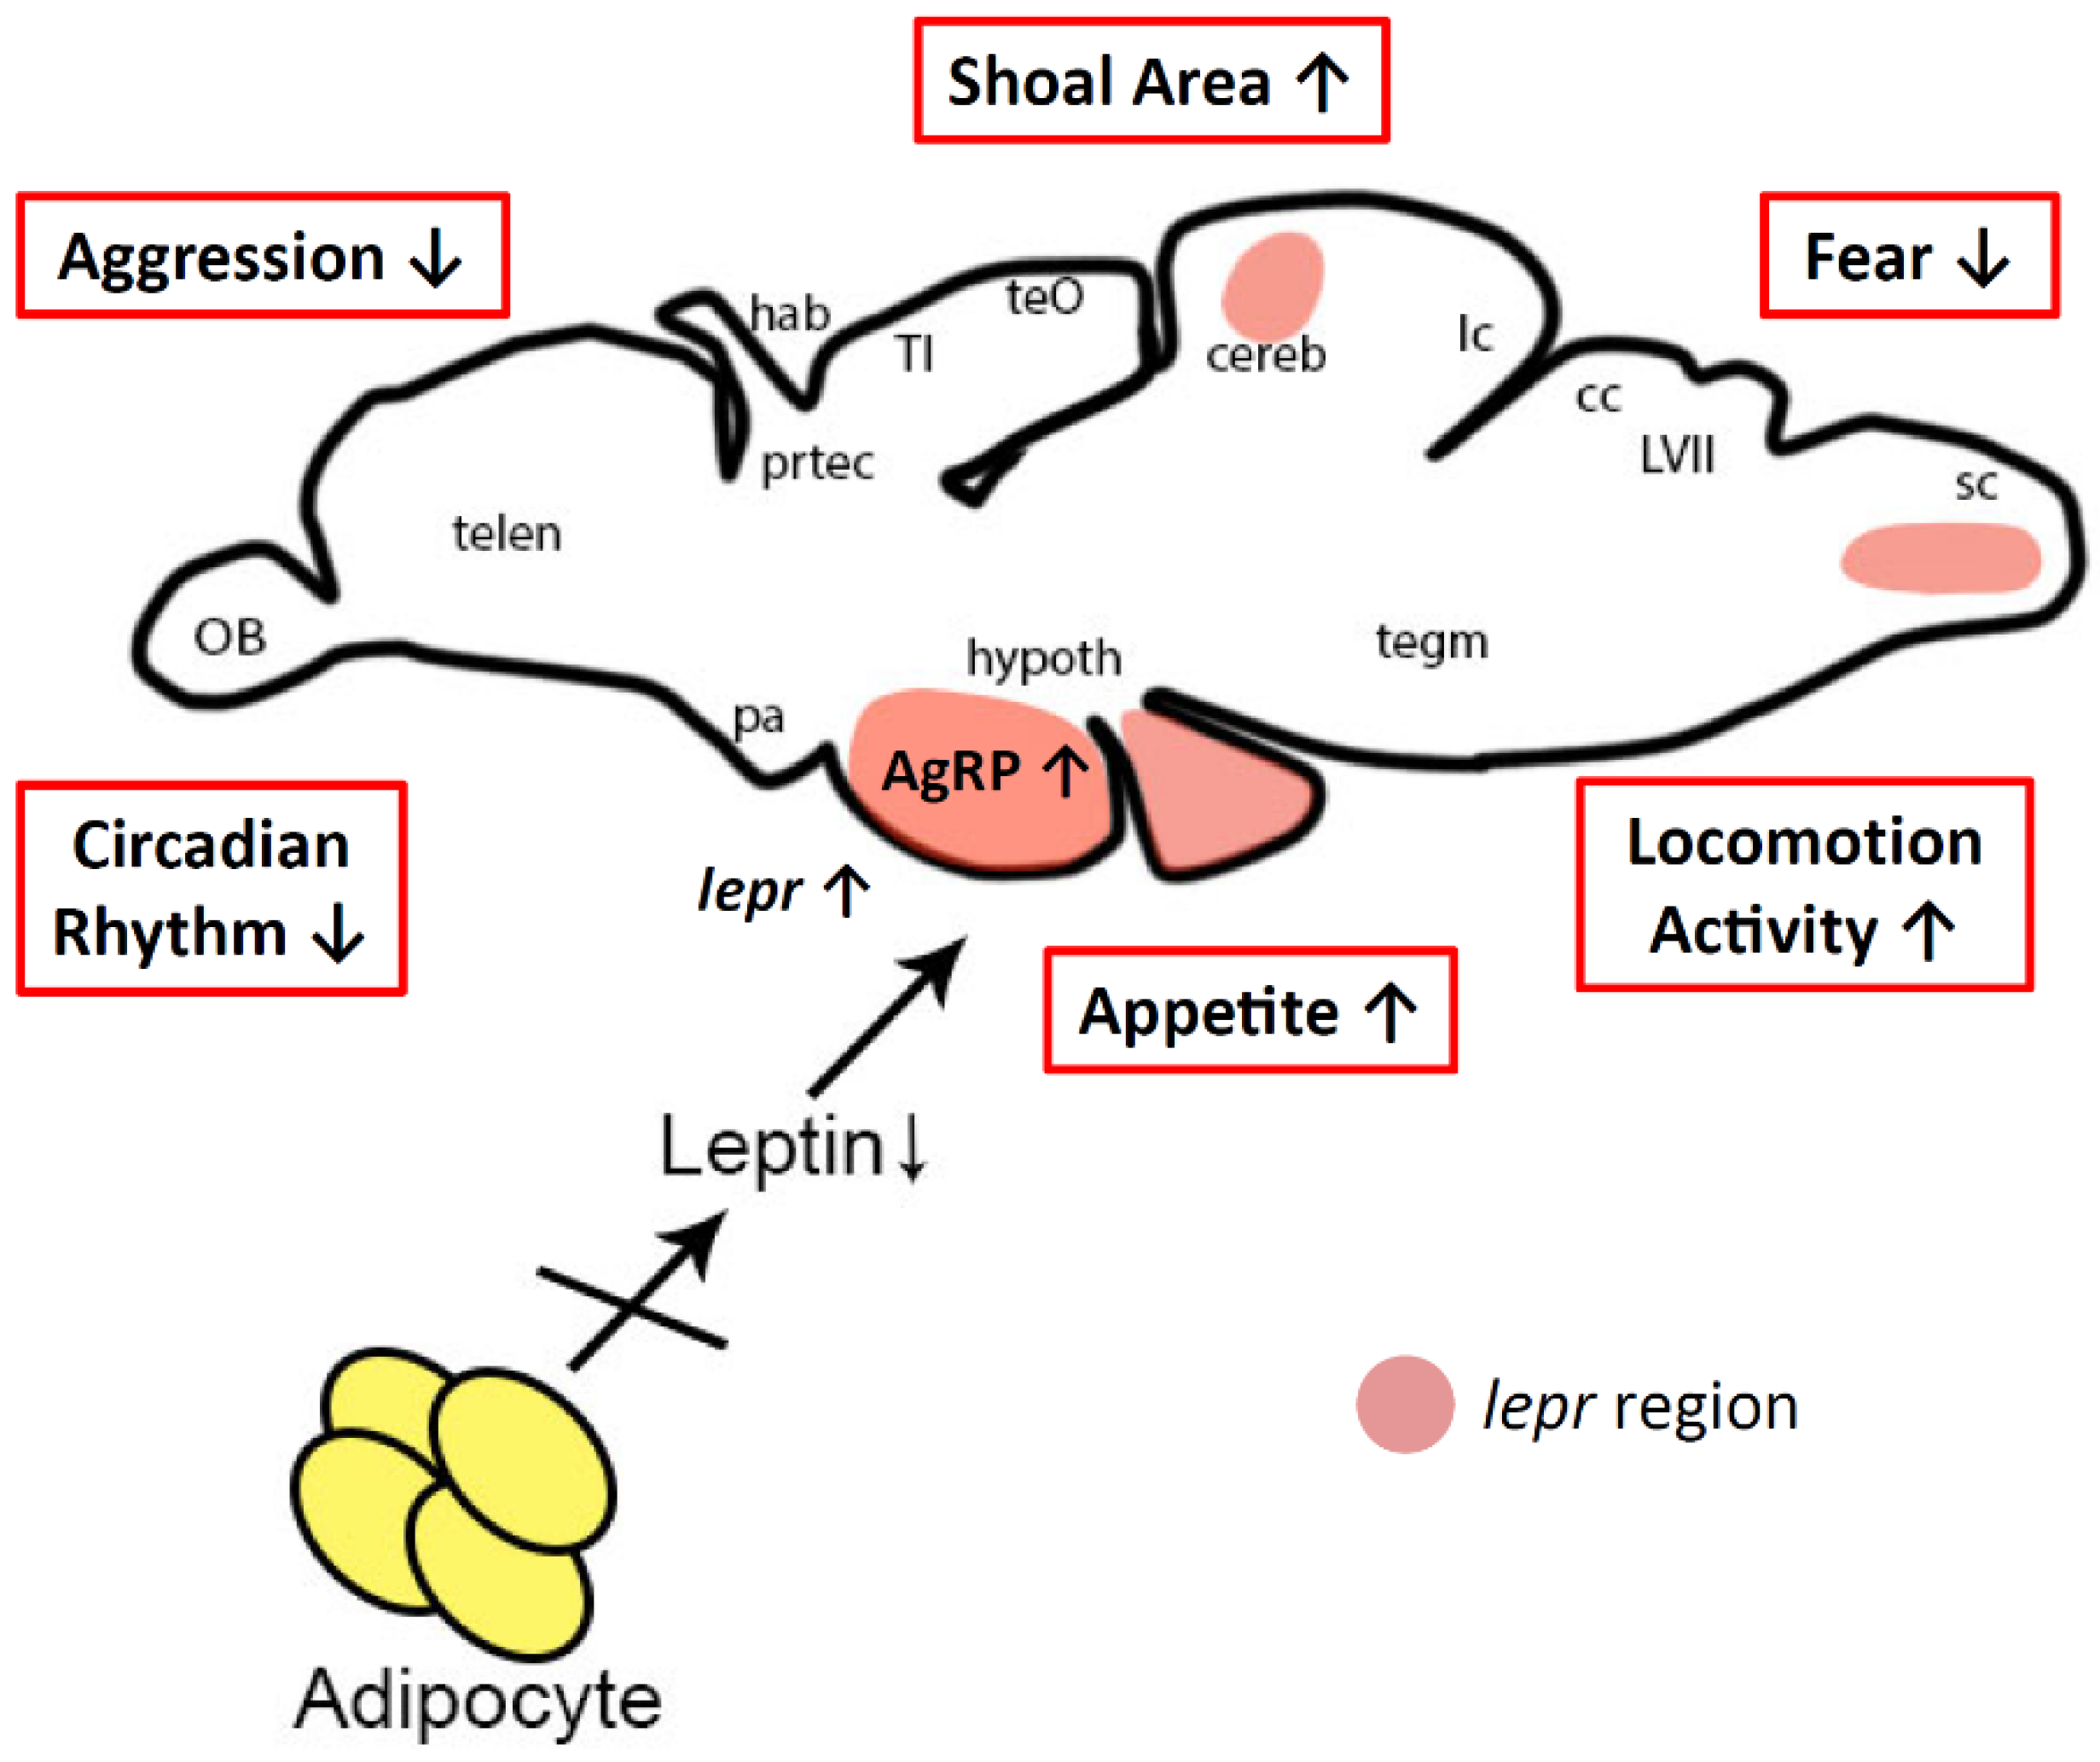
3.3. Possible Mechanism for Behavior Alterations in Lepa KO Fish

Although the mechanisms for behavior alteration in lepa deficiency zebrafish remain speculative, high level of leptin receptor expressed in the brain and its substantial roles may be involved. The behavior changes are also suspected to be related with the depression behavior due to the lepa gene mutation that alter the serotonin and norepinephrine levels. Depression is reported to have a shared biological mechanism with obesity [93], which js influenced by food uptake and storage of energy that are known to be regulated by leptin. Interestingly, leptin has been reported to affect the development of the brain. Conceivably, leptin may affect the brain neurocircuitry and hypothalamic organization in early life [94]. Zebrafish leptin receptor (lepr) is detected in both of embryonic and larval stages, and in adult zebrafish. In embryonic zebrafish, lepr is mainly expressed in the notochord and it will decrease as development proceeds, while its expression in several other tissues including the trunk muscles and gut become evident [95]. Despite strong evidence showing lepr in other sites, the brain is the major sites that mediates the function of leptin. Inside the brain, the most abundant expression of lepr is exhibited by the hypothalamic lateral tuberal nucleus, the fish homolog of the arcuate nucleus. Meanwhile, outside the hypothalamus, lepr is also expressed in cerebellum, vagal lobe, hindbrain and other sites [95,96]. In general, leptin has pleiotropic effects, playing a key role in physiology including controlling various aspects of energy intake and expenditure, including centrally inhibiting appetite and suppressing lipogenesis, and influencing the stress response via the hypothalamo-pituitary-adrenal (HPA)-axis [97]. Major depression in human is often linked to deregulation of the endocrine stress system, particularly the HPA-axis [98,99]. HPA-axis is activated when the organism is exposed to a threatening stressor, and its stress adaptation response acts to maintain or restore the dynamic equilibrium (homeostasis) of body and mind [95]. In addition, the molecular and functional characteristics of the mammalian HPA-axis are highly conserved in zebrafish [100]. In zebrafish, HPA-axis is fundamental to stress responses, and involves a cascade of hormones from corticotropin releasing hormone (CRH) to adrenocortocotropic hormone (ACTH) and cortisol [101]. Our data support a significant higher cortisol level in lepa KO fish, which was consistent with previous study using mouse model showing elevated cortisol level in lack of leptin mice [102]. This finding is in line with previous study by Hewagalamulage et al. who highlighted that deregulation activity of the HPA-axis may not merely be a consequence of the obese state and high cortisol responsiveness affects an individual’s weight gain [103]. In parallel with our finding, the HPA-axis has complex interactions with serotonin, norepinephrine, and dopamine, which predicates that dysregulation of these hormones may cause mood disorder and depression [104]. Alternatively, expression of lepr (leptin receptor message) is also largely detected in the similar regions of the hindbrain (medulla oblongata) of both larval and adult zebrafish brains, which is similar to rodents. Furthermore, in five-day-old zebrafish larvae, the hindbrain lepr-expressing cell identity are already established, suggesting that the leptin-sensitive neural pathways are evolutionarily conserved [95]. The organization of hindbrain has elements of the same structural and functional network plan to the patterning in spinal cord and these two regions play a key role in generating all of the motor output from the nervous system [105]. In addition, previous study has shown hindbrain, together with the Mauthner cell and its serial homologs, serves to control the directionality of the escape behavior that fish use to avoid predators [106]. Although we established the correlation between lepa gene loss-of-function and behavioral abnormality, it is still unclear the underlying mechanism or neural circuit that is responsible for the observed behavior alteration in our lepa deficiency zebrafish model. It is certain that decreased leptin levels in lepa KO fish would modulate some region-specific brain function (as summarized in Figure 7). Future studies are considered necessary to address the expressional territories of leptin receptor or other neurotransmitters in the brain of lepa KO fish by using in situ hybridization or immunohistochemistry. In addition, some useful enhancer-trap transgenic lines showing neuron circuit-specific expression of green fluorescent protein (GFP) can be used to study the potential abnormality of neural circuit in lepa KO mutant [107,108,109].
In summary, by using loss-of-function assay approach, we report a lepa KO fish line showing obesity, hyperactivity, anxiety, less aggression and fear, and circadian rhythm and color preference dysregulation behaviors for the first time in zebrafish. This mutant model greatly facilitates gaining better insight into the non-canonical functions of leptin on behavior controls.

4. Material and Methods

4.1. Animal Ethics and Rearing

All experimental protocols and procedures involving zebrafish were approved by the Committee for Animal Experimentation of the Chung Yuan Christian University (Number: CYCU104024, issue date 21 December 2015). All experiments were performed in accordance with the guidelines for laboratory animals. Wild-type AB strain and lepa KO zebrafish were maintained in a recirculating aquatic system at 28.5 °C with a 10/14-h dark/light cycle according to standards. Circulating water in the aquarium was filtered by reverse osmosis (pH 7.0–7.5). The zebrafish were fed twice a day with lab-grown brine shrimp. For behavioral tests, we used adult zebrafish aged around 6–7 months.

4.2. Production of TALEN mRNA

The customized TALEN vectors were purchased from Zgenebio Inc. (Taipei, Taiwan). The TALEN target site was designed to target exon 2 of zebrafish leptin, which is located on chromosome 18 (ENSDARG00000091085). The TALEN target sequences TGACCAGATACGCCGAGatctatccacacttcTGGGTTACCTGGAAGGC (recognition sites are capitalized and underlined, and spacer is between two recognition sites). TALEN vectors were linearized with Not1 restriction enzyme and transcribed using mMESSAGE mMACHINE SP6 kit (Life Technologies) to synthesize 5’capping TALEN mRNAs. Following completion of transcription, poly(A) tailing reaction and DNase I treatment were performed according to the manufacturer’s instructions for the TALEN mRNAs. To enhance the purity, the in vitro transcribed TALEN mRNAs were then filtered and enriched by using YM30 column (Merck, Darmstadt, Germany).

4.3. Microinjection of Zebrafish Embryos

TALEN mRNAs were co-injected with Transposase mRNA into one-cell stage zebrafish embryos. Each embryo was injected with approximately 2 nL of solution containing 50 pg/nL of TALEN mRNA. On the next day, the injected embryos were inspected under a stereoscope. Only embryos that developed normally were used for analyses. Genomic DNA was extracted from embryos one day after injection for HRM (High Resolution Melting) assay.

4.4. Identification of Indel and Targeted Mutations by HRM Assay

Genomic DNA was extracted from pools of 10 embryos. Targeted genomic loci were amplified by using primers designed to anneal approximately 150–200 base pairs upstream and downstream from the expected FokI cut site and KOD FX high-fidelity DNA polymerase (TOYOBO) according to the manufacturer’s instructions. HRM assay was performed by using MyGO pro (IT-IS Life Science Ltd. Cork, Republic of Ireland). Each target locus was amplified by PCR from pooled genomic DNA of ten injected embryos. The resulting PCR products were cloned into the pGEM-T vector (Promega, Madison, USA) and transformed into bacteria. Thus, each colony represented one PCR amplified sequence.

4.5. Genotyping of Lepa KO Fish

At 3–4 days post-fertilization, 20 progenies were pooled and lysed in 25 mL of the alkaline lysis buffer (25 mM NaOH, 0.2 mM EDTA) and heated at 95 °C for 30 min. DNA solution was neutralized using 25 mL of the neutralization buffer (40 mM Tris-HCl, pH8.0). Samples were centrifuged at 3000 g for 5 min, and the supernatant contained extracted genomic DNA. In general, 20 embryos from each potential founder were screened for the presence of indel mutations by HRM amplifying the region surrounding the relevant TALEN FoKI cleavage site using a forward primer and a reverse primer. For sequence confirmation, genomic DNA from single embryos was amplified using targeted loci-specific primers. The PCR products were then submitted for Sanger sequencing. Mutant fish lines generated will be provided upon request.

4.6. Body Length and Body Weight Measurement

Mixed gender of wild type and lepa KO fish were raised in 10 L tanks separately until three months old (n = 60 for each group). Fish were transferred and raised in 100 L tanks. All the fish were feed with artemia twice per day and kept at constant temperature of 28 °C. The standard body length, body weight and survival rate were measured every month from 3 to 7 months old.

4.7. Zebrafish 3D Locomotor Activity

Three-dimensional locomotor activity was tracked according to a previously described protocol [45]. The 3D locomotion activity of six fish each recording time were held in an acrylic tank (20 cm × 20 cm × 20 cm dimension with 15 cm high water level).

4.8. Passive Avoidance Test (Short-Term Memory Test)

To evaluate the potential short-term memory impairment in lepa KO fish, the passive avoidance test was carried out according to previously published paper with minor modification [110]. The test included two sessions with an interval of 24 h. In each session, fish was placed individually in an acrylic tank (20 cm × 20 cm × 20 cm) divided by a door into black and white compartments with equal size. In the training session, the fish was placed in white compartment, with the door closed for one minute for environmental acclimatization and recognition. Next, the door was lifted, and the fish crossed over to the dark side of the tank. When fish passed the dark area, the door was again closed, and was subjected to a mild electric shock (25 V, 1 mA) of a 5 s interval. On the other hand, when fish passed the white area, fish was pushed back to the dark area and shocked again until the fish passed to the white region. The training was repeated for maximum of three attempts until the fish passed to the white side. The fish that completed the training was stored into small plastic container (15 × 10 cm × 5 cm) and kept at 28 °C. After 24 h, the fish was put into the training apparatus and tested for the latency to pass to the dark area. The latency observed in the test session was used as an indicator of short-term memory retention.

4.9. Aggressiveness Test

Aggressive behavior was determined in adult zebrafish based on the mirror test described before [111,112]. The test tank (28 cm × 5 cm × 15 cm) was filled with 1 L water where a mirror was at the side of the tank. After 1 min of fish introduction into the tank, aggressive behaviors (bites and fast swimming) were recorded for a period of 5 min.

4.10. Circadian Rhythm Test

To analyze zebrafish locomotion activity during day and night, we performed circadian rhythm test based on previous published method with some modifications [113]. To prevent any external disturbance, the tested fish were moved into a temperature-controlled incubator and kept at 28 °C. A specially designed LED light box with conventional and infrared LED array were used as bottom light source. An infrared sensitive CCD (700–1000 nm detection window) with maximum resolution at 1920 × 1080 pixels and 30 fps frame rate was used for video recording (3206_1080P module, Shenzhen, China). In this experiment, we recorded zebrafish locomotion activity (average speed, average angular velocity and meandering) for 1 min every hour and used idTracker software [114] to track fish movement trajectories according to our previous published method [45].

4.11. Predator Avoidance Test

The predator avoidance test was performed based on the mirror test described previously with minor modification [86]. The test tank (28 cm × 5 cm × 15 cm) was filled with 1 L water where a transparent separator was placed in the middle of the tank. The predator Convict cichlid (Amatitlania nigrofasciata) was placed in the left and zebrafish was put in the right area. After fish introduction into the tank, the predator avoidance behaviors (average speed, maximum and minimum speed, distance traveled, freezing, swimming, and rapid time movement percentage, top/bottom ratio of time spent and traveling distance, predator approaching time percentage, and distance to predator separator in average) were recorded for a period of 5 min.

4.12. Color Preferences Assay

The color preference assay was done in in a 21 cm × 21 cm × 10 cm acrylic tank filled with 1.5 L of filtered water. The tanks were divided into two-color combinations among red, green, blue and yellow, respectively. In total, there were six color combinations to determine the color preference of zebrafish. The experiment was done between 10:00 and 16:00. The color preference was recorded with combination of IR camera and HD camera and analyzed using idTracker software [114].

4.13. Determination of Appetite-Controlling Hormone, Neurotransmitter, Oxidative, Anti-Oxidative Capacity, Lipid Peroxidation, DNA Damage, Stress Hormone and Inflammation Markers

Three fishes were randomly collected from each tank (9 fish/treatment) for biochemical assay. Brains were removed and a pool of three zebrafish tissues were homogenated at medium speed with Bullet blender tissue homogenizer (Next Advance, Inc., NY, USA) with 50 volumes of (v/w) ice cold PBS adjusted to pH 7.2. Samples were further centrifuged at 12,000 g for 15 min and the crude homogenate was stored in 100 µL aliquots at −80 °C until further use. The levels appetite-controlling hormones of leptin, leptin receptor, AgRP, Ghrelin, glucose and insulin were measured by using target-specific ELISA kits purchased from commercial company (ZGB-E1642, ZGB-E1651, ZGB-E1647, ZGB-E1648, ZGB-E1649 and ZGB-E1650, Zgenebio Inc., Taipei, Taiwan). The levels neurotransmitters of serotonin, norepinephrine, dopamine, GABA, glutamate, glycine, ACh, AChE, catecholamine and cortisol were measured by using target-specific ELISA kits purchased from commercial company (ZGB-E1572, ZGB-E1571, ZGB-E1573, ZGB-E1574, ZGB-E1588, ZGB-E1587, ZGB-E1585, ZGB-E1637, ZGB-E1590 and ZGB-E1575, Zgenebio Inc., Taipei, Taiwan). The ROS and catalase levels were measured by using target-specific ELISA kits purchased from commercial company (ZGB-E1561 and ZGB-E1598, Zgenebio Inc., Taipei, Taiwan). Two stress hormones of catecholamine and cortisol were measured by using target-specific ELISA kits purchased from commercial company (ZGB-E1590 and ZGB-E1560, Zgenebio Inc., Taipei, Taiwan). Two inflammation markers of TNF-α and IL-1β were measured using target-specific ELISA kits purchased from commercial company (ZGB-E1612 and ZGB-E1608, Zgenebio Inc., Taipei, Taiwan). Initially, zebrafish brain tissues were minced and completely homogenized in PBS solution by using tissue homogenizer. The target protein content of each sample was calibrated by interpolation from the standard calibration curve and normalized to the amount of total protein (μg) in each sample. The target protein content or activity was measured following the manufactory instructions.

4.14. Statistical Analysis

Data for each fish group are expressed as mean ± SEM and were compared by using Student’s-t test. Significant level was set at 5% (p < 0.05). One-way ANOVA was used to analyzed color preferences data with Tukey post-hoc analysis. Non-parametric Kruskal–Wallis followed by Dunn’s post hoc test was used to measure data that did not follow normal distribution assumption (* p < 0.05, ** p < 0.01, *** p < 0.001, **** p < 0.0001). All statistics were plotted and compiled by using GraphPad prism (GraphPad Software version 7 Inc., La Jolla, CA, USA).

Supplementary Materials

Supplementary materials can be found at https://0-www-mdpi-com.brum.beds.ac.uk/1422-0067/19/12/4038/s1. Video S1: Locomotion of wild type (left) and lepa KO (right) zebrafish. The three-dimension locomotion trajectories of six fish were recorded and analyzed. This video is played at 10× speed; Video S2: Locomotion of wild type (left) and lepa KO (right) zebrafish in novel tank test. The locomotion for 0–1 min (left) and 15–16 min (right) windows were recorded and analyzed by using idTracker software. The upper chamber space is highlighted in yellow color. This video is played at 5× speed; Video S3: Locomotion of wild type (left) and lepa KO (right) zebrafish in mirror biting test. The mirror positions are positioned to the right site. The mirror approaching zones are highlighted in yellow color. This video is played at 10× speed; Video S4: Locomotion of wild type (left) and lepa KO (right) zebrafish in predator avoidance test. The predator is placed in the left side and zebrafish is placed in the right site and one transparent glass plate is inserted to separate both animals. The predator approaching zones are highlighted in yellow color. This video is played at 10× speed; Video S5: Locomotion of wild type (left) and lepa KO (right) zebrafish in social interaction test. The normal zebrafish is placed in the left side and tested KO fish is placed in the right site and one transparent glass plate is inserted to separate both animals. The social interaction approaching zones are highlighted in yellow color. This video is played at 10× speed; Video S6: Locomotion of three wild type (left) and lepa KO (right) zebrafish in shoaling test. This video is played at 10× speed.

Author Contributions

Conceptualization, G.-M.L., M.-C.H. and C.-D.H.; Methodology, G.A. and S.S.; Validation, G.A., J.-R.C. and S.J.; Formal Analysis, S.J., B.P.S. and Y.-H.L.; Resources, S.-T.L.; Data Curation, G.A. and S.S.; Writing, G.A., Y.-H.L., and C.-D.H.

Funding

This study was supported by the grants sponsored by the Ministry of Science Technology (MOST 105-2313-B-033-001-MY3).

Acknowledgements

The authors sincerely thank Kai-Ling Chiu of the Department of Biochemistry and Molecular Biology, College of Medicine, National Chen Kung University, Taiwan for her meticulous illustration.

Conflicts of Interest

The authors declare no conflict of interest.

Appendix A

Figure A1. Passive avoidance test on training and memory of control (black) and lepa KO (red) zebrafish. Data were presented as means ± standard error of the mean (SEM) (n = 12) and were analyzed individually for each treated group. Statistical analysis was performed by one-way ANOVA, followed by Tukey post hoc test.
Ijms 19 04038 g0a1

References

  1. Friedman, J.M.; Halaas, J.L. Leptin and the regulation of body weight in mammals. Nature 1998, 395, 763–770. [Google Scholar] [CrossRef] [PubMed]
  2. Prokop, J.W.; Duff, R.J.; Ball, H.C.; Copeland, D.L.; Londraville, R.L. Leptin and leptin receptor: Analysis of a structure to function relationship in interaction and evolution from humans to fish. Peptides 2012, 38, 326–336. [Google Scholar] [CrossRef] [PubMed] [Green Version]
  3. Maffei, M.; Halaas, J.; Ravussin, E.; Pratley, R.E.; Lee, G.H.; Zhang, Y.; Fei, H.; Kim, S.; Lallone, R.; Ranganathan, S.; et al. Leptin levels in human and rodent: Measurement of plasma leptin and ob rna in obese and weight-reduced subjects. Nat. Med. 1995, 1, 1155–1161. [Google Scholar] [CrossRef] [PubMed]
  4. Frederich, R.C.; Hamann, A.; Anderson, S.; Lollmann, B.; Lowell, B.B.; Flier, J.S. Leptin levels reflect body lipid content in mice: Evidence for diet-induced resistance to leptin action. Nat. Med. 1995, 1, 1311–1314. [Google Scholar] [CrossRef] [PubMed]
  5. Butler, A.A.; Cone, R.D. Knockout models resulting in the development of obesity. Trends Genet. 2001, 17, S50–S54. [Google Scholar] [CrossRef]
  6. Paz-Filho, G.; Mastronardi, C.; Delibasi, T.; Wong, M.L.; Licinio, J. Congenital leptin deficiency: Diagnosis and effects of leptin replacement therapy. Arq. Bras. Endocrinol. Metabol. 2010, 54, 690–697. [Google Scholar] [CrossRef] [PubMed]
  7. Bluher, S.; Shah, S.; Mantzoros, C.S. Leptin deficiency: Clinical implications and opportunities for therapeutic interventions. J. Investig. Med. 2009, 57, 784–788. [Google Scholar] [CrossRef] [PubMed]
  8. Lord, G.M.; Matarese, G.; Howard, J.K.; Baker, R.J.; Bloom, S.R.; Lechler, R.I. Leptin modulates the t-cell immune response and reverses starvation-induced immunosuppression. Nature 1998, 394, 897–901. [Google Scholar] [CrossRef] [PubMed]
  9. Fujita, Y.; Murakami, M.; Ogawa, Y.; Masuzaki, H.; Tanaka, M.; Ozaki, S.; Nakao, K.; Mimori, T. Leptin inhibits stress-induced apoptosis of t lymphocytes. Clin. Exp. Immunol. 2002, 128, 21–26. [Google Scholar] [CrossRef]
  10. Iikuni, N.; Lam, Q.L.; Lu, L.; Matarese, G.; La Cava, A. Leptin and inflammation. Curr. Immunol. Rev. 2008, 4, 70–79. [Google Scholar] [CrossRef]
  11. Paz-Filho, G.; Mastronardi, C.; Franco, C.B.; Wang, K.B.; Wong, M.L.; Licinio, J. Leptin: Molecular mechanisms, systemic pro-inflammatory effects, and clinical implications. Arq. Bras. Endocrinol. Metabol. 2012, 56, 597–607. [Google Scholar] [CrossRef]
  12. Francisco, V.; Pino, J.; Campos-Cabaleiro, V.; Ruiz-Fernandez, C.; Mera, A.; Gonzalez-Gay, M.A.; Gomez, R.; Gualillo, O. Obesity, fat mass and immune system: Role for leptin. Front. Physiol. 2018, 9, 640. [Google Scholar] [CrossRef] [PubMed]
  13. Hausman, G.J.; Barb, C.R.; Lents, C.A. Leptin and reproductive function. Biochimie 2012, 94, 2075–2081. [Google Scholar] [CrossRef] [PubMed]
  14. Perez-Perez, A.; Sanchez-Jimenez, F.; Maymo, J.; Duenas, J.L.; Varone, C.; Sanchez-Margalet, V. Role of leptin in female reproduction. Clin. Chem. Lab. Med. 2015, 53, 15–28. [Google Scholar] [CrossRef] [PubMed]
  15. Tsuji, K.; Maeda, T.; Kawane, T.; Matsunuma, A.; Horiuchi, N. Leptin stimulates fibroblast growth factor 23 expression in bone and suppresses renal 1alpha,25-dihydroxyvitamin d3 synthesis in leptin-deficient mice. J. Bone Miner. Res. 2010, 25, 1711–1723. [Google Scholar] [CrossRef]
  16. Ferron, M.; Lacombe, J. Regulation of energy metabolism by the skeleton: Osteocalcin and beyond. Arch. Biochem. Biophys 2014, 561, 137–146. [Google Scholar] [CrossRef] [PubMed]
  17. Harvey, J. Leptin: A diverse regulator of neuronal function. J. Neurochem. 2007, 100, 307–313. [Google Scholar] [CrossRef]
  18. Guimond, D.; Diabira, D.; Porcher, C.; Bader, F.; Ferrand, N.; Zhu, M.; Appleyard, S.M.; Wayman, G.A.; Gaiarsa, J.L. Leptin potentiates gabaergic synaptic transmission in the developing rodent hippocampus. Front. Cell. Neurosci. 2014, 8, 235. [Google Scholar] [CrossRef]
  19. Irving, A.J.; Harvey, J. Leptin regulation of hippocampal synaptic function in health and disease. Philos. Trans. R. Soc. Lond. B Biol. Sci. 2014, 369, 20130155. [Google Scholar] [CrossRef]
  20. Ates, M.; Dayi, A.; Kiray, M.; Sisman, A.R.; Agilkaya, S.; Aksu, I.; Baykara, B.; Buyuk, E.; Cetinkaya, C.; Cingoz, S.; et al. Anxiety- and depression-like behavior are correlated with leptin and leptin receptor expression in prefrontal cortex of streptozotocin-induced diabetic rats. Biotech. Histochem. 2014, 89, 161–171. [Google Scholar] [CrossRef]
  21. Rebolledo-Solleiro, D.; Roldan-Roldan, G.; Diaz, D.; Velasco, M.; Larque, C.; Rico-Rosillo, G.; Vega-Robledo, G.B.; Zambrano, E.; Hiriart, M.; Perez de la Mora, M. Increased anxiety-like behavior is associated with the metabolic syndrome in non-stressed rats. PLoS ONE 2017, 12, e0176554. [Google Scholar] [CrossRef] [PubMed]
  22. Halaas, J.L.; Boozer, C.; Blair-West, J.; Fidahusein, N.; Denton, D.A.; Friedman, J.M. Physiological response to long-term peripheral and central leptin infusion in lean and obese mice. Proc. Natl. Acad. Sci. USA 1997, 94, 8878–8883. [Google Scholar] [CrossRef] [Green Version]
  23. Liu, J.; Garza, J.C.; Bronner, J.; Kim, C.S.; Zhang, W.; Lu, X.Y. Acute administration of leptin produces anxiolytic-like effects: A comparison with fluoxetine. Psychopharmacology 2010, 207, 535–545. [Google Scholar] [CrossRef] [PubMed]
  24. Wang, W.; Liu, S.L.; Li, K.; Chen, Y.; Jiang, B.; Li, Y.K.; Xiao, J.L.; Yang, S.; Chen, T.; Chen, J.G.; et al. Leptin: A potential anxiolytic by facilitation of fear extinction. CNS Neurosci. Ther. 2015, 21, 425–434. [Google Scholar] [CrossRef]
  25. Licinio, J.; Negrao, A.B.; Wong, M.L. Plasma leptin concentrations are highly correlated to emotional states throughout the day. Transl. Psychiatry 2014, 4, e475. [Google Scholar] [CrossRef] [PubMed]
  26. Veniant, M.M.; LeBel, C.P. Leptin: From animals to humans. Curr. Pharm. Des. 2003, 9, 811–818. [Google Scholar] [CrossRef] [PubMed]
  27. Barb, C.R.; Kraeling, R.R.; Rampacek, G.B.; Hausman, G.J. The role of neuropeptide y and interaction with leptin in regulating feed intake and luteinizing hormone and growth hormone secretion in the pig. Reproduction 2006, 131, 1127–1135. [Google Scholar] [CrossRef]
  28. Londraville, R.L.; Prokop, J.W.; Duff, R.J.; Liu, Q.; Tuttle, M. On the molecular evolution of leptin, leptin receptor, and endospanin. Front. Endocrinol. 2017, 8, 58. [Google Scholar] [CrossRef]
  29. Bates, S.H.; Myers, M.G. The role of leptin-->stat3 signaling in neuroendocrine function: An integrative perspective. J. Mol. Med. 2004, 82, 12–20. [Google Scholar] [CrossRef]
  30. Niswender, K.D.; Morton, G.J.; Stearns, W.H.; Rhodes, C.J.; Myers, M.G., Jr.; Schwartz, M.W. Intracellular signalling. Key enzyme in leptin-induced anorexia. Nature 2001, 413, 794–795. [Google Scholar] [CrossRef]
  31. Su, H.; Jiang, L.; Carter-Su, C.; Rui, L. Glucose enhances leptin signaling through modulation of ampk activity. PLoS ONE 2012, 7, e31636. [Google Scholar] [CrossRef] [PubMed]
  32. Mania, M.; Maruccio, L.; Russo, F.; Abbate, F.; Castaldo, L.; D’Angelo, L.; de Girolamo, P.; Guerrera, M.C.; Lucini, C.; Madrigrano, M.; et al. Expression and distribution of leptin and its receptors in the digestive tract of dio (diet-induced obese) zebrafish. Ann. Anat. 2017, 212, 37–47. [Google Scholar] [CrossRef] [PubMed]
  33. Dalman, M.R.; Liu, Q.; King, M.D.; Bagatto, B.; Londraville, R.L. Leptin expression affects metabolic rate in zebrafish embryos (d. Rerio). Front. Physiol. 2013, 4, 160. [Google Scholar] [CrossRef] [PubMed]
  34. Imrie, D.; Sadler, K.C. White adipose tissue development in zebrafish is regulated by both developmental time and fish size. Dev. Dyn. 2010, 239, 3013–3023. [Google Scholar] [CrossRef] [PubMed] [Green Version]
  35. Jao, L.-E.; Wente, S.R.; Chen, W. Efficient multiplex biallelic zebrafish genome editing using a crispr nuclease system. Proc. Natl. Acad. Sci. USA 2013, 110, 13904–13909. [Google Scholar] [CrossRef] [PubMed]
  36. Wei, C.; Liu, J.; Yu, Z.; Zhang, B.; Gao, G.; Jiao, R. TALEN or cas9–rapid, efficient and specific choices for genome modifications. J. Genet. Genom. 2013, 40, 281–289. [Google Scholar] [CrossRef] [PubMed]
  37. Bedell, V.M.; Wang, Y.; Campbell, J.M.; Poshusta, T.L.; Starker, C.G.; Krug, R.G., II; Tan, W.; Penheiter, S.G.; Ma, A.C.; Leung, A.Y.J.N. In vivo genome editing using a high-efficiency talen system. Nature 2012, 491, 114. [Google Scholar] [CrossRef]
  38. Kawakami, K.; Shima, A.; Kawakami, N. Identification of a functional transposase of the tol2 element, an ac-like element from the japanese medaka fish, and its transposition in the zebrafish germ lineage. Proc. Natl. Acad. Sci. USA 2000, 97, 11403–11408. [Google Scholar] [CrossRef]
  39. Kawakami, K.J. Tol2: A versatile gene transfer vector in vertebrates. Genome Biol. 2007, 8, S7. [Google Scholar] [CrossRef]
  40. Rihel, J.; Prober, D.A.; Arvanites, A.; Lam, K.; Zimmerman, S.; Jang, S.; Haggarty, S.J.; Kokel, D.; Rubin, L.L.; Peterson, R.T.; et al. Zebrafish behavioral profiling links drugs to biological targets and rest/wake regulation. Science 2010, 327, 348–351. [Google Scholar] [CrossRef]
  41. Audira, G.; Sampurna, B.; Juniardi, S.; Liang, S.-T.; Lai, Y.-H.; Hsiao, C.-D. A versatile setup for measuring multiple behavior endpoints in zebrafish. Inventions 2018, 3, 75. [Google Scholar] [CrossRef]
  42. Gorissen, M.; Bernier, N.J.; Nabuurs, S.B.; Flik, G.; Huising, M.O. Two divergent leptin paralogues in zebrafish (danio rerio) that originate early in teleostean evolution. J. Endocrinol. 2009, 201, 329–339. [Google Scholar] [CrossRef] [PubMed]
  43. Takács, P.; Vitál, Z.; Ferincz, Á.; Staszny, Á. Repeatability, reproducibility, separative power and subjectivity of different fish morphometric analysis methods. PLoS ONE 2016, 11, e0157890. [Google Scholar] [CrossRef] [PubMed]
  44. Audira, G.; Sampurna, B.P.; Juniardi, S.; Liang, S.-T.; Lai, Y.-H.; Hsiao, C.-D. A simple setup to perform 3d locomotion tracking in zebrafish by using a single camera. Inventions 2018, 3, 11. [Google Scholar] [CrossRef]
  45. Valladolid-Acebes, I.; Fole, A.; Martín, M.; Morales, L.; Cano, M.V.; Ruiz-Gayo, M.; Del Olmo, N. Spatial memory impairment and changes in hippocampal morphology are triggered by high-fat diets in adolescent mice. Is there a role of leptin? Neurobiol. Learn. Mem. 2013, 106, 18–25. [Google Scholar] [CrossRef] [PubMed]
  46. Li, X.-L.; Aou, S.; Oomura, Y.; Hori, N.; Fukunaga, K.; Hori, T. Impairment of long-term potentiation and spatial memory in leptin receptor-deficient rodents. Neuroscience 2002, 113, 607–615. [Google Scholar] [CrossRef]
  47. Greco, S.J.; Bryan, K.J.; Sarkar, S.; Zhu, X.; Smith, M.A.; Ashford, J.W.; Johnston, J.M.; Tezapsidis, N.; Casadesus, G. Leptin reduces pathology and improves memory in a transgenic mouse model of alzheimer’s disease. J. Alzheimer’s Dis. 2010, 19, 1155–1167. [Google Scholar] [CrossRef] [PubMed]
  48. Blundell, J. Serotonin and appetite. Neuropharmacology 1984, 23, 1537–1551. [Google Scholar] [CrossRef]
  49. Halford, J.C.; Blundell, J.E. Separate systems for serotonin and leptin in appetite control. Ann. Med. 2000, 32, 222–232. [Google Scholar] [CrossRef]
  50. Leibowitz, S.F.; Alexander, J.T. Hypothalamic serotonin in control of eating behavior, meal size, and body weight. Biol. Psychiatry 1998, 44, 851–864. [Google Scholar] [CrossRef]
  51. Yadav, V.K.; Oury, F.; Suda, N.; Liu, Z.-W.; Gao, X.-B.; Confavreux, C.; Klemenhagen, K.C.; Tanaka, K.F.; Gingrich, J.A.; Guo, X.E. A serotonin-dependent mechanism explains the leptin regulation of bone mass, appetite, and energy expenditure. Cell 2009, 138, 976–989. [Google Scholar] [CrossRef] [PubMed]
  52. Halford, J.C.; Harrold, J.A.; Lawton, C.L.; Blundell, J.E. Serotonin (5-ht) drugs: Effects on appetite expression and use for the treatment of obesity. Curr. Drug Targets 2005, 6, 201–213. [Google Scholar] [CrossRef] [PubMed]
  53. Blundell, J.E.; Halford, J.C. Serotonin and appetite regulation. CNS Drugs 1998, 9, 473–495. [Google Scholar] [CrossRef]
  54. Weiss, J.M.; Goodman, P.A.; Losito, B.G.; Corrigan, S.; Charry, J.M.; Bailey, W.H. Behavioral depression produced by an uncontrollable stressor: Relationship to norepinephrine, dopamine, and serotonin levels in various regions of rat brain. Brain Res. Rev. 1981, 3, 167–205. [Google Scholar] [CrossRef]
  55. Klimek, V.; Stockmeier, C.; Overholser, J.; Meltzer, H.Y.; Kalka, S.; Dilley, G.; Ordway, G.A. Reduced levels of norepinephrine transporters in the locus coeruleus in major depression. J. Neurosci. 1997, 17, 8451–8458. [Google Scholar] [CrossRef] [PubMed]
  56. Berthoud, H.-R. Metabolic and hedonic drives in the neural control of appetite: Who is the boss? Curr. Opin. Neurobiol. 2011, 21, 888–896. [Google Scholar] [CrossRef] [PubMed]
  57. Salamone, J.; Arizzi, M.; Sandoval, M.; Cervone, K.; Aberman, J. Dopamine antagonists alter response allocation but do not suppress appetite for food in rats: Contrast between the effects of skf 83566, raclopride, and fenfluramine on a concurrent choice task. Psychopharmacology 2002, 160, 371–380. [Google Scholar] [CrossRef]
  58. Movafagh, S.; Crook, S.; Vo, K. Regulation of hypoxia-inducible factor-1a by reactive oxygen species: New developments in an old debate. J. Cell. Biochem. 2015, 116, 696–703. [Google Scholar] [CrossRef]
  59. Majmundar, A.J.; Wong, W.J.; Simon, M.C. Hypoxia-inducible factors and the response to hypoxic stress. Mol. Cell 2010, 40, 294–309. [Google Scholar] [CrossRef]
  60. Dandekar, A.; Mendez, R.; Zhang, K. Cross talk between er stress, oxidative stress, and inflammation in health and disease. In Stress Responses; Springer: Berlin, Germany, 2015; pp. 205–214. [Google Scholar]
  61. Fulton, S.; Woodside, B.; Shizgal, P. Modulation of brain reward circuitry by leptin. Science 2000, 287, 125–128. [Google Scholar] [CrossRef]
  62. Carr, K.D. Augmentation of drug reward by chronic food restriction: Behavioral evidence and underlying mechanisms. Physiol. Behav. 2002, 76, 353–364. [Google Scholar] [CrossRef]
  63. Shalev, U.; Yap, J.; Shaham, Y. Leptin attenuates acute food deprivation-induced relapse to heroin seeking. J. Neurosci. 2001, 21, RC129. [Google Scholar] [CrossRef] [PubMed]
  64. Figlewicz, D.P.; Woods, S.C. Adiposity signals and brain reward mechanisms. Trends Pharmacol. Sci. 2000, 21, 235–236. [Google Scholar] [CrossRef]
  65. Tecott, L.H. Serotonin and the orchestration of energy balance. Cell MeTable 2007, 6, 352–361. [Google Scholar] [CrossRef] [PubMed]
  66. Volkow, N.D.; Wang, G.-J.; Baler, R.D. Reward, dopamine and the control of food intake: Implications for obesity. Trends Cogn. Sci. 2011, 15, 37–46. [Google Scholar] [CrossRef]
  67. Martin-Gronert, M.S.; Stocker, C.J.; Wargent, E.T.; Cripps, R.L.; Garfield, A.S.; Jovanovic, Z.; D’Agostino, G.; Yeo, G.S.; Cawthorne, M.A.; Arch, J.R. 5-HT2A and 5-HT2C receptors as hypothalamic targets of developmental programming in male rats. Dis. Models Mech. 2016. [Google Scholar] [CrossRef]
  68. Romanova, I.V.; Derkach, K.V.; Mikhrina, A.L.; Sukhov, I.B.; Mikhailova, E.V.; Shpakov, A.O. The leptin, dopamine and serotonin receptors in hypothalamic pomc-neurons of normal and obese rodents. Neurochem. Res. 2018, 43, 821–837. [Google Scholar] [CrossRef] [PubMed]
  69. Michel, M.; Page-McCaw, P.S.; Chen, W.; Cone, R.D. Leptin signaling regulates glucose homeostasis, but not adipostasis, in the zebrafish. Proc. Natl. Acad. Sci. USA 2016, 113, 3084–3089. [Google Scholar] [CrossRef]
  70. Chisada, S.-I.; Kurokawa, T.; Murashita, K.; Rønnestad, I.; Taniguchi, Y.; Toyoda, A.; Sakaki, Y.; Takeda, S.; Yoshiura, Y. Leptin receptor-deficient (knockout) medaka, oryzias latipes, show chronical up-regulated levels of orexigenic neuropeptides, elevated food intake and stage specific effects on growth and fat allocation. Gen. Comp. Endocrinol. 2014, 195, 9–20. [Google Scholar] [CrossRef] [PubMed]
  71. Fischer-Posovszky, P.; von Schnurbein, J.; Moepps, B.; Lahr, G.; Strauss, G.; Barth, T.F.; Kassubek, J.; Muhleder, H.; Möller, P.; Debatin, K.-M. A new missense mutation in the leptin gene causes mild obesity and hypogonadism without affecting t cell responsiveness. J. Clin. Endocrinol. MeTable 2010, 95, 2836–2840. [Google Scholar] [CrossRef] [PubMed]
  72. Garza, J.C.; Guo, M.; Zhang, W.; Lu, X.-Y. Leptin restores adult hippocampal neurogenesis in a chronic unpredictable stress model of depression and reverses glucocorticoid-induced inhibition of gsk-3β/β-catenin signaling. Mol. Psychiatry 2012, 17, 790. [Google Scholar] [CrossRef] [PubMed]
  73. Kalueff, A.V.; Gebhardt, M.; Stewart, A.M.; Cachat, J.M.; Brimmer, M.; Chawla, J.S.; Craddock, C.; Kyzar, E.J.; Roth, A.; Landsman, S. Towards a comprehensive catalog of zebrafish behavior 1.0 and beyond. Zebrafish 2013, 10, 70–86. [Google Scholar] [CrossRef] [PubMed]
  74. Nelson, R.J.; Trainor, B.C. Neural mechanisms of aggression. Nat. Rev. Neurosci. 2007, 8, 536. [Google Scholar] [CrossRef] [PubMed]
  75. O’Brien, J. Encyclopedia of Gender and Society; SAGE Publications: Newcastle upon Tyne, UK, 2008. [Google Scholar]
  76. Haagensen, A.M.J.; Sørensen, D.B.; Sandøe, P.; Matthews, L.R.; Birck, M.M.; Fels, J.J.; Astrup, A. High fat, low carbohydrate diet limit fear and aggression in göttingen minipigs. PLoS ONE 2014, 9, e93821. [Google Scholar] [CrossRef] [PubMed]
  77. Pham, M.; Raymond, J.; Hester, J.; Kyzar, E.; Gaikwad, S.; Bruce, I.; Fryar, C.; Chanin, S.; Enriquez, J.; Bagawandoss, S. Assessing social behavior phenotypes in adult zebrafish: Shoaling, social preference, and mirror biting tests. In Zebrafish Protocols for Neurobehavioral Research; Springer: Berlin, Germany, 2012; pp. 231–246. [Google Scholar]
  78. Piato, Â.L.; Capiotti, K.M.; Tamborski, A.R.; Oses, J.P.; Barcellos, L.J.; Bogo, M.R.; Lara, D.R.; Vianna, M.R.; Bonan, C.D. Unpredictable chronic stress model in zebrafish (danio rerio): Behavioral and physiological responses. Prog. Neuro-Psychopharmacol. Biol. Psychiatry 2011, 35, 561–567. [Google Scholar] [CrossRef] [PubMed]
  79. Miller, N.; Greene, K.; Dydinski, A.; Gerlai, R. Effects of nicotine and alcohol on zebrafish (danio rerio) shoaling. Behav. Brain Res. 2013, 240, 192–196. [Google Scholar] [CrossRef] [PubMed]
  80. Gebauer, D.L.; Pagnussat, N.; Piato, Â.L.; Schaefer, I.C.; Bonan, C.D.; Lara, D.R. Effects of anxiolytics in zebrafish: Similarities and differences between benzodiazepines, buspirone and ethanol. Pharmacol. Biochem. Behav. 2011, 99, 480–486. [Google Scholar] [CrossRef]
  81. Prentice, A.M.; Moore, S.E.; Collinson, A.C.; O’Connell, M.A. Leptin and undernutrition. Nutr. Rev. 2002, 60, S56–S67. [Google Scholar] [CrossRef]
  82. Bass, S.L.; Gerlai, R. Zebrafish (danio rerio) responds differentially to stimulus fish: The effects of sympatric and allopatric predators and harmless fish. Behav. Brain Res. 2008, 186, 107–117. [Google Scholar] [CrossRef]
  83. Arble, D.M.; Vitaterna, M.H.; Turek, F.W. Rhythmic leptin is required for weight gain from circadian desynchronized feeding in the mouse. PLoS ONE 2011, 6, e25079. [Google Scholar] [CrossRef]
  84. Kettner, N.M.; Mayo, S.A.; Hua, J.; Lee, C.; Moore, D.D.; Fu, L. Circadian dysfunction induces leptin resistance in mice. Cell MeTable 2015, 22, 448–459. [Google Scholar] [CrossRef] [PubMed]
  85. Murakami, D.; Horwitz, B.A.; Fuller, C.A. Circadian rhythms of temperature and activity in obese and lean zucker rats. Am. J. Physiol.-Regul. Integr. Comp. Physiol. 1995, 269, R1038–R1043. [Google Scholar] [CrossRef] [PubMed]
  86. Kohsaka, A.; Laposky, A.D.; Ramsey, K.M.; Estrada, C.; Joshu, C.; Kobayashi, Y.; Turek, F.W.; Bass, J. High-fat diet disrupts behavioral and molecular circadian rhythms in mice. Cell MeTable 2007, 6, 414–421. [Google Scholar] [CrossRef] [PubMed]
  87. Cajochen, C.; Kräuchi, K.; Wirz-Justice, A. Role of melatonin in the regulation of human circadian rhythms and sleep. J. Neuroendocrinol. 2003, 15, 432–437. [Google Scholar] [CrossRef] [PubMed]
  88. Zhang, S.; Liu, X.; Sun, M.; Zhang, Q.; Li, T.; Li, X.; Xu, J.; Zhao, X.; Chen, D.; Feng, X. Reversal of reserpine-induced depression and cognitive disorder in zebrafish by sertraline and traditional chinese medicine (TCM). Behav. Brain Funct. BBF 2018, 14. [Google Scholar] [CrossRef]
  89. Korkmaz, S.; Özer, Ö.; Kaya, Ş.; Kazgan, A.; Atmaca, M. The correlation between color choices and impulsivity, anxiety and depression. Eur. J. Gen. Med. 2016, 13, 47–50. [Google Scholar] [CrossRef]
  90. Jacobs, B.L.; Azmitia, E.C. Structure and function of the brain serotonin system. Physiol. Rev. 1992, 72, 165–229. [Google Scholar] [CrossRef]
  91. Holmes, A.; Murphy, D.L.; Crawley, J.N. Abnormal behavioral phenotypes of serotonin transporter knockout mice: Parallels with human anxiety and depression. Biol. Psychiatry 2003, 54, 953–959. [Google Scholar] [CrossRef]
  92. Lira, A.; Zhou, M.; Castanon, N.; Ansorge, M.S.; Gordon, J.A.; Francis, J.H.; Bradley-Moore, M.; Lira, J.; Underwood, M.D.; Arango, V. Altered depression-related behaviors and functional changes in the dorsal raphe nucleus of serotonin transporter-deficient mice. Biol. Psychiatry 2003, 54, 960–971. [Google Scholar] [CrossRef]
  93. Milaneschi, Y.; Simmons, W.K.; van Rossum, E.F.C.; Penninx, B.W.J.H. Depression and obesity: Evidence of shared biological mechanisms. Mol. Psychiatry 2018. [Google Scholar] [CrossRef]
  94. Bouret, S.G. Neurodevelopmental actions of leptin. Brain Res. 2010, 1350, 2–9. [Google Scholar] [CrossRef] [PubMed] [Green Version]
  95. Liu, Q.; Chen, Y.; Copeland, D.; Ball, H.; Duff, R.J.; Rockich, B.; Londraville, R.L. Expression of leptin receptor gene in developing and adult zebrafish. Gen. Comp. Endocrinol. 2010, 166, 346–355. [Google Scholar] [CrossRef] [PubMed] [Green Version]
  96. Xu, Y.; Tong, Q.J. Expanding neurotransmitters in the hypothalamic neurocircuitry for energy balance regulation. Protein Cell 2011, 2, 800–813. [Google Scholar] [CrossRef] [PubMed] [Green Version]
  97. Roubos, E.W.; Dahmen, M.; Kozicz, T.; Xu, L. Leptin and the hypothalamo-pituitary–adrenal stress axis. Gen. Comp. Endocrinol. 2012, 177, 28–36. [Google Scholar] [CrossRef] [PubMed]
  98. Pitchot, W.; Herrera, C.; Ansseau, M. Hpa axis dysfunction in major depression: Relationship to 5-ht(1a) receptor activity. Neuropsychobiology 2001, 44, 74–77. [Google Scholar] [CrossRef] [PubMed]
  99. Aihara, M.; Ida, I.; Yuuki, N.; Oshima, A.; Kumano, H.; Takahashi, K.; Fukuda, M.; Oriuchi, N.; Endo, K.; Matsuda, H.; et al. Hpa axis dysfunction in unmedicated major depressive disorder and its normalization by pharmacotherapy correlates with alteration of neural activity in prefrontal cortex and limbic/paralimbic regions. Psychiatry Res. Neuroimaging 2007, 155, 245–256. [Google Scholar] [CrossRef] [PubMed]
  100. Haesemeyer, M.; Schier, A.F. The study of psychiatric disease genes and drugs in zebrafish. Curr. Opin. Neurobiol. 2015, 30, 122–130. [Google Scholar] [CrossRef] [PubMed] [Green Version]
  101. Egan, R.J.; Bergner, C.L.; Hart, P.C.; Cachat, J.M.; Canavello, P.R.; Elegante, M.F.; Elkhayat, S.I.; Bartels, B.K.; Tien, A.K.; Tien, D.H. Understanding behavioral and physiological phenotypes of stress and anxiety in zebrafish. Behav. Brain Res. 2009, 205, 38–44. [Google Scholar] [CrossRef] [Green Version]
  102. Wang, B.; Chandrasekera, P.C.; Pippin, J.J. Leptin- and leptin receptor-deficient rodent models: Relevance for human type 2 diabetes. Curr. Diabetes Rev. 2014, 10, 131–145. [Google Scholar] [CrossRef]
  103. Hewagalamulage, S.; Lee, T.; Clarke, I.; Henry, B.A. Stress, cortisol, and obesity: A role for cortisol responsiveness in identifying individuals prone to obesity. Domest. Anim. Endocrinol. 2016, 56, S112–S120. [Google Scholar] [CrossRef]
  104. Pompili, M.; Serafini, G.; Innamorati, M.; Moller-Leimkuhler, A.M.; Giupponi, G.; Girardi, P.; Tatarelli, R.; Lester, D. The hypothalamic-pituitary-adrenal axis and serotonin abnormalities: A selective overview for the implications of suicide prevention. Eur. Arch. Psychiatry Clin. Neurosci. 2010, 260, 583–600. [Google Scholar] [CrossRef] [PubMed]
  105. Kinkhabwala, A.; Riley, M.; Koyama, M.; Monen, J.; Satou, C.; Kimura, Y.; Higashijima, S.-I.; Fetcho, J. A structural and functional ground plan for neurons in the hindbrain of zebrafish. Proc. Natl. Acad. Sci. USA 2011, 108, 1164–1169. [Google Scholar] [CrossRef] [PubMed] [Green Version]
  106. O’Malley, D.M.; Kao, Y.-H.; Fetcho, J. Imaging the functional organization of zebrafish hindbrain segments during escape behaviors. Proc. Natl. Acad. Sci. USA 1996, 17, 1145–1155. [Google Scholar] [CrossRef]
  107. Asakawa, K.; Suster, M.L.; Mizusawa, K.; Nagayoshi, S.; Kotani, T.; Urasaki, A.; Kishimoto, Y.; Hibi, M.; Kawakami, K. Genetic dissection of neural circuits by tol2 transposon-mediated gal4 gene and enhancer trapping in zebrafish. Proc. Natl. Acad. Sci. USA 2008, 105, 1255–1260. [Google Scholar] [CrossRef] [PubMed]
  108. Scott, E.K.; Mason, L.; Arrenberg, A.B.; Ziv, L.; Gosse, N.J.; Xiao, T.; Chi, N.C.; Asakawa, K.; Kawakami, K.; Baier, H. Targeting neural circuitry in zebrafish using GAL4 enhancer trapping. Nat. Methods 2007, 4, 323. [Google Scholar] [CrossRef] [PubMed]
  109. Baier, H.; Scott, E.K. Genetic and optical targeting of neural circuits and behavior—Zebrafish in the spotlight. Curr. Opin. Neurobiol. 2009, 19, 553–560. [Google Scholar] [CrossRef]
  110. Blank, M.; Guerim, L.D.; Cordeiro, R.F.; Vianna, M.R. A one-trial inhibitory avoidance task to zebrafish: Rapid acquisition of an nmda-dependent long-term memory. Neurobiol. Learn. Mem. 2009, 92, 529–534. [Google Scholar] [CrossRef]
  111. Gerlai, R.; Lahav, M.; Guo, S.; Rosenthal, A. Drinks like a fish: Zebra fish (danio rerio) as a behavior genetic model to study alcohol effects. Pharmacol. Biochem. Behav. 2000, 67, 773–782. [Google Scholar] [CrossRef]
  112. Moretz, J.A.; Martins, E.P.; Robison, B.D. The effects of early and adult social environment on zebrafish (danio rerio) behavior. Environ. Biol. Fishes 2007, 80, 91–101. [Google Scholar] [CrossRef]
  113. Steenbergen, P.J.; Richardson, M.K.; Champagne, D.L. Patterns of avoidance behaviours in the light/dark preference test in young juvenile zebrafish: A pharmacological study. Behav. Brain Res. 2011, 222, 15–25. [Google Scholar] [CrossRef]
  114. Pérez-Escudero, A.; Vicente-Page, J.; Hinz, R.C.; Arganda, S.; De Polavieja, G.G. Idtracker: Tracking individuals in a group by automatic identification of unmarked animals. Nat. Methods 2014, 11, 743. [Google Scholar] [CrossRef] [PubMed]
Figure 1. Generation and phenotype analysis of lepa KO zebrafish. (A) Schematic showing the TALEN left and right arm sequences used to target lepa gene on exon 2 in zebrafish. (B) Three-dimension model showing the predicted protein structure between wild type and lepa KO fish. (C) Comparison of body length and (D) body weight between wild type and lepa KO fish at six-month-old aged. (E) Appearance of wild type and lepa KO fish at six-month-old aged. (F) Morphometric analysis of wild type and lepa KO fish at six-month-old aged.
Ijms 19 04038 g001
Figure 2. Comparison of several untreated wild type and lepa KO zebrafish behavioral endpoints in 3D locomotion test and novel tank exposure test within 30 min: (A) Average speed; (B) average angular velocity; (C) duration time in top of the tank; (D) meandering; (E) swimming time movement ratio; (F) rapid movement time ratio; (G) average speed; (H) freezing time movement ratio; (I) duration time in top of the tank; (J) number of entries to the top of the tank; (K) latency to enter the top of the tank; and (L) total distance travelled in the top of the tank. (M) Locomotion trajectory of wild type (left) and lepa KO (right) zebrafish. The three-dimensional locomotion trajectories of six fish were recorded and analyzed by using idTracker software. (N) Locomotion trajectory of wild type (black color) and lepa KO (red color) zebrafish in novel tank test. The locomotion for 0–1 min (left) and 15–16 min (right) windows were recorded and analyzed by using idTracker software. The data from 3D locomotion test (AF) are expressed as the mean ± SEM and analyzed by unpaired t-test (n control = 40; n lepa KO = 30; ** p < 0.01, *** p < 0.001, **** p < 0.0001). The data from novel tank test (GL) are expressed as the mean ± SEM and analyzed by Mann–Whitney test (n = 30; * p < 0.05, ** p < 0.01, *** p < 0.001, **** p < 0.0001).
Ijms 19 04038 g002
Figure 3. Comparison of several behavior endpoints of untreated wild type and lepa KO zebrafish in mirror biting test (AF) and predator avoidance test (GL): (A) average speed; (B) mirror biting time percentage; (C) longest duration in the mirror side; (D) freezing time movement ratio; (E) swimming time movement ratio; (F) rapid movement time ratio; (G) average speed; (H) predator approaching time; (I) average distance to separator; (J) freezing time movement ratio; (K) swimming time movement ratio; and (L) rapid movement ratio. (M) Locomotion trajectory of wild type (black color) and lepa KO (red color) zebrafish in mirror biting test. The mirror positions are positioned to the right site. The mirror approaching zones are highlighted in yellow color. (N) Locomotion trajectory of wild type (left) and lepa KO (right) zebrafish in predator avoidance test. The predator is placed in the left side and zebrafish is placed in the right site and one transparent glass plate is inserted to separate both animals. The predator approaching zones are highlighted in yellow color. The data are expressed as the mean ± SEM and were analyzed by Mann–Whitney test (n = 30; * p < 0.05, ** p < 0.01, *** p < 0.001, **** p < 0.0001).
Ijms 19 04038 g003
Figure 4. Comparison of several behavior endpoints of untreated wild type and lepa KO zebrafish in social interaction test (AD) and shoaling test (group of three fish) (EJ). (A) average speed; (B) average distance to separator; (C) interaction time percentage; (D) longest duration in separator side; (E) average speed; (F) time in top duration; (G) average distance to center of the tank; (H) average shoal area; (I) average inter-fish distance; and (J) average nearest neighbor distance. (K) Locomotion trajectory of wild type (top) and lepa KO (bottom) zebrafish in social interaction test. The normal zebrafish is placed in the left side and tested KO fish is placed in the right site and one transparent glass plate is inserted to separate both animals. The social interaction approaching zones are highlighted in yellow color. (L) Locomotion trajectory of three wild type (top) and lepa KO (bottom) zebrafish in shoaling test. The shoaling trajectories for each single fish are labeled in different color. The data were expressed as the mean ± SEM and were analyzed by Mann–Whitney test (n = 30; ** p < 0.01, *** p < 0.001, **** p < 0.0001).
Ijms 19 04038 g004
Figure 5. Comparison of several untreated wild type and lepa KO zebrafish behavior endpoints in circadian rhythm test: (A) circadian patterns of average speed; and (B) meandering in light/dark cycle. (C) Average speed; (D) average angular velocity; and (E) meandering during light cycle. (F) Average speed; (G) average angular velocity; and (H) meandering in during dark cycle. The data are expressed as the mean ± SEM and several data were analyzed by unpaired t-test (n control = 30; n lepa KO = 16; ** p < 0.01, **** p < 0.0001).
Ijms 19 04038 g005
Figure 6. Comparison of color preferences between wild type and lepa KO zebrafish: (A) green vs. blue combination; (B) green vs. yellow combination; (C) red vs. blue combination; (D) green vs. red combination; (E) red vs. yellow combination; and (F) blue vs. yellow combination. Data were analyzed using two-way ANOVA followed by Tukey post-hoc test. If the data were not normally distributed, they were analyzed using non-parametric Kruskal–Wallis followed by Dunn’s post-hoc test, and p < 0.05 was considered significantly different. The data are presented with mean ± SEM with n = 24, * p < 0.05, ** p < 0.01, *** p < 0.001, **** p> 0.0001.
Ijms 19 04038 g006
Figure 7. Proposed mechanism of leptin deficiency that affected on zebrafish behaviors. Leptin production by adipocyte is greatly reduced in lepa-deficient fish. Reduction of leptin induces the lepr overshooting in some specific regions on the zebrafish brain. Lack of leptin affects behavioral changes by deregulating HPA-axis and/or medulla oblongata functions resulting in dysregulated circadian rhythm, shoal formation, fear, and aggression, also increment of locomotion activity. Leptin deficiency also increases AgRP level, producing high level of appetite. OB, olfactory bulb; Telen, Telecephalon; TeO, Tectum Opticum; Hab, Habenula; Hypoth, Hypothalamus; SC, Spinal cord; Prtec, Pretectal population; Cc, Crista Cerebellaris; LVII, facial lobe; Tegm, tegmentum; Pa, Preoptic area; TI, Torus longitudinalis; Lc, Lobus caudalis.
Ijms 19 04038 g007
Table 1. Comparison of expression levels of biochemical markers between untreated wild type and lepa KO zebrafish.
BiomarkerWT lepa KOUnitSignificancep Value
Brain
leptin0.020 ± 0.0020.010 ± 0.002ng/μg total proteinYESp = 0.0024
Leptin receptor0.094 ± 0.0120.213 ± 0.039ng/μg total proteinYESp = 0.0421
AgRP0.145 ± 0.0090.286 ± 0.021ng/μg total proteinYESp = 0.0036
Gehirn0.118 ± 0.0140.453 ± 0.058ng/μg total proteinYESp = 0.0051
Glucose0.172 ± 0.0200.358 ± 0.018 mmol/μg total proteinYESp = 0.0024
Insulin0.857±0.1080.428 ± 0.098U/μg total proteinYESp = 0.0423
Serotonin (5-HT)0.187 ± 0.0340.0153 ± 0.003ng/μg total proteinYESp = 0.0076
Norepinephrine0.731 ± 0.0940.063 ± 0.010ng/μg total proteinYESp = 0.0021
Dopamine5.530 ± 0.30810.130 ± 1.138pg/μg total proteinYESp = 0.0175
GABA0.020 ± 0.0040.021 ± 0.005ug/μg total proteinNop = 0.8789
Glutamate0.141 ± 0.0070.053 ± 0.013ug/μg total proteinYESp = 0.0038
Glycine0.239 ± 0.0100.999 ± 0.170ug/μg total proteinYESp = 0.0110
ACh6.150 ± 0.7460.979 ± 0.118U/μg total proteinYESp = 0.0024
AChE1.289 ± 0.1590.541 ± 0.061U/μg total proteinYESp = 0.0117
Catecholamine1.633 ± 0.0860.589 ± 0.142ng/μg total proteinYESp = 0.0016
Cortisol3.500 ± 0.3255.155 ± 0.398pg/μg total proteinYESp = 0.0092
Histamine0.061 ± 0.0060.109 ± 0.026ng/μg total proteinNop = 0.1456
TNF-α1.310 ± 0.3370.412 ± 0.046pg/μg total proteinNop = 0.0575
IL1β0.054 ± 0.0210.011 ± 0.004ng/μg total proteinNop = 0.1151
Catalase1.135 ± 0.1500.052 ± 0.007U/μg total proteinYESp = 0.0019
ROS1.632 ± 0.1533.720 ± 0.475U/μg total proteinYESp = 0.0138
Melatonin0.970 ± 0.1440.081 ± 0.007pg/μg total proteinYESp = 0.0035
Amyloid beta1.839 ± 0.2091.334 ± 0.174ug/μg total proteinNop = 0.1366
p-Tau1.723 ± 0.1811.383 ± 0.130pg/μg total proteinNop = 0.2014
Hif-1α2.672 ± 0.2163.225 ± 0.241pg/μg total proteinNop = 0.1619
creatinine0.850 ± 0.0230.774 ± 0.019ug/μg total proteinNop = 0.0620
Muscle
leptin0.096 ± 0.0060.023 ± 0.001ng/μg total proteinYESp = 0.0003
Creatine kinase4.120 ± 0.3681.100 ± 0.132ng/μg total proteinYESp = 0.0015
ATP143.300 ± 11.38048.960 ± 5.780ng/μg total proteinYESp = 0.0018
ROS3.917 ± 0.7417.427 ± 0.769U/μg total proteinYESp = 0.0303
Hif-1α5.708 ± 0.2458.714 ± 0.522pg/μg total proteinYESp = 0.0065
Enzymatic- or ELISA (enzyme-linked immunosorbent assay)-based methods were applied to detect the biomarkers brain and in muscle tissues for lepa KO zebrafish. The data are expressed as the mean ± SEM and were analyzed by unpaired t-test (n control = 3–6; n lepa KO = 3–6; significant when p < 0.05).

