Article

Evolutionary Analysis of Plastid Genomes of Seven Lonicera L. Species: Implications for Sequence Divergence and Phylogenetic Relationships

Key Laboratory of Resource Biology and Biotechnology in Western China, Ministry of Education, College of Life Sciences, Northwest University, Xi’an 710069, China
*
Author to whom correspondence should be addressed.
These authors contributed equally to this study.
Int. J. Mol. Sci. 2018, 19(12), 4039; https://0-doi-org.brum.beds.ac.uk/10.3390/ijms19124039
Submission received: 10 November 2018 / Revised: 7 December 2018 / Accepted: 11 December 2018 / Published: 14 December 2018
(This article belongs to the Special Issue Chloroplast 2.0)

Abstract

:
Plant plastomes play crucial roles in species evolution and phylogenetic reconstruction studies due to being maternally inherited and due to the moderate evolutionary rate of genomes. However, patterns of sequence divergence and molecular evolution of the plastid genomes in the horticulturally- and economically-important Lonicera L. species are poorly understood. In this study, we collected the complete plastomes of seven Lonicera species and determined the various repeat sequence variations and protein sequence evolution by comparative genomic analysis. A total of 498 repeats were identified in plastid genomes, which included tandem (130), dispersed (277), and palindromic (91) types of repeat variations. Simple sequence repeat (SSR) elements analysis indicated the enriched SSRs in seven genomes to be mononucleotides, followed by tetra-nucleotides, dinucleotides, tri-nucleotides, hex-nucleotides, and penta-nucleotides. We identified 18 divergence hotspot regions (rps15, rps16, rps18, rpl23, psaJ, infA, ycf1, trnN-GUU-ndhF, rpoC2-rpoC1, rbcL-psaI, trnI-CAU-ycf2, psbZ-trnG-UCC, trnK-UUU-rps16, infA-rps8, rpl14-rpl16, trnV-GAC-rrn16, trnL-UAA intron, and rps12-clpP) that could be used as the potential molecular genetic markers for the further study of population genetics and phylogenetic evolution of Lonicera species. We found that a large number of repeat sequences were distributed in the divergence hotspots of plastid genomes. Interestingly, 16 genes were determined under positive selection, which included four genes for the subunits of ribosome proteins (rps7, rpl2, rpl16, and rpl22), three genes for the subunits of photosystem proteins (psaJ, psbC, and ycf4), three NADH oxidoreductase genes (ndhB, ndhH, and ndhK), two subunits of ATP genes (atpA and atpB), and four other genes (infA, rbcL, ycf1, and ycf2). Phylogenetic analysis based on the whole plastome demonstrated that the seven Lonicera species form a highly-supported monophyletic clade. The availability of these plastid genomes provides important genetic information for further species identification and biological research on Lonicera.

1. Introduction

The genus Lonicera, which includes approximately 200 species, is a major component of the family Caprifoliaceae, comprising a large number of horticultural and economically important shrubs and tree species [1]. These plants are generally distributed in the temperate and subtropical regions of North America, Europe, Asia, and Africa [2], and about 100 Lonicera species are found in China. The majority of these species have important medicinal properties. For example, the extracts from Lonicera species have long been used for inflammation relief in some traditional Chinese medicines [3,4,5,6]. The research on Lonicera has mainly focused on the biological characteristics, classification, introduction, training, cultivation management, and chemical components of species [7,8,9,10,11]. The phylogenetic analysis based on the nuclear ribosomal internal transcribed spacer (ITS) and five chloroplast DNA regions demonstrated that Lonicera species diverged into two major lineages: Chamaecerasus and Periclymenum [12]. He et al. [13] first reported the whole plastid genome sequence of Lonicera japonica. However, the comparative characteristics of complete plastid genomes and phylogenetic evolution of Lonicera species are still poorly understood.
Generally, plant plastomes are closed cyclic DNA molecules, which typically have a quadripartite structure with a large single copy (LSC) region, a small single copy (SSC) region, and two identical copies of inverted repeats (IR) regions [14]. Some studies found that the plastid genomes of higher plants were highly conserved in genome organization, gene content, and order [14,15,16,17,18]. However, the repeat sequences in plastomes remained poorly understood for years. We now know that the repeat variations in plastid genomes often participate in diverse cellular functions including gene evolution, RNA editing, and gene mobility [19,20]. The repetitive sequences fall primarily into three classes: local repeats (tandem repeats and simple sequence repeats, SSRs), families of dispersed repeats (mostly transposable elements and retro-transposed cellular genes), and segmental duplications (duplicated genomic fragments). From an evolutionary point of view, the higher the level of organism evolution, the greater the proportion of repetitive sequences in the total plant genomes [21]. Long repeat sequences and SSRs were found scattered throughout the whole plastid genomes. Some studies found that most repeat sequences were located in the intergenic regions and intron regions, whereas few were located in the coding regions in angiosperm plastomes [22,23]. The diversity and versatility of functions of the repeated DNA sequences may be useful within the course of species adaptation to the environment.
Some studies showed that the repeat sequence variations and adaptive selection were the main evolutionary forces in the process of adaptive responses of species to the rapidly changed environments [24,25]. For instance, Yang et al. [26] found that positive selective action appears to have driven the functional divergence of the CHS gene in the process of speciation of Dendranthema (DC.) Des Moul. An evolutionary analysis of the plastid genes demonstrated that the chloroplast rps4 gene might have, under positive selection, undergone diversification in the Cretaceous period after the rise of angiosperms [27]. The rapidly evolved plastid matK gene also experienced positive selection in some lineages of land plants [28]. However, the patterns of repetitive variations and adaptive evolution of the whole plastid genome sequence in most angiosperms remain largely unknown.
In this study, we collected the whole chloroplast genomes of seven Lonicera species to detect the structure variations and performed a comparative analysis. The specific goals were: (1) to determine the distribution patterns of repeat sequence variations of plastid genomes, (2) to detect the positively selected genes in Lonicera plastid genomes, and (3) to identify the variant hotspot regions as potential molecular genetic markers for further population evolutionary studies.

2. Results

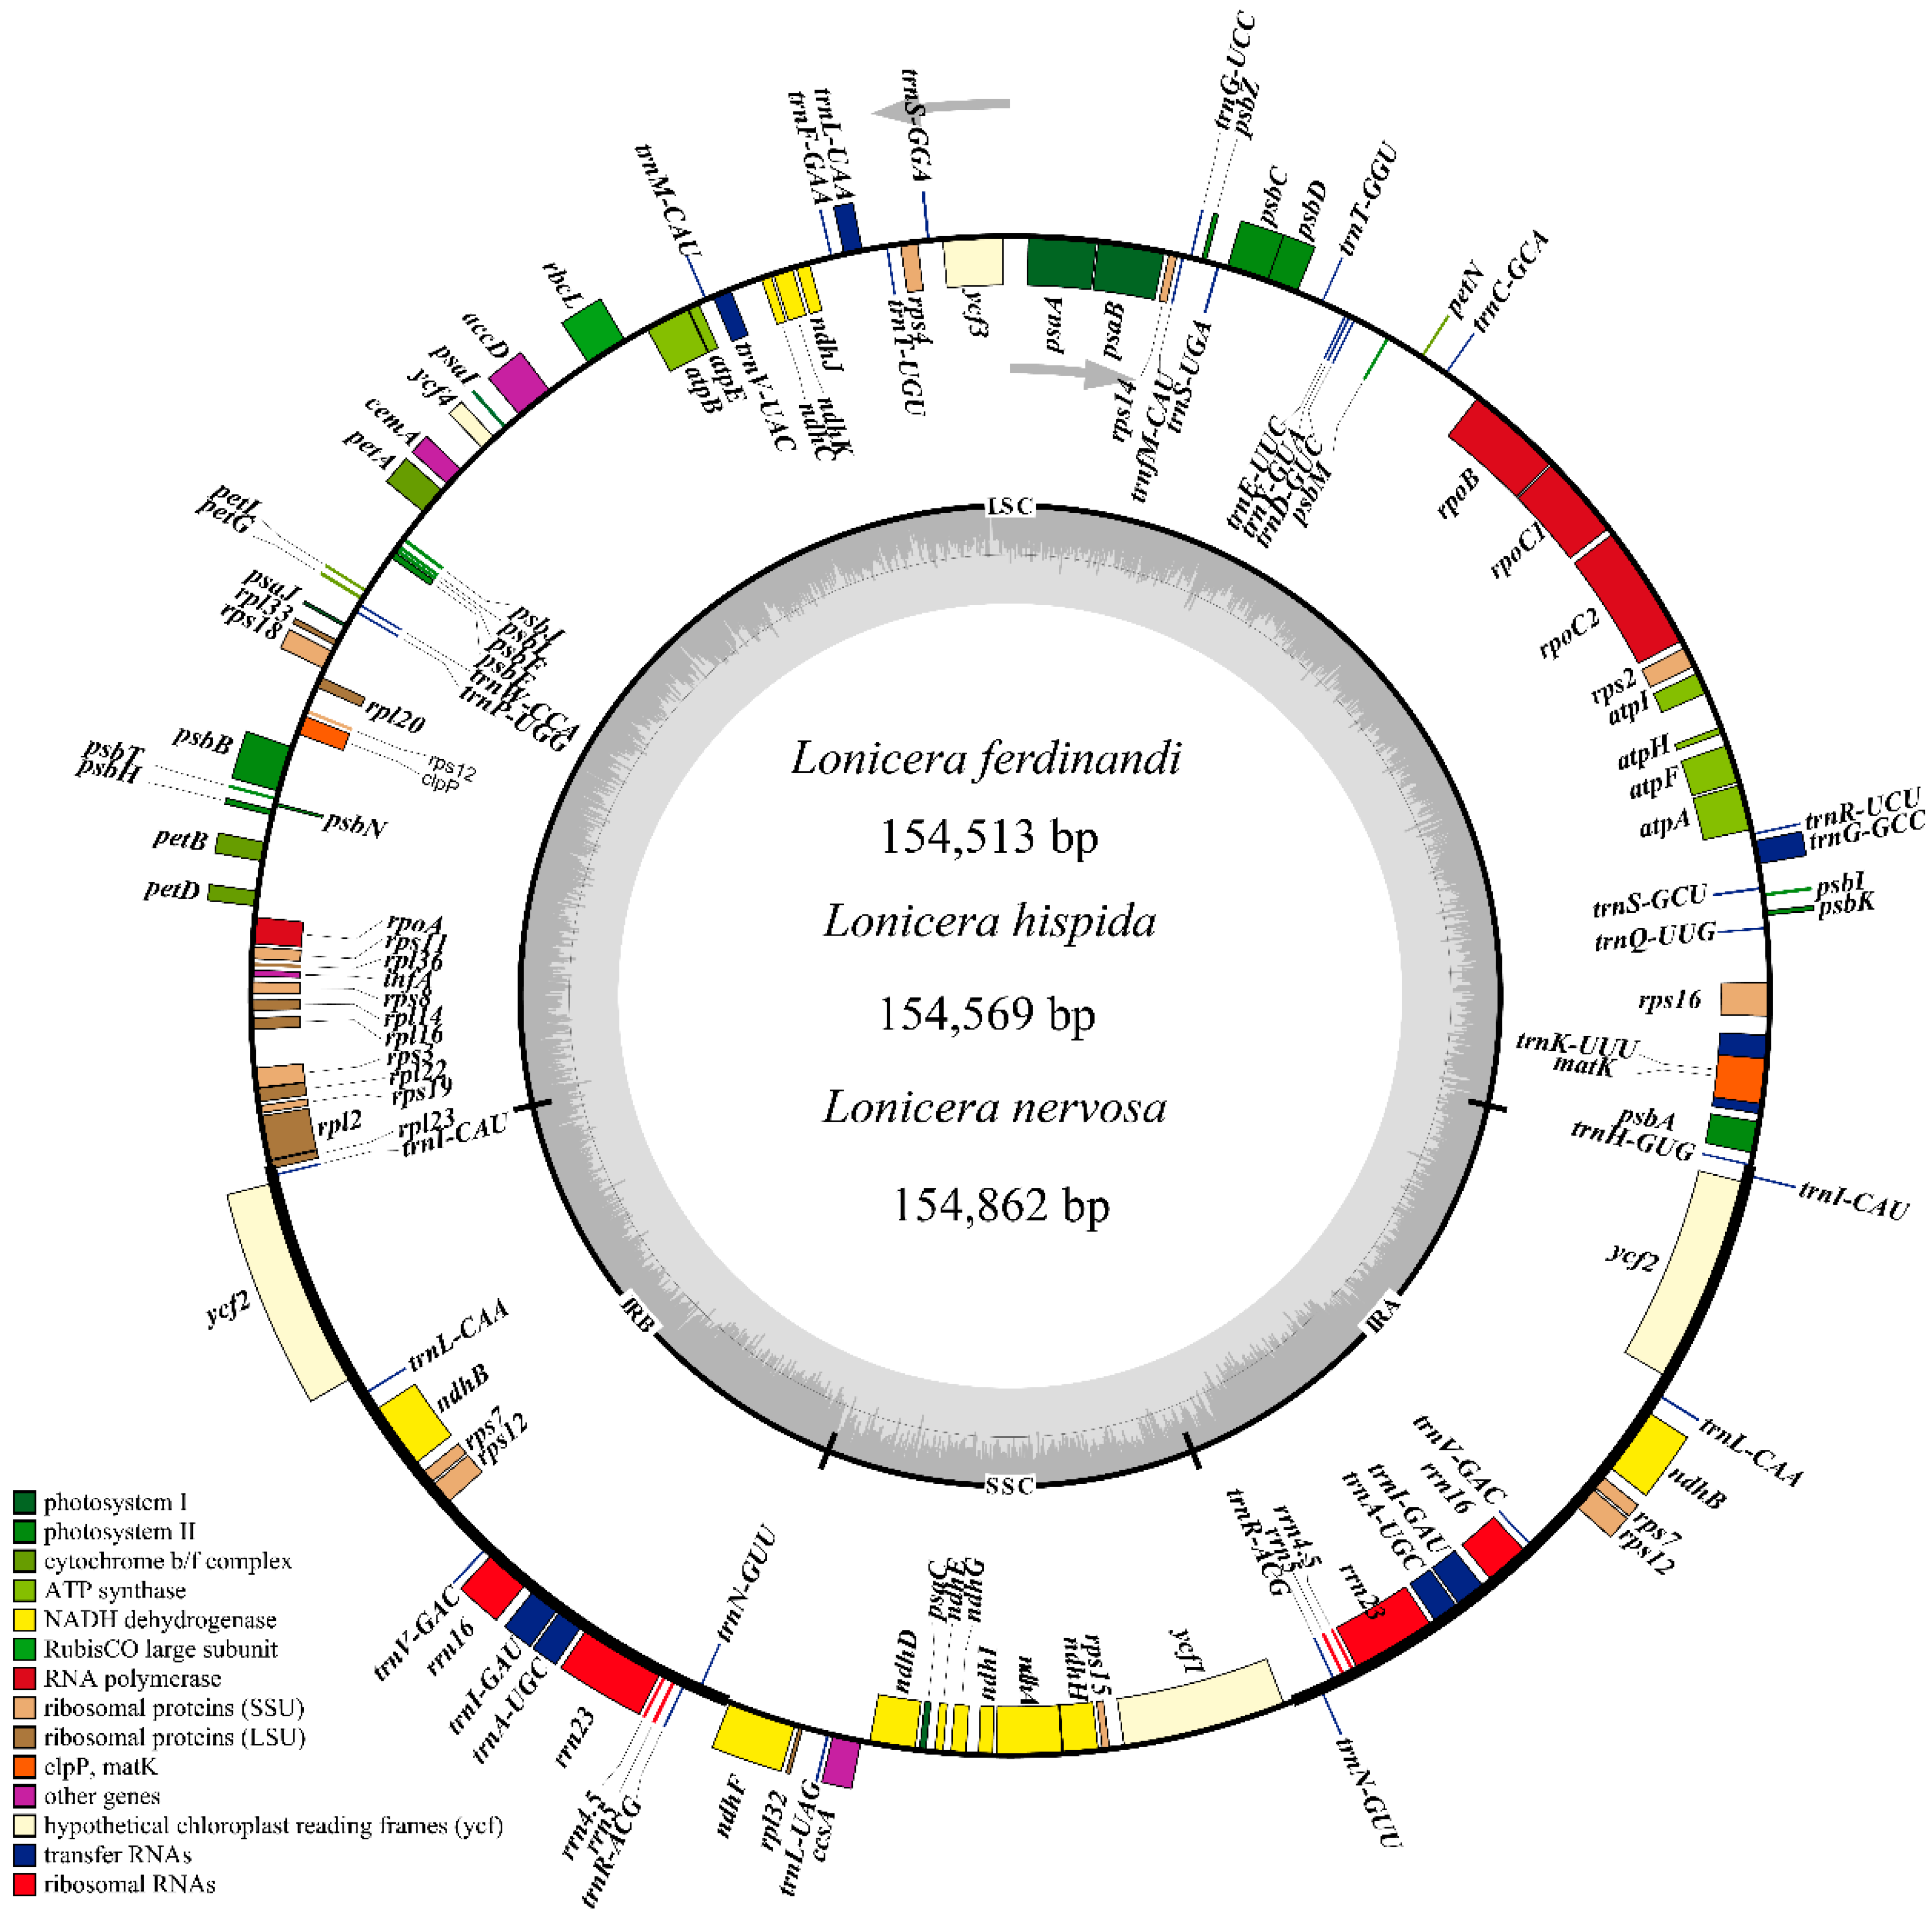
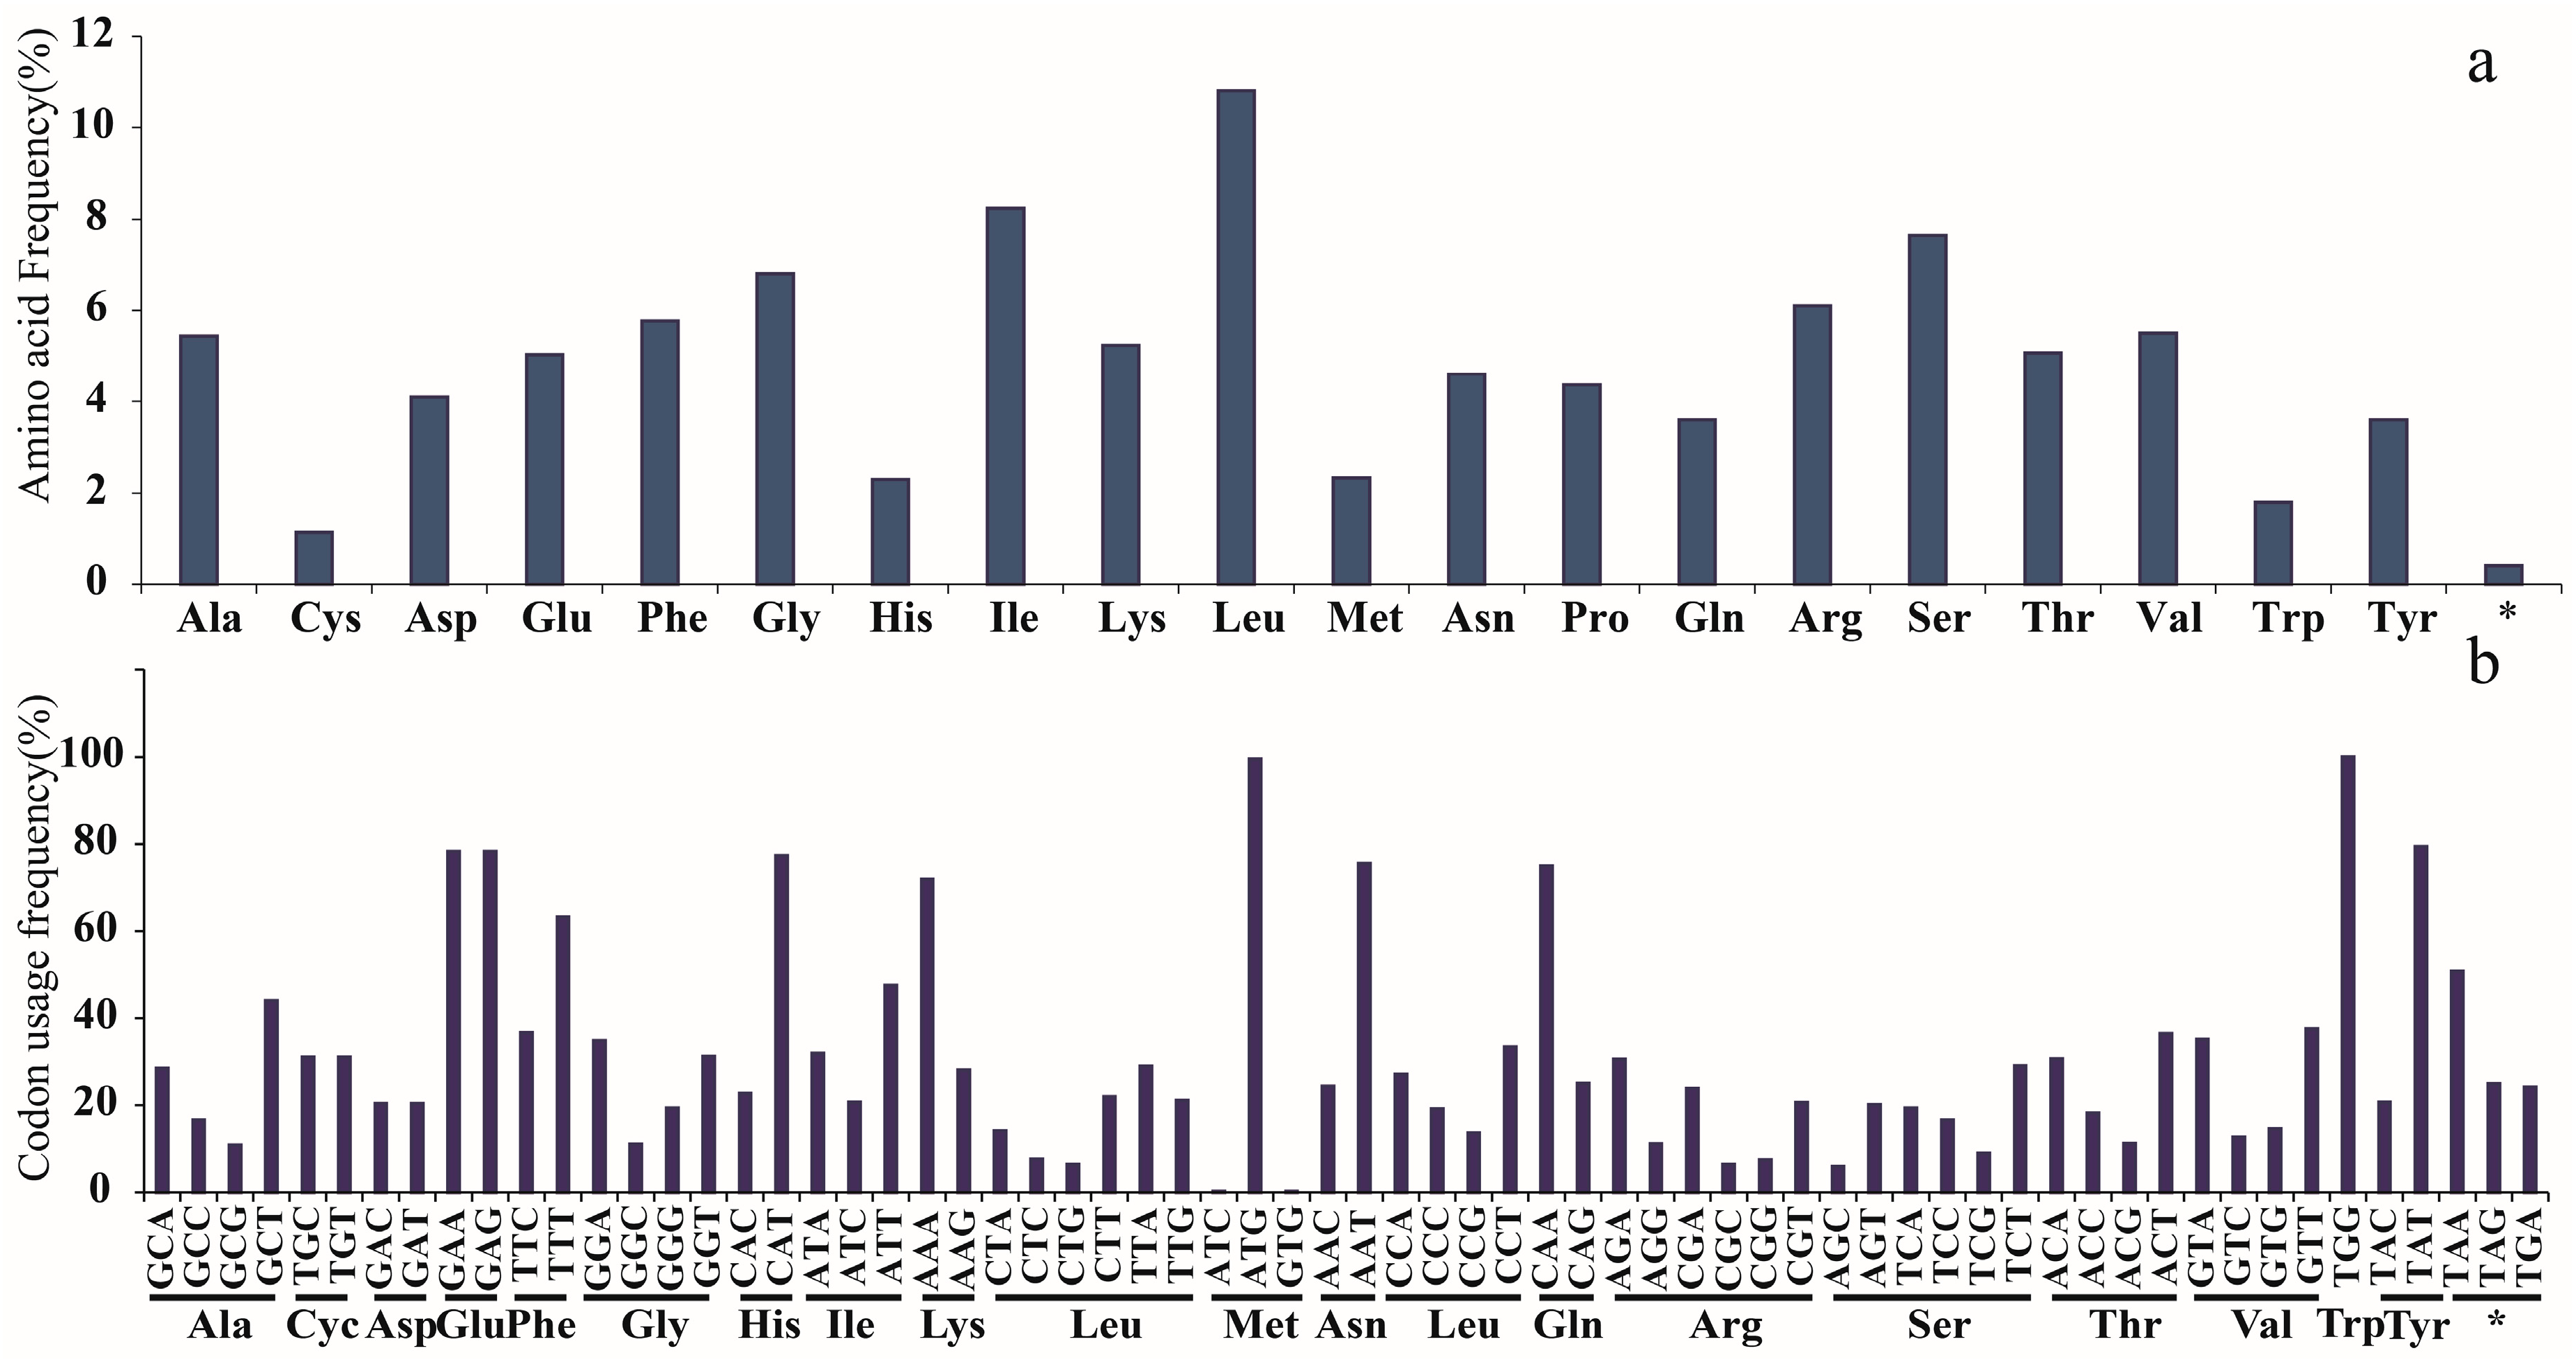
2.1. Characters of Plastid Genomes

The plastid genomes of seven Lonicera species ranged from 154,513 bp (L. ferdinandi) to 155,545 bp (L. tragophylla) in length (Table 1). The structure of the genomes was a typical quadripartite circular molecule composed of a LSC region of 88,505–89,288 bp, a SSC region of 18,552–18,766 bp, and a pair of IR regions of 23,646–23,791 bp (Figure 1, Table 1). The gene order and compositions were similar in the seven Lonicera species. The numbers and positions of genes in the seven Lonicera plastid genomes were also similar, which consist of 82 protein-coding genes, 37 tRNA genes, 8 rRNA genes, and 1 pseudogene (Table 2). Among the 128 genes, 20 genes contain introns comprised of 12 genes coding for proteins (rps16, atpF, rpoC1, ycf3, rps18, rps12, rpl2, ycf2 (two copies), ndhB (two copies), ndhA) and 8 tRNA genes (trnK-UUU, trnG-GCC, trnL-UAA, trnV-UAC, trnI-GAU (two copies), trnA-UGC (two copies)). The overall GC content is similar in the seven genomes, at about 38.4%. The overall GC content is unequally distributed across the plastid genome, which is the highest in the IR region (43.4%), followed by LSC (38.4%) and SSC (33.2%) regions. We summarized the codon usage and anticodon recognition patterns in the seven plastid genomes (Figure 2). Protein-coding genes comprise 25,110 amino acids in L. hispida, 25,178 amino acids in L. nervosa, and 25,222 amino acids in L. ferdinandi. Among these codons, those for leucine (10.8%) and isoleucine (8.2%) are the most common, and cysteine was the least frequently coded amino acid in the seven plastid genomes (Figure 2).

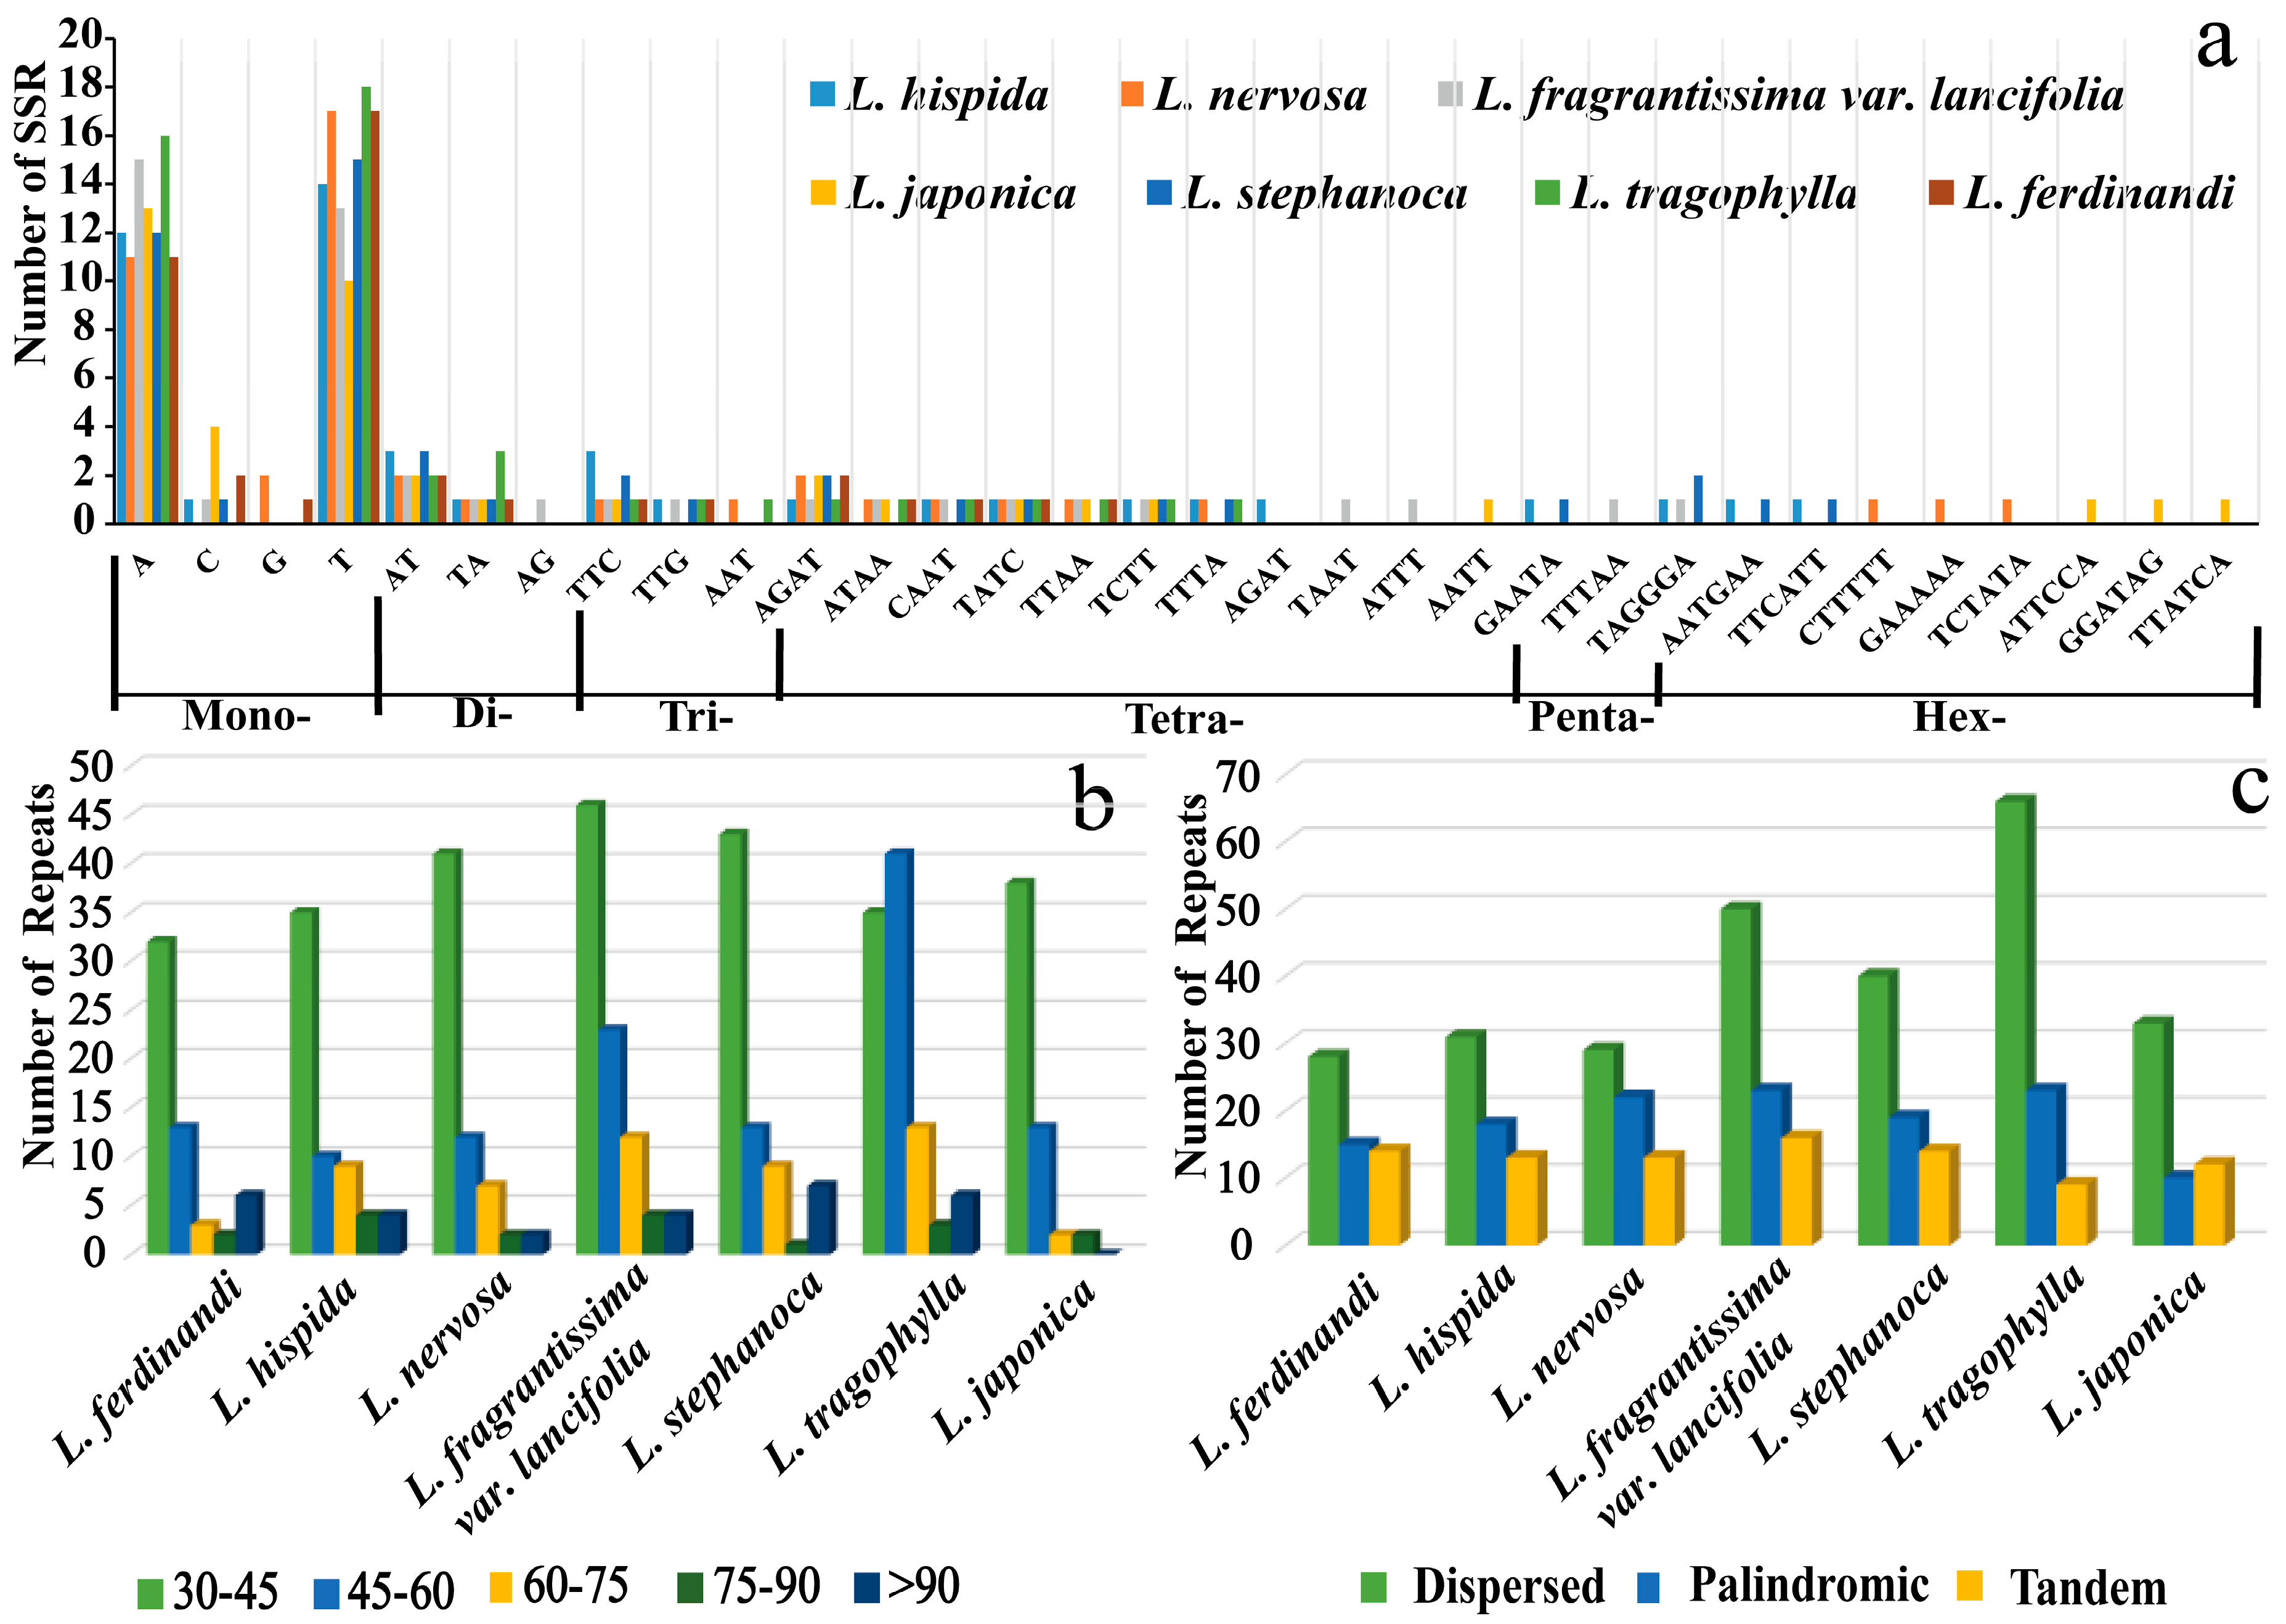
2.2. Repeat Sequences Analysis

We identified 313 SSR loci in the seven Lonicera plastids (Table S1, Figure 3a). Each species contains 41–49 SSRs (mean 45 SSRs). Among them, the mono-nucleotides repeat is the most common, which accounts for about 65.8% of total SSRs, followed by tetra-nucleotides (15.0%), dinucleotides (8.3%), tri-nucleotides (5.4%), and hex-nucleotides (4.5%). Penta-nucleotides (0.9%) were very rare across the plastid genomes. Mononucleotide SSRs are especially rich in A/T repeats (about 94%) in each Lonicera species. We found that the number of tetra-nucleotides SSRs is the largest in total SSRs, except mononucleotides. Most SSRs are located in noncoding sections (75%) and about 25% are in protein-coding regions (ycf1, ycf2, atpB, rpoA, rpoB, rpoC1, rpoC2, ndhF, ccsA, and rpl23) (Table S1). The numbers and distributions of all of the repeat types in the seven plastid genomes are similar and conserved (Figure 3, Tables S2 and S3). We identified 498 other types of repeats, which included tandem (91), dispersed (277), and palindromic (130) repeats in the seven Lonicera plastids. The number of dispersed repeats is more than that of palindromic repeats, and tandem is the lowest in these species. The length of the repeat units mainly ranges from 30 to 45 bp (Figure 3). These repeat sequences are mainly distributed in non-coding regions, whereas only a few are located in coding regions (ycf2, ycf1, rpl20, rps18, ndhA, rps7, and ndhI). A large number of repeat sequences are distributed around the pseudogene accD in these Lonicera species.

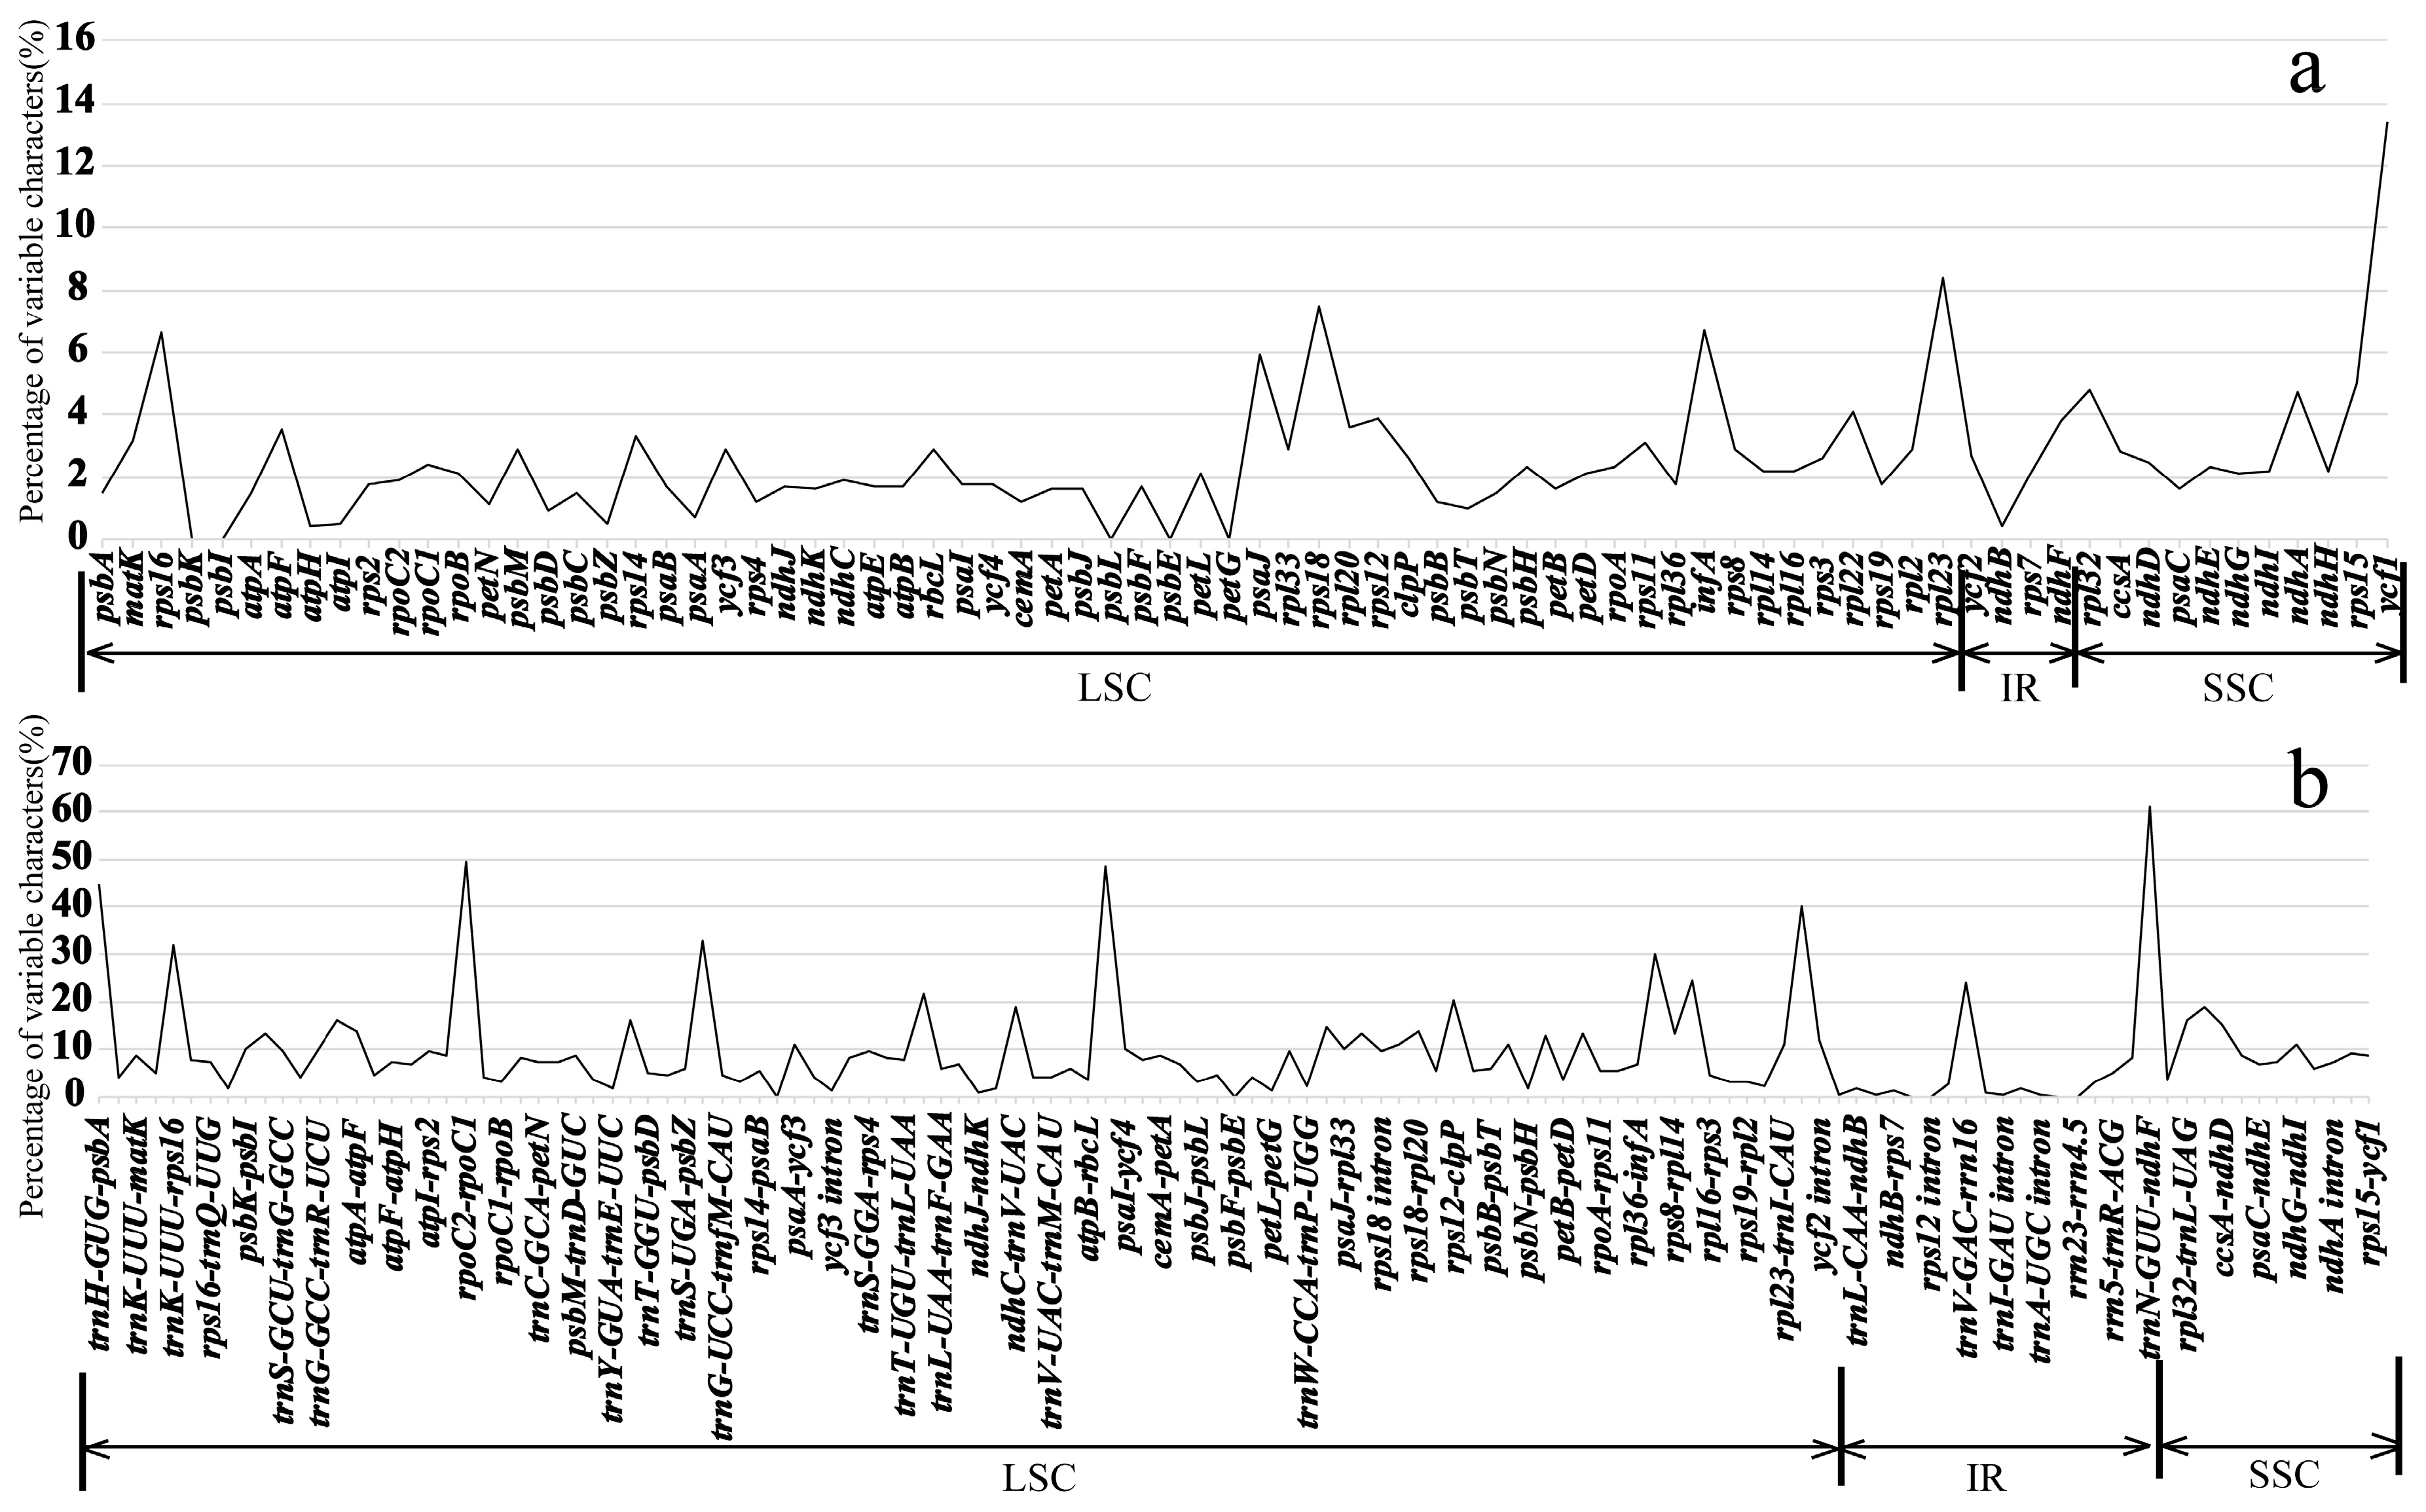
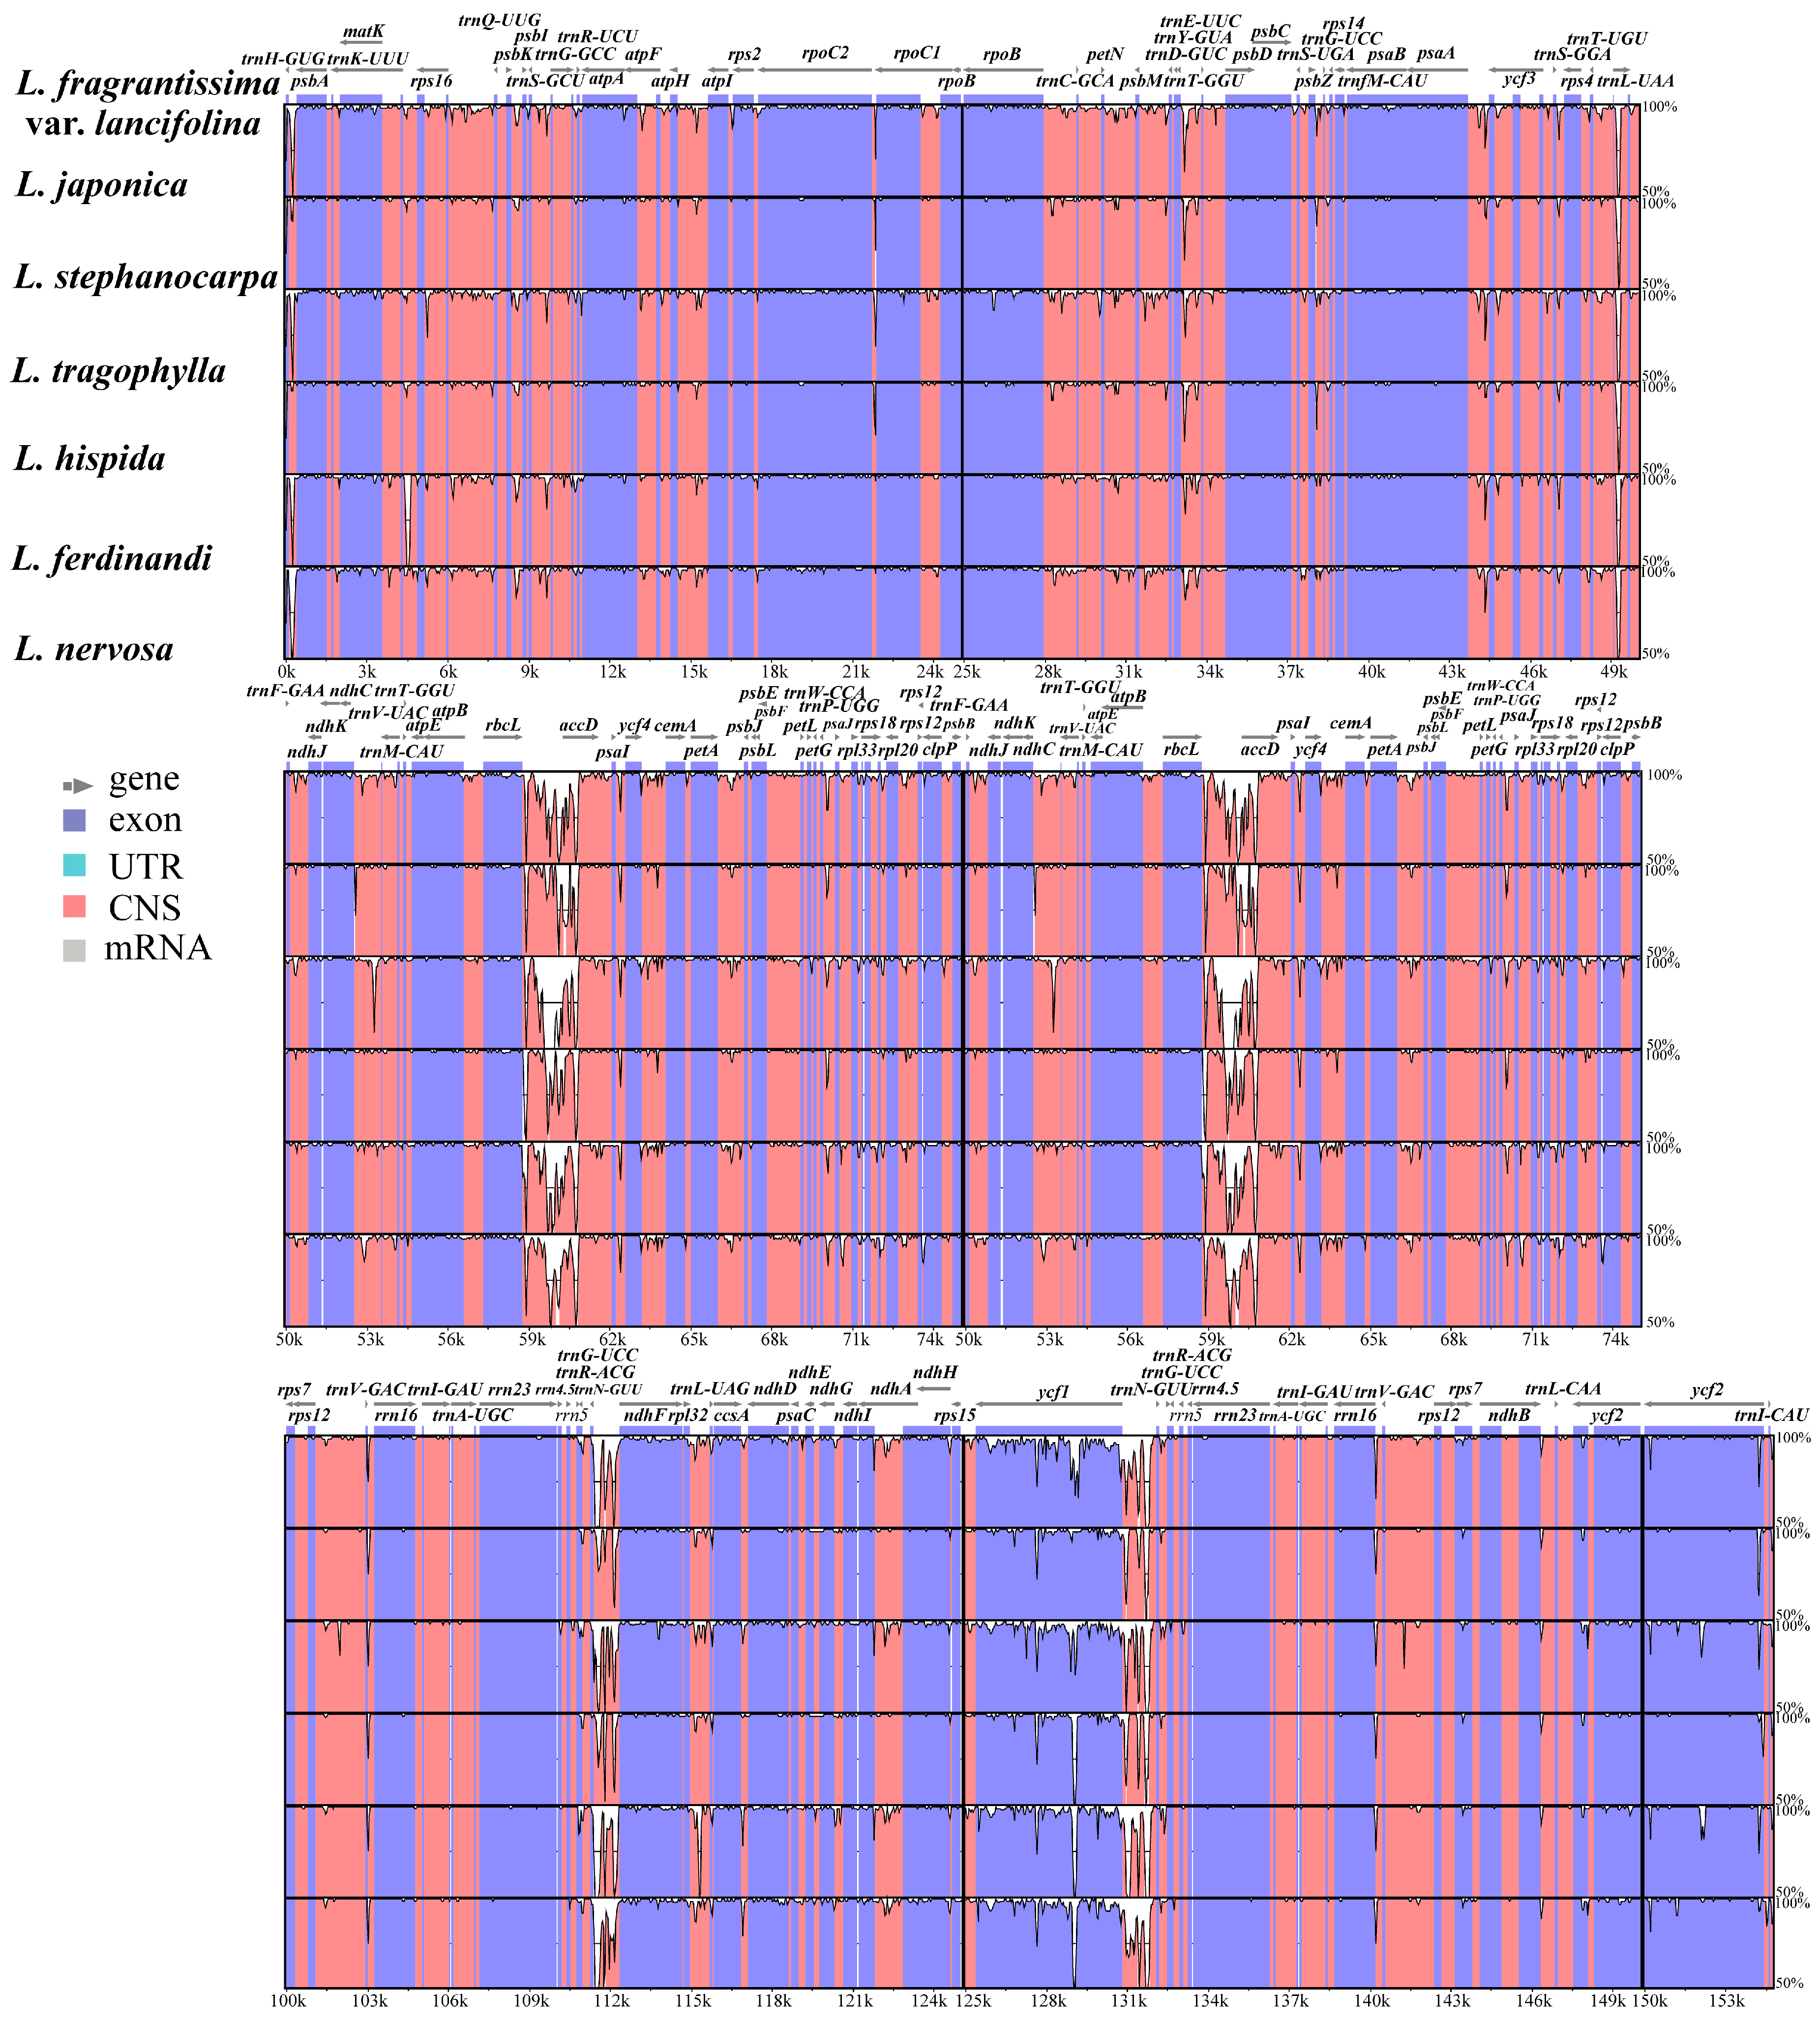
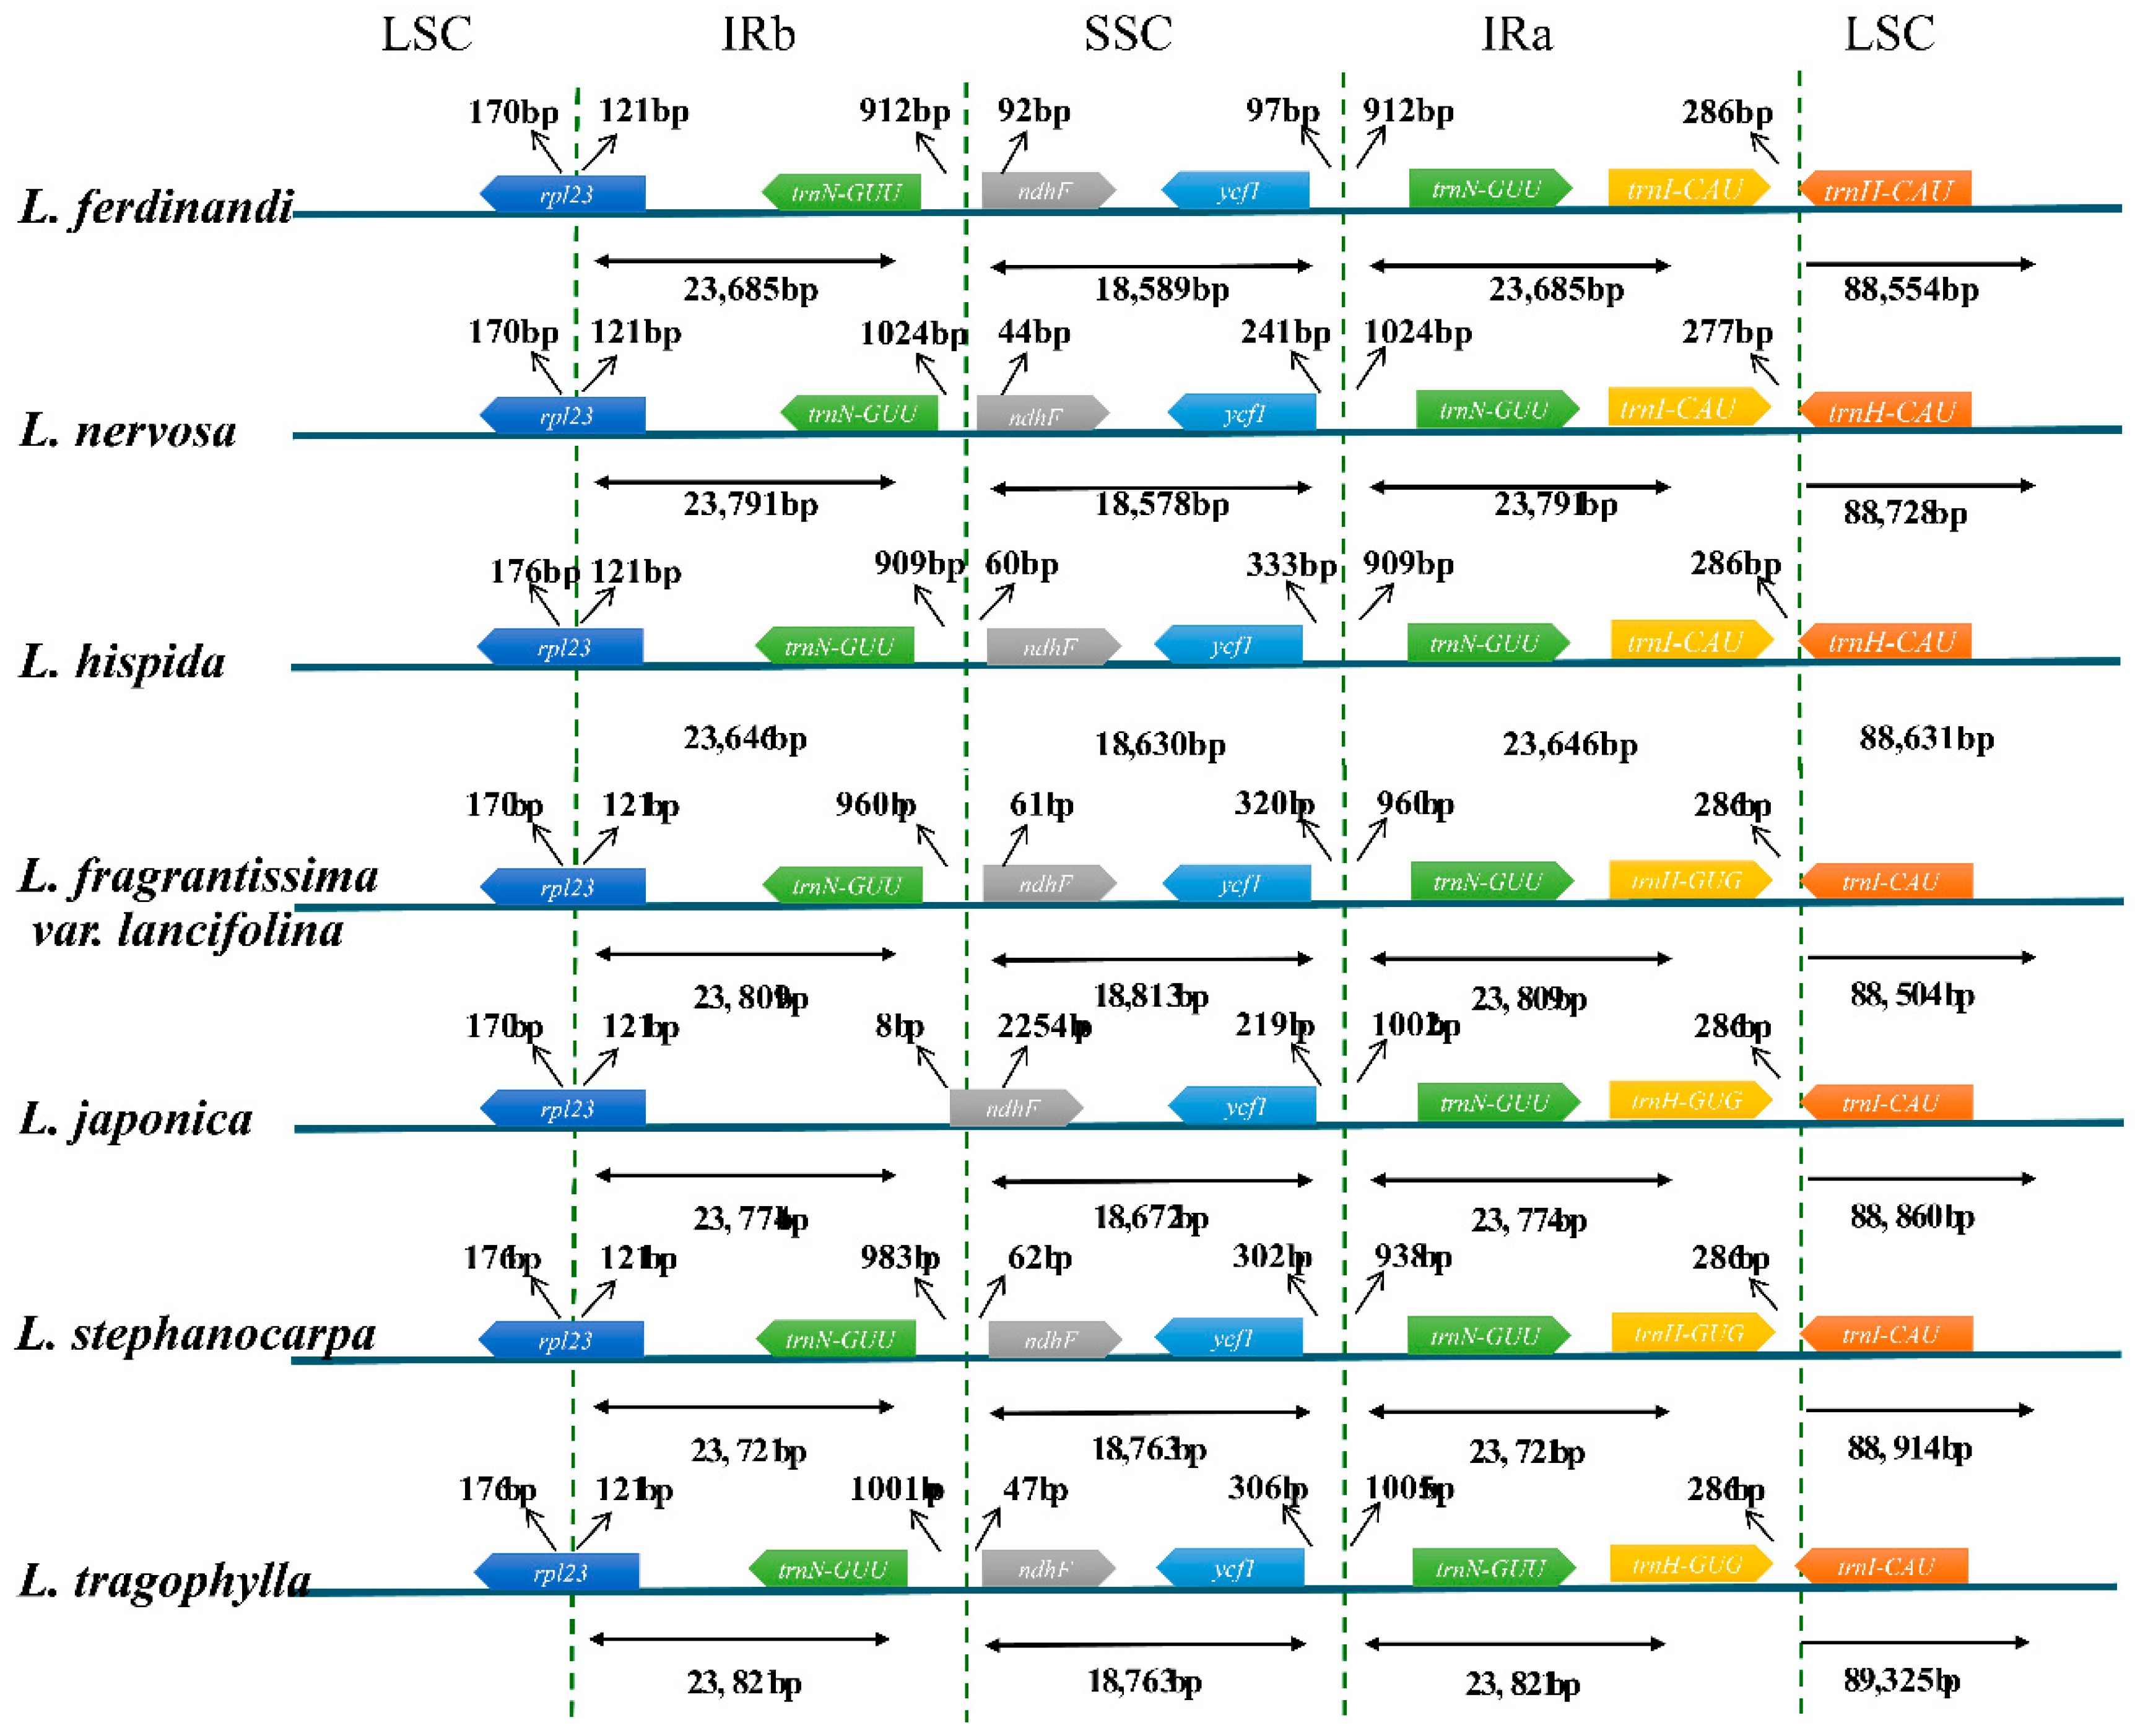
2.3. Divergence Hotspots of Plastid Genomes

The coding genes, non-coding regions, and complete chloroplast genomes of seven Lonicera species were compared using the mVISTA program. To elucidate the level of sequence divergence, the percentages of variation were also calculated. As expected, non-coding regions and SC regions exhibited the higher levels of divergence than the coding and IR regions (Tables S4 and S5, Figure 4 and Figure 5). The percentage of variation in non-coding regions ranges from 0 to 61.3%, with an average of 9.37%, which is higher than that in the coding regions (ranging from 0 to 13.4%, an average of 2.50%). In coding regions, seven genes have the greatest variability (>5%): rps15, rps16, rps18, rpl23, psaJ, infA, and ycf1. Eleven intergenic regions have a percentage exceeding 20%: trnN-GUU-ndhF, rpoC2-rpoC1, rbcL-psaI, trnI-CAU-ycf2, psbZ-trnG-UCC, trnK-UUU-rps16, infA-rps8, rpl14-rpl16, trnV-GAC-rrn16, trnL-UAA intron, and rps12-clpP (Figure 5).
We analyzed the border structure of seven Lonicera plastid genomes. Detailed comparisons of the LSC, SSC, and IR regions are shown in Figure 6. The rpl23 gene located in the IRb extended into the LSC region by about 170–176 bp. The trnN and ndhF genes are located in either side of LSC/IRb border and 969–1068 bp apart, whereas the ndhF gene is located in boundary of L. japonica. The ycf1 gene is located in the SSC region, which ranges from 97 bp (L. ferdinandi) to 333 bp (L. hispida) away from the SSC/IRa border. IRa/LSC border performance is relatively stable, and the trnH gene is located 277–286 bp upstream of the IRa/LSC border.

2.4. Positive Selection Analysis

We detected 14 genes with positively selected sites via LRT tests (M0 vs. M3, M1 vs. M2, and M7 vs. M8) (p < 0.05, Tables S6 and S7), which included two genes for the subunit of ribosome protein (rpl16, rpl22), three subunits of the photosystem genes (psaJ, psbC, and ycf4), three NADH oxidoreductase genes (ndhB, ndhH, and ndhK), two subunits of ATP genes (atpA and atpB,) and four other genes (infA, rbcL, ycf1, and ycf2). Five genes (ndhB, ndhK, rpl16, rpl22, and ycf4) were detected in only one positively selected sites within Model 8, and the ycf1 and rbcL genes were detected in more than two or, three selected sites for Model 8 than Model 2 with p > 95%, respectively. We detected the most selective sites (18) in the ycf1 gene in the seven Lonicera plastid genomes.

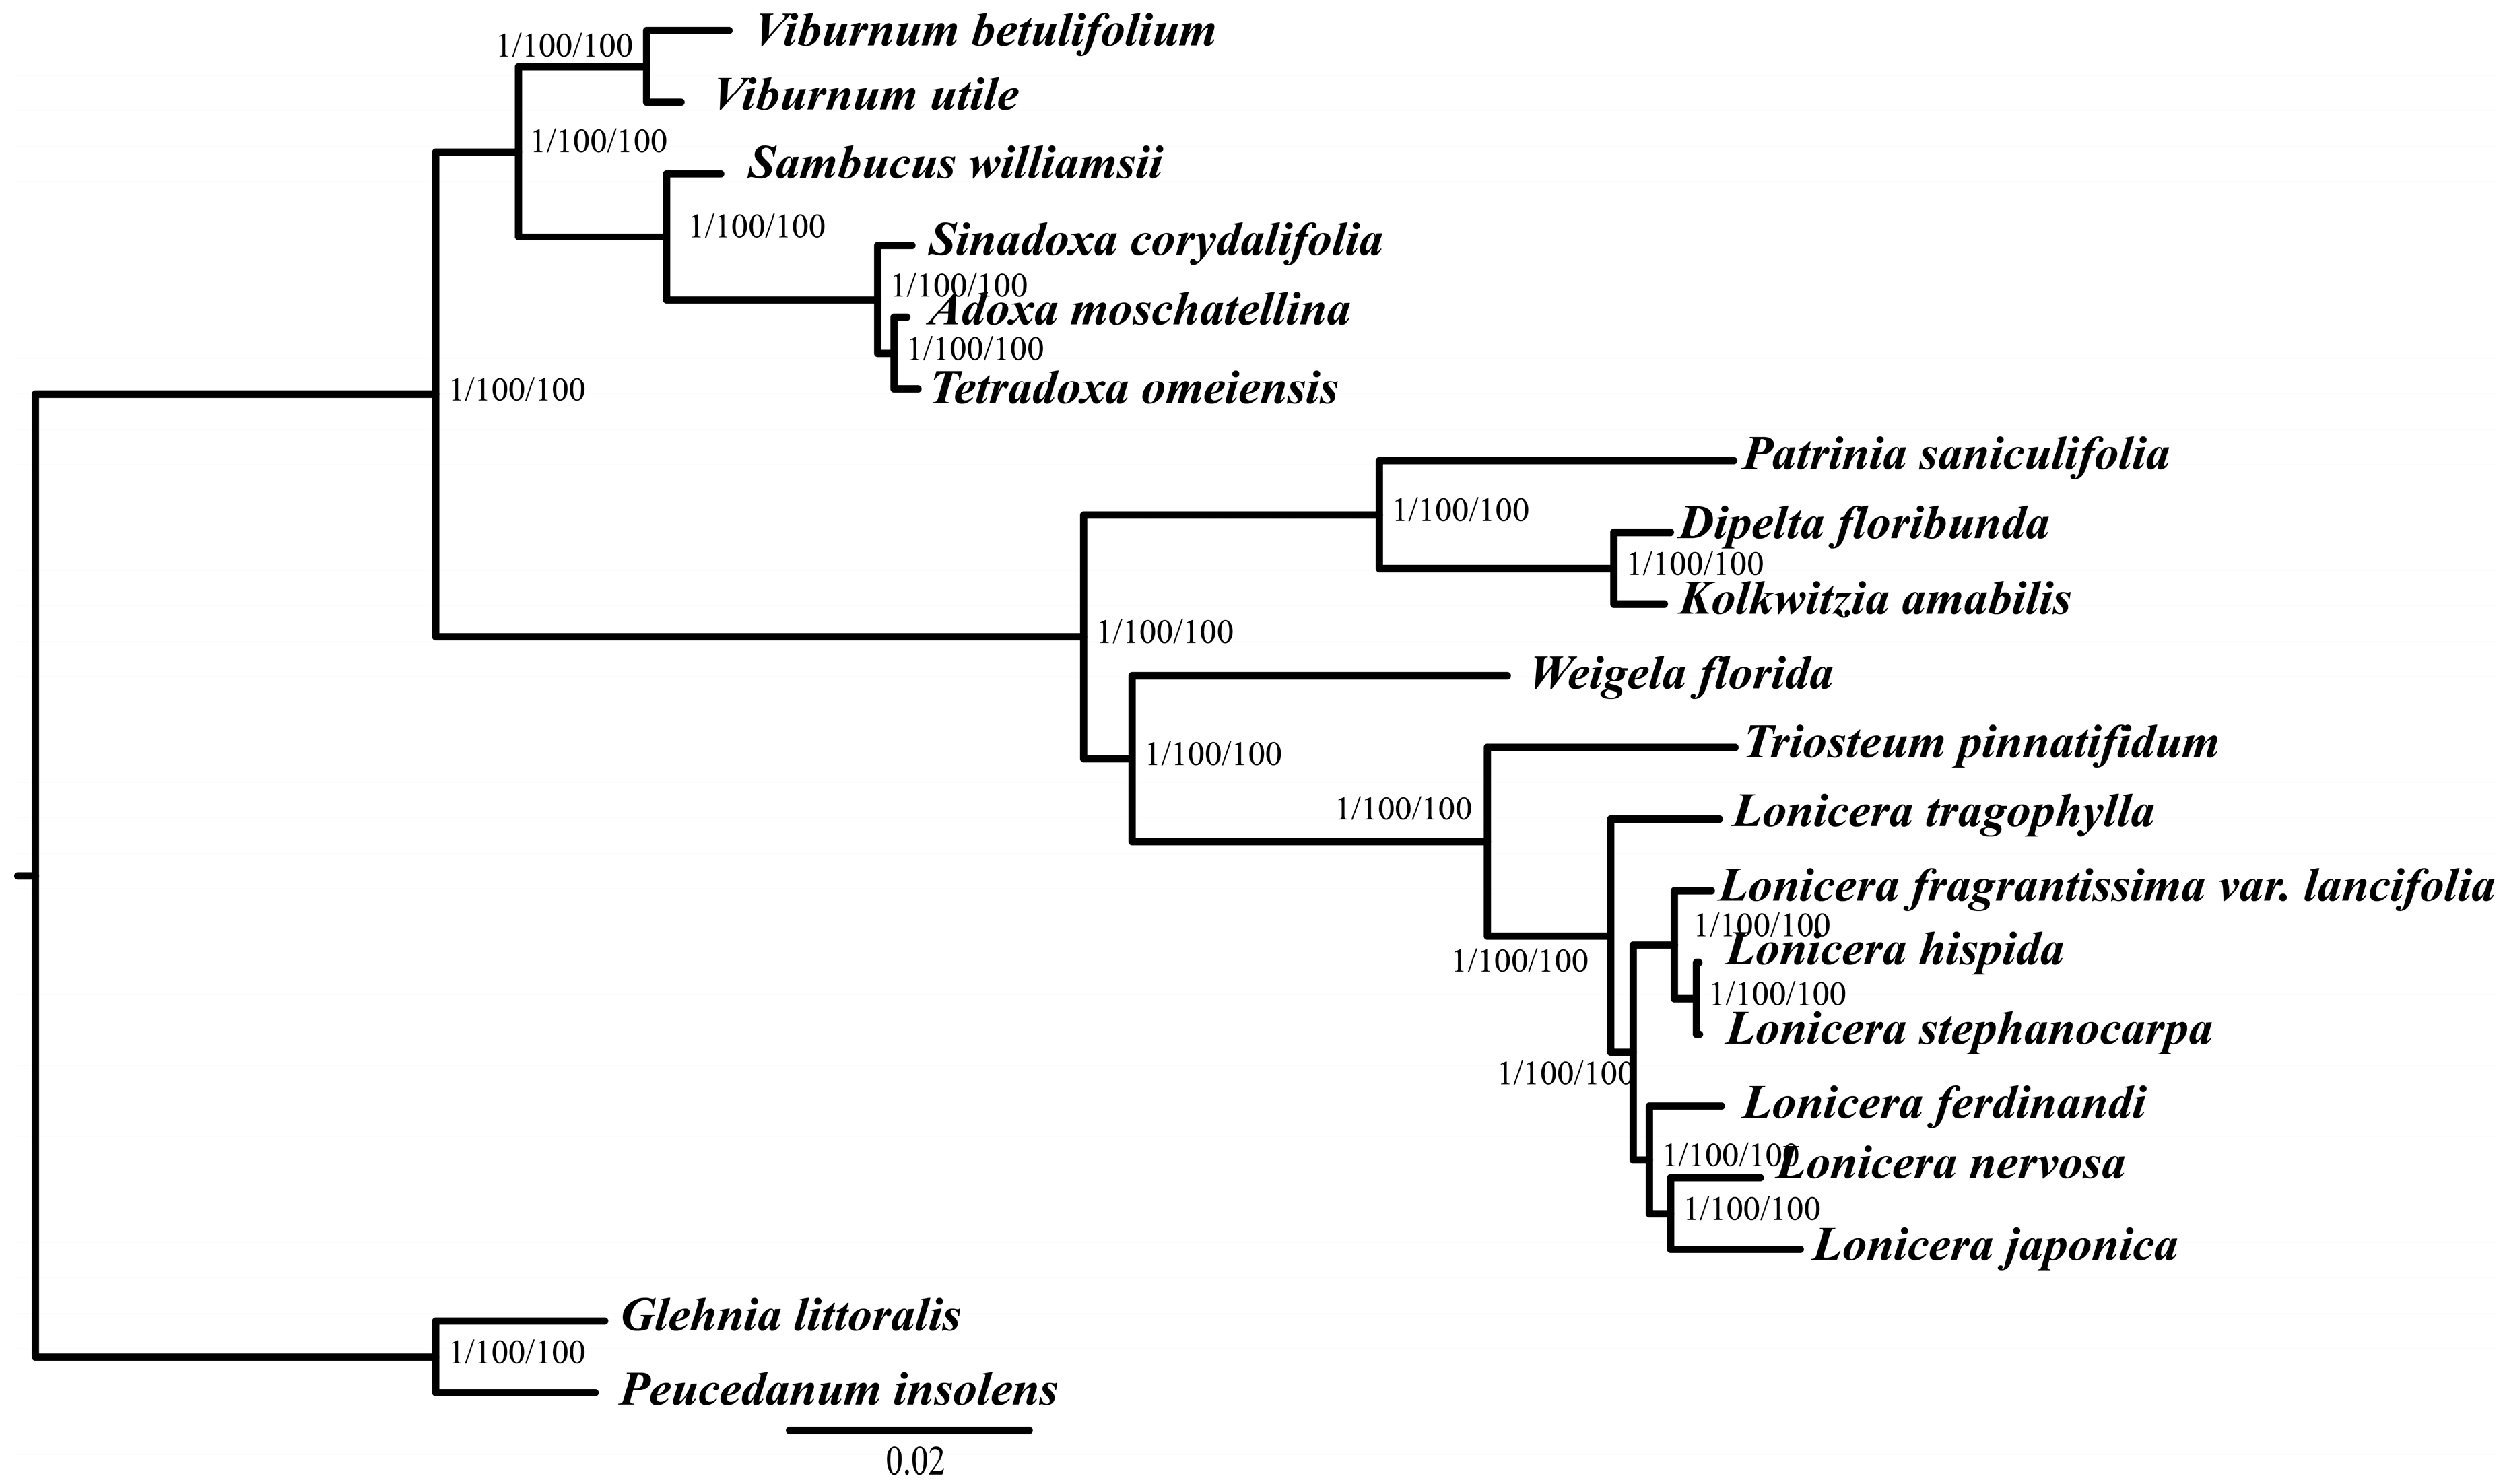
2.5. Phylogenetic Analysis

To obtain an accurate phylogenetic relationship of Lonicera species, we performed multiple sequence alignments of 20 complete plastid genomes. The obtained topology is presented in Figure 7. The basic topologies were similar in the MP and ML analyses, which showed that the 18 Dipsacales species were divided into two parts, containing six Adoxaceae and 12 Caprifoliaceae species. Within Caprifoliaceae, Patrinia saniculifolia Hemsl. was placed as a sister clade to Linnaceae (Dipelta floribunda Maximowicz and Kolkwitzia amabilis Graebner) with 100% bootstrap values. We found that the seven Lonicera species formed a highly-supported monophyletic lineage. L. tragophylla separated first of seven Lonicera species. Three Lonicera species (L. fragrantissima var. lancifolia, L. stephanocarpa, and L. hispida) and the other three species (L. ferdinandi, L. nervosa, and L. japonica) formed a sister clade with high bootstrap value.

3. Discussion

3.1. Features of Plastid Genomes

The available plastid genome sequences of most land plants have increased rapidly with the development of next generation sequencing (NGS) methods. However, the plastid genomes of Lonicera remained relatively limited, with only four species (L. japonica, L. fragrantissima var. lancifolia, L. stephanocarpa, and L. tragophylla) being reported [13,23]. Generally, most angiosperm plastid genomes are considered highly conserved in terms of their structure, gene content, and order [14]. In this study, we showed that the genome size of seven Lonicera species ranged from 154,513 to 155,545 bp, containing 82 protein-coding genes, 37 tRNA genes, 8 rRNA genes, and one pseudogene within quadripartite structure (LSC, 88,504–89,299 bp; SSC, 18,552–18,766 bp; and IR, 23,646–23,791 bp). The structure characteristics of the chloroplast genomes of these species are similar to those of most angiosperms [29]. In terms of GC content of the seven Lonicera plastids, the complete chloroplast genome had an overall GC content of ~38.4%, similar to the previously published L. japonica genome [13]. The GC content of IR regions is clearly higher than in the other regions, which are highly similar to most of land plants possibly due to the existence of the rRNA gene [30].
The pseudogenes in plastid genomes are functionless relatives of genes that have lost their ability to code and express a protein [31] relative to a complete gene. Although pseudogenes are not protein-coding DNA, these segment sequences may be similar to other kinds of noncoding regions, which may have a regulatory function [32] and have important roles in normal physiology and abnormal pathology [33]. In this study, we determined that the accD gene encoding a subunit of heteromeric acetyl-CoA carboxylase is a pseudogene in seven Lonicera species. The accD gene is known to be essential for leaf development in angiosperms [34]. Previous studies have shown that the accD gene has been lost in some angiosperm plastid genomes including Poales [35], Acoraceae [36,37], and Geraniaceae [38]. This gene may have played the main role in the physiological regulation in Lonicera species.

3.2. Repeat Sequence Variations

Previous studies suggested that repeat sequences may have played crucial roles in the rearrangement and stabilization of plastid genomes [39]. In the current study, we determined the dispersed, palindromic, and tandem repeats in seven Lonicera species, which showed that the number of tandem repeats is more than that of dispersed repeats, and palindromic repeats are the least common in these species. The majority of repeats were distributed in the intergenic spacer and intron regions, which is similar to those reported in other angiosperm lineages [26]. Variability in the copy number of SSRs in the chloroplast is generally polymorphic and can be used to analyze the population genetics and evolutionary studies at the inter- and intra-population levels [40]. We identified 313 SSR loci in the seven Lonicera plastid genomes. Most of these SSRs are located in noncoding regions (75%) and about of 25% are in protein-coding regions, similar to other angiosperms [41]. More tetra-nucleotide SSRs occur in the seven Lonicera plastomes. Among them, (AGAT)3 and (TATC)3 are shared by two ycf2 genes. The (AGAT)3 repeat unit was also found in the pseudo-gene accD region in six Lonicera species, except for L. tragophylla. This large number of repeat sequences and SSRs is possibly related to the plastid genome size variation and divergence [42]. We identified 18 divergence hotspots (rps15, rps16, rps18, rpl23, psaJ, infA, ycf1, trnN-GUU-ndhF, rpoC2-rpoC1, rbcL-psaI, trnI-CAU-ycf2, psbZ-trnG-UCC, trnK-UUU-rps16, infA-rps8, rpl14-rpl16, trnV-GAC-rrn16, trnL-UAA intron, and rps12-clpP) in seven Lonicera plastid genomes. A large number of repeat sequences are also distributed in these divergence hotspot regions. These regions could be considered as potential molecular genetic markers for further study of population genetics and species evolution of Lonicera.

3.3. Positive Selection Analysis

Synonymous and nonsynonymous nucleotide substitutions are important markers for protein coding gene evolution. Generally, the rates of nonsynonymous and synonymous substitution in plant chloroplast genomes are relatively slow [43] due to the action of purifying and neutral selection [44]. In this study, we identified 14 protein-coding genes under positive selection. These genes included two small subunits of ribosome genes (rpl16 and rpl22) that have been proven to be essential for the chloroplast ribosome development in plants [45]. Eleven genes (ndhA-ndhK) were found in the plastid genomes of most plants, encoding the NAD(P)H dehydrogenase (NDH) complex, which is involved in the I circulatory electron transport and chlororespiration, whereas three of these genes (ndhB, ndhH, and ndhK) were found to own selected sites. The family genes of psa and psb, and ycf3 and ycf4 genes were found to play vital roles in plant photosystem. The psaJ and psbC genes respectively belong to photosystem I and photosystem II. The ycf4 gene forms modules that mediate PSI assembly as conserved chloroplast-encoded auxiliary factors [46]. The gene infA encodes translation initiation factor 1. It has been lost completely in some angiosperms [47,48] and is present as a pseudogene in the majority of angiosperms [47,48]. The rbcL gene was also found to play an important role as a photosynthetic electron transfer regulator, which is essential for photosynthesis [49]. We found rbcL gene possess nine sites under positive selection in these Lonicera species. A previous study also showed that the rbcL gene is often under positive selection in land plants [23,50]. The ycf1 and ycf2 genes are the largest plastid genes, encoding a protein that was part of the chloroplast inner envelope membrane protein translocon [51]. We identified 7 and 18 positively selected sites in the ycf1 and ycf2 genes, respectively. The current study also revealed that the positive selection of these two genes in angiosperm plants may be a common phenomenon [42].

3.4. Phylogenetic Relationship

In the previously phylogenetic results of Caprifoliaceae, Rehder [7] divided Lonicera species into two subgenera: Lonicera and Caprifolium. Lonicera subgenera contains four sections, Coeloxylosteum, Isoxylosteum, Nintooa, and Isika. In our study, phylogenetic analysis based on the complete plastid genomes showed that the seven Lonicera species form a highly-supported monophyletic lineage. L. tragophylla is separated from the seven Lonicera species. Some previously studies based on the partial nuclear and chloroplast DNA markers found that L. ferdinandi, L. hispida, L. stephanocarpa, and L. fragrantissima var. lancifolia belong to the Isika section, and L. nervosa belongs to Rhodanthae subsection, and L. japonica belongs to Nintooa [12]. These incongruent results may be due to the different sampling strategies and different molecular markers that were used. We also found that the three Lonicera species (L. fragrantissima var. lancifolia, L. stephanocarpa, and L. hispida) and the other three species (L. ferdinandi, L. nervosa, and L. japonica) form a sister clade with high bootstrap values. L. ferdinandi is closely related to L. japonica and L. nervosa. These findings are similar to previous morphological analyses of Caprifoliaceae species [7,12]. In conclusion, the results of phylogenetic analysis based on the plastid genomes greatly enhance our understanding of the evolutionary relationships among Lonicera species [52,53]. In the future, the more plastid genome datasets are needed to test the phylogenetic relationship and species evolution of Lonicera species.

4. Method

4.1. Sampling and Sequencing

Fresh leaves of three Lonicera species, Lonicera nervosa Maximowicz, Lonicera ferdinandi Franchet, and Lonicera hispida Pallas ex Schultes, were collected from Chunxin and Huating counties in Gansu province, China, in 2017. The dried plant samples and voucher specimens were deposited in the Key Laboratory of Resource Biology and Biotechnology in Western China (Shaanxi, China). The total genomic DNA was extracted from about 5 g of leaf tissue using a DNeasy Plant Mini Kit (Qiagen, Germany) according to the manufacturer’s instructions. About 5 ug purified DNA was used to construct paired-end libraries with 350 bp insert size and to sequence on an Illumina HiSeq 2500 platform by Novogene (Beijing, China). We downloaded the other four published Lonicera plastid genome sequences (Lonicera japonica Thunberg in Murray, Lonicera fragrantissima var. lancifolia (Rehder) Q. E. Yang Landrein, Borosova & J. Osborne, Lonicera stephanocarpa Franchet, and Lonicera tragophylla Hemsley) to employ the comparison analysis.

4.2. Chloroplast Genome Assembly and Annotation

We trimmed the raw reads by removing the shorter and low-quality reads using NGSQCToolkit v2.3.3 software [54]. After clean reads of L. nervosa, L. ferdinandi, and L. hispida were assembled using MIRA 4.0.2 [55] with the complete plastid genome of closely-related species L. japonica (NC_026839) as the reference. To further assemble the whole plastid genomes, some ambiguous regions were extended using the MITObim v1.7 program [56] with a baiting and iteration method. The complete chloroplast genome sequences were imported into the online program Dual Organellar Genome Annotator (Dogma) [57] for annotation. The positions of starts, stops, introns, and exons were manually adjusted by comparison with homologous genes in other chloroplast genomes (L. japonica, L. fragrantissima var. lancifolia, L. stephanocarpa, and L. tragophylla). All tRNA genes were further confirmed using online tool tRNAscan-SE [58]. Eventually, the circular plastid genome maps were drawn using the bio-software OGDRAW [59]. The plastid genome sequences of the three Lonicera species and their raw reads were submitted to NCBI (accession numbers: MK176510-MK176512, SRR8269399, and SRR8269400).

4.3. Repeat Sequence Analysis

In general, the long repeat contains dispersed, palindromic, and tandem repeats. In our study, the online software REPuter [60] was used to identify the dispersed and palindromic repeats with following conditions: (1) hamming distance of 1, (2) 90% or greater sequence identity, (3) and a minimum repeat size of 30 bp. The tandem repeats (>10 bp) were determined using the program Tandem Repeats Finder [61] with 2, 7, and 7 set for the alignment parameters match, mismatch, and indel, respectively. SSR loci were further detected using MISA software [62] with following thresholds: 10, 5, 4, 3, 3, and 3 repeat units for mono-nucleotide, di-nucleotide, tri-nucleotide, tetra-nucleotide, penta-nucleotide, and hexa-nucleotide SSRs, respectively.

4.4. Sequence Divergence Analysis

The complete plastid genomes of seven Lonicera species were compared using web-based program mVISTA [63] with L. japonica as the reference. To further identify the percentage of variable characters for each coding and non-coding region, the SNP sites were counted and positioned in the plastid genomes using DnaSP v5.0 [64].

4.5. Gene Selection Sites Analysis

The non-synonymous/synonymous substitution rate ratio (ω = dN/dS) is sensitive to the selection pressure in the evolution of protein level, and is particularly useful for identifying positive selection. A total of 75 protein-coding genes in Lonicera plastid genomes were extracted and compared using Genious R v9.0.5 [65] and MAFFT v7.0.0 [66]. The maximum likelihood phylogenetic tree was constructed using the program RAxML v7.2.8 [67] based on complete plastid genomes. The value of dN, dS, and ω for each gene exon were calculated using the site-specific model in the codeml program of Paml 4.7 [68]. In order to choose a more reliable model, we carried out the three likelihood ratio tests (LRT). The candidate sites of positive selection with significant support from posterior probability (p of (ω > 1) ≥ 0.99; Bayes Empirical Bayes approach) identified by M2 and M8 were considered further.

4.6. Phylogenetic Analysis

Phylogenetic analyses were performed on aligned data from 20 complete plastid genomes, which included 18 Dipsacales and two Apiaceae species, as demonstrated using Maximum parsimony (MP), Maximum likelihood (ML), and Bayesian inference (BI) analyses. Firstly, plastid genomes were aligned using MAFFT v7.0.0 [66] and the best-fitting model was selected using the MrModeltest 2.3 [69] through the Akaike information criterion (AIC). The ML and MP analyses were conducted using PAUP4 [70] with 1000 bootstrap replicates. BI analyses were performed using the program MrBayes v3.1.2 [71] with the settings as following: 1,000,000 generations Monte Carlo simulations (MCMC) algorithm, starting from random trees, and sampling 1 of every 1000 generations. Then 25% of all trees were burned using the software Tracer v1.6 [72].

5. Conclusions

In this study, we collected the complete chloroplast genomes of seven Lonicera species and determined the sequence variations and molecular evolution by comparative genomic analysis. The genus Lonicera plastomes exhibited a typical quadripartite DNA molecular structure, which is similar to those in other angiosperm species. A total of 498 repeats were identified in plastid genomes, which included tandem (130), dispersed (277), and palindromic (91) types of repeat variations. Simple sequence repeat (SSR) elements analysis indicated the enriched SSRs in seven plastomes to be mononucleotides, followed by tetra-nucleotides, dinucleotides, tri-nucleotides, hex-nucleotides, and penta-nucleotides. Interestingly, we determined eighteen divergence hotspot regions in these horticulturally- and economically-important Lonicera plastomes, which could be used as the potential molecular genetic markers for the further study of population genetics and phylogenetic evolution of Lonicera species. Selection pressure analysis showed that some plastid genes were under positive selection, which may played the important roles during the evolutionary process of Lonicera. Phylogenetic analysis based on the whole plastome revealed that the seven Lonicera species form a highly-supported monophyletic clade. The availability of these plastid genomes provides important genetic information for further species identification and evolutionary biological research on Lonicera.

Supplementary Materials

Author Contributions

Z.-H.L. designed the study. M.-L.L., W.-B.F., and N.W. performed the experiments. M.-L.L., W.-B.F., N.W., P.-B.D., T.-T.Z., and M.Y. contributed materials/analysis tools. Z.-H.L., W.-B.F., and M.-L.L. wrote the manuscript. Z.-H.L., W.-B.F., and M.-L.L. revised the manuscript.

Acknowledgments

This work was co-supported by the National Natural Science Foundation of China (31470400), the Shaanxi Provincial Key Laboratory Project of Department of Education (grant no. 17JS135), and the Open Foundation of Key Laboratory of Resource Biology and Biotechnology in Western China (Ministry of Education) (No. ZSK2017007).

Conflicts of Interest

The authors declare no conflict of interest.

References

  1. Jacobs, B.; Lens, F.; Smets, E. Evolution of fruit and seed characters in the Diervilla and Lonicera clades (Caprifoliaceae, Dipsacales). Ann. Bot. 2009, 104, 253–276. [Google Scholar] [CrossRef] [PubMed]
  2. Hsu, P.S. A preliminary numerical taxonomy of the family Caprifoliaceae. Acta Phytotaxon. Sin. 1983, 21, 26–32. [Google Scholar]
  3. Li, H.J.; Li, P.; Wang, M.C.; Ye, W.C. A new secoiridoid glucoside from Lonicera japonica. Chin. J. Nat. Med. 2003, 3, 132–133. [Google Scholar]
  4. Shang, X.F.; Pan, H.; Li, M.X.; Miao, X.L.; Ding, H. Lonicera japonica thunb.: Ethnopharmacology, phytochemistry and pharmacology of an important traditional Chinese medicine. J. Ethnopharmacol. 2011, 138, 1–21. [Google Scholar] [CrossRef] [PubMed]
  5. Ren, M.T.; Chen, J.; Song, Y.; Sheng, L.S.; Li, P.; Qi, L.W. Identification and quantification of 32 bioactive compounds in Lonicera species by high performance liquid chromatography coupled with time-of-flight mass spectrometry. J. Pharm. Biomed. 2008, 48, 1351–1360. [Google Scholar] [CrossRef] [PubMed]
  6. Chen, C.Y.; Qi, L.W.; Li, H.J.; Li, P.; Yi, L.; Ma, H.L.; Tang, D. Simultaneous determination of iridoids, phenolic acids, flavonoids, and saponins in Flos Lonicerae and Flos Lonicerae Japonicae by HPLC-DAD-ELSD coupled with principal component analysis. J. Sep. Sci. 2007, 30, 3181–3192. [Google Scholar] [CrossRef]
  7. Rehder, A. Synopsis of the Genus Lonicera. Mo. Bot. Gard. Annu. Rep. 1903, 27–232. [Google Scholar] [CrossRef]
  8. Lin, S.L.; Yang, L.M.; Qiao, G.P. The study on greenwood cutting reproduction technology of Lonicera edulls. J. Jilin Agric. Univ. 2003, 25, 10. [Google Scholar]
  9. Choi, C.W.; Jung, H.A.; Kang, S.S.; Choi, J.S. Antioxidant constituents and a new triterpenoid glycoside from Flos Lonicerae. Arch. Pharm. Res. 2007, 30, 1–7. [Google Scholar] [CrossRef]
  10. Gao, Z.T.; Liu, Y.; Wang, X.Y.; Song, J.Y.; Chen, S.L.; Ragupathy, S.; Han, J.P.; Newmaster, S.G. Derivative technology of DNA barcoding (nucleotide signature and SNP double peak methods) detects adulterants and substitution in Chinese patent medicines. Sci. Rep. 2017, 7, 5858. [Google Scholar] [CrossRef]
  11. Rai, A.; Kamochi, H.; Suzuki, H.; Nakamura, M.; Takahashi, H.; Hatada, T.; Saito, K.; Yamazaki, M. De novo transcriptome assembly and characterization of nine tissues of Lonicera japonica, to identify potential candidate genes involved in chlorogenic acid, luteolosides, and secoiridoid biosynthesis pathways. J. Nat. Med. 2017, 71, 1–15. [Google Scholar] [CrossRef] [PubMed]
  12. Nina, T.; Michael, J.D.; Li, J.H. Phylogenetics of the Caprifolieae and Lonicera (Dipsacales) based on nuclear and chloroplast DNA sequences. Syst. Bot. 2008, 33, 776–783. [Google Scholar]
  13. He, L.; Qian, J.; Li, X.W.; Sun, Z.Y.; Xu, X.L.; Chen, S.L. Complete chloroplast genome of medicinal plant Lonicera japonica: Genome rearrangement, intron gain and loss, and implications for phylogenetic studies. Molecules 2017, 22, 249. [Google Scholar] [CrossRef] [PubMed]
  14. Wicke, S.; Schneeweiss, G.M.; dePamphilis, C.W.; Müller, K.F.; Quandt, D. The evolution of the plastid chromosome in land plants: Gene content, gene order, gene function. Plant Mol. Biol. 2011, 76, 273–297. [Google Scholar] [CrossRef] [PubMed]
  15. Palmer, J.D. Plastid chromosomes: Structure and evolution. In Cell Culture and Somatic Cell Genetics of Plants; Bogorad, L., Vasil, I.K., Eds.; Academic Press: San Diego, CA, USA, 1991; pp. 5–53. [Google Scholar]
  16. Raubeson, L.A.; Jansen, R.K. Chloroplast genomes of plants. In Plant Diversity and Evolution: Genotypic and Phenotypic Variation in Higher Plants; Henry, R.J., Ed.; CAB International: London, UK, 2005; pp. 45–68. [Google Scholar]
  17. Jansen, R.K.; Ruhlman, T.A. Plastid genomes of seed plants. In Genomics of Chloroplasts and Mitochondria, Advances in Photosynthesis and Respiration; Bock, R., Knoop, V., Eds.; Springer: Dordrecht, The Netherlands, 2012; pp. 103–126. [Google Scholar]
  18. Ruhlman, T.A.; Jansen, R.K. The plastid genomes of flowering plants. In Chloroplast Biotechnology: Methods and Protocols; Maliga, P., Ed.; Spring: New York, NY, USA, 2014; pp. 3–38. [Google Scholar]
  19. George, B.; Bhatt, B.S.; Awasthi, M.; George, B.; Singh, A.K. Comparative analysis of microsatellites in chloroplast genomes of lower and higher plants. Curr. Genet. 2015, 61, 665–667. [Google Scholar] [CrossRef] [PubMed]
  20. Tobes, R.; Pareja, E. Repetitive extragenic palindromic sequences in the Pseudomonas syringae pv. tomato DC3000 genome: Extragenic signals for genome reannotation. Res. Microbiol. 2005, 156, 424–433. [Google Scholar] [PubMed]
  21. Li, S.F.; Su, T.; Cheng, G.Q.; Wang, B.X.; Li, X.; Deng, C.L.; Gao, W.J. Chromosome evolution in connection with repetitive sequences and epigenetics in plants. Genes 2017, 8, 290. [Google Scholar] [CrossRef] [PubMed]
  22. Yang, J.; Yue, M.; Niu, C.; Ma, X.F.; Li, Z.H. Comparative analysis of the complete chloroplast genome of four endangered herbals of Notopterygium. Genes 2017, 8, 124. [Google Scholar] [CrossRef] [PubMed]
  23. Fan, W.B.; Wu, Y.; Yang, J.; Shahzad, K.; Li, Z.H. Comparative chloroplast genomics of Dipsacales species: Insights into sequence variation, adaptive evolution, and phylogenetic relationships. Front. Plant Sci. 2018, 9, 689. [Google Scholar] [CrossRef] [PubMed]
  24. Liu, P.L.; Wan, J.N.; Guo, Y.P.; Ge, S.; Rao, G.Y. Adaptive evolution of the chrysanthemyl diphosphate synthase gene involved in irregular monoterpene metabolism. BMC Evol. Biol. 2012, 12, 214. [Google Scholar] [CrossRef] [PubMed]
  25. Shiu, S.H.; Byrnes, J.K.; Pan, R.S.; Zhang, P.; Li, W.H. Role of positive selection in the retention of duplicate genes in mammalian genomes. Proc. Natl. Acad. Sci. USA 2006, 103, 2232–2236. [Google Scholar] [CrossRef] [PubMed] [Green Version]
  26. Yang, Y.C.; Zhou, T.; Duan, D.; Yang, J.; Feng, L.; Zhao, G.F. Comparative analysis of the complete chloroplast genomes of five Quercus species. Front Plant. Sci. 2016, 7, 573. [Google Scholar] [CrossRef] [PubMed]
  27. Zhang, L.J.; Chen, J.; Wang, T. Adaptive evolution in the chloroplast gene rps4 in ferns. Bull. Bot. Res. 2010, 30, 42–50. [Google Scholar]
  28. Hao, D.C.; Chen, S.L.; Xiao, P.G. Molecular evolution and positive darwinian selection of the chloroplast maturase matK. J. Plant Res. 2010, 123, 241–247. [Google Scholar] [CrossRef] [PubMed]
  29. Huang, J.; Zhang, C.M.; Zhao, X.; Fei, Z.G.; Wan, K.K.; Zhang, Z.; Pang, X.M.; Yin, X.; Bai, Y.; Sun, X.Q.; et al. The jujube genome provides insights into genome evolution and the domestication of sweetness/acidity taste in fruit trees. PLoS. Genet. 2016, 12, e1006433. [Google Scholar] [CrossRef]
  30. Bock, R. Structure, function, and inheritance of plastid genomes. In Cell and Molecular Biology of Plastids; Bock, R., Ed.; Springer: Berlin/Heidelberg, Germany, 2007; pp. 29–63. [Google Scholar]
  31. Prade, V.M.; Gundlach, H.; Twardziok, S.; Chapman, B.; Tan, C.; Langridge, P.; Schulman, A.H.; Stein, N.; Waugh, R.; Zhang, G.P.; et al. The pseudogenes of barley. Plant J. 2018, 93, 502. [Google Scholar] [CrossRef] [PubMed]
  32. Poliseno, L.; Salmena, L.; Zhang, J.W.; Carver, B.; Haveman, W.J.; Pandolfi, P.P. A coding-independent function of gene and pseudogene mRNAs regulates tumour biology. Nature 2010, 465, 1033–1038. [Google Scholar] [CrossRef] [Green Version]
  33. Lu, X.J.; Gao, A.M.; Ji, L.J.; Xu, J. Pseudogene in cancer: Real functions and promising signature. J. Med. Genet. 2015, 52, 17–24. [Google Scholar]
  34. Hong, C.P.; Park, J.; Lee, Y.; Lee, M.; Park, S.G.; Uhm, Y.; Kim, C.K. accD nuclear transfer of platycodon grandiflorum and the plastid of early Campanulaceae. BMC Genom. 2017, 18, 607. [Google Scholar] [CrossRef]
  35. Harris, M.E.; Meyer, G.; Vandergon, T.; Vandergon, V.O. Loss of the acetyl-CoA carboxylase (accD) gene in Poales. Plant Mol. Biol. Rep. 2012, 31, 21–31. [Google Scholar] [CrossRef]
  36. Goremykin, V.V.; Holland, B.; Hirschernst, K.I.; Hellwig, F.H. Analysis of Acorus calamus chloroplast genome and its phylogenetic implications. Mol. Biol. Evol. 2005, 22, 1813–1822. [Google Scholar] [CrossRef]
  37. Rousseau-Gueutin, M.; Huang, X.; Higginson, E.; Ayliffe, M.; Day, A.; Timmis, J.N. Potential functional replacement of the plastidic acetyl-CoA carboxylase subunit (accD) gene by recent transfers to the nucleus in some angiosperm lineages. Plant Physiol. 2013, 161, 1918–1929. [Google Scholar] [CrossRef]
  38. Guisinger, M.M.; Kuehl, J.V.; Boore, J.L.; Jansen, R.K. Genome-wide analyses of Geraniaceae plastid DNA reveal unprecedented patterns of increased nucleotide substitutions. Proc. Natl. Acad. Sci. USA 2008, 105, 18424–18429. [Google Scholar] [CrossRef] [PubMed] [Green Version]
  39. Cavalier-Smith, T. Chloroplast evolution: Secondary symbiogenesis and multiple losses. Curr. Biol. CB 2002, 12, R62. [Google Scholar] [CrossRef]
  40. Pauwels, M.; Vekemans, X.; Godé, C.; Frérot, H.; Castric, V.; Saumitou-Laprade, P. Nuclear and chloroplast DNA phylogeography reveals vicariance among European populations of the model species for the study of metal tolerance, Arabidopsis halleri (Brassicaceae). New Phytol. 2012, 193, 916–928. [Google Scholar] [CrossRef] [PubMed]
  41. Zhang, X.; Zhou, T.; Kanwal, N.; Zhao, Y.M.; Bai, G.Q.; Zhao, G.F. Completion of eight Gynostemma BL. (Cucurbitaceae) chloroplast genomes: Characterization, comparative analysis, and phylogenetic relationships. Front Plant. Sci. 2017, 8, 1583. [Google Scholar] [CrossRef] [PubMed]
  42. Wu, Y.; Liu, F.; Yang, D.G.; Li, W.; Zhou, X.J.; Pei, X.Y.; Liu, Y.G.; He, K.L.; Zhang, W.S.; Ren, Z.Y.; et al. Comparative chloroplast genomics of Gossypium species: Insights into repeat sequence variations and phylogeny. Front. Plant Sci. 2018, 9, 376. [Google Scholar] [CrossRef] [PubMed]
  43. Erixon, P.; Oxelman, B. Whole-gene positive selection, elevated synonymous substitution rates, duplication, and indel evolution of the chloroplast clpP1 gene. PLoS ONE 2008, 3, e1386. [Google Scholar] [CrossRef] [PubMed]
  44. Ivanova, Z.; Sablok, G.; Daskalova, E.; Zahmanova, G.; Apostolova, E.; Yahubyan, G.; Baev, V. Chloroplast genome analysis of resurrection tertiary relict Haberlea rhodopensis highlights genes important for desiccation stress response. Front. Plant Sci. 2017, 8, 204. [Google Scholar] [CrossRef] [PubMed]
  45. Rogalski, M.; Ruf, S.; Bock, R. Tobacco plastid ribosomal protein S18 is essential for cell survival. Nucleic Acids. Res. 2006, 34, 4537–4545. [Google Scholar] [CrossRef] [PubMed] [Green Version]
  46. Nellaeplli, S.; Ozawa, S.I.; Kuroda, H.; Takahashi, Y. The photosystem I assembly apparatus consisting of Ycf3–Y3IP1 and Ycf4 modules. Nat. Commun. 2018, 9, 2439. [Google Scholar] [CrossRef] [PubMed]
  47. Millen, R.S.; Olmstead, R.G.; Adams, K.L.; Palmer, J.D.; Lao, N.T.; Heggie, L.; Kavanagh, T.A.; Hibberd, J.M.; Gray, J.C.; Morden, C.W.; et al. Many parallel losses of infA from chloroplast DNA during angiosperm evolution with multiple independent transfers to the nucleus. Plant Cell 2001, 13, 645–658. [Google Scholar] [CrossRef] [PubMed]
  48. Steane, D.A. Complete nucleotide sequence of the chloroplast genome from the Tasmanian blue gum, Eucalyptus globulus (Myrtaceae). DNA Res. 2005, 12, 215–220. [Google Scholar] [CrossRef] [PubMed]
  49. Allahverdiyeva, Y.; Mamedov, F.; Mäenpää, P.; Vass, I.; Aro, E.M. Modulation of photosynthetic electron transport in the absence of terminal electron acceptors: Characterization of the rbcL deletion mutant of tobacco. BBA-Bioenergetics 2005, 1709, 69–83. [Google Scholar] [CrossRef] [PubMed]
  50. Kapralov, M.V.; Filatov, D.A. Widespread positive selection in the photosynthetic Rubisco enzyme. BMC Evol. Biol. 2007, 7, 73. [Google Scholar] [CrossRef] [PubMed]
  51. Kikuchi, S.; Bédard, J.; Hirano, M.; Hirabayashi, Y.; Oishi, M.; Imai, M.; Takase, M.; Ide, T.; Nakai, M. Uncovering the protein translocon at the chloroplast inner envelope membrane. Science 2013, 339, 571–574. [Google Scholar] [CrossRef]
  52. Leebens-Mack, J.; Raubeson, L.A.; Cui, L.Y.; Kuehl, J.V.; Fourcade, M.H.; Chumley, T.W.; Boore, J.L.; Jansen, R.K.; dePamphilis, C.W. Identifying the basal angiosperm node in chloroplast genome phylogenies: Sampling one’s way out of the Felsenstein zone. Mol. Biol. Evol. 2005, 22, 1948–1963. [Google Scholar] [CrossRef]
  53. Moore, M.J.; Bell, C.D.; Soltis, P.S.; Soltis, D.E. Using plastid genome-scale data to resolve enigmatic relationships among basal angiosperms. Proc. Natl. Acad. Sci. USA 2007, 104, 19363–19368. [Google Scholar] [CrossRef] [Green Version]
  54. Patel, R.K.; Jain, M. NGS QC Toolkit: A toolkit for quality control of next generation sequencing data. PLoS ONE 2012, 7, e30619. [Google Scholar] [CrossRef]
  55. Chevreux, B.; Pfisterer, T.; Drescher, B.; Driesel, A.J.; Müller, W.E.G.; Wetter, T.; Suhai, S. Using the miraEST assembler for reliable and automated mRNA transcript assembly and SNP detection in sequenced ESTs. Genome Res. 2004, 14, 1147–1159. [Google Scholar] [CrossRef]
  56. Hahn, C.; Bachmann, L.; Chevreux, B. Reconstructing mitochondrial genomes directly from genomic next-generation sequencing reads—A baiting and iterative mapping approach. Nucleic Acids Res. 2013, 41, e129. [Google Scholar] [CrossRef]
  57. Wyman, S.K.; Jansen, R.K.; Boore, J.L. Automatic annotation of organellar genomes with DOGMA. Bioinformatics 2004, 20, 3252–3255. [Google Scholar] [CrossRef] [PubMed] [Green Version]
  58. Schattner, P.; Brooks, A.N.; Lowe, T.M. The tRNAscan-SE, snoscan and snoGPS web servers for the detection of tRNAs and snoRNAs. Nucleic Acids Res. 2005, 33, 686–689. [Google Scholar] [CrossRef] [PubMed]
  59. Lohse, M.; Drechsel, O.; Kahlau, S.; Bock, R. OrganellarGenomeDRAW--a suite of tools for generating physical maps of plastid and mitochondrial genomes and visualizing expression data sets. Nucleic Acids Res. 2013, 41, W575. [Google Scholar] [CrossRef] [PubMed]
  60. Kurtz, S.; Choudhuri, J.V.; Ohlebusch, E.; Schleiermacher, C.; Stoye, J.; Giegerich, R. REPuter: The manifold applications of repeat analysis on a genomic scale. Nucleic Acids Res. 2001, 29, 4633. [Google Scholar] [CrossRef] [PubMed]
  61. Benson, G. Tandem repeats finder: A program to analyze DNA sequences. Nucleic Acids Res. 1999, 27, 573–580. [Google Scholar] [CrossRef] [PubMed]
  62. Thiel, T.; Michalek, W.; Varshney, R.K.; Graner, A. Exploiting EST databases for the development and characterization of gene-derived SSR-markers in barley (Hordeum vulgare L.). Theop. Appl. Genet. 2003, 106, 411–422. [Google Scholar] [CrossRef]
  63. Frazer, K.A.; Pachter, L.; Poliakov, A.; Rubin, E.M.; Dubchak, I. VISTA: Computational tools for comparative genomics. Nucleic Acids Res. 2004, 32, W273–W279. [Google Scholar] [CrossRef]
  64. Librado, P.; Rozas, J. DnaSP v5: A software for comprehensive analysis of DNA polymorphism data. Bioinformatics 2009, 25, 1451–1452. [Google Scholar] [CrossRef]
  65. Kearse, M.; Moir, R.; Wilson, A.; Stones-Havas, S.; Cheung, M.; Sturrock, S.; Buxton, S.; Cooper, A.; Markowitz, S.; Duran, C.; et al. Geneious Basic: An integrated and extendable desktop software platform for the organization and analysis of sequence data. Bioinformatics 2012, 28, 1647. [Google Scholar] [CrossRef]
  66. Katoh, K.; Standley, D.M. MAFFT multiple sequence alignment software version 7: Improvements in performance and usability. Mol. Biol. Evol. 2013, 30, 772–780. [Google Scholar] [CrossRef] [PubMed]
  67. Stamatakis, A. RAxML-VI-HPC: Maximum likelihood-based phylogenetic analyses with thousands of taxa and mixed models. Bioinformatics 2006, 22, 2688. [Google Scholar] [CrossRef] [PubMed]
  68. Yang, Z.H.; Wong, W.S.W.; Nielsen, R. Bayes empirical bayes inference of amino acid sites under positive selection. Mol. Biol. Evol. 2005, 22, 1107–1118. [Google Scholar] [CrossRef] [PubMed]
  69. Nylander, J. Mrmodeltest v2. Program Distributed by the Author; Uppsala University: Uppsala, Sweden, 2004. [Google Scholar]
  70. Swofford, D.L. Paup 4.0 for Macintosh: Phylogenetic Analysis Using Parsimony (Software and User’s Book for Macintosh); Sinauer Associates, Incorporated: Sunderland, MA, USA, 2004. [Google Scholar]
  71. Ronquist, F.; Huelsenbeck, J.P. MrBayes 3: Bayesian phylogenetic inference under mixed models. Bioinformatics 2003, 19, 1572–1574. [Google Scholar] [CrossRef] [PubMed] [Green Version]
  72. Drummond, A.J.; Suchard, M.A.; Xie, D.; Rambaut, A. Bayesian phylogenetics with BEAUti and the BEAST 1.7. Mol. Biol. Evol. 2012, 29, 1969–1973. [Google Scholar] [CrossRef] [PubMed]
Figure 1. Chloroplast genome map for three Lonicera species. Genes located outside the outer rim are transcribed in a counterclockwise direction, whereas genes inside the outer rim are transcribed in a clockwise direction (as indicated by grey arrows). The colored bars indicate known different functional groups. The dashed gray area in the inner circle shows the percentage GC content of the corresponding genes. LSC, SSC, and IR denote large single copy, small single copy, and inverted repeat, respectively.
Ijms 19 04039 g001
Figure 2. Amino acid (a) and codon usage (b) frequencies of the protein-coding sequences in the seven Lonicera chloroplast genomes. *: Termination codon.
Ijms 19 04039 g002
Figure 3. Analysis of repeated sequences in the seven Lonicera chloroplast genomes. (a) Frequency of selected motifs of simple sequence repeats (SSRs); (b) Frequency of repeat sequences of length >30 bp; (c) Composition of the repeats in seven Lonicera species.
Ijms 19 04039 g003
Figure 4. Percentages of variable characters in homologous regions among the chloroplast genomes of seven Lonicera species: (a) coding region and (b) noncoding region. The homologous regions are oriented according to their locations in the chloroplast genome.
Ijms 19 04039 g004
Figure 5. Sequence alignment of chloroplast genomes from seven Lonicera species. Sequences of chloroplast genomes were aligned and compared using the mVISTA program. The horizontal axis (x) indicates the coordinates within the chloroplast genome. The vertical scale (y axis) indicates the percentage identity, ranging from 50 to 100%. The grey arrows indicates the direction of each gene. Purple bars represent exons, orange bars show conserved non-coding sequences.
Ijms 19 04039 g005
Figure 6. Comparison of the border positions of large single copy (LSC), small single copy (SSC), and inverted repeat (IR) regions in the chloroplast genomes in seven Lonicera species.
Ijms 19 04039 g006
Figure 7. Phylogenetic tree obtained for seven Lonicera species based on the complete chloroplast genomes. The first number of the slashes on the branches shows the posterior probabilities according to Bayesian inference, the second number shows the bootstrap values obtained by maximum likelihood analyses, and the third number shows the bootstrap values obtained by maximum parsimony analyses.
Ijms 19 04039 g007
Table 1. The features of chloroplast genomes of seven Lonicera species.
SpeciesL. ferdinandiL. hispidaL. nervosaL. fragrantissima var. lancifoliaL. stephanocarpaL. tragophyllaL. japonica
No. of mapped reads180,643159,034158,808
Average coverage149.1419.2198.4
Total sequence length154,513154,553154,862154,732155,056155,545155,078
Large single copy (LSC)88,55488,63188,72888,50488,91289,29988,858
Inverted repeat (IR) region23,68523,64623,79123,73123,69023,75923,774
Small single copy (SSC)18,58918,63018,55218,76618,76318,72818,672
GC content (%)38.438.338.638.338.338.538.6
GC content in LSC (%)36.936.836.936.836.837.037.1
GC content in IR (%)43.443.443.543.343.443.543.5
GC content in SSC (%)33.232.933.132.932.833.133.4
No. of total genes128128128128128128128
Protein-coding genes82 (4)82 (4)82 (4)82 (4)82 (4)82 (4)82 (4)
tRNAs genes37 (7)37 (7)37 (7)37 (7)37 (7)37 (7)37 (7)
rRNAs genes8 (4)8 (4)8 (4)8 (4)8 (4)8 (4)8 (4)
Genes with introns20 (4)20 (4)20 (4)20 (4)20 (4)20 (4)20 (4)
Note: Numbers in brackets indicate genes duplicated in the IR regions.
Table 2. List of genes present in the chloroplast genomes of seven Lonicera species.
Gene GroupGene Name
Ribosomal RNA genesrrn16 (a)rrn23 (a)rrn4.5 (a)rrn5 (a)
Transfer RNA genestrnI-CAU (a)trnI-GAU (a)trnL-UAAtrnL-CAA (a)trnL-UAG
trnR-UCUtrnR-ACG (a)trnA-UGC (a)trnW-CCA
trnV-UACtrnV-GAC (a)trnF-GAAtrnT-UGUtrnT-GGU
trnP-UGGtrnfM-CAUtrnP-GGGtrnG-GCCtrnS-GGA
trnS-UGAtrnS-GCUtrnD-GUCtrnC-GCAtrnN-GUU (a)
trnE-UUCtrnY-GUAtrnQ-UUGtrnK-UUUtrnH-GUG
Small subunit of ribosome rps2rps3rps4rps7 (a)rps8
rps11rps12 (a)rps14rps15rps16
rps18rps19
Large subunit of ribosomerp12rp114rp116rp120rp122
rp123rp132rp133rp136
DNA-dependent RNA polymeraserpoArpoBrpoC1rpoC2
Translational initiation factorinfA
Subunits of photosystem IpsaApsaBpsaCpsaIpsaJ
ycf3ycf4
Subunits of photosystem IIpsbBpsbCpsbDpsbEpsbF
psbHpsbIpsbJpsbLpsbM
psbNpsbT
NADH oxidoreductasendhAndhB (a)ndhC,ndhD,ndhE,
ndhG,ndhIndhJndhKndhF
Subunits of cytochromepetA,petB,petDpetGpetL
petN
Subunits of ATP synthaseatpAatpBatpEatpFatpH
atpI
Large subunit of RubiscorbcL
Maturasematk
Envelope membrane proteincemA
Subunit of acetyl-CoAaccD (b)
C-type cytochrome synthesis geneccsA
Note: (a) two gene copies in seven Lonicera species; (b) pseudogene in the seven Lonicera chloroplast genomes.

