Article

Cold and Heat Stress Diversely Alter Both Cauliflower Respiration and Distinct Mitochondrial Proteins Including OXPHOS Components and Matrix Enzymes

by
Michał Rurek
1,*,
Magdalena Czołpińska
1,
Tomasz Andrzej Pawłowski
2,
Włodzimierz Krzesiński
3 and
Tomasz Spiżewski
3
1
Department of Molecular and Cellular Biology, Institute of Molecular Biology and Biotechnology, Adam Mickiewicz University, Poznań, Umultowska 89, 61-614 Poznań, Poland
2
Institute of Dendrology, Polish Academy of Sciences, Parkowa 5, 62-035 Kórnik, Poland
3
Department of Vegetable Crops, Poznan University of Life Sciences, Dąbrowskiego 159, 60-594 Poznań, Poland
*
Author to whom correspondence should be addressed.
Int. J. Mol. Sci. 2018, 19(3), 877; https://0-doi-org.brum.beds.ac.uk/10.3390/ijms19030877
Submission received: 29 January 2018 / Revised: 7 March 2018 / Accepted: 9 March 2018 / Published: 16 March 2018
(This article belongs to the Special Issue Plant Mitochondria)

Abstract

:
Complex proteomic and physiological approaches for studying cold and heat stress responses in plant mitochondria are still limited. Variations in the mitochondrial proteome of cauliflower (Brassica oleracea var. botrytis) curds after cold and heat and after stress recovery were assayed by two-dimensional polyacrylamide gel electrophoresis (2D PAGE) in relation to mRNA abundance and respiratory parameters. Quantitative analysis of the mitochondrial proteome revealed numerous stress-affected protein spots. In cold, major downregulations in the level of photorespiratory enzymes, porine isoforms, oxidative phosphorylation (OXPHOS) and some low-abundant proteins were observed. In contrast, carbohydrate metabolism enzymes, heat-shock proteins, translation, protein import, and OXPHOS components were involved in heat response and recovery. Several transcriptomic and metabolic regulation mechanisms are also suggested. Cauliflower plants appeared less susceptible to heat; closed stomata in heat stress resulted in moderate photosynthetic, but only minor respiratory impairments, however, photosystem II performance was unaffected. Decreased photorespiration corresponded with proteomic alterations in cold. Our results show that cold and heat stress not only operate in diverse modes (exemplified by cold-specific accumulation of some heat shock proteins), but exert some associations at molecular and physiological levels. This implies a more complex model of action of investigated stresses on plant mitochondria.

Graphical Abstract

1. Introduction

Abiotic stress, including excessive cold or heat, cause failure in the cultivation of many plant species. Such conditions may significantly reduce the yield of most major crops. Plants have various physiological and metabolic response mechanisms, which act within the complex network to avoid harm due to unfavorable environmental stimuli [1,2,3]. Understanding these mechanisms improves our knowledge of stress resistance and will allow the breeding of more appropriate plant varieties.
Numerous aspects of plant responses to cold and heat have been studied. They may differ between plant species [4,5,6]. Both low and high temperatures can decrease chlorophyll biosynthesis, significantly impeding chloroplast development and potentially resulting in photosystem II (PSII) damage [7,8,9,10,11]. Cold-grown plants generate a vast number of reactive oxygen species (ROS) [12]. Armstrong et al. [13] analyzed temperature-dependent sensitivity of leaf respiration in Arabidopsis during cold acclimation and suggested the importance of an alternative oxidation pathway in this process. Moreover, Talts et al. [14] observed that cold-treated plants often display higher rates of respiration. However, heat stress (depending on its intensity and duration) can exert particularly diverse effects on the photosynthetic apparatus [15], including increased cyclic electron flow around PSI [9,16,17,18,19].
Despite reports concerning evident alterations in plant physiological parameters during stress response, data on the correlation of those changes with mitochondrial proteomes are quite limited. Organellar proteomic analyses, including mitochondrial ones, may help to reveal the intrinsic mechanisms of stress response by elucidating the relationship between protein variations and general plant tolerance to environmental factors [20]. Nowadays, characterization of total proteomes or sub-proteomes of important crop and vegetable plants, including cauliflower (Brassica oleracea var. botrytis), appears to be very important [21,22,23,24,25,26].
The plant mitochondrial proteome is a very dynamic entity which can be remodeled in a plethora of environmental conditions and developmental signals [27,28]. It is known that dozens of nuclear genes encoding mitochondrial proteins respond to stress conditions form a functional network [29]. Using an integrative approach, Cui et al. [30] found 503 Arabidopsis mitochondrial proteins participating in a stress protein interaction network. This suggests the general dependence of plant mitochondria on other plant cell compartments during stress response. Furthermore, Taylor et al. [31] estimated that only 22% of total Arabidopsis organellar proteins that are stress-responsive comprise mitochondrial proteins. It seems that the number of mitochondrial proteins involved in stress response is still underestimated, due to limited complexity of some reports and the fact that a significant number of results came from analyses of total plant proteomes and main metabolic pathways only [25,32,33,34]. It should be mentioned that the number of low-abundant mitochondrial proteins responsive to temperature stress is still far from being understood [31]. Recently, these issues were improved by the application of isobaric tags for the absolute quantification (iTRAQ) or label-free peptide counting coupled with liquid chromatography-tandem mass spectrometry (LC-MS/MS) [35,36,37,38]. Using a gel-free approach, Tan et al. [39] found that cold stress led to a concerted decrease in respiratory protein level, accompanied by an increase in abundance of some import/export protein machinery components. However, the overall amount of cold-responsive proteins was smaller, when compared to other suboptimal stimuli.
Although it is known that temperature stress modulates mitochondrial protein activity, level, biogenesis and interactions [40,41,42], crucial steps of achieving appropriate coordination during mitochondrial biogenesis in stress need to be further investigated. For instance, Giegé et al. [43] showed that regulation of mitochondrial biogenesis in Arabidopsis cell cultures during sugar starvation seems to be rather coordinated at the complex assembly. Approaches linking molecular and physiological data dealing with temperature stress impact on mitochondria are still welcomed. Some mitochondrial proteins (e.g., alternative oxidase [AOX]) are ‘classical’ modulators of stress response among plants [44,45,46]. Regulation of diverse AOX genes varies between monocots and dicots. In a number of plant species, the alterations of AOX protein are less pronounced [47,48]. In addition, AOX may not to be increased in abundance by certain stress treatments, for example chilling [49,50]. The latter phenomenon was also confirmed in our previous study [41]; we reported a significant decline in AOX level in cauliflower mitochondria under cold stress and recovery. Overall AOX gene family responses on proteomic and transcriptomic levels were only partially associated and AOX was a suggested target of translational regulation in diverse temperature treatments. In tobacco (Nicotiana tabacum) leaves, abundance of this protein reached a maximum after 48 h of cold stress and slowly decreased afterwards [51]. This highlights the importance of the length of cold stress treatment for the plant to gain acclimation, presumably by the induction of regular changes in the transcriptome first [52].
Assuming limitations of the deposited data, this work was undertaken to gain a comprehensive view about the influence of cold and heat treatment (as well as cold and heat recovery) on the cauliflower mitochondrial proteome in relation to leaf transpiration and respiration rate, stomatal conductance, rate of leaf photosynthesis, photorespiration as well as chlorophyll content and fluorescence. The current study extends our previous complexomic and functional data [41]. To determine mitochondrial proteome response in relation to plant respiration, we aimed to (1) investigate the dynamic nature of the mitochondrial proteome under cold and heat treatment and stress recovery; (2) identify the most variable proteins in cauliflower inflorescence mitochondrial extracts; and (3) link proteomic and discussed metabolic/functional aspects with alterations of analyzed physiological parameters. On the whole, the broader set of identified proteins responding to cold/heat stress and after stress recovery, which correlate with alterations in plant respiration and some general metabolic demands, was able to be characterized in cauliflower mitochondria.

2. Results

2.1. Proteome Maps of Cauliflower Mitochondria under Stress Conditions

Mitochondrial proteins isolated from curds of control plants and from plants submitted to cold or heat treatment were resolved by two-dimensional gel electrophoresis (2D PAGE). We also examined the mitochondrial proteomes from curds of stress-recovered cauliflower plants with the idea to study the impact of stress on the mitochondrial proteome under stress recovery (Figure S1). 2D gels for investigated variants, including control, were run in triplicate. Individual gel replicates are shown in Figure S2. In order to create master gel, we chose the image of control variant as the reference and then we added the specific spots detected on the gels of remaining variants. The number of spots on silver-stained 2D gels varied from 347 to 511 between all analyzed variants, including the control one. Thus, 694 different spots were taken into account for the building of a synthetic silver-stained master gel (Figure 1). Contrary to silver-stained gels, the number of protein spots on colloidal Coomassie Brilliant Blue (CBB)-stained 2D gels was lower. Finally, for the analysis of spot variation, only 413 spots representing highly abundant proteins from silver-stained gels were taken into account.

2.2. Identification of Variable Protein Spots

Twenty two spots (3.2% on the silver-stained master gel) were significantly variable (verified by the analysis of variance [ANOVA] and Tukey’s honest significant difference [HSD] test) as detected using Image Master 7 Platinum software. Spot positions depicted in Figure 1, Figure S1 and S2 were calculated from three biological replicates. All spots were successfully identified by LC-MS/MS. The obtained data were used for searching Mascot against the National Centre for Biotechnology Information (NCBI) database (version 20100203). Cauliflower stress-responsive mitochondrial proteins were identified by using the Viridiplantae section of the database (with the aid of Arabidopsis and B. oleracea nuclear and mitochondrial [53] genomes). To avoid possible misidentifications resulting from large datasets, as pointed out by Schmidt et al. [24], we were able to set the false positive rate threshold to 5%. Identifications of protein spots are presented in Table 1 and properties of individual peptides for each protein spot are given in Table S1. As illustrated, all 22 spots represented 16 non-redundant stress-responsive proteins. We did not exclude spots with multiple protein identification from the analyses, however, we focused on protein identifications (for all stress-responsive spots) confirmed by sufficient parameter quality (highest MOWSE score, emPAI, peptide number and coverage). The disproportion between the quality of mentioned parameters for the initial and remaining records in the MASCOT search list allowed us to do so. The percentage of sequence coverage ranged from 14% to 42% and the total number of identified peptides varied from 12 to 301. Among all spots, mitochondrial proteins in all but one spot (spot No. 13 corresponding to Brassica napus protein sequence) were identified based on their high similarity to Arabidopsis sequences. In addition, 17 Arabidopsis proteins also showed a very high or 100% sequence identity with B. oleracea var. oleracea records (Table S2). The experimental molecular mass corresponded roughly to the theoretical value for the majority of spots. Some proteins including phosphoglycerate kinase isoform 1 (PGK1; spots No. 4, 10; Table 1), mitochondrial elongation factor Tu (mtEF-Tu; spots No. 16, 17), isocitrate dehydrogenase (IDH; spot No. 18) and citrate synthase (CS; spots No. 19, 20) showed a few kDa decrease in molecular mass between theoretical and gel values. We are rather convinced that this did not result from the excessive proteolysis in cauliflower mitochondria.
Seven spots (approximately 1% of all) displayed significant variations in their abundance after cold stress and cold recovery. According to Tukey’s HSD test, four proteins, including three members of the heat shock protein (HSP) family (spots No. 1, 6, 7) and 3-phosphoglycerate dehydrogenase (PGDH)–like protein (spot No. 3) were increased in abundance during cold treatment. After cold recovery another three proteins were significantly increased in abundance, namely pyruvate dehydrogenase subunit β (PDHβ; spot No. 2), PGK1 (spot No. 4) as well as NAD+-dependent malate dehydrogenase (MDH; spot No. 5; Table 1).
After heat stress and heat recovery, 15 responsive spots (representing 11 non-redundant proteins) were identified (approximately 2.2% of all spots; Table 1). Four proteins PGDH-like protein, Δ-1-pyrroline-5-carboxylate dehydrogenase (P5CDH), mtEF-Tu as well as CS were represented by double spots (No. 8/9, 14/15, 16/17 and 19/20, respectively) displaying slightly different molecular mass and pI values. According to Tukey’s HSD test, it appeared that three proteins significantly raised their level during heat treatment: PGDH–like protein (spots No. 8), mtEF-Tu (spots No. 17), as well as mitochondrial ATP synthase subunit d (ATPQ; spot No. 22), but two proteins: P5CDH (spot No. 15) and CS (spots No. 19/20) were decreased in abundance.
Some variations were also observed after heat recovery. Here, we detected a more intense accumulation of a broad set of proteins, namely PGDH-like protein (spots No. 8, 9), PGK1 (spot No. 10, succinyl-CoA ligase subunit β (SCLβ; spot No. 11), chaperonin 10 (CPN10; spot No. 21), and ATPQ (spot No. 22). Notably, CPN10 extensively increased in abundance. In those conditions, we also noticed a significant decline of the ATP synthase subunit α (ATP1; spot No. 13), mitochondrial processing peptidase subunit β (MPPβ; spot No. 12), P5CDH (spots No. 14, 15), mtEF-Tu (spots No. 16/17), IDH (spot No. 18) and CS level (spots No. 19/20; Table 1). In addition, with the help of polyclonal antibodies, we verified the abundance of ATP1 (the only protein from our data encoded by the mitochondrial genome) after heat recovery on 2D immunoblots. As illustrated in Figure 2 (all 2D immunoblot replicates are shown in Figure S2), the respective variations of this protein assayed by immunoblotting roughly followed the protein variations on the silver stained 2D gels. Notably, four proteins that were identified as double spots showed very similar response after heat and heat recovery, which is in favour for the correctness of their assignments (Table 1).
Full peptide data from the error-tolerant MASCOT search (Table S3a) allow to get a general view on the extent posttranslational protein modifications (PTMs) within proteins (listed in Table 1) from double spots (No. 8/9, 14/15, 16/17 and 19/20). As was shown, different proteins were identified in each spot pair. Protein multi-spotting frequently accompanies 2D gel data, however, we only investigated stress-responsive double spots (Table 1). We wanted to check whether the presence of unknown PTMs could be associated with protein multi-spotting (Table S3b). We estimated a number of modified residues from spectra of tryptic peptides as well as expected molecular mass difference from the extent of given PTM between compared spots. We focused on phosphorylations, deamidations, methylations, formylations and ethylations. Because no phosphoprotein enrichment was performed, we were unable to further characterize the phosphoproteome in cauliflower mitochondria, despite phosphorylated residues accounting mostly for total theoretical molecular mass difference between double spots. However, only limited correlation was found between this value and the experimental molecular mass difference for double spots. Therefore, multi-spotting of some analysed proteins came rather from non-investigated modifications and/or from the expression of gene family members.

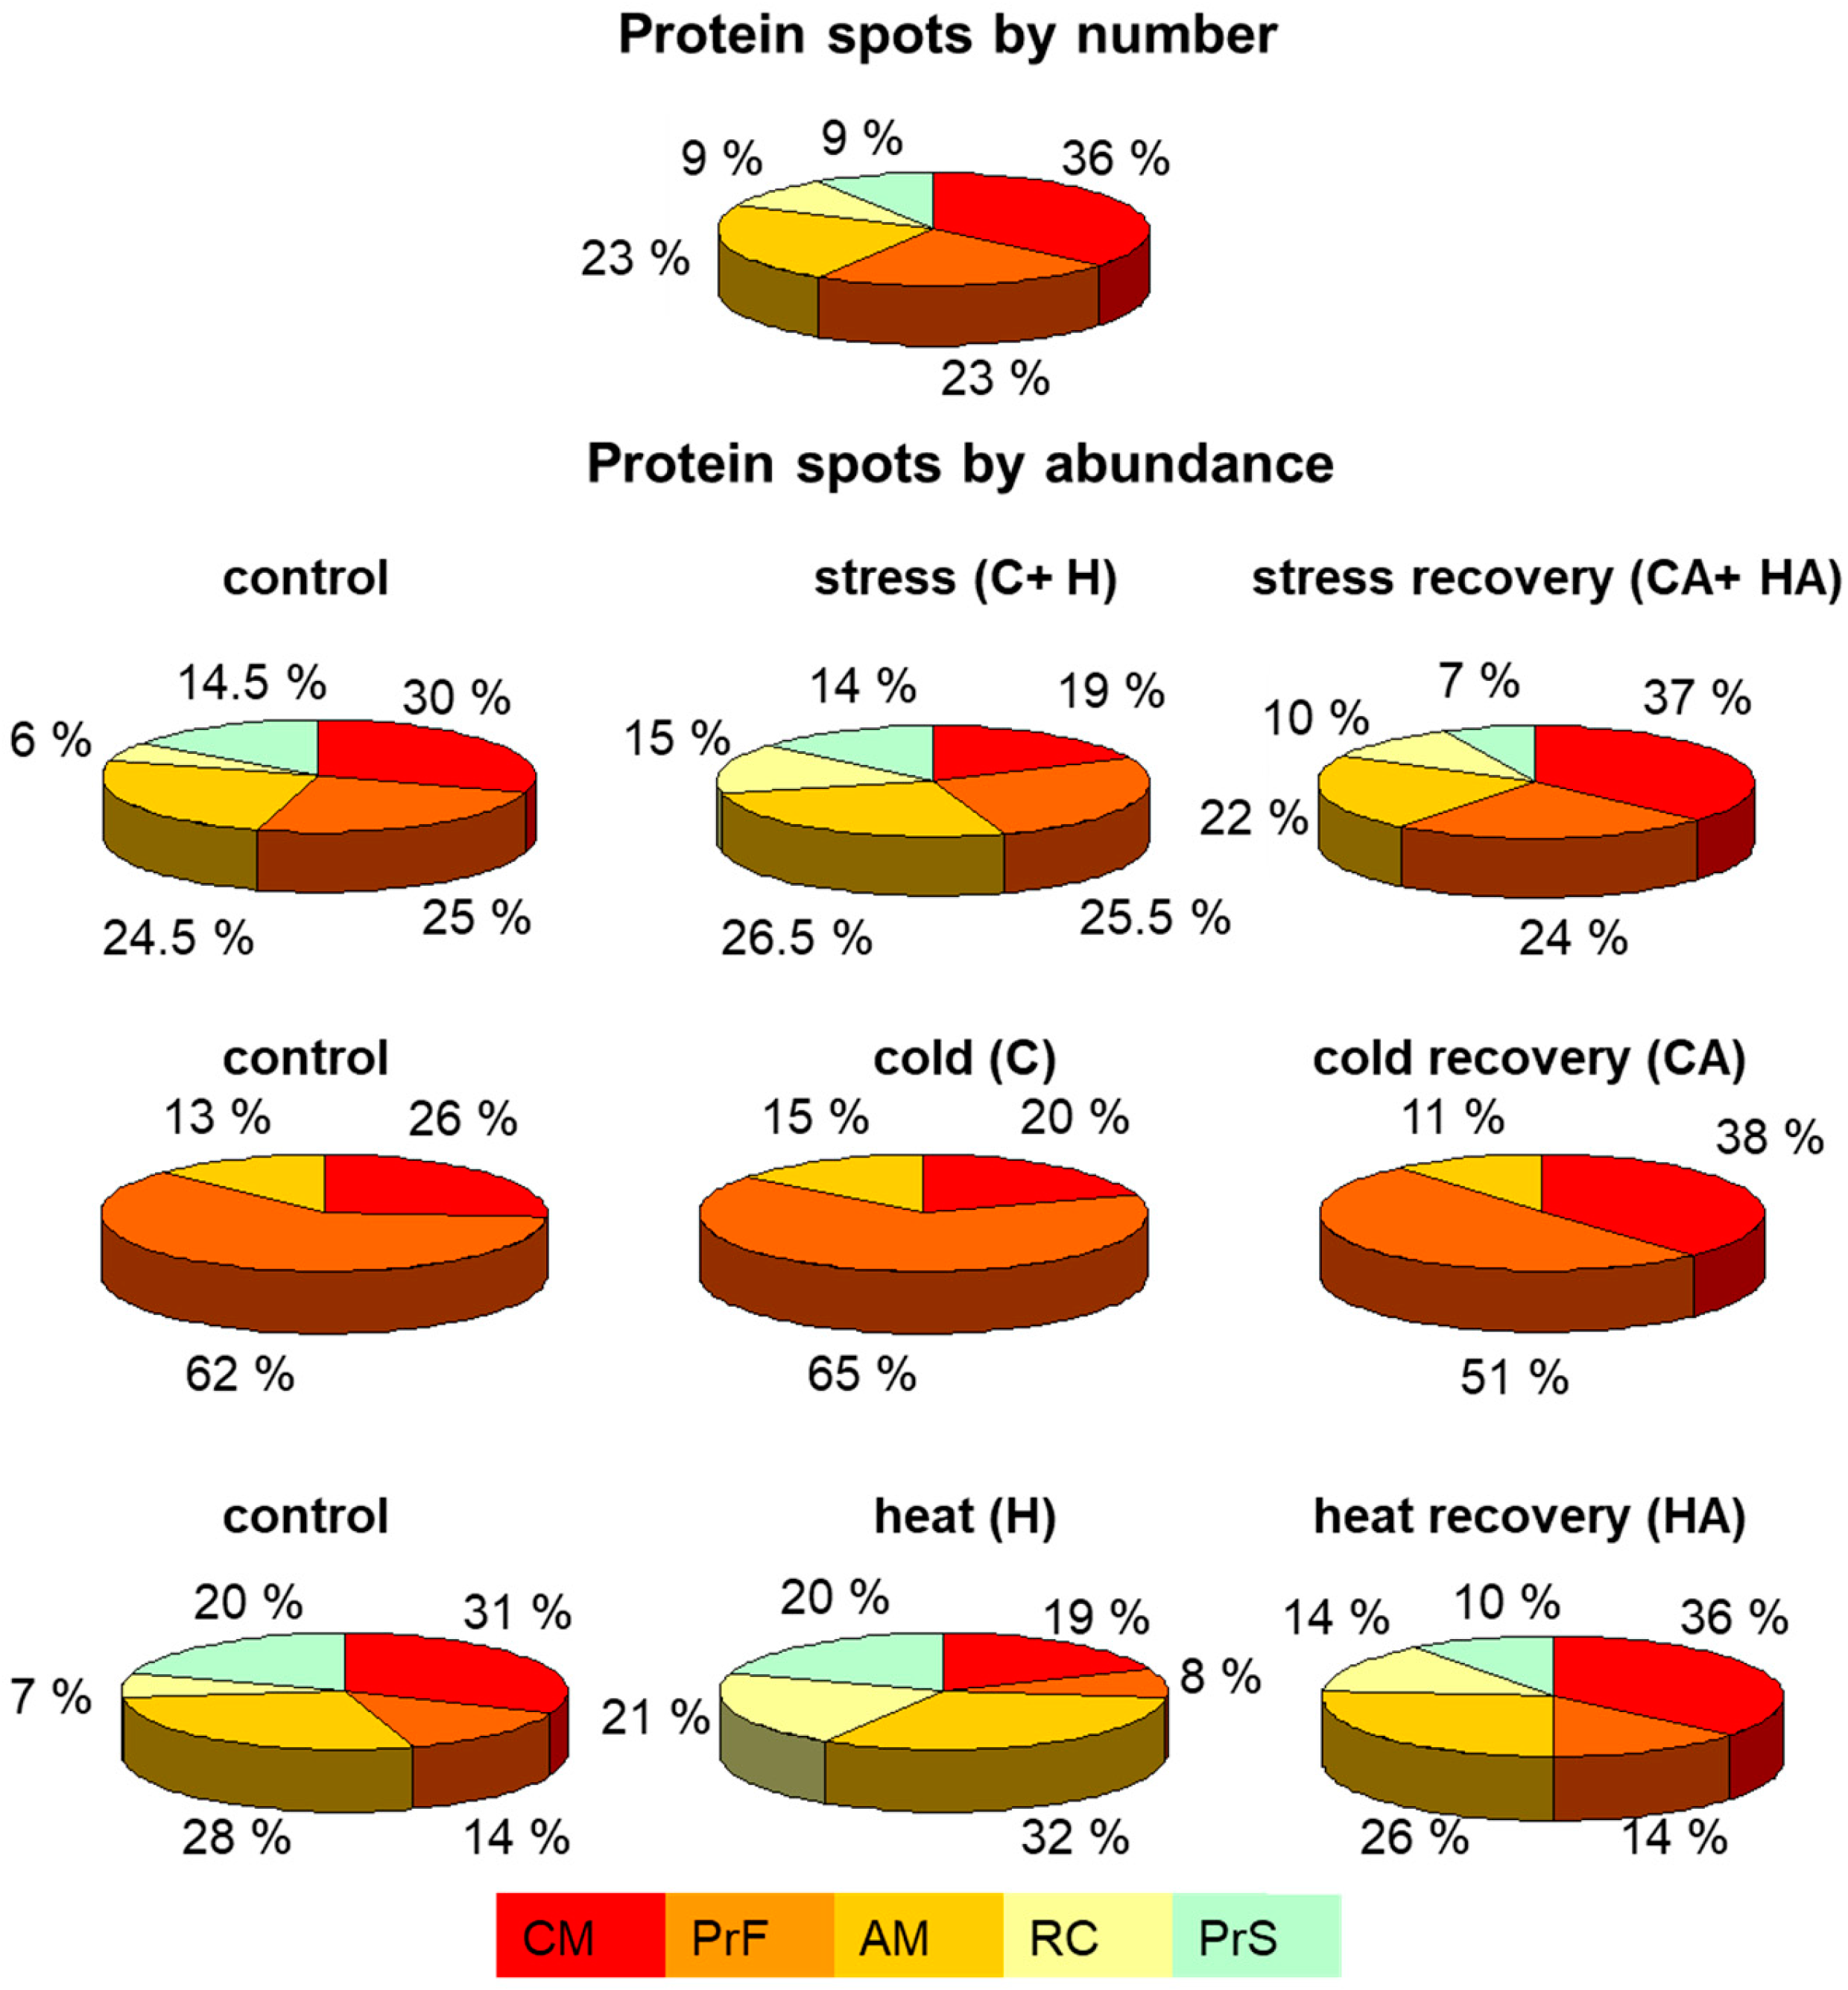
2.3. Functional Categorization of Identified Proteins

Based on Arabidopsis protein orthologues, we used a functional categorization (FunCat) scheme at the Munich Information Center for Protein Sequences database (Available online: http://ibis.helmholtz-muenchen.de/funcatDB/) for clustering of stress-responsive proteins resolved on 2D gels into five functional categories (Figure 3 and Table 1).
Counting the number of spots within each category (Figure 3, panel: protein spots by number), it appeared that the majority of cauliflower mitochondrial protein spots responsive to cold and heat stress belonged to the class participating in carbohydrate metabolism, including tricarboxylic acid (TCA) cycle components (about 36% spots) as well as amino acid metabolism and protein fate (each of approximately 23%). The next ones were represented by respiratory chain (RC) components and protein synthesis apparatus (each of approximately 9%). Interestingly, eight spots (36%) representing six proteins were already annotated as stress responsive in the MIPS database.
Spots linked to RC components increased in abundance after heat stress, as well as after heat recovery, however, the ones linked to amino acid metabolism were upregulated after cold and heat stress. In contrast, spots linked with carbohydrate metabolism decreased in abundance after cold and heat, but markedly upregulated in cold- and heat-recovered plants (Figure 3, panel: protein spots by abundance), Interestingly, the total abundance of spots related to the protein fate showed some increase after cold, but neither after heat stress (where it was decreased), nor after recovery phase. It seems that the majority of identified protein spots that belonged to the protein fate class appeared responsive in cold stress and cold recovery, which indicates its overall importance in low temperature response in cauliflower mitochondria. Many protein functional classes, however, were regulated by heat and heat recovery (Figure 3, panel: protein spots by abundance, at the bottom).

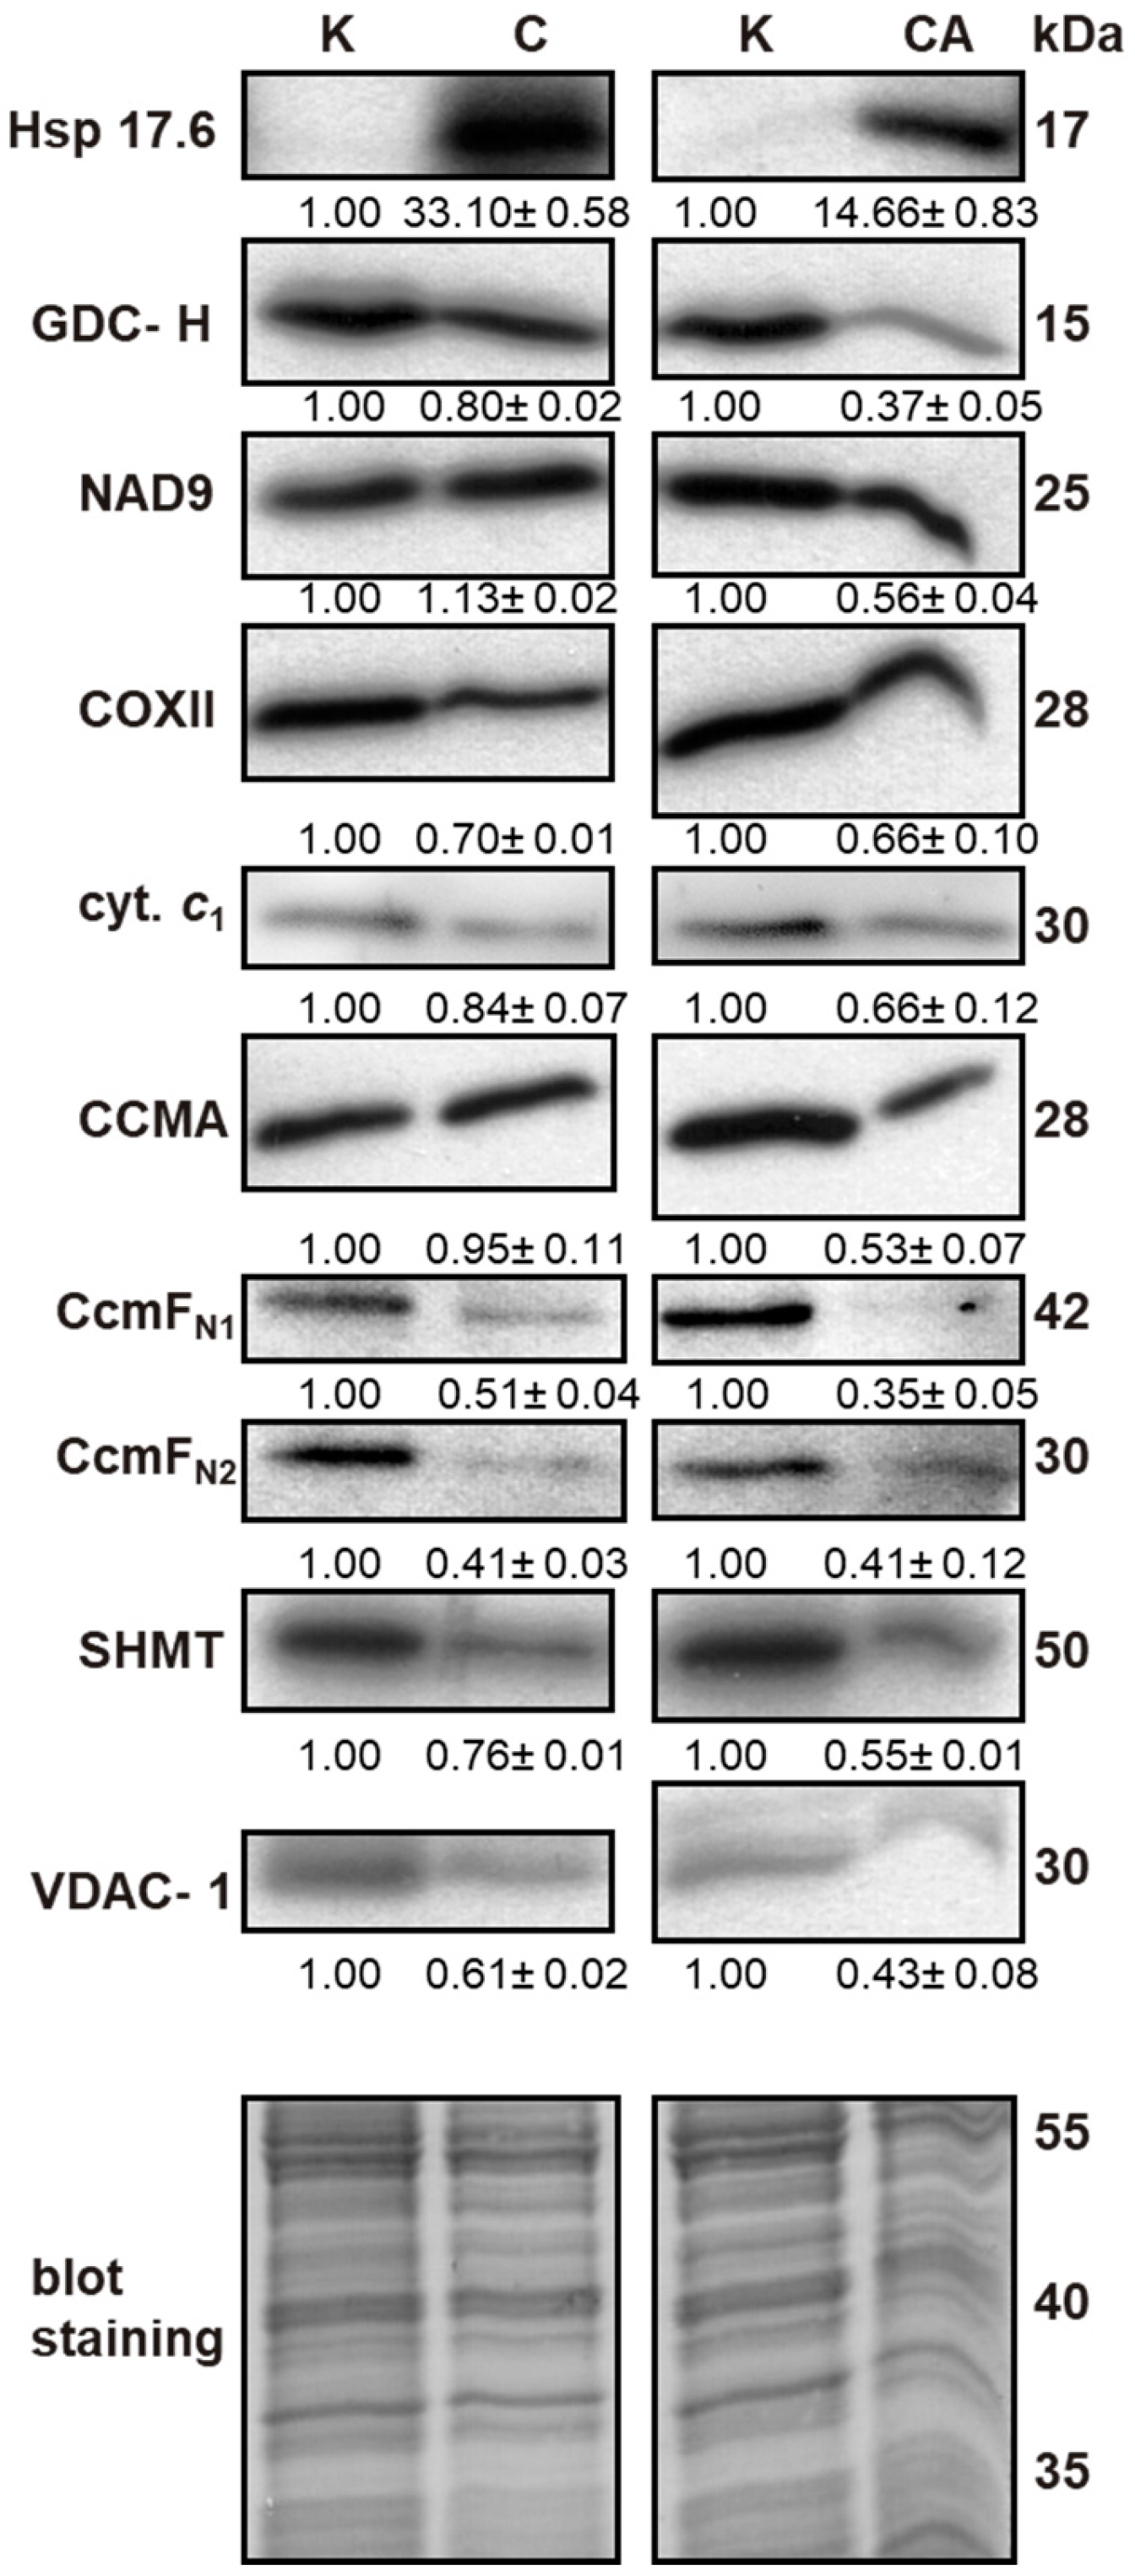
2.4. Effect of Cold Stress on Abundance of Additional Mitochondrial Proteins

Due to the fact that the number of cold-regulated proteins was lower than those regulated by heat stress in cauliflower mitochondria, we decided to verify our analyses by additional immunoblotting assays (Figure 4). All immunoblot replicates are shown in Figure S2. The level of selected proteins was monitored in mitochondria isolated from curds of cauliflower plants grown either in control conditions or submitted to cold, or from cold-recovered plants. To verify protein loading, blots were Coomassie-stained.
We assayed the level of glycine decarboxylase subunit-H (GDC-H), serine hydroxymethyltransferase 1 (SHMT), mitochondrial porine isoform 1 (VDAC-1), some OXPHOS proteins, including complex I (CI) subunit 9 (NAD9), cytochrome c1, complex IV (CIV) subunit 2 (COXII) as well as proteins engaged in cytochrome c (cyt. c) maturation in plant mitochondria, particularly ABC transporter I family member 1 (CCMA) and CcmF N-terminal-like mitochondrial proteins 1 and 2 (CcmFN1 and CcmFN2, respectively). With the application of specific antibodies, we also investigated the level of cytoplasmic small Hsp17.6 of class I (sHsp17.6C-CI), that interacts with mitochondria under temperature stress [54]. It appeared, that the level of Hsp17.6C-CI associated with mitochondrial membranes increased extensively after cold stress and remained quite high after cold recovery (Figure 4). The abundance of GDC-H showed almost a three-fold change decrease after cold recovery, but only slightly after cold stress. A similar decrease in the level of CcmFN1 and CcmFN2 proteins was observed in cold and cold recovery conditions (up to two- and three-fold change, respectively). In contrast, the accumulation of the CCMA transporter protein was not affected by cold; however, it was decreased (by almost 50%) after cold recovery. In the tested conditions, the relative abundance of SHMT and VDAC-1 was also decreased. Regarding RC proteins, we detected a small upregulation of NAD9 subunit of CI after cold stress and a subsequent major decline under cold recovery as well as a small downregulation of COXII and cyt. c1 in stress (Figure 4).

2.5. Association between Protein and Transcript Level

Besides analyses of cauliflower mitochondrial proteome, we studied how proteomic response is accompanied by transcript alterations. For the rapid assessment of both patterns, we employed RT-semiqPCR and the level of five mitochondrial and 11 nuclear messengers was assayed (Figure S3) and compared with the abundance of some OXPHOS proteins encoded by mitochondrial genome and proteins coded by nuclear genome investigated in this study (Section 2.2 and Section 2.4).
None of the mitochondrial mRNAs showed alterations in their abundance associated with the protein level. nad9 and coxII messengers (coding for CI subunit 9 and CIV subunit 2) were regulated inversely compared with the respective proteomic data in cold and cold recovery. atp1 transcripts (coding for ATP synthase subunit 1) responded only in cold recovery. Furthermore, expression profiles of genes coding for subunits of the same protein complexes (e.g., nad genes for CI and atp/ATP genes for ATP synthase) were largely unassociated. This is true both for selected mitochondrial as well as nuclear genes. The level of ATP2 nuclear transcripts was slightly decreased in cold and heat, and decreased furthermore in stress recovery.
Parallel RNA/protein accumulation patterns were noted in case of the only three nuclear genes coding for HSP70 isoform 1 (HSP70-1) in cold and cold recovery, mitochondrial processing peptidase subunit (MPPβ) as well as for Δ-1-pyrroline-5-carboxylate dehydrogenase (P5CDH) in heat recovery. However, those variations were quite minor. In case of the remaining regulations, we can see that the decreased mRNA level (particularly for some transcripts, e.g., Hsp17.6 in cold and cold recovery and SCLβ together with CPN10 in heat recovery) did not correlate with the increased protein abundance in stress and recovery. Our results indicate also for the down-regulation of transcripts coding for two enzymes of Pro catabolism: proline dehydrogenase (PRODH) and Δ-1-pyrroline-5-carboxylate dehydrogenase (PRODH and P5CDH, respectively) in cold and heat recovery (Figure S3).

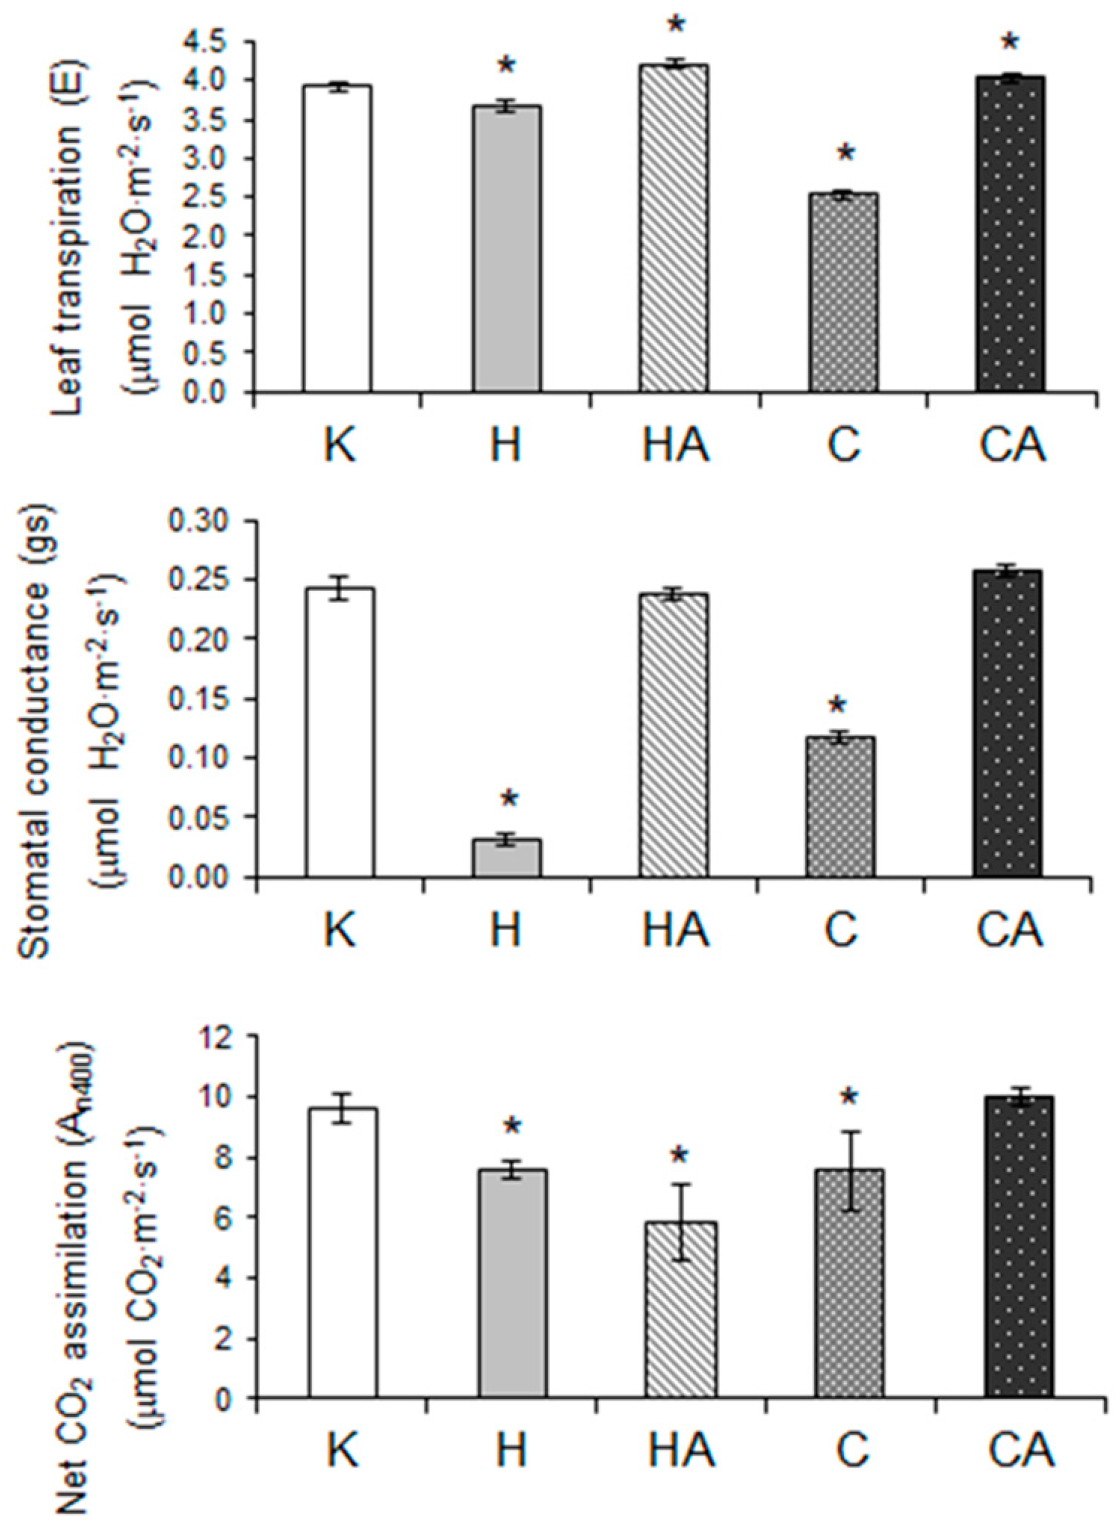
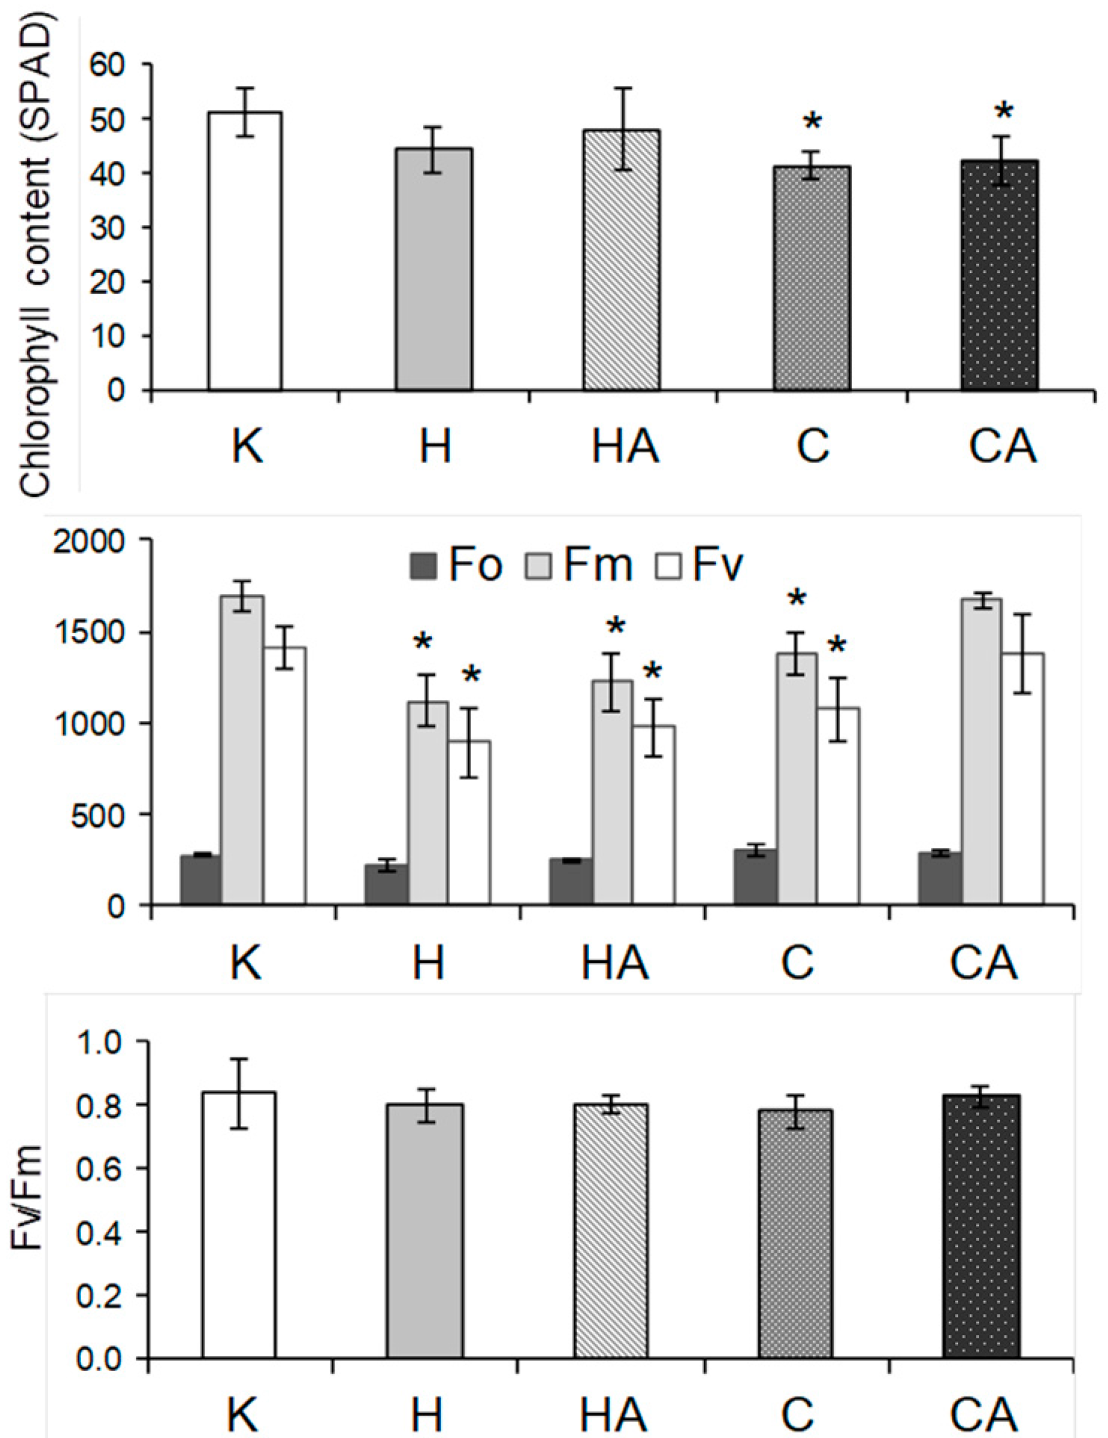
2.6. Cauliflower Physiological Responses to Cold and Heat Stress, and after Stress Recovery

We also studied how leaf respiration was affected after cessation of cold and heat treatment as well as after post-stress plant recovery. By using an appropriate assay [55], we determined mitochondrial respiration in the light (non-photorespiratory intracellular decarboxylation; Rd) in gas phase as the rate of CO2 release. In addition, we also measured the rate of respiration of darkened leaves (Rn). It appeared, that the respiratory production of CO2 in illuminated leaves was lowered in cold-stressed plants; however, under cold recovery, a significant burst of Rd was observed. Rn rate was also lowered after cold treatment and remained so after cold recovery. In contrast, both Rd and Rn rates significantly increased in heat stress and decreased almost to control stage values after heat recovery (Figure 5).
To gain a more complete view of cauliflower plant physiological status, we also assayed the impact of stress conditions and stress recovery on leaf transpiration (E) rate, stomatal conductance (gs) as well as essential photosynthetic parameters. We detected a decrease in E rate as well as lower gs value under cold and heat stress, but not after cold recovery. However, after heat recovery, leaf transpiration was slightly elevated (Figure 6).
To investigate whether all those responses were also accompanied by impaired photosynthetic performance, we also measured the rate of net CO2 assimilation at three photosynthetic photon flux densities (PPFDs)—200, 400 and 600 µmol·m−2·s−1. Here, the net photosynthesis intensity was presented only for 400 µmol·m−2·s−1 (An400), which appeared the most optimal PPFD; the respective net CO2 assimilation rate values at the remaining photon flux densities (An200, An600) followed similar to An400 trends in stress response. The rate of An400 was markedly decreased after cold, heat and also after heat recovery and, generally, it accompanied similar variations in stomatal closure and leaf transpiration (Figure 6).
Notably, all those parameters did not correlate with alterations in variable (Fv) to maximal (Fm) chlorophyll fluorescence ratio, which appeared relatively constant for all investigated stress conditions. However, Fv and Fm significantly decreased both after heat and cold stress as well as after heat recovery. The relative chlorophyll content (assayed by chlorophyll meter) was affected only after cold stress and cold recovery (Figure 7). Due to the fact that in cauliflower curds, which are not involved in CO2 assimilation, the decrease in abundance of two main photorespiratory enzymes (GDC and SHMT) was noticed (Figure 4), we also aimed to investigate photorespiration (PhR) in photosynthetically active organs in fully expanded leaves. Using Laisk’s [55] method, we determined the ratio of photosynthetic rate under three investigated PPFDs between ambient and low CO2 concentration. It appeared that PhR at all PPFDs markedly increased in cold-stressed plants; however, after cold recovery it was severely impaired. In contrast, heat stress and heat recovery resulted only in the slight decline of PhR200 and PhR400 values, whereas PhR600 was more affected at heat stress, but it was recovered after heat recovery (Figure 5).
Overall, we showed that cauliflower plants, besides mitochondrial proteome plasticity at the physiological level, display only partial but diverse alterations in various photosynthetic and respiratory parameters.

3. Discussion

3.1. Identification of Cauliflower Stress-Responsive Proteins by MS Analysis

In order to obtain a more general view of the impact of cold and heat stress on the functioning of cauliflower mitochondria, we began our study by their proteome analysis. Using 2D PAGE, 22 stress-responsive spots representing 19 non-redundant proteins were selected. Although some proteins belong to the general components of the abiotic stress response [40], in this study the list of cauliflower mitochondrial proteins responsive to temperature stress was broadened by stress recovery data showing new candidates (Table 1). Our previous studies suggested that stress recovery is associated with the possible acquiring of stress tolerance by cauliflower displaying some alterations within the mitochondrial OXPHOS and dehydrin-like proteins [41,56]. We would like to complement the study of mitochondrial complexome [57] by extended physiological and proteomic analyses and to follow the importance of stress recovery conditions in such assays.
Cauliflower is closely genetically related with other Brassica species and the identification of mitochondrial proteins was conducted based on protein sequence similarity between Brassicaceae members. Schmidt et al. [24] and Zhu et al. [36] have identified some proteins (e.g., ATPQ, CPN10, MDH, PDHβ and HSP81-1) that appeared to be stress-responsive in our study. The presence of protein spots containing glycolytic enzymes (for instance PGK1) (Table 1) was not curious, because this enzyme was reported to be associated with outer mitochondrial membrane [58,59]. Such a finding was concluded mainly from the measurements of its enzymatic activity in mitochondrial extracts, however, the cytosolic member of this enzyme family (At1g79550), distinct to the Arabidopsis homolog (At3g12780) of cauliflower protein, was also identified in a large protein complex associated with mitochondrial membranes [58,60]. Interestingly, Arabidopsis PGK1 ortholog from plastid proteome showed cold response [61], whereas cauliflower mitochondrial protein was affected after heat recovery.
Four cauliflower mitochondrial proteins (3-PGDH, P5CDH, mtEF-Tu and CS) were represented as double spots. The presence of multiple spots on 2D gels was reported in numerous proteomic analyses, also including proteins analysed in this study (Figure S1) [21,22,32,50,62,63,64,65,66,67]. Consequently, we determined the extent to which posttranslational modifications might be responsible for the presence of multiple spots for the investigated proteins. Due to the lack of quantitative analysis including laborious enrichment of protein extracts in modified proteins and technical limitations of our protein separation methods, we were not able to accurately analyse majority of PTMs. Instead, we focused on a few selected modifications only (Tables S3a and S3b). However, various algorithms used for the PTM prediction among Arabidopsis emphasize that our data is largely novel and also significantly broadens deposited records. Among investigated modifications, many phosphorylated and methylated peptides were detected. Phosphorylation, together with oxidation, belong to the most important PTMs, regulating the activity of many stress-responsive proteins; in plant mitochondria, phosphorylation has particularly been studied in detail [34,68,69,70,71]. Energy and transport proteins, HSPs and even RC components were identified as potent phosphorylation targets [71]. Among proteins that were present in multiple spots in our study, it was shown that rice (Oryza sativa) CS can be phosphorylated [72] and mtEF-Tu was subjected to oxidation [73]. Overall, multi-spotting of cauliflower mitochondrial protein may depend not only on the presence of different PTMs, but largely on multigenic families coding novel protein isoforms, which resulted from the complex evolution of Brassica nuclear genomes as they underwent numerous chromosomal doublings, hybridizations and rearrangements [74]. More sensitive and quantitative proteomic assays should be implemented in the future for the better characterization of PTMs in cauliflower mitochondrial proteome.
We also noticed minor differences in molecular mass between nominal and observed values of some cauliflower mitochondrial proteins (Table 1). However, such discrepancies may be even more evident due to protein degradation [75]. Taylor et al. [50] and Imin et al. [76] have shown that abiotic stress could induce accumulation of protein degradation products. We routinely used protease inhibitors for the preparation of mitochondria, therefore, we think that extensive proteolysis could not account for major molecular mass discrepancies. Overall, despite the general similarity of 2D maps, it seems that numerous mitochondrial proteins may slightly differ in some physicochemical properties between Arabidopsis and cauliflower. We expected this from our previous analyses [23].

3.2. Variations in Pattern of Cauliflower Mitochondrial Proteome in Stress and Stress Recovery, and Their Metabolic Relevance

From the identified 16 stress-responsive proteins, at least an ca. two-fold change in variations in protein abundance were shown for most of them (Table 1). Under heat stress and heat recovery more proteins which varied in abundance were identified, compared to cold/cold recovery. From our data, only four stress-responsive proteins (ATP1, NAD9, COXII, CcmFNI, CcmFNII) are encoded in the plant mitochondrial genome (Table 1, Figure 4). Such a discrepancy may be due to the fact that the proteomic data allow the estimation of only a limited amount of mitochondrial proteins participating in various stress responses [31], therefore, literature inventories of those proteins are still far from complete. Rurek [40] lists almost 82 cold- and 52 heat-responsive plant mitochondrial proteins and only five proteins encoded by mitochondrial genome within them. In the up-dated Heidarvand et al. [42] review, only four proteins encoded in mitochondria contrast with the 44 nuclear-encoded cold responsive proteins. However, the modulation of plant mitochondrial biogenesis may rather depend on the regulation of the level of nuclear-encoded proteins governing assembly of macromolecular complexes, as has been speculated for sucrose-starved Arabidopsis cell cultures [43]. Overall, temperature stress response seems to involve no more than ca. 5% mitochondrial proteins encoded by mtDNA.
Some proteins detected in our study were previously shown to vary under diverse abiotic stress conditions. PDH participates in regulation of carbon flux from glycolysis to TCA cycle. In the published data, upregulations of PDH subunits prevail; in pea (Pisum sativum) mitochondria, PDHβ proteolytic products accumulate [50,77,78]. In rice leaves, however, contrasting PDHα responses (similarly to HSP90, see below) were noted under diverse cold conditions [37]. It is known that also other components of PDH complex including dehydrolipoamide dehydrogenase, may be upregulated during heat stress [79]. In contrast, we showed extensive accumulation of PDHβ after cold recovery, but not after heat treatment. In rice, PDHβ was downregulated during hypoxia [80], however, subunit-α of this enzyme increased during heat treatment and decreased in abundance after stress cessation [81]. Our results suggest that despite the overall number of major cold-responsive mitochondrial proteins being lower than those regulated by heat, it seems that carbon transfer from glycolysis to TCA cycle is increased in cauliflower cold response. Nonetheless, stress can regulate plant energetic and metabolic demands, including ATP/ADP intracellular and intramitochondrial ratio and the need for carbon skeletons [82].
Mitochondrial NAD+-dependent MDH, which was increased in abundance after cold recovery in cauliflower mitochondria, in Arabidopsis was accumulated in response to different environmental stimuli including cold de-acclimation (but not cold acclimation) [32,33,83,84]. Arabidopsis MDH1 was suggested to belong to translational regulation targets [85]. The level of this enzyme (together with CS) was diversely modulated by various chilling conditions; generally, MDH abundance increased in cold-sensitive plant species [26,37,50,78,86,87]. Dumont et al. [88] investigating alterations in MDH abundance in diverse pea genotypes submitted to the combined cold and frost action and obtained contrasting results depending on the stress treatment and duration, similarly to the Yin et al. [89] and Cheng et al. [90] studies on MDH1 level in soybean (Glycine max) embryonic axes. Interestingly, CS responses depend on the severity of the temperature treatment (e.g., in the severe chilling the abundance of this enzyme declined), whereas under moderate treatment it increased [91]. During 2-day-long heat stress, MDH was also diversely downregulated in two Agrostis species depending on their thermotolerance [92]. Such a decrease in abundance was also reported for soybean MDH [89]. The significant up-regulation of cauliflower MDH only to cold recovery suggests that it may be the cold recovery marker [93]. However, heat recovery appeared detrimental for the level of this enzyme in cauliflower mitochondria [41]; cauliflower IDH and CS markedly declined after a 2-day-long heat recovery. Similar changes were reported for CS in heat adapted Populus euphratica [79]. In general, heat (which may lead to intramitochondrial oxidative damage) results in TCA enzymes, mitochondrial NADH pool and ATP synthesis impairments [94] and cold stress results in general stimulation of respiratory metabolism.
It appeared that cold stress causes an increase in the level of cauliflower HSPs; interestingly, in our study HSP70 and HSP90 increased more than in pea (Pea sativum) and rice leaves and peach (Prunus persica) barks [38,50,95]. A similar trend was observed in rice during salinity [96] and heat action in Arabidopsis [97]. However, mitochondrial HSP70 declined in abundance in stored or detached peach fruits submitted to prolonged cold [77,98]. Van Aken et al. [29] reported that Arabidopsis mitochondrial heat shock proteins responded only slightly to some forms of abiotic stress, for example HSP70 in the case of Cd treatment [83]. Another protein, HSP81-2, appeared to be cold-responsive in cauliflower mitochondria, contrary to the Arabidopsis ortholog, which was regulated by heat [31,97]. Notably, the regulation of HSP90 level in rice leaves depended on cold duration [38]. CPN10 remained unaffected after cold stress in pea [50], but in cauliflower mitochondria this protein accumulated very extensively under heat recovery. Also, mitochondrial sHsp22 was induced preferentially by heat (but not by cold) in soybean seedlings [25]. Together with FunCat data, all those findings suggest that the accumulation of some HSPs in cauliflower mitochondria may be specific for the preferential temperature stress conditions. Some HSPs can also diversely participate in various stress conditions, leading to distinct stress responses. It should also be noted, that the expression of two proteins (HSP70 and MDH1) regulated by low-temperature treatment, as well as additional proteins (mtEF-Tu, CS) responded to heat/heat recovery in our study and is known to be modulated by the specific glycine-rich protein (displaying RNA chaperone activity) under cold adaptation in Arabidopsis plants [99].
Cauliflower mtEF-Tu increased in abundance mainly after heat stress and did not last after heat recovery; overall, this may imply that the mitochondrial translation apparatus is impaired after heat cessation and rapid shift to control growth conditions of cauliflower, which was also observed for instance in chilled soybean embryo axes [89]. mtEF-Tu together with β-subunit of succinyl-CoA ligase increased in abundance in drought and partially in flood and MPP and ATP1 by salinity in Arabidopsis [32,84]. Curiously, β-subunit of succinyl-CoA ligase showed heat duration-dependent responses in soybean roots and rice leaves [25,37]. The major downregulation of succinyl-CoA ligase β-subunit in cauliflower mitochondria followed alterations of other TCA cycle components (IDH, CS) after heat stress [37,79], but not after heat recovery. Therefore, we can speculate that succinyl-CoA ligase may be preferentially accumulated in cauliflower during heat recovery in order to adjust the mitochondrial metabolism to control conditions.
ATP1 belongs to the proteins with level alterations dependent on the given species as well as stress intensity and duration [42]. In our study, ATP1 was declined in abundance after heat recovery. Similar trends were noted for pea, Arabidopsis, and Zea mays in a course of chilling, prolonged heat, CuCl or H2O2 treatment [39,50,100,101]. In contrast, cauliflower ATP1 abundance slightly increased in heat, similarly to the unassembled subunit b of ATP synthase [41]. We also found that heat caused a vast increase in abundance of ATP synthase d-subunit, contrary to its major downregulation reported by Gammulla et al. [37] and Tan et al. [39] for cold-stressed Arabidopsis cell cultures and heat-treated rice leaves, respectively. During oat (Avena sativa) seed storage, ATP1 level consistently declined as temperature increased from 35 to 50 °C, whereas subunit d of ATP synthase initially increased and then decreased in abundance under the same treatment; notably, subunits d and α were differentially accumulated at 10% and 16% moisture content, respectively [102]. Overall, those findings suggest that demand for ATP synthesis during heat treatment increases and the excess of de novo synthesized diverse ATP synthase subunits (e.g., mitochondrially encoded ATP1 or nuclear-encoded ATP7 proteins) is likely to be assembled into novel ATP synthase holocomplexes, labile in heat recovery [41].
Regarding the decrease in the level of MPPβ after heat recovery, we think that this may reflect the impairment of the import machinery, which may not be fully restored after stress recovery: according to our previous study [41], another subunit—MPPα appeared also to be down-regulated in heat recovery. Gammulla et al. [37] and Neilson et al. [38] noticed contrasting changes in the level of MPP subunits in rice leaves under low temperature and overall downregulations under heat. The level of MPP subunits underwent major changes in flood, indicating mitochondrial damage [84]. The influence of abiotic stresses on the efficiency of protein import into plant mitochondria was investigated, inter alia, by Taylor et al. [103] and Giegé et al. [43]. Taylor et al. [103] observed import inhibition of all tested pre-proteins into pea mitochondria during thermal stress. In turn, Giegé et al. [43] reported that the capacity for in vitro mitochondrial protein import is not affected after sucrose starvation in Arabidopsis cell cultures. Owing to our present and previous results [41], the pattern of protein import into cauliflower mitochondria under temperature stress should be investigated.
Another down-regulated cauliflower mitochondrial protein in heat was P5CDH, an enzyme involved in the proline degradation pathway of the Pro/P5C cycle [104]. Enzymes of this cycle, including P5C synthetase and proline dehydrogenase (ProDH) could be reciprocally expressed under stress. Moreover, ProDH closely associates with the OXPHOS system [42,105]; it was suggested that P5CDH prevents oxidative stress and electron run-off within the mitochondrial respiratory chain during Pro metabolism [106]. Free Pro accumulated in leaves of cold-treated cauliflower of wild type and mutant clones selected on hydroxyproline-containing medium, however, after salinity stress in mutated populations [107,108]. Interestingly, the level of P5CDH messengers significantly decreased in Arabidopsis plants expressing ectopically P5C synthetase 1 in response to heat stress. Pro accumulation impeded Arabidopsis seedlings growth in heat stress and may not serve as a protective osmolyte [109]. Therefore, it would be important to determine whether the decrease in abundance of P5CDH in cauliflower curds is associated with the increased Pro level after heat stress and heat recovery.
To extend our knowledge regarding cauliflower cold-responsive proteins, we carried out immunoblotting using antisera against dedicated proteins (Figure 3). We observed accumulation of cytosolic Hsp17.6C-CI after cold stress and recovery, indicating interaction of small HSPs with cauliflower mitochondrial membranes under prolonged cold treatment (as speculated by Rikhvanov et al. [54] for heat-stressed Arabidopsis cell cultures) and the importance of stress recovery phase in gaining stress resistance. Overall, HSPs are known to form oligomeric complexes with stress-affected proteins [110]. Important photorespiratory enzymes, GDC and SHMT, were decreased in abundance after cold recovery, similarly to Agrostis scabra, A. stolonifera, Arabidopsis, pea, P. cathayana, rice and wheat (Triticum aestivum) proteins in cold, heat and drought [37,38,50,92,111,112,113]. This observation is consistent with the reported declined levels of those enzymes in plant mitochondria under unfavourable conditions, leading to photorespiratory impairments [111]. However, under microspore development in rice plants submitted to cold, GDC-H was upregulated [114]. Interestingly, such up-regulation of GDC-H was also reported in pea leaves under frost and independently to cold tolerance and in the case of SHMT- in cold and salinity [37,88,115]. GDC-H slightly increases in abundance also in the early stages of low temperature action [116]. In accordance with that observation, as a part of protective mechanisms, significant accumulation of GDC-H transcripts in Arabidopsis leaves in response to short cold treatment was also reported [117].
We also determined variations in the level of some proteins engaged in maturation of cyt. c. Interestingly, major level downregulations of CcmFN1 and CcmFN2 proteins suggest that components of cyt. c maturation apparatus, including putative heme lyase components, may be sensitive to temperature stress. Generally, evidence for alterations of the level of those proteins in plant mitochondria during stress conditions are quite scarce. However, Naydenov et al. [118] found that CcmFN messengers responded during three-day-long cold exposure in maize embryos.
Regarding the level of other mitochondrial proteins during cold stress and cold recovery, VDAC-1 was downregulated in cauliflower mitochondria, which is generally in accordance with previously published results [37,77,94,119]. Interestingly, according to our previous study [41], we found the affected level of another VDAC isoform (VDAC-2) under heat recovery only. In addition, we detected some level of regulation of selected RC components, such as NAD9, COXII and cyt. c1. Despite Tan et al. [39] having found cyt. c1 abundance alterations (roughly followed by our data) among a number of Arabidopsis proteins in terms of their decline in cold, they did not identify COXII among them. However, those authors also reported the increased level of NAD9 protein in chilled Arabidopsis cell cultures. Longer cold acclimation led to the downregulation of this protein in wheat crowns, which is similar to our data [112], but 72 h-long cold stress resulted in NAD9 increase [37]. Selected CIV subunits [e.g., 6b-1 in chickpea (Cicer arietinum)] could also decline in abundance in cold, which suggests that overall respiratory activity decreased [120]. In most of the investigated plants, the level of COXII increased under low temperature and the overall changes in NAD9 abundance seem to be species-specific under temperature stress [5,121,122]. OXPHOS components are heat action sites in cauliflower [41]. It should be underlined that cold/cold recovery responses in cauliflower mitochondria also resulted in few protein upregulations, as was evident from 2D PAGE.
Finally, immunoblotting results extended the 2D PAGE data for cold-regulated proteins and the current study has also broadened knowledge on temperature stress responsive mitochondrial proteins, compared to our previous complexomic data [41]. Obtained data indicate for the variations of the same mitochondrial proteins in analysed stress conditions between cauliflower and other plant species. Few novel proteins, representing various pathways of mitochondrial metabolism, were discovered as responsive ones in thermal stress in cauliflower mitochondria. Therefore, one could speculate that numerous signalling pathways may be induced during action of cold or heat stress to alter the pattern of mitochondrial proteome. Various metabolic pathways (e.g., TCA cycle) may diversely participate in a particular stress response, which results in a plethora of various proteomic effects for cold, heat stress conditions and for stress recovery. In addition, the imbalance between proteomic and transcriptomic responses investigated in this study suggest that messengers accumulated at lowered levels have to be more efficiently used for translation, presumably by adaptive alterations in transcript/ribosome associations. Moreover, lack of coordination of expression profiles of diverse genes coding for subunits of the same complexes (CI, ATP synthase) in diverse temperature treatments points to the putative aberrations in the biogenesis of OXPHOS complexes also in cold and cold recovery and extends our previous data [41].

3.3. Cauliflower Leaf Respiratory Responses to Cold and Heat Stress

Temperature belongs to the critical factors controlling plant growth and development. Understanding both molecular, physiological as well as metabolic responses of crop and vegetable species to temperature stress in order to improve their tolerance and sustain high field yields is crucial [123]. However, the data regarding physiological functioning of Brassica species, including cauliflower, in cold and heat treatment [15,124] is still insufficient, contrary to some other environmental conditions, such as salinity or cadmium treatment [125,126,127,128,129].
Cauliflower is one of the most agriculturally important vegetable crops worldwide [107]. Notably, cauliflower and kale (B. oleracea var. acephala) belong to species better cold- and frost-adapted than Arabidopsis [107,130]. In our study, cold or heat stress was applied to cauliflower plants at the early stage of curd development, which enabled us to study the stress response of plants both at the molecular and physiological level. Previously, we used polarographic assays for investigating physiological properties and the activity of alternative pathway under temperature stress and recovery in isolated cauliflower mitochondria [41]. For physiological measurements in the current report, fully developed cauliflower leaves instead of curds were chosen; leaves, contrary to other plant organs, appeared more cold sensitive, which makes them most suitable for physiological assays [131]. We determined leaf respiration rate (by gas-exchange measurements on illuminated and darkened leaves), transpiration, stomatal opening, net CO2 assimilation rate as well as chlorophyll level and fluorescence parameters which appeared to be affected by the same treatments to various extents (Figure 5, Figure 6 and Figure 7), complementing our previous data.
In our study, the increase of Rn and Rd after heat stress and their subsequent decrease to the level of control variant during heat recovery suggest that adaptive forces of respiratory metabolism of cauliflower leaves to thermal treatment depends on stress duration. The increase of respiration after heat stress was also assayed in a number of plants [e.g., pepper (Capsicum annuum) leaves], which is a thermotolerant species with effective energy dissipation and ROS scavenging systems [132]. Due to the fact that cold stress acted for a longer period and appeared even more detrimental than heat, we did not observe Rn return to the level of control variant after cold recovery. This indicates for some irreversible effects in the cold, contrary to heat response (Figure 5). Such temperature recovery is expected to control energetic needs during acclimation, because of larger maintenance costs due to the increased activity of numerous enzymes [14].
The rate of respiration belongs to the first processes affected in plants also subjected to the low temperature treatments [27]. In the illuminated cauliflower leaves, Rd burst after cold recovery was evident; also for cold-acclimated Arabidopsis plants light respiration increased [14]. In some plants, however, the increase in respiration rate is visible at the early stage of cold treatment and it declines afterwards [42]. Overall, the importance of Rd in thermal adaptation is suggested. In addition, Talts et al. [14] showed that Rn of Arabidopsis leaves was more sensitive to cold stress than Rd. We noticed a more evident decrease in Rd rather than in Rn after cold treatment (Figure 5). However, in various winter and spring wheat and rye (Secale cereale) cultivars, chilling also resulted in a small Rn increase [133]. Apart from the known various temperature treatments, species-specific respiratory responses are suggested between various plant species.
In our study, cold, heat and heat recovery resulted in a significant decrease of net photosynthesis rate, which was partially accompanied by decreased stomatal conductance [14,132,134,135]. Similarly, to cauliflower data, the post-cold plant acclimation resulted in recovery of photosynthesis [134]. Copolovici et al. [135] pointed out the relevance of various cold/heat treatments for different photosynthesis and stomatal conductance decrease in tomato (Solanum lycopersicum) leaves, which is also important in our case (Figure 6). Dahal et al. [133] showed that in some wheat and rye cultivars, cold resulted in a decrease of both net CO2 assimilation and as well as leaf transpiration and stomatal conductance. Leaf transpiration, stomatal conductance, chlorophyll content and photosynthesis also responded to cold in P. cathayana [136]. The decreased photosynthetic CO2 assimilation rate in cauliflower leaves also correlated with an apparent decrease in stomatal conductance and transpiration rate after cold stress; however, in heat stress, stomata were closed to an even greater extent (Figure 6). Similarly, heat stress affected photosynthetic parameters and decreased stomatal conductance in grapevine (Vitis amurensis) and tobacco leaves [137,138]; in cauliflower leaves after heat recovery, despite rapid stomatal opening, the net photosynthetic rate remained decreased (Figure 6).
Under temperature stress, chlorophyll level and fluorescence as well as PS performance could be affected to various extents [10,124,137,139]. In our case, the decrease of Fm and Fv was accompanied by lower amounts of chlorophyll in cauliflower leaves only after cold treatment, and chlorophyll fluorescence parameters were not restored only after heat recovery. The lower chlorophyll content in leaves of cold stressed plants may suggest some damage in photosynthetic apparatus because photosynthetic rate was decreased. Generally, heat stress may result in the decrease of Fv/Fm [132]. However, in our study, PSII performance was largely unaffected due to the overall stable Fv/Fm ratio in all stress conditions investigated (Figure 7). It is known that the heat damage of PSII, accompanied by a decrease of CO2 assimilation rate, occurs when severe stress conditions (exceeded 42 °C) were applied on illuminated leaves; however, this damage could be restored either in cases when a ‘point of no return’ is not exceeded or when exogenous Ca is applied for stomatal opening [138,140,141]. We conclude that despite our heat treatment conditions bordered with this threshold between mild and severe conditions, closed stomata in heat stress resulted in overall photosynthetic, but not respiratory decrease (Figure 5 and Figure 6) and overall less susceptibility of cauliflower to heat than cold treatment.
We also noticed an association between decreased photorespiration rate and GDC-H and SHMT levels in cold recovery (Figure 4 and Figure 5). Photorespiratory decline under temperature stress may result from GDC and SHMT downregulations in abundance and/or activity [50,92,111,117]. In our study, photorespiratory impairment was observed after heat treatment and heat recovery. Here, decreased photorespiration corresponded with decreased photosynthetic activity (due to over-reduction of the photosynthetic chain) and appeared irreparable after heat recovery. Also, in pepper leaves, heat treatment decreased both net photosynthetic as well as photorespiratory rate [132]. Interestingly, in cauliflower mitochondrial proteome, the increased level of MDH was associated with GDC-H and SHMT downregulation in cold stress and cold recovery. Mitochondrial MDH, which assists in metabolic flux through the TCA cycle, could operate in a reverse manner, by reducing oxaloacetate to malate, providing NAD+ for photorespiratory glycine decarboxylation [142]. Regarding our study, mitochondrial MDH did not respond to heat treatment and heat recovery. Despite distinct tissues (curds and leaves) being chosen for proteomic and physiological experiments, still we may speculate whether cauliflower NAD+-dependent MDH is engaged rather in the increase of the NADH pool inside mitochondria by acting within the TCA cycle, and not in NAD+ regeneration necessary for photorespiration in cold stress, because the level of MDH and GDC-H were regulated conversely. Further experimental attempts are necessary to elucidate this issue.
Figure 8 summarizes results of our study. In general, we suggest that distinct cold and heat stress responses act in various way not only on the cauliflower mitochondrial proteome, but also on investigated transcript alterations and physiological parameters related with respiration with limited association. As it was pointed out above, associations between photorespiration rate and the dedicated enzymes were clearly seen. Contrasting conditions of temperature stress and recovery may result in diversely affected pre-protein import to cauliflower mitochondria, impaired metabolite exchange and altered chaperoning activity together with TCA and OXPHOS functioning. In addition, transcript accumulation is proposed to compensate affected protein pool. Nevertheless, specificity of studied physiological and molecular responses to cold and heat stress between cauliflower and other plant species were easily observed and should be investigated in the future in more detail.

4. Materials and Methods

4.1. Plant Material, Growth Conditions and Stress Treatment

Cauliflower (Brassica oleracea var. botrytis subvar. cauliflora DC cv. ‘Diadom’) seeds were purchased from Bejo Zaden (Warmenhuizen, Holland). Cauliflower seedlings were grown in 0.09 dm3 pots filled with peat substrate for growing cruciferous vegetables (Kronen–Clasmann, Gryfice, Poland). Seedlings with 3–4 leaves were transferred to larger containers (5 dm3 in volume). Plants were grown for three months in cultivation chambers at a local breeding station (Poznan University of Life Sciences, Poland) at 23/19 °C (D/N) and 70% relative humidity under photon flux density 200 μmol·m−2·s−1 (16 h of light/8 h of dark). After three months of growth corresponding to the young inflorescence (10 cm in diameter) stage, plants were divided into a few sets for stress treatment and the parallel control variants (plants grown in conditions described above).
Two stress variants were tested in this study: the direct stress treatment-heat or cold and post-stress plant cultivation (stress recovery). For the application of cold stress, plants before the isolation of mitochondria were transferred for ten days to 8 °C. Heat treatment (40 °C) was applied to growing plants for 4 h before the isolation of mitochondria. After stopping the stress treatment, part of cauliflower plants were transferred to the standard growth conditions for 48 h for the stress recovery. Curds (5 mm topmost layer) were directly harvested either after stopping the stress treatment or after stress recovery.

4.2. Gas Exchange Measurements

All analyses were carried out on at least three fully developed leaves from three 3-month-old plants. Leaves were taken from each plant representing all experimental variants (control versus stress-treated or control versus stress recovered plants). At least three biological replicates were analyzed. All parameters (the rate of total CO2 assimilation [Ag], An, total respiration rate [RT], Rd, Rn, E, and gs) were measured using an LI-6400 XT infrared gas analyzer (LI-COR, Lincoln, NE, USA) and adjusted to the enclosed leaf area determined by an LI-300 leaf meter (LI-COR, Lincoln, NE, USA). Data were recorded after at least 2 h-long illumination. During the experiment, each of the analyzed leaves were placed into a 6-cm2 chamber of the analyzer. Results were recorded after initial leaf acclimation to the desired light and CO2 concentration, relative humidity and temperature. Gas-exchange parameters were recorded after leaf acclimated in the gas exchange chamber under the following conditions: PPFD of 400 μmol·m−2·s−1, 50% of the relative humidity (RH), 22 °C, 350 ppm of CO2. CO2 assimilation rate was also determined at two additional PPFD values (200 and 600 μmol·m−2·s−1).
Rd rate was determined according to Laisk [55]. For each leaf, CO2 assimilation rate representing a given RT was recorded during decreasing intercellular CO2 concentration (Ci) to 0 ppm at 22 °C and 50% RH, and for each of the three different PPFD values (200, 400 and 600 μmol·m−2·s−1). For each PPFD, the linear regression of CO2 assimilation (A) versus Ci was calculated (A/Ci curve) and the photorespiration rate (PhR for each PPFD value, denoted as PhR200, PhR400 and PhR600) was determined as the difference between RT and Rd values (the last one expressed as a given CO2 evolution rate at the point of crossing of all A/Ci curves). The Rn rate was extrapolated from the A value during decreased PPFD to 0 μmol·m−2·s−1 from A/PPFD curve.

4.3. Chlorophyll Content and Fluorescence Measurements

Chlorophyll content was measured with a SPAD-502 chlorophyll meter (Konica Minolta, Wrocław, Poland) and expressed in relative units. Chlorophyll fluorescence was determined using a portable fluorometer (PAM-2000; Heinz Walz GmbH, Effeltrich, Germany) in a dark room with stable conditions. Before measurement, leaves were dark adapted for 30 min. Minimal fluorescence (Fo) was measured under 650 nm wavelength at a very low intensity (0.8 μmol·m−2·s−1). Fm was estimated after 1 s application of the saturating pulse of white light (3000 μmol·m−2·s−1). PSII photochemical efficiency was estimated from the Fv/Fm ratio, where Fv stands for the difference between Fm and Fo.

4.4. Preparation of Mitochondria

Mitochondria from 100 to 500 g of 5 mm-thick apical layer of cauliflower curds were isolated using a modified protocol of Boutry et al. [143], as described by Pawlowski et al. [23]. During isolation, the Complete Mini EDTA-free Protease Inhibitor Cocktail (Merck Poland, Warsaw, Poland) was added. Protein concentration was determined by the Bradford [144] method, using BSA as a calibrator.

4.5. Control Assays

Purity assays of isolated mitochondria (measurement of activities of mitochondrial cyt. c oxidase, peroxisomal catalase, plastid alkaline pyrophosphatase and cytoplasmic alcohol dehydrogenase) were conducted according to Pawlowski et al. [23]. Additionally, the purity of isolated mitochondria was verified by transmission electron microscopy (JEOL 1200EXII, Jeol, Peabody, MA, USA; [56]).

4.6. Preparation of Samples for Two-Dimensional Electrophoresis (2D SDS-PAGE)

Freshly isolated samples of cauliflower mitochondria were precipitated with trichloroacetic acid at −20 °C overnight [145,146]. After centrifugation for 5 min (16,000× g, 4 °C), pellets were washed once with 1 mL of acetone supplemented with 20 mM dithiothreitol (DTT) and re-centrifuged as described above. After vacuum drying, pellets were resuspended in the lysis buffer (7 M urea, 2 M thiourea, 0.5% (w/v) 3-((3-cholamidopropyl)dimethylammonio)-1-propanesulfonate (CHAPS), 1.5% (w/v) DTT, 0.5% (v/v) pharmalyte, pH 3–10) and protein concentration was determined either with the modified Bradford assay [147] or using a 2D Quant Kit (GE Healthcare, Warsaw, Poland).

4.7. 2D SDS-PAGE

All analyses were conducted at 15 °C; at least three biological replicates were analysed. Mitochondrial proteins (100 μg for silver nitrate staining or 500 μg for colloidal CBB) were first separated according to their charge on rehydrated Immobiline dry strips (24 cm, containing linear gradient of pH 3–10) with the rehydration buffer (8 M urea, 2% (w/v) CHAPS, 0.3% (w/v) DTT, 2% (v/v) pharmalyte, pH 3 to10) on an IPGphor apparatus (GE Healthcare, Uppsala, Sweden). Conditions for isoelectrofocusing (IEF) were as follows: 1 h at 500 V (step), 1 h at 1000 V (gradient), 3 h at 8000 V (gradient) and, finally, 5.5 h at 8000 V (step). The strips were either stored at −80 °C or they were directly treated for 10 min with solution A (6 M urea, 50 mM Tris-HCl, pH 6.8, 30% (v/v) glycerol, 2% (w/v) SDS, 0.25% [w/v] DTT) and for the same time with solution B (solution A supplemented with 4.5% (w/v) iodoacetamide without DTT) and subjected for the second dimension run (SDS-PAGE).
For SDS-PAGE precast Ettan DALT 12.5% (w/v) polyacrylamide gels (GE Healthcare) and an Ettan Dalt Six electrophoretical chamber (for six gels) were used. Conditions for the run were as follows: 45 min at 80 V and 15 h at 120 V. After electrophoresis, proteins on gel triplicates were either silver stained [148] for protein variation analysis or stained with colloidal CBB, according to Neuhoff et al. [149] for MS analyses. 2D gels were scanned, analysed using 2D Image Master 7 Platinum software (GE Healthcare) and the normalized quantitative volume of protein spots was determined.

4.8. Statistical Analysis of 2D Protein Pattern Variations

Protein spots showing variations in abundance were submitted to ANOVA to select spots for which stress treatment of post-stress plant cultivation had a significant effect (p < 0.05) on their volume. Additionally, the most variable proteins were also checked using Tukey’s HSD test (JMP Software v8, SAS Institute, Cary, NC, USA). These variable proteins were further identified by MS.

4.9. Protein Identification by MS

For MS analysis, gel spots were subjected to a standard ‘in-gel’ digestion procedure during which proteins were reduced with 100 mM (w/v) DTT (for 30 min at 56 °C), alkylated with iodoacetamide (45 min at room temperature in the dark) and digested overnight with trypsin (sequencing Grade Modified Trypsin—Promega V5111). Resulting peptides were eluted from the gel with 0.1% (v/v) trifluoroacetic acid, 2% (v/v) acetonitrile.
Peptide mixtures were separated by liquid chromatography prior to molecular mass measurements (LC coupled to a linear ion trap-Fourier transform ion cyclotron resonance (LTQ-FTICR) mass spectrometer) on Orbitrap Velos mass spectrometer (Thermo Electron Corporation, San Jose, CA, USA) at the Mass Spectrometry Laboratory (Institute of Biochemistry and Biophysics, Polish Academy of Sciences, Warsaw, Poland). Peptide mixture was applied to an RP-18 precolumn (nanoACQUITY Symmetry® C18—Waters 186003514, Waters, Warsaw, Poland) using water containing 0.1% (v/v) trifluoroacetic acid as mobile phase and then transferred to a nano-HPLC RP-18 column (nanoACQUITY BEH C18—Waters 186003545) using an acetonitrile gradient (0 to 60% (v/v) acetonitrile for 120 min) in the presence of 0.05% (v/v) formic acid with a flow rate of 150 nL·min−1. The column outlet was directly coupled to the ion source of the spectrometer working in the regime of data dependent MS to MS/MS switch. A blank run ensuring lack of cross contamination from previous samples preceded each analysis.
Acquired raw data were processed by Mascot Distiller followed by Mascot search (Matrix Science, London, UK, 8-processor on-site license) against NCBInr (version 20100203) with taxonomy restricted to Viridiplantae. Search parameters for precursor and product ions mass tolerance were 40 ppm and 0.8 Da, respectively, with allowance made for one missed trypsin cleavage, and the following fixed modifications: cysteine carbamidomethylation and allowed variable modifications: lysine carbamidomethylation and methionine oxidation, serine, threonine and tyrosine phosphorylation as well as deamidations, methylations, formylations and ethylations. Peptides with Mascot Score exceeding the threshold value corresponding to <5% False Positive Rate, calculated by Mascot procedure, were considered to be positively identified. Phosphorylation sites were predicted by PhosPhAt v4.0 (Available online: http://phosphat.uni-hohenheim.de/; [150]), NetPhos v2.0, available online: (http://www.cbs.dtu.dk/services/NetPhos-2.0/; [151]) and MUsite v1.0 (Available online: www.musite.net; [152]). Methylation sites were predicted by PMes (Available online: http://bioinfo.ncu.edu.cn/inquiries_PMeS.aspx; [153]). The data were compared with Arabidopsis data at PPDB (Available online: http://ppdb.tc.cornell.edu/dbsearch/searchmod.aspx). PPDB experimental sources concerned Zybailov et al. [154] as well as Kim et al. [155] data. Additional modified residues were predicted by FindMod (Available online: https://web.expasy.org/findmod/; [156]).

4.10. SDS-PAGE and Immunoblotting

Aliquots containing 20 μg of mitochondrial proteins were separated by 12% (w/v) SDS-PAGE [157]. For immunoassays, proteins were electroblotted from 1D (SDS-PAGE) or 2D (IEF/SDS-PAGE) gels onto polyvinylidene difluoride Immobilon-P membranes (Merck, Warsaw, Poland), using a Sedryt semidry blotting apparatus (Kucharczyk, Warsaw, Poland). Membranes were CBB-stained to ensure that equal amounts of proteins were transferred. After destaining and subsequent blocking of the membrane, they were incubated overnight with antibodies. Indicated antibodies (Table S4) were purchased from Agrisera (Vännäs, Sweden). Antibodies against cyt. c1 and ATP1 were kindly donated by Prof. Gottfried Schatz (University of Basel). Hsp17.6 antisera were a generous gift from Prof. Elisabeth Vierling (University of Massachusetts, Amherst, MA, USA). Antibodies against NAD9 and CCMA were produced by [158] and [159], respectively. CcmFN1 and CcmFN2 antisera were generated by [160]. Bound sera were detected using an anti-rabbit immunoglobulin G horseradish peroxidase or alkaline phosphatase conjugate diluted to 1/10,000 (BioRad Polska, Warsaw, Poland) and visualized with enhanced chemiluminescent reagents (GE Healthcare, Warsaw, Poland) or with Lumi-Phos WB Chemiluminescent Substrate (Life Technologies Poland, Warsaw, Poland). Immunoblotting images in triplicates were analyzed by Multi Gauge (v2.2, Fujifilm, Tokio, Japan) software and the representative pattern was presented. Band intensities were calibrated to the protein loading in the linear relationship (the control denoted as 1.00); the other bands were calculated relative to this value.

4.11. RNA Isolation and RT-semiqPCR
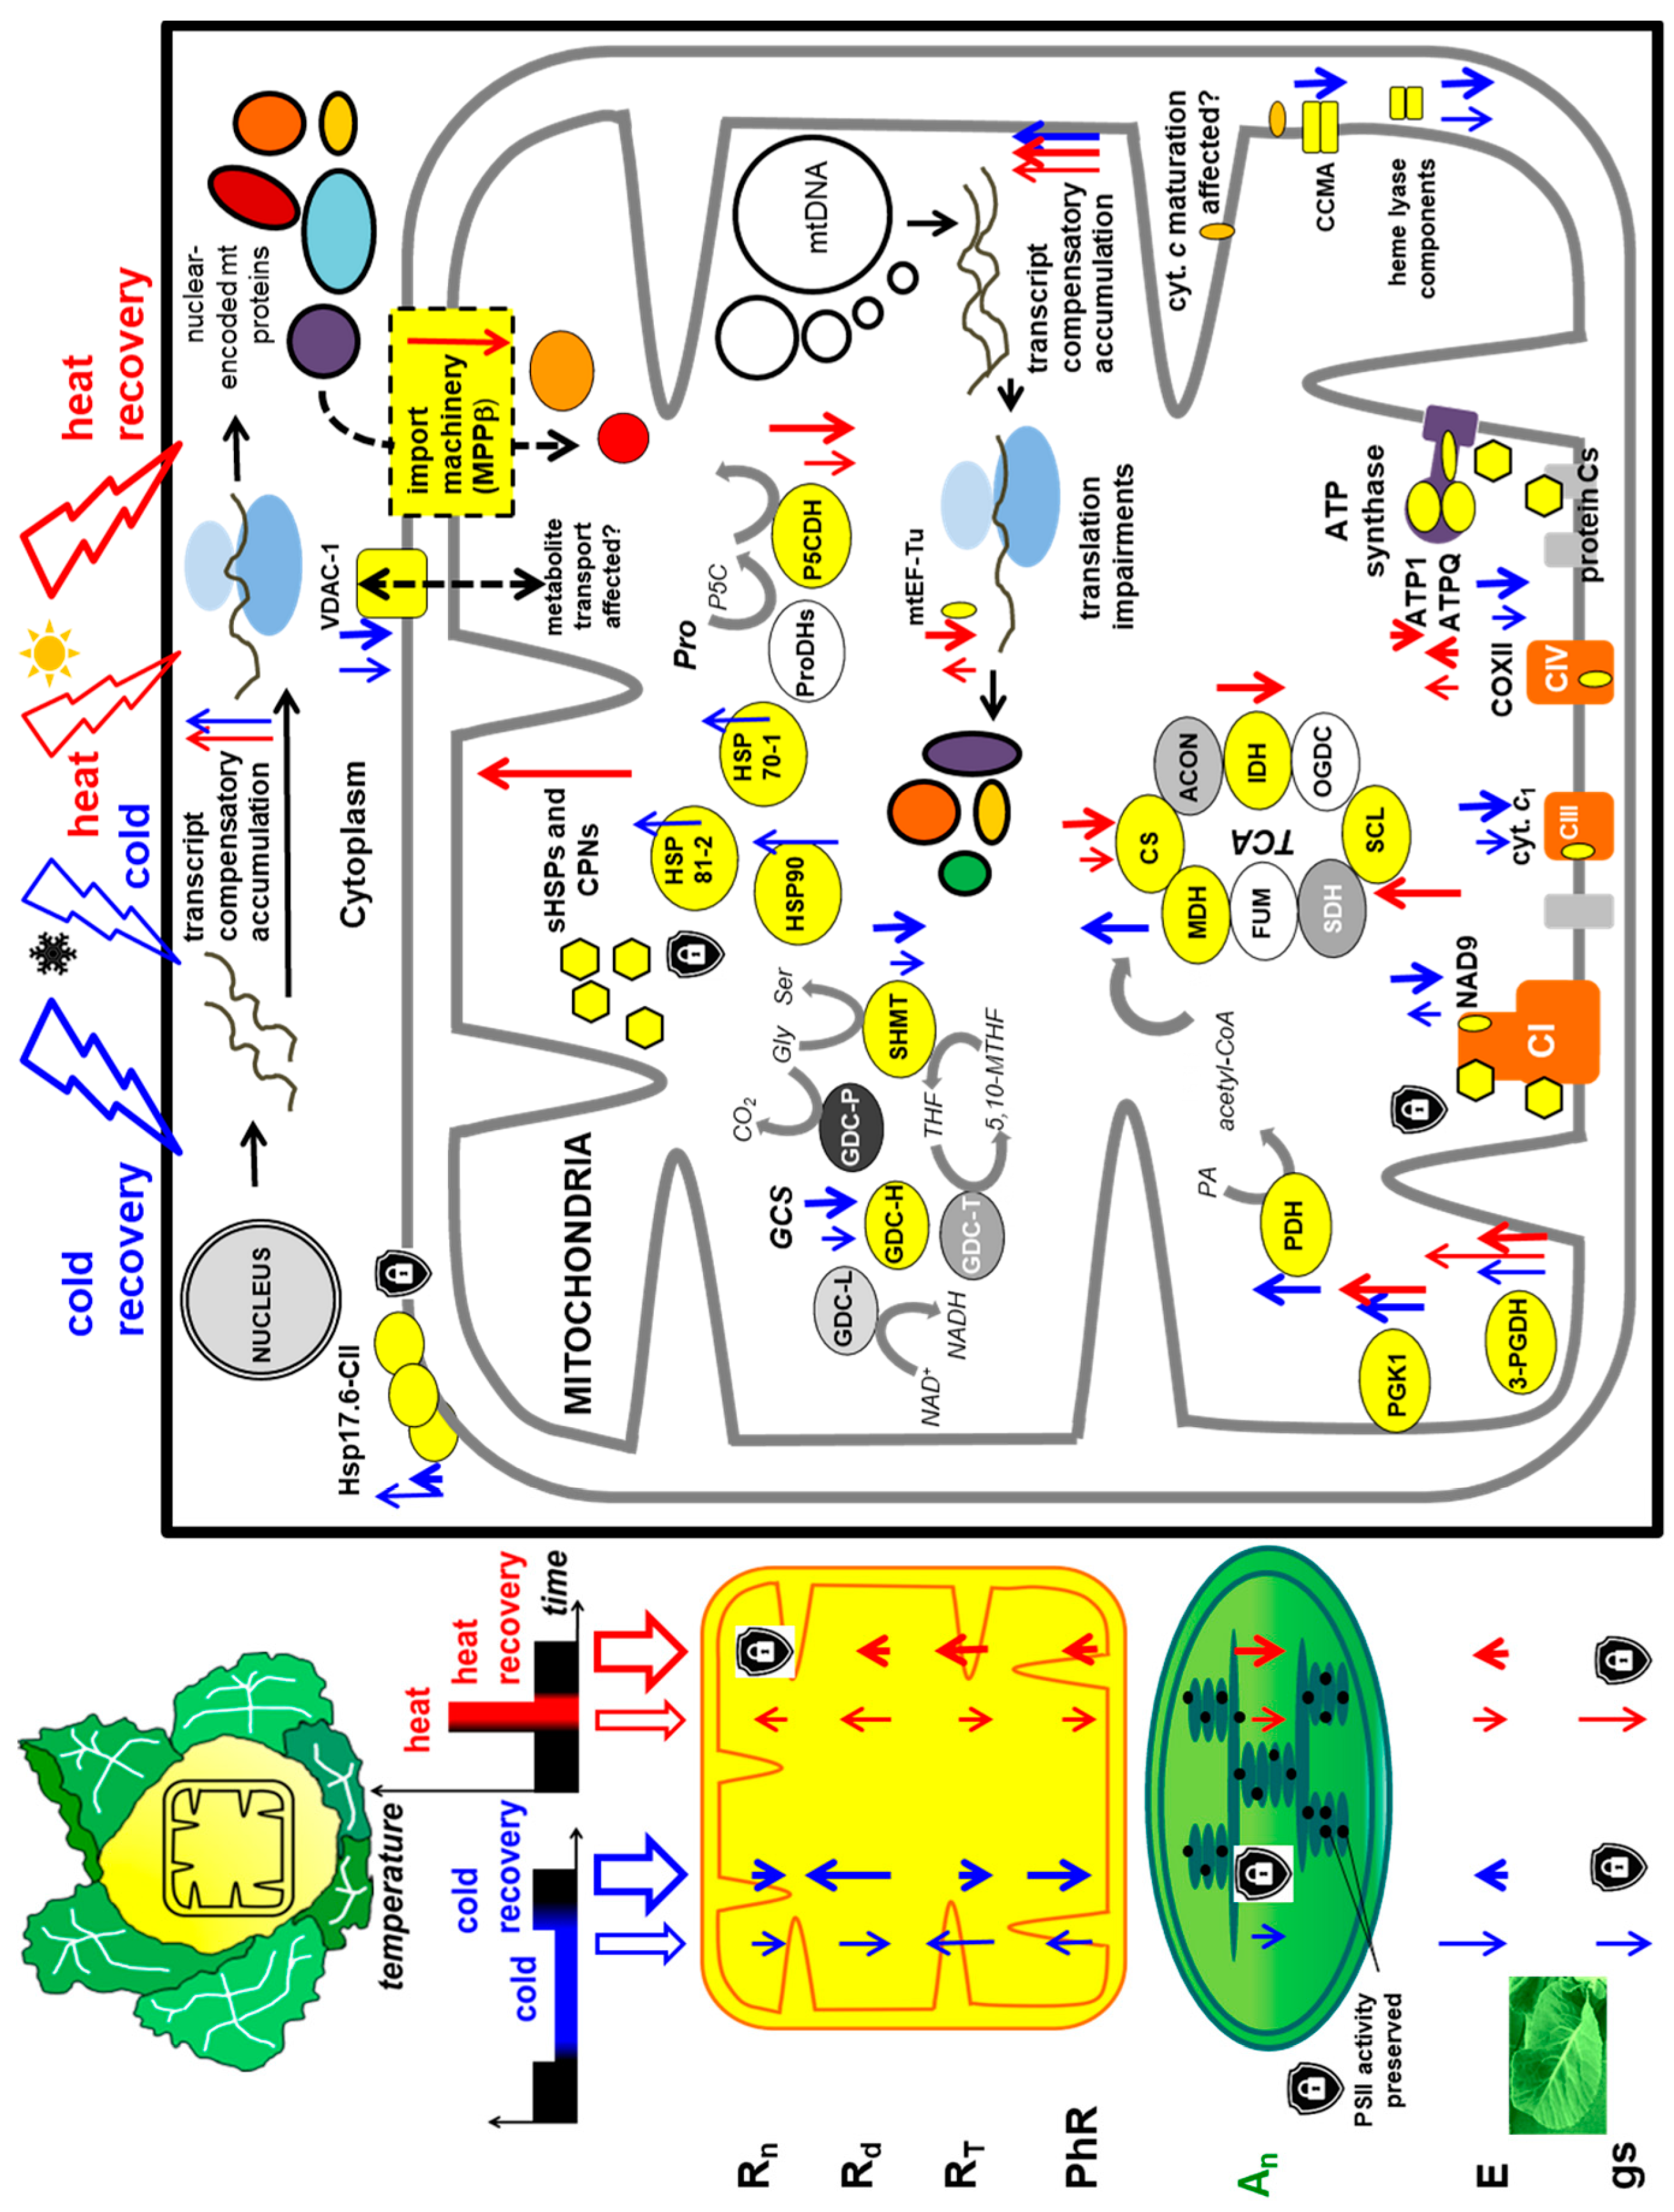
Total RNA from cauliflower curds was extracted using Trizol reagent or an EZ-10 Spin Column Plant RNA Mini-Preps Kit (BioBasic, Markham, ON, Canada) according to the manufacturer’s protocol. Genomic DNA contaminants were removed by RQ1 DNase I free of RNase (Promega Poland, Warsaw, Poland). cDNA was synthesized using 1 μg of RNA, 0.2 μg of random hexamers mixture from HexaLabel DNA Labeling Kit (Thermo Scientific, Gdańsk, Poland) and 200 units of M-MLV reverse transcriptase (Promega Poland, Warsaw, Poland) in a 20 μL total volume for 1 h at 37 °C. After first strand synthesis, the reaction mixture was diluted with 10 mM Tris-HCl, pH 8.0 three or six times; after normalization, aliquots of 1–2 μL were subjected to RT-semiquantitative multiplex PCR (RT-semiqPCR) in a 15 μL total volume.
RT-semiqPCR was performed in an Applied Biosystems 2720 thermal cycler (Applied Biosystems Poland, Warsaw, Poland) with the following profile: 3 min at 95 °C followed by 25–26 cycles depending on amplicon of 20 s at 95 °C, 30 s at 55 °C (except 58 °C and 50 °C for coxII and CPN10, respectively) and 30 s at 72 °C, and with a final incubation for 5 min at 72 °C. PCR products were separated on a 1.5% agarose gel and stained with ethidium bromide. The gels were documented using a GBOX XL1.4 (TK Biotech, Warsaw, Poland) imaging system and quantified with Multi Gauge (v.2.2, Fujifilm, Tokio, Japan). For RT-PCR assays, two biological and at least three technical replicates were included.
Cauliflower cDNA fragments for selected mitochondrial proteins were amplified using specific primers (Table S5); a 239-bp fragment of cauliflower actin1 (ACT1) cDNA was used as an internal standard. The amplicons were directly sequenced bi-directionally (Big Dye Terminator v.3.1 Cycle Sequencing kit, Applied Biosystems Poland, Warsaw, Poland) on an ABI Prism 31–30 XL system (Applied Biosystems Poland, Warsaw, Poland) for sequence identity verification.

5. Conclusions

Our approach comprises general data about variations regarding cold and heat stress responses in the mitochondrial proteome of cauliflower and in physiological parameters, related particularly to plant respiration. It appeared that the set of cauliflower mitochondrial proteins responded to temperature stress conditions as well as to the stress recovery varied from the previously described ones. These results significantly extend the deposited data also by means of investigated quantitative alterations. However, investigated proteomic, transcriptomic and respiratory physiological responses related to the functioning of cauliflower mitochondria in stress were largely not associated. For instance, the rates of respiration in illuminated leaves together with leaf transpiration and photorespiration were significantly affected by cold and/or cold recovery, despite more proteins of various functional classes being involved in heat/heat recovery. Studied transcripts and protein alterations in temperature stress and recovery involve contrasting responses. Interestingly, the expression patterns of genes coding for various CI and ATP synthase subunits also differ. According to our previous data [41], this may suggest perturbations in the biogenesis of OXPHOS complexes. Owing to the scarce representation of cold- and heat-affected proteins encoded in the mitochondrial genome during mitochondrial response to temperature stress and recovery, modulation of cauliflower mitochondrial biogenesis under the investigated stimuli may depend rather on the massive regulation of nuclear-encoded proteins.
We would like to emphasize that heat-regulated proteins were distinct (with minor exceptions) from the ones regulated by cold/cold recovery. Overall, we (1) noticed the impaired photorespiration rate which was followed by alterations in photorespiratory enzymes after cold recovery; (2) suggested possible metabolic impairments in various TCA components and Pro catabolism (downregulations of PRODH and P5CDH transcripts in cold and heat recovery were also notable), and in protein import apparatus; (3) observed elevated demand for ATP synthesis after heat/heat recovery (e.g., ATP1 and ATPQ level); (4) noticed evident downregulation of some RC subunits (e.g., ATP1, NAD9, COXII) and the sensitivity of c-type cytochrome biogenesis apparatus to cold stress and cold recovery; and (5) compared selected proteomic and transcriptomic responses providing additional data on their participation in temperature stress and recovery. Our data show that selected regulations cannot be fully restored after temperature recovery. All these results imply the necessity (1) to go deeper in the quantitative analysis of protein posttranslational modifications and (2) to study further tissue-specific proteomic and physiological alterations.

Supplementary Materials

Supplementary materials can be found at https://0-www-mdpi-com.brum.beds.ac.uk/1422-0067/19/3/877/s1.

Acknowledgments

The work was supported by the Ministry of Science and Higher Education, Poland, grant number: N N303 338835. We gratefully thank Mikołaj Knaflewski, Alina Kałużewicz, and Anna Zaworska (Poznan University of Life Sciences) for the valuable help during cauliflower plant cultivation and the gas exchange measurements. We would like to thank Michał Dadlez, Janusz Dębski and the staff from Mass Spectrometry Laboratory (Institute of Biochemistry and Biophysics, Polish Academy of Sciences, Warsaw) for MS analyses. We thank Ludmiła Bladocha (Institute of Dendrology, Polish Academy of Sciences, Kórnik) as well as Grzegorz Pietkiewicz (Adam Mickiewicz University, Poznań) for valuable technical assistance.

Author Contributions

Michał Rurek, Tomasz Pawłowski and Włodzimierz Krzesiński conceived and designed the experiments; Michał Rurek was the principle investigator, who designed this study, performed extraction of mitochondria, control assays, carried out SDS-PAGE and immunoblotting, analysed proteomic results (together with FunCat), performed RT-semiqPCR assays, analysed data from those assays and wrote the manuscript; Magdalena Czołpińska isolated mitochondria, prepared protein samples for SDS-PAGE and immunoblotting, analyzed MS data and wrote the manuscript; Tomasz Pawłowski prepared protein samples for 2D PAGE, performed 2D PAGE and the statistical analysis of spot variations, selected stress-responsive protein spots, submitted protein spots for MS analyses and participated in writing the paper; Włodzimierz Krzesiński cultivated plant material, and conducted all physiological analyses (gas exchange measurements and fluorescence assays), analysed their results; Tomasz Spiżewski assisted in cultivation and maintenance of the plant material in control conditions and after stress dosage, prepared nutrient media, subjected plants to stress conditions and participated in physiological analyses.

Conflicts of Interest

The authors declare no conflicts of interest.

Abbreviations

Annet CO2 assimilation rate
Agtotal CO2 assimilation rate
ANOVAanalysis of variance
AOXalternative oxidase
ATP1ATP synthase subunit α
BSAbovine serum albumin
CBBCoomassie Brilliant Blue
Ccm/CCMcytochrome c maturation
CAPS3-[(3-cholamidopropyl)dimethylammonio]-1-propanesulfonate
Ciintercellular CO2 concentration
COXcytochrome c oxidase
CPNchaperonin
CScitrate synthase
2D PAGEtwo-dimensional gel electrophoresis
DTTdithiothreitol
Etranspiration
EDTAethylenediaminetetraacetic acid
EGTAethylene glycol-bis(β-aminoethyl ether)-N,N,N′,N′-tetraacetic acid
EFelongation factor
Fmmaximal fluorescence
Fominimal fluorescence
FunCatfunctional categorization
Fvvariable fluorescence
GDCglycine decarboxylase
gsstomatal conductance
HSDhonest significant difference
HSPheat shock protein
IDHisocitrate dehydrogenase
IEFisoelectrofocusing
iTRAQisobaric tags for the absolute quantification
LC-MS/MSliquid chromatography-tandem mass spectrometry
MDHmalate dehydrogenase
MIPSMunich Information Center for Protein Sequences
MPPmitochondrial processing peptidase
NADcomplex I subunit (mitochondrially-encoded)
NCBINational Center for Biotechnology Information
OXPHOSoxidative phosphorylation
P5CDHΔ-1-pyrroline-5-carboxylate dehydrogenase
PDHpyruvate dehydrogenase
PGDH3-phosphoglycerate dehydrogenase
PGKphosphoglycerate kinase
PhRphotorespiration rate
PPFDphotosynthetic photon flux density
PRODHproline dehydrogenase
PSphotosystem
PTMposttranslational protein modification
RCrespiratory chain
Rdrespiration in the light (day respiration) rate
RHrelative humidity
Rnrespiration in the dark (night respiration) rate
ROSreactive oxygen species
RTtotal respiration rate
SCLsuccinyl-CoA ligase
SHMTserine hydroxy-methyl aminotransferase
TCAtricarboxylic acid
VDACvoltage-dependent anion channel

References

  1. Bray, E.A.; Bailey-Serres, J.; Weretilnyk, E. Responses to abiotic stresses. In Biochemistry and Molecular Biology of Plants, 1st ed.; Buchanan, B., Gruissem, W., Jones, R., Eds.; American Society of Plant Physiologists: Rockville, MD, USA, 2000; pp. 158–1249. ISBN1 13 978-0943088372. ISBN2 10 0943088372. [Google Scholar]
  2. Bohnert, H.J.; Nelson, D.E.; Jensen, R.G. Adaptations to Environmental Stresses. Plant Cell 1995, 7, 1099–1111. [Google Scholar] [CrossRef] [PubMed]
  3. Krishnan, A.; Pereira, A. Integrative approaches for mining transcriptional regulatory programs in Arabidopsis. Brief. Funct. Genom. Proteom. 2008, 7, 264–274. [Google Scholar] [CrossRef] [PubMed]
  4. Ribas-Carbo, M.; Aroca, R.; Gonzàlez-Meler, M.A.; Irigoyen, J.J.; Sánchez-Díaz, M. The Electron Partitioning between the Cytochrome and Alternative Respiratory Pathways during Chilling Recovery in Two Cultivars of Maize Differing in Chilling Sensitivity. Plant Physiol. 2000, 122, 199–204. [Google Scholar] [CrossRef] [PubMed]
  5. Kurimoto, K.; Millar, A.H.; Lambers, H.; Day, D.A.; Noguchi, K. Maintenance of Growth Rate at Low Temperature in Rice and Wheat Cultivars with a High Degree of Respiratory Homeostasis is Associated with a High Efficiency of Respiratory ATP Production. Plant Cell Physiol. 2004, 45, 1015–1022. [Google Scholar] [CrossRef] [PubMed]
  6. Armstrong, A.F.; Logan, D.C.; Tobin, A.K.; O’Toole, P.; Atkin, O.K. Heterogeneity of plant mitochondrial responses underpinning respiratory acclimation to the cold in Arabidopsis thaliana leaves. Plant Cell Environ. 2006, 29, 940–949. [Google Scholar] [CrossRef] [PubMed]
  7. Yang, M.-T.; Chen, S.-L.; Lin, C.-Y.; Chen, Y.-M. Chilling stress suppresses chloroplast development and nuclear gene expression in leaves of mung bean seedlings. Planta 2005, 221, 374–385. [Google Scholar] [CrossRef] [PubMed]
  8. Mohanty, S.; Grimm, B.; Tripathy, B.C. Light and dark modulation of chlorophyll biosynthetic genes in response to temperature. Planta 2006, 224, 692–699. [Google Scholar] [CrossRef] [PubMed]
  9. Allakhverdiev, S.I.; Kreslavski, V.D.; Klimov, V.V.; Los, D.A.; Carpentier, R.; Mohanty, P. Heat stress: An overview of molecular responses in photosynthesis. Photosynth. Res. 2008, 98, 541–550. [Google Scholar] [CrossRef] [PubMed]
  10. Dutta, S.; Mohanty, S.; Tripathy, B.C. Role of Temperature Stress on Chloroplast Biogenesis and Protein Import in Pea. Plant Physiol. 2009, 150, 1050–1061. [Google Scholar] [CrossRef] [PubMed]
  11. Lütz, C. Cell physiology of plants growing in cold environments. Protoplasma 2010, 244, 53–73. [Google Scholar] [CrossRef] [PubMed]
  12. Wise, R.R. Chilling-enhanced photooxidation: The production, action and study of reactive oxygen species produced during chilling in the light. Photosynth. Res. 1995, 45, 79–97. [Google Scholar] [CrossRef] [PubMed]
  13. Armstrong, A.F.; Badger, M.R.; Day, D.A.; Barthet, M.M.; Smith, P.M.C.; Millar, A.H.; Whelan, J.; Atkin, O.K. Dynamic changes in the mitochondrial electron transport chain underpinning cold acclimation of leaf respiration. Plant Cell Environ. 2008, 31, 1156–1169. [Google Scholar] [CrossRef] [PubMed]
  14. Talts, P.; Pärnik, T.; Gardeström, P.; Keerberg, O. Respiratory acclimation in Arabidopsis thaliana leaves at low temperature. J. Plant Physiol. 2004, 161, 573–579. [Google Scholar] [CrossRef] [PubMed]
  15. Díaz, M.; de Haro, V.; Muñoz, R.; Quiles, M.J. Chlororespiration is involved in the adaptation of Brassica plants to heat and high light intensity. Plant Cell Environ. 2007, 30, 1578–1585. [Google Scholar] [CrossRef] [PubMed]
  16. Pastenes, C.; Horton, P. Effect of High Temperature on Photosynthesis in Beans (I. Oxygen Evolution and Chlorophyll Fluorescence). Plant Physiol. 1996, 112, 1245–1251. [Google Scholar] [CrossRef] [PubMed]
  17. Havaux, M. Short-term responses of Photosystem I to heat stress. Photosynth. Res. 1996, 47, 85–97. [Google Scholar] [CrossRef] [PubMed]
  18. Bukhov, N.G.; Samson, G.; Carpentier, R. Nonphotosynthetic Reduction of the Intersystem Electron Transport Chain of Chloroplasts Following Heat Stress. Steady-State Rate. Photochem. Photobiol. 2000, 72, 351–357. [Google Scholar] [CrossRef]
  19. Bukhov, N.G.; Wiese, C.; Neimanis, S.; Heber, U. Heat sensitivity of chloroplasts and leaves: Leakage of protons from thylakoids and reversible activation of cyclic electron transport. Photosynth. Res. 1999, 59, 81–93. [Google Scholar] [CrossRef]
  20. Hossain, Z.; Nouri, M.-Z.; Komatsu, S. Plant cell organelle proteomics in response to abiotic stress. J. Proteome Res. 2012, 11, 37–48. [Google Scholar] [CrossRef] [PubMed]
  21. Bardel, J.; Louwagie, M.; Jaquinod, M.; Jourdain, A.; Luche, S.; Rabilloud, T.; Macherel, D.; Garin, J.; Bourguignon, J. A survey of the plant mitochondrial proteome in relation to development. Proteomics 2002, 2, 880–898. [Google Scholar] [CrossRef]
  22. Heazlewood, J.L.; Howell, K.A.; Whelan, J.; Millar, A.H. Towards an Analysis of the Rice Mitochondrial Proteome. Plant Physiol. 2003, 132, 230–242. [Google Scholar] [CrossRef] [PubMed]
  23. Pawlowski, T.; Rurek, M.; Janicka, S.; Raczynska, K.D.; Augustyniak, H. Preliminary analysis of the cauliflower mitochondrial proteome. Acta Physiol. Plant. 2005, 27, 275–281. [Google Scholar] [CrossRef]
  24. Schmidt, U.G.; Endler, A.; Schelbert, S.; Brunner, A.; Schnell, M.; Neuhaus, H.E.; Marty-Mazars, D.; Marty, F.; Baginsky, S.; Martinoia, E. Novel Tonoplast Transporters Identified Using a Proteomic Approach with Vacuoles Isolated from Cauliflower Buds. Plant Physiol. 2007, 145, 216–229. [Google Scholar] [CrossRef] [PubMed]
  25. Ahsan, N.; Donnart, T.; Nouri, M.-Z.; Komatsu, S. Tissue-Specific Defense and Thermo-Adaptive Mechanisms of Soybean Seedlings under Heat Stress Revealed by Proteomic Approach. J. Proteome Res. 2010, 9, 4189–4204. [Google Scholar] [CrossRef] [PubMed]
  26. Koehler, G.; Wilson, R.C.; Goodpaster, J.V.; Sønsteby, A.; Lai, X.; Witzmann, F.A.; You, J.-S.; Rohloff, J.; Randall, S.K.; Alsheikh, M. Proteomic Study of Low-Temperature Responses in Strawberry Cultivars (Fragaria × ananassa) That Differ in Cold tolerance. Plant Physiol. 2012, 159, 1787–1805. [Google Scholar] [CrossRef] [PubMed] [Green Version]
  27. Lee, B.; Lee, H.; Xiong, L.; Zhu, J.-K. A Mitochondrial Complex I Defect Impairs Cold-Regulated Nuclear Gene Expression. Plant Cell 2002, 14, 1235–1251. [Google Scholar] [CrossRef] [PubMed]
  28. Millar, A.H.; Heazlewood, J.L.; Kristensen, B.K.; Braun, H.-P.; Møller, I.M. The plant mitochondrial proteome. Trends Plant Sci. 2005, 10, 36–43. [Google Scholar] [CrossRef] [PubMed]
  29. Van Aken, O.; Zhang, B.; Carrie, C.; Uggalla, V.; Paynter, E.; Giraud, E.; Whelan, J. Defining the Mitochondrial Stress Response in Arabidopsis thaliana. Mol. Plant 2009, 2, 1310–1324. [Google Scholar] [CrossRef] [PubMed]
  30. Cui, J.; Liu, J.; Li, Y.; Shi, T. Integrative Identification of Arabidopsis Mitochondrial Proteome and Its Function Exploitation through Protein Interaction Network. PLoS ONE 2011, 6, e16022. [Google Scholar] [CrossRef] [PubMed]
  31. Taylor, N.L.; Tan, Y.-F.; Jacoby, R.P.; Millar, A.H. Abiotic environmental stress induced changes in the Arabidopsis thaliana chloroplast, mitochondria and peroxisome proteomes. J. Proteom. 2009, 72, 367–378. [Google Scholar] [CrossRef] [PubMed]
  32. Ndimba, B.K.; Chivasa, S.; Simon, W.J.; Slabas, A.R. Identification of Arabidopsis salt and osmotic stress responsive proteins using two-dimensional difference gel electrophoresis and mass spectrometry. Proteomics 2005, 5, 4185–4196. [Google Scholar] [CrossRef] [PubMed]
  33. Jiang, Y.; Yang, B.; Harris, N.S.; Deyholos, M.K. Comparative proteomic analysis of NaCl stress-responsive proteins in Arabidopsis roots. J. Exp. Bot. 2007, 58, 3591–3607. [Google Scholar] [CrossRef] [PubMed]
  34. Kosová, K.; Vítámvás, P.; Prášil, I.T.; Renaut, J. Plant proteome changes under abiotic stress—Contribution of proteomics studies to understanding plant stress response. J. Proteom. 2011, 74, 1301–1322. [Google Scholar] [CrossRef] [PubMed]
  35. Dunkley, T.P.J.; Hester, S.; Shadforth, I.P.; Runions, J.; Weimar, T.; Hanton, S.L.; Griffin, J.L.; Bessant, C.; Brandizzi, F.; Hawes, C.; et al. Mapping the Arabidopsis organelle proteome. Proc. Natl. Acad. Sci. USA 2006, 103, 6518–6523. [Google Scholar] [CrossRef] [PubMed]
  36. Zhu, M.; Dai, S.; McClung, S.; Yan, X.; Chen, S. Functional Differentiation of Brassica napus Guard Cells and Mesophyll Cells Revealed by Comparative Proteomics. Mol. Cell. Proteom. 2009, 8, 752–766. [Google Scholar] [CrossRef] [PubMed]
  37. Gammulla, C.G.; Pascovici, D.; Atwell, B.J.; Haynes, P.A. Differential proteomic response of rice (Oryza sativa) leaves exposed to high- and low-temperature stress. Proteomics 2011, 11, 2839–2850. [Google Scholar] [CrossRef] [PubMed]
  38. Neilson, K.A.; Mariani, M.; Haynes, P.A. Quantitative proteomic analysis of cold-responsive proteins in rice. Proteomics 2011, 11, 1696–1706. [Google Scholar] [CrossRef] [PubMed]
  39. Tan, Y.-F.; Millar, A.H.; Taylor, N.L. Components of Mitochondrial Oxidative Phosphorylation Vary in Abundance Following Exposure to Cold and Chemical Stresses. J. Proteome Res. 2012, 11, 3860–3879. [Google Scholar] [CrossRef] [PubMed]
  40. Rurek, M. Plant mitochondria under a variety of temperature stress conditions. Mitochondrion 2014, 19, 289–294. [Google Scholar] [CrossRef] [PubMed]
  41. Rurek, M.; Woyda-Ploszczyca, A.M.; Jarmuszkiewicz, W. Biogenesis of mitochondria in cauliflower (Brassica oleracea var. botrytis) curds subjected to temperature stress and recovery involves regulation of the complexome, respiratory chain activity, organellar translation and ultrastructure. Biochi. Biophys. Acta-Bioenerg. 2015, 1847, 399–417. [Google Scholar] [CrossRef] [PubMed]
  42. Heidarvand, L.; Millar, A.H.; Taylor, N.L. Responses of the Mitochondrial Respiratory System to Low Temperature in Plants. Crit. Rev. Plant Sci. 2017, 36, 217–240. [Google Scholar] [CrossRef]
  43. Giegé, P.; Sweetlove, L.J.; Cognat, V.; Leaver, C.J. Coordination of Nuclear and Mitochondrial Genome Expression during Mitochondrial Biogenesis in Arabidopsis. Plant Cell 2005, 17, 1497–1512. [Google Scholar] [CrossRef] [PubMed]
  44. Millenaar, F.F.; Lambers, H. The Alternative Oxidase: In vivo Regulation and Function. Plant Biol. 2003, 5, 2–15. [Google Scholar] [CrossRef]
  45. Lambers, H.; Robinson, S.A.; Ribas-Carbo, M. Plant Respiration: From Cell to Ecosystem. In Advances in Photosynthesis and Respiration Series, 1st ed.; Lambers, H., Ribas-Carbo, M., Eds.; Springer: Dordrecht, The Netherlands, 2005; Volume 18, pp. 1–15. ISBN 9781402035883. [Google Scholar]
  46. Vanlerberghe, G.C.; Cvetkovska, M.; Wang, J. Is the maintenance of homeostatic mitochondrial signaling during stress a physiological role for alternative oxidase? Physiol. Plant. 2009, 137, 392–406. [Google Scholar] [CrossRef] [PubMed]
  47. Grabelnych, O.I.; Sumina, O.N.; Funderat, S.P.; Pobezhimova, T.P.; Voinikov, V.K.; Kolesnichenko, A.V. The distribution of electron transport between the main cytochrome and alternative pathways in plant mitochondria during short-term cold stress and cold hardening. J. Therm. Biol. 2004, 29, 165–175. [Google Scholar] [CrossRef]
  48. Sugie, A.; Naydenov, N.; Mizuno, N.; Nakamura, C.; Takumi, S. Overexpression of wheat alternative oxidase gene Waox1a alters respiration capacity and response to reactive oxygen species under low temperature in transgenic Arabidopsis. Genes Genet. Syst. 2006, 81, 349–354. [Google Scholar] [CrossRef] [PubMed]
  49. Popov, V.N.; Purvis, A.C.; Skulachev, V.P.; Wagner, A.M. Stress-induced changes in ubiquinone concentration and alternative oxidase in plant mitochondria. Biosci. Rep. 2001, 21, 369–379. [Google Scholar] [CrossRef] [PubMed]
  50. Taylor, N.L.; Heazlewood, J.L.; Day, D.A.; Millar, A.H. Differential Impact of Environmental Stresses on the Pea Mitochondrial Proteome. Mol. Cell. Proteom. 2005, 4, 1122–1133. [Google Scholar] [CrossRef] [PubMed]
  51. Wang, J.; Rajakulendran, N.; Amirsadeghi, S.; Vanlerberghe, G.C. Impact of mitochondrial alternative oxidase expression on the response of Nicotiana tabacum to cold temperature. Physiol. Plant. 2011, 142, 339–351. [Google Scholar] [CrossRef] [PubMed]
  52. Fowler, S.; Thomashow, M.F. Arabidopsis Transcriptome Profiling Indicates That Multiple Regulatory Pathways Are Activated during Cold Acclimation in Addition to the CBF Cold Response Pathway. Plant Cell 2002, 14, 1675–1690. [Google Scholar] [CrossRef] [PubMed]
  53. Chang, S.; Yang, T.; Du, T.; Huang, Y.; Chen, J.; Yan, J.; He, J.; Guan, R. Mitochondrial genome sequencing helps show the evolutionary mechanism of mitochondrial genome formation in Brassica. BMC Genom. 2011, 12, 497. [Google Scholar] [CrossRef] [PubMed]
  54. Rikhvanov, E.G.; Gamburg, K.Z.; Varakina, N.N.; Rusaleva, T.M.; Fedoseeva, I.V.; Tauson, E.L.; Stupnikova, I.V.; Stepanov, A.V.; Borovskii, G.B.; Voinikov, V.K. Nuclear-mitochondrial cross-talk during heat shock in Arabidopsis cell culture. Plant J. 2007, 52, 763–778. [Google Scholar] [CrossRef] [PubMed]
  55. Laisk, A. Kinetics of Photosynthesis and Photorespiration in C3-Plants; Nauka: Moscow, Russia, 1977. [Google Scholar]
  56. Rurek, M. Diverse accumulation of several dehydrin-like proteins in cauliflower (Brassica oleracea var. botrytis), Arabidopsis thaliana and yellow lupin (Lupinus luteus) mitochondria under cold and heat stress. BMC Plant Biol. 2010, 10, 181. [Google Scholar] [CrossRef] [PubMed]
  57. Yan, S.-P.; Zhang, Q.-Y.; Tang, Z.-C.; Su, W.-A.; Sun, W.-N. Comparative Proteomic Analysis Provides New Insights into Chilling Stress Responses in Rice. Mol. Cell. Proteom. 2006, 5, 484–496. [Google Scholar] [CrossRef] [PubMed]
  58. Giegé, P.; Heazlewood, J.L.; Roessner-Tunali, U.; Millar, A.H.; Fernie, A.R.; Leaver, C.J.; Sweetlove, L.J. Enzymes of Glycolysis Are Functionally Associated with the Mitochondrion in Arabidopsis Cells. Plant Cell 2003, 15, 2140–2151. [Google Scholar] [CrossRef] [PubMed]
  59. Heazlewood, J.L.; Tonti-Filippini, J.S.; Gout, A.M.; Day, D.A.; Whelan, J.; Millar, A.H. Experimental Analysis of the Arabidopsis Mitochondrial Proteome Highlights Signaling and Regulatory Components, Provides Assessment of Targeting Prediction Programs, and Indicates Plant-Specific Mitochondrial Proteins. Plant Cell 2004, 16, 241–256. [Google Scholar] [CrossRef] [PubMed]
  60. Graham, J.W.A.; Williams, T.C.R.; Morgan, M.; Fernie, A.R.; Ratcliffe, R.G.; Sweetlove, L.J. Glycolytic Enzymes Associate Dynamically with Mitochondria in Response to Respiratory Demand and Support Substrate Channeling. Plant Cell 2007, 19, 3723–3738. [Google Scholar] [CrossRef] [PubMed]
  61. Goulas, E.; Schubert, M.; Kieselbach, T.; Kleczkowski, L.A.; Gardeström, P.; Schröder, W.; Hurry, V. The chloroplast lumen and stromal proteomes of Arabidopsis thaliana show differential sensitivity to short- and long-term exposure to low temperature. Plant J. 2006, 47, 720–734. [Google Scholar] [CrossRef] [PubMed]
  62. Millar, A.H.; Sweetlove, L.J.; Giegé, P.; Leaver, C.J. Analysis of the Arabidopsis Mitochondrial Proteome. Plant Physiol. 2001, 127, 1711–1727. [Google Scholar] [CrossRef] [PubMed]
  63. Kruft, V.; Eubel, H.; Jänsch, L.; Werhahn, W.; Braun, H.P. Proteomic Approach to Identify Novel Mitochondrial Proteins in Arabidopsis. Plant Physiol. 2001, 127, 1694–1710. [Google Scholar] [CrossRef] [PubMed]
  64. Giegé, P.; Sweetlove, L.J.; Leaver, C.J. Identification of mitochondrial protein complexes in Arabidopsis using two-dimensional blue-native polyacrylamide gel electrophoresis. Plant Mol. Biol. Rep. 2003, 21, 133–144. [Google Scholar] [CrossRef]
  65. Huang, S.; Taylor, N.L.; Narsai, R.; Eubel, H.; Whelan, J.; Millar, A.H. Experimental Analysis of the Rice Mitochondrial Proteome, Its Biogenesis, and Heterogeneity. Plant Physiol. 2009, 149, 719–734. [Google Scholar] [CrossRef] [PubMed]
  66. Dubinin, J.; Braun, H.-P.; Schmitz, U.; Colditz, F. The mitochondrial proteome of the model legume Medicago truncatula. Biochim. Biophys. Acta 2011, 1814, 1658–1668. [Google Scholar] [CrossRef] [PubMed]
  67. Taylor, N.L.; Heazlewood, J.L.; Millar, A.H. The Arabidopsis thaliana 2-D gel mitochondrial proteome: Refining the value of reference maps for assessing protein abundance, contaminants and post-translational modifications. Proteomics 2011, 11, 1720–1733. [Google Scholar] [CrossRef] [PubMed]
  68. Ito, J.; Heazlewood, J.L.; Millar, A.H. The plant mitochondrial proteome and the challenge of defining the posttranslational modifications responsible for signalling and stress effects on respiratory functions. Physiol. Plant. 2007, 129, 207–224. [Google Scholar] [CrossRef]
  69. Ito, J.; Taylor, N.L.; Castleden, I.; Weckwerth, W.; Millar, A.H.; Heazlewood, J.L. A survey of the Arabidopsis thaliana mitochondrial phosphoproteome. Proteomics 2009, 9, 4229–4240. [Google Scholar] [CrossRef] [PubMed]
  70. Huang, C.; Verrillo, F.; Renzone, G.; Arena, S.; Rocco, M.; Scaloni, A.; Marra, M. Response to biotic and oxidative stress in Arabidopsis thaliana: Analysis of variably phosphorylated proteins. J. Proteom. 2011, 74, 1934–1949. [Google Scholar] [CrossRef] [PubMed] [Green Version]
  71. Havelund, J.F.; Thelen, J.J.; Møller, I.M. Biochemistry, proteomics, and phosphoproteomics of plant mitochondria from non-photosynthetic cells. Front. Plant Sci. 2013, 4, 51. [Google Scholar] [CrossRef] [PubMed]
  72. Khan, M.; Takasaki, H.; Komatsu, S. Comprehensive Phosphoproteome Analysis in Rice and Identification of Phosphoproteins Responsive to Different Hormones/Stresses. J. Proteome Res. 2005, 4, 1592–1599. [Google Scholar] [CrossRef] [PubMed]
  73. Solheim, C.; Li, L.; Hatzopoulos, P.; Millar, A.H. Loss of Lon1 in Arabidopsis Changes the Mitochondrial Proteome Leading to Altered Metabolite Profiles and Growth Retardation without an Accumulation of Oxidative Damage. Plant Physiol. 2012, 160, 1187–1203. [Google Scholar] [CrossRef] [PubMed]
  74. Parkin, I.A.P.; Robinson, S.J. Exploring the Paradoxes of the Brassica Genome Architecture. In Genetics, Genomics and Breeding of Vegetable Brassicas, 1st ed.; Sadowski, J., Kole, C., Eds.; Science Publishers: Enfield, NH, USA; Boca Raton, FL, USA, 2011; pp. 328–348. ISBN 9781578087068. [Google Scholar]
  75. Faurobert, M.; Mihr, C.; Bertin, N.; Pawlowski, T.; Negroni, L.; Sommerer, N.; Causse, M. Major Proteome Variations Associated with Cherry Tomato Pericarp Development and Ripening. Plant Physiol. 2007, 143, 1327–1346. [Google Scholar] [CrossRef] [PubMed]
  76. Imin, N.; Kerim, T.; Rolfe, B.G.; Weinman, J.J. Effect of early cold stress on the maturation of rice anthers. Proteomics 2004, 4, 1873–1882. [Google Scholar] [CrossRef] [PubMed]
  77. Qin, G.; Meng, X.; Wang, Q.; Tian, S. Oxidative Damage of Mitochondrial Proteins Contributes to Fruit Senescence: A Redox Proteomics Analysis. J. Proteome Res. 2009, 8, 2449–2462. [Google Scholar] [CrossRef] [PubMed]
  78. Yun, Z.; Jin, S.; Ding, Y.; Wang, Z.; Gao, H.; Pan, Z.; Xu, J.; Cheng, Y.; Deng, X. Comparative transcriptomics and proteomics analysis of citrus fruit, to improve understanding of the effect of low temperature on maintaining fruit quality during lengthy post-harvest storage. J. Exp. Bot. 2012, 63, 2873–2893. [Google Scholar] [CrossRef] [PubMed]
  79. Ferreira, S.; Hjernø, K.; Larsen, M.; Wingsle, G.; Larsen, P.; Fey, S.; Roepstorff, P.; Salomé Pais, M. Proteome Profiling of Populus euphratica Oliv. Upon Heat Stress. Ann. Bot. 2006, 98, 361–377. [Google Scholar] [CrossRef] [PubMed]
  80. Howell, K.A.; Cheng, K.; Murcha, M.W.; Jenkin, L.E.; Millar, A.H.; Whelan, J. Oxygen Initiation of Respiration and Mitochondrial Biogenesis in Rice. J. Biol. Chem. 2007, 282, 15619–15631. [Google Scholar] [CrossRef] [PubMed]
  81. Lee, D.-G.; Ahsan, N.; Lee, S.-H.; Kang, K.Y.; Bahk, J.D.; Lee, I.-J.; Lee, B.-H. A proteomic approach in analyzing heat-responsive proteins in rice leaves. Proteomics 2007, 7, 3369–3383. [Google Scholar] [CrossRef] [PubMed]
  82. Millar, A.H.; Whelan, J.; Soole, K.L.; Day, D.A. Organization and regulation of mitochondrial respiration in plants. Annu. Rev. Plant Biol. 2011, 62, 79–104. [Google Scholar] [CrossRef] [PubMed]
  83. Sarry, J.-E.; Kuhn, L.; Ducruix, C.; Lafaye, A.; Junot, C.; Hugouvieux, V.; Jourdain, A.; Bastien, O.; Fievet, J.B.; Vailhen, D.; et al. The early responses of Arabidopsis thaliana cells to cadmium exposure explored by protein and metabolite profiling analyses. Proteomics 2006, 6, 2180–2198. [Google Scholar] [CrossRef] [PubMed]
  84. Komatsu, S.; Yamamoto, A.; Nakamura, T.; Nouri, M.-Z.; Nanjo, Y.; Nishizawa, K.; Furukawa, K. Comprehensive Analysis of Mitochondria in Roots and Hypocotyls of Soybean under Flooding Stress using Proteomics and Metabolomics Techniques. J. Proteome Res. 2011, 10, 3993–4004. [Google Scholar] [CrossRef] [PubMed]
  85. Nakaminami, K.; Matsui, A.; Nakagami, H.; Minami, A.; Nomura, Y.; Tanaka, M.; Morosawa, T.; Ishida, J.; Takahashi, S.; Uemura, M.; et al. Analysis of Differential Expression Patterns of mRNA and Protein During Cold-Acclimation and De-Acclimation in Arabidopsis. Mol. Cell. Proteom. 2014, 13, 3602–3611. [Google Scholar] [CrossRef] [PubMed]
  86. Li, T.; Xu, S.L.; Oses-Prieto, J.A.; Putil, S.; Xu, P.; Wang, R.J.; Li, K.H.; Maltby, D.A.; An, L.H.; Burlingame, A.L.; et al. Proteomics Analysis Reveals Post-Translational Mechanisms for Cold-Induced Metabolic Changes in Arabidopsis. Mol. Plant 2011, 4, 361–374. [Google Scholar] [CrossRef] [PubMed]
  87. Rinalducci, S.; Egidi, M.G.; Karimzadeh, G.; Jazii, F.R.; Zolla, L. Proteomic analysis of a spring wheat cultivar in response to prolonged cold stress. Electrophoresis 2011, 32, 1807–1818. [Google Scholar] [CrossRef] [PubMed]
  88. Dumont, E.; Bahrman, N.; Goulas, E.; Valot, B.; Sellier, H.; Hilbert, J.-L.; Vuylsteker, C.; Lejeune-Hénaut, I.; Delbreil, B. A proteomic approach to decipher chilling response from cold acclimation in pea (Pisum sativum L.). Plant Sci. 2011, 180, 86–98. [Google Scholar] [CrossRef] [PubMed]
  89. Yin, G.; Sun, H.; Xin, X.; Qin, G.; Liang, Z.; Jing, X. Mitochondrial Damage in the Soybean Seed Axis during Imbibition at Chilling Temperatures. Plant Cell. Physiol. 2009, 50, 1305–1318. [Google Scholar] [CrossRef] [PubMed]
  90. Cheng, L.; Gao, X.; Li, S.; Shi, M.; Javeed, H.; Jing, X.; Yang, G.; He, G. Proteomic analysis of soybean [Glycine max (L.) Meer.] seeds during imbibition at chilling temperature. Mol. Breed. 2010, 26, 1–17. [Google Scholar] [CrossRef]
  91. Sánchez-Bel, P.; Egea, I.; Sanchez-Ballesta, M.T.; Martinez-Madrid, C.; Fernandez-Garcia, N.; Romojaro, F.; Olmos, E.; Estrella, E.; Bolarin, M.C.; Flores, F.B. Understanding the mechanisms of chilling injury in bell pepper fruits using the proteomic approach. J. Proteom. 2012, 75, 5463–5478. [Google Scholar] [CrossRef] [PubMed] [Green Version]
  92. Xu, C.; Huang, B. Differential proteomic response to heat stress in thermal Agrostis scabra and heat-sensitive Agrostis stolonifera. Physiol. Plant. 2010, 139, 192–204. [Google Scholar] [CrossRef] [PubMed]
  93. Vítámvás, P.; Prášil, I.T.; Kosová, K.; Planchon, S.; Renaut, J. Analysis of proteome and frost tolerance in chromosome 5A and 5B reciprocal substitution lines between two winter wheats during long-term cold acclimation. Proteomics 2012, 12, 68–85. [Google Scholar] [CrossRef] [PubMed]
  94. Sweetlove, L.J.; Heazlewood, J.L.; Herald, V.; Holtzapffel, R.; Day, D.A.; Leaver, C.J.; Millar, A.H. The impact of oxidative stress on Arabidopsis mitochondria. Plant J. 2002, 32, 891–904. [Google Scholar] [CrossRef] [PubMed]
  95. Renaut, J.; Hausman, J.-F.; Bassett, C.; Artlip, T.; Cauchie, H.-M.; Witters, E.; Wisniewski, M. Quantitative proteomic analysis of short photoperiod and low-temperature responses in bark tissues of peach (Prunus persica L. Batsch). Tree Genet. Genomes 2008, 4, 589–600. [Google Scholar] [CrossRef]
  96. Chen, X.; Wang, Y.; Li, J.; Jiang, A.; Cheng, Y.; Zhang, W. Mitochondrial proteome during salt stress-induced programmed cell death in rice. Plant Physiol. Biochem. 2009, 47, 407–415. [Google Scholar] [CrossRef] [PubMed]
  97. Palmblad, M.; Mills, D.J.; Bindschedler, L.V. Heat-Shock Response in Arabidopsis thaliana Explored by Multiplexed Quantitative Proteomics Using Differential Metabolic Labeling. J. Proteome Res. 2008, 7, 780–785. [Google Scholar] [CrossRef] [PubMed]
  98. Wu, X.; Jiang, L.; Yu, M.; An, X.; Ma, R.; Yu, Z. Proteomic analysis of changes in mitochondrial protein expression during peach fruit ripening and senescence. J. Proteom. 2016, 147, 197–211. [Google Scholar] [CrossRef] [PubMed]
  99. Kim, J.Y.; Park, S.J.; Jang, B.; Jung, C.-H.; Ahn, S.J.; Goh, C.-H.; Cho, K.; Han, O.; Kang, H. Functional characterization of a glycine-rich RNA-binding protein 2 in Arabidopsis thaliana under abiotic stress conditions. Plant J. 2007, 50, 439–451. [Google Scholar] [CrossRef] [PubMed]
  100. Cui, S.; Huang, F.; Wang, J.; Ma, X.; Cheng, Y.; Liu, J. A proteomic analysis of cold stress responses in rice seedlings. Proteomics 2005, 5, 3162–3172. [Google Scholar] [CrossRef] [PubMed]
  101. Xin, X.; Lin, X.-H.; Zhou, Y.-C.; Chen, X.-L.; Liu, X.; Lu, X.-X. Proteome analysis of maize seeds: The effect of artificial ageing. Physiol. Plant. 2011, 143, 126–138. [Google Scholar] [CrossRef] [PubMed]
  102. Chen, L.; Chen, Q.; Kong, L.; Xia, F.; Yan, H.; Zhu, Y.; Mao, P. Proteomic and Physiological Analysis of the Response of Oat (Avena sativa) Seeds to Heat Stress under Different Moisture Conditions. Front. Plant Sci. 2016, 7, 896. [Google Scholar] [CrossRef] [PubMed]
  103. Taylor, N.L.; Rudhe, C.; Hulett, J.M.; Lithgow, T.; Glaser, E.; Day, D.A.; Millar, A.H.; Whelan, J. Environmental stresses inhibit and stimulate different protein import pathways in plant mitochondria. FEBS Lett. 2003, 547, 125–130. [Google Scholar] [CrossRef]
  104. Funck, D.; Eckard, S.; Müller, G. Non-redundant functions of two proline dehydrogenase isoforms in Arabidopsis. BMC Plant Biol. 2010, 10, 70. [Google Scholar] [CrossRef] [PubMed]
  105. Peng, Z.; Lu, Q.; Verma, D.P. Reciprocal regulation of delta 1-pyrroline-5-carboxylate synthetase and proline dehydrogenase genes controls proline levels during and after osmotic stress in plants. Mol. Gen. Genet. 1996, 253, 334–341. [Google Scholar] [CrossRef] [PubMed]
  106. Miller, G.; Honig, A.; Stein, H.; Suzuki, N.; Mittler, R.; Zilberstein, A. Unraveling Δ1-Pyrroline-5-Carboxylate-Proline Cycle in Plants by Uncoupled Expression of Proline Oxidation Enzymes. J. Biol. Chem. 2009, 284, 26482–26492. [Google Scholar] [CrossRef] [PubMed]
  107. Fuller, M.P.; Metwali, E.M.R.; Eed, M.H.; Jellings, A.J. Evaluation of Abiotic Stress Resistance in Mutated Populations of Cauliflower (Brassica oleracea var. botrytis). Plant Cell Tissue Organ Cult. 2006, 86, 239. [Google Scholar] [CrossRef]
  108. Hadi, F.; Gilpin, M.; Fuller, M.P. Identification and expression analysis of CBF/DREB1 and COR15 genes in mutants of Brassica oleracea var. botrytis with enhanced proline production and frost resistance. Plant Physiol. Biochem. 2011, 49, 1323–1332. [Google Scholar] [CrossRef] [PubMed] [Green Version]
  109. Lv, W.-T.; Lin, B.; Zhang, M.; Hua, X.-J. Proline Accumulation is Inhibitory to Arabidopsis Seedlings during Heat Stress. Plant Physiol. 2011, 156, 1921–1933. [Google Scholar] [CrossRef] [PubMed]
  110. Lee, U.; Wie, C.; Escobar, M.; Williams, B.; Hong, S.-W.; Vierling, E. Genetic Analysis Reveals Domain Interactions of Arabidopsis Hsp100/Clpb and Cooperation with the Small Heat Shock Protein Chaperone System. Plant Cell 2005, 17, 559–571. [Google Scholar] [CrossRef] [PubMed]
  111. Taylor, N.L.; Day, D.A.; Millar, A.H. Environmental Stress Causes Oxidative Damage to Plant Mitochondria Leading to Inhibition of Glycine Decarboxylase. J. Biol. Chem. 2002, 277, 42663–42668. [Google Scholar] [CrossRef] [PubMed]
  112. Herman, E.M.; Rotter, K.; Premakumar, R.; Elwinger, G.; Bae, H.; Ehler-King, L.; Chen, S.; Livingston, D.P. Additional freeze hardiness in wheat acquired by exposure to −3 °C is associated with extensive physiological, morphological, and molecular changes. J. Exp. Bot. 2006, 57, 3601–3618. [Google Scholar] [CrossRef] [PubMed]
  113. Zhang, S.; Chen, F.; Peng, S.; Ma, W.; Korpelainen, H.; Li, C. Comparative physiological, ultrastructural and proteomic analyses reveal sexual differences in the responses of Populus cathayana under drought stress. Proteomics 2010, 10, 2661–2677. [Google Scholar] [CrossRef] [PubMed]
  114. Imin, N.; Kerim, T.; Weinman, J.J.; Rolfe, B.G. Low Temperature Treatment at the Young Microspore Stage Induces Protein Changes in Rice Anthers. Mol. Cell. Proteom. 2006, 5, 274–292. [Google Scholar] [CrossRef] [PubMed]
  115. Kim, D.-W.; Rakwal, R.; Agrawal, G.K.; Jung, Y.-H.; Shibato, J.; Jwa, N.-S.; Iwahashi, Y.; Iwahashi, H.; Kim, D.H.; Shim, I.-S.; et al. A hydroponic rice seedling culture model system for investigating proteome of salt stress in rice leaf. Electrophoresis 2005, 26, 4521–4539. [Google Scholar] [CrossRef] [PubMed]
  116. Wang, X.Y.; Shan, X.H.; Wu, Y.; Su, S.Z.; Li, S.P.; Liu, H.K.; Han, J.Y.; Xue, C.M.; Yuan, Y.P. iTRAQ-based quantitative proteomic analysis reveals new metabolic pathways responding to chilling stress in maize seedlings. J. Proteom. 2016, 146, 14–24. [Google Scholar] [CrossRef] [PubMed]
  117. Byun, Y.-J.; Kim, H.-J.; Lee, D.-H. LongSAGE analysis of the early response to cold stress in Arabidopsis leaf. Planta 2009, 229, 1181–1200. [Google Scholar] [CrossRef] [PubMed]
  118. Naydenov, N.G.; Khanam, S.; Siniauskaya, M.; Nakamura, C. Profiling of mitochondrial transcriptome in germinating wheat embryos and seedlings subjected to cold, salinity and osmotic stresses. Genes Genet. Syst. 2010, 85, 31–42. [Google Scholar] [CrossRef] [PubMed]
  119. Jacoby, R.P.; Millar, A.H.; Taylor, N.L. Wheat Mitochondrial Proteomes Provide New Links between Antioxidant Defense and Plant Salinity Tolerance. J. Proteome Res. 2010, 9, 6595–6604. [Google Scholar] [CrossRef] [PubMed]
  120. Heidarvand, L.; Maali-Amiri, R. Physio-biochemical and proteome analysis of chickpea in early phases of cold stress. J. Plant Physiol. 2013, 170, 459–469. [Google Scholar] [CrossRef] [PubMed]
  121. Holtzapffel, R.C.; Finnegan, P.M.; Millar, A.H.; Badger, M.R.; Day, D.A. Mitochondrial protein expression in tomato fruit during on-vine ripening and cold storage. Funct. Plant Biol. 2002, 29, 827–834. [Google Scholar] [CrossRef]
  122. Bocian, A.; Kosmala, A.; Rapacz, M.; Jurczyk, B.; Marczak, L.; Zwierzykowski, Z. Differences in leaf proteome response to cold acclimation between Lolium perenne plants with distinct levels of frost tolerance. J. Plant Physiol. 2011, 168, 1271–1279. [Google Scholar] [CrossRef] [PubMed]
  123. Wahid, A.; Gelani, S.; Ashraf, M.; Foolad, M. Heat tolerance in plants: An overview. Environ. Exp. Bot. 2007, 61, 199–223. [Google Scholar] [CrossRef]
  124. Lin, K.-H.; Huang, H.-C.; Lin, C.-Y. Cloning, expression and physiological analysis of broccoli catalase gene and Chinese cabbage ascorbate peroxidase gene under heat stress. Plant Cell Rep. 2010, 29, 575–593. [Google Scholar] [CrossRef] [PubMed]
  125. Ashraf, M. Relationships between growth and gas exchange characteristics in some salt-tolerant amphidiploid Brassica species in relation to their diploid parents. Environ. Exp. Bot. 2001, 45, 155–163. [Google Scholar] [CrossRef]
  126. Baryla, A.; Carrier, P.; Franck, F.; Coulomb, C.; Sahut, C.; Havaux, M. Leaf chlorosis in oilseed rape plants (Brassica napus) grown on cadmium-polluted soil: Causes and consequences for photosynthesis and growth. Planta 2001, 212, 696–709. [Google Scholar] [CrossRef] [PubMed]
  127. Gill, S.S.; Khan, N.A.; Tuteja, N. Differential cadmium stress tolerance in five indian mustard (Brassica juncea L.) cultivars: An evaluation of the role of antioxidant machinery. Plant Signal. Behav. 2011, 6, 293–300. [Google Scholar] [CrossRef] [PubMed]
  128. Hayat, S.; Maheshwari, P.; Wani, A.S.; Irfan, M.; Alyemeni, M.N.; Ahmad, A. Comparative effect of 28 homobrassinolide and salicylic acid in the amelioration of NaCl stress in Brassica juncea L. Plant Physiol. Biochem. 2012, 53, 61–68. [Google Scholar] [CrossRef] [PubMed]
  129. Yang, Y.; Zheng, Q.; Liu, M.; Long, X.; Liu, Z.; Shen, Q.; Guo, S. Difference in Sodium Spatial Distribution in the Shoot of Two Canola Cultivars under Saline Stress. Plant Cell. Physiol. 2012, 53, 1083–1092. [Google Scholar] [CrossRef] [PubMed]
  130. Bunce, J.A. Acclimation of photosynthesis to temperature in Arabidopsis thaliana and Brassica oleracea. Photosynthetica 2008, 46, 517–524. [Google Scholar] [CrossRef]
  131. Hu, W.H.; Shi, K.; Song, X.S.; Xia, X.J.; Zhou, Y.H.; Yu, J.Q. Different effects of chilling on respiration in leaves and roots of cucumber (Cucumis sativus). Plant Physiol. Biochem. 2006, 44, 837–843. [Google Scholar] [CrossRef] [PubMed]
  132. Hu, W.H.; Xiao, Y.A.; Zeng, J.J.; Hu, X.H. Photosynthesis, respiration and antioxidant enzymes in pepper leaves under drought and heat stresses. Biol. Plant. 2010, 54, 761–765. [Google Scholar] [CrossRef]
  133. Dahal, K.; Kane, K.; Gadapati, W.; Webb, E.; Savitch, L.V.; Singh, J.; Sharma, P.; Sarhan, F.; Longstaffe, F.J.; Grodzinski, B.; et al. The effects of phenotypic plasticity on photosynthetic performance in winter rye, winter wheat and Brassica napus. Physiol. Plant. 2012, 144, 169–188. [Google Scholar] [CrossRef] [PubMed]
  134. Savitch, L.V.; Barker-Astrom, J.; Ivanov, A.G.; Hurry, V.; Oquist, G.; Huner, N.P.; Gardeström, P. Cold acclimation of Arabidopsis thaliana results in incomplete recovery of photosynthetic capacity, associated with an increased reduction of the chloroplast stroma. Planta 2001, 214, 295–303. [Google Scholar] [CrossRef] [PubMed]
  135. Copolovici, L.; Kännaste, A.; Pazouki, L.; Niinemets, U. Emissions of green leaf volatiles and terpenoids from Solanum lycopersicum are quantitatively related to the severity of cold and heat shock treatments. J. Plant Physiol. 2012, 169, 664–672. [Google Scholar] [CrossRef] [PubMed]
  136. Zhang, S.; Jiang, H.; Peng, S.; Korpelainen, H.; Li, C. Sex-related differences in morphological, physiological, and ultrastructural responses of Populus cathayana to chilling. J. Exp. Bot. 2011, 62, 675–686. [Google Scholar] [CrossRef] [PubMed]
  137. Luo, H.-B.; Ma, L.; Xi, H.-F.; Duan, W.; Li, S.-H.; Loescher, W.; Wang, J.-F.; Wang, L.-J. Photosynthetic Responses to Heat Treatments at Different Temperatures and Following Recovery in Grapevine (Vitis amurensis L.) Leaves. PLoS ONE 2011, 6, e23033. [Google Scholar] [CrossRef] [PubMed]
  138. Tan, W.; wei Meng, Q.; Brestic, M.; Olsovska, K.; Yang, X. Photosynthesis is improved by exogenous calcium in heat-stressed tobacco plants. J. Plant Physiol. 2011, 168, 2063–2071. [Google Scholar] [CrossRef] [PubMed]
  139. Efeoğlu, B.; Terzioğlu, S. Photosynthetic responses of two wheat varieties to high temperature. EurAsian J. BioSci. 2009, 3, 97–106. [Google Scholar] [CrossRef]
  140. Yin, Y.; Li, S.; Liao, W.; Lu, Q.; Wen, X.; Lu, C. Photosystem II photochemistry, photoinhibition, and the xanthophyll cycle in heat-stressed rice leaves. J. Plant Physiol. 2010, 167, 959–966. [Google Scholar] [CrossRef] [PubMed]
  141. Hüve, K.; Bichele, I.; Rasulov, B.; Niinemets, U. When it is too hot for photosynthesis: Heat-induced instability of photosynthesis in relation to respiratory burst, cell permeability changes and H2O2 formation. Plant Cell Environ. 2011, 34, 113–126. [Google Scholar] [CrossRef] [PubMed]
  142. Tomaz, T.; Bagard, M.; Pracharoenwattana, I.; Lindén, P.; Lee, C.P.; Carroll, A.J.; Ströher, E.; Smith, S.M.; Gardeström, P.; Millar, A.H. Mitochondrial Malate Dehydrogenase Lowers Leaf Respiration and Alters Photorespiration and Plant Growth in Arabidopsis. Plant Physiol. 2010, 154, 1143–1157. [Google Scholar] [CrossRef] [PubMed]
  143. Boutry, M.; Faber, A.-M.; Charbonnier, M.; Briquet, M. Microanalysis of plant mitochondrial protein synthesis products. Plant Mol. Biol. 1984, 3, 445–452. [Google Scholar] [CrossRef] [PubMed]
  144. Bradford, M.M. A rapid and sensitive method for the quantitation of microgram quantities of protein utilizing the principle of protein-dye binding. Anal. Biochem. 1976, 72, 248–254. [Google Scholar] [CrossRef]
  145. Staszak, A.M.; Pawłowski, T.A. Proteomic Analysis of Embryogenesis and the Acquisition of Seed Dormancy in Norway Maple (Acer platanoides L.). Int. J. Mol. Sci. 2014, 15, 10868–10891. [Google Scholar] [CrossRef] [PubMed]
  146. Pawłowski, T.A.; Staszak, A.M. Analysis of the embryo proteome of sycamore (Acer pseudoplatanus L.) seeds reveals a distinct class of proteins regulating dormancy release. J. Plant Physiol. 2016, 195, 9–22. [Google Scholar] [CrossRef] [PubMed]
  147. Ramagli, L.S.; Rodriguez, L.V. Quantitation of microgram amounts of protein in two-dimensional polyacrylamide gel electrophoresis sample buffer. Electrophoresis 1985, 6, 559–563. [Google Scholar] [CrossRef]
  148. Heukeshoven, J.; Dernick, R. Silver staining of proteins. In Electrophoresis Forum, 1st ed.; Radola, B.J., Ed.; Technische Universität München: Munich, Germany, 1986. [Google Scholar]
  149. Neuhoff, V.; Arold, N.; Taube, D.; Ehrhardt, W. Improved staining of proteins in polyacrylamide gels including isoelectric focusing gels with clear background at nanogram sensitivity using Coomassie Brilliant Blue G-250 and R-250. Electrophoresis 1988, 9, 255–262. [Google Scholar] [CrossRef] [PubMed]
  150. Durek, P.; Schmidt, R.; Heazlewood, J.L.; Jones, A.; MacLean, D.; Nagel, A.; Kersten, B.; Schulze, W.X. PhosPhAt: The Arabidopsis thaliana phosphorylation site database. An update. Nucleic Acids Res. 2010, 38, D828–D834. [Google Scholar] [CrossRef] [PubMed]
  151. Blom, N.; Gammeltoft, S.; Brunak, S. Sequence and structure-based prediction of eukaryotic protein phosphorylation sites. J. Mol. Biol. 1999, 294, 1351–1362. [Google Scholar] [CrossRef] [PubMed]
  152. Gao, J.; Thelen, J.J.; Dunker, A.K.; Xu, D. Musite, a Tool for Global Prediction of General and Kinase-specific Phosphorylation Sites. Mol. Cell. Proteom. 2010, 9, 2586–2600. [Google Scholar] [CrossRef] [PubMed]
  153. Shi, S.-P.; Qiu, J.-D.; Sun, X.-Y.; Suo, S.-B.; Huang, S.-Y.; Liang, R.-P. PMeS: Prediction of Methylation Sites Based on Enhanced Feature Encoding Scheme. PLoS ONE 2012, 7, e38772. [Google Scholar] [CrossRef] [PubMed]
  154. Zybailov, B.; Sun, Q.; van Wijk, K.J. Workflow for Large Scale Detection and Validation of Peptide Modifications by RPLC-LTQ-Orbitrap: Application to the Arabidopsis thaliana Leaf Proteome and an Online Modified Peptide Library. Anal. Chem. 2009, 81, 8015–8024. [Google Scholar] [CrossRef] [PubMed]
  155. Kim, J.; Rudella, A.; Ramirez Rodriguez, V.; Zybailov, B.; Olinares, P.D.B.; van Wijk, K.J. Subunits of the Plastid ClpPR Protease Complex Have Differential Contributions to Embryogenesis, Plastid Biogenesis, and Plant Development in Arabidopsis. Plant Cell 2009, 21, 1669–1692. [Google Scholar] [CrossRef] [PubMed]
  156. Wilkins, M.R.; Gasteiger, E.; Gooley, A.A.; Herbert, B.R.; Molloy, M.P.; Binz, P.A.; Ou, K.; Sanchez, J.C.; Bairoch, A.; Williams, K.L.; et al. High-throughput mass spectrometric discovery of protein post-translational modifications. J. Mol. Biol. 1999, 289, 645–657. [Google Scholar] [CrossRef] [PubMed]
  157. Laemmli, U.K. Cleavage of Structural Proteins during the Assembly of the Head of Bacteriophage T4. Nature 1970, 227, 680–685. [Google Scholar] [CrossRef] [PubMed]
  158. Lamattina, L.; Gonzalez, D.; Gualberto, J.; Grienenberger, J.M. Higher plant mitochondria encode an homologue of the nuclear-encoded 30-kDa subunit of bovine mitochondrial complex I. Eur. J. Biochem. 1993, 217, 831–838. [Google Scholar] [CrossRef] [PubMed]
  159. Rayapuram, N.; Hagenmuller, J.; Grienenberger, J.M.; Bonnard, G.; Giegé, P. The Three Mitochondrial Encoded Ccmf Proteins Form a Complex That Interacts with CCMH and c-Type Apocytochromes in Arabidopsis. J. Biol. Chem. 2008, 283, 25200–25208. [Google Scholar] [CrossRef] [PubMed]
  160. Rayapuram, N.; Hagenmuller, J.; Grienenberger, J.-M.; Giegé, P.; Bonnard, G. AtCCMA Interacts with AtCcmB to Form a Novel Mitochondrial ABC Transporter Involved in Cytochrome c Maturation in Arabidopsis. J. Biol. Chem. 2007, 282, 21015–21023. [Google Scholar] [CrossRef] [PubMed]
Figure 1. Position of varying spots on 2D silver-stained master gel of cauliflower curd mitochondrial proteome (in total 100 µg of mitochondrial proteins pooled from all experimental variants), including 694 repeatable spots. 24-cm immobilised pH gradient strips (linear pH 3–10) for the first dimension and precast Ettan DALT 12.5% SDS-polyacrylamide gels for the second dimension were used. It shows the position of the 22 variable spots that were mapped and identified (they appear also in Figure 1, Figure S1 and S2 and Table 1). Protein molecular mass standards (Thermo Scientific, Gdańsk, Polska) sizes are given in kilodaltons (kDa); pI-isoelectric point. Further experimental details in Materials and Methods.
Ijms 19 00877 g001
Figure 2. Immunoblotting of ATP1 on 2D blots containing cauliflower curd mitochondrial proteins from control grown plants (K) and from heat-recovered plants (HA). 100 μg of mitochondrial proteins were loaded onto all gels. 24-cm immobilized pH gradient strips (linear pH 3–10) for the first dimension and precast Ettan DALT 12.5% SDS-polyacrylamide gels for the second dimension were used. For protein transfer onto Immobilone membrane, a semidry system was applied. Blots were probed with polyclonal antibodies raised against mitochondrial ATP synthase subunit α (ATP1). Detection was carried with chemiluminescence assays after incubation with HRP-conjugated secondary antibody. Representative results (from triplicates) are shown. For the comparison, panels showing fragments of silver-stained 2D gels that contains spots for ATP1 are displayed. Arrows (indicated in each blot) show the position of ATP1 on immunoblots and 2D gels. Protein molecular mass standard (Thermo Scientific, Gdańsk, Poland) sizes are given in kilodaltons (kDa); pI-isoelectric point. Further experimental details in the text.
Ijms 19 00877 g002
Figure 3. Functional categorization of cauliflower stress-responsive protein spots, analysed by 2D PAGE. Spots were analysed both according to their number (upper) as well as densitometrical volume (abundance; below) calculated for each of functional groups in control grown plants, cold- or heat-stressed plants (C or H, respectively) and cold- or heat-recovered plants (CA or HA, respectively). Bar legend of categories: CM—carbohydrate metabolism, PrF—protein fate, AM—amino acid metabolism, RC—respiration (respiratory chain components), PrS—protein synthesis.
Ijms 19 00877 g003
Figure 4. Immunoblotting of proteins from control grown plants (K), cold-stressed plants (C) and from cold-recovered plants (CA). About 10 μg of mitochondrial proteins from cauliflower curds were loaded onto SDS-polyacrylamide gels. Proteins were transferred onto an Immobilone membrane using a semidry system. All assays were performed using specific primary antibodies raised against heat shock protein 17.6C class I (Hsp17.6), glycine decarboxylase subunit H (GDC-H), NADH dehydrogenase (CI) subunit 9 (NAD9), cyt. c oxidase (CIV) subunit 2 (COXII), cyt. c1, cyt. c maturation proteins (CCMA, CcmFN1, CcmFN2), serine hydroxymethyltransferase 1 (SHMT) and voltage-dependent anion channel 1 (VDAC-1). Detection was carried out with chemiluminescence assays after incubation with HRP-conjugated secondary antibody. Representative results from triplicates are shown. The relative abundance of bands is given below each panel. The abundance in stress conditions (value ± SD) is standardized to 1.00 in control variants. For the loading control, blot staining with Coomassie Brilliant Blue is additionally shown. Protein molecular mass standard (Thermo Scientific, Gdańsk, Poland) sizes are given in kilodaltons (kDa). Further experimental details in Materials and Methods.
Ijms 19 00877 g004
Figure 5. Changes in cauliflower leaf light (Rd), dark (Rn) respiration as well as total light (RT) respiration and (PhR) photorespiration (all expressed in µmol CO2·m−2·s−1) at 200 (RT200 and PhR200), 400 (RT400 and PhR400) and 600 (RT600 and PhR600) µmol·m−2·s−1 illumination rate in control grown (K), heat-stressed (H), heat-recovered (HA), cold-stressed (C) and cold-recovered (CA) plants. All parameters were measured on 3-month-old plants with fully developed leaves with the application of an infrared gas analyser. Data were recorded after at least 2 h of illumination. During the experiment, each of the analysed leaves were placed into a 6-cm2 chamber of the analyser. Results were recorded after initial leaf acclimation to the desired light and CO2 concentration, relative humidity and temperature. The Rd rate was determined according to the Laisk [55] method. The photorespiration rate for each PPFD value was determined as the difference between RT and Rd values. Error bars denote ± S.D. Asterisks indicate significantly different curves at p = 0.05 (Student’s t-test). Further experimental details in Materials and Methods.
Ijms 19 00877 g005
Figure 6. Changes in cauliflower leaf transpiration, stomatal conductance to water vapour and net CO2 assimilation rate at 400 μmol·m−2·s−1 illumination in control grown (K), cold-stressed (C), heat-stressed (H), cold-recovered (CA) and heat-recovered (HA) plants. All parameters were measured on 3-month-old plants with fully developed leaves with the application of an infrared gas analyser. Data were recorded after at least 2 h of illumination. During the experiment, each of the analysed leaves were placed into a 6-cm2 chamber of the analyser. Results were recorded after initial leaf acclimation to the desired light and CO2 concentration, relative humidity and temperature. Bars are means ± SD (n > 3) and asterisks indicate significant differences (p < 0.05; Student’s t-test) from the control (K). Further experimental details in Materials and Methods.
Ijms 19 00877 g006
Figure 7. Changes in cauliflower leaf chlorophyll content minimal (Fo), maximal (Fm) and variable (Fv) fluorescence and Fv/Fm ratio in control grown (K), cold-stressed (C), heat-stressed (H), cold-recovered (CA) and heat-recovered (HA) plants. Chlorophyll content measured with a chlorophyll meter was expressed in relative units. Chlorophyll fluorescence was measured using a portable fluorometer. Before measurement, leaves were dark adapted for 30 min. Photochemical efficiency of PSII could be estimated from the Fv/Fm ratio, where Fv is the difference between Fm and Fo. Bars are means ± SD (n > 3) and asterisks indicate significant differences (p < 0.05; Student’s t-test) from the control (K). Further experimental details in ‘Materials and Methods’.
Ijms 19 00877 g007
Figure 8. Proposed model of the impact of temperature stress and recovery on mitochondrial biogenesis in cauliflower curds. Investigated phenomena are depicted. Regulations in the cold and heat are shown by thin blue and red arrows; regulations in stress recovery by the respective thick blue and red arrows. Up-regulations and down-regulations are denoted by arrow heads raised up and down, respectively. Icons with a shield inside depict sustained physiological parameters or phenomena (left panel) or protective function of selected proteins in mitochondrial biogenesis (right panel). Left panel: stress dosage scheme and regulations in key physiological parameters. Right panel: Proteins and complex subunits regulated by abundance are yellow-marked. Some regulatory steps affected by stress conditions are highlighted by discontinuous lines and arrows. Important abbreviations: A, net photosynthetic rate; ATP1, ATPQ, ATP synthase subunits 1 and d; CCM, cytochrome c maturation; CPN, chaperonin; C(s), complex(es); COX, cytochrome c oxidase; CS, citrate synthase; cyt. c, cytochrome c; E, leaf transpiration; GCS, glycine cleavage system; GDC, glycine decarboxylase; gs, stomatal conductance; HSP(s), heat shock protein(s); IDH, isocitrate dehydrogenase; MDH, malate dehydrogenase; MPP, mitochondrial processing peptidase; mt, mitochondrial; NAD9, complex I subunit 9; P5CDH, 1-Δ-pyrroline-5-carboxylate dehydrogenase; PDH, pyruvate dehydrogenase; 3-PGDH, 3-phosphoglycerate dehydrogenase; PGK1, phosphoglycerate kinase isoform 1; PhR, photorespiration; ProDH(s), proline dehydrogenase(s); Rd, light respiration; Rn, dark respiration; RT, total light respiration; SCL, succinyl-CoA ligase; SHMT, serine hydroxymethyltransferase; TCA, tricarboxylic acid; VDAC, voltage-dependent anion channel. Further data in the text.
Ijms 19 00877 g008
Table 1. List of cauliflower mitochondrial proteins the level of which varied during stress treatments.
Spot No. aMean % Volume bAssignment; Species; FunCat cProtein Record VersionUniProt Accession No.AGI IdentifierNominalObservedMascot Score; emPAI dCoverage (%)Uniq. Peps; Tot. Peps e
KC; HCA; HAMpIMpI
10.53 ± 0.021.06 ± 0.08 (+2.00)0.68 ± 0.19 [+1.28]Mitochondrial heat shock protein 70-1; Arabidopsis; PrFCAB37531.1Q9SZJ3At4g3791071.45.31795.354732; 3.613353; 129
20.11 ± 0.010.21 ± 0.06 [+1.91]0.22 ± 0.03 (+2.00)Pyruvate dehydrogenase E1 beta subunit; Arabidopsis; CMNP_199898.1Q38799At5g5085039.45.67395.165484; 2.942973; 146
30.18 ± 0.010.40 ± 0.09 (+2.22)0.21 ± 0.01 (+1.17)3-phosphoglycerate dehydrogenase-like protein; Arabidopsis; AMNP_195146.1O49485At4g3420063.66.16725.437707; 1.4831112; 266
40.11 ± 0.010.15 ± 0.01 (+1.36)0.21 ± 0.03 (+1.91)Phosphoglycerate kinase 1; Arabidopsis; CMNP_187884.1Q9LD57At3g1278050.15.91435.20630; 1.44289; 26
50.15 ± 0.010.19 ± 0.04 (+1.27)0.29 ± 0.03 (+1.93)Malate dehydrogenase (NAD), mitochondrial; Arabidopsis: CMNP_564625.1Q9ZP06At1g5324036.08.54375.58409; 0.982210; 18
60.19 ± 0.020.37 ± 0.05 (+1.95)0.16 ± 0.03 (−1.18)Heat shock protein 81-2 (HSP 90 related); Arabidopsis; PrFNP_200414.1P55737At5g5603080.24.95845.20277; 0.43140; 12
70.16 ± 0.050.39 ± 0.09 (+2.44)0.13 ± 0.07 (−1.23)Heat shock protein 90; Arabidopsis; PrFBAF00175.1Q0WRS4At3g0777090.85.26895.061996; 1.111915; 75
80.17 ± 0.020.64 ± 0.19 (+3.76)0.48 ± 0.07 (+2.82)3-phosphoglycerate dehydrogenase-like protein; Arabidopsis; AMNP_195146.1O49485At4g3420063.66.16735.566778; 1.743088; 237
90.25 ± 0.030.72 ± 0.31 (+2.88)0.72 ± 0.16 (+2.88)3-phosphoglycerate dehydrogenase-like protein; Arabidopsis; AMNP_195146.1O49485At4g3420063.66.16745.497997; 1.3627111; 301
100.05 ± 0.030.06 ± 0.01 (+1.20)0.19 ± 0.04 (+3.80)Phosphoglycerate kinase 1; Arabidopsis; CMNP_187884.1Q9LD57At3g1278050.25.91815.501376; 2.574222; 53
110.14 ± 0.080.12 ± 0.11 (−1.17)1.29 ± 0.25 (+9.21)Putative succinyl-CoA ligase (GDP-forming) beta subunit, mitochondrial; Arabidopsis; CMNP_179632.1O82662At2g2042045.66.30415.15265; 0.881711; 11
120.56 ± 0.150.32 ± 0.17 (−1.75)0.11 ± 0.02 (−5.09)Putative mitochondrial processing peptidase; Arabidopsis; PrFBAE98412.1Q42290At3g0209051.55.71805.79833; 1.382617; 42
130.36 ± 0.140.47 ± 0.09 (+1.30)0.19 ± 0.04 (−1.89)ATPase subunit 1; Brassica napus; RCYP_717155.1Q6YSN4AtMg0119055.46.01586.073195; 1.122376; 168
140.35 ± 0.140.22 ± 0.04 (−1.59)0.08 ± 0.03 (−4.37)Δ-1-pyrroline-5-carboxylate dehydrogenase precursor; Arabidopsis; AMAAK73756.1Q8VZC3At5g6253062.26.26706.24784; 0.67183; 41
150.54 ± 0.060.33 ± 0.06 (−1.64)0.09 ± 0.01 (−6.00)Δ-1-pyrroline-5-carboxylate dehydrogenase precursor; Arabidopsis; AMAAK73756.1Q8VZC3At5g6253062.26.26696.331622; 0.95210; 78
160.60 ± 0.140.77 ± 0.11 (+1.28)0.31 ± 0.05 (−1.93)Mitochondrial elongation factor Tu; Arabidopsis; PrSCAA61511.1Q9ZT91At4g0293051.65.53426.003123; 2.453724; 100
170.31 ± 0.080.42 ± 0.07 (+1.35)0.18 ± 0.04 (−1.72)Mitochondrial elongation factor Tu; Arabidopsis; PrSCAA61511.1Q9ZT91At4g0293051.65.53426.192502; 2.053335; 77
180.58 ± 0.150.52 ± 0.07 (−1.11)0.14 ± 0.02 (−4.14)Isocitrate dehydrogenase-like protein; Arabidopsis; CMCAB87626.1Q9LYK1At5g1459052.37.11456.37697; 0.962314; 23
190.26 ± 0.060.17 ± 0.03 (−1.53)0.11 ± 0.01 (−2.36)Citrate synthase (SI); Arabidopsis; CMNP_850415.1P20115At2g4435053.16.41486.57999; 0.621834; 40
200.40 ± 0.090.23 ± 0.07 (−1.74)0.15 ± 0.01 (−2.67)Citrate synthase (SI); Arabidopsis: CMNP_850415.1P20115At2g4435053.16.41476.832126; 0.832151; 84
210.08 ± 0.060.16 ± 0.08 (+2.00)0.61 ± 0.08 (+7.62)10 kDa chaperonin; Arabidopsis; PrFNP_563961.1P34893At1g1498010.86.74199.38107; 1.30318; 8
22LAf0.80 ± 0.200.53 ± 0.01ATP synthase, d chain, mitochondrial; Arabidopsis; RCNP_190798.1Q9FT52At3g5230019.65.09204.59979; 1.602518; 39
For each spot, values for nominal (computed) and observed isoelectric point (pI) and molecular mass (M, in kDa) and the mean normalized volume at each of analysed stress and control variants were indicated; a Spot number as index in the reference gel; b Mean value with the standard deviation of three spot volumes at each analysed stage: control (K), cold stress (C; spots 1–7), heat stress (H; spots 8–22), cold recovery (CA; spots no. 1–7), heat recovery (HA; spots 8–22). In parentheses, the fold change of mean value for stress variants, compared to control. Up-regulations are indicated by + and down-regulations by −. Significant regulations (according to HSD test) are bolded and underlined; the ones for cold, cold recovery, heat and heat recovery are shown in blue, green, red and brown highlights, respectively; c In bold: functional categorisation (FunCat) using data from FunCat scheme (Available online: http://ibis.helmholtz-muenchen.de/funcatDB/). Two-letter legend to all categories: CM—carbohydrate metabolism, PrF—protein fate, AM—amino-acid metabolism, RC—respiration (respiratory chain components), PrS—protein synthesis; d Exponentially modified protein abundance index; e Uniq. peps; tot. peps-number of unique peptides; number of total peptides for each protein spot; f LA—low-abundant protein (with the % volume of circa 0.01); in this case the calculation of the fold change was not applicable. Further experimental details in Materials and Methods.

