Current Challenges in Plant Eco-Metabolomics

 , , , , , , , , , , ,
  and
and 
Abstract
:1. Introduction
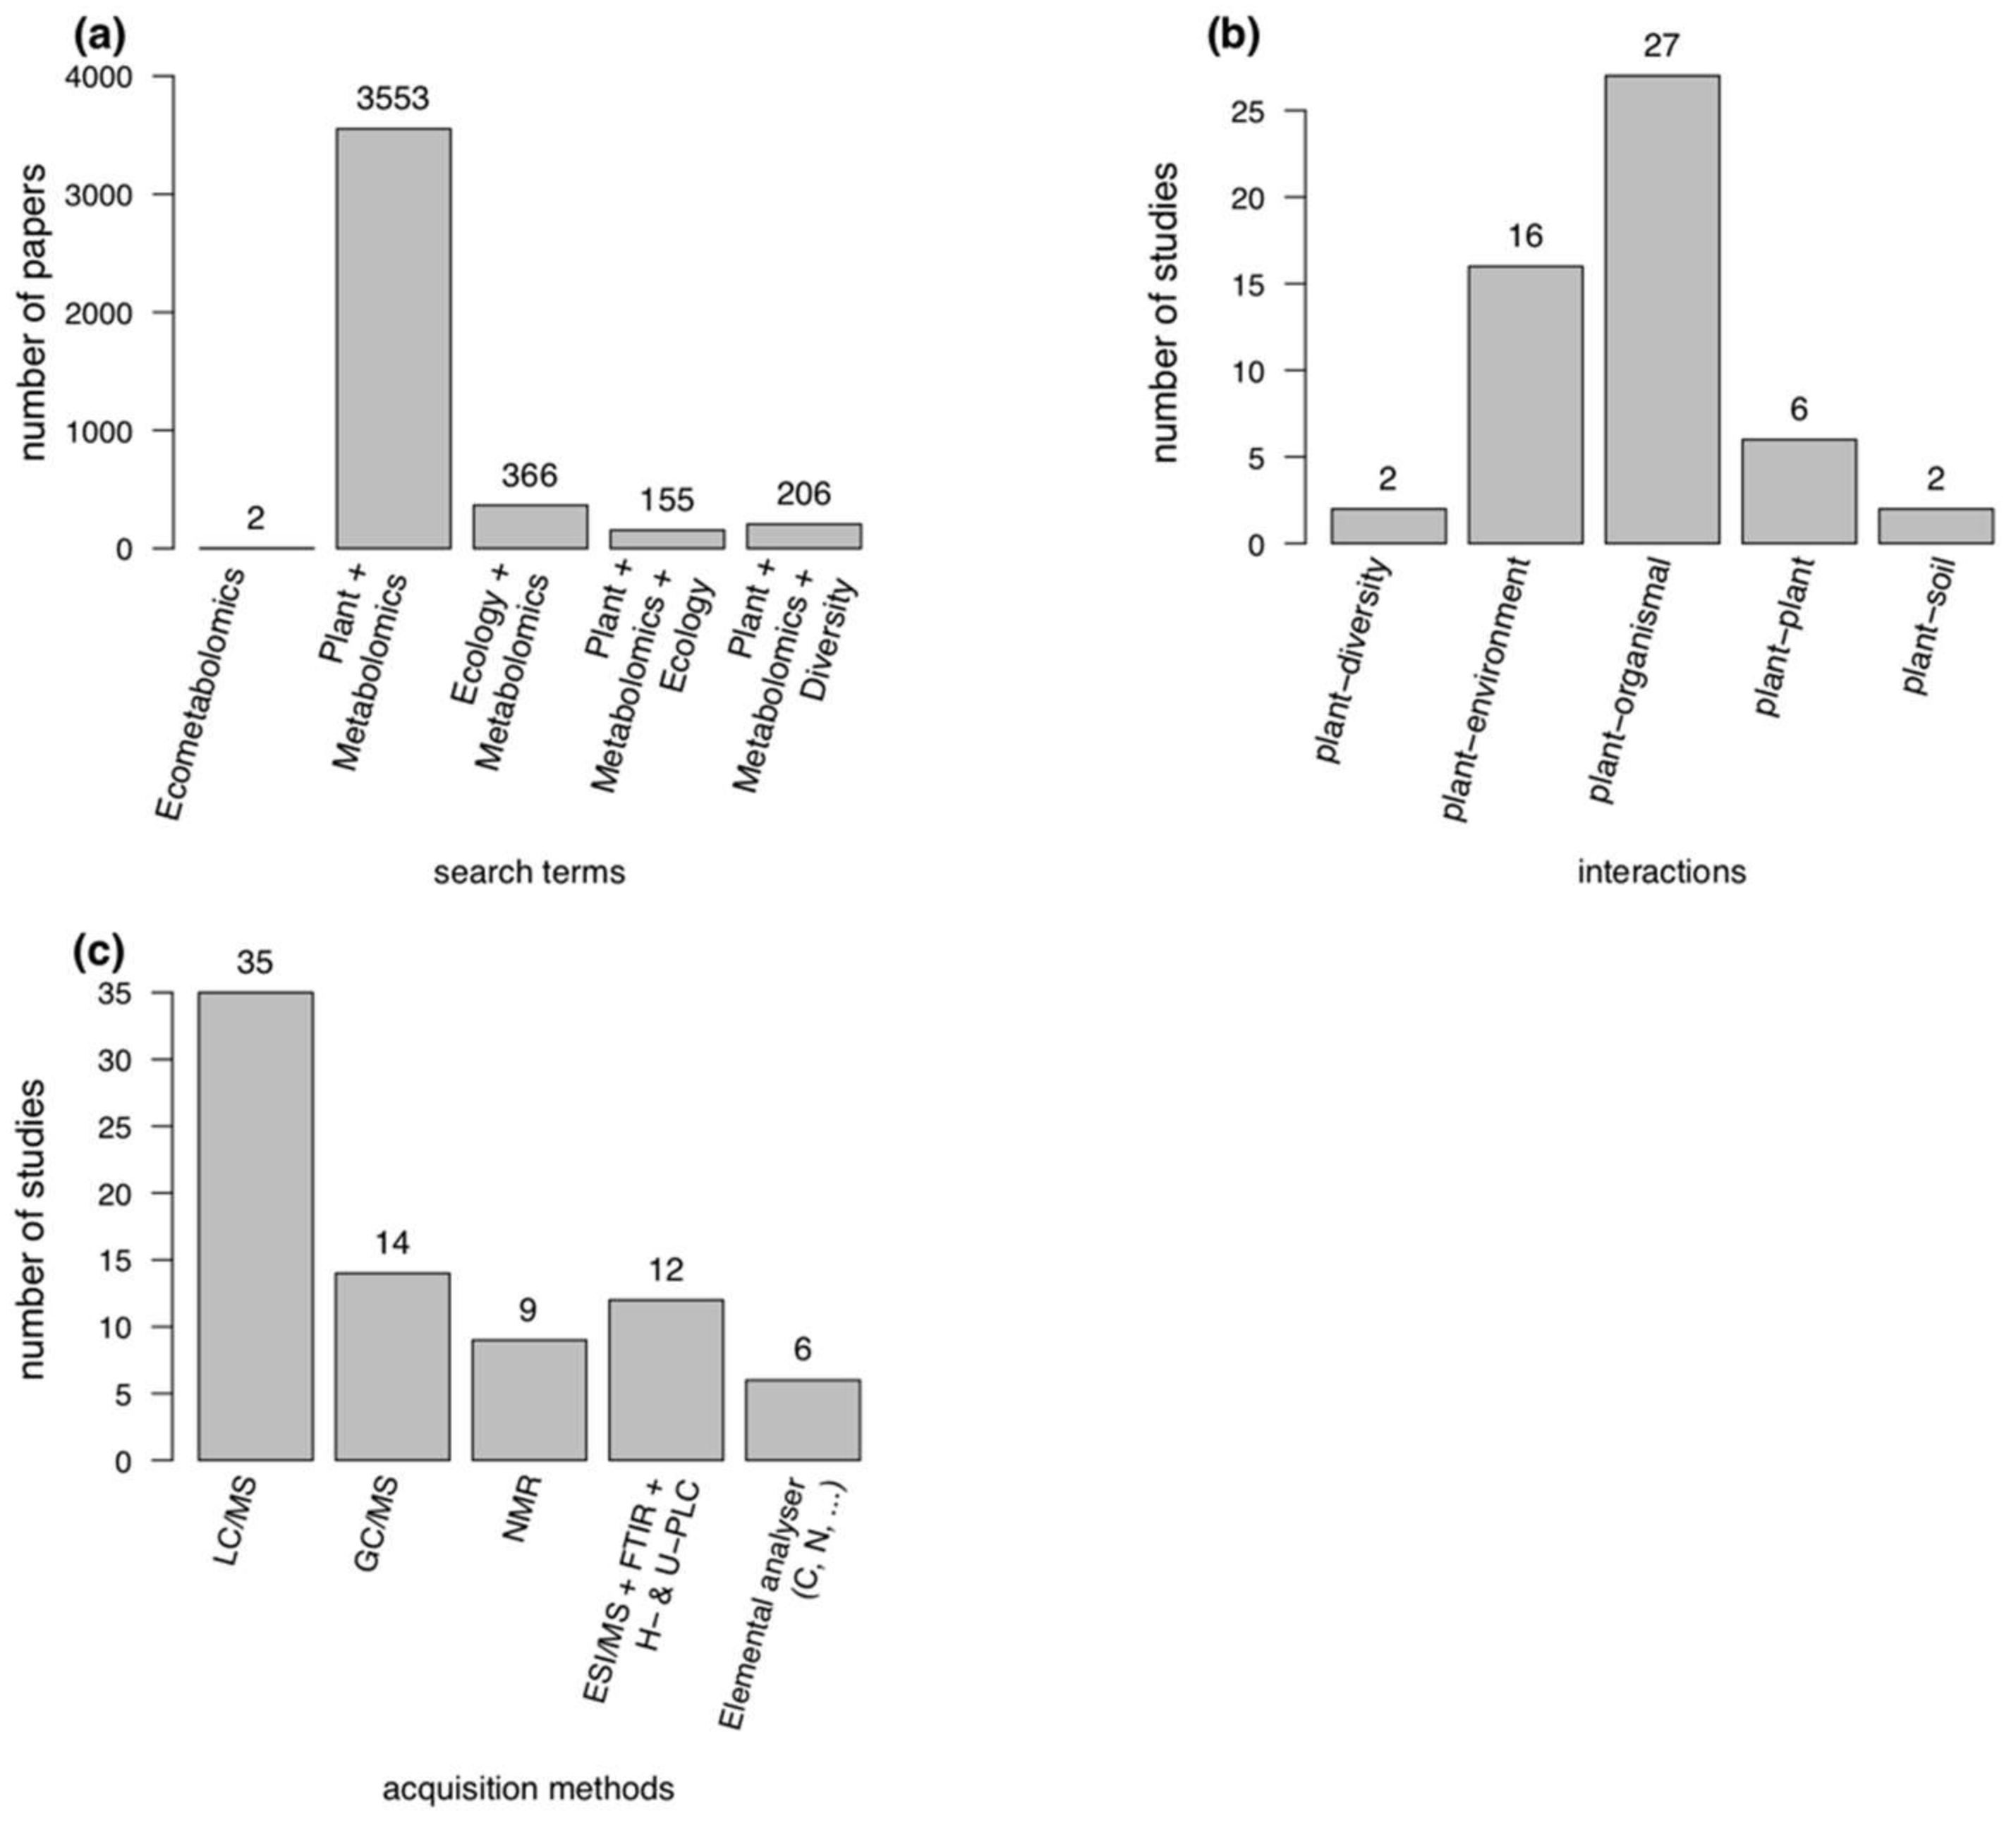
2. What Is Eco-Metabolomics?
3. Current Research
4. Bridging the Gap between Biochemistry and Ecology
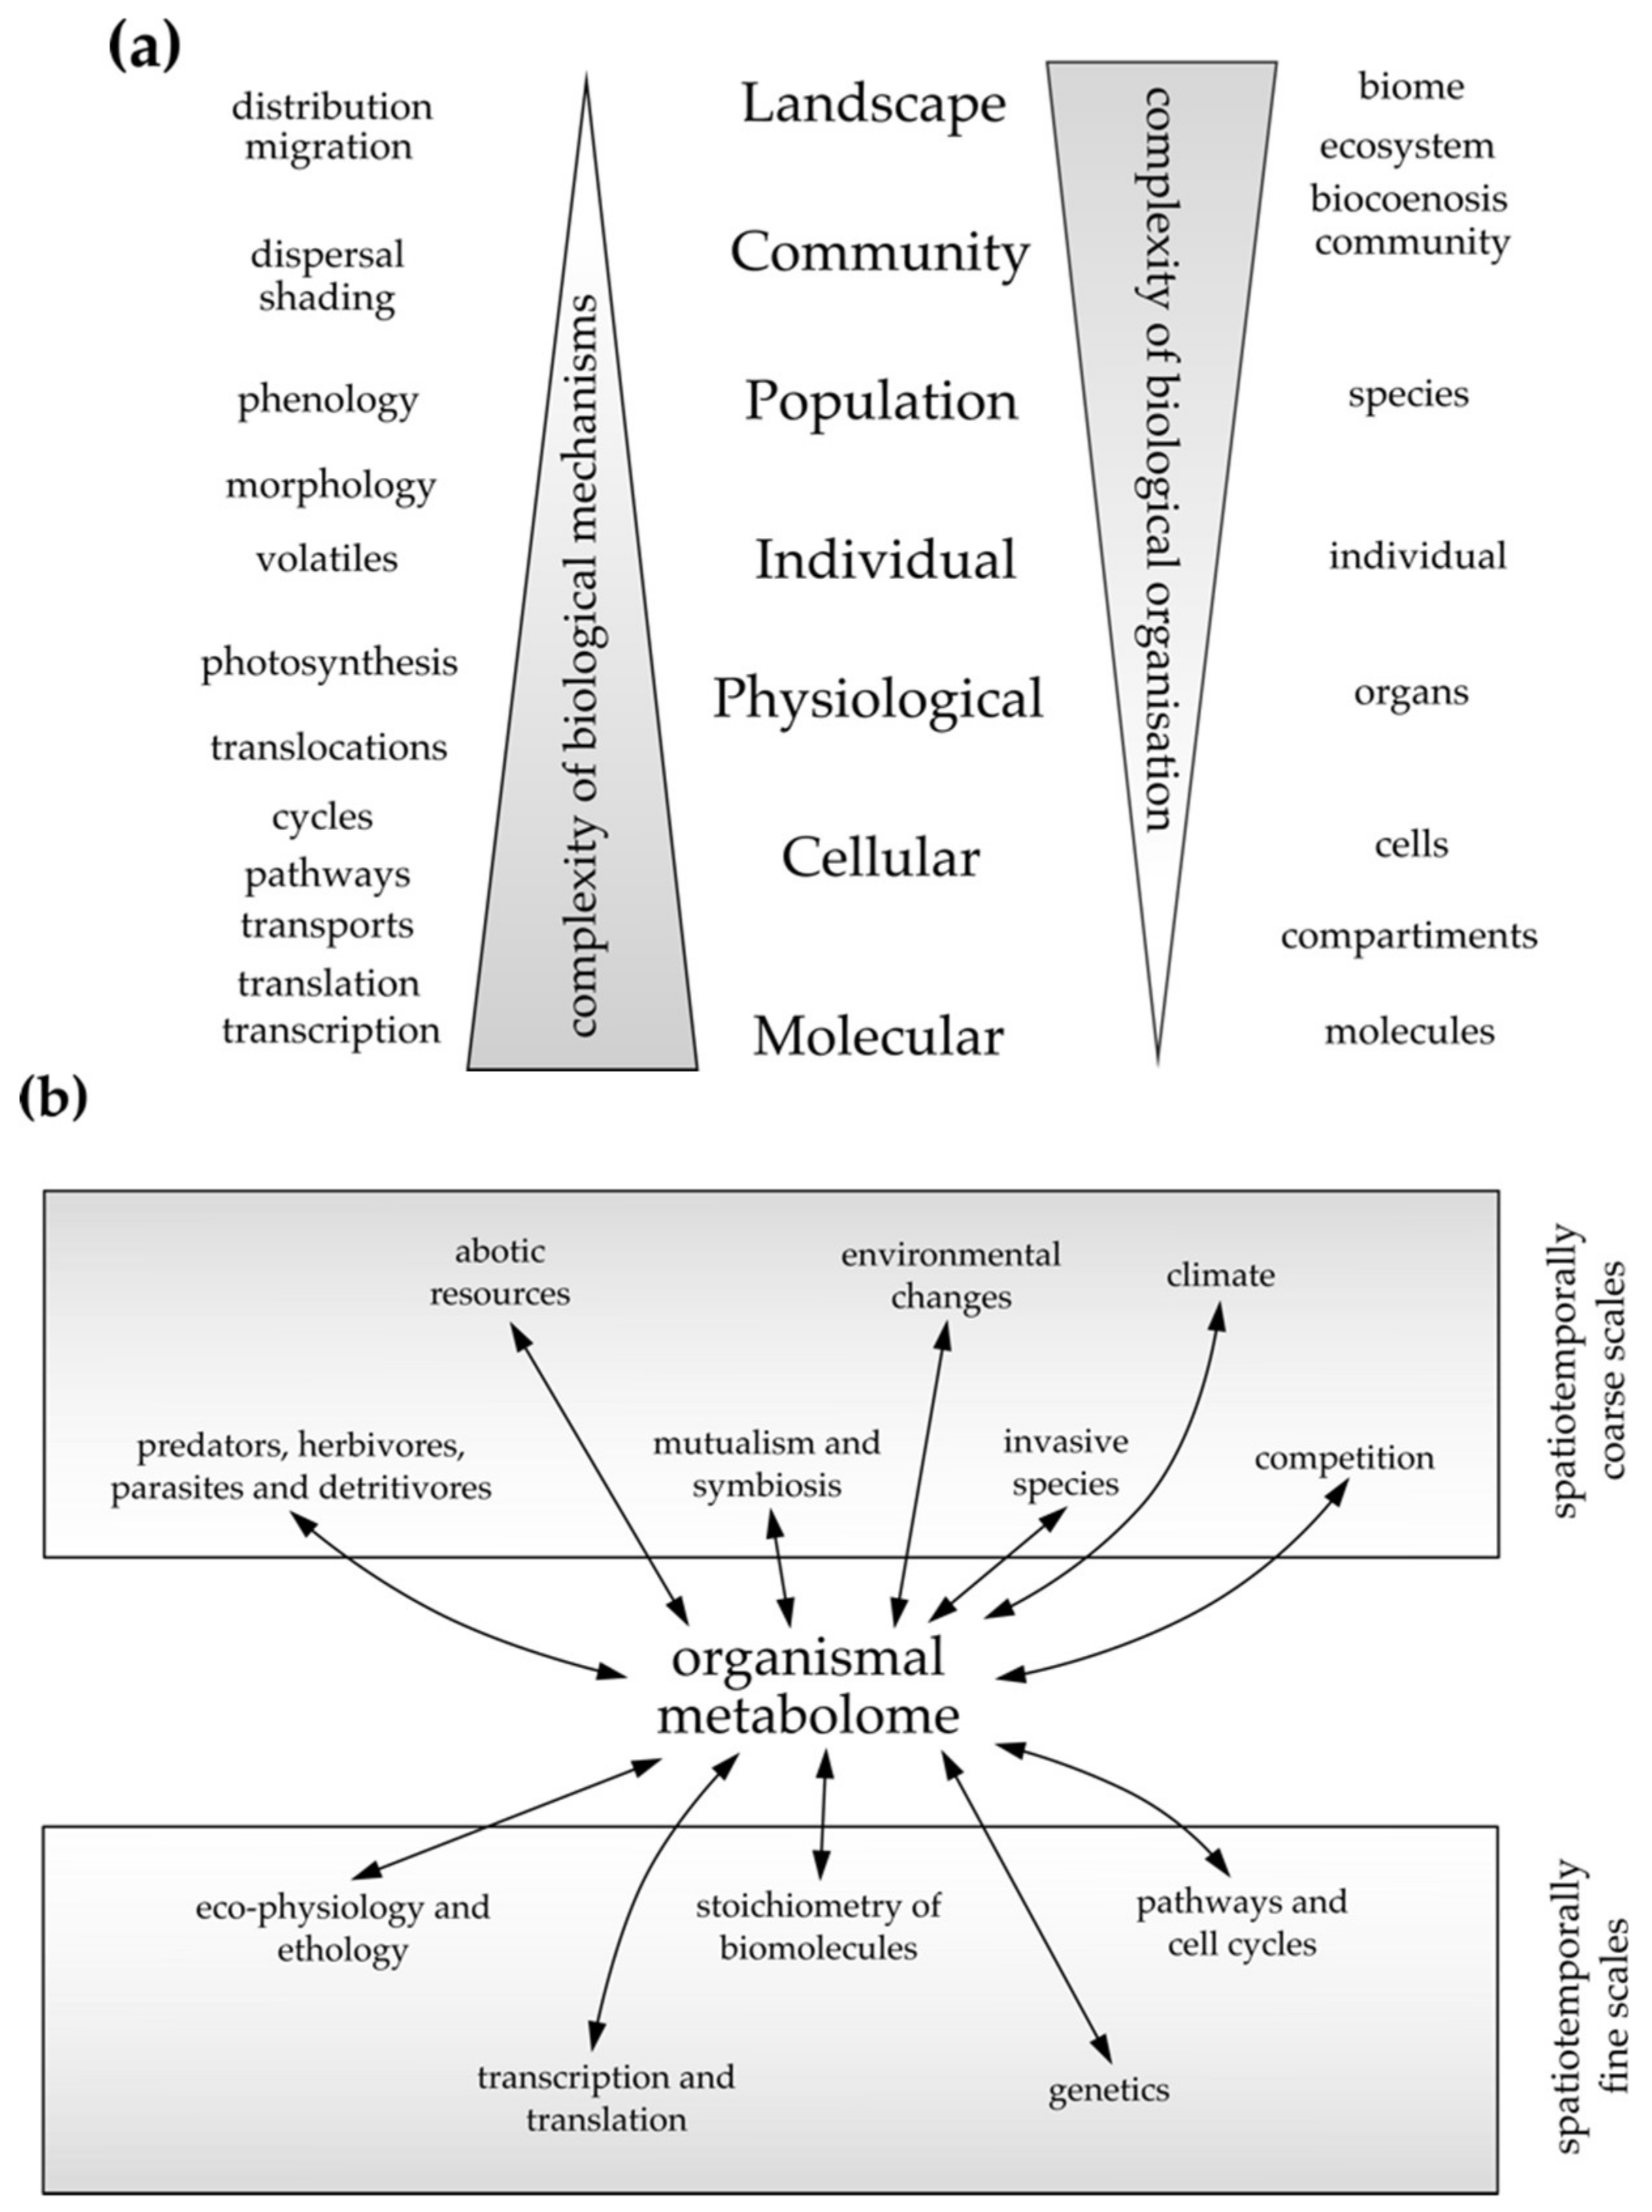
4.1. The Bottom-Up Approach, Inferring from Cellular to Individual Spatiotemporal Scales
4.2. The Top-Down Approach, Inferring from Coarse to Fine Spatiotemporal Scales
5. Current Challenges
5.1. Complex Experimental Designs and Large Variation of Metabolite Profiles
5.2. Feature Extraction
5.3. Metabolite Identification
5.4. Statistical Analyses
5.5. Bioinformatics Software Tools and Workflows
6. Possible Limitations in Eco-Metabolomics
7. Future Directions in Eco-Metabolomics
Author Contributions
Acknowledgments
Conflicts of Interest
References
- Fiehn, O. Metabolomics—The link between genotypes and phenotypes. Plant Mol. Biol. 2002, 48, 155–171. [Google Scholar] [CrossRef] [PubMed]
- Johnson, C.H.; Ivanisevic, J.; Siuzdak, G. Metabolomics: Beyond biomarkers and towards mechanisms. Nat. Rev. Mol. Cell Biol. 2016, 17, 451. [Google Scholar] [CrossRef] [PubMed]
- Kücklich, M.; Möller, M.; Marcillo, A.; Einspanier, A.; Weiß, B.M.; Birkemeyer, C.; Widdig, A. Different methods for volatile sampling in mammals. PLoS ONE 2017, 12, e0183440. [Google Scholar] [CrossRef] [PubMed]
- Weiß, B.M.; Marcillo, A.; Manser, M.; Holland, R.; Birkemeyer, C.; Widdig, A. A non-invasive method for sampling the body odour of mammals. Methods Ecol. Evol. 2018, 9, 420–429. [Google Scholar] [CrossRef]
- Hernández, F.; Sancho, J.V.; Ibáñez, M.; Abad, E.; Portolés, T.; Mattioli, L. Current use of high-resolution mass spectrometry in the environmental sciences. Anal. Bioanal. Chem. 2012, 403, 1251–1264. [Google Scholar] [CrossRef] [PubMed]
- Roessner, U.; Dias, D.A. (Eds.) Metabolomics Tools for Natural Product Discovery; Methods in Molecular Biology; Humana Press: Totowa, NJ, USA, 2013; Volume 1055, ISBN 978-1-62703-576-7. [Google Scholar]
- Viant, M.R.; Sommer, U. Mass spectrometry based environmental metabolomics: A primer and review. Metabolomics 2013, 9, 144–158. [Google Scholar] [CrossRef]
- Van Dam, N.M.; van der Meijden, E. A Role for Metabolomics in Plant Ecology. In Annual Plant Reviews; Hall, R.D., Ed.; Wiley-Blackwell: Oxford, UK, 2011; Volume 43, pp. 87–107. ISBN 978-1-4443-3995-6. [Google Scholar]
- Webster, B.; Bruce, T.; Dufour, S.; Birkemeyer, C.; Birkett, M.; Hardie, J.; Pickett, J. Identification of Volatile Compounds Used in Host Location by the Black Bean Aphid, Aphis fabae. J. Chem. Ecol. 2008, 34, 1153–1161. [Google Scholar] [CrossRef] [PubMed]
- Bundy, J.G.; Davey, M.P.; Viant, M.R. Environmental metabolomics: A critical review and future perspectives. Metabolomics 2009, 5, 3–21. [Google Scholar] [CrossRef]
- Viant, M.R. Applications of metabolomics to the environmental sciences. Metabolomics 2009, 5, 1–2. [Google Scholar] [CrossRef]
- Peñuelas, J.; Sardans, J. Ecological metabolomics. Chem. Ecol. 2009, 25, 305–309. [Google Scholar] [CrossRef]
- Frolov, A.; Bilova, T.; Paudel, G.; Berger, R.; Balcke, G.U.; Birkemeyer, C.; Wessjohann, L.A. Early responses of mature Arabidopsis thaliana plants to reduced water potential in the agar-based polyethylene glycol infusion drought model. J. Plant Physiol. 2017, 208, 70–83. [Google Scholar] [CrossRef] [PubMed]
- Sardans, J.; Peñuelas, J.; Rivas-Ubach, A. Ecological metabolomics: Overview of current developments and future challenges. Chemoecology 2011, 21, 191–225. [Google Scholar] [CrossRef]
- Saito, K.; Matsuda, F. Metabolomics for Functional Genomics, Systems Biology, and Biotechnology. Annu. Rev. Plant Biol. 2010, 61, 463–489. [Google Scholar] [CrossRef] [PubMed]
- Wink, M. Introduction: Biochemistry, Physiology and Ecological Functions of Secondary Metabolites. In Biochemistry of Plant Secondary Metabolism; Wink, M., Ed.; Wiley-Blackwell: Oxford, UK, 2010; pp. 1–19. ISBN 978-1-4443-2050-3. [Google Scholar]
- Raguso, R.A.; Agrawal, A.A.; Douglas, A.E.; Jander, G.; Kessler, A.; Poveda, K.; Thaler, J.S. The raison d’être of chemical ecology. Ecology 2015, 96, 617–630. [Google Scholar] [CrossRef] [PubMed]
- Viant, M.R.; Kurland, I.J.; Jones, M.R.; Dunn, W.B. How close are we to complete annotation of metabolomes? Curr. Opin. Chem. Biol. 2017, 36, 64–69. [Google Scholar] [CrossRef] [PubMed]
- Ivanišević, J.; Thomas, O.P.; Lejeusne, C.; Chevaldonné, P.; Pérez, T. Metabolic fingerprinting as an indicator of biodiversity: Towards understanding inter-specific relationships among Homoscleromorpha sponges. Metabolomics 2011, 7, 289–304. [Google Scholar] [CrossRef]
- Pimenta, L.P.S.; Kim, H.K.; Verpoorte, R.; Choi, Y.H. NMR-Based Metabolomics: A Probe to Utilize Biodiversity. In Metabolomics Tools for Natural Product Discovery; Roessner, U., Dias, D.A., Eds.; Humana Press: Totowa, NJ, USA, 2013; Volume 1055, pp. 117–127. ISBN 978-1-62703-576-7. [Google Scholar]
- Tarakhovskaya, E.; Lemesheva, V.; Bilova, T.; Birkemeyer, C. Early Embryogenesis of Brown Alga Fucus vesiculosus L. is Characterized by Significant Changes in Carbon and Energy Metabolism. Molecules 2017, 22, 1509. [Google Scholar] [CrossRef] [PubMed]
- Roscher, C.; Schumacher, J.; Baade, J.; Wilcke, W.; Gleixner, G.; Weisser, W.W.; Schmid, B.; Schulze, E.-D. The role of biodiversity for element cycling and trophic interactions: An experimental approach in a grassland community. Basic Appl. Ecol. 2004, 5, 107–121. [Google Scholar] [CrossRef]
- Spehn, E.M.; Hector, A.; Joshi, J.; Scherer-Lorenzen, M.; Schmid, B.; Bazeley-White, E.; Beierkuhnlein, C.; Caldeira, M.C.; Diemer, M.; Dimitrakopoulos, P.G. Ecosystem effects of biodiversity manipulations in European grasslands. Ecol. Monogr. 2005, 75, 37–63. [Google Scholar] [CrossRef] [Green Version]
- Cadotte, M.W.; Cavender-Bares, J.; Tilman, D.; Oakley, T.H. Using Phylogenetic, Functional and Trait Diversity to Understand Patterns of Plant Community Productivity. PLoS ONE 2009, 4, e5695. [Google Scholar] [CrossRef] [PubMed]
- Bruelheide, H.; Nadrowski, K.; Assmann, T.; Bauhus, J.; Both, S.; Buscot, F.; Chen, X.-Y.; Ding, B.; Durka, W.; Erfmeier, A.; et al. Designing forest biodiversity experiments: General considerations illustrated by a new large experiment in subtropical China. Methods Ecol. Evol. 2014, 5, 74–89. [Google Scholar] [CrossRef]
- Anderson-Teixeira, K.J.; Davies, S.J.; Bennett, A.C.; Gonzalez-Akre, E.B.; Muller-Landau, H.C.; Joseph Wright, S.; Abu Salim, K.; Almeyda Zambrano, A.M.; Alonso, A.; Baltzer, J.L.; et al. CTFS-ForestGEO: A worldwide network monitoring forests in an era of global change. Glob. Chang. Biol. 2015, 21, 528–549. [Google Scholar] [CrossRef] [PubMed] [Green Version]
- Tilman, D.; Reich, P.B.; Knops, J.M.H. Biodiversity and ecosystem stability in a decade-long grassland experiment. Nature 2006, 441, 629–632. [Google Scholar] [CrossRef] [PubMed]
- Goodman, K.J.; Parker, S.M.; Edmonds, J.W.; Zeglin, L.H. Expanding the scale of aquatic sciences: The role of the National Ecological Observatory Network (NEON). Freshw. Sci. 2015, 34, 377–385. [Google Scholar] [CrossRef]
- Haase, P.; Frenzel, M.; Klotz, S.; Musche, M.; Stoll, S. The long-term ecological research (LTER) network: Relevance, current status, future perspective and examples from marine, freshwater and terrestrial long-term observation. Ecol. Indic. 2016, 65, 1–3. [Google Scholar] [CrossRef]
- Swallow, S.; Liu, P. Analyzing scientists’ donations to measure their values for the Nutrient Network (NutNet). Glob. Ecol. Conserv. 2017, 12, 73–79. [Google Scholar] [CrossRef]
- Tautenhahn, R.; Bottcher, C.; Neumann, S. Highly sensitive feature detection for high resolution LC/MS. BMC Bioinform. 2008, 9, 504. [Google Scholar] [CrossRef] [PubMed]
- Sumner, L.W.; Mendes, P.; Dixon, R.A. Plant metabolomics: Large-scale phytochemistry in the functional genomics era. Phytochemistry 2003, 62, 817–836. [Google Scholar] [CrossRef]
- Meier, R.; Ruttkies, C.; Treutler, H.; Neumann, S. Bioinformatics can boost metabolomics research. J. Biotechnol. 2017, 261, 137–141. [Google Scholar] [CrossRef] [PubMed]
- Hall, R.D. (Ed.) Biology of Plant Metabolomics; Annual Plant Reviews; Wiley-Blackwell: Oxford, UK, 2011; ISBN 978-1-4051-9954-4. [Google Scholar]
- Scherling, C.; Roscher, C.; Giavalisco, P.; Schulze, E.-D.; Weckwerth, W. Metabolomics Unravel Contrasting Effects of Biodiversity on the Performance of Individual Plant Species. PLoS ONE 2010, 5, e12569. [Google Scholar] [CrossRef] [PubMed]
- Zuppinger-Dingley, D.; Flynn, D.F.B.; Brandl, H.; Schmid, B. Selection in monoculture vs. mixture alters plant metabolic fingerprints. J. Plant Ecol. 2015, 8, 549–557. [Google Scholar] [CrossRef]
- Bhat, H.A.; Kaur, T.; Bhat, R.; Vyas, D. Physiological and biochemical plasticity of Lepidium latifolium as ‘sleeper weed’ in Western Himalayas. Physiol. Plant. 2016, 156, 278–293. [Google Scholar] [CrossRef] [PubMed]
- Field, K.J.; Lake, J.A. Environmental metabolomics links genotype to phenotype and predicts genotype abundance in wild plant populations. Physiol. Plant. 2011, 142, 352–360. [Google Scholar] [CrossRef] [PubMed]
- Hennion, F.; Bouchereau, A.; Gauthier, C.; Hermant, M.; Vernon, P.; Prinzing, A. Variation in amine composition in plant species: How it integrates macroevolutionary and environmental signals. Am. J. Bot. 2012, 99, 36–45. [Google Scholar] [CrossRef] [PubMed]
- Macel, M.; de Vos, R.C.H.; Jansen, J.J.; van der Putten, W.H.; van Dam, N.M. Novel chemistry of invasive plants: Exotic species have more unique metabolomic profiles than native congeners. Ecol. Evol. 2014, 4, 2777–2786. [Google Scholar] [CrossRef] [PubMed] [Green Version]
- Peters, K.; Gorzolka, K.; Bruelheide, H.; Neumann, S. Seasonal variation of secondary metabolites in nine different bryophytes. Ecol. Evol. 2018. submitted. [Google Scholar]
- Riedl, J.; Kluender, C.; Sans-Piché, F.; Heilmeier, H.; Altenburger, R.; Schmitt-Jansen, M. Spatial and temporal variation in metabolic fingerprints of field-growing Myriophyllum spicatum. Aquat. Bot. 2012, 102, 34–43. [Google Scholar] [CrossRef]
- Ristok, C.; Leppert, K.N.; Franke, K.; Scherer-Lorenzen, M.; Niklaus, P.A.; Wessjohann, L.A.; Bruelheide, H. Leaf litter diversity positively affects the decomposition of plant polyphenols. Plant Soil 2017, 419, 305–317. [Google Scholar] [CrossRef]
- Rivas-Ubach, A.; Sardans, J.; Perez-Trujillo, M.; Estiarte, M.; Penuelas, J. Strong relationship between elemental stoichiometry and metabolome in plants. Proc. Natl. Acad. Sci. USA 2012, 109, 4181–4186. [Google Scholar] [CrossRef] [PubMed]
- Rivas-Ubach, A.; Gargallo-Garriga, A.; Sardans, J.; Oravec, M.; Mateu-Castell, L.; Pérez-Trujillo, M.; Parella, T.; Ogaya, R.; Urban, O.; Peñuelas, J. Drought enhances folivory by shifting foliar metabolomes in Quercus ilex trees. New Phytol. 2014, 202, 874–885. [Google Scholar] [CrossRef] [PubMed]
- Wiggins, N.L.; Forrister, D.L.; Endara, M.-J.; Coley, P.D.; Kursar, T.A. Quantitative and qualitative shifts in defensive metabolites define chemical defense investment during leaf development in Inga, a genus of tropical trees. Ecol. Evol. 2016, 6, 478–492. [Google Scholar] [CrossRef] [PubMed]
- Tewes, L.J.; Michling, F.; Koch, M.A.; Müller, C. Intracontinental plant invader shows matching genetic and chemical profiles and might benefit from high defence variation within populations. J. Ecol. 2018, 106, 714–726. [Google Scholar] [CrossRef]
- Endara, M.-J.; Weinhold, A.; Cox, J.E.; Wiggins, N.L.; Coley, P.D.; Kursar, T.A. Divergent evolution in antiherbivore defences within species complexes at a single Amazonian site. J. Ecol. 2015, 103, 1107–1118. [Google Scholar] [CrossRef]
- Fortuna, T.M.; Eckert, S.; Harvey, J.A.; Vet, L.E.M.; Müller, C.; Gols, R. Variation in plant defences among populations of a range-expanding plant: Consequences for trophic interactions. New Phytol. 2014, 204, 989–999. [Google Scholar] [CrossRef] [PubMed]
- Kursar, T.A.; Dexter, K.G.; Lokvam, J.; Pennington, R.T.; Richardson, J.E.; Weber, M.G.; Murakami, E.T.; Drake, C.; McGregor, R.; Coley, P.D. The evolution of antiherbivore defenses and their contribution to species coexistence in the tropical tree genus Inga. Proc. Natl. Acad. Sci. USA 2009, 106, 18073–18078. [Google Scholar] [CrossRef] [PubMed]
- Kuzina, V.; Ekstrom, C.T.; Andersen, S.B.; Nielsen, J.K.; Olsen, C.E.; Bak, S. Identification of Defense Compounds in Barbarea vulgaris against the Herbivore Phyllotreta nemorum by an Ecometabolomic Approach. Plant Physiol. 2009, 151, 1977–1990. [Google Scholar] [CrossRef] [PubMed]
- Leiss, K.A.; Cristofori, G.; van Steenis, R.; Verpoorte, R.; Klinkhamer, P.G.L. An eco-metabolomic study of host plant resistance to Western flower thrips in cultivated, biofortified and wild carrots. Phytochemistry 2013, 93, 63–70. [Google Scholar] [CrossRef] [PubMed]
- Rivas-Ubach, A.; Sardans, J.; Hódar, J.A.; Garcia-Porta, J.; Guenther, A.; Oravec, M.; Urban, O.; Peñuelas, J. Similar local, but different systemic, metabolomic responses of closely related pine subspecies to folivory by caterpillars of the processionary moth. Plant Biol. 2016, 18, 484–494. [Google Scholar] [CrossRef] [PubMed]
- Rivas-Ubach, A.; Hódar, J.A.; Sardans, J.; Kyle, J.E.; Kim, Y.-M.; Oravec, M.; Urban, O.; Guenther, A.; Peñuelas, J. Are the metabolomic responses to folivory of closely related plant species linked to macroevolutionary and plant-folivore coevolutionary processes? Ecol. Evol. 2016, 6, 4372–4386. [Google Scholar] [CrossRef] [PubMed]
- Rivas-Ubach, A.; Sardans, J.; Hódar, J.A.; Garcia-Porta, J.; Guenther, A.; Paša-Tolić, L.; Oravec, M.; Urban, O.; Peñuelas, J. Close and distant: Contrasting the metabolism of two closely related subspecies of Scots pine under the effects of folivory and summer drought. Ecol. Evol. 2017, 7, 8976–8988. [Google Scholar] [CrossRef] [PubMed]
- Sedio, B.E.; Rojas Echeverri, J.C.; Boya, P.; Cristopher, A.; Wright, S.J. Sources of variation in foliar secondary chemistry in a tropical forest tree community. Ecology 2017, 98, 616–623. [Google Scholar] [CrossRef] [PubMed]
- Gaillard, M.D.P.; Glauser, G.; Robert, C.A.M.; Turlings, T.C.J. Fine-tuning the ‘plant domestication-reduced defense’ hypothesis: Specialist vs generalist herbivores. New Phytol. 2018, 217, 355–366. [Google Scholar] [CrossRef] [PubMed]
- Li, D.; Baldwin, I.T.; Gaquerel, E. Navigating natural variation in herbivory-induced secondary metabolism in coyote tobacco populations using MS/MS structural analysis. Proc. Natl. Acad. Sci. USA 2015, 112, E4147–E4155. [Google Scholar] [CrossRef] [PubMed]
- Richards, L.A.; Dyer, L.A.; Forister, M.L.; Smilanich, A.M.; Dodson, C.D.; Leonard, M.D.; Jeffrey, C.S. Phytochemical diversity drives plant–insect community diversity. Proc. Natl. Acad. Sci. USA 2015, 112, 10973–10978. [Google Scholar] [CrossRef] [PubMed]
- Fernandez, C.; Monnier, Y.; Santonja, M.; Gallet, C.; Weston, L.A.; Prévosto, B.; Saunier, A.; Baldy, V.; Bousquet-Mélou, A. The Impact of Competition and Allelopathy on the Trade-Off between Plant Defense and Growth in Two Contrasting Tree Species. Front. Plant Sci. 2016, 7. [Google Scholar] [CrossRef] [PubMed]
- Miehe-Steier, A.; Roscher, C.; Reichelt, M.; Gershenzon, J.; Unsicker, S.B. Light and Nutrient Dependent Responses in Secondary Metabolites of Plantago lanceolata Offspring Are Due to Phenotypic Plasticity in Experimental Grasslands. PLoS ONE 2015, 10, e0136073. [Google Scholar] [CrossRef] [PubMed]
- Poulson-Ellestad, K.L.; Jones, C.M.; Roy, J.; Viant, M.R.; Fernández, F.M.; Kubanek, J.; Nunn, B.L. Metabolomics and proteomics reveal impacts of chemically mediated competition on marine plankton. Proc. Natl. Acad. Sci. USA 2014, 111, 9009–9014. [Google Scholar] [CrossRef] [PubMed]
- Dötterl, S.; Jahreiß, K.; Jhumur, U.S.; Jürgens, A. Temporal variation of flower scent in Silene otites (Caryophyllaceae): A species with a mixed pollination system: Temporal variation of flower scent. Bot. J. Linn. Soc. 2012, 169, 447–460. [Google Scholar] [CrossRef]
- Gargallo-Garriga, A.; Sardans, J.; Pérez-Trujillo, M.; Oravec, M.; Urban, O.; Jentsch, A.; Kreyling, J.; Beierkuhnlein, C.; Parella, T.; Peñuelas, J. Warming differentially influences the effects of drought on stoichiometry and metabolomics in shoots and roots. New Phytol. 2015, 207, 591–603. [Google Scholar] [CrossRef] [PubMed]
- Gargallo-Garriga, A.; Sardans, J.; Pérez-Trujillo, M.; Guenther, A.; Llusià, J.; Rico, L.; Terradas, J.; Farré-Armengol, G.; Filella, I.; Parella, T.; et al. Shifts in plant foliar and floral metabolomes in response to the suppression of the associated microbiota. BMC Plant Biol. 2016, 16. [Google Scholar] [CrossRef] [PubMed]
- Du, B.; Jansen, K.; Kleiber, A.; Eiblmeier, M.; Kammerer, B.; Ensminger, I.; Gessler, A.; Rennenberg, H.; Kreuzwieser, J. A coastal and an interior Douglas fir provenance exhibit different metabolic strategies to deal with drought stress. Tree Physiol. 2015, tpv105. [Google Scholar] [CrossRef] [PubMed]
- Hirth, M.; Liverani, S.; Mahlow, S.; Bouget, F.-Y.; Pohnert, G.; Sasso, S. Metabolic profiling identifies trehalose as an abundant and diurnally fluctuating metabolite in the microalga Ostreococcus tauri. Metabolomics 2017, 13. [Google Scholar] [CrossRef] [PubMed]
- Skoneczny, D.; Weston, P.; Zhu, X.; Gurr, G.; Callaway, R.; Barrow, R.; Weston, L. Metabolic Profiling and Identification of Shikonins in Root Periderm of Two Invasive Echium spp. Weeds in Australia. Molecules 2017, 22, 330. [Google Scholar] [CrossRef] [PubMed]
- Valares Masa, C.; Alías Gallego, J.; Chaves Lobón, N.; Sosa Díaz, T. Intra-Population Variation of Secondary Metabolites in Cistus ladanifer L. Molecules 2016, 21, 945. [Google Scholar] [CrossRef] [PubMed]
- Fiore, C.L.; Longnecker, K.; Kido Soule, M.C.; Kujawinski, E.B. Release of ecologically relevant metabolites by the cyanobacterium Synechococcus elongatus CCMP 1631: Metabolomics of Synechococcus. Environ. Microbiol. 2015, 17, 3949–3963. [Google Scholar] [CrossRef] [PubMed]
- Sun, C.X.; Gao, X.X.; Li, M.Q.; Fu, J.Q.; Zhang, Y.L. Plastic responses in the metabolome and functional traits of maize plants to temperature variations. Plant Biol. 2016, 18, 249–261. [Google Scholar] [CrossRef] [PubMed]
- Van Meulebroek, L.; Hanssens, J.; Steppe, K.; Vanhaecke, L. Metabolic fingerprinting to assess the impact of salinity on carotenoid content in developing tomato fruits. Int. J. Mol. Sci. 2016, 17, 821. [Google Scholar] [CrossRef] [PubMed]
- Schweiger, R.; Baier, M.C.; Müller, C. Arbuscular Mycorrhiza-induced shifts in foliar metabolism and photosynthesis mirror the developmental stage of the symbiosis and are only partly driven by improved phosphate uptake. Mol. Plant-Microbe Interact. 2014, 27, 1403–1412. [Google Scholar] [CrossRef] [PubMed]
- Schweiger, R.; Heise, A.-M.; Persicke, M.; MüLler, C. Interactions between the jasmonic and salicylic acid pathway modulate the plant metabolome and affect herbivores of different feeding types: Phytohormone interactions affect metabolome and herbivores. Plant Cell Environ. 2014, 37, 1574–1585. [Google Scholar] [CrossRef] [PubMed]
- Schweiger, R.; Baier, M.C.; Persicke, M.; Müller, C. High specificity in plant leaf metabolic responses to arbuscular mycorrhiza. Nat. Commun. 2014, 5. [Google Scholar] [CrossRef] [PubMed]
- Calf, O.W.; Huber, H.; Peters, J.L.; Weinhold, A.; van Dam, N.M. Glycoalkaloid composition explains variation in slug resistance in Solanum dulcamara. Oecologia 2018. [Google Scholar] [CrossRef] [PubMed]
- Sutter, R.; Müller, C. Mining for treatment-specific and general changes in target compounds and metabolic fingerprints in response to herbivory and phytohormones in Plantago lanceolata. New Phytol. 2011, 191, 1069–1082. [Google Scholar] [CrossRef] [PubMed]
- Tortosa, M.; Cartea, M.E.; Rodríguez, V.M.; Velasco, P. Unraveling the metabolic response of Brassica oleracea exposed to Xanthomonas campestris pv. campestris: Metabolomic response of B. oleracea to Xanthomonas infection. J. Sci. Food Agric. 2018. [Google Scholar] [CrossRef] [PubMed]
- Alamgir, K.M.; Hojo, Y.; Christeller, J.T.; Fukumoto, K.; Isshiki, R.; Shinya, T.; Baldwin, I.T.; Galis, I. Systematic analysis of rice (Oryza sativa) metabolic responses to herbivory: Defence metabolites in rice. Plant Cell Environ. 2016, 39, 453–466. [Google Scholar] [CrossRef] [PubMed]
- Gutbrodt, B.; Dorn, S.; Unsicker, S.B.; Mody, K. Species-specific responses of herbivores to within-plant and environmentally mediated between-plant variability in plant chemistry. Chemoecology 2012, 22, 101–111. [Google Scholar] [CrossRef]
- Herden, J.; Meldau, S.; Kim, S.-G.; Kunert, G.; Joo, Y.; Baldwin, I.T.; Schuman, M.C. Shifting Nicotiana attenuata’s diurnal rhythm does not alter its resistance to the specialist herbivore Manduca sexta: N. attenuata’s resistance to M. sexta is diurnally robust. J. Integr. Plant Biol. 2016, 58, 656–668. [Google Scholar] [CrossRef] [PubMed]
- Kutyniok, M.; Müller, C. Crosstalk between above- and belowground herbivores is mediated by minute metabolic responses of the host Arabidopsis thaliana. J. Exp. Bot. 2012, 63, 6199–6210. [Google Scholar] [CrossRef] [PubMed]
- Kutyniok, M.; Müller, C. Plant-mediated interactions between shoot-feeding aphids and root-feeding nematodes depend on nitrate fertilization. Oecologia 2013, 173, 1367–1377. [Google Scholar] [CrossRef] [PubMed]
- Nacoulma, A.; Vandeputte, O.; De Lorenzi, M.; El Jaziri, M.; Duez, P. Metabolomic-Based Study of the Leafy Gall, the Ecological Niche of the Phytopathogen Rhodococcus fascians, as a Potential Source of Bioactive Compounds. Int. J. Mol. Sci. 2013, 14, 12533–12549. [Google Scholar] [CrossRef] [PubMed]
- Caseys, C.; Glauser, G.; Stölting, K.N.; Christe, C.; Albrectsen, B.R.; Lexer, C. Effects of interspecific recombination on functional traits in trees revealed by metabolomics and genotyping-by-resequencing. Plant Ecol. Divers. 2012, 5, 457–471. [Google Scholar] [CrossRef]
- Huseby, S.; Degerlund, M.; Zingone, A.; Hansen, E. Metabolic fingerprinting reveals differences between northern and southern strains of the cryptic diatom Chaetoceros socialis. Eur. J. Phycol. 2012, 47, 480–489. [Google Scholar] [CrossRef]
- Jandová, K.; Dostál, P.; Cajthaml, T.; Kameník, Z. Intraspecific variability in allelopathy of Heracleum mantegazzianum is linked to the metabolic profile of root exudates. Ann. Bot. 2015, 115, 821–831. [Google Scholar] [CrossRef] [PubMed]
- Shikano, I. Evolutionary Ecology of Multitrophic Interactions between Plants, Insect Herbivores and Entomopathogens. J. Chem. Ecol. 2017, 43, 586–598. [Google Scholar] [CrossRef] [PubMed]
- Sedio, B.E. Recent breakthroughs in metabolomics promise to reveal the cryptic chemical traits that mediate plant community composition, character evolution and lineage diversification. New Phytol. 2017, 214, 952–958. [Google Scholar] [CrossRef] [PubMed]
- Ehlers, B.K.; Damgaard, C.F.; Laroche, F. Intraspecific genetic variation and species coexistence in plant communities. Biol. Lett. 2016, 12, 20150853. [Google Scholar] [CrossRef] [PubMed]
- Drenovsky, R.E.; Grewell, B.J.; D’Antonio, C.M.; Funk, J.L.; James, J.J.; Molinari, N.; Parker, I.M.; Richards, C.L. A functional trait perspective on plant invasion. Ann. Bot. 2012, 110, 141–153. [Google Scholar] [CrossRef] [PubMed]
- Peñuelas, J.; Sardans, J.; Estiarte, M.; Ogaya, R.; Carnicer, J.; Coll, M.; Barbeta, A.; Rivas-Ubach, A.; Llusià, J.; Garbulsky, M.; et al. Evidence of current impact of climate change on life: A walk from genes to the biosphere. Glob. Chang. Biol. 2013, 19, 2303–2338. [Google Scholar] [CrossRef] [PubMed]
- Van Dam, N.M.; Bouwmeester, H.J. Metabolomics in the Rhizosphere: Tapping into Belowground Chemical Communication. Trends Plant Sci. 2016, 21, 256–265. [Google Scholar] [CrossRef] [PubMed]
- Jones, O.A.H.; Maguire, M.L.; Griffin, J.L.; Dias, D.A.; Spurgeon, D.J.; Svendsen, C. Metabolomics and its use in ecology: Metabolomics in Ecology. Austral Ecol. 2013, 38, 713–720. [Google Scholar] [CrossRef]
- Brunetti, C.; George, R.M.; Tattini, M.; Field, K.; Davey, M.P. Metabolomics in plant environmental physiology. J. Exp. Bot. 2013, 64, 4011–4020. [Google Scholar] [CrossRef] [PubMed]
- Fester, T. Plant metabolite profiles and the buffering capacities of ecosystems. Phytochemistry 2015, 110, 6–12. [Google Scholar] [CrossRef] [PubMed]
- Pierik, R.; Mommer, L.; Voesenek, L.A. Molecular mechanisms of plant competition: Neighbour detection and response strategies. Funct. Ecol. 2013, 27, 841–853. [Google Scholar] [CrossRef]
- Larsen, P.E.; Collart, F.R.; Dai, Y. Predicting Ecological Roles in the Rhizosphere Using Metabolome and Transportome Modeling. PLoS ONE 2015, 10, e0132837. [Google Scholar] [CrossRef] [PubMed]
- Schweiger, R.; Müller, C. Leaf metabolome in arbuscular mycorrhizal symbiosis. Curr. Opin. Plant Biol. 2015, 26, 120–126. [Google Scholar] [CrossRef] [PubMed]
- Gaquerel, E.; Baldwin, I.T. Honing in on phenotypes: Comprehensive two-dimensional gas chromatography of herbivory-induced volatile emissions and novel opportunities for system-level analyses. AoB Plants 2013, 5, plt002. [Google Scholar] [CrossRef] [PubMed]
- Leiss, K.A.; Choi, Y.H.; Verpoorte, R.; Klinkhamer, P.G.L. An overview of NMR-based metabolomics to identify secondary plant compounds involved in host plant resistance. Phytochem. Rev. 2011, 10, 205–216. [Google Scholar] [CrossRef] [PubMed]
- Kuhlisch, C.; Pohnert, G. Metabolomics in chemical ecology. Nat. Prod. Rep. 2015, 32, 937–955. [Google Scholar] [CrossRef] [PubMed]
- Allwood, J.W.; De Vos, R.C.H.; Moing, A.; Deborde, C.; Erban, A.; Kopka, J.; Goodacre, R.; Hall, R.D. Plant Metabolomics and Its Potential for Systems Biology Research. In Methods in Enzymology; Elsevier: New York, NY, USA, 2011; Volume 500, pp. 299–336. ISBN 978-0-12-385118-5. [Google Scholar]
- Draper, J.; Rasmussen, S.; Zubair, H. Metabolite Analysis and Metabolomics in the Study of Biotrophic Interactions between Plants and Microbes. In Annual Plant Reviews; Hall, R.D., Ed.; Wiley-Blackwell: Oxford, UK, 2011; Volume 43, pp. 25–59. ISBN 978-1-4443-3995-6. [Google Scholar]
- Bowne, J.; Bacic, A.; Tester, M.; Roessner, U. Abiotic Stress and Metabolomics. In Annual Plant Reviews; Hall, R.D., Ed.; Wiley-Blackwell: Oxford, UK, 2011; Volume 43, pp. 61–85. ISBN 978-1-4443-3995-6. [Google Scholar]
- Weckwerth, W. Green systems biology—From single genomes, proteomes and metabolomes to ecosystems research and biotechnology. J. Proteom. 2011, 75, 284–305. [Google Scholar] [CrossRef] [PubMed]
- Moore, M.N.; Depledge, M.H.; Readman, J.W.; Paul Leonard, D. An integrated biomarker-based strategy for ecotoxicological evaluation of risk in environmental management. Mutat. Res. Fundam. Mol. Mech. Mutagen. 2004, 552, 247–268. [Google Scholar] [CrossRef] [PubMed]
- Lankadurai, B.P.; Nagato, E.G.; Simpson, M.J. Environmental metabolomics: An emerging approach to study organism responses to environmental stressors. Environ. Rev. 2013, 21, 180–205. [Google Scholar] [CrossRef]
- Macel, M.; Van DAM, N.M.; Keurentjes, J.J.B. Metabolomics: The chemistry between ecology and genetics: Invited technical review. Mol. Ecol. Resour. 2010, 10, 583–593. [Google Scholar] [CrossRef] [PubMed]
- Leibold, M.A.; Holyoak, M.; Mouquet, N.; Amarasekare, P.; Chase, J.M.; Hoopes, M.F.; Holt, R.D.; Shurin, J.B.; Law, R.; Tilman, D.; et al. The metacommunity concept: A framework for multi-scale community ecology: The metacommunity concept. Ecol. Lett. 2004, 7, 601–613. [Google Scholar] [CrossRef]
- Peters, K.; Breitsameter, L.; Gerowitt, B. Impact of climate change on weeds in agriculture: A review. Agron. Sustain. Dev. 2014, 34, 707–721. [Google Scholar] [CrossRef]
- Hopkins, R.J.; van Dam, N.M.; van Loon, J.J.A. Role of Glucosinolates in Insect-Plant Relationships and Multitrophic Interactions. Annu. Rev. Entomol. 2009, 54, 57–83. [Google Scholar] [CrossRef] [PubMed]
- Gillard, J.; Frenkel, J.; Devos, V.; Sabbe, K.; Paul, C.; Rempt, M.; Inzé, D.; Pohnert, G.; Vuylsteke, M.; Vyverman, W. Metabolomics Enables the Structure Elucidation of a Diatom Sex Pheromone. Angew. Chem. Int. Ed. 2013, 52, 854–857. [Google Scholar] [CrossRef] [PubMed]
- Okie, J.G.; Van Horn, D.J.; Storch, D.; Barrett, J.E.; Gooseff, M.N.; Kopsova, L.; Takacs-Vesbach, C.D. Niche and metabolic principles explain patterns of diversity and distribution: Theory and a case study with soil bacterial communities. Proc. R. Soc. B Biol. Sci. 2015, 282, 20142630. [Google Scholar] [CrossRef] [PubMed]
- Watrous, J.; Roach, P.; Alexandrov, T.; Heath, B.S.; Yang, J.Y.; Kersten, R.D.; van der Voort, M.; Pogliano, K.; Gross, H.; Raaijmakers, J.M.; et al. Mass spectral molecular networking of living microbial colonies. Proc. Natl. Acad. Sci. USA 2012, 109, E1743–E1752. [Google Scholar] [CrossRef] [PubMed]
- Callaway, R.M.; Ridenour, W.M. Novel weapons: Invasive success and the evolution of increased competitive ability. Front. Ecol. Environ. 2004, 2, 436–443. [Google Scholar] [CrossRef]
- Salmaso, N.; Naselli-Flores, L.; Padisák, J. Functional classifications and their application in phytoplankton ecology. Freshw. Biol. 2015, 60, 603–619. [Google Scholar] [CrossRef] [Green Version]
- Blande, J.D. Plant Communication with Herbivores. In Advances in Botanical Research; Elsevier: New York, NY, USA, 2017; Volume 82, pp. 281–304. ISBN 978-0-12-801431-8. [Google Scholar]
- Hodgkison, R.; Ayasse, M.; Kalko, E.K.V.; Häberlein, C.; Schulz, S.; Mustapha, W.A.W.; Zubaid, A.; Kunz, T.H. Chemical Ecology of Fruit Bat Foraging Behavior in Relation to the Fruit Odors of Two Species of Paleotropical Bat-Dispersed Figs (Ficus hispida and Ficus scortechinii). J. Chem. Ecol. 2007, 33, 2097–2110. [Google Scholar] [CrossRef] [PubMed]
- Nevo, O.; Orts Garri, R.; Hernandez Salazar, L.T.; Schulz, S.; Heymann, E.W.; Ayasse, M.; Laska, M. Chemical recognition of fruit ripeness in spider monkeys (Ateles geoffroyi). Sci. Rep. 2015, 5, 14895. [Google Scholar] [CrossRef] [PubMed]
- Nevo, O.; Heymann, E.W.; Schulz, S.; Ayasse, M. Fruit Odor as a Ripeness Signal for Seed-Dispersing Primates? A Case Study on Four Neotropical Plant Species. J. Chem. Ecol. 2016, 42, 323–328. [Google Scholar] [CrossRef] [PubMed]
- Majetic, C.J.; Raguso, R.A.; Ashman, T.-L. The Impact of Biochemistry vs. Population Membership on Floral Scent Profiles in Colour Polymorphic Hesperis matronalis. Ann. Bot. 2008, 102, 911–922. [Google Scholar] [CrossRef] [PubMed]
- Dormont, L.; Delle-Vedove, R.; Bessière, J.-M.; Schatz, B. Floral scent emitted by white and coloured morphs in orchids. Phytochemistry 2014, 100, 51–59. [Google Scholar] [CrossRef] [PubMed]
- Rodríguez, A.; Alquézar, B.; Peña, L. Fruit aromas in mature fleshy fruits as signals of readiness for predation and seed dispersal. New Phytol. 2013, 197, 36–48. [Google Scholar] [CrossRef] [PubMed]
- Valenta, K.; Burke, R.J.; Styler, S.A.; Jackson, D.A.; Melin, A.D.; Lehman, S.M. Colour and odour drive fruit selection and seed dispersal by mouse lemurs. Sci. Rep. 2013, 3. [Google Scholar] [CrossRef] [PubMed]
- Mithöfer, A.; Boland, W. Plant Defense against Herbivores: Chemical Aspects. Annu. Rev. Plant Biol. 2012, 63, 431–450. [Google Scholar] [CrossRef] [PubMed]
- Pitts-Singer, T.L.; Hagen, M.M.; Helm, B.R.; Highland, S.; Buckner, J.S.; Kemp, W.P. Comparison of the Chemical Compositions of the Cuticle and Dufour’s Gland of Two Solitary Bee Species from Laboratory and Field Conditions. J. Chem. Ecol. 2017, 43, 451–468. [Google Scholar] [CrossRef] [PubMed]
- Rivas-Ubach, A.; Pérez-Trujillo, M.; Sardans, J.; Gargallo-Garriga, A.; Parella, T.; Peñuelas, J. Ecometabolomics: Optimized NMR-based method. Methods Ecol. Evol. 2013, 4, 464–473. [Google Scholar] [CrossRef]
- De Meyer, T.; Sinnaeve, D.; Van Gasse, B.; Tsiporkova, E.; Rietzschel, E.R.; De Buyzere, M.L.; Gillebert, T.C.; Bekaert, S.; Martins, J.C.; Van Criekinge, W. NMR-Based Characterization of Metabolic Alterations in Hypertension Using an Adaptive, Intelligent Binning Algorithm. Anal. Chem. 2008, 80, 3783–3790. [Google Scholar] [CrossRef] [PubMed]
- Sousa, S.A.A.; Magalhães, A.; Ferreira, M.M.C. Optimized bucketing for NMR spectra: Three case studies. Chemom. Intell. Lab. Syst. 2013, 122, 93–102. [Google Scholar] [CrossRef]
- Rocca-Serra, P.; Salek, R.M.; Arita, M.; Correa, E.; Dayalan, S.; Gonzalez-Beltran, A.; Ebbels, T.; Goodacre, R.; Hastings, J.; Haug, K.; et al. Data standards can boost metabolomics research, and if there is a will, there is a way. Metabolomics 2016, 12. [Google Scholar] [CrossRef] [PubMed]
- Spicer, R.; Salek, R.M.; Moreno, P.; Cañueto, D.; Steinbeck, C. Navigating freely-available software tools for metabolomics analysis. Metabolomics 2017, 13. [Google Scholar] [CrossRef] [PubMed]
- Jansen, J.J.; Allwood, J.W.; Marsden-Edwards, E.; van der Putten, W.H.; Goodacre, R.; van Dam, N.M. Metabolomic analysis of the interaction between plants and herbivores. Metabolomics 2009, 5, 150–161. [Google Scholar] [CrossRef] [Green Version]
- Qiu, B.-L.; Harvey, J.A.; Raaijmakers, C.E.; Vet, L.E.M.; van Dam, N.M. Nonlinear effects of plant root and shoot jasmonic acid application on the performance of Pieris brassicae and its parasitoid Cotesia glomerata. Funct. Ecol. 2009, 23, 496–505. [Google Scholar] [CrossRef]
- Fiehn, O. Metabolomics—The link between genotypes and phenotypes. In Functional Genomics; Town, C., Ed.; Springer: Dordrecht, The Netherlands, 2002; pp. 155–171. ISBN 978-94-010-3903-1. [Google Scholar]
- Dunn, W.B.; Ellis, D.I. Metabolomics: Current analytical platforms and methodologies. TrAC Trends Anal. Chem. 2005, 24, 285–294. [Google Scholar] [CrossRef]
- Sue, T.; Obolonkin, V.; Griffiths, H.; Villas-Bôas, S.G. An Exometabolomics Approach to Monitoring Microbial Contamination in Microalgal Fermentation Processes by Using Metabolic Footprint Analysis. Appl. Environ. Microbiol. 2011, 77, 7605–7610. [Google Scholar] [CrossRef] [PubMed]
- Gao, P.; Xu, G. Mass-spectrometry-based microbial metabolomics: Recent developments and applications. Anal. Bioanal. Chem. 2015, 407, 669–680. [Google Scholar] [CrossRef] [PubMed]
- Trutschel, D.; Schmidt, S.; Grosse, I.; Neumann, S. Experiment design beyond gut feeling: Statistical tests and power to detect differential metabolites in mass spectrometry data. Metabolomics 2015, 11, 851–860. [Google Scholar] [CrossRef]
- Kelley, K. Confidence intervals for standardized effect sizes: Theory, application, and implementation. J. Stat. Softw. 2007, 20, 1–24. [Google Scholar] [CrossRef]
- Legendre, P.; Legendre, L. Numerical Ecology, 3. Engl. ed.; Developments in Environmental Modelling; Elsevier: Amsterdam, The Netherlands, 2012; ISBN 978-0-444-53868-0. [Google Scholar]
- Trogisch, S.; Schuldt, A.; Bauhus, J.; Blum, J.A.; Both, S.; Buscot, F.; Castro-Izaguirre, N.; Chesters, D.; Durka, W.; Eichenberg, D.; et al. Toward a methodical framework for comprehensively assessing forest multifunctionality. Ecol. Evol. 2017, 7, 10652–10674. [Google Scholar] [CrossRef] [PubMed]
- Cornelissen, J.H.C.; Lang, S.I.; Soudzilovskaia, N.A.; During, H.J. Comparative Cryptogam Ecology: A Review of Bryophyte and Lichen Traits that Drive Biogeochemistry. Ann. Bot. 2007, 99, 987–1001. [Google Scholar] [CrossRef] [PubMed]
- Stitt, M.; Gibon, Y.; Lunn, J.E.; Piques, M. Multilevel genomics analysis of carbon signalling during low carbon availability: Coordinating the supply and utilisation of carbon in a fluctuating environment. Funct. Plant Biol. 2007, 34, 526. [Google Scholar] [CrossRef]
- Abraham, P.E.; Yin, H.; Borland, A.M.; Weighill, D.; Lim, S.D.; De Paoli, H.C.; Engle, N.; Jones, P.C.; Agh, R.; Weston, D.J.; et al. Transcript, protein and metabolite temporal dynamics in the CAM plant Agave. Nat. Plants 2016, 2, 16178. [Google Scholar] [CrossRef] [PubMed]
- Maier, T.S.; Kuhn, J.; Müller, C. Proposal for field sampling of plants and processing in the lab for environmental metabolic fingerprinting. Plant Methods 2010, 6, 6. [Google Scholar] [CrossRef] [PubMed]
- Dunn, W.B.; Wilson, I.D.; Nicholls, A.W.; Broadhurst, D. The importance of experimental design and QC samples in large-scale and MS-driven untargeted metabolomic studies of humans. Bioanalysis 2012, 4, 2249–2264. [Google Scholar] [CrossRef] [PubMed]
- Kucharíková, A.; Kusari, S.; Sezgin, S.; Spiteller, M.; Čellárová, E. Occurrence and Distribution of Phytochemicals in the Leaves of 17 In vitro Cultured Hypericum spp. Adapted to Outdoor Conditions. Front. Plant Sci. 2016, 7. [Google Scholar] [CrossRef] [PubMed]
- Rahi, P.; Prakash, O.; Shouche, Y.S. Matrix-Assisted Laser Desorption/Ionization Time-of-Flight Mass-Spectrometry (MALDI-TOF MS) Based Microbial Identifications: Challenges and Scopes for Microbial Ecologists. Front. Microbiol. 2016, 7. [Google Scholar] [CrossRef] [PubMed]
- Bouhifd, M. Quality assurance of metabolomics. ALTEX 2015, 32, 319–326. [Google Scholar] [CrossRef] [PubMed]
- Arens, N.; Döll, S.; Mock, H.-P. The reproducibility of liquid chromatography separation technology and its potential impact on large scale plant metabolomics experiments. J. Chromatogr. B 2015, 991, 41–45. [Google Scholar] [CrossRef] [PubMed]
- Kiontke, A.; Oliveira-Birkmeier, A.; Opitz, A.; Birkemeyer, C. Electrospray Ionization Efficiency Is Dependent on Different Molecular Descriptors with Respect to Solvent pH and Instrumental Configuration. PLoS ONE 2016, 11, e0167502. [Google Scholar] [CrossRef] [PubMed]
- Birkemeyer, C.; Kopka, J. Design of metabolite recovery by variations of the metabolite profiling protocol. In Concepts in Plant Metabolomics; Springer: Dordrecht, The Netherlands, 2007; pp. 45–69. [Google Scholar]
- Hutschenreuther, A.; Birkemeyer, C.; Grötzinger, K.; Straubinger, R.K.; Rauwald, H.W. Growth inhibiting activity of volatile oil from Cistus creticus L. against Borrelia burgdorferiss in vitro. Die Pharm. Int. J. Pharm. Sci. 2010, 65, 290–295. [Google Scholar]
- Smith, C.A.; Want, E.J.; O’Maille, G.; Abagyan, R.; Siuzdak, G. XCMS: Processing Mass Spectrometry Data for Metabolite Profiling Using Nonlinear Peak Alignment, Matching, and Identification. Anal. Chem. 2006, 78, 779–787. [Google Scholar] [CrossRef] [PubMed]
- Röst, H.L.; Sachsenberg, T.; Aiche, S.; Bielow, C.; Weisser, H.; Aicheler, F.; Andreotti, S.; Ehrlich, H.-C.; Gutenbrunner, P.; Kenar, E.; et al. OpenMS: A flexible open-source software platform for mass spectrometry data analysis. Nat. Methods 2016, 13, 741–748. [Google Scholar] [CrossRef] [PubMed]
- Kumar, M.; Kuzhiumparambil, U.; Pernice, M.; Jiang, Z.; Ralph, P.J. Metabolomics: An emerging frontier of systems biology in marine macrophytes. Algal Res. 2016, 16, 76–92. [Google Scholar] [CrossRef]
- Van den Berg, R.A.; Hoefsloot, H.C.; Westerhuis, J.A.; Smilde, A.K.; van der Werf, M.J. Centering, scaling, and transformations: Improving the biological information content of metabolomics data. BMC Genom. 2006, 7, 142. [Google Scholar] [CrossRef] [PubMed]
- Kenar, E.; Franken, H.; Forcisi, S.; Wörmann, K.; Häring, H.-U.; Lehmann, R.; Schmitt-Kopplin, P.; Zell, A.; Kohlbacher, O. Automated Label-free Quantification of Metabolites from Liquid Chromatography–Mass Spectrometry Data. Mol. Cell. Proteom. 2014, 13, 348–359. [Google Scholar] [CrossRef] [PubMed]
- Sturm, M.; Kohlbacher, O. TOPPView: An Open-Source Viewer for Mass Spectrometry Data. J. Proteome Res. 2009, 8, 3760–3763. [Google Scholar] [CrossRef] [PubMed]
- Weisser, H.; Nahnsen, S.; Grossmann, J.; Nilse, L.; Quandt, A.; Brauer, H.; Sturm, M.; Kenar, E.; Kohlbacher, O.; Aebersold, R.; et al. An Automated Pipeline for High-Throughput Label-Free Quantitative Proteomics. J. Proteome Res. 2013, 12, 1628–1644. [Google Scholar] [CrossRef] [PubMed]
- Kuhl, C.; Tautenhahn, R.; Böttcher, C.; Larson, T.R.; Neumann, S. CAMERA: An Integrated Strategy for Compound Spectra Extraction and Annotation of Liquid Chromatography/Mass Spectrometry Data Sets. Anal. Chem. 2012, 84, 283–289. [Google Scholar] [CrossRef] [PubMed]
- Peters, K.; Gorzolka, K.; Bruelheide, H.; Neumann, S. Computational workflow to study the seasonal variation of secondary metabolites in nine different bryophytes. Nat. Sci. Data 2018. submitted. [Google Scholar]
- Wishart, D.S. Computational strategies for metabolite identification in metabolomics. Bioanalysis 2009, 1, 1579–1596. [Google Scholar] [CrossRef] [PubMed]
- Xiao, J.F.; Zhou, B.; Ressom, H.W. Metabolite identification and quantitation in LC-MS/MS-based metabolomics. TrAC Trends Anal. Chem. 2012, 32, 1–14. [Google Scholar] [CrossRef] [PubMed]
- Kopka, J.; Schauer, N.; Krueger, S.; Birkemeyer, C.; Usadel, B.; Bergmuller, E.; Dormann, P.; Weckwerth, W.; Gibon, Y.; Stitt, M.; et al. [email protected]: The Golm Metabolome Database. Bioinformatics 2005, 21, 1635–1638. [Google Scholar] [CrossRef] [PubMed]
- Vinaixa, M.; Schymanski, E.L.; Neumann, S.; Navarro, M.; Salek, R.M.; Yanes, O. Mass spectral databases for LC/MS- and GC/MS-based metabolomics: State of the field and future prospects. TrAC Trends Anal. Chem. 2016, 78, 23–35. [Google Scholar] [CrossRef]
- Domingo-Almenara, X.; Perera, A.; Ramírez, N.; Cañellas, N.; Correig, X.; Brezmes, J. Compound identification in gas chromatography/mass spectrometry-based metabolomics by blind source separation. J. Chromatogr. A 2015, 1409, 226–233. [Google Scholar] [CrossRef] [PubMed]
- Domingo-Almenara, X.; Perera, A.; Brezmes, J. Avoiding hard chromatographic segmentation: A moving window approach for the automated resolution of gas chromatography–mass spectrometry-based metabolomics signals by multivariate methods. J. Chromatogr. A 2016, 1474, 145–151. [Google Scholar] [CrossRef] [PubMed]
- Domingo-Almenara, X.; Montenegro-Burke, J.R.; Benton, H.P.; Siuzdak, G. Annotation: A Computational Solution for Streamlining Metabolomics Analysis. Anal. Chem. 2018, 90, 480–489. [Google Scholar] [CrossRef] [PubMed]
- Wang, M.; Carver, J.J.; Phelan, V.V.; Sanchez, L.M.; Garg, N.; Peng, Y.; Nguyen, D.D.; Watrous, J.; Kapono, C.A.; Luzzatto-Knaan, T.; et al. Sharing and community curation of mass spectrometry data with Global Natural Products Social Molecular Networking. Nat. Biotechnol. 2016, 34, 828–837. [Google Scholar] [CrossRef] [PubMed]
- Jonsson, P.; Bruce, S.J.; Moritz, T.; Trygg, J.; Sjöström, M.; Plumb, R.; Granger, J.; Maibaum, E.; Nicholson, J.K.; Holmes, E.; et al. Extraction, interpretation and validation of information for comparing samples in metabolic LC/MS data sets. Analyst 2005, 130, 701–707. [Google Scholar] [CrossRef] [PubMed]
- Krauss, M.; Singer, H.; Hollender, J. LC–high resolution MS in environmental analysis: From target screening to the identification of unknowns. Anal. Bioanal. Chem. 2010, 397, 943–951. [Google Scholar] [CrossRef] [PubMed]
- Creek, D.J.; Jankevics, A.; Breitling, R.; Watson, D.G.; Barrett, M.P.; Burgess, K.E.V. Toward Global Metabolomics Analysis with Hydrophilic Interaction Liquid Chromatography–Mass Spectrometry: Improved Metabolite Identification by Retention Time Prediction. Anal. Chem. 2011, 83, 8703–8710. [Google Scholar] [CrossRef] [PubMed]
- Cao, M.; Fraser, K.; Huege, J.; Featonby, T.; Rasmussen, S.; Jones, C. Predicting retention time in hydrophilic interaction liquid chromatography mass spectrometry and its use for peak annotation in metabolomics. Metabolomics 2015, 11, 696–706. [Google Scholar] [CrossRef] [PubMed]
- McEachran, A.D.; Mansouri, K.; Newton, S.R.; Beverly, B.E.J.; Sobus, J.R.; Williams, A.J. A comparison of three liquid chromatography (LC) retention time prediction models. Talanta 2018, 182, 371–379. [Google Scholar] [CrossRef] [PubMed]
- Meyer, M.R.; Peters, F.T.; Maurer, H.H. Automated Mass Spectral Deconvolution and Identification System for GC-MS Screening for Drugs, Poisons, and Metabolites in Urine. Clin. Chem. 2010, 56, 575–584. [Google Scholar] [CrossRef] [PubMed]
- Hao, J.; Liebeke, M.; Astle, W.; De Iorio, M.; Bundy, J.G.; Ebbels, T.M.D. Bayesian deconvolution and quantification of metabolites in complex 1D NMR spectra using BATMAN. Nat. Protoc. 2014, 9, 1416–1427. [Google Scholar] [CrossRef] [PubMed]
- Allen, F.; Pon, A.; Wilson, M.; Greiner, R.; Wishart, D. CFM-ID: A web server for annotation, spectrum prediction and metabolite identification from tandem mass spectra. Nucleic Acids Res. 2014, 42, W94–W99. [Google Scholar] [CrossRef] [PubMed]
- Dührkop, K.; Shen, H.; Meusel, M.; Rousu, J.; Böcker, S. Searching molecular structure databases with tandem mass spectra using CSI:FingerID. Proc. Natl. Acad. Sci. USA 2015, 112, 12580–12585. [Google Scholar] [CrossRef] [PubMed]
- Davidson, R.L.; Weber, R.J.M.; Liu, H.; Sharma-Oates, A.; Viant, M.R. Galaxy-M: A Galaxy workflow for processing and analyzing direct infusion and liquid chromatography mass spectrometry-based metabolomics data. GigaScience 2016, 5. [Google Scholar] [CrossRef] [PubMed]
- Aguilar-Mogas, A.; Sales-Pardo, M.; Navarro, M.; Guimerà, R.; Yanes, O. iMet: A network-based computational tool to assist in the annotation of metabolites from tandem mass spectra. Anal. Chem. 2017, 89, 3474–3482. [Google Scholar] [CrossRef] [PubMed]
- Xia, J.; Psychogios, N.; Young, N.; Wishart, D.S. MetaboAnalyst: A web server for metabolomic data analysis and interpretation. Nucleic Acids Res. 2009, 37, W652–W660. [Google Scholar] [CrossRef] [PubMed]
- Treutler, H.; Tsugawa, H.; Porzel, A.; Gorzolka, K.; Tissier, A.; Neumann, S.; Balcke, G.U. Discovering Regulated Metabolite Families in Untargeted Metabolomics Studies. Anal. Chem. 2016, 88, 8082–8090. [Google Scholar] [CrossRef] [PubMed]
- Wolf, S.; Schmidt, S.; Müller-Hannemann, M.; Neumann, S. In silico fragmentation for computer assisted identification of metabolite mass spectra. BMC Bioinform. 2010, 11, 148. [Google Scholar] [CrossRef] [PubMed]
- Wandy, J.; Zhu, Y.; van der Hooft, J.J.J.; Daly, R.; Barrett, M.P.; Rogers, S. Ms2lda.org: Web-based topic modelling for substructure discovery in mass spectrometry. Bioinformatics 2018, 34, 317–318. [Google Scholar] [CrossRef] [PubMed]
- Tsugawa, H.; Cajka, T.; Kind, T.; Ma, Y.; Higgins, B.; Ikeda, K.; Kanazawa, M.; VanderGheynst, J.; Fiehn, O.; Arita, M. MS-DIAL: Data-independent MS/MS deconvolution for comprehensive metabolome analysis. Nat. Methods 2015, 12, 523–526. [Google Scholar] [CrossRef] [PubMed]
- Scheltema, R.A.; Jankevics, A.; Jansen, R.C.; Swertz, M.A.; Breitling, R. PeakML/mzMatch: A File Format, Java Library, R Library, and Tool-Chain for Mass Spectrometry Data Analysis. Anal. Chem. 2011, 83, 2786–2793. [Google Scholar] [CrossRef] [PubMed]
- Pluskal, T.; Castillo, S.; Villar-Briones, A.; Orešič, M. MZmine 2: Modular framework for processing, visualizing, and analyzing mass spectrometry-based molecular profile data. BMC Bioinform. 2010, 11, 395. [Google Scholar] [CrossRef] [PubMed]
- Jacob, D.; Deborde, C.; Lefebvre, M.; Maucourt, M.; Moing, A. NMRProcFlow: A graphical and interactive tool dedicated to 1D spectra processing for NMR-based metabolomics. Metabolomics 2017, 13. [Google Scholar] [CrossRef] [PubMed]
- Böcker, S.; Letzel, M.C.; Lipták, Z.; Pervukhin, A. SIRIUS: Decomposing isotope patterns for metabolite identification. Bioinformatics 2009, 25, 218–224. [Google Scholar] [CrossRef] [PubMed]
- Giacomoni, F.; Le Corguille, G.; Monsoor, M.; Landi, M.; Pericard, P.; Petera, M.; Duperier, C.; Tremblay-Franco, M.; Martin, J.-F.; Jacob, D.; et al. Workflow4Metabolomics: A collaborative research infrastructure for computational metabolomics. Bioinformatics 2015, 31, 1493–1495. [Google Scholar] [CrossRef] [PubMed]
- Tautenhahn, R.; Patti, G.J.; Rinehart, D.; Siuzdak, G. XCMS Online: A Web-Based Platform to Process Untargeted Metabolomic Data. Anal. Chem. 2012, 84, 5035–5039. [Google Scholar] [CrossRef] [PubMed]
- Shahaf, N.; Rogachev, I.; Heinig, U.; Meir, S.; Malitsky, S.; Battat, M.; Wyner, H.; Zheng, S.; Wehrens, R.; Aharoni, A. The WEIZMASS spectral library for high-confidence metabolite identification. Nat. Commun. 2016, 7, 12423. [Google Scholar] [CrossRef] [PubMed]
- Ruttkies, C.; Strehmel, N.; Scheel, D.; Neumann, S. Annotation of metabolites from gas chromatography/atmospheric pressure chemical ionization tandem mass spectrometry data using an in silico generated compound database and MetFrag: Annotation of metabolites from high-resolution GC/APCI-MS/MS data. Rapid Commun. Mass Spectrom. 2015, 29, 1521–1529. [Google Scholar] [CrossRef] [PubMed]
- Allard, P.-M.; Péresse, T.; Bisson, J.; Gindro, K.; Marcourt, L.; Pham, V.C.; Roussi, F.; Litaudon, M.; Wolfender, J.-L. Integration of Molecular Networking and In-Silico MS/MS Fragmentation for Natural Products Dereplication. Anal. Chem. 2016, 88, 3317–3323. [Google Scholar] [CrossRef] [PubMed]
- Chervin, J.; Stierhof, M.; Tong, M.H.; Peace, D.; Hansen, K.Ø.; Urgast, D.S.; Andersen, J.H.; Yu, Y.; Ebel, R.; Kyeremeh, K.; et al. Targeted Dereplication of Microbial Natural Products by High-Resolution MS and Predicted LC Retention Time. J. Nat. Prod. 2017, 80, 1370–1377. [Google Scholar] [CrossRef] [PubMed]
- Broadhurst, D.I.; Kell, D.B. Statistical strategies for avoiding false discoveries in metabolomics and related experiments. Metabolomics 2007, 2, 171–196. [Google Scholar] [CrossRef]
- Vinaixa, M.; Samino, S.; Saez, I.; Duran, J.; Guinovart, J.J.; Yanes, O. A Guideline to Univariate Statistical Analysis for LC/MS-Based Untargeted Metabolomics-Derived Data. Metabolites 2012, 2, 775–795. [Google Scholar] [CrossRef] [PubMed]
- Newson, R.; Team, A.S. Multiple-test procedures and smile plots. Stata J. 2003, 3, 109–132. [Google Scholar]
- Guo, W.; Romano, J. A Generalized Sidak-Holm Procedure and Control of Generalized Error Rates under Independence. Stat. Appl. Genet. Mol. Biol. 2007, 6. [Google Scholar] [CrossRef] [PubMed]
- Jamil, T.; Ozinga, W.A.; Kleyer, M.; ter Braak, C.J.F. Selecting traits that explain species-environment relationships: A generalized linear mixed model approach. J. Veg. Sci. 2013, 24, 988–1000. [Google Scholar] [CrossRef]
- Weber, R.; Selander, E.; Sommer, U.; Viant, M. A Stable-Isotope Mass Spectrometry-Based Metabolic Footprinting Approach to Analyze Exudates from Phytoplankton. Mar. Drugs 2013, 11, 4158–4175. [Google Scholar] [CrossRef] [PubMed]
- Smith, R.; Ventura, D.; Prince, J.T. LC-MS alignment in theory and practice: A comprehensive algorithmic review. Brief. Bioinform. 2015, 16, 104–117. [Google Scholar] [CrossRef] [PubMed]
- Warton, D.I.; Wright, S.T.; Wang, Y. Distance-based multivariate analyses confound location and dispersion effects: Mean-variance confounding in multivariate analysis. Methods Ecol. Evol. 2012, 3, 89–101. [Google Scholar] [CrossRef]
- Jesch, A.; Barry, K.E.; Ravenek, J.M.; Bachmann, D.; Strecker, T.; Weigelt, A.; Buchmann, N.; de Kroon, H.; Gessler, A.; Mommer, L.; et al. Below-ground resource partitioning alone cannot explain the biodiversity-ecosystem function relationship: A field test using multiple tracers. J. Ecol. 2018. [Google Scholar] [CrossRef]
- Wilkinson, M.D.; Dumontier, M.; Aalbersberg, I.J.; Appleton, G.; Axton, M.; Baak, A.; Blomberg, N.; Boiten, J.-W.; da Silva Santos, L.B.; Bourne, P.E.; et al. The FAIR Guiding Principles for scientific data management and stewardship. Sci. Data 2016, 3, 160018. [Google Scholar] [CrossRef] [PubMed] [Green Version]
- Nakamura, Y.; Mochamad Afendi, F.; Kawsar Parvin, A.; Ono, N.; Tanaka, K.; Hirai Morita, A.; Sato, T.; Sugiura, T.; Altaf-Ul-Amin, M.; Kanaya, S. KNApSAcK Metabolite Activity Database for Retrieving the Relationships Between Metabolites and Biological Activities. Plant Cell Physiol. 2014, 55, e7. [Google Scholar] [CrossRef] [PubMed]
- Zeng, X.; Zhang, P.; He, W.; Qin, C.; Chen, S.; Tao, L.; Wang, Y.; Tan, Y.; Gao, D.; Wang, B.; et al. NPASS: Natural product activity and species source database for natural product research, discovery and tool development. Nucleic Acids Res. 2018, 46, D1217–D1222. [Google Scholar] [CrossRef] [PubMed]
- Caspi, R.; Billington, R.; Ferrer, L.; Foerster, H.; Fulcher, C.A.; Keseler, I.M.; Kothari, A.; Krummenacker, M.; Latendresse, M.; Mueller, L.A.; et al. The MetaCyc database of metabolic pathways and enzymes and the BioCyc collection of pathway/genome databases. Nucleic Acids Res. 2016, 44, D471–D480. [Google Scholar] [CrossRef] [PubMed]
- Karp, P.; Billington, R.; Holland, T.; Kothari, A.; Krummenacker, M.; Weaver, D.; Latendresse, M.; Paley, S. Computational Metabolomics Operations at BioCyc.org. Metabolites 2015, 5, 291–310. [Google Scholar] [CrossRef] [PubMed]
- Kattge, J.; DíAz, S.; Lavorel, S.; Prentice, I.C.; Leadley, P.; BöNisch, G.; Garnier, E.; Westoby, M.; Reich, P.B.; Wright, I.J.; et al. TRY—A global database of plant traits: TRY—A global database of plant traits. Glob. Chang. Biol. 2011, 17, 2905–2935. [Google Scholar] [CrossRef] [Green Version]
- Soranno, P.A.; Bissell, E.G.; Cheruvelil, K.S.; Christel, S.T.; Collins, S.M.; Fergus, C.E.; Filstrup, C.T.; Lapierre, J.-F.; Lottig, N.R.; Oliver, S.K.; et al. Building a multi-scaled geospatial temporal ecology database from disparate data sources: Fostering open science and data reuse. GigaScience 2015, 4. [Google Scholar] [CrossRef] [PubMed]
- Carroll, A.J.; Badger, M.R.; Millar, A.H. The MetabolomeExpress Project: Enabling web-based processing, analysis and transparent dissemination of GC/MS metabolomics datasets. BMC Bioinform. 2010, 11, 376. [Google Scholar] [CrossRef] [PubMed]
- Haug, K.; Salek, R.M.; Conesa, P.; Hastings, J.; de Matos, P.; Rijnbeek, M.; Mahendraker, T.; Williams, M.; Neumann, S.; Rocca-Serra, P.; et al. MetaboLights—An open-access general-purpose repository for metabolomics studies and associated meta-data. Nucleic Acids Res. 2013, 41, D781–D786. [Google Scholar] [CrossRef] [PubMed]
- Sneddon, T.P.; Si Zhe, X.; Edmunds, S.C.; Li, P.; Goodman, L.; Hunter, C.I. GigaDB: Promoting data dissemination and reproducibility. Database 2014, 2014, bau018. [Google Scholar] [CrossRef] [PubMed]
- Russell, J.F. If a job is worth doing, it is worth doing twice: Researchers and funding agencies need to put a premium on ensuring that results are reproducible. Nature 2013, 496, 7–8. [Google Scholar] [CrossRef] [PubMed]
- Goodacre, R.; Vaidyanathan, S.; Dunn, W.B.; Harrigan, G.G.; Kell, D.B. Metabolomics by numbers: Acquiring and understanding global metabolite data. Trends Biotechnol. 2004, 22, 245–252. [Google Scholar] [CrossRef] [PubMed]
- Zhang, A.; Sun, H.; Wang, P.; Han, Y.; Wang, X. Modern analytical techniques in metabolomics analysis. Analyst 2012, 137, 293–300. [Google Scholar] [CrossRef] [PubMed]
- Eghbalnia, H.R.; Romero, P.R.; Westler, W.M.; Baskaran, K.; Ulrich, E.L.; Markley, J.L. Increasing rigor in NMR-based metabolomics through validated and open source tools. Curr. Opin. Biotechnol. 2017, 43, 56–61. [Google Scholar] [CrossRef] [PubMed]
- Ioannidis, J.P.A.; Allison, D.B.; Ball, C.A.; Coulibaly, I.; Cui, X.; Culhane, A.C.; Falchi, M.; Furlanello, C.; Game, L.; Jurman, G.; et al. Repeatability of published microarray gene expression analyses. Nat. Genet. 2009, 41, 149–155. [Google Scholar] [CrossRef] [PubMed]
- Peng, R.D. Reproducible Research in Computational Science. Science 2011, 334, 1226–1227. [Google Scholar] [CrossRef] [PubMed]
- Kanani, H.; Chrysanthopoulos, P.K.; Klapa, M.I. Standardizing GC–MS metabolomics. J. Chromatogr. B 2008, 871, 191–201. [Google Scholar] [CrossRef] [PubMed]
- Godzien, J.; Alonso-Herranz, V.; Barbas, C.; Armitage, E.G. Controlling the quality of metabolomics data: New strategies to get the best out of the QC sample. Metabolomics 2015, 11, 518–528. [Google Scholar] [CrossRef]
- Leipzig, J. A review of bioinformatic pipeline frameworks. Brief. Bioinform. 2016, bbw020. [Google Scholar] [CrossRef] [PubMed]
- Afgan, E.; Baker, D.; van den Beek, M.; Blankenberg, D.; Bouvier, D.; Čech, M.; Chilton, J.; Clements, D.; Coraor, N.; Eberhard, C.; et al. The Galaxy platform for accessible, reproducible and collaborative biomedical analyses: 2016 update. Nucleic Acids Res. 2016, 44, W3–W10. [Google Scholar] [CrossRef] [PubMed]
- Fillbrunn, A.; Dietz, C.; Pfeuffer, J.; Rahn, R.; Landrum, G.A.; Berthold, M.R. KNIME for reproducible cross-domain analysis of life science data. J. Biotechnol. 2017, 261, 149–156. [Google Scholar] [CrossRef] [PubMed]
- Pfeuffer, J.; Sachsenberg, T.; Alka, O.; Walzer, M.; Fillbrunn, A.; Nilse, L.; Schilling, O.; Reinert, K.; Kohlbacher, O. OpenMS—A platform for reproducible analysis of mass spectrometry data. J. Biotechnol. 2017, 261, 142–148. [Google Scholar] [CrossRef] [PubMed]
- Kim, J.; Kim, H.-S.; Choi, S.-H.; Jang, J.-Y.; Jeong, M.-J.; Lee, S. The Importance of the Circadian Clock in Regulating Plant Metabolism. Int. J. Mol. Sci. 2017, 18, 2680. [Google Scholar] [CrossRef] [PubMed]
- Ryan, R.P.; Germaine, K.; Franks, A.; Ryan, D.J.; Dowling, D.N. Bacterial endophytes: Recent developments and applications. FEMS Microbiol. Lett. 2008, 278, 1–9. [Google Scholar] [CrossRef] [PubMed]
- Liu, H.; Carvalhais, L.C.; Crawford, M.; Singh, E.; Dennis, P.G.; Pieterse, C.M.J.; Schenk, P.M. Inner Plant Values: Diversity, Colonization and Benefits from Endophytic Bacteria. Front. Microbiol. 2017, 8. [Google Scholar] [CrossRef] [PubMed]
- MacArthur, R. Fluctuations of animal populations and a measure of community stability. Ecology 1955, 36, 533–536. [Google Scholar] [CrossRef]
- Menéndez, R.; González-Megías, A.; Collingham, Y.; Fox, R.; Roy, D.B.; Ohlemüller, R.; Thomas, C.D. Direct and indirect effects of climate and habitat factors on butterfly diversity. Ecology 2007, 88, 605–611. [Google Scholar] [CrossRef] [PubMed]
- Lamb, E.G. Direct and indirect control of grassland community structure by litter, resources, and biomass. Ecology 2008, 89, 216–225. [Google Scholar] [CrossRef] [PubMed]
- Lamb, E.G.; Kembel, S.W.; Cahill, J.F. Shoot, but not root, competition reduces community diversity in experimental mesocosms. J. Ecol. 2009, 97, 155–163. [Google Scholar] [CrossRef]
- Eisenhauer, N.; Cesarz, S.; Koller, R.; Worm, K.; Reich, P.B. Global change belowground: Impacts of elevated CO2, nitrogen, and summer drought on soil food webs and biodiversity. Glob. Chang. Biol. 2012, 18, 435–447. [Google Scholar] [CrossRef]
- Clough, Y. A generalized approach to modeling and estimating indirect effects in ecology. Ecology 2012, 93, 1809–1815. [Google Scholar] [CrossRef] [PubMed]
- Douma, J.C.; Shipley, B.; Witte, J.-P.; Aerts, R.; Van Bodegom, P.M. Disturbance and resource availability act differently on the same suite of plant traits: Revisiting assembly hypotheses. Ecology 2012, 93, 825–835. [Google Scholar] [CrossRef] [PubMed] [Green Version]
- Wei, Z.; Yang, T.; Friman, V.-P.; Xu, Y.; Shen, Q.; Jousset, A. Trophic network architecture of root-associated bacterial communities determines pathogen invasion and plant health. Nat. Commun. 2015, 6. [Google Scholar] [CrossRef] [PubMed]
- Eisenhauer, N.; Bowker, M.A.; Grace, J.B.; Powell, J.R. From patterns to causal understanding: Structural equation modeling (SEM) in soil ecology. Pedobiologia 2015, 58, 65–72. [Google Scholar] [CrossRef]
- Canarini, A.; Carrillo, Y.; Mariotte, P.; Ingram, L.; Dijkstra, F.A. Soil microbial community resistance to drought and links to C stabilization in an Australian grassland. Soil Biol. Biochem. 2016, 103, 171–180. [Google Scholar] [CrossRef]
- Cortois, R.; Veen, G.F.C.; Duyts, H.; Abbas, M.; Strecker, T.; Kostenko, O.; Eisenhauer, N.; Scheu, S.; Gleixner, G.; De Deyn, G.B.; et al. Possible mechanisms underlying abundance and diversity responses of nematode communities to plant diversity. Ecosphere 2017, 8, e01719. [Google Scholar] [CrossRef]


| Reference | Approach | Interaction Level | Non-Model Species? | Plant Species Studied | Experimental Methodology | Metabolomics Acquisition Method | Statistical Methods | Bioinformatics Tools Used | Compounds Identified | Key Results |
|---|---|---|---|---|---|---|---|---|---|---|
| [35] | top-down | plant–diversity | yes | Bellis perennis Knautia arvensis Lotus corniculatus Medicago x varia Leontodon autumnalis | field | GC/MS FT-ICR-MS | GLM, PCA, ANOVA, HCA, Kruskal–Wallis test | yes | Negative effects of resource competition with small-statured species, modified metabolite profiles in response to altered resource availability with tall species | |
| [36] | top-down | plant–diversity | yes | Festuca pratensis Poa pratensis Plantago lanceolata Prunella vulgaris Crepis biennis Galium mollugo Onobrychis viciifolia Trifolium repens | semi-field plots | FTIR | LDA, Canonical variate analysis, NMDS, HCA | classes | Metabolic profiles of species can be differentiated according to the diversity level they grew in | |
| [37] | top-down | plant–environment | yes | Lepidium latifolium | field | HPLC | ANOVA, Tukey HSD | SPSS | yes | The species (also described as “sleeper weed“) has biochemical plasticity in response to different environments |
| [38] | top-down | plant–environment | yes | Carex caryophyllea | growth chamber | LC/MS | PCA, DCA, Pearson correlation | SIMCA-P, PC-ORD | no | Interaction of genetic diversity and resulting metabolite plasticity with regard to soil type and environment |
| [39] | top-down | plant–environment | yes | Poa annua Poa cookii Poa kerguelensis Ranunculus biternatus Ranunculus pseudotrullifolius Ranunculus moseleyi Pringlea antiscorbutica Acaena magellanica Taraxacum erythrospermum | field | HPLC | discriminant analysis, ANOVA | StatSoft | yes | Differences in amine composition can be linked to environment |
| [40] | top-down | plant–environment | yes | Artemisia biennis Artemisia vulgaris Bidens frondosa Bidens tripartita Senecio inaequidens Senecio vulgaris Senecio jacobaea Solidago gigantea Solidago virgaurea Tanacetum parthenium Tanacetum vulgare Tragopogon dubius Tragopogon pratensis | greenhouse | LC/MS | ANOVA, Spearman correlation | Metalign, R | no | Exotic species have more and also more unique metabolites when compared to native congeners, herbivore performance was lower with exotics |
| [41] | top-down | plant–environment | yes | Brachythecium rutabulum Calliergonella cuspidata Fissidens taxifolius Grimmia pulvinata Hypnum cupressiforme Marchantia polymorpha Plagiomnium undulatum Polytrichum strictum Rhytidiadelphus squarrosus | field | LC/MS | dbRDA, HCA, ANOVA, Tukey HSD, Pearson correlation, Mantel test | R, CompassXPort, CompassIsotopePattern, CompassDataAnalysis, ISAcreator, Docker, Galaxy | no | Patterns in metabolite profiles of bryophytes are connected to phylogenetic history, seasonal changes, ecological characteristics and life strategies |
| [42] | top-down | plant–environment | yes | Myriophyllum spicatum | field | GC/MS | t-test, PCA | R, XCMS | no | Metabolite profiles are related to ontogenetic development, habitat and nutrient status of lake |
| [43] | top-down | plant–environment | yes | Quercus acutissima Schima superba Sapindus saponaria | field | LC/MS-MS HPLC | ANOVA, F-test, NMDS, RDA | R | yes | Litter diversity effects on the decomposition of leaf litter tannin and polyphenols of three tree species |
| [44] | top-down | plant–environment | yes | Erica multiflora | field | CHNS-O elemental analyser NMR | MANOVA, PERMANOVA, PCA, DA | TOPSPIN, PRIMER, Statistica | yes | Stoichiometrical evidence for the growth-rate hypothesis |
| [45] | top-down | plant–environment | yes | Quercus ilex | field | LC/MS NMR CEM | PERMANOVA, ANOVA, PCA, PLS-DA, GLM | R, TOPSPIN, AMIX, Statistica | classes | Drought shifts metabolism as plants adapt metabolism and folivory to prevent water loss |
| [46] | top-down | plant–herbivore | yes | Inga marginata Inga acreana Inga auristellae Inga tenuistipula Inga umbellifera Inga laurina | field | LC/MS | PCA, HCA, PLS-DA, Venn, ANOVA, Kruskal–Wallis test | R, MetaboAnalyst | no | Metabolomics and advances in bioinformatics allow For comprehensive examination of shifts in foliar chemical defenses of trees depending on leaf development stage |
| [47] | top-down | plant–herbivore | yes | Bunias orientalis | growth chamber | LC/MS | linear (mixed effect) model, ANOVA, NMDS, Mantel test, Spearman rank correlation, Shannon diversity, Holm-Sidak, Levene's test | R | yes (glucosinolates) | Genetic distances of 16 Bunias orientalis populations correlated with metabolite fingerprints; invasion success is facilitated by high metabolite variation and diversity within populations which play a role with reducing herbivory to the herbovore Mamestra brassicae |
| [48] | top-down | plant–herbivore | yes | Inga heterophylla Inga capitata | field | GC/MS LC/MS | PCA, PLS-DA | R, Metaboanalyst | yes | interactions with natural enemies play a significant role in phenotypic divergence and potentially in diversification and coexistence of two tropical sister species; defensive traits are evolutionary labile |
| [49] | top-down | plant–herbivore | yes | Bunias orientalis | glasshouse | LC/MS | linear mixed model, REML, Tukey-Kramer test, PCA, ANOVA | SAS, R | classes (glucosinolates) | Native populations are better defended against herbivory than non-native populations |
| [50] | top-down | plant–herbivore | yes | 37 Inga species | field | LC/MS | HCA, PCA, Bayesian | R, MrBayes, MacClade | classes | Species of Inga trees that co-occur at local and regional spatial scales are less similar in terms of their metabolomes than by chance, suggesting that interactions with shared herbivores and pathogens (whose host ranges are determined by the trees’ metabolomes) select for chemically diverse plant assemblages, and hence facilitate ecological coexistence in the tree community (in this case among congeneric trees) |
| [51] | top-down | plant–herbivore | yes | Barbarea vulgaris subsp. arcuata | growth chamber | LC/MS | t-test, correlation, regression, HCA, PCA | MetAlign, Java, SAS, R | yes + classes | Metabolite profiles differentiated plants susceptible to the herbivore Phyllotreta nemorum, the known compounds hederagenin cellobioside and oleanolic acid cellobioside, as well as two other saponins were correlated with plant resistance |
| [52] | top-down | plant–herbivore | yes | Daucus carota | growth chamber | NMR | Pearson correlation, ANOVA, PCA, PLS-DA, OPLS-DA | TOPSPIN, SIMCA-P | yes | Wild carrots are more resistant to herbivores than cultivated species + identification of compounds that are important for interaction |
| [53,54,55] | top-down | plant–herbivore | yes | Pinus sylvestris ssp. nevadensis Pinus sylvestris ssp. iberica Pinus pinaster Pinus nigra Pinus nevadensis | field | LC/MS | Shapiro–Wilk, ANOVA, Levene's test, PERMANOVA, Tukey's HSD, PCA, Euclidean distance, PERMANOVA, PLS-DA, HCA | R, MZmine | no | The metabolomes of the tested Pinus species were more dissimilar to folivory in summer than in winter possibly due to drought conditions |
| [56] | top-down | plant–herbivore | yes | 46 tree species from four genus-level clades, including Eugenia (4 species), Inga (14 species), Ocotea (including Nectandra; 8 species) and Psychotria (including Palicourea; 20 species) | field | LC/MS LC/MS-MS | Chemical structural compositional similarity, Bray-Curtis similarity, Permutation test | GNPS, R | yes (in Supporting Information) | Interspecific differences, including those among congeneric species of trees, were much larger than within species and chemical structural similarity of ontogeny, light environment and season. Variation between metabolite profiles permits niche segregation among congeneric tree species based on chemical defences. |
| [57] | top-down | plant–herbivore | no | Zea mays ssp. mays Zea mays ssp. parviglumis | glasshouse | LC/MS | linear mixed model, ANOVA, PLS, MANOVA | yes (BXDs) | Domesticated maize plants have weakened chemical defences against several herbivores when compared to teosinte, the wild maize ancestor | |
| [58] | top-down | plant–herbivore | no | Nicotiana attenuata | greenhouse | LC/MS LC/MS-MS | Coexpression networks, PCA | R, Cytoscape | yes | Metabolic branch-specific variations in natural accessions identified by fragmentation analysis, discovery and annotation of ecologically interesting compounds |
| [59] | top-down | plant–pathogen | yes | Piper santi-felicis Piper multiplinervium Piper cenocladum Piper reticulatum Piper holdrigeanum Piper auritum Piper xanthostachym Piper peltatum Piper melanocladum | field | NMR | Diversity indices, a priori path models (PROC CALIS), upfield and downfield diversity | MestReNova, SAS | classes | Elevated phytochemical diversity in 9 Piper species has positive effects on the diversity of herbivores and reduces overall herbivore damage. Metabolite profiles provide mechanistic evidence for the predominance of specialized insect herbivores on Piper |
| [60] | top-down | plant–plant | yes | Pinus halepensis Quercus pubescens | field | GC/MS | ANOVA, Tukey test, t-test, PCA, SIMPER, Mann–Whitney test | R, PRIMER-E, GraphPad | no | Plants modulate their metabolism (trade-off of allelopathy and growth) according to level of competition |
| [61] | top-down | plant–plant | yes | Plantago lanceolata | greenhouse | HPLC | linear mixed model, Tukey HSD | R | no | Phenotypic plasticity in response to environmental variation rather than genetic differentiation as a response to plant diversity |
| [62] | top-down | plant–plant | yes | Karenia brevis Asterionellopsis glacialis Thalassiosira pseudonana | cultures | LC/MS NMR | PCA, PLS-DA | Matlab, PLS_Toolbox, SEQUEST, NMRLab, MassLynx | yes | Allelochemicals target multiple pathways in competitors, affecting primary production and nutrient cycling in ecosystems |
| [63] | top-down | plant–pollinator | yes | Silene otites | field semi-field plots | GC/MS | non-parametric ANOVA, Tukey-Kramer post hoc test | Saturn Software, MassFinder, Statistica | yes | Diel variation in floral volatile composition, emission patterns correspond to olfactory ability and activity times of insect pollinators |
| [64] | top-down | plant–soil | yes | Holcus lanatus Alopecurus pratensis | field | LC/MS NMR | PERMANOVA, PCA, PLS-DA, ANOVA, Kolmogorov-Smirnov test | MZMINE, TOPSPIN, AMIX, Statistica, R | yes | Different responses of species to environmental stresses, responses opposite in shoots and roots |
| [65] | top-down | plant–soil | yes | Sambucus nigra | field | LC/MS | PERMANOVA, PCA, PLS-DA, ANOVA, Kolmogorov-Smirnov test | MZMINE, Statistica, R | yes | Microbial communities in the phyllosphere have impact on metabolome of plants |
| [66] | bottom-up | plant–environment | yes | Pseudotsuga menziesii | growth chamber | GC/MS | t-test | SigmaPlot, Excel | yes | Provenance-specific reactions to environmental stress as outlined with identifying specific compounds |
| [67] | bottom-up | plant–environment | yes | Ostreococcus tauri | cultures | GC/MS | none | Xcalibur, MET-IDEA, Excel, AMDIS, MS Search | yes | Metabolomes show diurnal fluctuations + identification of formerly unknown metabolites |
| [68] | bottom-up | plant–environment | yes | Echium plantagineum Echium vulgare | glasshouse | LC/MS | Logistic regression | MassHunter, Statistix, Excel | yes | Role of shikonins in relation to plant phenological stage |
| [69] | bottom-up | plant–environment | yes | Cistus ladanifer | field | HPLC | HCA, ANOVA | - | yes | Intra-population variation in the metabolomes with regard to environment |
| [70] | bottom-up | plant–environment | no | Synechococcus elongatus | cultures | LC/MS LC/MS-MS | Pearson correlation, Spearman correlation, NMDS, ANOSIM | XCalibur, Excel, R, Metlin, MetFrag, KEGG, MetaboLights | yes | Exuded metabolites to the environment have ecological relevance on e.g., microbes |
| [71] | bottom-up | plant–environment | no | Zea mays | greenhouse | NMR | ANOVA, PCA, HCA, linear regression | SIMCA-P+, SPSS | yes | Plastic responses of different maize lines to temperature conditions |
| [72] | bottom-up | plant–environment | no | Solanum lycopersicum | greenhouse | LC/MS | OPLS-DA, ANOVA | SIMCA | yes | Metabolome of tomato changes with different salinity levels, carotenoid accumulation with higher salinity was observed |
| [73,74,75] | bottom-up | plant–fungusplant–herbivore | yes | Plantago major Plantago lanceolata Veronica chamaedrys Medicago truncatula Poa annua | growth chamber climate chamber | GC/MS LC/MS LC-FL elemental analyser | cluster heatmap average linkage, HCA, Pearson correlation, GLM, Mann–Whitney U test, Kruskal–Wallis test, Dunn test, volcano plot, Chi2 test, Venn-Euler diagram | MassHunter, Xcalibur, XCMS, R, Excel, GLM, Cluster, JavaTreeView, MATLAB, KEGG | yes | There is a core-Metabolome across species and a phytometabolome which is species-specific as a response to arbuscular mycorrhizal fungus. Foliar metabolome modifications are determined by the developmental stage of arbuscular mycorrhiza with changes becoming more pronounced over time and being only partly phosphate-mediated. Specific effects of jasmonic acid and salicylic acid on metabolite pattern in leaf tissue and phloem exudates. |
| [76] | bottom-up | plant–herbivore | yes | Solanum dulcamara | greenhouse | LC/MS | Friedman ANOVA, Wilcoxon signed-rank test, Pearson's correlation test and heatmap | MetaboAnalyst 3.0 | yes | Variation in steroidal glycoalkaloids (GAs) correlated with slug preference; accessions with high GA levels were consistently less damaged by slugs. One, strongly preferred, accession with particularly low GA levels contained high levels of structurally related steroidal compounds. These were conjugated with uronic acid instead of the glycoside moieties common for Solanum GAs. |
| [77] | bottom-up | plant–herbivore | yes | Plantago lanceolata | growth chamber | LC/MS GC/MS | GLM, Kruskal–Wallis test, PCA, Mann–Whitney U test, volcano plot, Chi2 test, Venn-Euler diagram | MassHunter, Xcalibur, XCMS, R, Excel, MATLAB, VennMaster | yes | Metabolic fingerprints were considerably affected especially by generalist and phytohormone treatments, but less by mechanical damage and specialist herbivory. Responses to generalists partly overlapped with the changes due to jasmonic acid, but many additional peaks were up-regulated. Many features were co-induced by jasmonic and salicylic acid. |
| [78] | bottom-up | plant–herbivore | yes | Brassica oleracea | greenhouse | LC/MS LC/MS-MS | PCA, PLS-DA | Metaboanalyst 3.0 | yes | Results showed that Xcc infection causes dynamic changes in the metabolome of B. oleracea. Repression pattern of the metabolites implicated in the response follows complex dynamics during infection progression indicating a complex temporal response. Specific metabolic pathways such as alkaloids, coumarins or sphingolipids are identified as candidates in the infection response |
| [79] | bottom-up | plant–herbivore | no | Oryza sativa | growth chamber | LC/MS LC/MS-MS | ANOVA, LSD, PCA, t-test | MetaboAnalyst, Excel | yes | Identification of formerly unknown compounds in rice in response to herbivory |
| [80] | bottom-up | plant–herbivore | no | Brassica oleracea | climate chamber | HPLC CHN elemental analyser | ANOVA, LSD test, t-test | PASWStatistics | yes | Responses of herbivores and their interactions with host plants are depending on drought stress |
| [81] | bottom-up | plant–herbivore | no | Nicotiana attenuata | climate chamber | LC/MS | PCA, Shapiro–Wilk test, t-test, linear mixed model, REML | MetaboAnalyst, R | yes | Damage-induced defence may undergo circadian fluctuation |
| [82] | bottom-up | plant–herbivore | no | Arabidopsis thaliana | growth chamber | GC/MS LC/MS | Kruskal–Wallis, Tukey HSD, Mann–Whitney U test, t-test, Spearman correlation, GLM, PCA, OPLS-DA, ANOVA | XCalibur, Agilent MassHunter, SIMCA, R | yes | Systemic plant responses to nematode and aphid interferences |
| [83] | bottom-up | plant–herbivore | no | Arabidopsis thaliana | growth chamber | GC/MS elemental analyser | PCA, PLS-DA, two-way ANOVA | XCalibur, R | yes | Effects of aphid shoot feeding on root metabolite profiles depend on fertilization, leading to contrasting effects on nematodes |
| [84] | bottom-up | plant–herbivore | no | Nicotiana tabacum | growth chamber | NMR GC/MS | PCA, OPLS-DA | SIMCA-P+ | yes | Conclusions for plant defence mechanisms following infection of leafy gall |
| [85] | bottom-up | plant–plant | yes | Populus alba Populus tremula | field | LC/MS | PCA, ANOVA, LSD test, Mann–Whitney U test, Mantel test | Markerlynx XS, SPSS | yes | Linking chemical traits to genotypic evolution |
| [86] | bottom-up | plant–plant | yes | Chaetoceros socialis | cultures | LC/MS | Mann–Whitney U test, Spearman correlation, PCA | Statistica, MarkerLynx XS, Excel | no | linking metabolite profiles to phenotypic differences, phylogeny and temperature regimes |
| [87] | bottom-up | plant–plant | yes | Heracleum mantegazzianum | greenhouse | LC/MS | linear mixed models, variance component analysis, OPLS, ANOVA, | R, MetAlign, SIMCA-P | yes | Intraspecific variability is important with allelopathy + identification of some compounds |
| Reference | Approach | Spatiotemporal Scales Covered | Interaction Level | Metabolomics Acquisition Methods | Contribution of Metabolomics |
|---|---|---|---|---|---|
| [88] | top-down | Community Population Individual | plant–herbivore plant–pathogen | - | Multitrophic interactions within a web of species interactions are mediated by phytochemicals that can be determined with metabolomics. These phytochemicals influence and trigger immune responses in both plants and herbivores/pathogens. |
| [89] | top-down | Community Population Individual | plant–herbivore plant–pathogen plant–plant | NMR LC/MS, LC/MS-MS | Metabolomics can reveal cryptic biochemical traits that mediate interactions of plants with other organisms; emphasis on species coexistence, lineage diversification and character evolution and potential of metabolomics |
| [90] | top-down | Community Population Individual Physiology Molecular | plant–plant plant–community | GC/MS | Central role of metabolomic traits that can describe species coexistence chemically, Metabolomics can be used to detect the genetic identity of neighbours if they have common history of coexistence |
| [91] | top-down | Landscape Community Population | plant–environment plant–community plant–plant | - | Metabolomics and chemical/ecophysiological interactions can be used to describe plant traits and phenotypic plasticity |
| [92] | top-down | Landscape Community Population Individual Physiology Molecular | plant–environment | LC/MS GC/MS NMR HPLC | Climate change acts on various scales on plants and affects their phenotypic plasticity, genotypic evolution, migration and local extinction of populations and result in biogeochemical and biophysical feedbacks: The potential of metabolomics are highlighted |
| [93] | bottom-up top-down | Community Population Individual Physiology | rhizosphere community plant–plant plant–herbivore plant–pathogen plant–community | GC/MS LC/MS NMR | Metabolomics can help to understand interactions of plant roots and organisms in the rhizosphere |
| [94] | top-down bottom-up | Community Population Individual | plant–plant plant–herbivore plant–community | FTIR NMR UV | Metabolomics can provide new insight into ecological processes such as interactions of plant with pollution, biotic and environmental stress |
| [95] | top-down bottom-up | Community Population Individual Physiology Molecular | plant–environment | GC/MS LC/MS NMR HPLC Fluorescence microimaging | Metabolomic approaches (untarged + targeted) can provide powerful insights at various scales |
| [96] | top-down bottom-up | Landscape Community Population | plant–environment | GC/MS LC/MS NMR | Metabolite profiles of model species can be used to determine ability of plant to recover from stress but also for stress-buffering capacities of ecosystems |
| [10] | top-down bottom-up | Population Individual Physiology | plant–environment plant–herbivory | LC/MS GC/MS FT-ICR NMR | Ecophysiological responses of plants to temperature, water, nutrients, light/circadian rhythm, atmospheric gases, seasonality; differentiation of aquatic and terrestrial organisms; emphasis on field studies and variation; biotic interactions |
| [97] | bottom-up | Community Population Individual Physiology | plant–plant | - | With plant–plant interactions, especially competition, sensing of compounds through light-quality signals, nutrient levels, soluble root exudates and volatile organic compounds emitted by neighbouring plants both above- and below-ground is vital |
| [98] | bottom-up | Community Population Individual Physiology Molecular | rhizosphere community | - | Metabolic pathways of microbes in the rhizosphere can be modelled with meta-genomic sequencing data and systems biology approaches. Systems biology approaches enable scale-independent thinking. |
| [7] | bottom-up | Individual Physiology | plant–environment | NMR LC/MS, LC/MS-MS GC/MS FT-ICR DIMS | Potential and challenges of environmental metabolomics with emphasis on analytical techniques |
| [99] | bottom-up | Individual Physiology | plant–fungus | GC/MS LC/MS | Mycorrhiza-mediated changes in foliar metabolome are highly species-specific and cover many different compound classes; changes can confer protection against abiotic stresses and have consequences on numerous biotic interactions |
| [100] | bottom-up | Individual Physiology | plant–herbivore | GC/MS LC/MS | Role of system-wide untargeted metabolomics analysis for plant–herbivore interactions with emphasis on analytical and statistical methods |
| [101] | bottom-up | Individual Physiology | plant–pathogen | NMR | Application of NMR in metabolomics and its role in detecting host plant resistance to pathogens |
| [102] | bottom-up | Individual Physiology Molecular | plant–environment plant–herbivore plant–pathogen | GC/MS LC/MS, LC/MS-MS NMR | Metabolomics can provide detailed insights into ecological interaction processes; Targeted and comparative metabolomics can reveal new and important compounds involved with these interactions; general analytical and statistical approaches are discussed |
| [103] | bottom-up | Individual Physiology Molecular | plant–environment plant–plant plant–herbivory plant–pathogen systems biology | GC/MS LC/MS NMR | General contribution of metabolomics from a systems biological view point |
| [104] | bottom-up | Individual Physiology Molecular | plant–pathogen plant–mutualist plant–microbes | GC/MS LC/MS FIE-MS FT-ICR-MS | Metabolomics can provide improved spatial and temporal separation of biotrophic interaction processes between plants and pathogenic + mutualistic fungi |
| [105] | bottom-up | Individual Physiology Molecular | plant–environment | GC/MS LC/MS NMR LIF | Ecophysiological responses of plants to drought, cold stress, salinity + integration of several Omics |
| [106] | bottom-up | Landscape Community Population Individual Physiology Molecular | plant–environment systems biology | GC-MS LC/MS UPLC Proteomics | Practical applications necessitate in-depth understanding of the physiology of single plant species; Metabolomics is one key technology to translate this knowledge to complex ecosystems; Correlation networks are one way to determine multi-scale interactions |
| [107] | bottom-up | Landscape Population Individual Physiology | plant–environment | - | Metabolomics can identify biomarkers and contaminants involved with environmental pollution; Metabolomics can be used to develop policies and management for sustainable environments; The concept of scaling and levels of biological organisation are discussed |
| [108] | bottom-up | Population Individual Physiology | plant–environment | LC/MS GC/MS NMR | General overview on experimental design, extraction methods, analytical instrumentation and statistical methods used in environmental metabolomics and pipeline how to detect biomarkers |
| [109] | bottom-up | Population Individual Physiology Molecular | plant–herbivore | LC/MS GC/MS NMR FTIR | Metabolomics is a research domain linking genotypes to phenotypes, describing metabolites that are important in plant herbivore interactions |
| Bioinformatics Tool | Reference | Metabolomics Acquisition Methods Covered | Main Functionality |
|---|---|---|---|
| AMDIS | [177] | GC/MS | Spectrum deconvolution, identification |
| BATMAN | [178] | NMR | Identification and quantification of metabolites in deconvoluted NMR data |
| CAMERA | [162] | GC/MS, LC/MS | Feature annotation, feature alignment, RT correction, isotope cluster validation |
| CFM-ID | [179] | LC/MS-MS | Identification, Spectrum prediction |
| CSI:FingerID | [180] | LC/MS-MS | Identification |
| Galaxy-M | [181] | LC/MS | Workflow system for metabolomics data analysis |
| GNPS | [171] | LC/MS-MS | Retrieval of online dereplicated and crowdsourced MS/MS spectra |
| iMet | [182] | LC/MS-MS | Identification |
| MetaboAnalyst | [183] | NMR, LC/MS, GC/MS | User interface for the processing and analysis of metabolomics data |
| MetFamily | [184] | GC/MS, LC/MS | Clustering of MS features to metabolite families |
| MetFrag | [185] | LC/MS-MS | Identification of MS features by their MS-MS spectra |
| MS2LDA | [186] | LC/MS-MS | Decomposition of MS/MS spectra to co-occurring fragments/neutral losses |
| MS-Dial | [187] | LC/MS-MS, GC-MS | Processing, deconvolution and analysis of MS data |
| mzMatch | [188] | GC/MS, LC/MS | Tool chain for the processing of metabolomics data |
| MZmine 2 | [189] | LC/MS | Framework for the processing and analysis of MS data |
| OpenMS | [156] | GC/MS, LC/MS | Feature extraction and data analysis |
| NMRProcFlow | [190] | NMR | Processing and visualization of 1D NMR data |
| SIRIUS | [191] | LC/MS | Annotation of sum formulas using MS/MS spectra and isotope patterns |
| Workflow4Metabolomics | [192] | NMR, LC/MS, GC/MS | Automatic processing, annotation and analysis of metabolomics data |
| XCMS | [155] | GC/MS, LC/MS | Feature extraction |
| XCMS Online | [193] | GC/MS, LC/MS | User interface for processing and analysis of metabolomics data |
| Criteria | Summary of Execution |
|---|---|
| Findability | (meta)data are assigned globally unique and persistent identifiers which are registered and indexed in searchable resources |
| Accessibility | (meta)data are retrievable by their identifier with an open and free protocol, metadata are still accessible even when data is no longer available |
| Interoperability | (meta)data use formal, accessible, shared and broadly applicable language and have vocabularies that follow FAIR principles and include qualified references to other (meta)data |
| Reusability | (meta)data are associated with accurate and relevant attributes, with detailed provenance, with an accessible license and meet domain-relevant community-standards |
© 2018 by the authors. Licensee MDPI, Basel, Switzerland. This article is an open access article distributed under the terms and conditions of the Creative Commons Attribution (CC BY) license (http://creativecommons.org/licenses/by/4.0/).
Share and Cite
Peters, K.; Worrich, A.; Weinhold, A.; Alka, O.; Balcke, G.; Birkemeyer, C.; Bruelheide, H.; Calf, O.W.; Dietz, S.; Dührkop, K.; et al. Current Challenges in Plant Eco-Metabolomics. Int. J. Mol. Sci. 2018, 19, 1385. https://0-doi-org.brum.beds.ac.uk/10.3390/ijms19051385
Peters K, Worrich A, Weinhold A, Alka O, Balcke G, Birkemeyer C, Bruelheide H, Calf OW, Dietz S, Dührkop K, et al. Current Challenges in Plant Eco-Metabolomics. International Journal of Molecular Sciences. 2018; 19(5):1385. https://0-doi-org.brum.beds.ac.uk/10.3390/ijms19051385
Chicago/Turabian StylePeters, Kristian, Anja Worrich, Alexander Weinhold, Oliver Alka, Gerd Balcke, Claudia Birkemeyer, Helge Bruelheide, Onno W. Calf, Sophie Dietz, Kai Dührkop, and et al. 2018. "Current Challenges in Plant Eco-Metabolomics" International Journal of Molecular Sciences 19, no. 5: 1385. https://0-doi-org.brum.beds.ac.uk/10.3390/ijms19051385