Article

Prognostic Value of RNASEH2A-, CDK1-, and CD151-Related Pathway Gene Profiling for Kidney Cancers

1
Department of Laboratory Medicine, China Medical University Hospital, Taichung, Taiwan; #2 Yude Road, Taichung 40447, Taiwan
2
Division of General Pediatrics, China Medical University Children’s Hospital, Taichung 40447, Taiwan
3
College of Medicine, China Medical University, Taichung 40402, Taiwan
4
Epigenome Research Center, China Medical University Hospital, Taichung 40447, Taiwan
*
Author to whom correspondence should be addressed.
Int. J. Mol. Sci. 2018, 19(6), 1586; https://0-doi-org.brum.beds.ac.uk/10.3390/ijms19061586
Submission received: 17 April 2018 / Revised: 17 May 2018 / Accepted: 22 May 2018 / Published: 28 May 2018
(This article belongs to the Special Issue Precision Medicine—From Bench to Bedside)

Abstract

:
The nucleotide degrading enzyme gene RNASEH2A (ribonuclease H2 subunit A) has been found to be overexpressed in cancers. Our aim was to understand the role of RNASEH2A in cancer prognostication and to establish a scoring system based on the expressions of genes interacting with RNASEH2A. We screened the nucleotide degrading enzyme gene expression in RNAseq data of 14 cancer types derived from The Cancer Genome Atlas (TCGA) and found that RNASEH2A overexpression was associated with poor patient survival only in renal cell carcinomas (RCCs). Further cluster analyses of samples with poor outcomes revealed that cluster of differentiation 151 (CD151) upregulation correlated with low cyclin dependent kinase 1 (CDK1) and high RNASEH2A expression. The combination of low CD151 expression and high RNASEH2A expression resulted in impaired proliferation in four kidney cancer cell lines, suggesting potential synthetic dosage lethality (SDL) interactions between the two genes. A prognostication scoring system was established based on the expression levels of RNASEH2A-, CDK1-, and CD151-related genes, which could effectively predict the overall survival in a TCGA clear cell RCC cohort (n = 533, 995.3 versus 2242.2 days, p < 0.0001), in another clear cell renal cell carcinoma (ccRCC) cohort E-GEOD-22541 (n = 44, 390.0 versus 1889.2 days, p = 0.0007), and in a TCGA papillary RCC (pRCC) cohort (n = 287, 741.6 versus 1623.7 days, p < 0.0001). Our results provide a clinically applicable prognostication scoring system for renal cancers.

1. Background

Nucleotide metabolism homeostasis is important for the balance of cell proliferation, DNA replication, and genome stability [1]. Genomic instability facilitates tumor initiation and progression. However, the roles of nucleotide degrading enzymes in tumorigenesis are not fully understood. Loss-of-function mutations in the nucleotide degrading enzymes sterile alpha motif (SAM) domain and HD domain-containing protein 1 (SAMHD1), Three prime repair exonuclease 1 (TREX1), and ribonuclease H2 subunits A, B, and C (RNASEH2A, RNASEH2B, RNASEH2C) in human germline mainly result in a hyper-inflammatory Aicardi–Goutières syndrome (AGS), and in the development of malignancy in AGS patient is rare [2,3,4]. Our previous study on a Taiwanese colon cancer cohort showed that, in contrast to the downregulation of TREX1, SAMHD1, and RNASEH2C, RNASEH2A expression was found to be higher in tumor tissues when compared to paired normal parts [5]. Interestingly, RNASEH2A has also been reported to be upregulated in a variety of cancers, including breast, bladder, brain, prostate, head and neck cancers, seminomas, and leukemia [6].
RNASEH2A is the main catalytic unit of ribonuclease H2 (RNase H2), which degrades the ribonucleotide that is mis-incorporated into the DNA–DNA complex and cleaves the lagging-strand Okazaki fragment RNA primers from the DNA:RNA duplex during DNA replication [7]. Recently, RNASEH2A was found to have functions other than that of nucleotide degrading enzyme. For example, it was found that it could promote proliferation in sarcoma, breast cancer, and glioma cell lines, suggesting that it plays a role in cancer progression [6]. In prostate cancer, a positive correlation between RNASEH2A expression and cancer aggressiveness has been reported [8]. However, we did not detect an association between high RNASEH2A levels and colon cancer prognosis in a previous Taiwanese cohort [5]. The prognostic value of RNASEH2A on patient survival in other cancer types also remains unclear. Furthermore, regulatory pathways that interact with RNASEH2A to determine the growth of tumor cells may exist. It has been reported that certain genes have synthetic dosage lethality (SDL) interactions with genes that are frequently overexpressed in tumors and that inhibition of the SDL partners can decrease cancer proliferation [9]. In the present study, we comprehensively analyzed pan-cancer gene expression profiles that were correlated with RNASEH2A upregulation and we combined stratified survival analyses to identify potential regulatory genes which, together with RNASEH2A, provide great prognostic value for predicting the overall survival rate of cancer patients.

2. Results

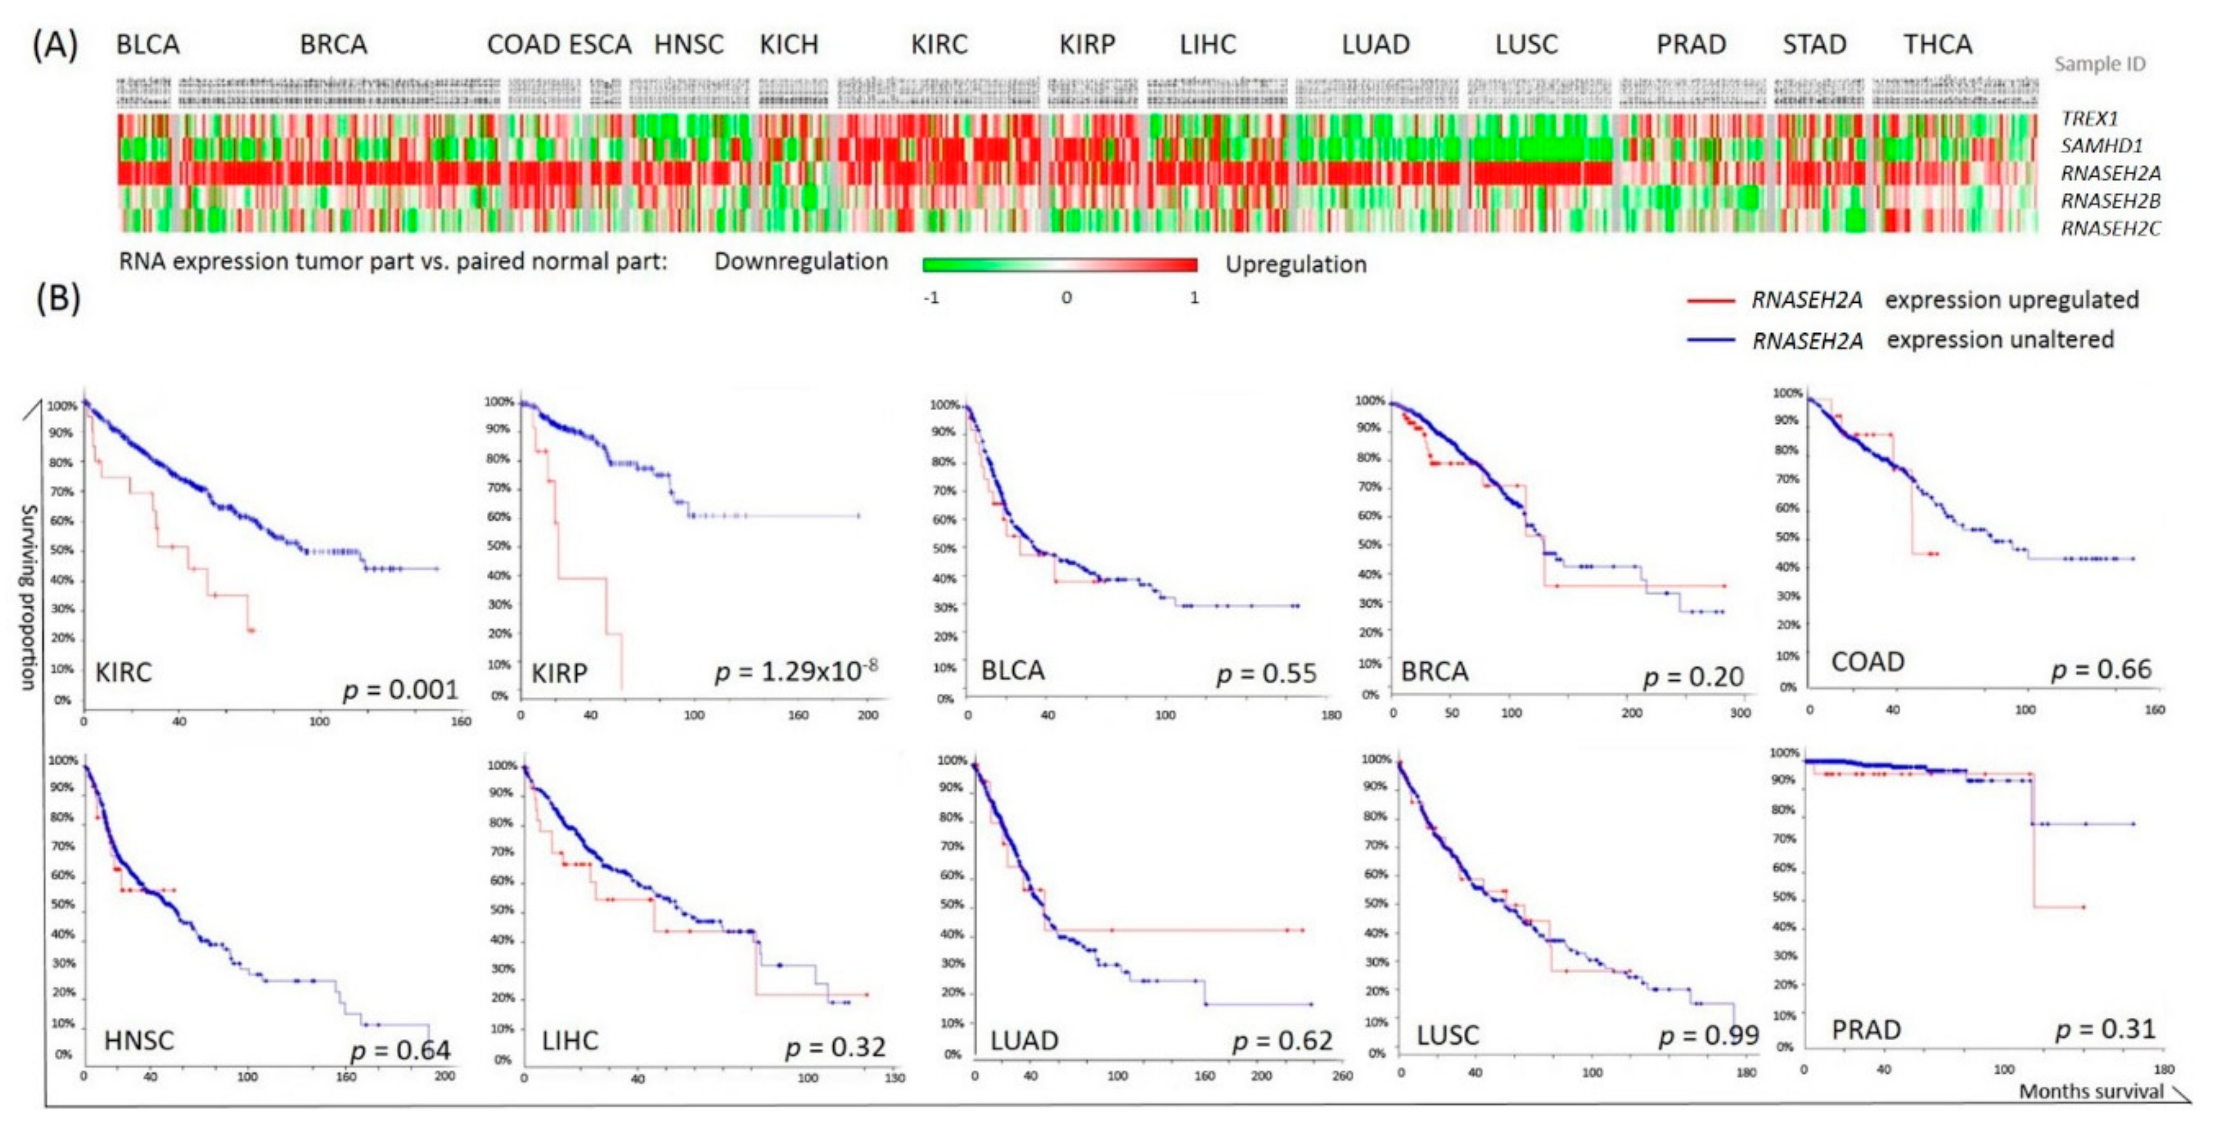
2.1. Pan-Cancer Analysis of Nucleotide Degrading Enzyme Genes

We first screened the messenger RNA (mRNA) expression of the nucleotide degrading enzyme genes TREX1, SAMHD1, RNASEH2A, RNASEH2B, and RNASEH2C in 14 cancer types using TCGA RNAseq data. Upregulation of RNASEH2A in cancerous tissues compared with normal tissues was observed across cancer types, except for chromophobe kidney cancer (KICH) (Figure 1A). However, Kaplan–Meier survival analyses of these cancers using the cBioPortal software showed that higher RNASEH2A expression was associated with a poor prognosis only in renal carcinomas, Figure 1B.

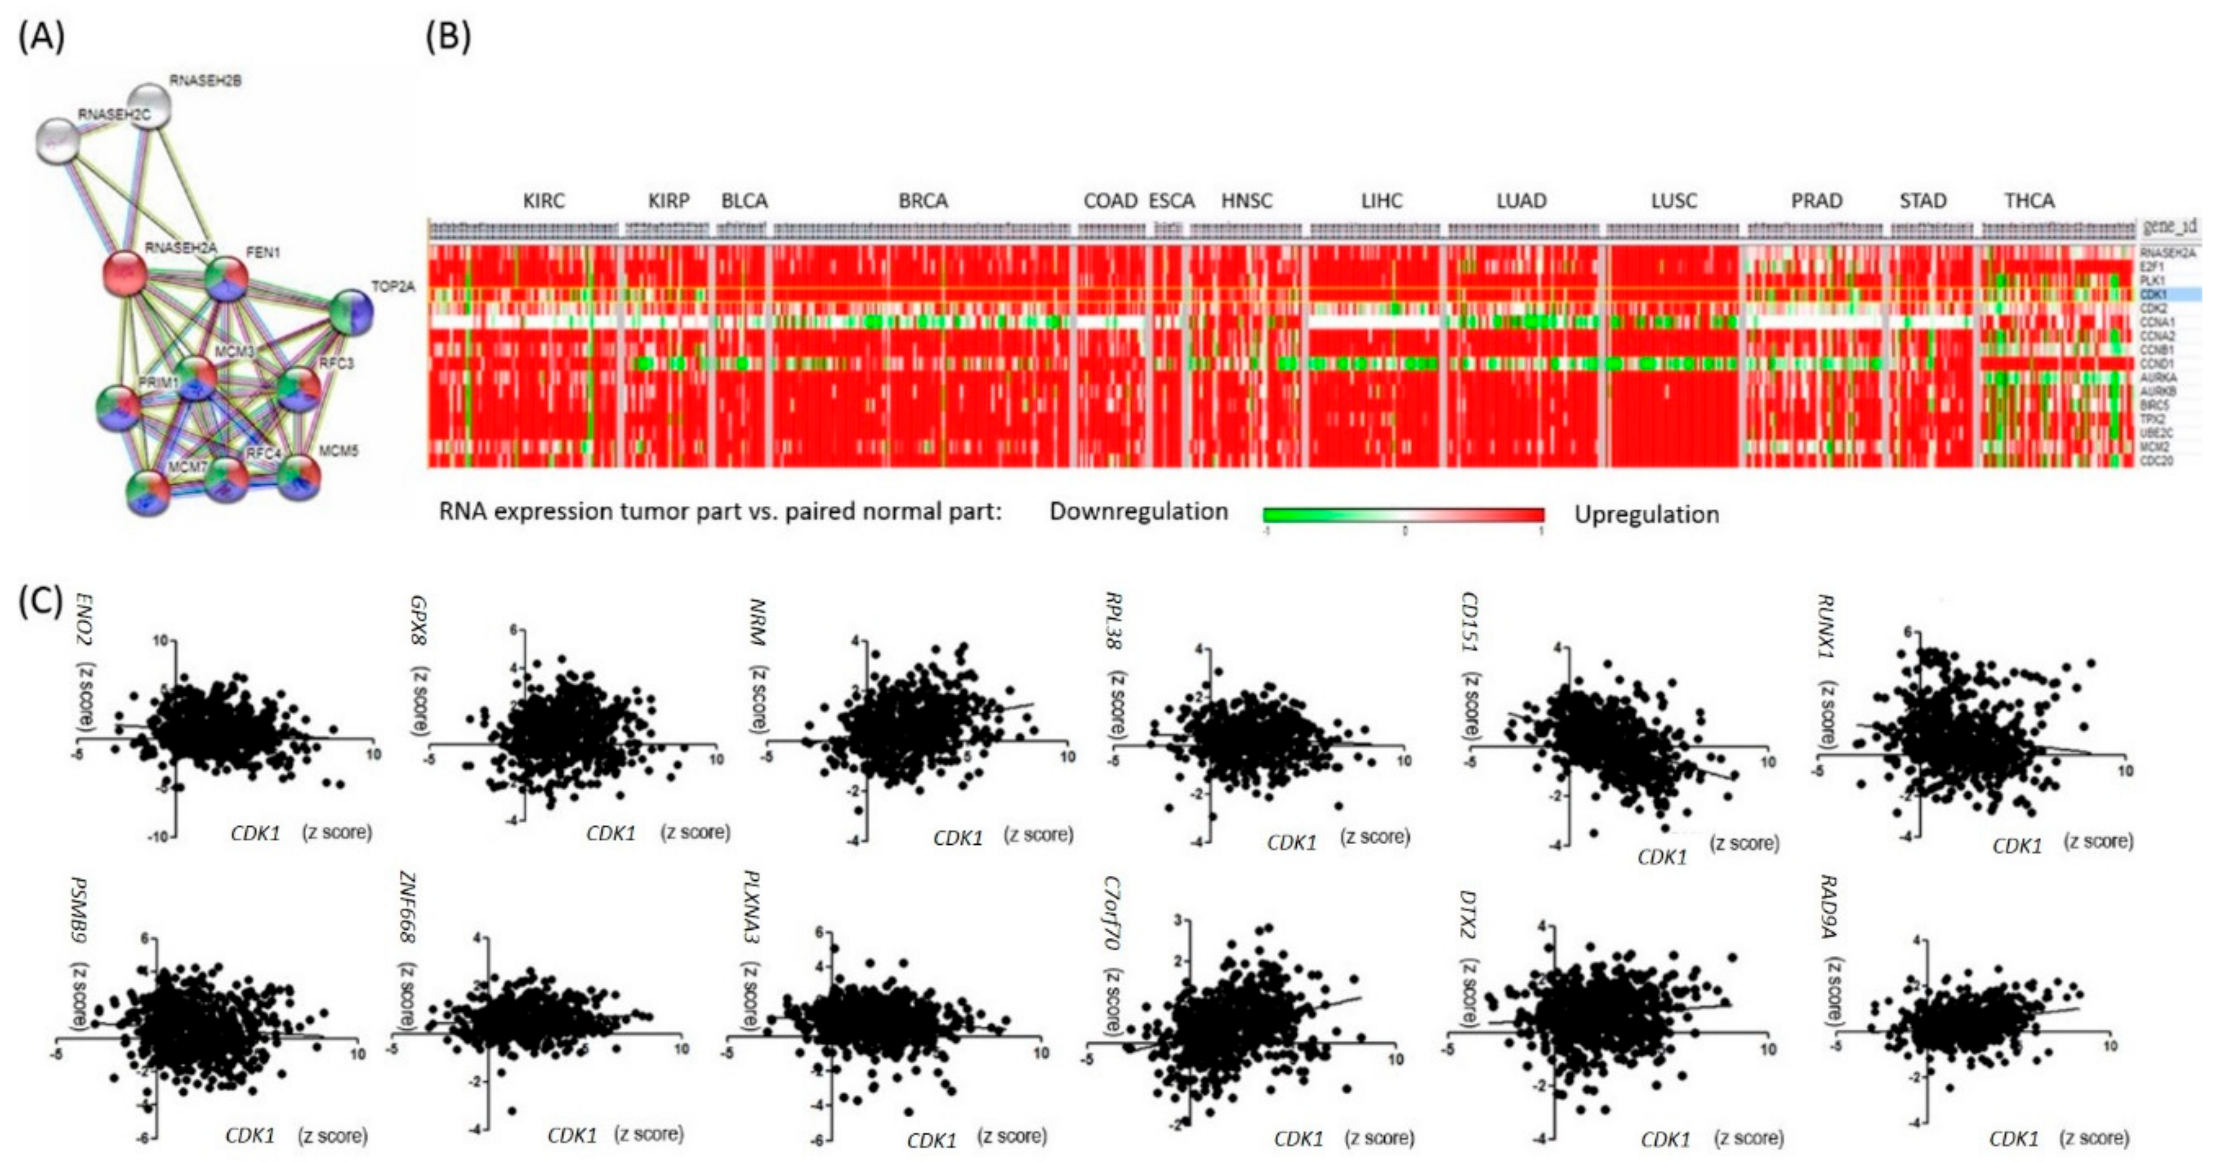
2.2. RNASEH2A Network Analysis and Identification of an Alternative Pathway Promoting Tumor Growth in CDK1-Low Tumors

In order to investigate the additional genes contributing to survival in RNASEH2A-overexpressing tumors, we performed RNASEH2A network analysis using STRING version 10.5 1 [10]. In addition to DNA replication, RNASEH2A was found to be involved in cell cycle pathways (Figure 2A). Examination of the expression of cell cycle genes across cancer types revealed that several kidney cancer samples had lower CDK1 levels when compared to their matched normal parts (Figure 2B). However, CDK1 upregulation alone was associated with poor overall patient survival in kidney renal clear cell carcinoma (KIRC) (log rank p = 4.13 × 10⁻⁸) and kidney renal papillary cell carcinoma (KIRP) (log rank p = 5.1 × 10⁻¹⁵).
In search of an alternative pathway that promotes tumor proliferation, we performed gene correlation studies in five kidney cancer patient samples with high RNASEH2A expression, low CDK1 expression, and bad clinical outcomes (death). Twelve genes were found to be negatively correlated with CDK1 expression, positively correlated with RNASEH2A expression, and associated with patient survival in KIRC or KIRP (Table S2). Further evaluation of the 12 gene expression levels in pooled TCGA RNAseq data of different cancer types revealed a strong negative correlation between CD151 and CDK1 expressions (Pearson r = −0.42, p < 0.0001, Figure 2C). Taken together, besides RNASEH2A upregulation, the CD151-related pathway might contribute to tumor growth in CDK1-low kidney cancers.

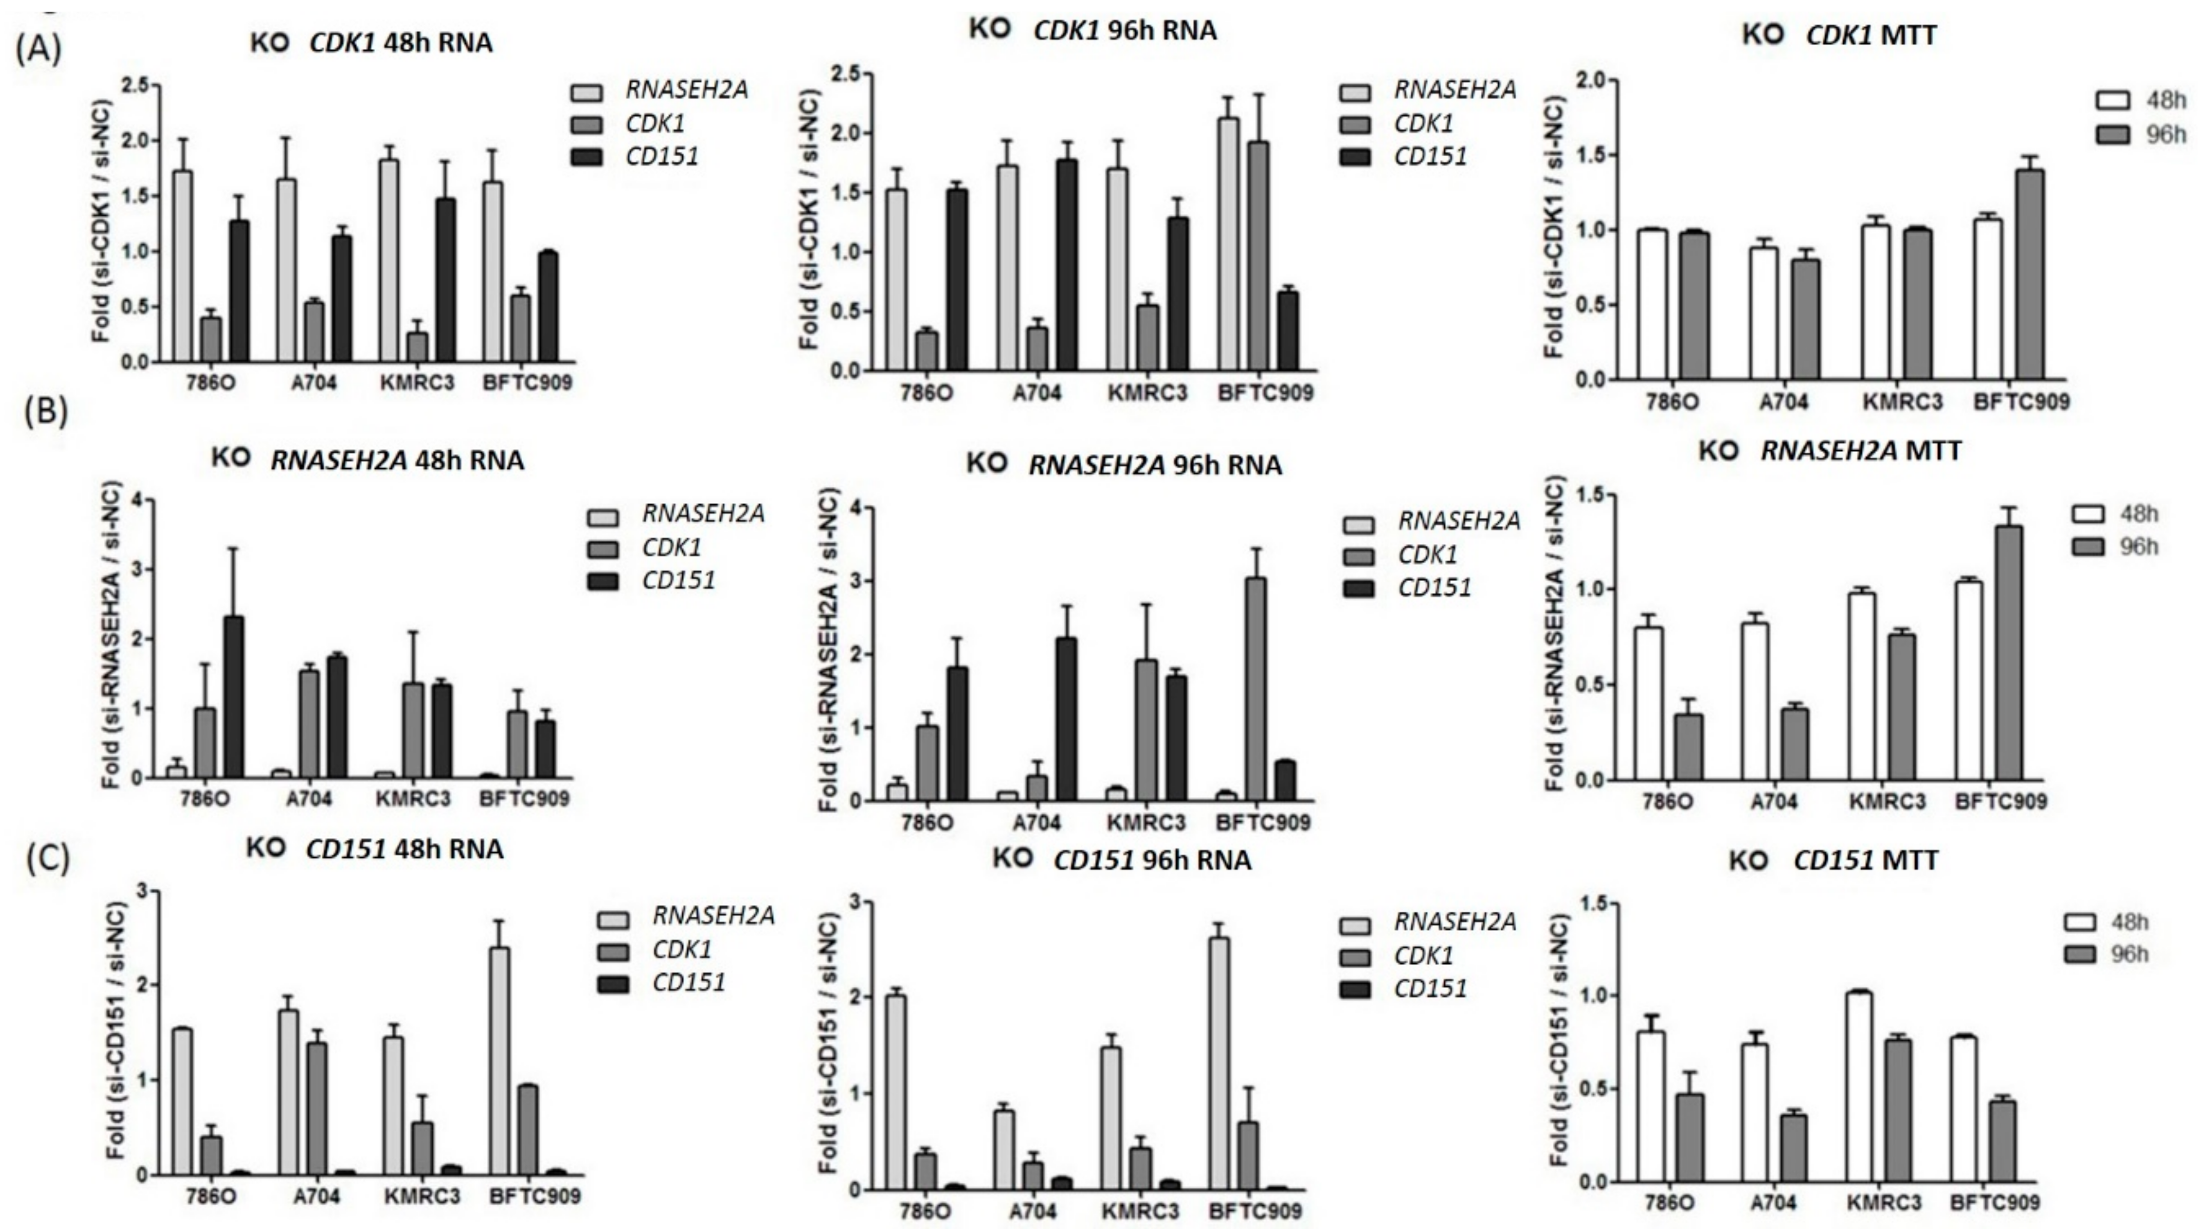
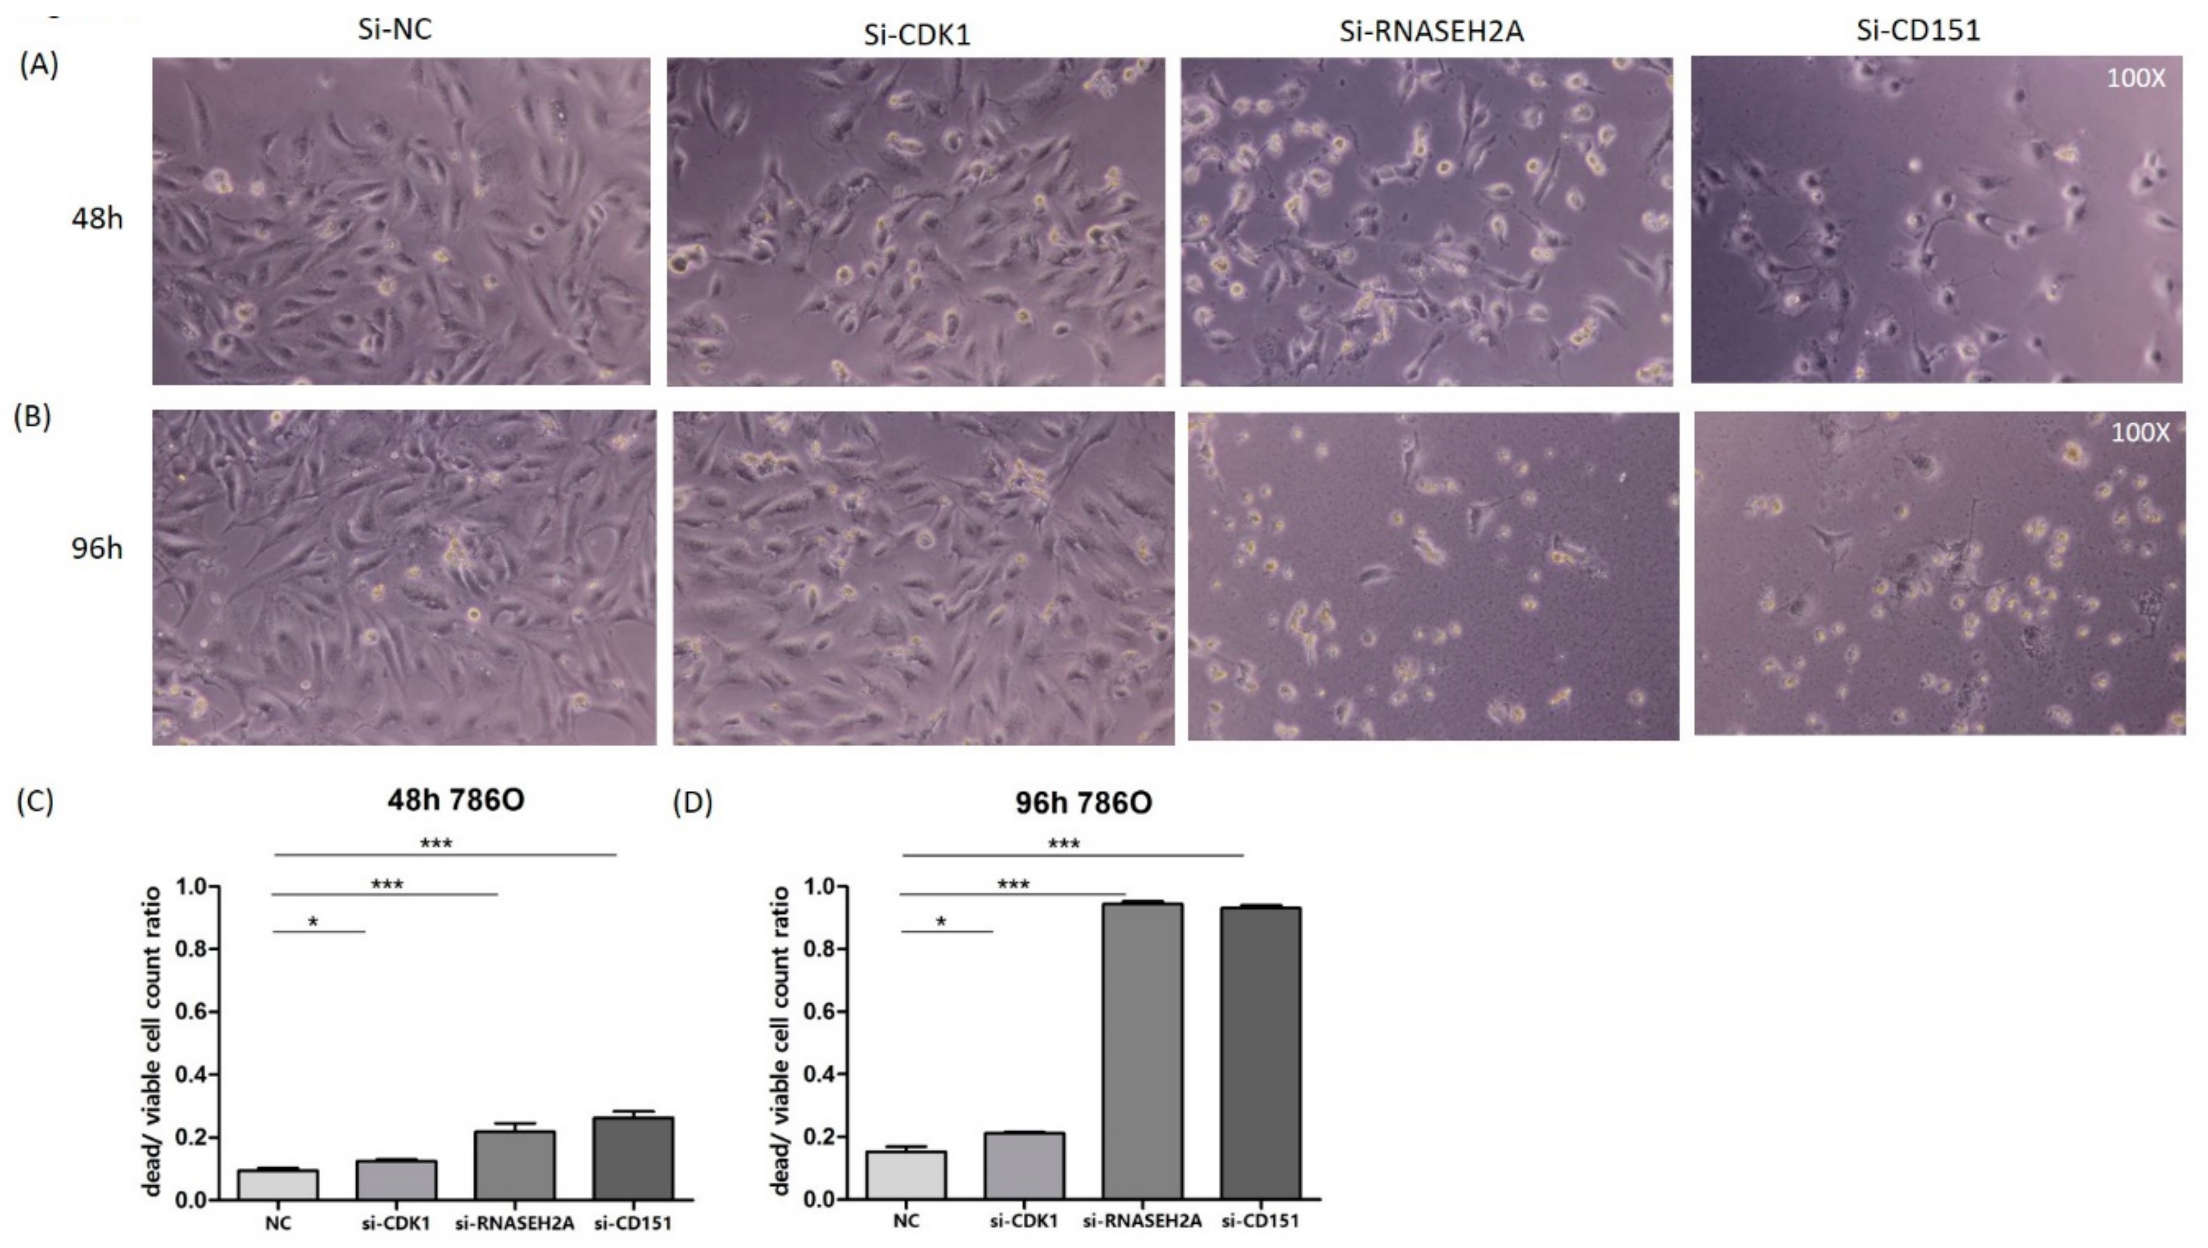
2.3. Analyses of the Interactions of RNASEH2A, CDK1, and CD151 Using Knockdown Studies in Four Kidney Cancer Cell Lines

To study the interactions among RNASEH2A, CDK1, and CD151 and their impact on tumor proliferation, we performed si-RNA knockdown studies on three ccRCC cell lines (786O, A704, KMRC3, all with VHL mutation) and one kidney urothelial carcinoma cell line (BFTC909, without VHL mutation). As shown in Figure 3A, CDK1 knockdown resulted in the upregulation of RNASEH2A and CD151 in all cell lines, however it did not significantly impair tumor proliferation (except for a mild effect on A704). Interestingly, in BFTC909, CDK1 could not be knocked down after a 96-hour si-CDK1 transfection, and the tumor survival rate even increased. Furthermore, RNASEH2A knockdown resulted in CD151 upregulation and decreased proliferation in all ccRCC cell lines. Elevated CDK1 expression was observed in KMRC3 and BFTC909 cell lines 96 h after RNASEH2A knockdown; however, in contrast to KMRC3, CD151 upregulation was not detected in BFTC909, and its cell proliferation was enhanced (Figure 3B). As for CD151 knockdown experiments, the upregulation of RNASEH2A was observed in all kidney cancer cell lines and was associated with impaired tumor proliferation (Figure 3C). Cell viability assays were performed in ccRCC cell line 786O after transfection with si-CDK1, si-RNASEH2A, and si-CD151, which showed comparable results to the 3-(4,5-dimethylthiazol-2-yl)-2,5-diphenyltetrazolium bromide (MTT) assays (Figure 4).

2.4. Analyses of the Prognostic Values of CD151-Related Genes in RCC

Next, we performed CD151 interactome analysis and cluster analysis to identify downstream genes in the CD151-related pathway (Figure 5A,B). The expression of ITGB1, ITGB4, and PLEC was found to be closely clustered with CD151 expression, and their upregulation was associated with poor overall survival in KIRP or KIRC (Figure 5B,C).

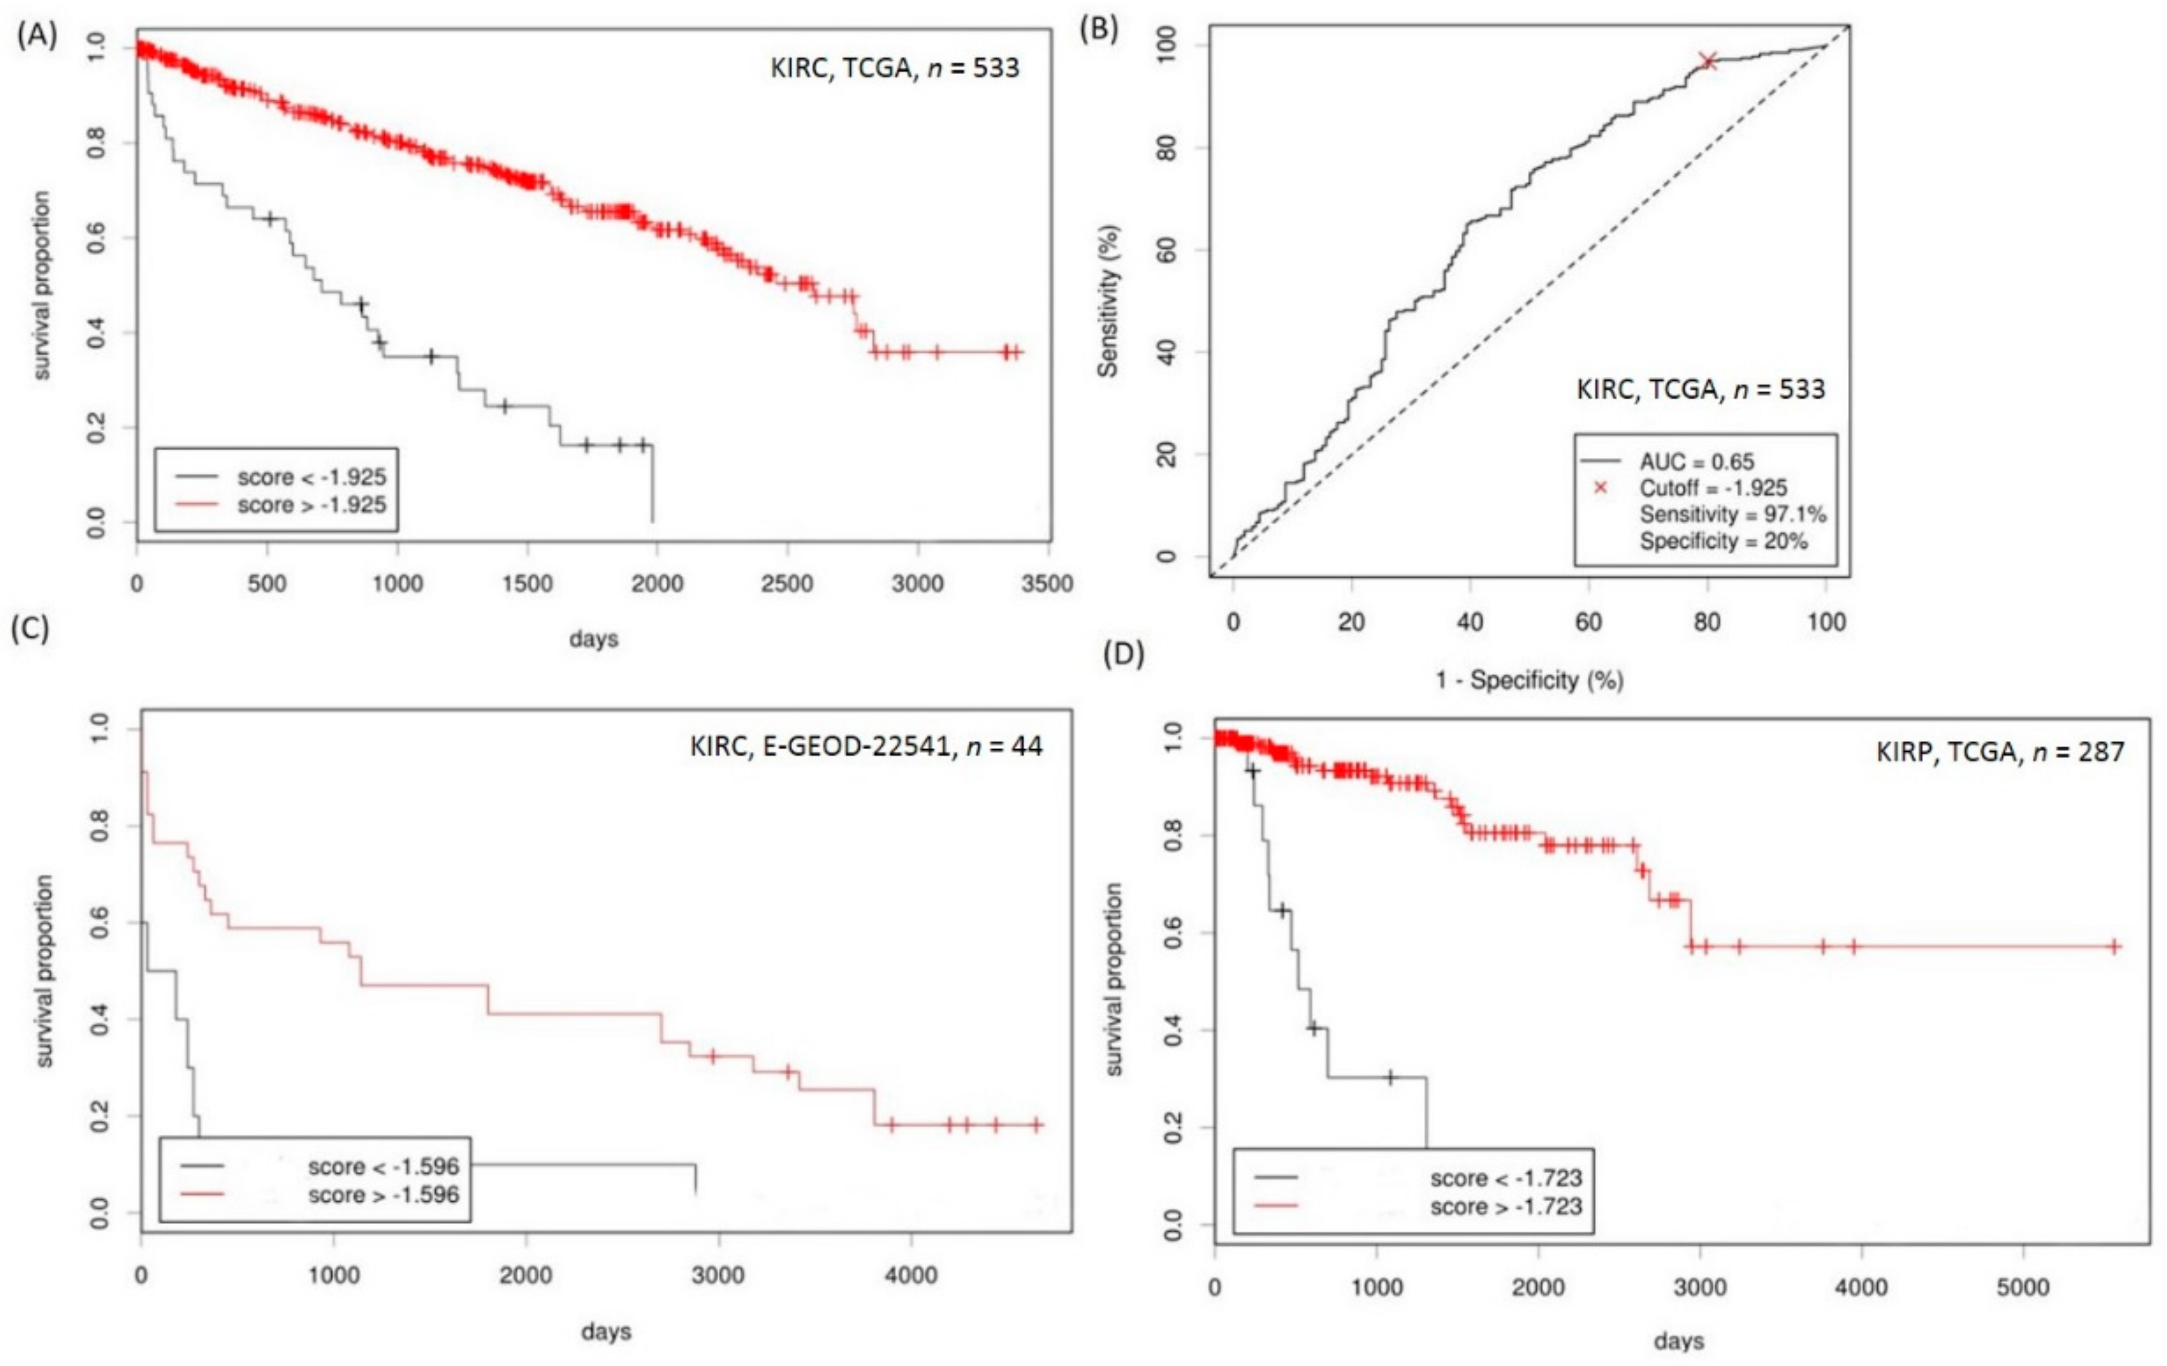
2.5. Establishment of a Prognostication Scoring System for Survival Prediction in RCC

To establish a prognostication scoring system for predicting the ccRCC overall patient survival rate, Cox regression analyses using RNASEH2A, CDK1, and the mean of ITGB1, ITGB4, and PLEC expressions as variables were performed on TCGA KIRC total RNAseq data (tumor sample n = 533, with or without their normal counterparts). Cox regression coefficients (β) were used as weights for each gene expression score: Prediction system = (−0.65)* RNASEH2A expression z score + (−1.13) × CDK1 expression z score + (−0.36) × CD151 expression z score + (−0.40)* mean of (ITGB1, ITGB4, and PLEC expression z scores). The Cutoff Finder was used to determine the optimal cutoff score.
In KIRC, patients with scores lower than the cutoff (−1.925) had a significantly worse overall survival rate compared to those with scores above the cutoff value (mean survival of 955.3 days versus 2242.2 days, hazard ratio (HR) = 4.53 (3.05–6.73), p = 2.2 × 10⁻¹⁶, Figure 6A). The receiver operating characteristic (ROC) curve that was plotted based on the optimal cutoff point is shown in Figure 6B. The prognostication score retained its independent predictive value when co-analyzed with clinical-pathological factors which showed a significant impact on the overall survival in univariate Cox regression analyses (adjusted HR for patients with lower prognostication score (< −1.925) = 2.68 (1.75–4.11), p < 0.0001, Table 1). In another ccRCC cohort, namely, the E-GEOD-22541 expression array data (n = 44), patients with scores lower than −1.596 also showed lower disease-free survival when compared to those with higher scores (mean survival of 390.0 days versus 1889.2 days, HR = 2.99 (1.07–8.35), p = 7.1 × 10⁻⁴, Figure 6C).
Furthermore, we applied the prediction system using the same coefficients as the TCGA KIRP (papillary RCC) cohort (n = 287) and we were able to clearly differentiate the patients with good or bad prognoses (mean survival for score < −1.723 versus score ≥ −1.723: 741.6 days versus 1623.7 days, HR = 13.19 (6.03–28.82), p = 4.4 × 10⁻¹⁶, Figure 6D). The prognostication score also retained its predictive value for the overall survival rate in papillary RCC (pRCC) patients after multivariate analyses considering other clinical-pathological parameters (adjusted HR for patients with score < −1.723 = 7.44 (3.01–18.41), p < 0.0001, Table 1).

3. Discussion

The above analyses highlight that, although RNASEH2A upregulation alone is not a universal cancer prognosis marker, it might form an alternative pathway with CD151 to enhance tumor growth in CDK1-low renal cell carcinomas. A prognostication scoring system based on the expression levels of RNASEH2A-, CDK1-, and CD151-related genes could effectively predict the survival rate of RCC cancer patients (with a mean difference of four years in ccRCC).
CDK1 promotes cell proliferation and survival and it is frequently overexpressed in cancer specimens [11]. Increased CDK1 activity reportedly predicts RCC recurrence, and an association has been found between CDK1 overexpression or hyperactivity and worse prognosis in ovarian, colorectal, and breast cancers [11,12,13,14]. However, the results from clinical trials for CDK inhibitors were mostly disappointing [15]. Similarly, in our study, CDK1 knockdown in RCC cell lines did not have a pronounced effect on tumor growth. Interestingly, increased RNASEH2A and CD151 expression was observed in si-CDK1-treated ccRCC cell lines and were was found in RCC patients with a low tumor CDK1 level and bad clinical outcomes. This suggests that RNASEH2A and CD151 have compensatory roles in promoting cell cycle progression and tumor growth. In contrast to CDK1 knockdown, transfection of RCC cell lines with either si-RNASEH2A or si-CD151 resulted in impaired tumor proliferation. Upregulation of CD151 and RNASEH2A was noted 48 h after si-RNASEH2A and si-CD151 knockdown, respectively, in all kidney cancer cell lines. Since synthetic dosage lethality (SDL) is defined by a combination of gene A overexpression and gene B underexpression and leads to cell death, our results suggest that RNASEH2A and CD151 may have SDL interactions. Therefore, CD151 is a potential drug target in RNASEH2A highly expressing tumors. Validation of the SDL relationships between RNASEH2A and CD151 in other cancer types is needed.
CD151 is known to form complexes with integrins and other transmembrane proteins and could be involved in cancer invasion and metastasis [16]. High CD151 expression alone has been reported to predict cancer progression in ccRCC patients [17]. Our study identified that the expression of CD151 downstream genes ITGB1, ITGB4, and PLEC may have additional prognostic values in kidney cancers. Consistent with this finding, simultaneous blocking of cdk1–cyclin B and integrin subtypes α5, α6, β4 using the drug sulforaphane was found to inhibit everolimus-resistant kidney cancer cell growth [18]. Furthermore, according to the potential SDL relationships between CD151 and RNASEH2A identified by this study, CD151-high RCCs could be treated with RNASEH2A inhibitors.
RCC is among the 15 most common tumors around the world, and ccRCC is the most prevalent subtype [19]. The mortality rate of RCC is about 20–40%, partly due to metastasis at initial presentation, heterogeneity of cancer histology, as well as treatment resistance. Currently, the main prognostication system for metastatic RCC is the Memorial Sloan-Kettering Cancer Center (MSKCC) prognostic category, which is based on clinical and laboratory parameters [20]. Factors concerning tumor biology and the heterogeneous tumor genome and transcriptome are not included. Recently, mRNA and protein expression information was reported to have prognostic values in RCC [21,22]. Our study is the first to comprehensively analyze the genetic heterogeneity and potential SDL interactions that underlie the various clinical outcomes in RNASEH2A-high tumors. The derived prognostication scoring system that uses coefficients calculated from Cox regression analyses of the TCGA KIRC data is able to predict not only the prognosis of ccRCC, but also the survival rate of patients with the pRCC subtype. Our prediction system needs to be further validated in more kidney cancer cohorts.

4. Methods

4.1. Study Populations

The tumor-normal paired gene expression RNAseq data with more than 10 sample pairs were downloaded from The Cancer Genome Atlas (TCGA) data portal (https://tcga-data.nci.nih.gov/tcga/), including 14 cancer types (BLCA, BRCA, COAD, ESCA, HNSC, KICH, KIRC, KIRP, LIHC, LUAD, LUSC, PRAD, STAD, THCA). The full names and abbreviations of these 14 cancers are listed below: bladder urothelial carcinoma (BLCA), breast invasive carcinoma (BRCA), colon adenocarcinoma (COAD), esophageal carcinoma (ESCA), head and neck squamous cell carcinoma (HNSC), chromophobe kidney cancer (KICH), kidney renal clear cell carcinoma (KIRC), kidney renal papillary cell carcinoma (KIRP), liver hepatocellular carcinoma (LIHC), lung adenocarcinoma (LUAD), lung squamous cell carcinoma (LUSC), prostate adenocarcinoma (PRAD), stomach adenocarcinoma (STAD), and thyroid carcinoma (THCA).
Furthermore, clinical data and all tumor RNAseq data collected from KIRC (ccRCC, n = 533) and KIRP (pRCC, n = 287) were also downloaded from TCGA. Moreover, microarray gene expression and clinical data of another clear cell renal cell carcinoma (ccRCC) cohort were downloaded from E-GEOD-22541 [23]. Comparisons of the clinical characteristics of the ccRCC cohorts are shown in the Table S1. This study has been approved on 23 June 2017, by China Medical University Hospital’s Institutional Research Ethics Committee (CMUH106-REC2-077).

4.2. Cell Line Studies

The kidney clear cell carcinoma cell lines 786O, A704, KMRC3, and kidney transitional cell carcinoma cell line BFTC909 were transfected with 10 nM siRNA for RNASEH2A, CD151, CDK1, or a negative control (purchased from MD Bio Inc., Taipei, Taiwan) using Lipofectamine RNAiMAX transfection reagent (Thermo Fisher Scientific-Invitrogen, Waltham, MA, USA), according to the manufacturer’s instructions. After 24 h, 48 h, 72 h, and 96 h of transfection, cell viability and proliferation were evaluated by MTT [3-(4,5-dimethylthiazol-2-yl)-2,5-diphenyltetrazolium bromide] assays. The reduced intracellular purple formazan crystals were dissolved by adding DMSO, and the absorbance was analyzed at 570 nm in a microtiter plate reader. The 786O cell line was also seeded on 24-well plates at 104 cells/well, and cell culture images under a 100× light microscope were taken at 48 h and 96 h post-transfection. Cell viability was evaluated by counting the ratio of dead (rounded cells) versus viable cells (normal shape, attached to the plate).

4.3. RNA Isolation and Real-Time PCR Analyses

Total RNA was extracted by TRIzol Reagent (Thermo Fisher Scientific-Invitrogen, Waltham, MA, USA). Two microgram RNA was reverse-transcribed into cDNA using a High-Capacity cDNA Reverse Transcriptase Kit (Thermo Fisher Scientific-Applied Biosystems, Waltham, MA, USA) for real-time PCR analyses. The expression of GAPDH was used as an endogenous control. All primers were designed and synthesized by Genomics BioSci & Tech, Taipei, Taiwan. The following primer sequences were used: RNASEH2A-forward 5′-GAGAAAGAGGCGGAAGATGTTA-3′, RNASEH2A-reverse 5′-TCTTCCTGAGTCCCTCCTGA-3′; CDK1-forward 5′-TGGATCTGAAGAAATACTTGGATTCTA-3′, CDK1-reverse 5′-CAATCCCCTGTAGGATTTGG-3′; CD151-forward 5′-TCCTGCAGAGGAGTCGTTTC-3′, CD151-reverse 5′-CGGTGCCACATGTTGTCTT-3′.

4.4. Statistical Analysis

The RNA expression data were log2 transformed and normalized to z score (sample value minus data mean and then divided by data standard deviation). Kaplan–Meier analyses for the overall survival (OS) in patients with RNASEH2A overexpression were performed using the cBioPortal software (http://www.cbioportal.org/). Kaplan–Meier and Cox proportional hazards regression analyses for OS in patients with differential gene expression patterns were calculated via the MedCalc software version 14. The log-rank test p < 0.05 was used to determine the significance of the survival analysis.
For the establishment of the prognostication scoring system, the beta value of each gene upregulation (z score ≥ 0.5) was derived from the Cox regression analysis and was used as the weight to multiply the gene expression value (z score). The score was calculated on the ∑β × gene expression z score. Cutoff Finder version 2.1 [24] was used to determine the optimal cutoff scores and to plot the Kaplan–Meier survival curves, as well as the receiver operating characteristic (ROC) curves based on the cutoff values. Multivariate Cox regression analyses on prediction scores and significant clinical parameters (defined by univariate analyses) in RCC cohorts were performed via the SAS software v.9.3 (SAS Institute, Inc., Cary, NC, USA) to determine whether our score could predict RCC patient survival independently.
For categorical data, the Fisher’s exact test was used to evaluate the statistical significance. The Mann–Whitney U test was performed to calculate the differences in cell MTT proliferation assays and in cell viability assays. Gene expression correlation studies were analyzed by Pearson’s tests. Gene expression cluster analysis was performed via MORPHEUS software (https://software.broadinstitute.org/morpheus).

5. Conclusions

This study suggests that higher RNASEH2A and CD151 gene expression might provide alternative pathways that enhance proliferation in CDK1-low tumors and presents a clinically applicable prognostication scoring system for RCC patients.

Supplementary Materials

Supplementary materials can be found at https://0-www-mdpi-com.brum.beds.ac.uk/1422-0067/19/6/1586/s1.

Author Contributions

C.-A.Y. conceived and designed the experiments, analyzed and interpreted data, wrote the manuscript. H.-Y.H. designed and analyzed data. J.-C.Y. acquired and analyzed data. J.-G.C. conceived and designed the experiments and interpreted data. All authors have read and approved the final manuscript.

Acknowledgments

This project was supported by the Ministry of Science and Technology (MOST), Taiwan, grant 106-2314-B-039-047-MY3. We thank Shun-Jen Chang for statistical consulting.

Conflicts of Interest

The authors declare no conflict of interest.

References

  1. Kohnken, R.; Kodigepalli, K.M.; Wu, L. Regulation of deoxynucleotide metabolism in cancer: Novel mechanisms and therapeutic implications. Mol. Cancer 2015, 14, 176. [Google Scholar] [CrossRef] [PubMed]
  2. Merati, M.; Buethe, D.J.; Cooper, K.D.; Honda, K.S.; Wang, H.; Gerstenblith, M.R. Aggressive CD8(+) epidermotropic cutaneous T-cell lymphoma associated with homozygous mutation in SAMHD1. JAAD Case Rep. 2015, 1, 227–229. [Google Scholar] [CrossRef] [PubMed]
  3. Volkman, H.E.; Stetson, D.B. The enemy within: Endogenous retroelements and autoimmune disease. Nat. Immunol. 2014, 15, 415–422. [Google Scholar] [CrossRef] [PubMed]
  4. Pokatayev, V.; Hasin, N.; Chon, H.; Cerritelli, S.M.; Sakhuja, K.; Ward, J.M.; Morris, H.D.; Yan, N.; Crouch, R.J. RNase H2 catalytic core Aicardi-Goutieres syndrome-related mutant invokes cGAS-STING innate immune-sensing pathway in mice. J. Exp. Med. 2016, 213, 329–336. [Google Scholar] [CrossRef] [PubMed]
  5. Yang, C.A.; Huang, H.Y.; Chang, Y.S.; Lin, C.L.; Lai, I.L.; Chang, J.G. DNA-Sensing and Nuclease Gene Expressions as Markers for Colorectal Cancer Progression. Oncology 2016, 92, 115–124. [Google Scholar] [CrossRef] [PubMed]
  6. Feng, S.; Cao, Z. Is the role of human RNase H2 restricted to its enzyme activity? Prog. Biophys. Mol. Biol. 2016, 121, 66–73. [Google Scholar] [CrossRef] [PubMed]
  7. Sparks, J.L.; Chon, H.; Cerritelli, S.M.; Kunkel, T.A.; Johansson, E.; Crouch, R.J.; Burgers, P.M. RNase H2-initiated ribonucleotide excision repair. Mol. Cell 2012, 47, 980–986. [Google Scholar] [CrossRef] [PubMed]
  8. Williams, K.A.; Lee, M.; Hu, Y.; Andreas, J.; Patel, S.J.; Zhang, S.; Chines, P.; Elkahloun, A.; Chandrasekharappa, S.; Gutkind, J.S.; et al. A systems genetics approach identifies CXCL14, ITGAX, and LPCAT2 as novel aggressive prostate cancer susceptibility genes. PLoS Genet. 2014, 10, e1004809. [Google Scholar] [CrossRef] [PubMed]
  9. Megchelenbrink, W.; Katzir, R.; Lu, X.; Ruppin, E.; Notebaart, R.A. Synthetic dosage lethality in the human metabolic network is highly predictive of tumor growth and cancer patient survival. Proc. Natl. Acad. Sci. USA 2015, 112, 12217–12222. [Google Scholar] [CrossRef] [PubMed]
  10. Szklarczyk, D.; Morris, J.H.; Cook, H.; Kuhn, M.; Wyder, S.; Simonovic, M.; Santos, A.; Doncheva, N.T.; Roth, A.; Bork, P.; et al. The STRING database in 2017: Quality-controlled protein-protein association networks, made broadly accessible. Nucleic Acids Res. 2017, 45, D362–D368. [Google Scholar] [CrossRef] [PubMed]
  11. Xi, Q.; Huang, M.; Wang, Y.; Zhong, J.; Liu, R.; Xu, G.; Jiang, L.; Wang, J.; Fang, Z.; Yang, S. The expression of CDK1 is associated with proliferation and can be a prognostic factor in epithelial ovarian cancer. Tumour Biol. 2015, 36, 4939–4948. [Google Scholar] [CrossRef] [PubMed]
  12. Hongo, F.; Takaha, N.; Oishi, M.; Ueda, T.; Nakamura, T.; Naitoh, Y.; Naya, Y.; Kamoi, K.; Okihara, K.; Matsushima, T.; et al. CDK1 and CDK2 activity is a strong predictor of renal cell carcinoma recurrence. Urol. Oncol. 2014, 32, 1240–1246. [Google Scholar] [CrossRef] [PubMed]
  13. Gan, W.; Zhao, H.; Li, T.; Liu, K.; Huang, J. CDK1 interacts with iASPP to regulate colorectal cancer cell proliferation through p53 pathway. Oncotarget 2017, 8, 71618–71629. [Google Scholar] [CrossRef] [PubMed]
  14. Kim, S.J.; Masuda, N.; Tsukamoto, F.; Inaji, H.; Akiyama, F.; Sonoo, H.; Kurebayashi, J.; Yoshidome, K.; Tsujimoto, M.; Takei, H.; et al. The cell cycle profiling-risk score based on CDK1 and 2 predicts early recurrence in node-negative, hormone receptor-positive breast cancer treated with endocrine therapy. Cancer Lett. 2014, 355, 217–223. [Google Scholar] [CrossRef] [PubMed]
  15. Asghar, U.; Witkiewicz, A.K.; Turner, N.C.; Knudsen, E.S. The history and future of targeting cyclin-dependent kinases in cancer therapy. Nat. Rev. Drug Discov. 2015, 14, 130–146. [Google Scholar] [CrossRef] [PubMed]
  16. Sadej, R.; Grudowska, A.; Turczyk, L.; Kordek, R.; Romanska, H.M. CD151 in cancer progression and metastasis: A complex scenario. Lab. Investig. 2014, 94, 41–51. [Google Scholar] [CrossRef] [PubMed]
  17. Yoo, S.H.; Lee, K.; Chae, J.Y.; Moon, K.C. CD151 expression can predict cancer progression in clear cell renal cell carcinoma. Histopathology 2011, 58, 191–197. [Google Scholar] [CrossRef] [PubMed]
  18. Juengel, E.; Maxeiner, S.; Rutz, J.; Justin, S.; Roos, F.; Khoder, W.; Tsaur, I.; Nelson, K.; Bechstein, W.O.; Haferkamp, A.; et al. Sulforaphane inhibits proliferation and invasive activity of everolimus-resistant kidney cancer cells in vitro. Oncotarget 2016, 7, 85208–85219. [Google Scholar] [CrossRef] [PubMed]
  19. Ridge, C.A.; Pua, B.B.; Madoff, D.C. Epidemiology and staging of renal cell carcinoma. Semin. Intervent. Radiol. 2014, 31, 3–8. [Google Scholar] [CrossRef] [PubMed]
  20. Motzer, R.J.; Bacik, J.; Murphy, B.A.; Russo, P.; Mazumdar, M. Interferon-alfa as a comparative treatment for clinical trials of new therapies against advanced renal cell carcinoma. J. Clin. Oncol. 2002, 20, 289–296. [Google Scholar] [CrossRef] [PubMed]
  21. Kim, S.H.; Park, W.S.; Park, E.Y.; Park, B.; Joo, J.; Joung, J.Y.; Seo, H.K.; Lee, K.H.; Chung, J. The prognostic value of BAP1, PBRM1, pS6, PTEN, TGase2, PD-L1, CA9, PSMA, and Ki-67 tissue markers in localized renal cell carcinoma: A retrospective study of tissue microarrays using immunohistochemistry. PLoS ONE 2017, 12, e0179610. [Google Scholar] [CrossRef] [PubMed]
  22. Giridhar, K.V.; Sosa, C.P.; Hillman, D.W.; Sanhueza, C.; Dalpiaz, C.L.; Costello, B.A.; Quevedo, F.J.; Pitot, H.C.; Dronca, R.S.; Ertz, D.; et al. Whole Blood mRNA Expression-Based Prognosis of Metastatic Renal Cell Carcinoma. Int. J. Mol. Sci. 2017, 18, 2326. [Google Scholar] [CrossRef] [PubMed]
  23. Wuttig, D.; Baier, B.; Fuessel, S.; Meinhardt, M.; Herr, A.; Hoefling, C.; Toma, M.; Grimm, M.O.; Meye, A.; Rolle, A.; et al. Gene signatures of pulmonary metastases of renal cell carcinoma reflect the disease-free interval and the number of metastases per patient. Int. J. Cancer 2009, 125, 474–482. [Google Scholar] [CrossRef] [PubMed]
  24. Budczies, J.; Klauschen, F.; Sinn, B.V.; Gyorffy, B.; Schmitt, W.D.; Darb-Esfahani, S.; Denkert, C. Cutoff Finder: A comprehensive and straightforward Web application enabling rapid biomarker cutoff optimization. PLoS ONE 2012, 7, e51862. [Google Scholar] [CrossRef] [PubMed]
Figure 1. Cancer nucleotide degrading enzyme gene expressions and their association with patient overall survival. (A) TREX1, SAMHD1, RNASEH2A, RNASEH2B, and RNASEH2C expression in each subject as compared with the corresponding normal tissues. Red indicates higher expression in tumor tissue and green indicates lower expression in cancer, as compared to normal tissues. Each column represents a patient sample of The Cancer Genome Atlas (TCGA) cancer cohorts. (B) Kaplan-Meier analyses of overall survival in patients with higher RNASEH2A expression (red line) or with unaltered RNASEH2A expression (blue line) calculated by cBioPortal software; p values were calculated by log-rank tests.
Ijms 19 01586 g001
Figure 2. Genes correlated with RNASEH2A expression. (A) RANSEH2A network analysis via STRING. Genes are enriched in pathways of DNA replication (red), mitotic cell cycle (blue), and cell cycle progression (green). (B) Expression profile of cell cycle-related genes in TCGA 13 cancer cohorts. CDK1 is marked in blue. (C) Pan-cancer gene expression analyses plotted in correlation with CDK1 expression.
Ijms 19 01586 g002
Figure 3. Kidney cancer cell line knockdown (KO) studies. (A) si-CDK1 (B) si-RNASEH2A (C) si-CD151. Gene expression fold changes at 48 h (left graphs) and at 96 h (middle graphs) post-transfection and knockdown effects on tumor proliferation measured by MTT assays (right graphs) are shown. Bars represent mean ± SD, n = 3.
Ijms 19 01586 g003
Figure 4. Cell viability assay in 786O cell line. (A,B) Light microscopy images of cells taken at 100× magnification, at 48 h (A) and 96 h (B) after transfection with si-NC (negative control), si-CDK1, si-RNASEH2A, or si-CD151. (C,D) Differential dead and viable cell count ratios in 786O cells transfected with si-NC, si-CDK1, si-RNASEH2A, or si-CD151 at 48 h (C) and 96 h (D). The bars represent mean ± SEM, n = 9; * p < 0.05; *** p < 0.0001 by Mann–Whitney U tests.
Ijms 19 01586 g004
Figure 5. Genes correlated with CD151 expression. (A) Interactome analysis of CD151 via cBioPortal. (B) Cluster analysis of genes correlated with CD151 expression in different cancers. Genes that correlated the most with CD151 are marked in blue. (C) Kaplan–Meier analyses of the overall survival in TCGA kidney cancer patients with or without altered gene expressions, calculated by cBioPortal.
Ijms 19 01586 g005
Figure 6. Prediction of kidney cancer overall patient survival rate using scores derived from cancer expression profiles of RNASEH2A, CDK1, CD151, ITGB1, ITGB4, and PLEC. (A) Kaplan–Meier analysis of the TCGA KIRC patients’ overall survival based on the optimal cutoff score derived from the cutoff finder. (B) Receiver operating characteristic (ROC) curve plotted on the optimal cutoff score of the TCGA kidney renal clear cell carcinoma (KIRC) cohort. (C) Kaplan–Meier analysis of disease-free survival of the E-GEOD-22541 clear cell renal cell carcinoma (ccRCC) validation cohort based on the optimal cutoff score. (D) Kaplan–Meier analysis of the TCGA kidney renal papillary cell carcinoma (KIRP) patients’ overall survival based on the optimal cutoff score.
Ijms 19 01586 g006
Table 1. Univariate and multivariate Cox regression analyses to identify predictors of overall survival in ccRCC and papillary RCC (pRCC).
VariableGroupUnadjusted HR (95% CI)p ValueAdjusted HR (95% CI)p Value
KIRC (n = 533)
Age (per year) 1.02 (1.02–1.04)<0.0001--
SexMale0.95 (0.69–1.31)0.77--
Female1
StageHigh (stage III–IV)4.28 (3.06–5.99)<0.0001--
Low (stage I–II)1
Distant metastasisM14.59 (3.32–6.33)<0.0001--
M01
Fuhrman gradeHigh (Gr 3–4)2.85 (1.98–4.11)<0.0001--
Low (Gr 1–2)1
Prediction scoreLow (<−1.925)4.53 (3.05–6.73)<0.00012.68 (1.75–4.11)<0.0001
High (≥−1.925)1
KIRP (n = 287)
Age (per year) 1.01 (0.98–1.04)0.56--
SexMale0.72 (0.32–1.62)0.43--
Female1
StageHigh (stage (III–IV)4.86 (2.22–10.66)<0.0001--
Low (stage I–II)1
Prediction scoreLow (<−1.723)13.19 (6.03–28.83)<0.00017.44 (3.01–18.41)<0.0001
High (≥−1.723)1
HR: Hazard ratio.

