Article

Overexpression of BraLTP2, a Lipid Transfer Protein of Brassica napus, Results in Increased Trichome Density and Altered Concentration of Secondary Metabolites

Key Laboratory of Oil Crop Biology of the Ministry of Agriculture, Oil Crops Research Institute, Chinese Academy of Agricultural Sciences, Wuhan 430062, China
*
Author to whom correspondence should be addressed.
These authors contributed equally to this work.
Int. J. Mol. Sci. 2018, 19(6), 1733; https://0-doi-org.brum.beds.ac.uk/10.3390/ijms19061733
Submission received: 10 May 2018 / Revised: 28 May 2018 / Accepted: 28 May 2018 / Published: 12 June 2018
(This article belongs to the Section Molecular Plant Sciences)

Abstract

:
Plant non-specific lipid transfer proteins (nsLTPs) belong to a large multigene family that possesses complex physiological functions. Trichomes are present on the aerial surfaces of most plants and include both glandular secretory hairs and non-glandular hairs. In this study, BraLTP2 was isolated from Brassica rapa (B. rapa) and its function was characterized in the important oilseed crop Brassica napus (B. napus). B. rapa lipid transfer protein 2 (BraLTP2) belongs to the little-known Y class of nsLTPs and encodes a predicted secretory protein. In ProBraLTP2::GUS (β-glucuronidase) transgenic plants, strong GUS activity was observed in young leaves and roots, while low activity was observed in the anther. It is noteworthy that strong GUS activity was observed in trichomes of the first four leaves of 4-week-old and 8-week-old seedings, however, it disappeared in 12-week-old seedings. In transgenic plants expressing a BraLTP2::GFP (green fluorescent protein) fusion protein, GFP fluorescence localized in the extracellular space of epidermal cells and trichomes. Overexpression of BraLTP2 in B. napus caused an increase in trichome number and altered the accumulation of secondary metabolites in leaves, including 43 upregulated secondary metabolites. Moreover, transgenic plants showed significantly increased activities of antioxidant enzymes. These results suggest that BraLTP2, a new nsLTP gene, may play a role in trichome development and the accumulation of secondary metabolites.

1. Introduction

Trichomes, which are derived from epidermal cells (outermost embryo’s cells), are specialized unicellular or multicellular structures that have various functions depending on the plant species and organ [1]. The criterion that is most often used to classify trichomes is whether they are glandular or not [2]. In the model plant Arabidopsis thaliana (A. thaliana, Cruciferae), only non-glandular trichomes are found, which are unicellular and can be either unbranched, or have two to five branches [3]. Trichomes represent the first barrier for overcoming pathogens and herbivorous arthropods because of their hairy physical properties [4].
Trichomes produce and accumulate secondary metabolites—such as flavonoids [5,6], phenylpropanoids [7], terpenoids [8], alkaloid [9], and defensive proteins [10]—With strong antifungal activity [11]; potential as natural pesticides [12]; and antirdical properties [13,14], such as protection against UV radiation [15,16].
Previous studies have reported that trichome gene expression sequence tags (ESTs) have been associated with resistance-related genes and biosynthetic pathways for secondary metabolites in mint (Mentha piperita) [17], basil (Ocimum basilicum) [7,18], alfalfa (Medicago sativa) [19], sweet wormwood (Artemisia annua) [20], hops (Humulus lupulus) [21], Greek sage (Salvia fruticosa) [22], tobacco (Nicotiana tabacum) [23], and tomato (Lycopersicum esculentum) [24]. It has been suggested that non-specific lipid transfer proteins (nsLTPs) are involved in the regulation of secondary metabolite biosynthesis, and have a role in resisting biological and abiotic stress [25,26,27].
In higher plants, nsLTPs are small, abundant, and basic secreted proteins [28,29], categorized into nine types (type I–IX) based on a genome-wide analysis of rice, wheat, and A. thaliana according to sequence similarity and intervals of eight-cysteine motif (8 CM) [30]. Type Y nsLTPs were first included in the nine nsLTP types, but because of the fact that their position was not well supported, they were excluded from the alignment [30]. The first plant lipid transfer protein was isolated from potato tuber [31]. Most nsLTP genes have been isolated and characterized in flowering plants (angiosperms), especially from major crops such as wheat (Triticum aestivum) [30], rice (Oryza sativa) [30], soybean (Glycine max) [32], Chinese cabbage (Brassica rapa (B. rapa)) [33], and maize [34]. nsLTPs have been implicated in complex physiological functions, such as abiotic stress resistance [35,36,37,38], pathogen defense [39,40], cutin and wax metabolism [25], sexual reproduction [41,42], and cell development [43,44]. In tobacco, it has been reported that nsLTPs were involved in secondary metabolisms [27]. The tobacco NtLTP1 gene encodes a trichome-specific lipid transfer protein, reported to be required for the transfer of metabolites from trichomes, which affected the accumulation of cuticular metabolites [27].
In this study, we characterized the B. rapa lipid transfer protein 2 (BraLTP2), which is expressed in leaf epidermal cells and trichomes. Additionally, we examined the biological function of BraLTP2 related to trichome development and secondary metabolites in Brassica napus (B. napus). Until recently, all type Y nsLTP genes were poorly studied, with no known function, providing a good opportunity to explore new physiological functions of this family in processes such as trichome development, as shown herein. BraLTP2 is the first type Y nsLTP family gene that has been found to affect the growth and development of epidermal trichomes and their effects on secondary metabolites. Our study will help broaden and deepen our understanding of the nsLTP gene function and will lay a foundation for the future application of nsLTP genes in Brassica breeding.

2. Results

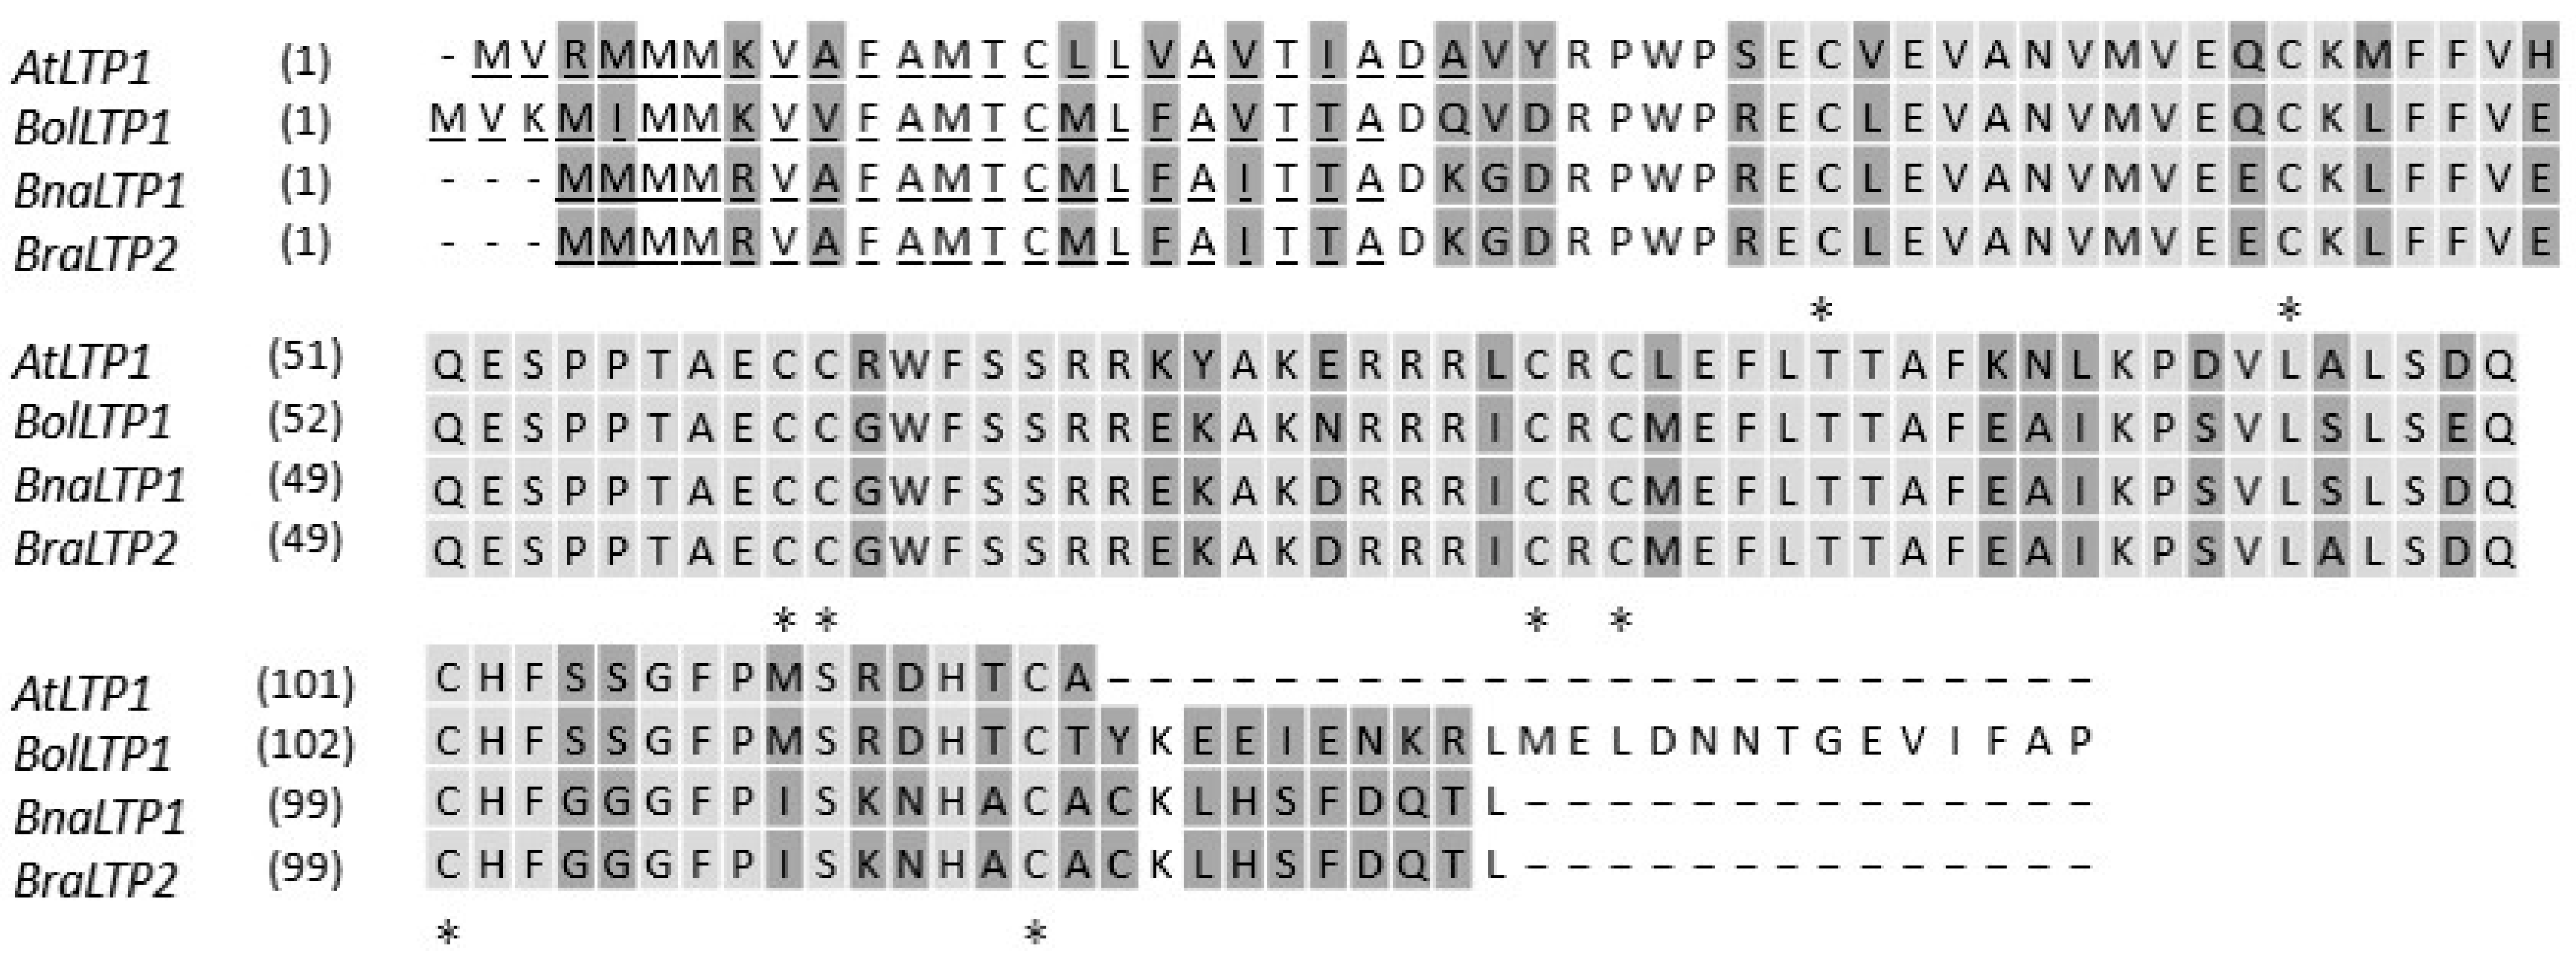
2.1. Gene and Protein Sequence Characterization

BraLTP2 has an open reading frame of 375 bp, encoding a protein of 124 amino acid residues with a molecular mass of 14 kDa and a calculated isoelectric point of 7.5 (Figure 1). BraLTP2 has 74% identity with AtLTP1 from Arabidopsis, 99% identity with BnaLTP1 from B. napus, and 85% identity with BolLTP1 from B. oleracea (Figure 1).
All species possessed high levels of sequence similarity in the nsLTP-like domain regions (Figure 1; light shaded amino acids 32 to 113 in BraLTP2 and BnaLTP1, 36 to 116 in BolLTP1, and 35 to 115 in AtLTP1). A putative extracellular secretary signal (Figure 1; amino acids 1 to 24 in Arabidopsis, 1 to 23 in B. oleracea, and 1 to 20 in the other Brassica species) was 100% conserved in the Brassica species (Figure 1). Eighteen amino acid substitutions exist in the nsLTP-like domains between AtLTP1 and the Brassica genes. The eight strictly conserved cysteine residues in all plant LTPs, which form four intrachain disulfide bridges, were also 100% conserved among all aligned sequences.
To obtain more information on the function of BraLTP2, we have predicted the cis–acting elements of the BraLTP2 promoter using PlantCARE, and the results are listed in Table 1. The predicted cis–acting elements included typical light response elements, resistance response elements, phytohormone response elements, and protein binding sites of the BraLTP2 promoter.

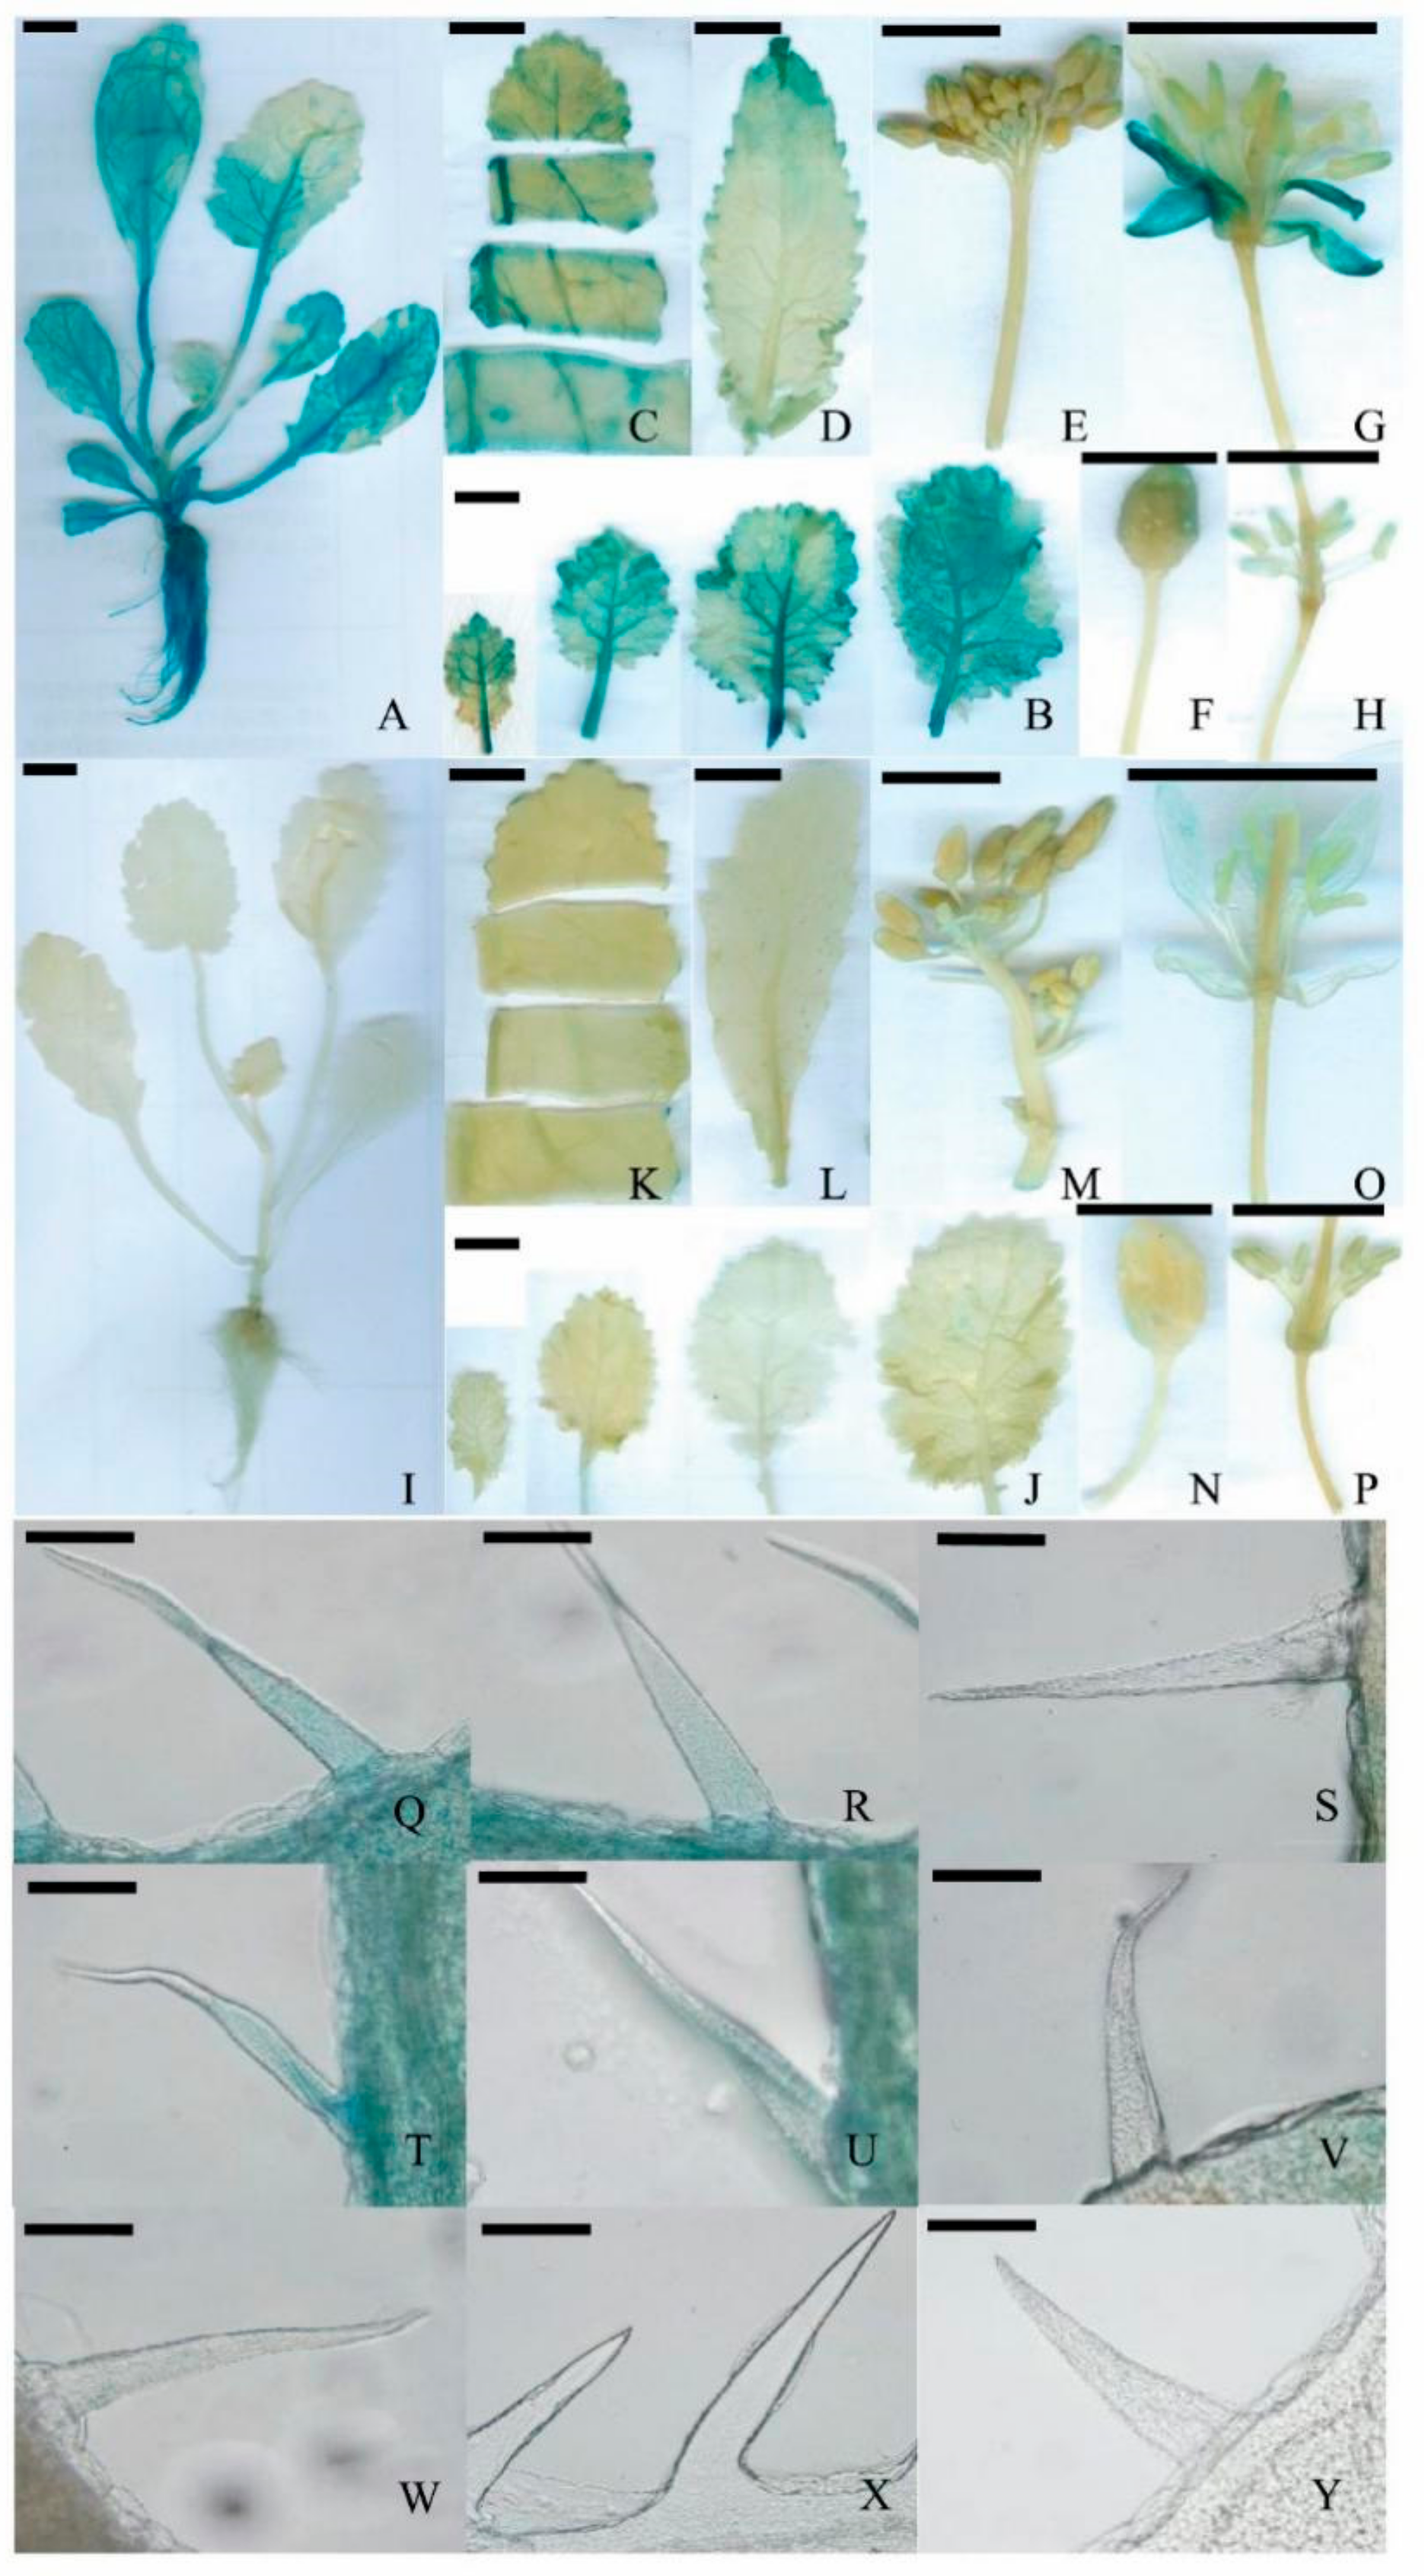
2.2. Spatiotemporal Expression of BraLTP2

To study the tissue-specific expression of BraLTP2, the promoter region (1998 bp upstream of the ATG) was used to generate a translational fusion with the β-glucuronidase (GUS) reporter gene. Three transgenic ProBraLTP2::GUS lines were analyzed in detail and showed a similar tissue-specific pattern (Figure 2). GUS expression was observed in the first four fully expanded leaves (Figure 2A,I) and their trichomes (Figure 2Q,T,W), and in stems and roots of 4-week-old seedlings (Figure 2A,I). For 8-week-old seedlings, strong GUS activity was observed in the vein of leaves (Figure 2B,J) and their trichomes (Figure 2R,U,X). For 12-week-old seedlings, strong GUS activity was observed in the vein of the leaf (Figure 2C,K), however, GUS activity in the trichomes all disappeared in the first four fully expanded leaves (Figure 2S,V,Y). During the bud stage (15-week-old plants), GUS expression was observed in the leaf tip and leaf edge (Figure 2D,L), as well as minor expression at the tip of the bud (Figure 2E,F,M,N). During the flowering stage (18-week-old plants), strong GUS expression was detected in sepals (Figure 2G,O,I), with minor expression observed at the tip of the stigma and stamen (Figure 2H,P).

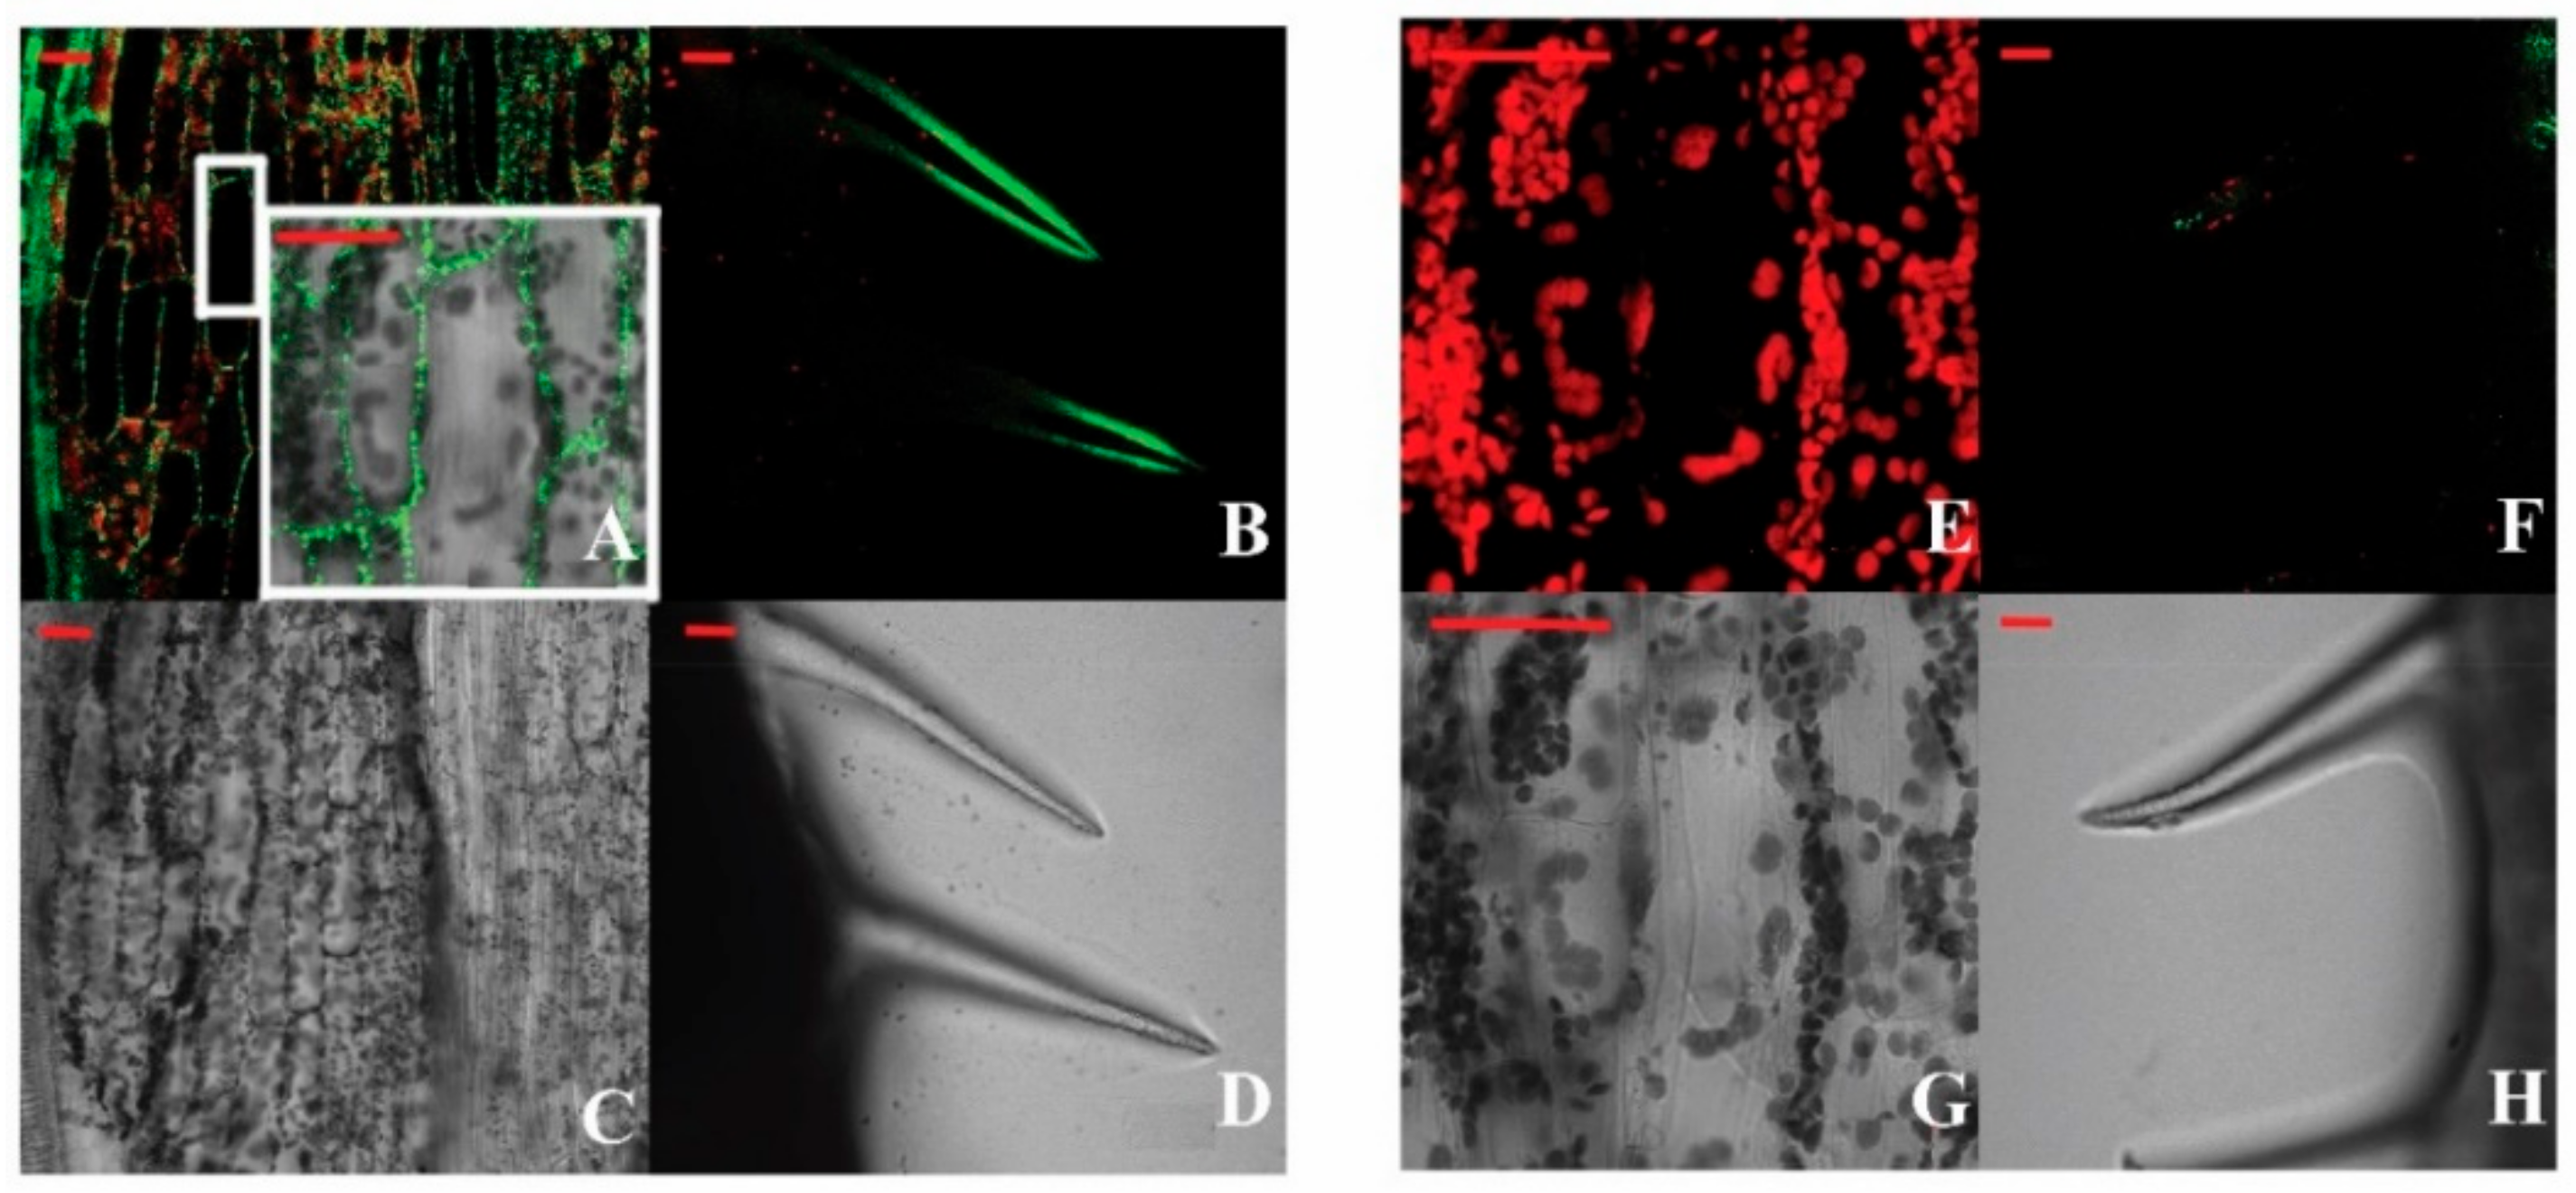
2.3. Localization of BraLTP2::GFP (Green Fluorescent Protein) Fusion Protein

A binary vector for the constitutive expression of a BraLTP2::GFP fusion protein was constructed and transformed into B. napus plants. The third fully expanded leaf from the apex of 4-week-old transgenic B. napus plants was visualized with a filter for the dual detection of GFP and chloroplast autofluorescence. The subcellular localization of BraLTP2 was detected extracellularly (Figure 3A,C) in leaf epidermal cells of transgenic B. napus. Upon magnification, GFP fluorescence was mainly observed in the periphery of the cell walls (Figure 3A, white border). It is worth noting that GFP fluorescence was concentrated at the edge of the leaf trichomes (Figure 3B,D). No GFP fluorescence was observed in the negative control plants (Figure 3E,G); only weak chloroplast autofluorescence was detected in the negative control plant’s trichomes (Figure 3F).

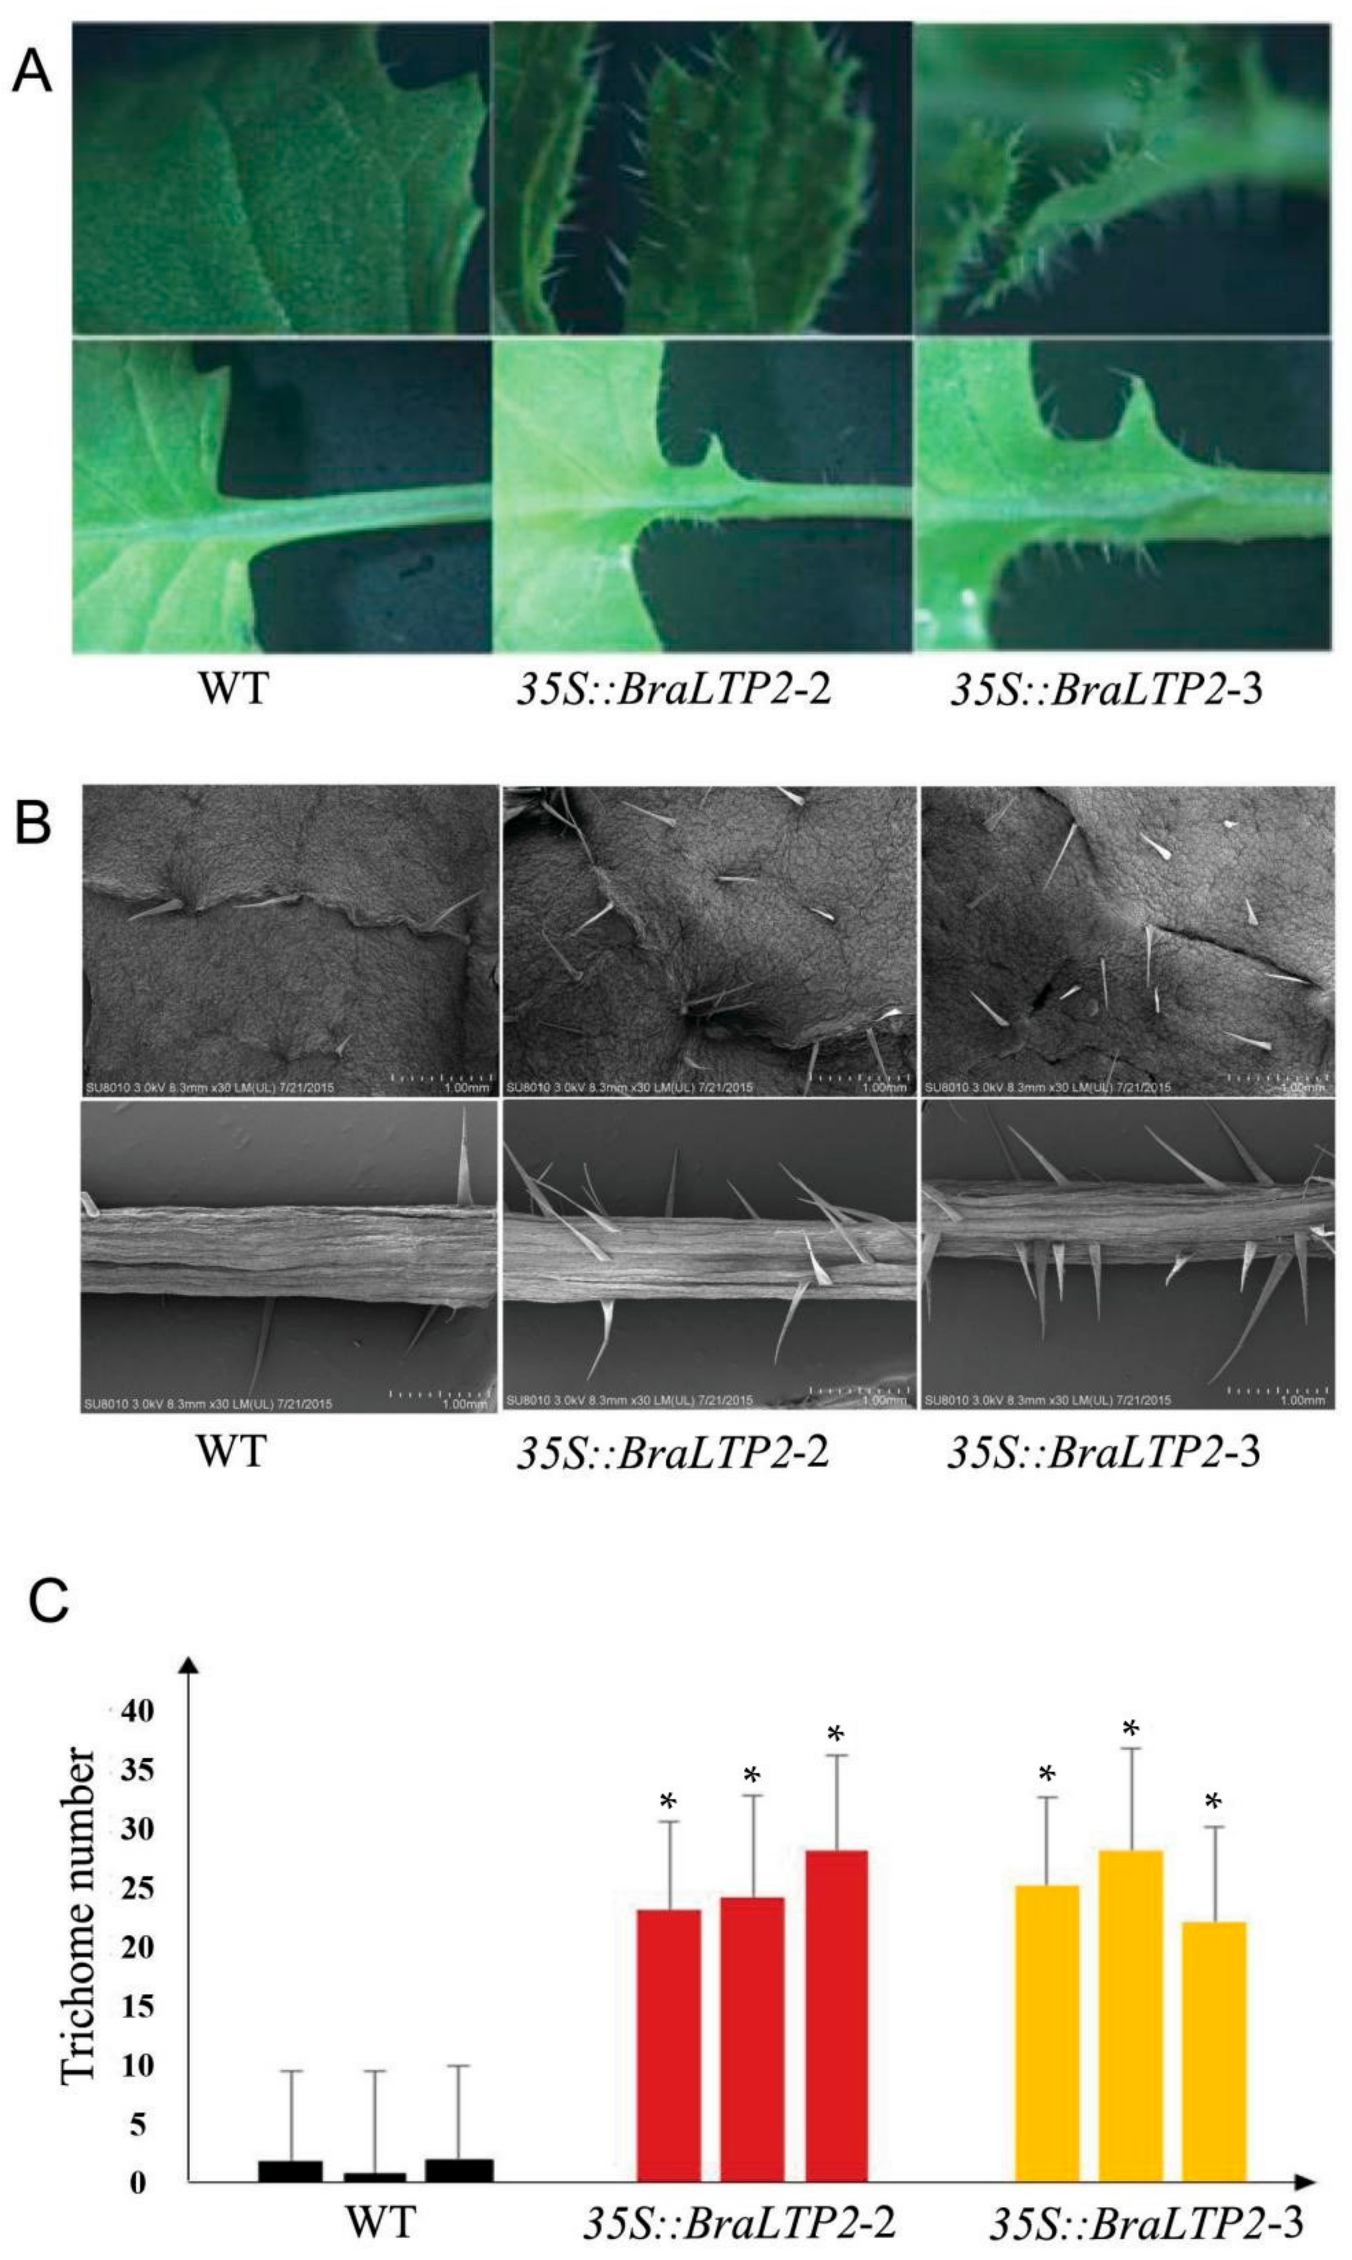
2.4. Overexpressing BraLTP2 Increases Trichome Number

Six independent transformants of B. napus L. cultivar Zhongshuang 6 with the 35S::BraLTP2 construct were obtained. BraLTP2 expression levels were 3000 to 19,000 times higher in the BraLTP2 overexpressed lines relative to the wild type (WT), as determined by real-time polymerase chain reaction (PCR) (Figure 4). We chose two T2 35S::BraLTP2 plants (BraLTP2-2 and BraLTP2-3) for further study because of their moderate expression and distinct phenotype observed on trichome density.
The 35S::BraLTP2 plants show no difference in plant height and plant morphology when compared with WT plants, however, the transgenic plants exhibit a hairy leaf surface, which is not observed in WT plants. This phenotypic feature of the 35S::BraLTP2 plants was a result of densely distributed trichomes, visible on both abaxial/adaxial leaf surfaces and petiole, when compared with WT plants (Figure 5A).
Further observation by scanning electron microscopy (SEM) confirmed the increase in trichomes in the transgenic line when compared with the WT (Figure 5B). The number of trichomes in a 1 cm2 leaf area of the transgenic and WT plants was counted, and the number of trichomes in transgenic lines was approximately 20 times higher compared with that in the WT plants (Figure 5C).

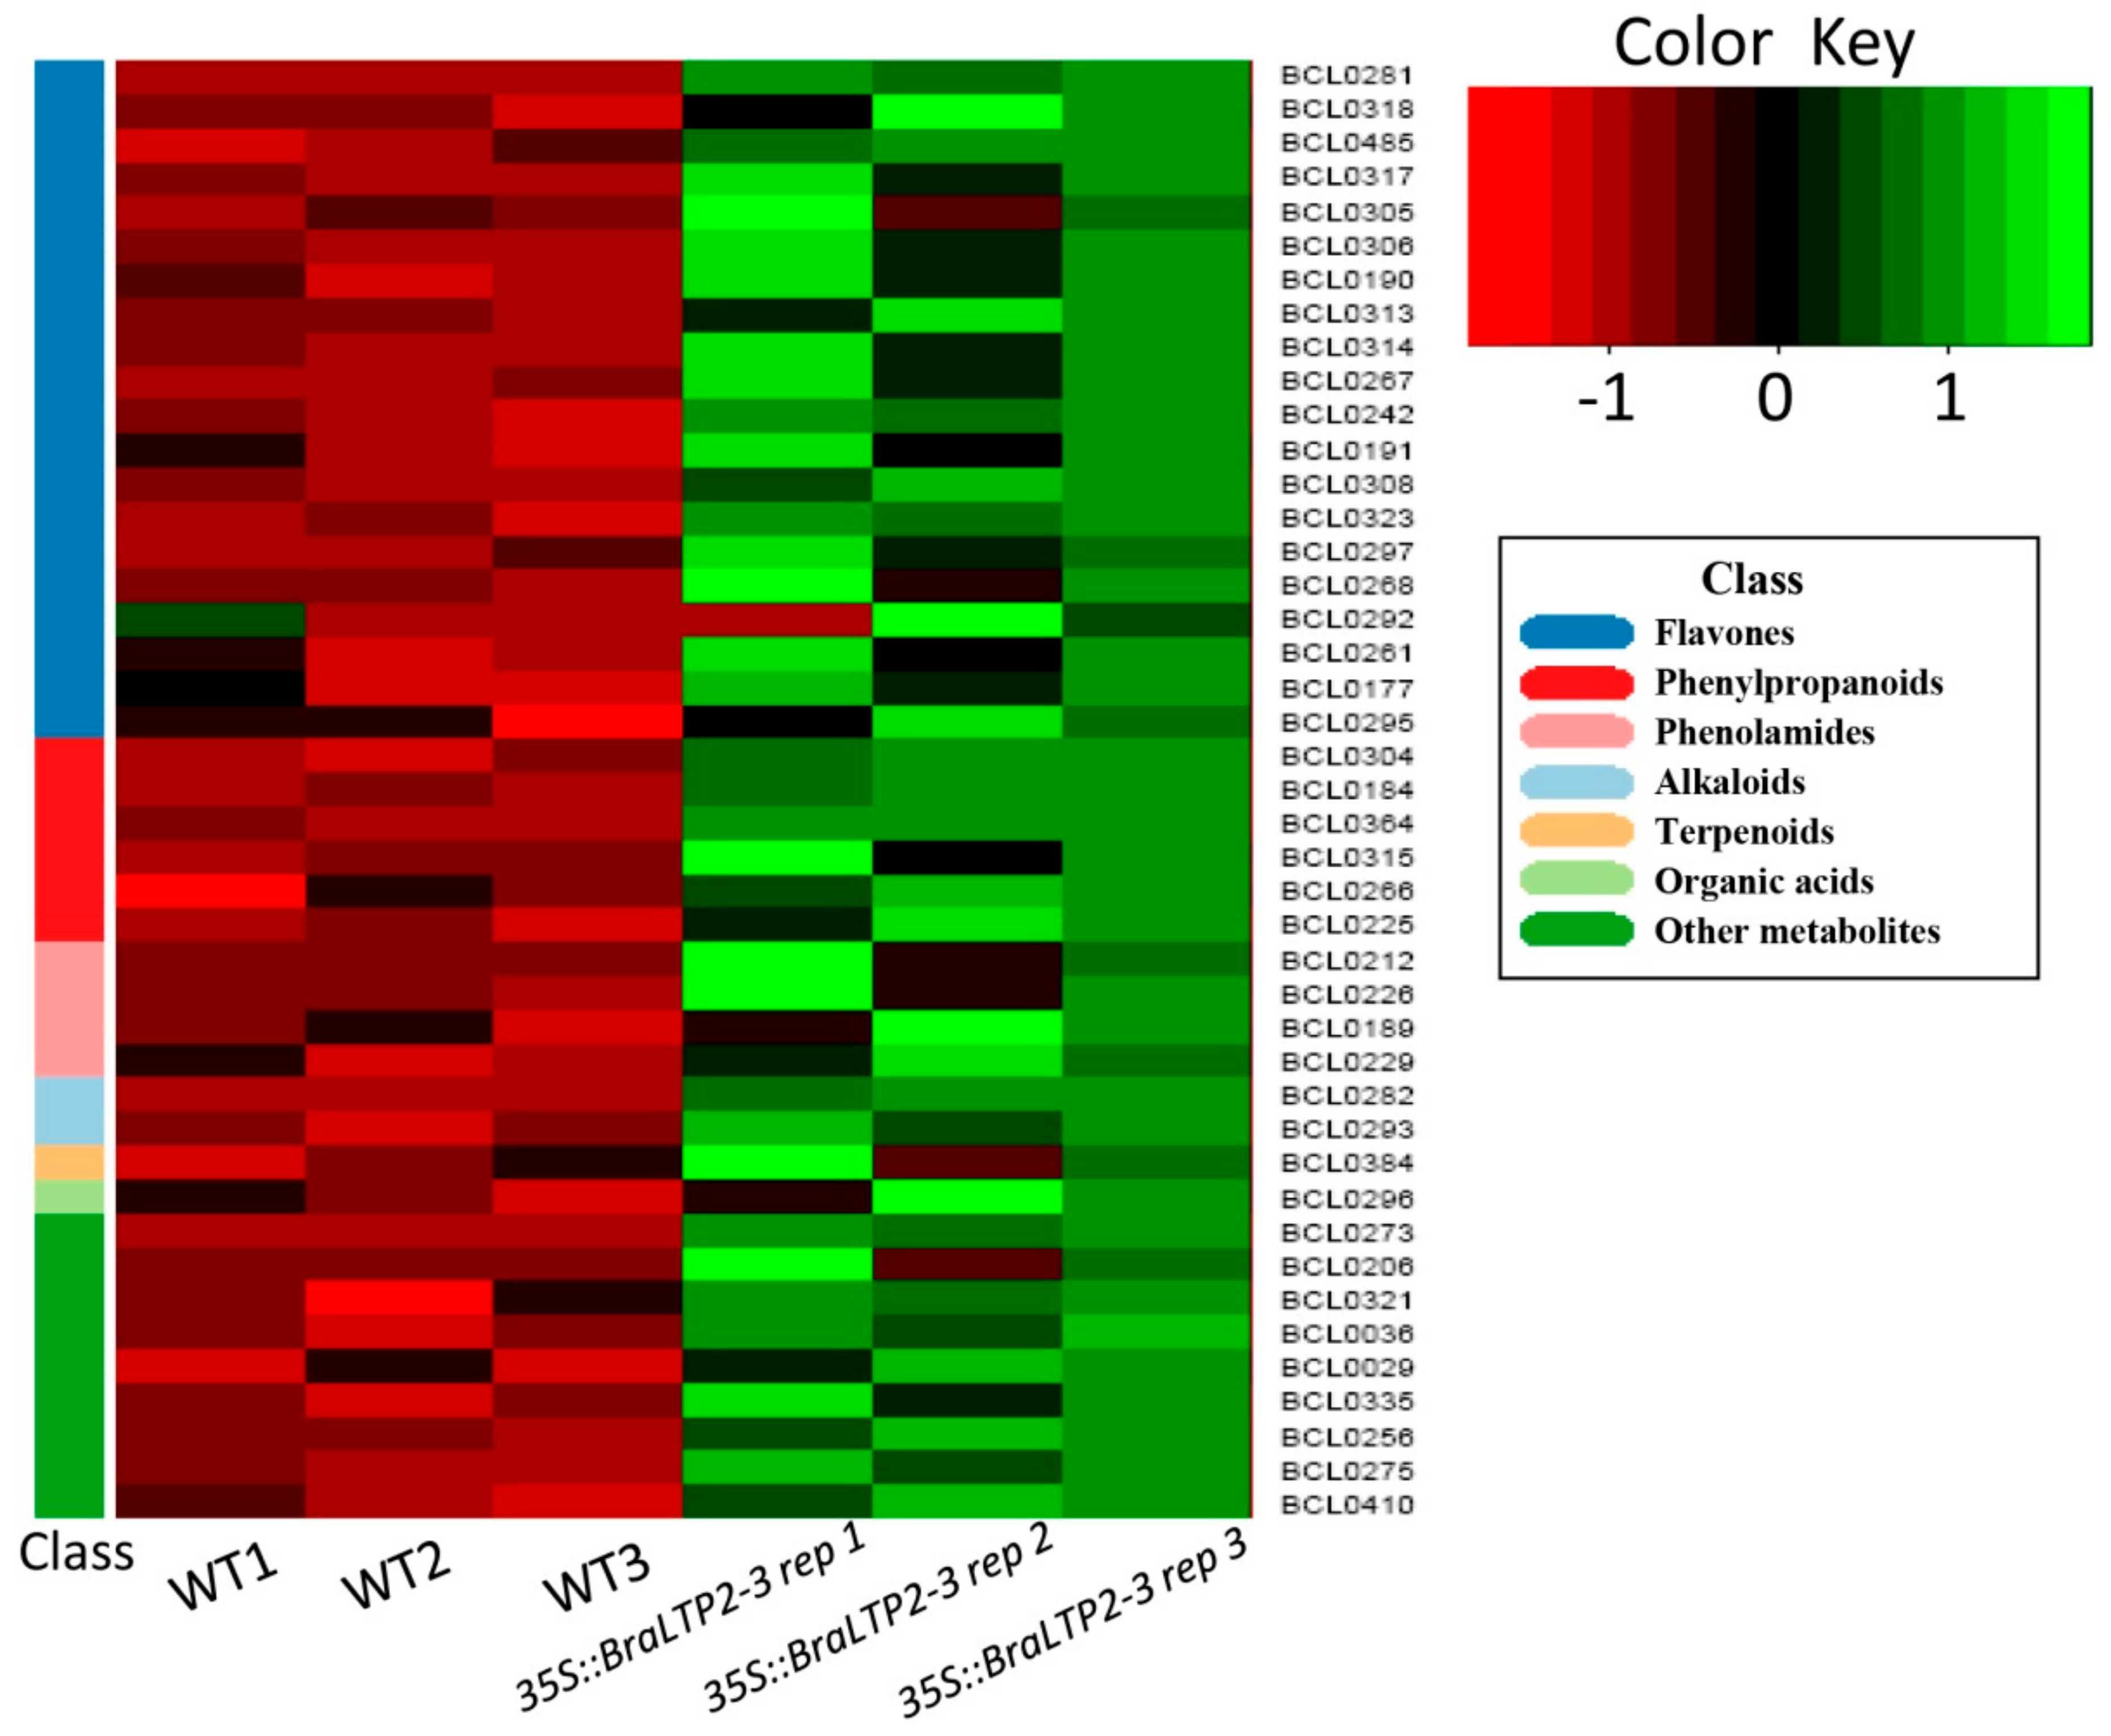
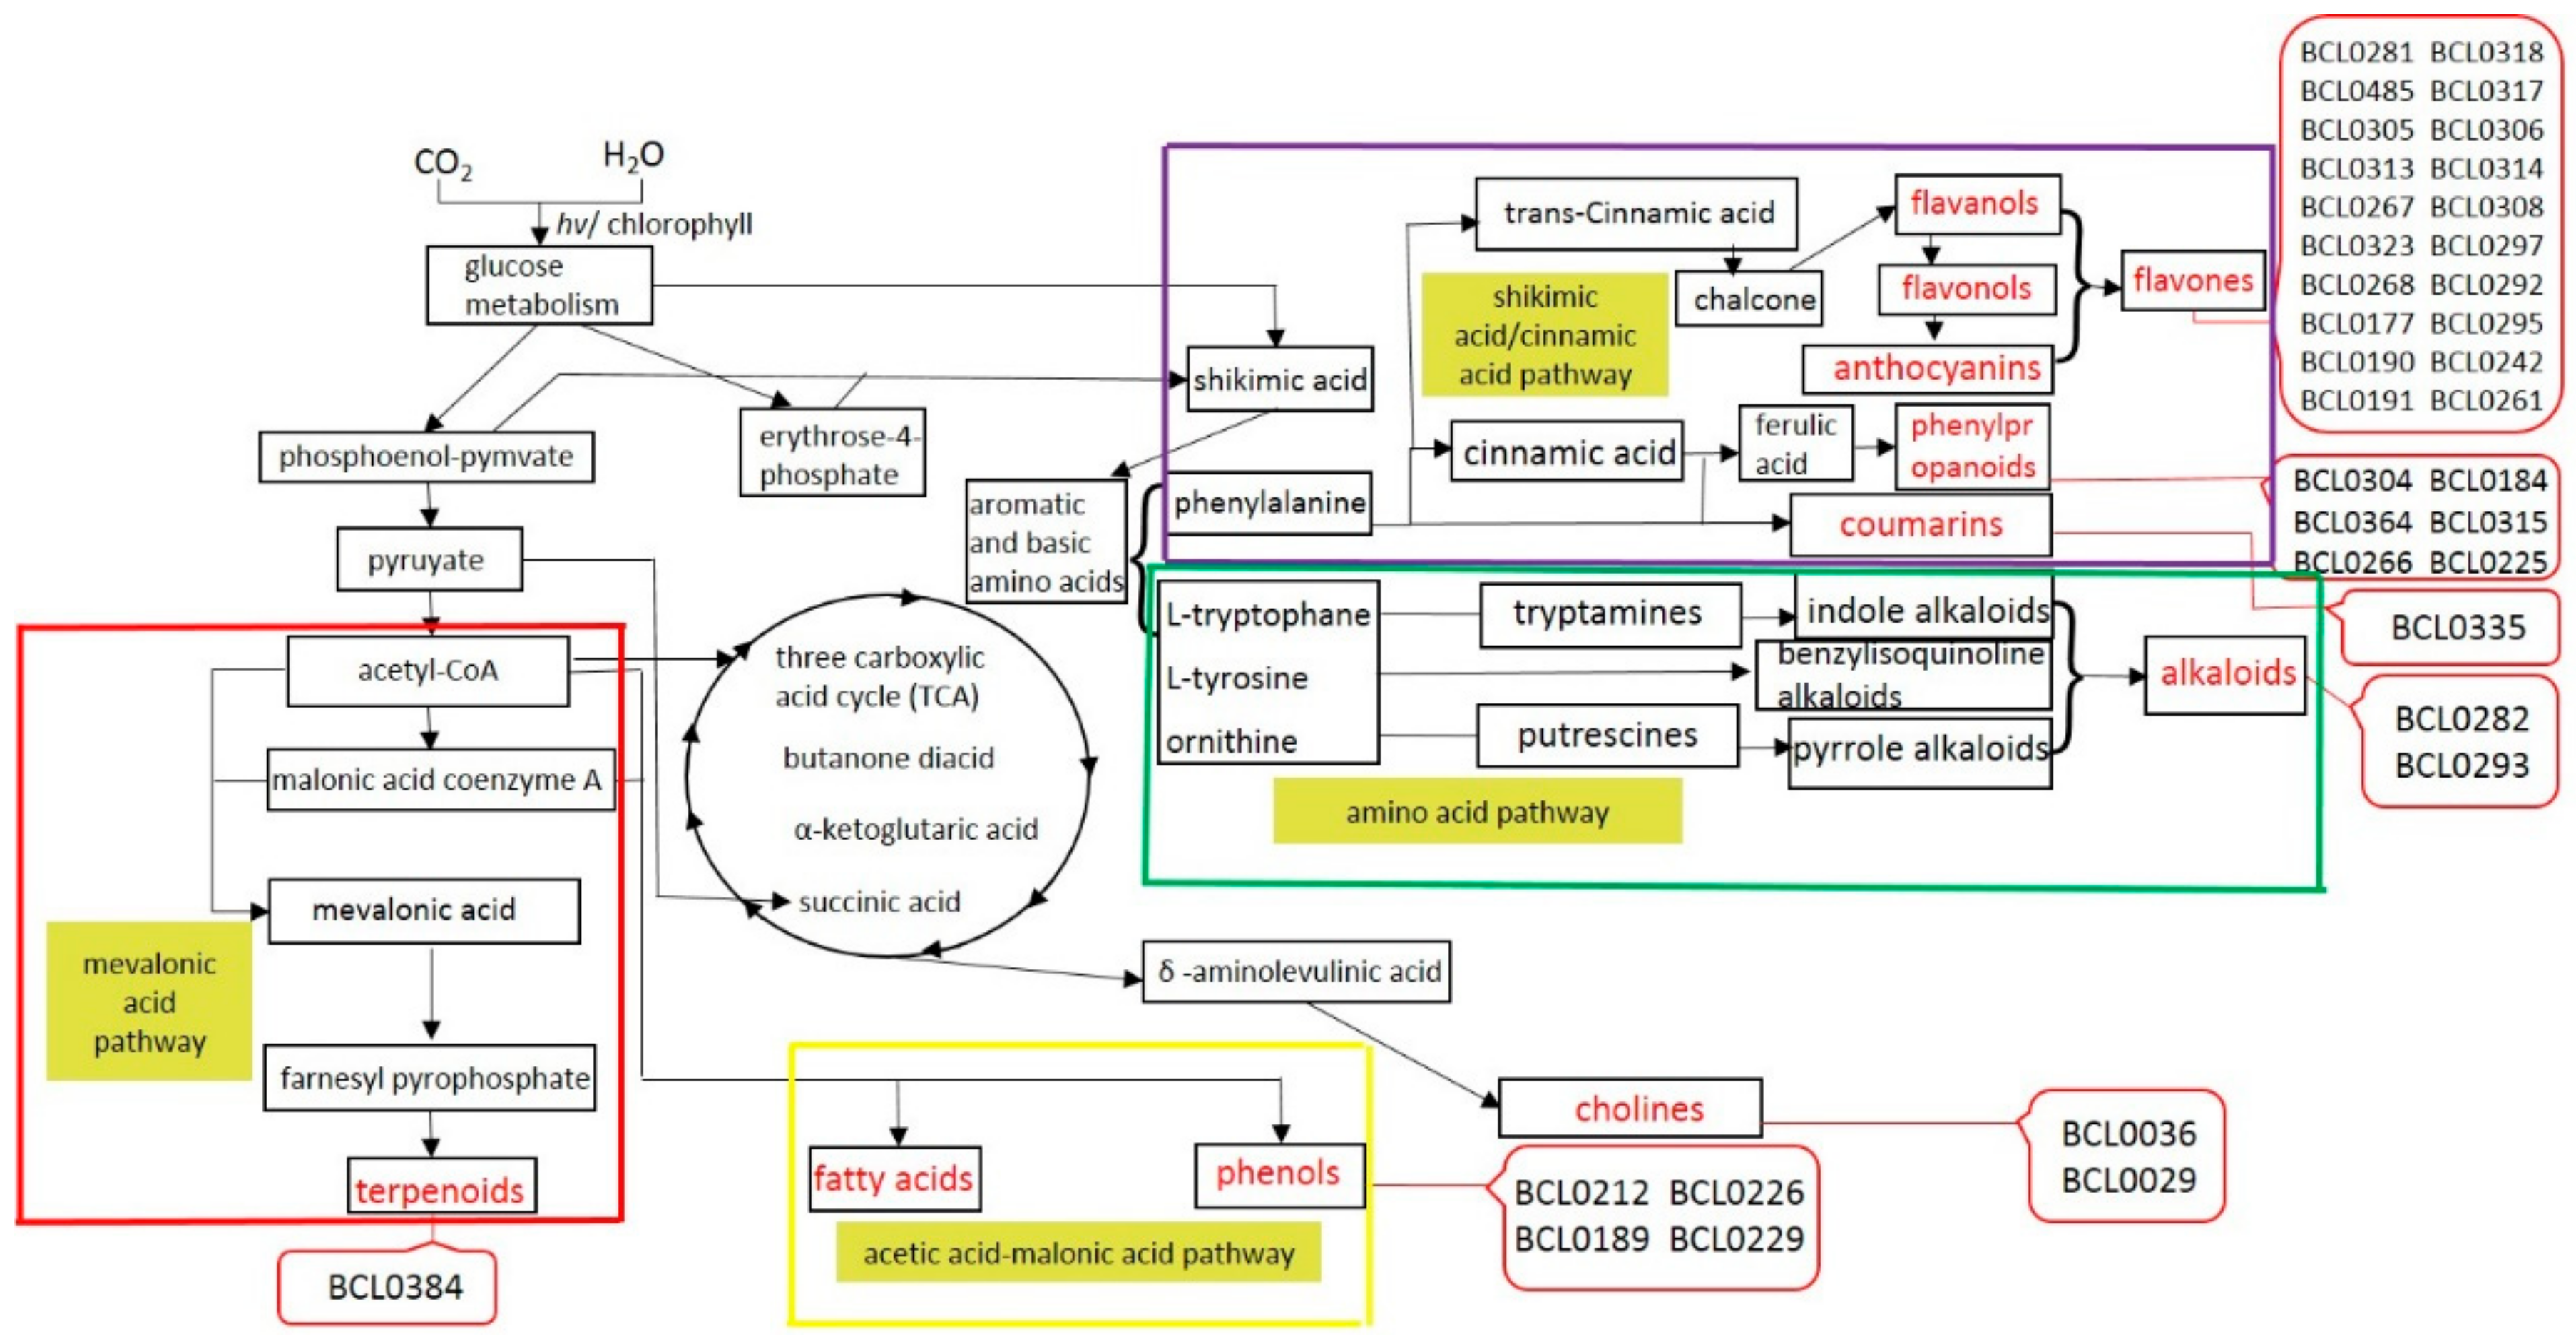
2.5. Overexpressing BraLTP2 Affects Secondary Metabolites in B. napus

To investigate the metabolic changes in the BraLTP2-overexpressing leaves at the vegetative stage, widely targeted metabolic profiles were determined by the percentage change of every metabolite content between 4-week-old BraLTP2-overexpressing plants and WT plants at the five-leaf stage. A total of 494 metabolites were detected, of which 399 were known metabolites (Table S2) and 271 were known secondary metabolites (Table 2).
As we are more concerned about the composition and content of secondary metabolites, the 271 detected secondary metabolites have been classified into seven categories: flavones, phenylpropanoids, phenolamides, alkaloids (tryptamines), terpenoids, organic acids, and other metabolites. The exact amounts of each class of secondary metabolites are shown in Table 2.
The evaluation of the metabolites (shown in Table S1) by partial least squares discriminant analysis (PLS-DA) showed obvious clustering in each group and significant differences of secondary metabolite levels between the two groups (Figure S1). Eighty-nine differential metabolites, with the standard of variable important in projection (VIP) of ≥1 and fold change of ≥2 or ≤0.5, were identified by evaluation of all of the detected metabolites in Table S2 (Table S3), of which VIP ranged from 3.69 for N-hexosyl-p-coumaroyl serotonin to 1.2 for kaempferol-3-O-β-rutinoside (Nicotiflorin). Among the 89 differential metabolites, there were 73 differential secondary metabolites, of which 43 secondary metabolites were up regulated (VIP of ≥1 and fold change of ≥2) and 30 secondary metabolites were down regulated (VIP of ≥1 and fold change of ≤0.5), in 35S::BraLTP2 plants when compared with WT plants (Table 2).
Focusing on these 43 significantly up-regulated secondary metabolites, a hierarchical cluster analysis grouped these secondary metabolites clearly into two clusters based on their relative abundance (Figure 6). Secondary metabolites in the control group were detected in three biological repetitions (WT1, WT2, and WT3) and were indicated in relative low abundance (red). In contrast, greatly up-regulated secondary metabolites in the BraLTP2-overexpressed groups were detected in three biological repetitions (35S::BraLTP2-3 rep 1, 35S::BraLTP2-3 rep 2, and 35S::BraLTP2-3 rep 3), and were indicated in relative high abundance (green). These results suggest high reproducibility within each group and a significant difference between WT and 35S::BraLTP2-3 groups (Figure 6). Table 3, Table 4, Table 5, Table 6 and Table 7 summarize these 43 significantly up-regulated secondary metabolites according to their classification of flavones, phenylpropanoids, phenolamides, alkaloids, terpenoids, organic acids, or other metabolites.
Specifically, the highest increase of secondary metabolites in 35S::BraLTP2 plants, compared with WT, was N-hexosyl-p-coumaroyl serotonin, a tryptamine, exhibiting a 105.77-fold increase (Table 6). IAA-Asp-N-Glc (indoles derivatives, Table 7), Kaempferide (flavone, Table 3), and N-feruloyl agmatine (phenolamides, Table 5) showed the second (57.09-fold), third (51.87-fold), and fourth (39.54-fold) highest increases, respectively.
Table 3 lists 20 flavones of 35::BraLTP2-overexpressed lines with significant 2–52 times increased mass spectral signal values when compared with WT leaf samples, which was probably caused by overexpressing BraLTP2. Table 3 also lists the most important precursor up regulated in anthocyanin biosynthesis, such as cyanidin (3.00-fold changes) and cyanidin 3-O-glucoside (4.06-fold changes) in 35S::BraLTP2 plants, compared with WT plants. Table 4 lists the significant differences of phenylpropanoids metabolites, such as ferulic acid (5.72-fold changes), trans-Cinnamaldehyde (2.44-fold changes), and coumarin (2.27-fold changes).

2.6. Activities of Antioxidant Enzymes

BraLTP2-overexpressed plants exhibited significantly increased levels of secondary metabolites. Kaempferide increased approximately 52 times, N-hexosyl-p-coumaroyl serotonin increased 105.7 times, and brevifolincarboxylic acid increased 4.9 times. Some researchers have indicated that kaempferide, N-hexosyl-p-coumaroyl serotonin, and brevifolincarboxylic acid all confer great antioxidation activity [45,46,47]. To confirm the role of oxidant resistance in 35S::BraLTP2 plants, we analyzed a series of antioxidant enzymes including catalase (CAT), ascorbate peroxidase (APX), glutathione reductase (GR), peroxidase (POD), and super oxide dimutese (SOD) after treatment with methyl viologen (MV), an oxidative stress inducer. Treatment with 10 µM and 50 µM MV resulted in significantly increased activity of CAT and SOD in 35S::BraLTP2 plants when compared with the WT. Treatment with 50 µM MV instead of 10 µM MV resulted in a significant increase of APX activity in 35S::BraLTP2 plants when compared with the WT. No significant increases were observed in GR activities of 35S::BraLTP2 plants after MV treatment and, interestingly, POD activity increased significantly in BraLTP2-overexpressed plants when compared with the WT, irrespective of treatment with MV (Figure 7, Student’s t-test, p < 0.05).

3. Discussion

3.1. Functional Characterization of BraLTP2

In this study, we have isolated and identified a nsLTP family gene from Brassica rapa accession Chiifu, which we named BraLTP2. The nsLTP family of genes are involved in a variety of physiological functions, however, research of nsLTP genes in B. napus is limited, and research of nsLTP genes related to epidermal trichome development and secondary metabolism has never been reported. In this study, we cloned and functionally analyzed a type Y nsLTP from B. napus.
BraLTP2 has a 375-bp coding region with a homologous gene in the ‘C’ genome of B. olercaea and corresponding ‘A’ genome copies in the amphidiploid of the ‘AC’ genome of B. napus. The amino acid sequence similarity of Arabidopsis, B. rapa, B. oleracea, and B. napus LTP2 copies is high and extends throughout the whole protein, with more variation in the Arabidopsis LTP2 copy (Figure 1). The B. napus (Brassica AC genome) is an allotetraploid species resulting from a cross between B. rapa (A genome) and B. oleracea (C genome), so it is not surprising that the BraLTP2 protein has a high identity to the LTP from B. napus and B. oleracea genomes [48]. According to previous reports, the configuration of the 8 CM domain and inter-cysteine amino acid residues places BraLTP2 in type Y of the nsLTP large family, which, in Arabidopsis, is composed of uncharacterized proteins, including At1g52415, At1g64235, At4g08530, and At4g28395 [30]. The BraLTP2 promoter contained a predicted MYB (v-myb avian myeloblastosis viral oncogene homolog) transcription factor binding site, or MBS for short (Table 1), indicating that BraLTP2 may be regulated by upstream MYB transcription factors, which are involved in abiotic stress [49]. The predicted typical light response elements, resistance response elements, phytohormone response elements, and protein binding sites of the BraLTP2 promoter suggested that BraLTP2 may participate in resistance to biotic or abiotic reaction stress.

3.2. BraLTP2 Is Expressed in Leaf Epidermal Trichomes.

In this study, BraLTP2 promoter activity was found abundant in the vegetative parts of B. napus plants, mainly in the vein and petioles of young leaves (Figure 2). Interestingly, high BraLTP2 promoter activity was observed in leaf trichomes of 4-week-old seedlings (Figure 2Q,T,W) and 8-week-old seedlings (Figure 2R,U,X), while it disappeared in 12-week-old plants (Figure 2S,V,Y). Likewise, trichome development initiates during the initial stages of leaf development [50], which indicates that BraLTP2 is possibly involved in trichome initiation development in the early seeding stages.
In Arabidopsis, the GL2 gene, which has the similar function to BraLTP2, is required for trichome development and affects trichome numbers, while its promoter regulated throughout the entire process of epidermal trichomes development [51,52]. Analysis of tobacco trichome expressed sequence tag (EST) libraries identified many trichome-specific genes and transcripts of several LTPs that accumulated specifically in trichomes [23]. Choi et al. [27] reported that tobacco NtLTP1, which is specifically expressed in long secretory glandular trichomes, plays a role in lipid secretion from trichome head cells and in resistance to aphid infestation. Yu et al. [53] have shown that squamosa promoter binding protein-like (SPL) genes temporally control the trichome distribution during flowering.
In this study, the cellular localization of the BraLTP2 protein was examined in trichomes by the generation of transgenic plants expressing a BraLTP2::GFP fusion protein. GFP fluorescence was clearly visible at the periphery of epidermal cells including trichome cells (Figure 3A–D), indicating that the protein is excreted. Furthermore, BraLTP2 contains a putative extracellular secretory signal (Figure 1), which is expected as BraLTP2 belongs to the nsLTP family, most of which present an N-terminal secretory signal peptide and were detected extracellularly [44,54]. The morphology of the trichomes displayed in our research indicated that trichomes of B. napus are non-glandular trichomes, like Arabidopsis trichomes, as glandular trichomes normally have a large head with secretory cells. Our result indicated that the BraLTP2 protein is secreted into the extracellular matrix of epidermal cells, including trichome cells.
More studies also provide evidence for an extracellular role of nsLTPs [55,56]. Lange et al. [17] have reported that in peppermint, LTPs are abundantly expressed in trichomes and have been proposed to transport lipid molecules to the periphery of the cell [17,57]. Several observations revealed that LTPs are secreted proteins; for example, an LTP, named PAPI protein, is secreted from aleurone layers into the incubation medium in Hordeum vulgare (barley) [58]. Two lipid transfer proteins were expressed entirely de novo in the tobacco leaf apoplast proteome [59] and in the secretome of the soybean xylem proteome [55].

3.3. Overexpressing BraLTP2 Leads to an Increase of Trichome Number

Trichome density of 35S::BraLTP2 plant leaves was significantly higher (p < 0.05) when compared with the WT (Figure 5). This phenotype resulted from the specific overexpression of BraLTP2, rather than from tissue culture mutation or vector insertion effects, because this phenotype was widespread in all lines. BraLTP2 is the first nsLTP family member known to affect the development of trichomes exhibiting the hairy phenotype. However, there was no specific alteration on trichome morphology in 35S::BraLTP2 plants, suggesting that the BraLTP2 gene might play a role in trichome formation, initiation, or development, and that the effect of BraLTP2 overactivity was specifically to increase the trichome number.
Mutant analyses have implicated a role for trichome numbers in Arabidopsis [60,61], however, the nsLTP gene family has seldom been involved. In our study, we speculated that trichomes’ formation and density were promoted by up regulating the expression of BraLTP2.
There are two explanations that could support the above conclusion: (1) BraLTP2 belongs to nsLTP gene family members, some of which had been reported to be involved in resistance to biotic and abiotic stress [37,62,63], cell growth development [43,64], and secondary metabolism [22,23,27]. BraLTP2 has similar conserved domains and signal peptides to the nsLTP gene family (Figure 1). Therefore, it might show a similar gene function; (2) By analyzing the BraLTP2 promoter, we found several cis-elements involved in biotic and abiotic stress (Table 1). We also found the protein binding site, including MBS, which is a MYB factor involved in drought induction (Table 1). Many studies have reported that MYB transcription factors are involved in epidermal trichome development and secondary metabolism; for example, AtMYB23 regulates the trichome initiation of leaf edges in Arabidopsis [65]. The poplar gene, PtaMYB186, is a regulator of trichome initiation, and overexpression of PtaMYB186 results in a fuzzy trichome phenotype [66]. In Arabidopsis, HIG1/MYB51 was shown to activate promoters of secondary metabolite–indolic glucosinolate biosynthetic genes, leading to increased accumulation of indolic glucosinolates [67]. We speculated that BraLTP2 is regulated by a MYB transcription factor or other proteins with similar roles. Further investigation of the molecular mechanism of the BraLTP2 action will shed more light on its function in trichome development and upstream regulation pathway.

3.4. Overexpressing BraLTP2 Alters Different Secondary Metabolites Produced by Different Biosynthesis Pathways.

It has been reported that nsLTP affects metabolites’ biosynthesis or secretion. For example, in Arabidopsis, LTPG, which encodes a glycosylphosphatidylinositol-anchored lipid transfer protein, has been reported to be required for the export of metabolites to the plant epidermal cells, which contributes either directly or indirectly to epidermal metabolites’ biosynthesis [25,26]. It has been reported that trichome development has a close relationship with increased metabolite levels, including anthocyanins, flavonoids, and phenylpropanoids [68,69]. In Arabidopsis, expression maps of leaf trichomes revealed high activities of anthocyanin and flavonoid pathways, indicative of the roles of trichomes in the biosynthesis of secondary metabolites and defense [68]. In our study, overexpressing BraLTP2 led to the increase of the trichome number. Therefore, we explored the metabolite changes in transgenic and WT B. napus plants.
Secondary metabolites from the leaf of the transgenic lines and the WT were analyzed by liquid chromatography tandem mass spectrometry (LC-MS). The metabolic network involved in different secondary metabolites’ biosynthesis is well known [70]. We detected 43 up-regulated secondary metabolites, of which 36 are shown in the metabolic network of Figure 8, which is an overview map of key up-regulated secondary metabolites, synthesized by the different biosynthetic pathways, in 35S::BraLTP2 plants compared with the WT.
The first pathway (Figure 8) is the acetic acid-malonate acid (AA-MA) pathway; the precursors, acetyl-CoA and malonic acid coenzyme A, synthesize fatty acids, and acetyl-CoA can form phenols through condensation reactions [71,72]. In this biosynthetic pathway, we have detected up regulation of BCL0212 (N-feruloyl agmatine), BCL0226 (N-Sinapoyl agmatine), BCL0189 (N-Sinapoyl agmatineand), and BCL0229 (N-Feruloyl spermidine) (Table 5).
The second pathway (Figure 8) is the mevalonic acid pathway; it produces terpenoid compounds via certain biosynthetic reactions with the precursor of mevalonic acid (MVA) [70]. BCL0384 (phytocassane C), showing 2.39-fold overexpression when compared with the WT (Table 6), is a precursor for the synthesis of diterpenes, which are diterpenoids with a structure based on the isocopalane (Tetradecahydro-1,1,4a,7,8,8a-hexamethylphenanthrene) or the 15,16-epoxyisocopalane skeleton [73].
The third pathway (Figure 8) is the shikimic acid/cinnamic acid pathway [70,74]; the aromatic amino acid, phenylalanine, is a precursors to synthesize into phenylpropanoid compounds, as well as flavanols, flavonols, and anthocyanins [70,74]. It is well known that flavones are synthesized via the phenylpropanoid pathway and can be divided into six major subgroups in plants, including flavanones, flavonoids, flavonols, flavan-3-ols, anthocyanins, and isoflavones [75,76].
The fourth pathway (Figure 8) is the amino acid pathway; alkaloids are synthesized by three pathways with three amino acids as precursors, l-tryptophane, l-tyrosine, and ornithine. Table 6 lists the significant difference of indole alkaloids in the l-tryptophane amino acid pathway. N-Hexosyl-p-coumaroyl serotonin (105.77-fold increase), which has the most significant difference of secondary metabolites, is a kind of tryptamines.
The fifth pathway, acetyl-CoA, can also take part in the tricarboxylic acid (TCA) cycle, then form the δ-aminolevulinic acid, and finally form cholines. Table 7 has listed the significant difference reactants, such as O-phosphocholine (3.54-fold increase) and sn-glycero-3-phosphocho (2.41-fold increase).
Our results indicate that BraLTP2 may participate in secondary metabolites’ biosynthesis or storage in B. napus leaves. However, further investigation is necessary to determine how BraLTP2 affected these secondary metabolite biosynthetic pathways.

3.5. Overexpressing BraLTP2 Demonstrates Enhanced Activities of the Main Antioxidant Enzymes

Plant stress resistance is responsible for the tolerance of plants to adverse environments; a product of evolution. Plants under environmental stress can prevent, reduce, or repair damage caused by adversity through metabolic reactions to maintain normal physiological activities [77,78]. It has been reported that secondary metabolites such as flavones and phenylpropanoids play an important role in oxidation tolerance and UV-B (with a wavelength of 280–315nm) resistance of plants [45,46,47,79]. The level of the flavone kaempferide (Table 3), which confers antioxidation activity [47], was 52-fold higher in the 35S::BraLTP2 plants. Likewise, N-hexosyl-p-coumaroyl serotonin, which increased 105.7-fold over the WT (Table 6), has an antioxidant role in rice leaves [45,46]. Ferulic acid, with an increase of 5.7-fold (Table 4), plays a role in shielding UV-B radiation [80]. Brevifolincarboxylic acid, which has a 4.9-fold increase (Table 4), has also been shown to act as an antioxidant [81,82].
The 35S::BraLTP2 plants have increased activities of the main antioxidant enzymes such as CAT, APX, POD, and SOD (Figure 7), which are responsible for alleviating or preventing MV-induced oxidative injury such as the reactive oxygen species (ROS) formation in plants [83]. SOD forms the first line of defense against ROS under stress [84], reducing superoxide (O2) into hydrogen peroxide (H2O2). H2O2 can be metabolized into oxygen and water by CAT and POD. H2O2 is also restricted by the ascorbate–glutathione (ASH–GSH) cycle, where APX uses ASH as a hydrogen donor and GR catalyzes the NADPH-dependent reduction of oxidized glutathione (GSSG) to reduced GSH [85]. In our study, in 35S::BraLTP2 transgenic plants leaves, the CAT, GR, POD, and SOD activities under MV treatment were higher than those in the WT. Under MV treatment, CAT, POD, and SOD activity showed a significant (p < 0.05) increase in 35S::BraLTP2 transgenic leaves when compared with WT leaves (Figure 7), but APX activity significantly (p < 0.05) increased only under high MV concentrations (50 µM). GR had no significant increase under any MV concentration. With 10 µM MV treatments, CAT and POD would work to remove ROS, and as APX and GR are part of the ASH-GSH cycle that scavenges ROS [86], no increase in APX or GR activities would be required to maintain safe levels of ROS. Enhanced activities of antioxidant enzymes play a role in the oxidation pathway, thereby improving the oxidative stress tolerance of 35S::BraLTP2 plants. There are also some reports that have proved that the activities of these five antioxidant enzymes were increased by heavy metal (cadmium) stress in wheat, tobacco, and Miscanthus spp. [87,88,89].

4. Materials and Methods

4.1. Plant Material

The plants seeds were sterilized and germinated on sterile Murashige & Skoog medium. The germinated seedlings or rooted transgenic plants were transferred from Murashige & Skoog media into pots containing a mixture of peat moss (PINDSTRUP, Ryomgaard, Danmark) and field soil (3:1), and maintained in a growth chamber at 18 °C ± 2 °C with a 16 h light and 8 h dark photoperiod, at a light intensity of 44 µmol m−2 s−1 and relative humidity of 60–90%.

4.2. Gene, Protein, and Promoter Sequence Analysis

BraLTP2 was aligned to homologous amino acid sequences from several Cruciferae species, including Arabidopsis, B. napus, and Brassica oleracea (B. oleracea), using Align X multiple sequence alignment software (Vector NTI Advance 11.0, 2008 Invitrogen Corporation, Carlsbad, CA, USA). The homology search was conducted using TAIR (http://www.arabidopsis.org/) and BRAD (http://brassicadb.org/brad/). Conserved domains were identified using CDD (http://0-www-ncbi-nlm-nih-gov.brum.beds.ac.uk/cdd/) and the signal peptide was determined by SignalP (http://www.cbs.dtu.dk/services/SignalP/) [64]. The predicted protein information was conducted using EXPASY (http://www.expasy.org/resources; Gigolashvili et al., 2007). The core promoter region and upstream cis-acting elements were predicted by the promoter prediction software, PlantCARE (http://bioinformatics.psb.ugent.be/webtools/plantcare/html/) (Universiteit Gent, Gent, Belgium).

4.3. Vector Construction and Genetic Transformation

4.3.1. Gene Cloning and Vector Construction

Genomic DNA was isolated from the B. rapa accession Chiifu using primers designed against the published B. rapa sequence Bra040156 (http://brassicadb.org/brad/index.php) [90], and the BraLTP2 DNA fragment was obtained via PCR, using the forward (BraLTP2-F) and reverse (BraLTP2-R) primers containing 5’ restriction enzyme sites for SacI and BamHI, respectively (Table S1). PCR was carried out in 50 µL, with 50 ng DNA, 0.2 mM dNTPs, 0.3 µM of each primer, 1.0 U KOD plus Taq (ToYoBo, Osaka, Japan), 1× KOD plus Taq buffer (ToYoBo, Osaka, Japan), and 1.0 mM MgSO4 (ToYoBo, Osaka, Japan). The conditions were as follows: 94 °C for 3 min, 30 cycles at 94 °C for 30 s, 56 °C for 30 s, and 68 °C for 30 s. The resulting 477 bp amplification product was digested by SacI (Thermo Scientific™ Code: ER1131, Rochester, NY, USA) and BamHI (Thermo Scientific™ Code: ER0051), and subcloned into the pMD®18-T cloning vector (Takara, Tokyo, Japan). To construct the BraLTP2 overexpression plasmid, the cloning vector harboring BraLTP2 was transferred to the pBI121S destination vector between the CaMV 35S promoter and a terminal poly A sequence [64]. The integrity of the construct was confirmed by sequencing.
A 1998-bp upstream DNA fragment containing the BraLTP2 promoter was amplified with the forward primer ProBraLTP2-F and reverse primer ProBraLTP2-R (Table S1). The PCR product was digested with PstI (Thermo Scientific™ Code: ER0611) and BamHI, and then cloned into the pMD®18-T cloning vector (Takara). The destination fragment was cleaved from the cloning vector and ligated into the destination vector pDX2181G using a T4 DNA ligase. The integrity of the construct was confirmed by sequencing and PCR analysis.
To determine the subcellular localization of BraLTP2 in plant cells, we created a BraLTP2::GFP fusion construct. For BraLTP2 amplification, the forward primer BraLTP2::GFP-F and reverse primer BraLTP2::GFP-R (containing 5’ restriction enzyme sites for Sac I) were used (Table S1). For GFP amplification, the forward primer GFP-F (containing 5’ restriction enzyme sites for BamHI) and reverse primer GFP-R were used (Table S1). The target BraLTP2 and GFP genes were combined into a fusion gene in the pBI121S vector under the control of the CaMV 35S promoter.

4.3.2. Genetic Transformation

Etiolated hypocotyls of B. napus cv. Zhongshuang 6, an elite Chinese cultivar from China, were transformed by Agrobacterium tumefaciens strain GV3101 (Weidi Biotechnology Co., Ltd, Shanghai, China) and regenerated, as described by Liu et al. (2014) [64].

4.4. Real-Time PCR Analysis

Total RNA was isolated from the fourth fully expanded leaf from the apex for each 10-week-old T0 generation B. napus plant using the TIANGEN RNAprep Pure Plant Kit (DP 432, TIANGEN, Beijing, China), according to the manufacturer’s instructions. Reverse-transcription reactions were carried out to synthesize the first-strand cDNAs from DNaseI-treated total RNA using a TIANGEN FastQuant RT Kit (with gDNase) (KR106, TIANGEN, Beijing, China), according to the manufacturer’s instructions. The cDNA was used as a template for PCR amplification analysis, and the reaction and procedure followed the manufacturer’s instructions, as above, in four replicates for each cDNA sample. PCR primers (Rt-PCR-F and Rt-PCR-R) and TaqMan probes (Rt-PCR-P) were designed based on the BraLTP2 cDNA sequences (Table S1). Specific primers (Actin-F and Actin-R) and TaqMan probes (Actin-P) for the B. napus Actin gene (GenBank accession number: AF111812.1) were used as an internal control (Table S1). Real-time PCR was performed in an optical 96-well plate with a Bio-Rad CFX96 Real-Time System (C1000 Thermal Cycler) (Applied Biosystems, Hercules, CA, USA).

4.5. Histochemical Analysis of GUS Expression

The ProBraLTP2::GUS clone in DX2181G was used to transform A. tumefaciens GV3101, and subsequently B. napus. B. napus transformants were selected with hygromycin B (25 mg/L) and verified by PCR analysis. Histochemical GUS staining of the T2 generation transgenic plants harboring the ProBraLTP2::GUS construct were conducted, as described by Jefferson et al. [91], using negative transgenic seedlings as controls. Briefly, young seedlings of transgenic lines expressing ProBraLTP2::GUS were incubated for 12 h with reaction buffer solution (50 mM Na2HPO4–NaH2PO4, pH 7.0, 0.5 mM K3Fe(CN)6, 0.5 mM K4Fe(CN)6, containing 2 mM 5-bromo-4-chloro-3-indolyl-b-d-glucuronic acid as a substrate). Tissue was destained with 70, 80, and 100% ethanol, trichomes were observed and photographed under an optical microscope (Olympus IX71, Melbourne, Australia), and other tissues were examined and photographed by a scanner (HP Scanjet G4050, Hewlett Packard, Beijing, China).

4.6. Microscopic Observation of the BraLTP2::GFP Fusion Protein

The BraLTP2::GFP fusion construct was transformed into B. napus plants mediated by A. tumefaciens strain GV3101, as described previously, using negative transgenic seedlings as controls. Leaf epidermal cells of T2 generation plants were analyzed to determine the location of the fusion protein, utilizing a confocal laser-scanning microscopy system (LSM) (Nikon A1, Tokyo, Japan) after treatment of light avoidance at 25 °C for 1 h. Fluorophores were excited using an argon laser at 488 nm (GFP), and bright-field images were collected using a transmitted light detector.

4.7. Trichome Observation

To compare the phenotypes between transgenic plants and the wild type (WT) plants, the second fully expanded leaves of 4-week-old T2 seedlings were observed by optical microscopy (Olympus SZX16, Melbourne, Australia). Furthermore, to observe the morphology and density of trichomes, young fresh leaves and stems of 4-week-old T2 seedlings were observed using scanning electron microscopy (SEM) (Hitachi SU8010, Tokyo, Japan). Before observation, the samples were fixed with glutaraldehyde and washed in cacodylate buffer, and then dehydrated in ethanol, dried, and coated with a film of gold [92]. To count the number of trichomes, an abaxial leaf area of 1 cm2 from the second fully expanded leaf from the apex for each 4-week-old plant was used for microscopic analysis and measurement. The leaves from three randomly selected plants of each transgenic line, along with the WT, were observed.

4.8. Analysis of Secondary Metabolites from Transgenic Plants by Liquid Chromatography Tandem Mass Spectrometry (LC-MS)

The third fully expanded leaves from the apex for T2 generation BraLTP2-overexpressing and WT seedlings at the five-leaf stage (4-week-old) were harvested for secondary metabolites analysis. Three independent biological repeats were performed, with five sample mixes for each repeat in order to reduce the metabolite differences caused by the environment and individuals [93,94,95]. These samples were frozen in liquid nitrogen, followed by freezing/drying (Scientz-100F, Ningbo, China), and ground for 1.5 min at 30 Hz using a grinding apparatus (MM 400, Retsch, Shanghai, China). The ground powder (100 mg) was extracted, separated, and analyzed using liquid chromatography tandem mass spectrometry (LC-MS) to identify and quantify the metabolites present, as previously described [93]. A previously described, the relative quantification method was used to analyze the samples [94]. Metabolite (m-trait) data were log2 transformed for statistical analysis to improve normality. The m-trait data of the association panel are the mean of the two biological sample sets for the LC-MS data, as follows: Pm, l = 1/2(Pm,l,1 + Pm,l,2), where Pm, l represents the m-trait data for metabolite m (m = 1, 2, 3, ..., 494 in leaf), and Pm,l,1 and Pm,l,2 are the normalized metabolite levels determined in the two biological sample sets, respectively. Principal component analysis plots were used to infer the difference between the two samples. Principal component analysis of the metabolites was performed using the software SIMCA-P with default settings.

4.9. Determination of Anti-Oxidant Enzymes Activities

One hundred milligrams fresh weight of the second fully expanded leaves from the apex for 2-week-old T2 generation BraLTP2-overexpressed transgenic and WT plants were harvested, with three technical replicates and three biological replicates. The samples were soaked in an aqueous 10 µM and 50 µM methyl viologen (MV, Sigma, Shanghai, China) [96] solution for 4 h, with distilled water treatment as a control. The leaves were then frozen in liquid nitrogen and ground at 4 °C in a mortar and pestle, with 1 ml extraction buffer (50 mM phosphate buffer (pH 7.8), containing 0.1 mM EDTA, 0.5% (w/v) Triton-100 and 2% polyvinyl pyrrolidone (PVP)), and centrifuged at 8000× g at 4 °C for 10 min (catalase (CAT), peroxidase (POD), super oxide dimutese (SOD) activity); at 8000× g at 4 °C for 15 min (glutathione reductase (GR) activity); and at 13,000× g at 4 °C for 20 min (ascorbate peroxidase (APX) activity). The supernatants were analyzed for enzyme activity using commercial kits, according to the manufacturer’s instructions (Jiangsu Keming Biotechnology Institute, Suzhou, China).

5. Conclusions

BraLTP2 is a new gene from B. rapa, its function, as well as that of its homologous gene in Arabidopsis, has not been previously identified. We have demonstrated that overexpressing BraLTP2 led to an increased number in leaf epidermal trichomes, suggesting BraLTP2 might play a role in trichome development. We observed an increase in secondary metabolites, such as flavones, phenylpropanoids, phenolamides, alkaloids, terpenoids, organic acids, and other metabolites, in 35::BraLTP2-overexpressed B. napus leaves when compared with those of WT, which may play a role in resistance to oxidation stress. Additionally, we have demonstrated increased activities of CAT, POD, and SOD under MV treatment, also contributing to oxidation tolerance in B. napus. B. napus trichomes were observed as non-glandular trichomes in our study, which may have the capacity to synthesize or store a wide array of metabolites. However, how much the increase of trichomes contributed to the increase of metabolites in this study still needs to be made clear.

Supplementary Materials

Supplementary materials can be found at https://0-www-mdpi-com.brum.beds.ac.uk/1422-0067/19/6/1733/s1.

Author Contributions

Data curation, (F.L.); Formal analysis, (N.T. and P.W.); Investigation, (N.T. and P.W.); Methodology, (F.L.); Resources, (G.W.); Supervision, (G.W.); Writing—original draft, (N.T.); Writing—review & editing, (F.L.). Conceptualization, (X.Y.); Software, (H.G.); Validation, (X.Z.).

Acknowledgements

This work was supported by Central Public-interest Scientific Institution Basal Research Fund, a Major Research Project of CAAS Science and the Technology Innovation Program; the National Natural Science Foundation of China (Grant number: 31400243); the Natural Science Foundation of Hubei Province (Grant number: ZRMS2016000076); and by the National Genetically Modified Organisms Breeding Major Projects China (2018ZX0801023B).

Conflicts of Interest

The authors declare no conflict of interest.

References

  1. Wagner, G.J.; Wang, E.; Shepherd, R.W. New approaches for studying and exploiting an old protuberance, the plant trichome. Ann. Bot. 2004, 93, 3–11. [Google Scholar] [CrossRef] [PubMed]
  2. Werker, E. Trichome diversity and development. Adv. Bot. Res. 2000, 31, 1–35. [Google Scholar]
  3. Mathur, J.; Chua, N.H. Microtubule stabilization leads to growth reorientation in Arabidopsis trichomes. Plant Cell 2000, 12, 465–477. [Google Scholar] [CrossRef] [PubMed]
  4. Fordyce, J.A.; Agrawal, A.A. The Role of Plant Trichomes and Caterpillar Group Size on Growth and Defence of the Pipevine Swallowtail Battus philenor. J. Anim. Ecol. 2001, 70, 997–1005. [Google Scholar] [CrossRef]
  5. Voirin, B.; Bayet, C.; Colson, M. Demonstration that flavone aglycones accumulate in the peltate glands of Mentha x piperita leaves. Phytochemistry 1993, 34, 85–87. [Google Scholar] [CrossRef]
  6. Agati, G.; Azzarello, E.; Pollastri, S.; Tattini, M. Flavonoids as antioxidants in plants: Location and functional significance. Plant Sci. 2012, 196, 67–76. [Google Scholar] [CrossRef] [PubMed]
  7. Gang, D.R.; Wang, J.; Dudareva, N.; Nam, K.H.; Simon, J.E.; Lewinsohn, E.; Pichersky, E. An investigation of the storage and biosynthesis of phenylpropenes in sweet basil. Plant Physiol. 2001, 125, 539–555. [Google Scholar] [CrossRef] [PubMed]
  8. Hallahan, D.L.; Callow, J.A.; Gray, J.C. Plant Trichomes. In Advances in Botanical Research; Academic Press: London, UK, 2000; Volume 31, pp. 1–35. [Google Scholar]
  9. Valletta, A.; Santamaria, A. R.; Canini, A.; Canuti, L.; Pasqua, G. Trichomes in Camptotheca acuminata Decaisne (Nyssaceae): Morphology, distribution, structure, and secretion. Plant Biosyst. 2013, 147, 548–556. [Google Scholar] [CrossRef]
  10. Shepherd, R.W.; Bass, W.T.; Houtz, R.L.; Wagner, G.J. Phylloplanins of tobacco are defensive proteins deployed on aerial surfaces by short glandular trichomes. Plant Cell 2005, 17, 1851–1861. [Google Scholar] [CrossRef] [PubMed]
  11. Mellon, J.E.; Zelaya, C.A.; Dowd, M.K.; Beltz, S.B.; Klich, M.A. Inhibitory effects of gossypol, gossypolone, and apogossypolone on a collection of economically important filamentous fungi. J. Agric. Food Chem. 2012, 60, 2740–2745. [Google Scholar] [CrossRef] [PubMed]
  12. Dayan, F.E.; Duke, S.O. Trichomes and Root Hairs: Natural Pesticide Factories. Pestic. Outlook 2003, 14, 175–178. [Google Scholar] [CrossRef]
  13. Impei, S.; Gismondi, A.; Canini, A. Metabolic and biological profile of autochthonous Vitis vinifera L. ecotypes. Food Funct. 2015, 6, 1526–1538. [Google Scholar] [CrossRef] [PubMed]
  14. Gismond, A.; di Marco, G.; Canuti, L.; Canini, A. Antiradical activity of phenolic metabolites extracted from grapes of white and red Vitis vinifera L. cultivars. Vitis 2017, 56, 19–26. [Google Scholar]
  15. Karabourniotis, G.; Kotsabassidis, D.; Manetas, Y. Trichome density and its protective potential against ultraviolet-B radiation damage during leaf development. Can. J. Bot. 1995, 73, 376–383. [Google Scholar] [CrossRef]
  16. Karabourniotis, G.; Kofidis, G.; Fasseas, C.; Liakoura, V.; Drossopoulos, I. Polyphenol deposition in leaf hairs of Olea europaea (Oleaceae) and Quercus ilex (Fagaceae). Am. J. Bot. 1998, 85, 1007. [Google Scholar] [CrossRef] [PubMed]
  17. Lange, B.M.; Wildung, M.R.; Stauber, E.J.; Sanchez, C.; Pouchnik, D.; Croteau, R. Probing essential oil biosynthesis and secretion by functional evaluation of expressed sequence tags from mint glandular trichomes. Proc. Natl. Acad. Sci. USA 2000, 97, 2934–2939. [Google Scholar] [CrossRef] [PubMed] [Green Version]
  18. Gang, D.R.; Beuerle, T.; Werck-Reichhart, D.; Pichersky, E. Differential production of meta hydroxylated phenylpropanoids in sweet basil peltate glandular trichomes and leaves is controlled by the activities of specific acyltransferases and hydroxylases. Plant Physiol. 2002, 130, 1536–1544. [Google Scholar] [CrossRef] [PubMed]
  19. Aziz, N.; Paiva, N.L.; May, G.D.; Dixon, R.A. Transcriptome analysis of alfalfa glandular trichomes. Planta 2005, 221, 28–38. [Google Scholar] [CrossRef] [PubMed]
  20. Bertea, C.M.; Voster, A.; Verstappen, F.W.; Maffei, M.; Beekwilder, J.; Bouwmeester, H.J. Isoprenoid biosynthesis in Artemisia annua: Cloning and heterologous expression of a germacrene A synthase from a glandular trichome cDNA library. Arch. Biochem. Biophys. 2006, 448, 3–12. [Google Scholar] [CrossRef] [PubMed]
  21. Wang, G.; Tian, L.; Aziz, N.; Broun, P.; Dai, X.; He, J.; King, A.; Zhao, P.X.; Dixon, R.A. Terpene biosynthesis in glandular trichomes of hop. Plant Physiol. 2008, 148, 1254–1266. [Google Scholar] [CrossRef] [PubMed]
  22. Chatzopoulou, F.M.; Makris, A.M.; Argiriou, A.; Degenhardt, J.; Kanellis, A.K. EST analysis and annotation of transcripts derived from a trichome-specific cDNA library from Salvia fruticosa. Plant Cell Rep. 2010, 29, 523–534. [Google Scholar] [CrossRef] [PubMed]
  23. Harada, E.; Kim, J.A.; Meyer, A.J.; Hell, R.; Clemens, S.; Choi, Y.E. Expression profiling of tobacco leaf trichomes identifies genes for biotic and abiotic stresses. Plant Cell Physiol. 2010, 51, 1627–1637. [Google Scholar] [CrossRef] [PubMed]
  24. Schilmiller, A.L.; Miner, D.P.; Larson, M.; McDowell, E.; Gang, D.R.; Wilkerson, C.; Last, R.L. Studies of a biochemical factory: Tomato trichome deep expressed sequence tag sequencing and proteomics. Plant Physiol. 2010, 153, 1212–1223. [Google Scholar] [CrossRef] [PubMed]
  25. Debono, A.; Yeats, T.H.; Rose, J.K.; Bird, D.; Jetter, R.; Kunst, L.; Samuels, L. Arabidopsis LTPG is a glycosylphosphatidylinositol-anchored lipid transfer protein required for export of lipids to the plant surface. Plant Cell 2009, 21, 1230–1238. [Google Scholar] [CrossRef] [PubMed]
  26. Lee, S.B.; Go, Y.S.; Bae, H.J.; Park, J.H.; Cho, S.H.; Cho, H.J.; Lee, D.S.; Park, O.K.; Hwang, I.; Suh, M.C. Disruption of glycosylphosphatidylinositol-anchored lipid transfer protein gene altered cuticular lipid composition, increased plastoglobules, and enhanced susceptibility to infection by the fungal pathogen Alternaria brassicicola. Plant Physiol. 2009, 150, 42–54. [Google Scholar] [CrossRef] [PubMed]
  27. Choi, Y.E.; Lim, S.; Kim, H.J.; Han, J.Y.; Lee, M.H.; Yang, Y.; Kim, J.A.; Kim, Y.S. Tobacco NtLTP1, a glandular-specific lipid transfer protein, is required for lipid secretion from glandular trichomes. Plant J. 2012, 70, 480–491. [Google Scholar] [CrossRef] [PubMed]
  28. Thoma, S.; Kaneko, Y.; Somerville, C. A non-specific lipid transfer protein from Arabidopsis is a cell wall protein. Plant J. 1993, 3, 427–436. [Google Scholar] [CrossRef] [PubMed] [Green Version]
  29. Kader, J.C. Lipid-Transfer Proteins in Plants. Annu. Rev. Plant Physiol. Mol. Biol. 1996, 47, 627–654. [Google Scholar] [CrossRef] [PubMed]
  30. Boutrot, F.; Chantret, N.; Gautier, M.F. Genome-wide analysis of the rice and Arabidopsis non-specific lipid transfer protein (nsLtp) gene families and identification of wheat nsLtp genes by EST data mining. BMC Genomics 2008, 9, 86. [Google Scholar] [CrossRef] [PubMed]
  31. Kader, J.C. Proteins and the intracellular exchange of lipids. I. Stimulation of phospholipid exchange between mitochondria and microsomal fractions by proteins isolated from potato tuber. Biochim. Biophys. Acta 1975, 380, 31–44. [Google Scholar] [CrossRef]
  32. Wang, L.; Yu, S.; Tong, C.; Zhao, Y.; Liu, Y.; Song, C.; Zhang, Y.; Zhang, X.; Wang, Y.; Hua, W.; et al. Genome sequencing of the high oil crop sesame provides insight into oil biosynthesis. Genome Biol. 2014, 15, R39. [Google Scholar] [CrossRef] [PubMed] [Green Version]
  33. Li, J.; Gao, G.; Xu, K.; Chen, B.; Yan, G.; Li, F.; Qiao, J.; Zhang, T.; Wu, X. Genome-wide survey and expression analysis of the putative non-specific lipid transfer proteins in Brassica rapa L. PLoS ONE 2014, 9, e84556. [Google Scholar] [CrossRef] [PubMed]
  34. Wei, K.; Zhong, X. Non-specific lipid transfer proteins in maize. BMC Plant Biol. 2014, 14, 281. [Google Scholar] [CrossRef] [PubMed]
  35. Jang, C.; Kim, D.; Bu, S.; Kim, J.; Lee, S.; Kim, J.; Johnson, J.; Seo, Y. Isolation and characterization of lipid transfer protein (LTP) genes from a wheat-rye translocation line. Plant Cell Rep. 2002, 20, 961–966. [Google Scholar]
  36. Jang, C.S.; Lee, H.J.; Chang, S.J.; Seo, Y.W. Expression and promoter analysis of the TaLTP1 gene induced by drought and salt stress in wheat (Triticum aestivum L.). Plant Sci. 2004, 167, 995–1001. [Google Scholar] [CrossRef]
  37. Jung, H.W.; Kim, K.D.; Hwang, B.K. Identification of pathogen-responsive regions in the promoter of a pepper lipid transfer protein gene (CALTPI) and the enhanced resistance of the CALTPI transgenic Arabidopsis against pathogen and environmental stresses. Planta 2005, 221, 361–373. [Google Scholar] [CrossRef] [PubMed]
  38. Deeken, R.; Saupe, S.; Klinkenberg, J.; Riedel, M. The nonspecific lipid transfer protein AtLtpI-4 is involved in suberin formation of Arabidopsis thaliana crown galls. Plant Physiol. 2016, 172, 1911–1927. [Google Scholar] [CrossRef] [PubMed]
  39. Sarowar, S.; Kim, Y.J.; Kim, K.D.; Hwang, B.K.; Ok, S.H.; Shin, J.S. Overexpression of lipid transfer protein (LTP) genes enhances resistance to plant pathogens and LTP functions in long-distance systemic signaling in tobacco. Plant Cell Rep. 2009, 28, 419–427. [Google Scholar] [CrossRef] [PubMed]
  40. Jia, Z.; Gou, J.; Sun, Y.; Yuan, L.; Tang, Q.; Yang, X.; Pei, Y.; Luo, K. Enhanced resistance to fungal pathogens in transgenic Populus tomentosa Carr. by overexpression of an nsLTP-like antimicrobial protein gene from motherwort (Leonurus japonicus). Tree Physiol. 2010, 30, 1599–1605. [Google Scholar] [CrossRef] [PubMed]
  41. Chae, K.; Kieslich, C.A.; Morikis, D.; Kim, S.C.; Lord, E.M. A gain-of-function mutation of Arabidopsis lipid transfer protein 5 disturbs pollen tube tip growth and fertilization. Plant Cell 2009, 21, 3902–3914. [Google Scholar] [CrossRef] [PubMed]
  42. Chae, K.; Gonong, B.J.; Kim, S.C.; Kieslich, C.A.; Morikis, D.; Balasubramanian, S.; Lord, E.M. A multifaceted study of stigma/style cysteine-rich adhesin (SCA)-like Arabidopsis lipid transfer proteins (LTPs) suggests diversified roles for these LTPs in plant growth and reproduction. J. Exp. Bot. 2010, 61, 4277–4290. [Google Scholar] [CrossRef] [PubMed]
  43. Ambrose, C.; DeBono, A.; Wasteneys, G. Cell geometry guides the dynamic targeting of apoplastic GPI-linked lipid transfer protein to cell wall elements and cell borders in Arabidopsis thaliana. PLoS ONE 2013, 8, e81215. [Google Scholar] [CrossRef] [PubMed]
  44. Liu, F.; Zhang, X.; Lu, C.; Zeng, X.; Li, Y.; Fu, D.; Wu, G. Non-specific lipid transfer proteins in plants: Presenting new advances and an integrated functional analysis. J. Exp. Bot. 2015, 66, 5663–5681. [Google Scholar] [CrossRef] [PubMed]
  45. Kang, K.; Kim, Y.S.; Park, S.; Back, K. Senescence-induced serotonin biosynthesis and its role in delaying senescence in rice leaves. Plant Physiol. 2009, 150, 1380–1393. [Google Scholar] [CrossRef] [PubMed]
  46. Ramakrishna, A.; Giridhar, P.; Ravishankar, G.A. Phytoserotonin: A review. Plant Signal Behav. 2011, 6, 800–809. [Google Scholar] [PubMed]
  47. Dong, X.; Chen, W.; Wang, W.; Zhang, H.; Liu, X.; Luo, J. Comprehensive profiling and natural variation of flavonoids in rice. J. Integr. Plant Biol. 2014, 56, 876–886. [Google Scholar] [CrossRef] [PubMed] [Green Version]
  48. Nagaharu, U. Genome analysis in Brassica with special reference to the experimental formation of B. napus and peculiar mode of fertilization. Jpn. J. Bot. 1935, 7, 389–452. [Google Scholar]
  49. Guo, L.; Yang, H.; Zhang, X.; Yang, S. Lipid transfer protein 3 as a target of MYB96 mediates freezing and drought stress in Arabidopsis. J. Exp. Bot. 2013, 64, 1755–1767. [Google Scholar] [CrossRef] [PubMed]
  50. Telfer, A.; Bollman, K.M.; Poethig, R.S. Phase change and the regulation of trichome distribution in Arabidopsis thaliana. Development 1997, 124, 645–654. [Google Scholar] [PubMed]
  51. Szymanski, D.B.; Jilk, R.A.; Pollock, S.M.; Marks, M.D. Control of GL2 expression in Arabidopsis leaves and trichomes. Development 1998, 125, 1161–1171. [Google Scholar] [PubMed]
  52. Hung, C.Y.; Lin, Y.; Zhang, M.; Pollock, S.; Marks, M.D.; Schiefelbein, J. A common position-dependent mechanism controls cell-type patterning and GLABRA2 regulation in the root and hypocotyl epidermis of Arabidopsis. Plant Physiol. 1998, 117, 73–84. [Google Scholar] [CrossRef] [PubMed]
  53. Yu, N.; Cai, W.J.; Wang, S.; Shan, C.M.; Wang, L.J.; Chen, X.Y. Temporal control of trichome distribution by microRNA156-targeted SPL genes in Arabidopsis thaliana. Plant Cell 2010, 22, 2322–2335. [Google Scholar] [CrossRef] [PubMed]
  54. Kader, J.C. Lipid-transfer proteins: A puzzling family of plant proteins. Trends Plant Sci. 1997, 2, 66–70. [Google Scholar] [CrossRef]
  55. Djordjevic, M.A.; Oakes, M.; Li, D.X.; Hwang, C.H.; Hocart, C.H.; Gresshoff, P.M. The glycine max xylem sap and apoplast proteome. J. Proteome Res. 2007, 6, 3771–3779. [Google Scholar] [CrossRef] [PubMed]
  56. Kusumawati, L.; Imin, N.; Djordjevic, M.A. Characterization of the secretome of suspension cultures of Medicago species reveals proteins important for defense and development. J. Proteome Res. 2008, 7, 4508–4520. [Google Scholar] [CrossRef] [PubMed]
  57. Pyee, J.; Yu, H.; Kolattukudy, P.E. Identification of a lipid transfer protein as the major protein in the surface wax of broccoli (Brassica oleracea) leaves. Arch. Biochem. Biophys. 1994, 311, 460–468. [Google Scholar] [CrossRef] [PubMed]
  58. Mundy, J.; Rogers, J.C. Selective expression of a probable amylase/protease inhibitor in barley aleurone cells: Comparison to the barley amylase/subtilisin inhibitor. Planta 1986, 169, 51–63. [Google Scholar] [CrossRef] [PubMed]
  59. Dani, V.; Simon, W.J.; Duranti, M.; Croy, R.R. Changes in the tobacco leaf apoplast proteome in response to salt stress. Proteomics 2005, 5, 737–745. [Google Scholar] [CrossRef] [PubMed]
  60. Hülskamp, M.; Misra, S.; Jurgens, G. Genetic dissection of trichome cell development in Arabidopsis. Cell 1994, 76, 555–566. [Google Scholar] [CrossRef]
  61. Larkin, J.C.; Oppenheimer, D.G.; Lloyd, A.M.; Paparozzi, E.T.; Marks, M.D. Roles of the GLABROUS1 and TRANSPARENT TESTA GLABRA Genes in Arabidopsis Trichome Development. Plant Cell 1994, 6, 1065–1076. [Google Scholar] [CrossRef] [PubMed]
  62. Sohal, A.K.; Pallas, J.A.; Jenkins, G.I. The promoter of a Brassica napus lipid transfer protein gene is active in a range of tissues and stimulated by light and viral infection in transgenic Arabidopsis. Plant Mol. Biol. 1999, 41, 75–87. [Google Scholar] [CrossRef] [PubMed]
  63. Kunst, L.; Samuels, A.L. Biosynthesis and secretion of plant cuticular wax. Prog. Lipid Res. 2003, 42, 51–80. [Google Scholar] [CrossRef]
  64. Liu, F.; Xiong, X.; Wu, L.; Fu, D.; Hayward, A.; Zeng, X.; Cao, Y.; Wu, Y.; Li, Y.; Wu, G. BraLTP1, a lipid transfer protein gene involved in epicuticular wax deposition, cell proliferation and flower development in Brassica napus. PLoS ONE 2014, 9, e110272. [Google Scholar] [CrossRef] [PubMed]
  65. Kirik, V.; Lee, M.M.; Wester, K.; Herrmann, U.; Zheng, Z.; Oppenheimer, D.; Schiefelbein, J.; Hülskamp, M. Functional diversification of MYB23 and GL1 genes in trichome morphogenesis and initiation. Development 2005, 132, 1477–1485. [Google Scholar] [CrossRef] [PubMed]
  66. Plett, J.M.; Wilkins, O.; Campbell, M.M.; Ralph, S.G.; Regan, S. Endogenous overexpression of Populus MYB186 increases trichome density, improves insect pest resistance, and impacts plant growth. Plant J. 2010, 64, 419–432. [Google Scholar] [CrossRef] [PubMed]
  67. Gigolashvili, T.; Berger, B.; Mock, H.P.; Muller, C.; Weisshaar, B.; Flugge, U.I. The transcription factor HIG1/MYB51 regulates indolic glucosinolate biosynthesis in Arabidopsis thaliana. Plant J. 2007, 50, 886–901. [Google Scholar] [CrossRef]
  68. Jakoby, M.J.; Falkenhan, D.; Mader, M.T.; Brininstool, G.; Wischnitzki, E.; Platz, N.; Hudson, A.; Hülskamp, M.; Larkin, J.; Schnittger, A. Transcriptional profiling of mature Arabidopsis trichomes reveals that NOECK encodes the MIXTA-like transcriptional regulator MYB106. Plant Physiol. 2008, 148, 1583. [Google Scholar] [CrossRef] [PubMed]
  69. Lloyd, A.M.; Walbot, V.; Davis, R.W. Arabidopsis and Nicotiana anthocyanin production activated by maize regulators R and C1. Science 1992, 258, 1773–1775. [Google Scholar] [CrossRef] [PubMed]
  70. Taiz, L.; Zeiger, E.; Møller, I.M.; Murphy, A. Plant Physiology and Development, 6th ed.; Oxford University Press: New York, NY, USA, 2014; Volume 6, pp. 1065–1068. [Google Scholar]
  71. Wen, W.; Li, D.; Li, X.; Gao, Y.; Li, W.; Li, H.; Liu, J.; Liu, H.; Chen, W.; Luo, J. Metabolome-based genome-wide association study of maize kernel leads to novel biochemical insights. Nat. Commun. 2014, 5, 3438. [Google Scholar] [CrossRef] [PubMed] [Green Version]
  72. Peng, M.; Gao, Y. Evolutionarily distinct BAHD N-acyltransferases are responsible for natural variation of aromatic amine conjugates in rice. Plant Cell 2016, 28, 1533–1550. [Google Scholar] [CrossRef] [PubMed]
  73. Yannai, S. Dictionary of Food Compounds with CD-ROM: Additives, Flavors, and Ingredients; CRC Press: Boca Raton, FL, USA, 2013; Volume 63, p. 123. [Google Scholar]
  74. Lorenzen, M.; Racicot, V.; Strack, D.; Chapple, C. Sinapic acid ester metabolism in wild type and a sinapoylglucose-accumulating mutant of Arabidopsis. Plant Physiol. 1996, 112, 1625–1630. [Google Scholar] [CrossRef] [PubMed]
  75. Stobiecki, M. Application of mass spectrometry for identification and structural studies of flavonoid glycosides. Phytochemistry 2000, 54, 237–256. [Google Scholar] [CrossRef]
  76. Lepiniec, L.; Debeaujon, I.; Routaboul, J.M.; Baudry, A.; Pourcel, L.; Nesi, N.; Caboche, M. Genetics and biochemistry of seed flavonoids. Annu. Rev. Plant Biol. 2006, 57, 405–430. [Google Scholar] [CrossRef] [PubMed]
  77. Golldack, D.; Luking, I.; Yang, O. Plant tolerance to drought and salinity: Stress regulating transcription factors and their functional significance in the cellular transcriptional network. Plant Cell Rep. 2011, 30, 1383–1391. [Google Scholar] [CrossRef] [PubMed]
  78. Seo, Y.S.; Chern, M.; Bartley, L.E.; Han, M.; Jung, K.H.; Lee, I.; Walia, H.; Richter, T.; Xu, X.; Cao, P.; et al. Towards establishment of a rice stress response interactome. PLoS Genet. 2011, 7, e1002020. [Google Scholar] [CrossRef] [PubMed]
  79. Ryan, K.G.; Swinny, E.E.; Winefield, C.; Markham, K.R. Flavonoids and UV photoprotection in Arabidopsis mutants. Z. Naturforsch. C. 2001, 56, 745–754. [Google Scholar] [CrossRef] [PubMed]
  80. Sheahan, J.J. Sinapate Esters Provide greater UV-B attenuation than flavonoids in Arabidopsis thaliana (Brassicaceae). Am. J. Bot. 1996, 83, 679–686. [Google Scholar] [CrossRef]
  81. N’Guessan, J.D.; Bidié, A.P.; Lenta, B.N.; Weniger, B.; André, P.; Guédéguina, F. In vitro assays for bioactivity-guided isolation of antisalmonella and antioxidant compounds in Thonningia sanguinea flowers. Afr. J. Biotechnol. 2007, 6, 1685–1689. [Google Scholar]
  82. Hawas, U.W. Antioxidant activity of brocchlin carboxylic acid and its methyl ester from Chrozophora brocchiana. Nat. Prod. Res. 2007, 21, 632–640. [Google Scholar] [CrossRef] [PubMed]
  83. Herbette, S.; Menn, A.L.; Rousselle, P.; Ameglio, T.; Faltin, Z.; Branlard, G.; Eshdat, Y.; Julien, J.L.; Drevet, J.R.; Roeckel-Drevet, P. Modification of photosynthetic regulation in tomato overexpressing glutathione peroxidase. Biochim. Biophys. Acta 2005, 1724, 108–118. [Google Scholar] [CrossRef] [PubMed]
  84. Gill, S.S.; Tuteja, N. Reactive oxygen species and antioxidant machinery in abiotic stress tolerance in crop plants. Plant Physiol. Biochem. 2010, 48, 909–930. [Google Scholar] [CrossRef] [PubMed]
  85. Foyer, C.H.; Noctor, G. Ascorbate and glutathione: The heart of the redox hub. Plant Physiol. 2011, 155, 2–18. [Google Scholar] [CrossRef] [PubMed]
  86. Wang, J.; Hu, J.; Zhang, X.; Xu, Q.; Zhou, S.; Xu, S. Effect of Salt Priming on Germination and Seedling Establishment of Rape Seed under Different Water Conditions. Seed 2004, 23, 6–8. [Google Scholar]
  87. Lin, R.; Wang, X.; Luo, Y.; Du, W.; Guo, H.; Yin, D. Effects of soil cadmium on growth, oxidative stress and antioxidant system in wheat seedlings (Triticum aestivum L.). Chemosphere 2007, 69, 89–98. [Google Scholar] [CrossRef] [PubMed]
  88. Liu, W.; Shang, S.; Feng, X.; Zhang, G.; Wu, F. Modulation of exogenous selenium in cadmium-induced changes in antioxidative metabolism, cadmium uptake, and photosynthetic performance in the 2 tobacco genotypes differing in cadmium tolerance. Environ. Toxicol. Chem. 2015, 34, 92–99. [Google Scholar] [CrossRef] [PubMed]
  89. Guo, H.; Hong, C.; Chen, X.; Xu, Y.; Liu, Y.; Jiang, D.; Zheng, B. Different growth and physiological responses to cadmium of the three miscanthus species. PLoS ONE 2016, 11, e0153475. [Google Scholar] [CrossRef] [PubMed]
  90. Wang, X.; Wang, H.; Wang, J.; Sun, R.; Wu, J.; Liu, S.; Bai, Y.; Mun, J.H.; Bancroft, I.; Cheng, F.; et al. The genome of the mesopolyploid crop species Brassica rapa. Nat. Genet. 2011, 43, 1035–1039. [Google Scholar] [CrossRef] [PubMed]
  91. Jefferson, R.A.; Kavanagh, T.A.; Bevan, M.W. GUS fusions: Beta-glucuronidase as a sensitive and versatile gene fusion marker in higher plants. EMBO J. 1987, 6, 3901–3907. [Google Scholar] [PubMed]
  92. Yang, C.; Li, H.; Zhang, J.; Luo, Z.; Gong, P.; Zhang, C.; Li, J.; Wang, T.; Zhang, Y.; Lu, Y.; et al. A regulatory gene induces trichome formation and embryo lethality in tomato. Proc. Natl. Acad. Sci. USA 2011, 108, 11836–11841. [Google Scholar] [CrossRef] [PubMed]
  93. Chen, W.; Gong, L.; Guo, Z.; Wang, W.; Zhang, H.; Liu, X.; Yu, S.; Xiong, L.; Luo, J. A novel integrated method for large-scale detection, identification, and quantification of widely targeted metabolites: Application in the study of rice metabolomics. Mol. Plant 2013, 6, 1769–1780. [Google Scholar] [CrossRef] [PubMed]
  94. Chen, W.; Gao, Y.; Xie, W.; Gong, L.; Lu, K.; Wang, W.; Li, Y.; Liu, X.; Zhang, H.; Dong, H.; et al. Genome-wide association analyses provide genetic and biochemical insights into natural variation in rice metabolism. Nat. Genet. 2014, 46, 714–721. [Google Scholar] [CrossRef] [PubMed]
  95. Zhu, G.; Wang, S.; Huang, Z.; Zhang, S.; Liao, Q.; Zhang, C.; Lin, T.; Qin, M.; Peng, M.; Yang, C.; et al. Rewiring of the Fruit Metabolome in Tomato Breeding. Cell 2018, 172, 249–261. [Google Scholar] [CrossRef] [PubMed]
  96. Dodge, A.D. The mode of action of the bipyridylium herbicides, paraquat and diquat. Endeavour 1971, 30, 130–135. [Google Scholar] [CrossRef]
Figure 1. Analysis of the deduced amino acid sequences of B. rapa lipid transfer protein 2 (BraLTP2) with homologous sequences in other Cruciferae. Variable sites (dark grey), the nsLTP-like conserved 8 CM domain (light gray) with conserved cysteine residues (asterisks), and putative extracellular secretory signals (underlined) have been displayed. The sequences are from Arabidopsis thaliana AtLTP1 (AT1g52415.1), B. oleracea BolLTP1 (Bol019670), B. napus BnaLTP1 (BnaAnng31360D), and B. rapa BraLTP2 (Bra040156).
Ijms 19 01733 g001
Figure 2. Histochemical β-glucuronidase (GUS) staining in tissues of ProBraLTP2::GUS plants. (A): Four-week-old ProBraLTP2::GUS seedling; (B): the first four lotus leaves from the apex of an 8-week-old ProBraLTP2::GUS seedling; (C): the front part of the first four lotus leaves from the apex of a 12-week-old ProBraLTP2::GUS seedling; (D,E,F): stem leaf and bud of a 15-week old plant during bud stage; (G,H): 18-week old ProBraLTP2::GUS plant during flowering stage; (IP): negative control groups in corresponding periods; (Q,T,W): Trichome of lotus leaves of 4-week old seedling; (R,U,X): trichome of lotus leaves of 8-week old seedling; (S,V,Y): trichome of lotus leaves of 12-week old seedling; (Q,R,S,W,X,Y): the first leaves; (T,U,V): the second leaves; (QV): trichome of ProBraLTP2::GUS leaves; and (WY): trichome of negative controls. (AE,GM,O,P): Scale bars = 1 cm; (F,N): scale bars = 0.5 cm; and (IY): scale bars = 5 µm.
Ijms 19 01733 g002
Figure 3. Localization of the fusion protein. (AD): BraLTP2::GFP; and (EH): negative controls. (A,C,E,G): B. napus petioles epidermis cells were transformed with construct and visualized with a fluorescence microscope; and (B,D,F,H): Trichomes on the leaf apex edge, visualized with a confocal laser scanning microscopy system. Scale bars = 50 µm.
Ijms 19 01733 g003
Figure 4. Analysis of BraLTP2 mRNA levels in the wild type (WT) and BraLTP2 overexpression lines. BraLTP2 mRNA levels in 10-week-old wild type (WT) and 35S::BraLTP2 transgenic plants by real-time polymerase chain reaction (PCR). Actin was used as an internal loading control in the y-axis. Standard errors were derived from three biological repeated experiments for the expression levels of each T0 plant. * Statistically significant difference from wild type (* p < 0.05).
Ijms 19 01733 g004
Figure 5. Phenotype identification, scanning electron microscopy (SEM) observation, and the number of epidermal trichome statistics. (A): Leaf epidermal trichomes imaged by light microscopy. (B): Leaf epidermal trichomes imaged by SEM. (C): Trichome number from 1 cm2 leaf area from apex edge. * Statistically significant difference from wild type (* p < 0.05).
Ijms 19 01733 g005
Figure 6. Differential classes of up-regulated secondary metabolites clustering heatmap. Seven classes of up-regulated secondary metabolites between 35S::BraLTP2-3 rep 1–3 group and WT1–3 group in the clustering heatmap. The abscissa corresponds to the group number, the right ordinate corresponds to the secondary metabolites number, and the left ordinate of different color modules corresponds to the seven classes of metabolites. The color indicates abundance of changes in secondary metabolites from −1 to 1. Green corresponds to a higher correlation, the intensity of green is an indication of a higher content of secondary metabolites in the corresponding group.
Ijms 19 01733 g006
Figure 7. Changes in activities of antioxidant enzymes of WT, 35S::BraLTP2-2, and 35S::BraLTP2-3 leaves. The activity of antioxidant enzymes was determined after treatment with methyl viologen (MV) for four hours. * Statistically significant difference from wild type (* p < 0.05) in each different treatment. Experiments were performed in triplicate. (A): CAT—Catalase; (B): APX—Ascorbate peroxidase; (C): GR—Glutathione reductase; (D): POD—Peroxidase; and (E): SOD—Super oxide dimutese.
Ijms 19 01733 g007
Figure 8. The relationship of different metabolic pathways. Important primary metabolic precursors and intermediate secondary metabolites are shown in black font, the final secondary metabolites are shown in red font. Pathways are boxed as follows: red box, mevalonic acid pathway; purple box, shikimic acid/cinnamic acid pathway; green box, amino acid pathway; yellow box, fatty acid pathway. The red callout boxes refer to the index number of up-regulated secondary metabolites, as detailed in Table S2.
Ijms 19 01733 g008
Table 1. The putative cis-acting regulatory elements in the promoter of BraLTP2 gene.
Component NameOrganismPosition in (+) StrandSequenceFunction
StartEnd
ABREArabidopsis thaliana–1184 –254 –166–1179 –250 –160CACGTGACGTGCACGCGGcis–acting element involved in the abscisic acid responsiveness
AREZea mays–661 –546–655 –541TAACGTATGGTTTcis–acting regulatory element essential for the anaerobic induction
P-BoxPetroselinum crispum–975–970TTGACCGibberellin-responsive element
CGTCA-motifHordeum vulgare–213–207CCTTTTGcis–acting regulatory element involved in the Methyl jasmonate-responsiveness
DREArabidopsis thaliana–1141–1134TGGCCGACRegulatory element involved in cold- and dehydration-responsiveness
G-BoxAntirrhinum majus–778–773CACGTTcis–acting regulatory element involved in light responsiveness
MBSArabidopsis thaliana–1090–1085CAACTGMYB binding site involved in drought-inducibility
MYBArabidopsis thaliana–109 –67–104 –62CTGTTAMYB binding sites
Table 2. Seven main categories of the secondary metabolite in the wild type (WT) and 35::BraLTP2-overexpressed lines.
ClassNumber of Compounds DetectedNumber of Compounds with Significant Quantitative DifferencesNumber of Compounds with Higher Concentration in 35::BraLTP2Number of Compounds with Lower Concentration in 35::BraLTP2
Flavonoids5521201
Phenylpropanoids321064
Phenolamides191349
Alkaloids24826
Terpenoids10211
Organic acids34211
Other metabolites971798
Total271734330
Table 3. Difference of flavones in the wild type and 35::BraLTP2-overexpressed lines. VIP—variable important in projection.
No. aFlavonesWT bBraLTP2bFold ChangeVIP
BCL0281Kaempferide6.07 × 1023.15 × 10451.873.35
BCL0318Prunin1.27 × 1037.03 × 1035.562.11
BCL0485Kaempferol1.03 × 1045.59 × 1045.432.22
BCL0317Chrysoeriol O-hexoside2.02 × 1031.00 × 1044.952.10
BCL0305Kaempferol 3-O-glucoside (Astragalin)2.00 × 1049.20 × 1044.601.81
BCL0306Luteolin 5-O-hexoside4.14 × 1041.70 × 1054.101.98
BCL0313Naringenin 7-O-glucoside5.65 × 1032.08 × 1043.681.87
BCL0314Apigenin 7-O-glucoside (Cosmosiin)2.66 × 1039.35 × 1033.511.84
BCL0267Luteolin O-hexosyl-O-hexoside2.37 × 1047.42 × 1043.131.75
BCL0308Apigenin 7-O-glucoside5.35 × 1031.54 × 1042.871.72
BCL0323Naringenin O-malonylhexoside1.77 × 1045.03 × 1042.841.72
BCL02973’,4’,5’-Dihydrotricetin O-hexosyl-O-hexoside3.97 × 1031.04 × 1042.621.59
BCL0268Quercetin O-hexoside1.01 × 1042.59 × 1042.571.49
BCL0292Kaempferol 3-O-β -rutinoside (Nicotiflorin)5.36 × 1031.36 × 1042.541.20
BCL0177Luteolin-3’,7-di-O-glucoside5.71 × 1061.36 × 1072.381.51
BCL02953,4,2’,4’,6’-Pentamethoxychalcone1.31 × 1042.62 × 1042.001.27
BCL0190Cyanidin 3-O-glucoside (Anthocyanins)1.54 × 1066.24 × 1064.061.96
BCL0242Cyanidin (Anthocyanins)4.87 × 1031.46 × 1043.001.76
BCL0191Delphinidin O-hexoside (Anthocyanins)5.52 × 1041.65 × 1052.981.69
BCL0261Rosinidin O-hexoside (Anthocyanins)3.40 × 1038.49 × 1032.501.52
Note: a The No. is the secondary metabolite number in Table S1; and b The average value is shown in the table. The value means mass spectral signal response value.
Table 4. Difference of phenylpropanoids in the wild type and 35::BraLTP2-overexpressed lines.
No.PhenylpropanoidsWTBraLTP2Fold ChangeVIP
BCL0304Ferulic acid2.60 × 1031.49 × 1045.72.24
BCL0184Brevifolincarboxylic acid1.61 × 1047.94 × 1044.932.13
BCL0364Geranyl acetate1.86 × 1047.48 × 1044.032.00
BCL0315trans-Cinnamaldehyde4.57 × 1031.11 × 1042.441.50
BCL0266Syringic acid2.00 × 1034.89 × 1032.441.52
BCL0225Coumarin9.77 × 1063.22 × 1062.271.48
Table 5. Difference of phenolamides in the wild type and 35::BraLTP2-overexpressed lines.
No.PhenolamidesWTBraLTP2Fold ChangeVIP
BCL0212N-Feruloyl agmatine4.51 × 1031.78 × 10539.543.13
BCL0226N-Sinapoyl agmatine2.71 × 1031.92 × 1047.082.26
BCL0189N-Coumaroyl agmatine2.02 × 1038.02 × 1033.971.82
BCL0229N-Feruloyl spermidine8.84 × 1041.79 × 1052.031.34
Table 6. Difference of alkaloids, terpenoids, and organic acids in the wild type and 35::BraLTP2-overexpressed lines.
No.Alkaloids, Terpenoids, and Organic acidsWTBraLTP2Fold ChangeVIP
BCL0282Alkaloids (Tryptamines)N-Nexosyl-p-coumaroyl serotonin1.56 × 1031.65 × 105105.773.69
BCL02935-Methoxy-N,N-dimethyltryptamine5.36 × 1041.85 × 1053.451.85
BCL0384TerpenoidsPhytocassane C6.71 × 1031.60 × 1042.391.32
BCL0296Organic acidsm-Anisic-acid7.44 × 1031.86 × 1042.831.57
Table 7. Difference of other metabolites in the wild type and 35::BraLTP2-overexpressed lines.
No.Other MetabolitesWTBraLTP2Fold ChangeVIP
BCL0273Indoles and its derivativesIAA-Asp-N-Glc7.41 × 1024.23 × 10457.093.38
BCL03211-Methoxyindole-3-carbaldehyde7.44 × 1031.86 × 1042.501.56
BCL0036CholinesO-Phosphocholine9.49 × 1033.36 × 1043.541.88
BCL0029sn-Glycero-3-phosphocho8.99 × 1052.17 × 1062.411.52
BCL0335Coumarins and its derivatives4-Methylumbelliferone1.49 × 1043.51 × 1042.351.26
BCL0206OthersN-α-Benzenolarginine ethylester9.01 × 1021.15 × 10412.792.50
BCL0256Bergamottin6.23 × 1053.16 × 1065.082.14
BCL02751-(3,4-Dichlorophenyl)-3-methylurea1.89 × 1058.77 × 1054.632.08
BCL04102-Amino-9-methyl-4-octadecene-1,3,8-triol4.80 × 1031.12 × 1042.331.49

