Immune-Related Functional Differential Gene Expression in Koi Carp (Cyprinus carpio) after Challenge with Aeromonas sobria

 ,
,
Abstract
:
1. Introduction
2. Results
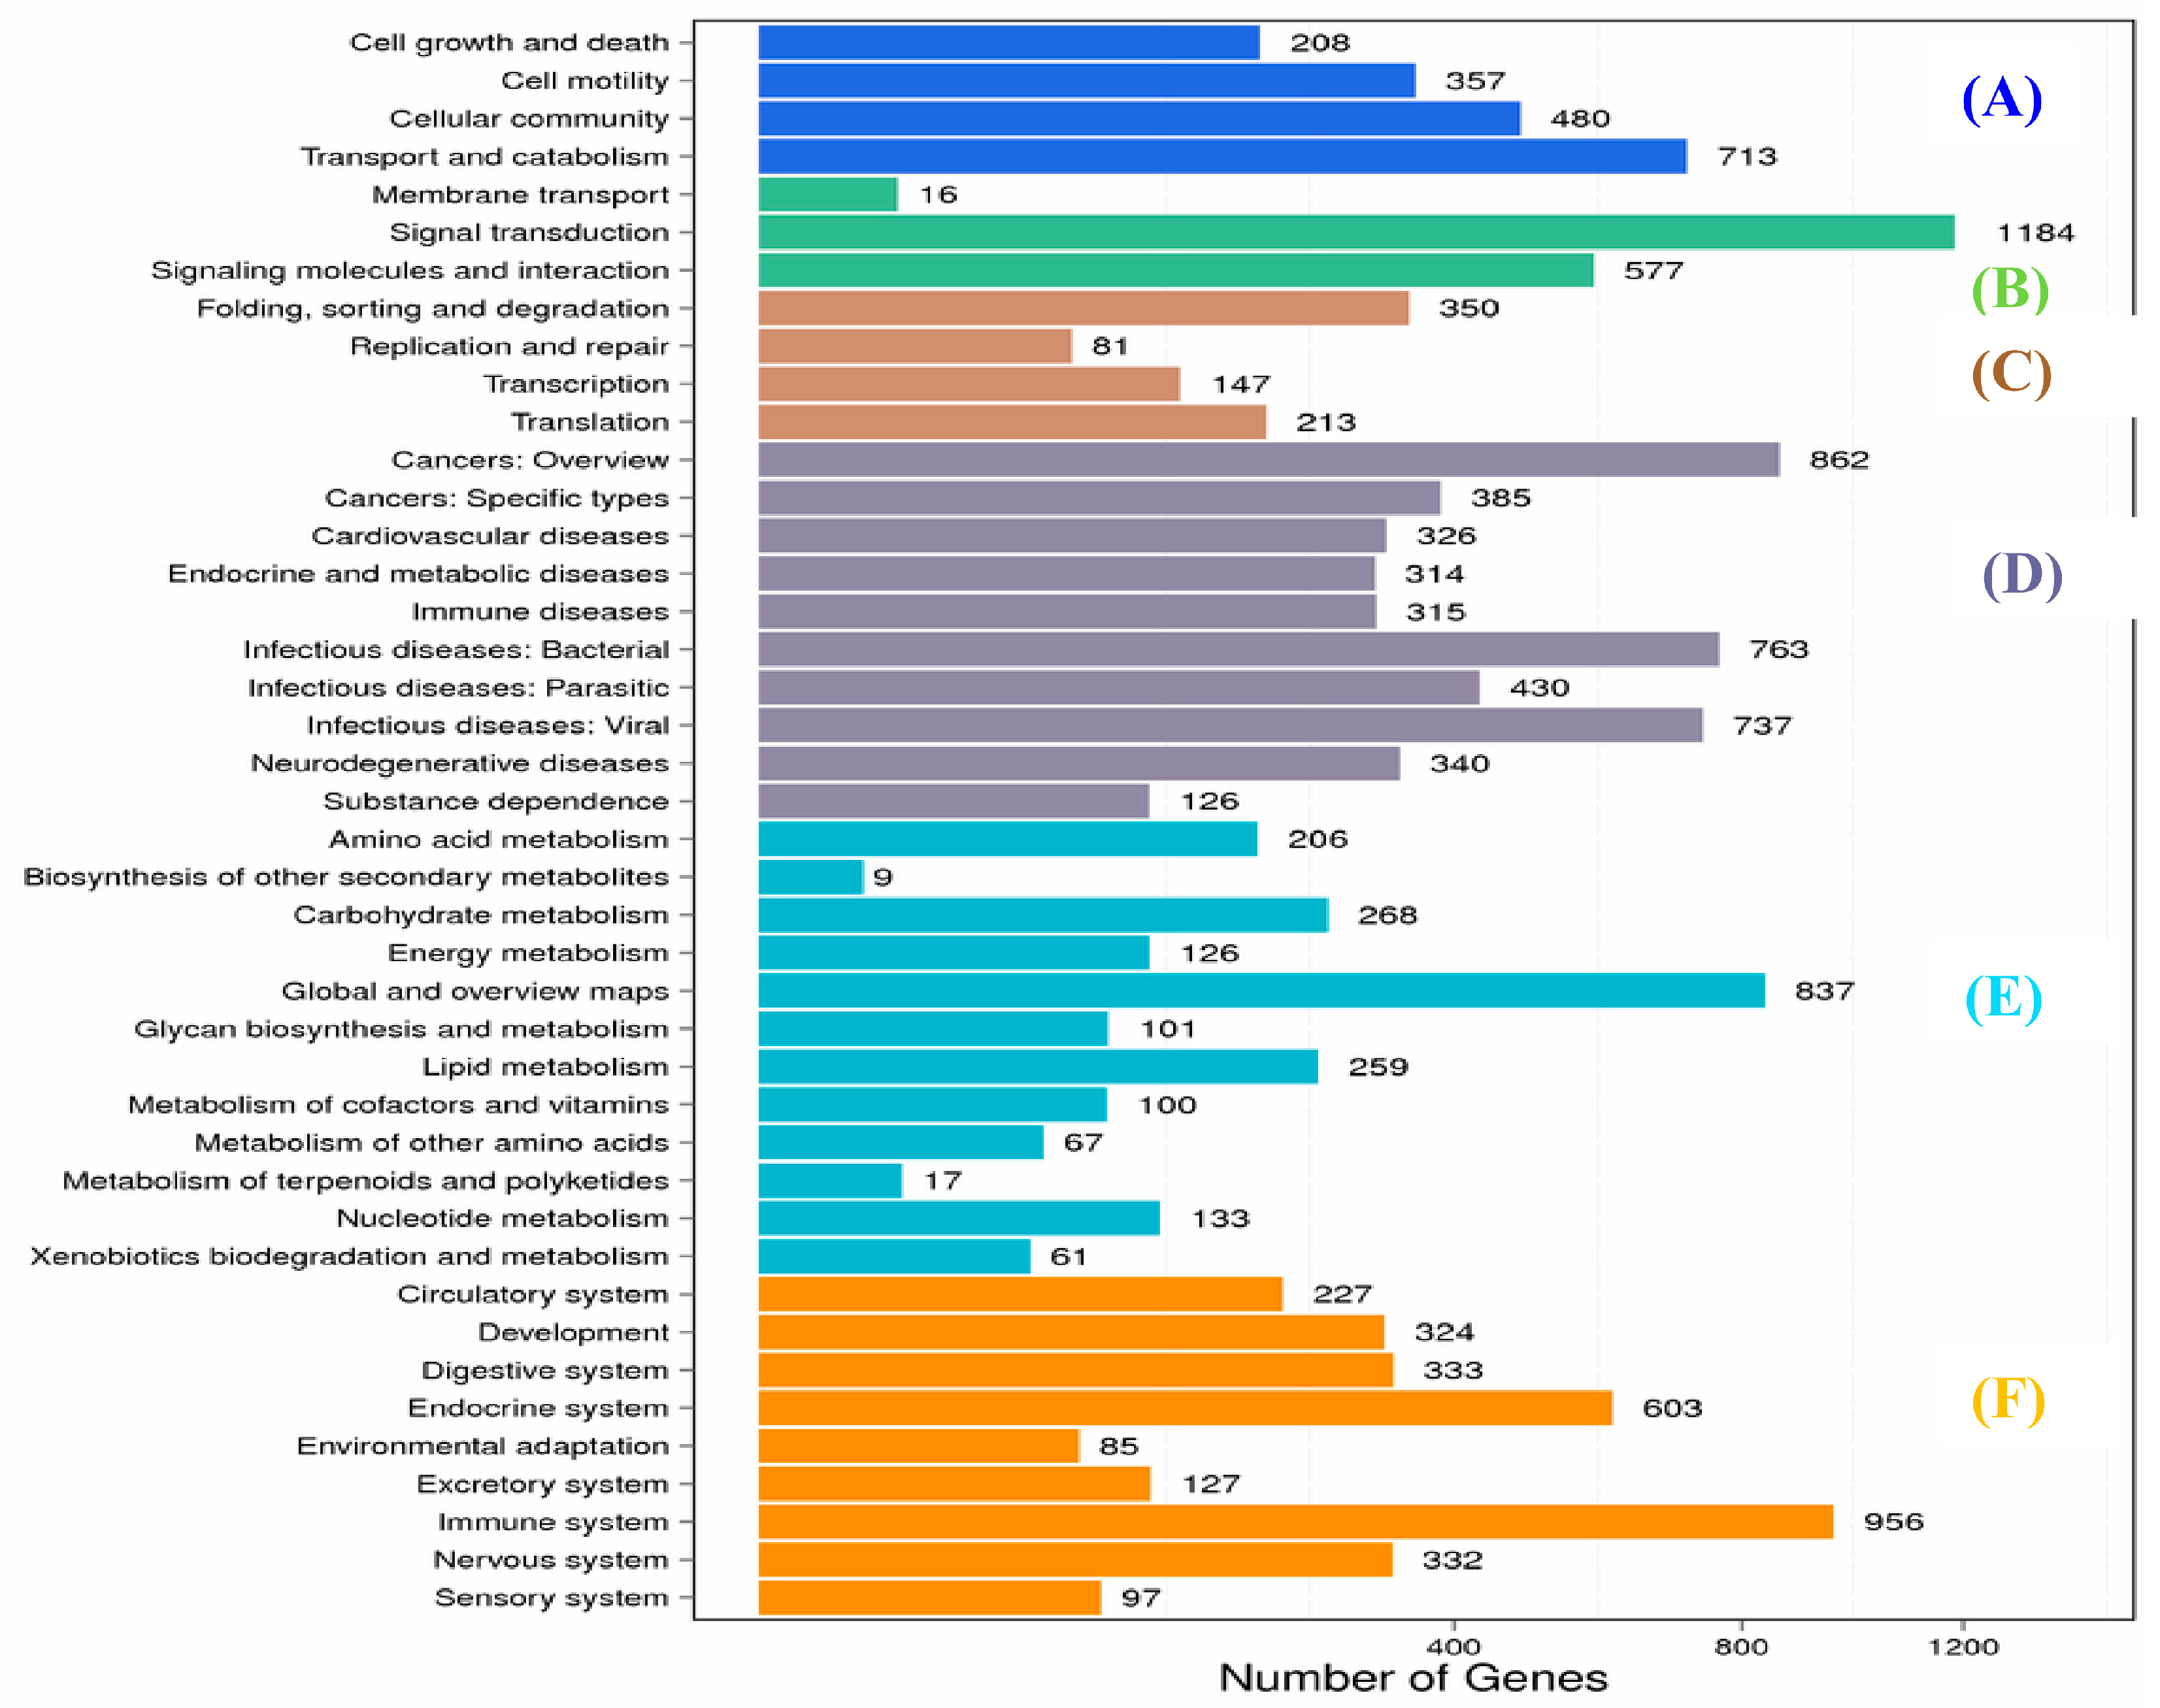
2.1. Transcriptome Sequence Assembly and Functional Annotation
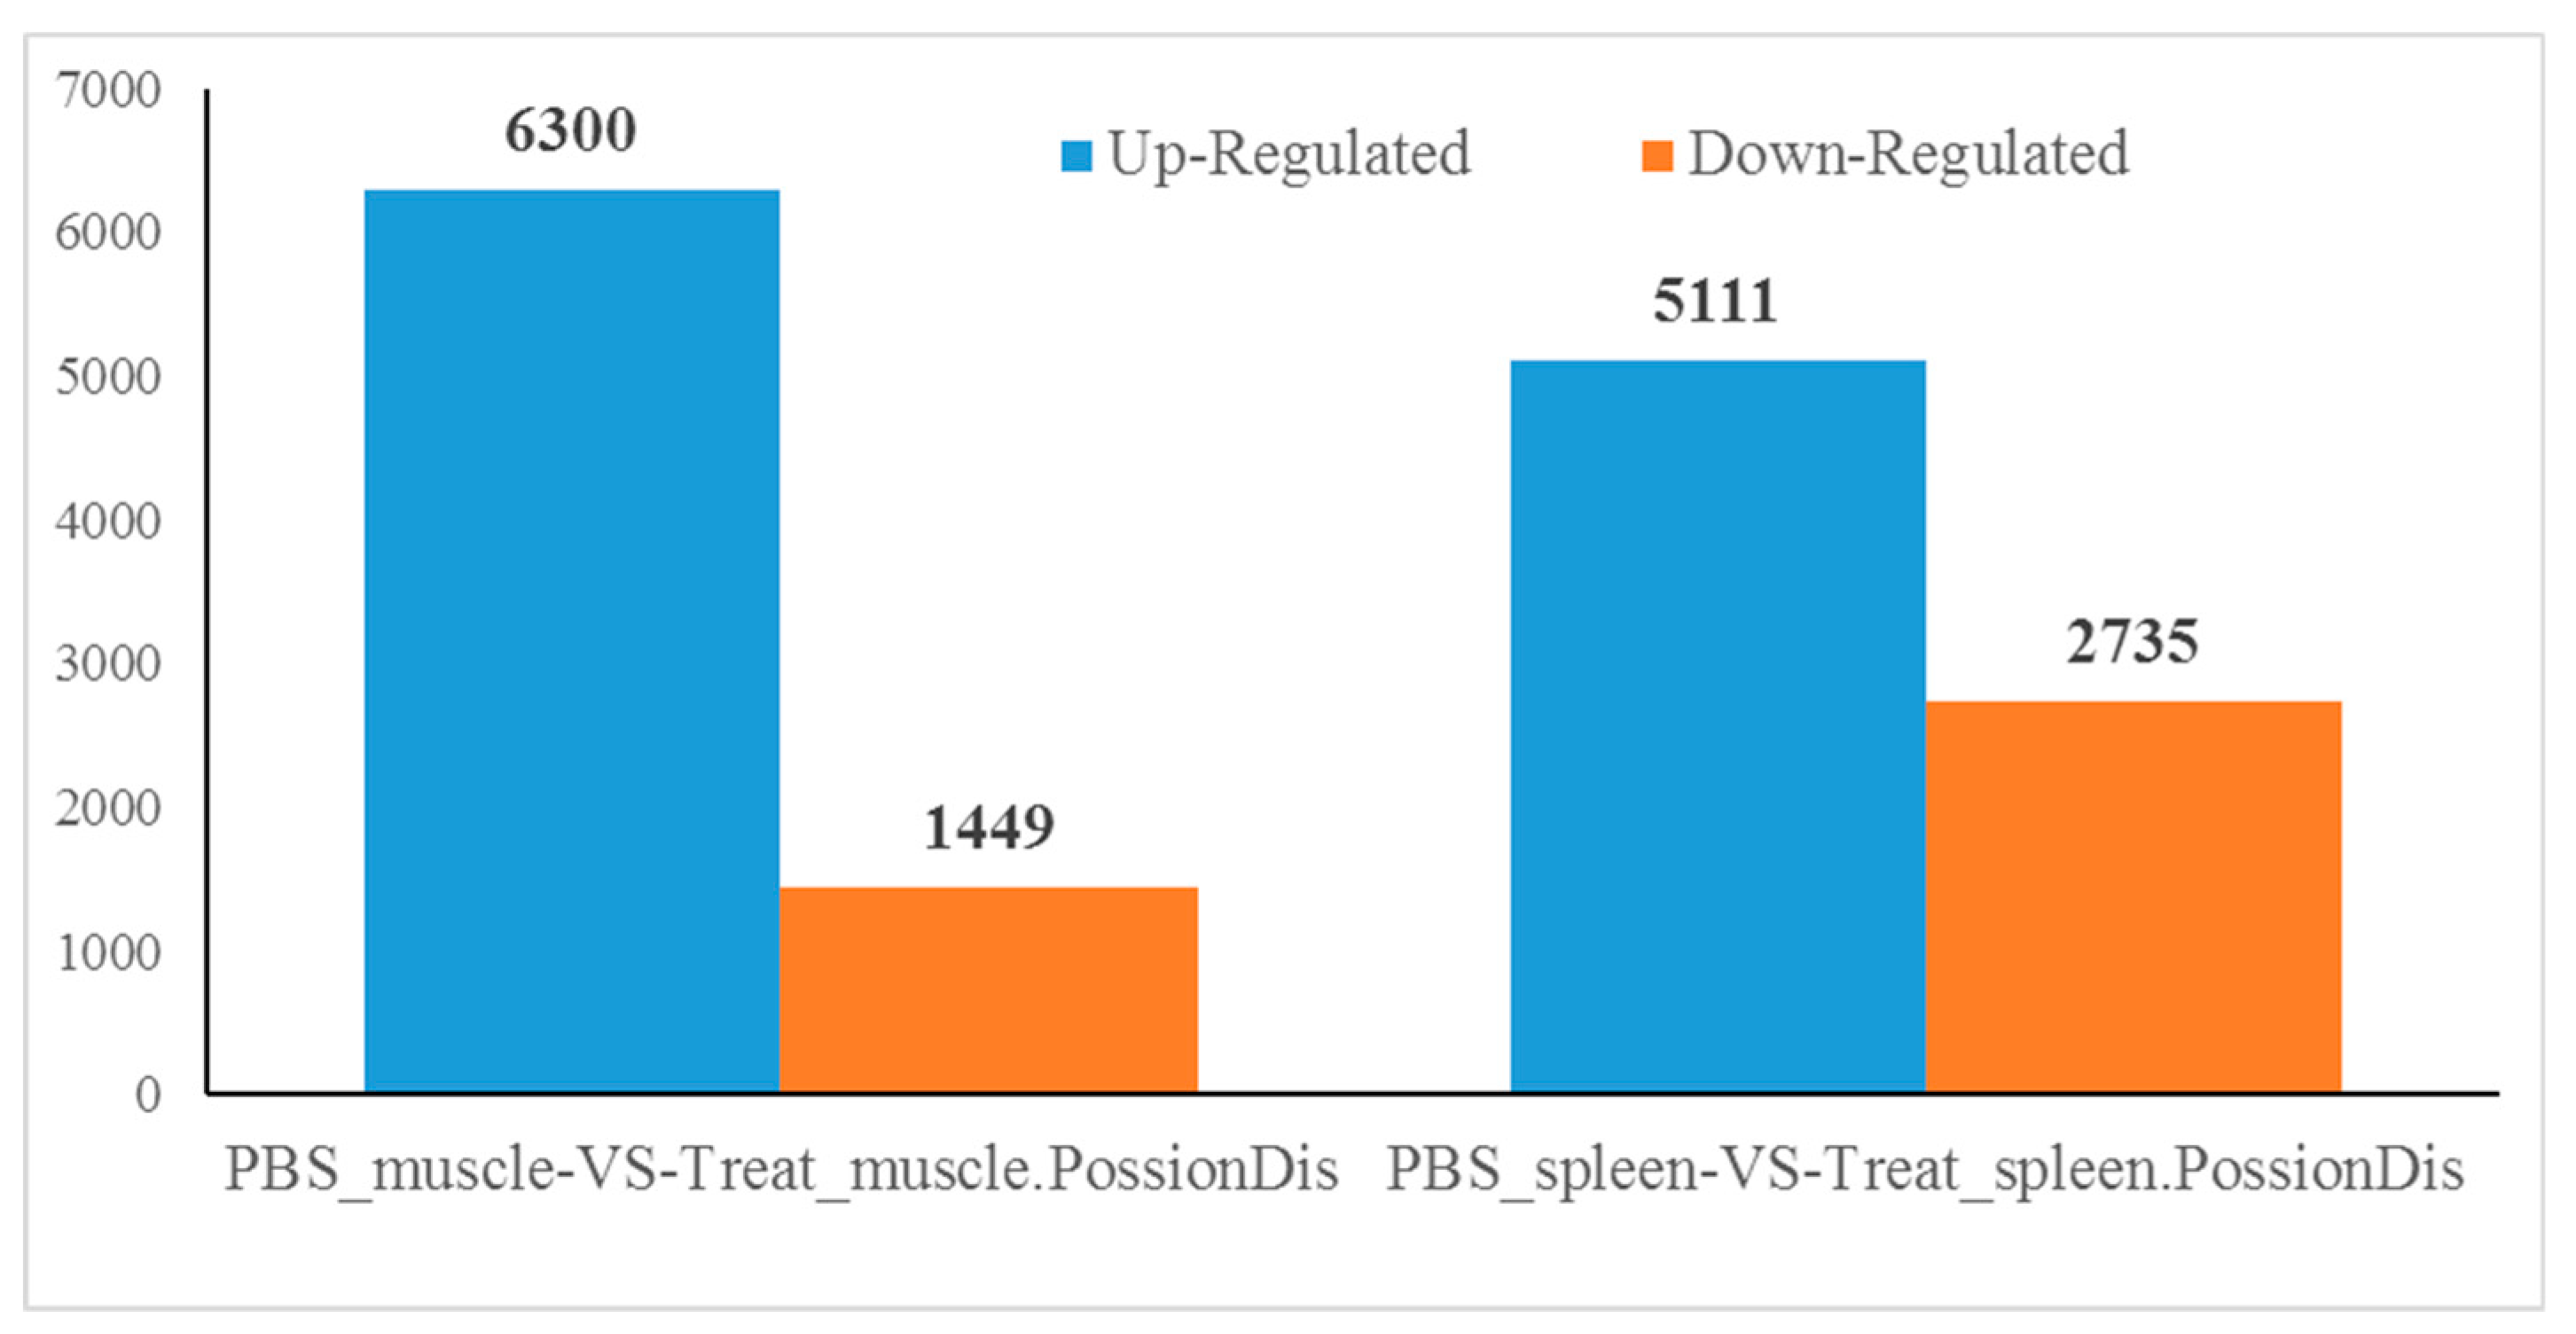
2.2. Number of Differentially Expressed Genes after Aeromonas Sobria Challenge
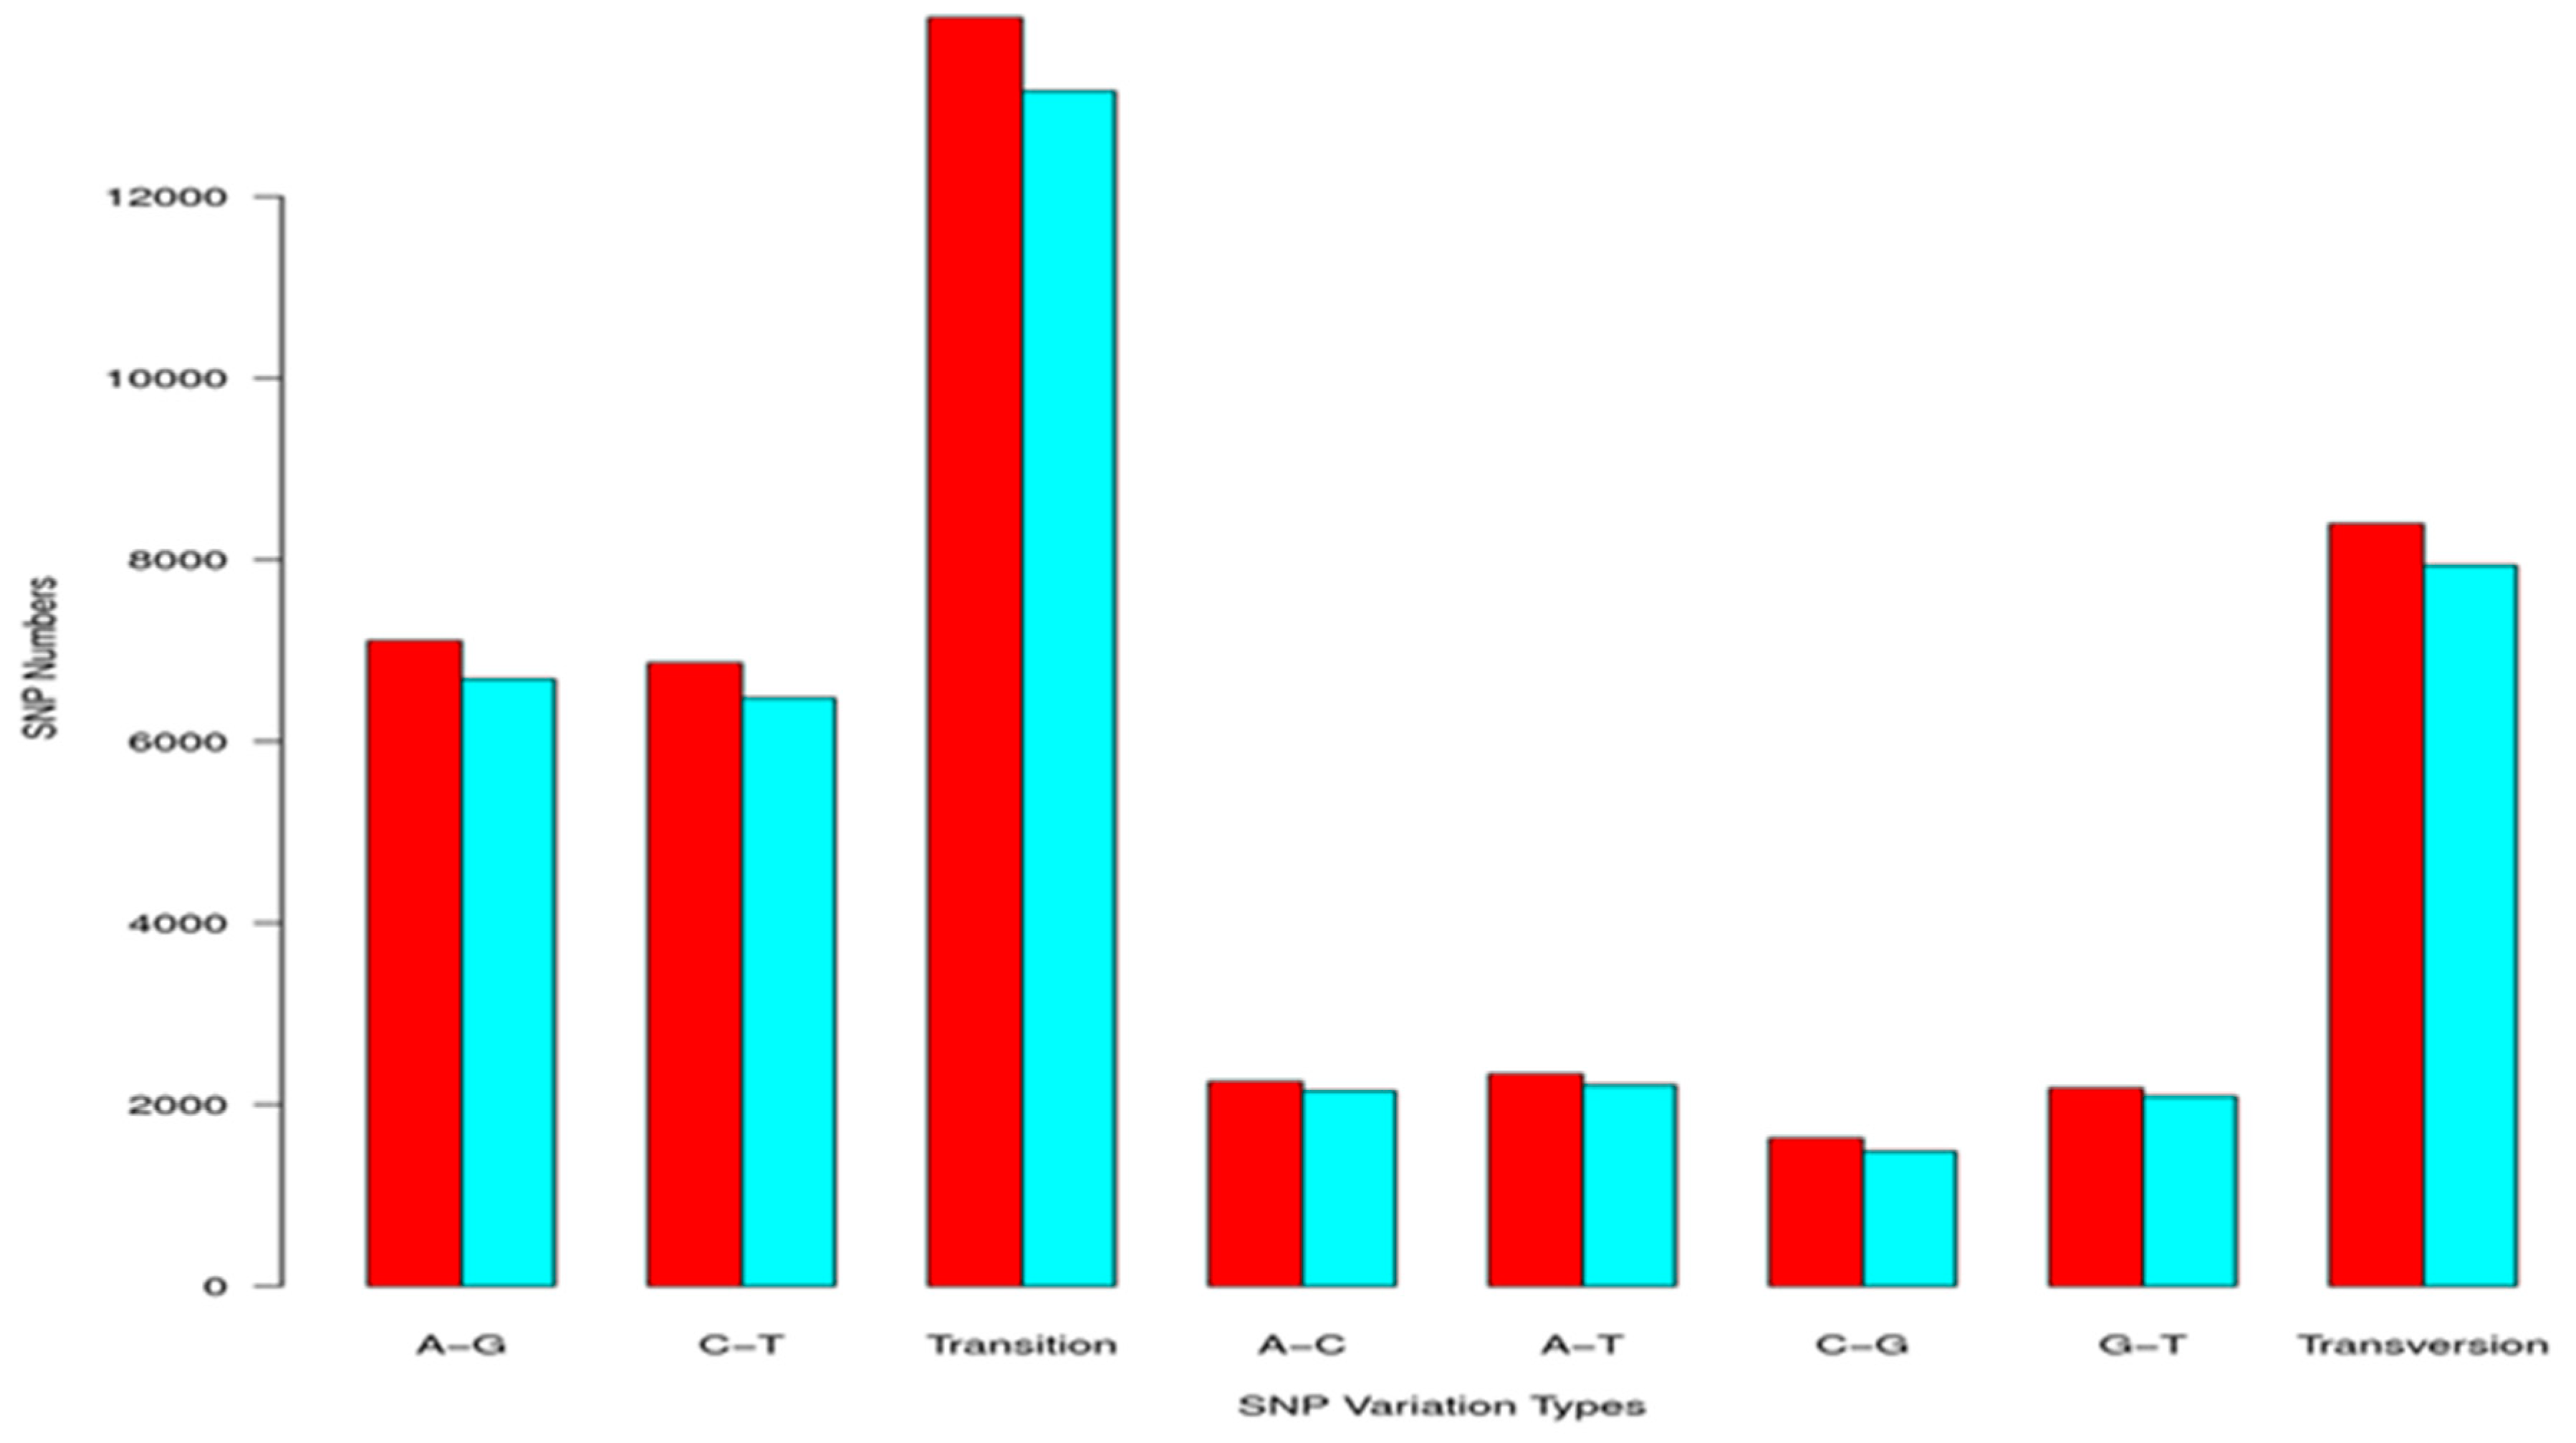
2.3. Simple Sequence Repeat and Single Nucleotide Polymorphism Discovery
2.4. RT-qPCR Analysis of Immune Related Genes Following Aeromonas sorbia Infection
3. Discussion
4. Materials and Methods
4.1. Animal Maintenance
4.2. Isolation, Cultivation, and Challenge with Aeromonas Sobria
4.3. Total RNA Isolation
4.4. cDNA Library Preparation and Sequencing
4.5. Assembly of De Novo Transcriptome
4.6. Functional Unigene Annotation and Classification
4.7. Identification of SSRs and SNP
4.8. Differentially Expressed Genes and Enrichment Analysis
4.9. Real-Time Reverse Transcription Polymerase Chain Reaction
5. Conclusions
Supplementary Materials
Author Contributions
Funding
Acknowledgments
Conflicts of Interest
References
- Beaz-Hidalgo, R.; Figueras, M.J. Aeromonas spp. whole genomes and virulence factors implicated in fish disease. J. Fish Dis. 2013, 36, 371–388. [Google Scholar] [CrossRef] [PubMed]
- Figueras, M.J. Clinical relevance of Aeromonas. Rev. Med. Microbiol. 2005, 16, 145–153. [Google Scholar] [CrossRef]
- Janda, J.M. Aeromonas and Plesiomonas. In Molecular Medical Microbiology; Sussman, M., Ed.; Academic Press: San Diego, CA, USA, 2001; pp. 1237–1270. [Google Scholar]
- Janda, J.M.; Abbott, S.L. The genus Aeromonas, taxonomy, pathogenicity, and infection. Clin. Microbiol. Rev. 2010, 23, 35–73. [Google Scholar] [CrossRef] [PubMed]
- Khardori, N.; Fainstein, V. Aeromonas and Plesiomonas as etiological agents. Annu. Rev. Microbiol. 1988, 42, 395–419. [Google Scholar] [CrossRef] [PubMed]
- Chopra, A.K.; Houston, C.W.; Peterson, J.W.; Jin, G.F. Cloning, expression, and sequence analysis of a cytolytic enterotoxin gene from Aeromonas hydrophila. Can. J. Microbiol. 1993, 39, 513–523. [Google Scholar] [CrossRef] [PubMed]
- Nordmann, P.; Poirel, L. Emerging carbapenemases in gram-negative aerobes. Clin. Microbiol. Inf. 2002, 8, 321–331. [Google Scholar] [CrossRef]
- Shome, R.; Shome, B.R.; Mazumder, Y.; Das, A.; Kumar, A.; Rahman, H.; Bujarbaruah, K.M. Abdominal dropsy disease in major carps of Meghalaya: Isolation and characterization of Aeromonas hydrophila. Curr. Sci. 2005, 88, 1897–1900. [Google Scholar]
- Gram, L.; Oundo, J.O.; Bon, J. Storage life of Nile perch (Lates niloticus) in relation to temperature and initial bacterial load. Trop. Sci. 1989, 29, 221–236. [Google Scholar]
- Popoff, M. Genus III Aeromonas. In Bergey’s Manual of Systematic Bacteriology; Kluyver, A.J., Van Niel, C.J., Eds.; Williams and Wilkins: Baltimore, MD, USA, 1984; Volume 1, pp. 545–548. [Google Scholar]
- Bernoth, E. Autoagglutination, growth on tryptonesoy-Coomassie agar, outer membrane protein patterns and virulence of Aeromonas salmonicida strain. J. Fish Microbiol. 1990, 41, 2348–2357. [Google Scholar]
- Noga, E.J. Fish Diseases: Diagnosis and Treatment, 2nd ed.; Willey-Blackwell: Singapore, 2010. [Google Scholar]
- Austin, B.; Austin, D.A. Bacterial Fish Pathogens: Disease in Farmed and Wild Fish; Halsted Press: New York, NY, USA, 1987. [Google Scholar]
- Dryden, M.; Munro, R. Aeromonas septicemia: Relationship of species and clinical features. Pathology 1989, 21, 111–114. [Google Scholar] [CrossRef] [PubMed]
- Areerat, S. Clarias culture in Thailand. Aquaculture 1987, 63, 355–362. [Google Scholar] [CrossRef]
- Abbott, S.L.; Cheung, W.K.; Janda, J.M. The genus Aeromonas: Biochemical characteristics, atypical reactions, and phenotypic identification schemes. J. Clin. Microbiol. 2003, 41, 2348–2357. [Google Scholar] [CrossRef] [PubMed]
- Lü, A.J.; Hu, X.C.; Wang, Y.; Zhu, A.H.; Shen, L.L.; Tian, J.; Feng, Z.Z.; Feng, Z.J. Skin immune response in the zebrafish, Danio rerio (Hamilton), to Aeromonas hydrophila infection: A transcriptional profiling approach. J. Fish Dis. 2015, 38, 137–150. [Google Scholar] [CrossRef] [PubMed]
- Song, X.; Hu, X.; Sun, B.; Bo, Y.; Wu, K.; Xiao, L.; Gong, C. A transcriptome analysis focusing on inflammation-related genes of grass carp intestines following infection with Aeromonas hydrophila. Sci. Rep. 2017, 7, 40777. [Google Scholar] [CrossRef] [PubMed]
- Qin, C.; Gong, Q.; Wen, Z.; Yuan, D.; Shao, T.; Wang, J.; Li, H. Transcriptome analysis of the spleen of the darkbarbel catfish Pelteobagrus vachellii in response to Aeromonas hydrophila infection. Fish Shellfish Immunol. 2017, 70, 498–506. [Google Scholar] [CrossRef] [PubMed]
- Zhang, X.; Wang, S.; Chen, S.; Chen, Y.; Liu, Y.; Shao, C.; Wang, Q.; Lu, Y.; Gong, G.; Ding, S.; et al. Transcriptome analysis revealed changes of multiple genes involved in immunity in Cynoglossus semilaevis during Vibrio anguillarum infection. Fish Shellfish Immunol. 2015, 43, 209–218. [Google Scholar] [CrossRef] [PubMed]
- Huang, Y.; Huang, X.; Yan, Y.; Cai, J.; Ouyang, Z.; Cui, H.; Wang, P.; Qin, Q. Transcriptome analysis of orange-spotted grouper (Epinephelus coioides) spleen in response to Singapore grouper iridiovirus. BMC Gen. 2011, 12, 556. [Google Scholar] [CrossRef] [PubMed]
- Tran, N.T.; Gao, Z.X.; Zhao, H.H.; Yi, S.K.; Chen, B.X.; Zhao, Y.H.; Lin, L.; Liu, X.Q.; Wang, W.M. Transcriptome analysis and microsatellite discovery in the blunt snout bream (Megalobrama amblycephala) after challenge with Aeromonas hydrophila. Fish Shellfish Immunol. 2015, 45, 72–82. [Google Scholar] [CrossRef] [PubMed]
- Cárdenas, L.; Sánchez, R.; Gomez, D.; et al. Molecular markers. Mar. Gen. 2011, 4, 197–205. [Google Scholar] [CrossRef] [PubMed]
- Chen, J.; Li, C.; Huang, R.; Du, F.; Liao, L.; Zhu, Z.; Wang, Y. Transcriptome analysis of head kidney in grass carp and discovery of immune-related genes. BMC Vet. Res. 2012, 8, 108. [Google Scholar] [CrossRef] [PubMed]
- Cui, J.; Wang, H.; Liu, S.; Qiu, X.; Jiang, Z.; Wang, X. Transcriptome analysis of the gill of Takifugu rubripes using Illumina sequencing for discovery of SNPs. Comp. Biochem. Physiol. Part D Genom. Proteom. 2014, 10, 44–51. [Google Scholar] [CrossRef] [PubMed]
- Wang, P.; Wang, J.; Su, Y.Q.; Mao, Y.; Zhang, J.S.; Wu, C.W.; Qiao-Zhen, K.; Kun-Huang, H.; Wei-Qiang, Z.; Nen-di, X. Transcriptome analysis of the Larimichthys crocea liver in response to Cryptocaryon irritans. Fish Shellfish Immunol. 2016, 48, 1–11. [Google Scholar] [CrossRef] [PubMed]
- Zhang, R.; Zhang, L.; Ye, X.; Tian, Y.Y.; Sun, C.F.; Lu, M.X.; Bai, J.J. Transcriptome profiling and digital gene expression analysis of Nile tilapia (Oreochromis niloticus) infected by Streptococcus agalactiae. Mol. Biol. Rep. 2013, 40, 5657–5668. [Google Scholar] [CrossRef] [PubMed]
- Zhu, J.; Li, C.; Ao, Q.; Tan, Y.; Luo, Y.; Guo, Y.; Lan, G.; Jiang, H.; Gan, X. Transcriptomic profiling revealed the signatures of acute immune response in tilapia (Oreochromis niloticus) following Streptococcus iniae challenge. Fish Shellfish Immunol. 2015, 46, 346–353. [Google Scholar] [CrossRef] [PubMed]
- Mu, Y.; Ding, F.; Cui, P.; Ao, J.; Hu, S.; Chen, X. Transcriptome and expression profiling analysis revealed changes of multiple signaling pathways involved in immunity in the large yellow croaker during Aeromonas hydrophila infection. BMC Genom. 2010, 11, 506. [Google Scholar] [CrossRef] [PubMed]
- Yu, S.; Mu, Y.; Ao, J.; Chen, X. Peroxiredoxin IV regulates pro-inflammatory responses in large yellow croaker (Pseudosciaena crocea) and protects against bacterial challenge. J. Proteome Res. 2010, 9, 1424–1436. [Google Scholar] [CrossRef] [PubMed]
- Ao, J.; Mu, Y.; Xiang, L.X.; Fan, D.; Feng, M.; Zhang, S.; Shi, Q.; Zhu, L.Y.; Li, T.; Ding, Y.; et al. Genome sequencing of the perciform fish Larimichthys crocea provides insights into molecular and genetic mechanisms of stress adaptation. PLoS Genet. 2015, 11, e1005118. [Google Scholar] [CrossRef] [PubMed]
- Kinoshita, S.; Wang, N.; Inoue, H.; Maeyama, K.; Okamoto, K.; Nagai, K.; Kondo, H.; Hirono, I.; Asakawa, S.; Watabe, S. Deep sequencing of ESTs from nacreous and prismatic layer producing tissues and a screen for novel shell formation-related genes in the pearl oyster. PLoS ONE 2011, 6, e21238. [Google Scholar] [CrossRef] [PubMed]
- Zhao, X.; Wang, Q.; Jiao, Y.; Huang, R.; Deng, Y.; Wang, H.; Du, X. Identification of genes potentially related to biomineralization and immunity by transcriptome analysis of pearl sac in pearl oyster Pinctada martensii. Mar. Biotechnol. 2012, 14, 730–739. [Google Scholar] [CrossRef] [PubMed]
- Zhao, Q.Y.; Wang, Y.; Kong, Y.M.; Luo, D.; Li, X.; Hao, P. Optimizing de novo transcriptome assembly from short-read RNA-Seq data: A comparative study. BMC Bioinf. 2011, 12, S2. [Google Scholar] [CrossRef] [PubMed]
- Vijay, N.; Poelstra, J.W.; Künstner, A.; Wolf, J.B.W. Challenges and strategies in transcriptome assembly and differential gene expression quantification. A comprehensive in silico assessment of RNA-seq experiments. Mol. Ecol. 2013, 22, 620–634. [Google Scholar] [CrossRef] [PubMed]
- Wang, A.; Wang, Y.; Gu, Z.; Li, S.; Shi, Y.; Guo, X. Development of expressed sequence tags from the pearl oyster, Pinctada martensii dunker. Mar. Biotechnol. 2011, 13, 275–283. [Google Scholar] [CrossRef] [PubMed]
- Meyer, E.; Aglyamova, G.V.; Wang, S.; Buchanan-Carter, J.; Abrego, D.; Colbourne, J.K.; Willis, B.L.; Matz, M.V. Sequencing and de novo analysis of a coral larval transcriptome using 454 GSFlx. BMC Genom. 2009, 10, 219. [Google Scholar] [CrossRef] [PubMed]
- Chu, S.L.; Weng, C.F.; Hsiao, C.D.; Hwang, P.P.; Chen, Y.C.; Ho, J.M.; Lee, S.J. Profile analysis of expressed sequence tags derived from the ovary of tilapia, Oreochromis mossambicus. Aquaculture 2006, 251, 537–548. [Google Scholar] [CrossRef]
- Dong, B.; Xiang, J.H. Discovery of genes involved in defense/immunity functions in a haemocytes cDNA library from Fenneropenaeus chinensis by ESTs annotation. Aquaculture 2007, 272, 208–215. [Google Scholar] [CrossRef]
- Novaes, E.; Drost, D.R.; Farmerie, W.G.; Pappas, G.J.; Grattapaglia, D.; Sederoff, R.R.; Kirst, M. High-throughput gene and SNP discovery in Eucalyptus grandis, an uncharacterized genome. BMC Genom. 2008, 9, 312. [Google Scholar] [CrossRef] [PubMed]
- Li, Y.C.; Korol, A.B.; Fahima, T.; Nevo, E. Microsatellites within genes: structure, function, and evolution. Mol. Biol. Evol. 2004, 21, 991–1007. [Google Scholar] [CrossRef] [PubMed]
- Cock, P.J.; Fields, C.J.; Goto, N.; Heuer, M.L.; Rice, P.M. The Sanger FASTQ file format for sequences with quality scores, and the Solexa/Illumina FASTQ variants. Nucleic Acids Res. 2010, 38, 1767–1771. [Google Scholar] [CrossRef] [PubMed]
- Camacho, C.; Coulouris, G.; Avagyan, V.; Ma, N.; Papadopoulos, J.; Bealer, K.; Madden, T.L. BLAST+: architecture and applications. BMC Bioinf. 2009, 10, 421. [Google Scholar] [CrossRef] [PubMed]
- Conesa, A.; Geotz, S.; García-Gomez, J.M.; Terol, J.; Talon, M.; Robles, M. Blast2GO a universal tool for annotation, visualization and analysis in functional genomics research. Bioinformatics 2005, 21, 3674–3676. [Google Scholar] [CrossRef] [PubMed]
- Iseli, C.; Jongeneel, C.V.; Bucher, P. ESTScan: A program for detecting, evaluating, and reconstructing potential coding regions in EST sequences. Proc. Int. Conf. Intell. Syst. Mol. Biol. 1999, 99, 138–148. [Google Scholar]
- Thiel, T.; Michalek, W.; Varshney, R.; Graner, A. Exploiting EST databases for the development and characterization of gene-derived SSR-markers in barley (Hordeum vulgare L.). Theor. Appl. Genet. 2003, 106, 411–422. [Google Scholar] [CrossRef] [PubMed]
- Kim, D.; Langmead, B.; Salzberg, S.L. HISAT: A fast spliced aligner with low memory requirements. Nat. Met. 2015. [Google Scholar] [CrossRef] [PubMed]
- McKenna, A.; Hanna, M.; Banks, E.; Sivachenko, A.; Cibulskis, K.; Kernytsky, A.; Garimella, K.; Altshuler, D.; Gabriel, S.; Daly, M.; et al. The Genome Analysis Toolkit: A MapReduce framework for analyzing next-generation DNA sequencing data. Genome Res. 2010, 20, 1297–1303. [Google Scholar] [CrossRef] [PubMed]
- Langmead, B.; Salzberg, S.L. Fast gapped-read alignment with Bowtie 2. Nat. Met. 2012, 9, 357–359. [Google Scholar] [CrossRef] [PubMed] [Green Version]
- Li, B.; Dewey, C.N. RSEM: Accurate transcript quantification from RNA-Seq data with or without a reference genome. BMC Bioinf. 2011, 12, 323. [Google Scholar] [CrossRef] [PubMed]


| Gene | log2 Fold Change (Treat_muscle/PBS_muscle) | Up/Down-Regulation (Treat_muscle/PBS_muscle) | Gene | log2 Fold Change (Treat_spleen/PBS_spleen) | Up/Down-Regulation (Treat_spleen/PBS_spleen) |
|---|---|---|---|---|---|
| Innate Immunity | Innate Immunity | ||||
| tlr5 | 4.360256 | Up | tlr5 | 3.787257 | Up |
| myd88 | 2.619664 | Up | myd88 | 3.701566 | Up |
| traf6 | 1.726865 | Up | tlr7 | −3.67177 | Down |
| tak1 | 4.95002 | Up | tbk1 | 1.701046 | Up |
| tbk1 | 2.392317 | Up | tab1 | 3.308268 | Up |
| nfkb | 2.415037 | Up | stat1 | −1.15676 | Down |
| tnf-α | 9.337622 | Up | tnf | −9.17742 | Down |
| il-1β | 11.21396 | Up | il-1β | 6.588696 | Up |
| il-12 | 2.374396 | Up | il-12 | 2.670009 | Up |
| il-8 | 13.58918 | Up | il-8 | 12.19013 | Up |
| cd40 | 8.438792 | Up | cd40 | −1.38904 | Down |
| Antigen Processing | Antigen Processing | ||||
| tcr | 2.235073 | Up | tcr | −4.78398 | Down |
| mhc-i | 7.857981 | Up | mhc-i | 11.54978 | Up |
| mhc-ii | 3.933396 | Up | mhc-ii | 1.144123 | Up |
| cd8 | 7.857981 | Up | cd8 | 11.54978 | Up |
| cd4 | 3.933396 | Up | cd4 | 1.144123 | Up |
| hsp70 | 4.422052 | Up | hsp70 | 2.483444 | Up |
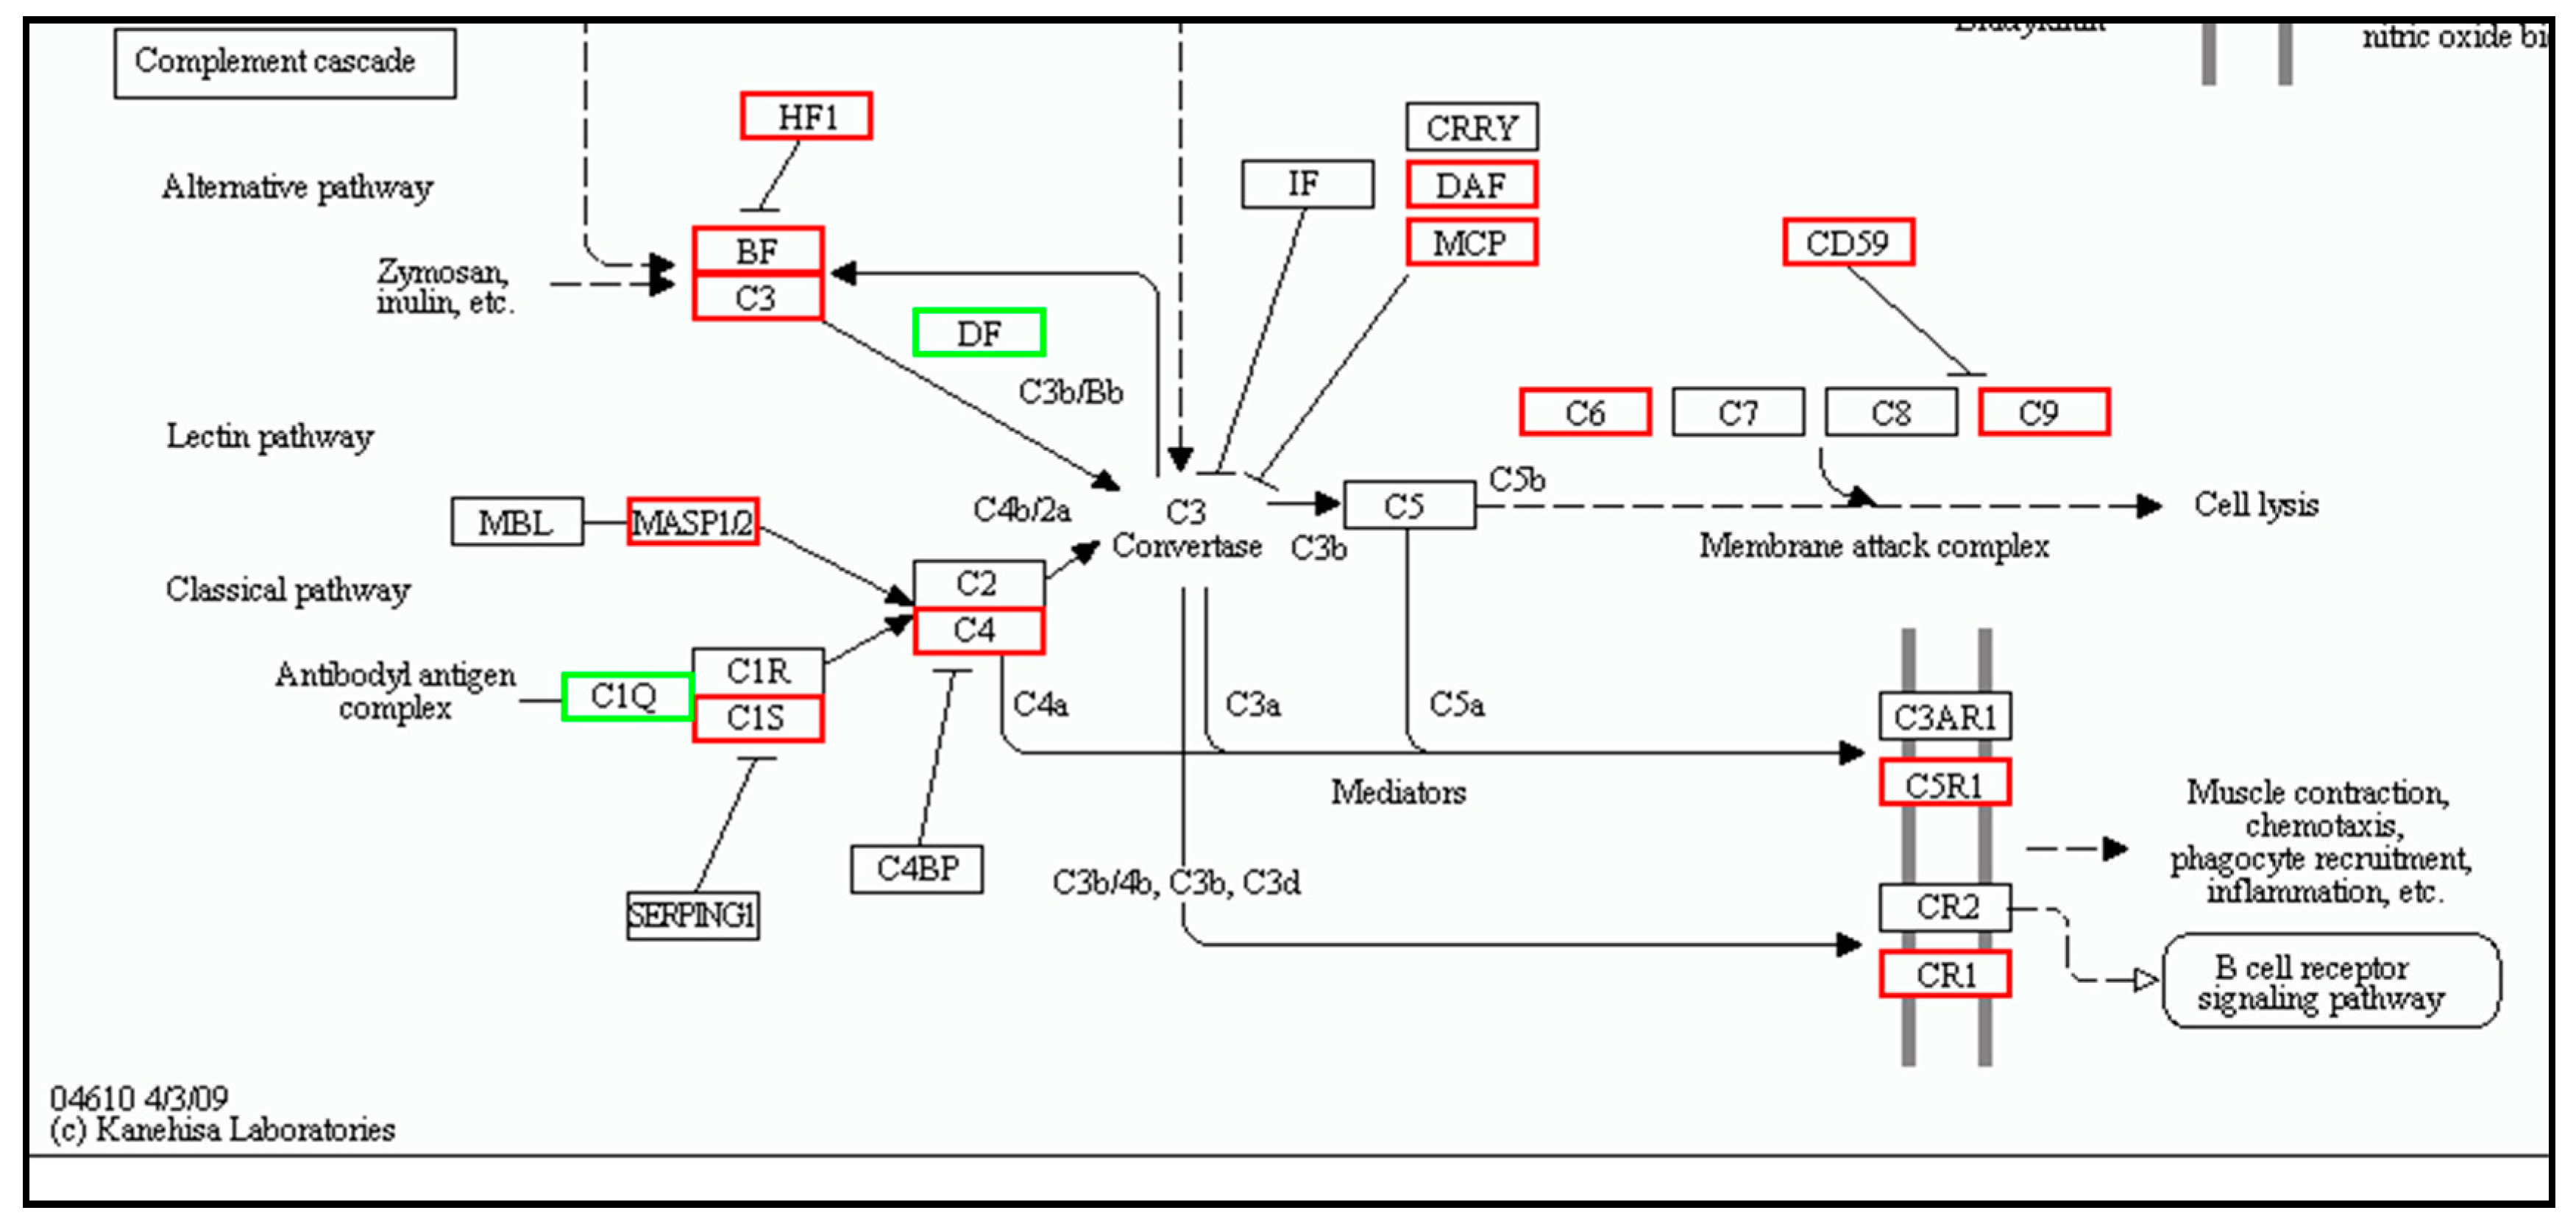
| Complement Cascade | Complement Cascade | ||||
| c3 | 6.954196 | Up | c3 | 6.722808 | Up |
| c4 | 1.81526 | Up | c4 | 2.656724 | Up |
| mannan-binding lectin serine protease 1 | 1.599362 | Up | mannan-binding lectin serine protease 1 | 4.143954 | Up |
| c6 | 4.712957 | Up | c6 | 1.467602 | Up |
| alpha-2-macroglobulin | 5.612605 | Up | alpha-2-macroglobulin | 11.84314 | Up |
| Parameter | Number |
|---|---|
| Total number of sequences examined: | 47,881 |
| Total size of examined sequences (bp): | 49,734,288 |
| Total number of identified SSRs: | 11,534 |
| Number of SSRs containing sequences: | 8638 |
| Number of sequences containing more than 1 SSR: | 2103 |
| Number of SSRs present in compound formation: | 943 |
| Repeat Number | Motif Length | Total | % | |||||
|---|---|---|---|---|---|---|---|---|
| Mono- | Di- | Tri- | Quad- | Penta- | Hexa- | |||
| 4 | 0 | 0 | 0 | 0 | 58 | 52 | 110 | 0.9 |
| 5 | 0 | 0 | 1214 | 112 | 5 | 5 | 1336 | 11.58 |
| 6 | 0 | 1358 | 542 | 78 | 5 | 8 | 1991 | 17.26 |
| 7 | 0 | 705 | 324 | 14 | 1 | 2 | 1046 | 9.06 |
| 8 | 0 | 496 | 242 | 13 | 0 | 0 | 751 | 6.51 |
| 9 | 0 | 345 | 31 | 7 | 0 | 1 | 384 | 3.32 |
| 10 | 0 | 292 | 34 | 3 | 0 | 2 | 331 | 2.86 |
| 11 | 0 | 373 | 33 | 1 | 0 | 0 | 407 | 3.52 |
| 12 | 802 | 279 | 27 | 1 | 1 | 0 | 1110 | 9.62 |
| 13 | 575 | 69 | 15 | 2 | 0 | 0 | 661 | 5.73 |
| 14 | 385 | 87 | 6 | 0 | 0 | 0 | 478 | 4.14 |
| 15 | 239 | 104 | 6 | 2 | 0 | 0 | 351 | 3.04 |
| >15 | 1787 | 1117 | 19 | 6 | 0 | 0 | 2929 | 25.39 |
| Total | 3549 | 5121 | 2487 | 237 | 70 | 70 | 11,534 | 100 |
| % | 30.76 | 44.39 | 21.56 | 2.05 | 0.6 | 0.6 | 99.96 | |
| Gene | Spleen | Muscle | ||
|---|---|---|---|---|
| RNA-Seq | qPCR | RNA-Seq | qPCR | |
| C3 | 6.722808 | 2.99 ± 1.90 | 6.954196 | 2.68 ± 1.84 |
| IL-1β | 6.588696 | * 24.73 ± 5.75 | 11.21396 | 1.23 ± 0.45 |
| IL-8 | 12.19013 | * 140.77 ± 77.4 | 13.58918 | 5.79 ± 3.82 |
| MyD88 | 3.701566 | 2.92 ± 0.85 | 2.619664 | 0.76 ± 0.24 |
| NF-κb | −1.15676 | 1.50 ± 0.58 | 2.415037 | 0.56 ± 0.16 |
| TLR5 | 3.787257 | 9.14 ± 4.53 | 4.360256 | 1.08 ± 0.69 |
| TNFα | −9.17742 | 5.33 ± 2.89 | 9.337622 | 0.25 ± 0.03 |
| Gene | Sequence (5′-3′) | |
|---|---|---|
| EF1α | Forward | 5′-CCGTTGAGATGCACCATGAGT-3′ |
| Reverse | 5′-TTGACAGACACGTTCTTCACGTT-3′ | |
| IL-1β | Forward | 5′-GTAACGTGTGCCGGTTTCTT-3′ |
| Reverse | 5′-GCAACACAAAAGGAAGCACA-3′ | |
| TNFα | Forward | 5′-GCTTGTAGCTGCCGTAGGAC-3′ |
| Reverse | 5′-GGTGGCTTGGAATTAGTG-3′ | |
| TLR5 | Forward | 5′-ATACACTCCGCTGCTGCTTT-3′ |
| Reverse | 5′-CAAGCTGAAGGTTTCCAAGC-3′ | |
| IL-8 | Forward | 5′-GATGCAAATGCCCTCAAATACA-3′ |
| Reverse | 5′-GGCTCTTGACGTTCCTTTTG-3′ | |
| NF-κb | Forward | 5′-TGGCTGGAGAGGATCCATAC-3′ |
| Reverse | 5′-AAAGCCCCTCTGTTTTGGTTG-3′ | |
| MyD88 | Forward | 5′-CAGTTCTGTGTTGCGACGTT-3′ |
| Reverse | 5′-CGGTAAGAACTTGGCACGAT-3′ | |
| C3 | Forward | 5′-GGCTGGTCTTAGGCAGACAG-3′ |
| Reverse | 5′-CAGCATAGGACCCGTCACTT-3′ |
© 2018 by the authors. Licensee MDPI, Basel, Switzerland. This article is an open access article distributed under the terms and conditions of the Creative Commons Attribution (CC BY) license (http://creativecommons.org/licenses/by/4.0/).
Share and Cite
Byadgi, O.; Chen, Y.-C.; Maekawa, S.; Wang, P.-C.; Chen, S.-C. Immune-Related Functional Differential Gene Expression in Koi Carp (Cyprinus carpio) after Challenge with Aeromonas sobria. Int. J. Mol. Sci. 2018, 19, 2107. https://0-doi-org.brum.beds.ac.uk/10.3390/ijms19072107
Byadgi O, Chen Y-C, Maekawa S, Wang P-C, Chen S-C. Immune-Related Functional Differential Gene Expression in Koi Carp (Cyprinus carpio) after Challenge with Aeromonas sobria. International Journal of Molecular Sciences. 2018; 19(7):2107. https://0-doi-org.brum.beds.ac.uk/10.3390/ijms19072107
Chicago/Turabian StyleByadgi, Omkar, Yao-Chung Chen, Shun Maekawa, Pei-Chyi Wang, and Shih-Chu Chen. 2018. "Immune-Related Functional Differential Gene Expression in Koi Carp (Cyprinus carpio) after Challenge with Aeromonas sobria" International Journal of Molecular Sciences 19, no. 7: 2107. https://0-doi-org.brum.beds.ac.uk/10.3390/ijms19072107