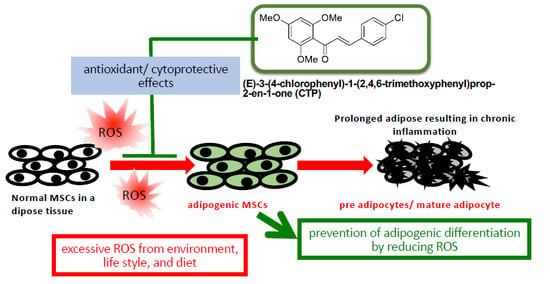
Novel Neohesperidin Dihydrochalcone Analogue Inhibits Adipogenic Differentiation of Human Adipose-Derived Stem Cells through the Nrf2 Pathway

 , ,
, ,
Abstract
:
1. Introduction
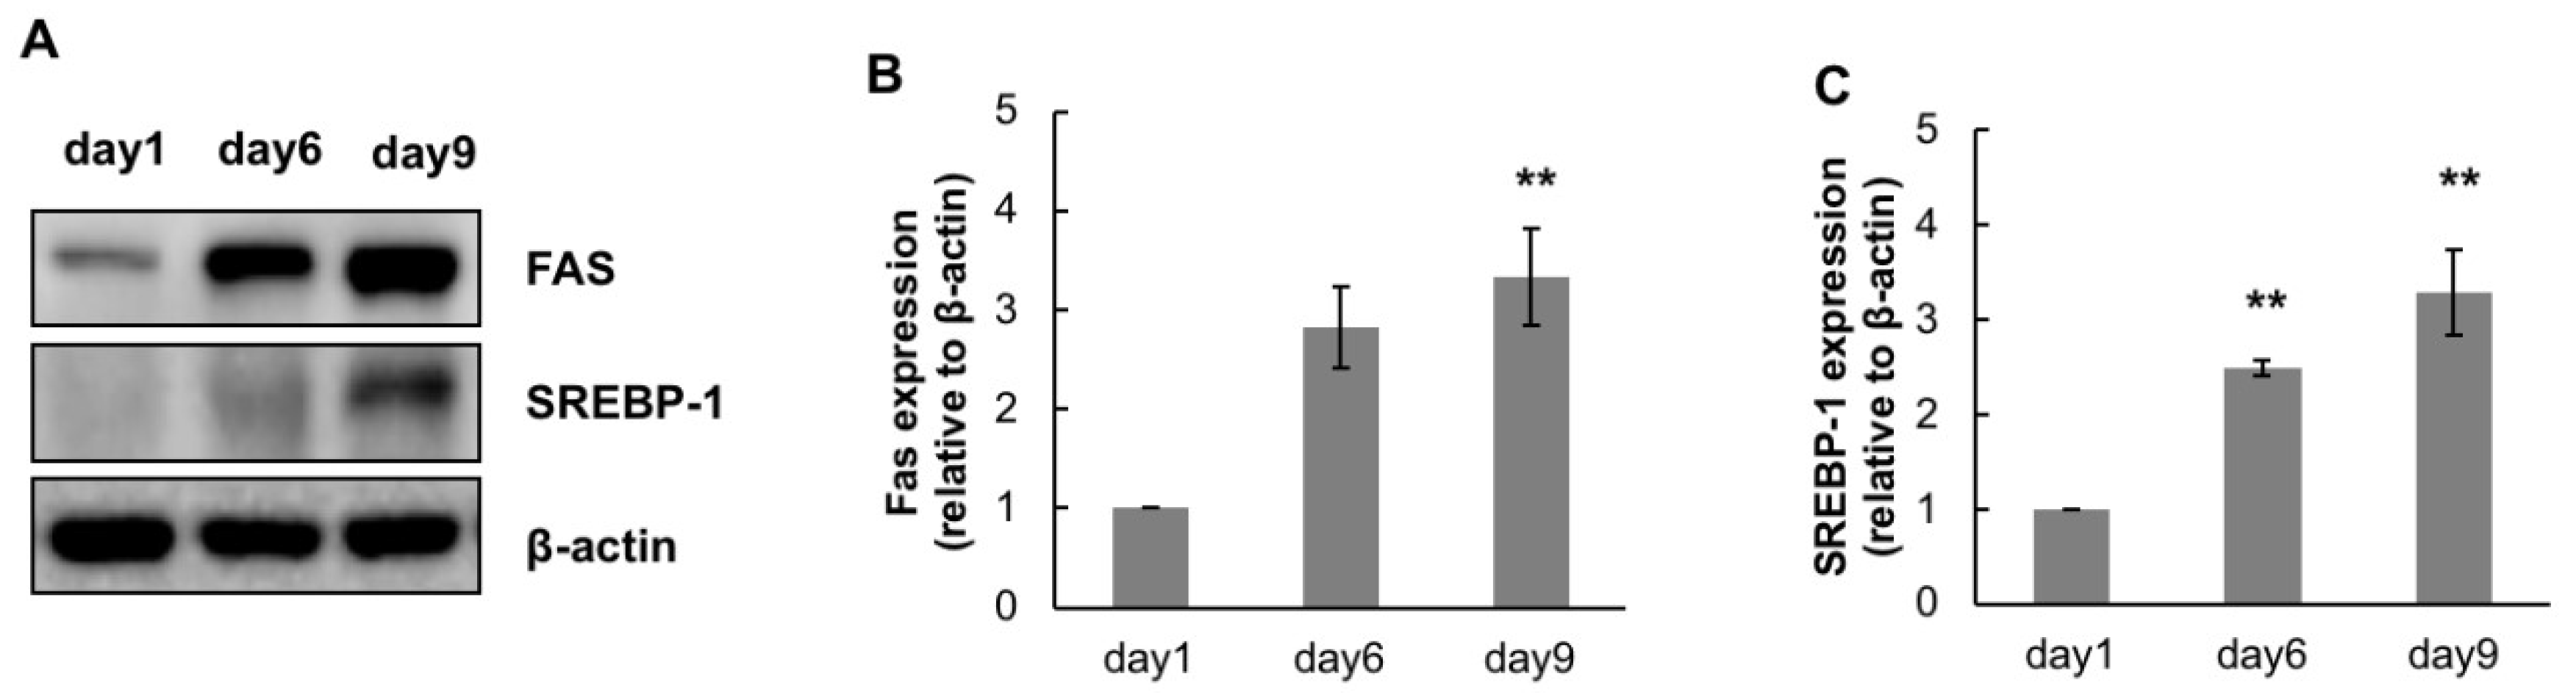
2. Results
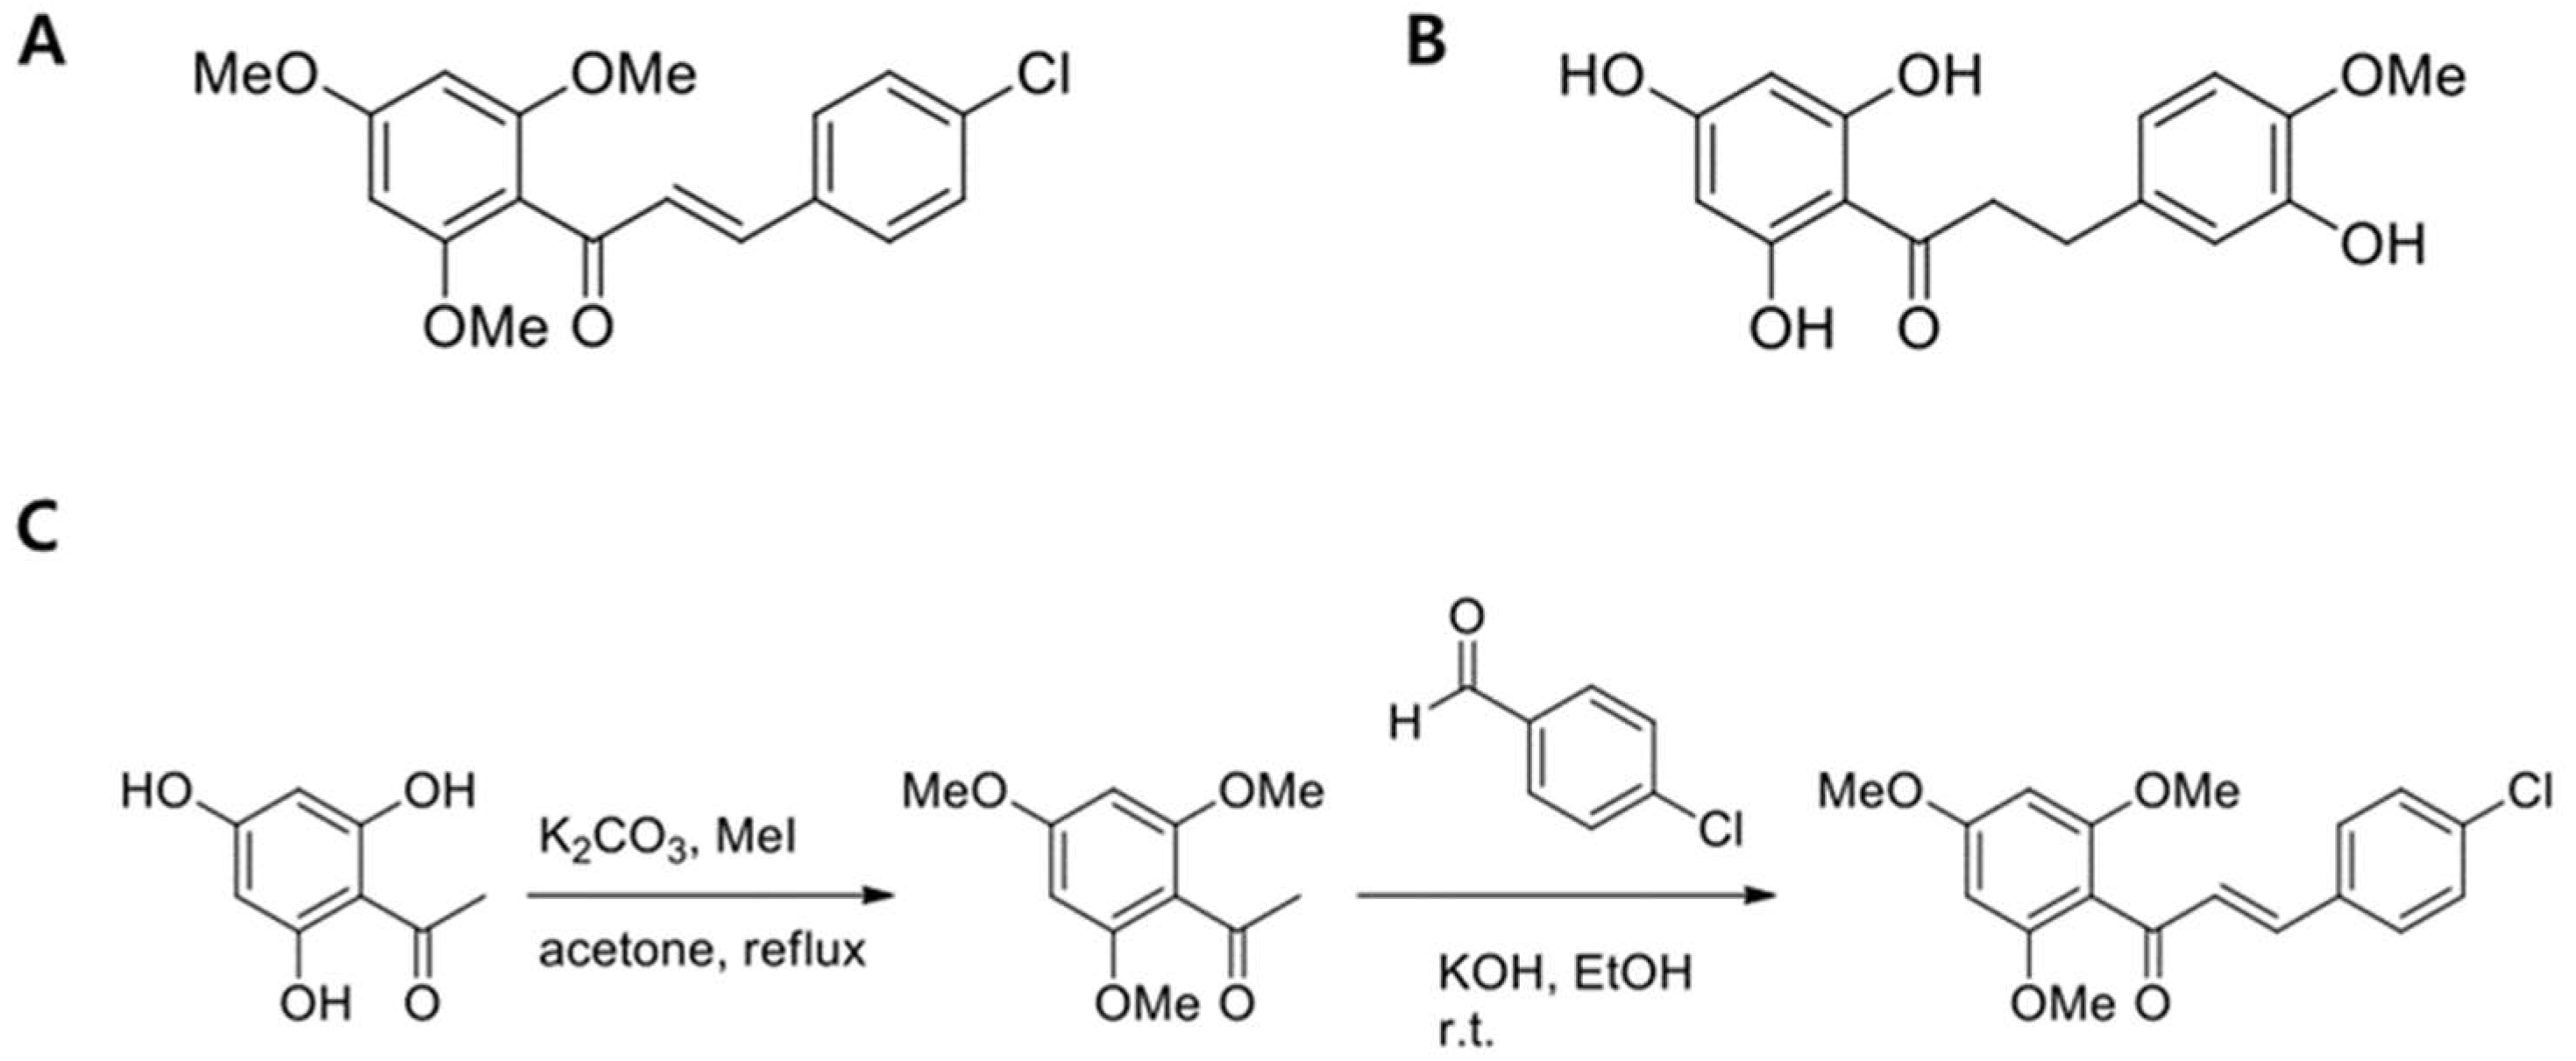
2.1. Synthesis of (E)-3-(4-Chlorophenyl)-1-(2,4,6-Trimethoxyphenyl)prop-2-en-1-one (CTP)
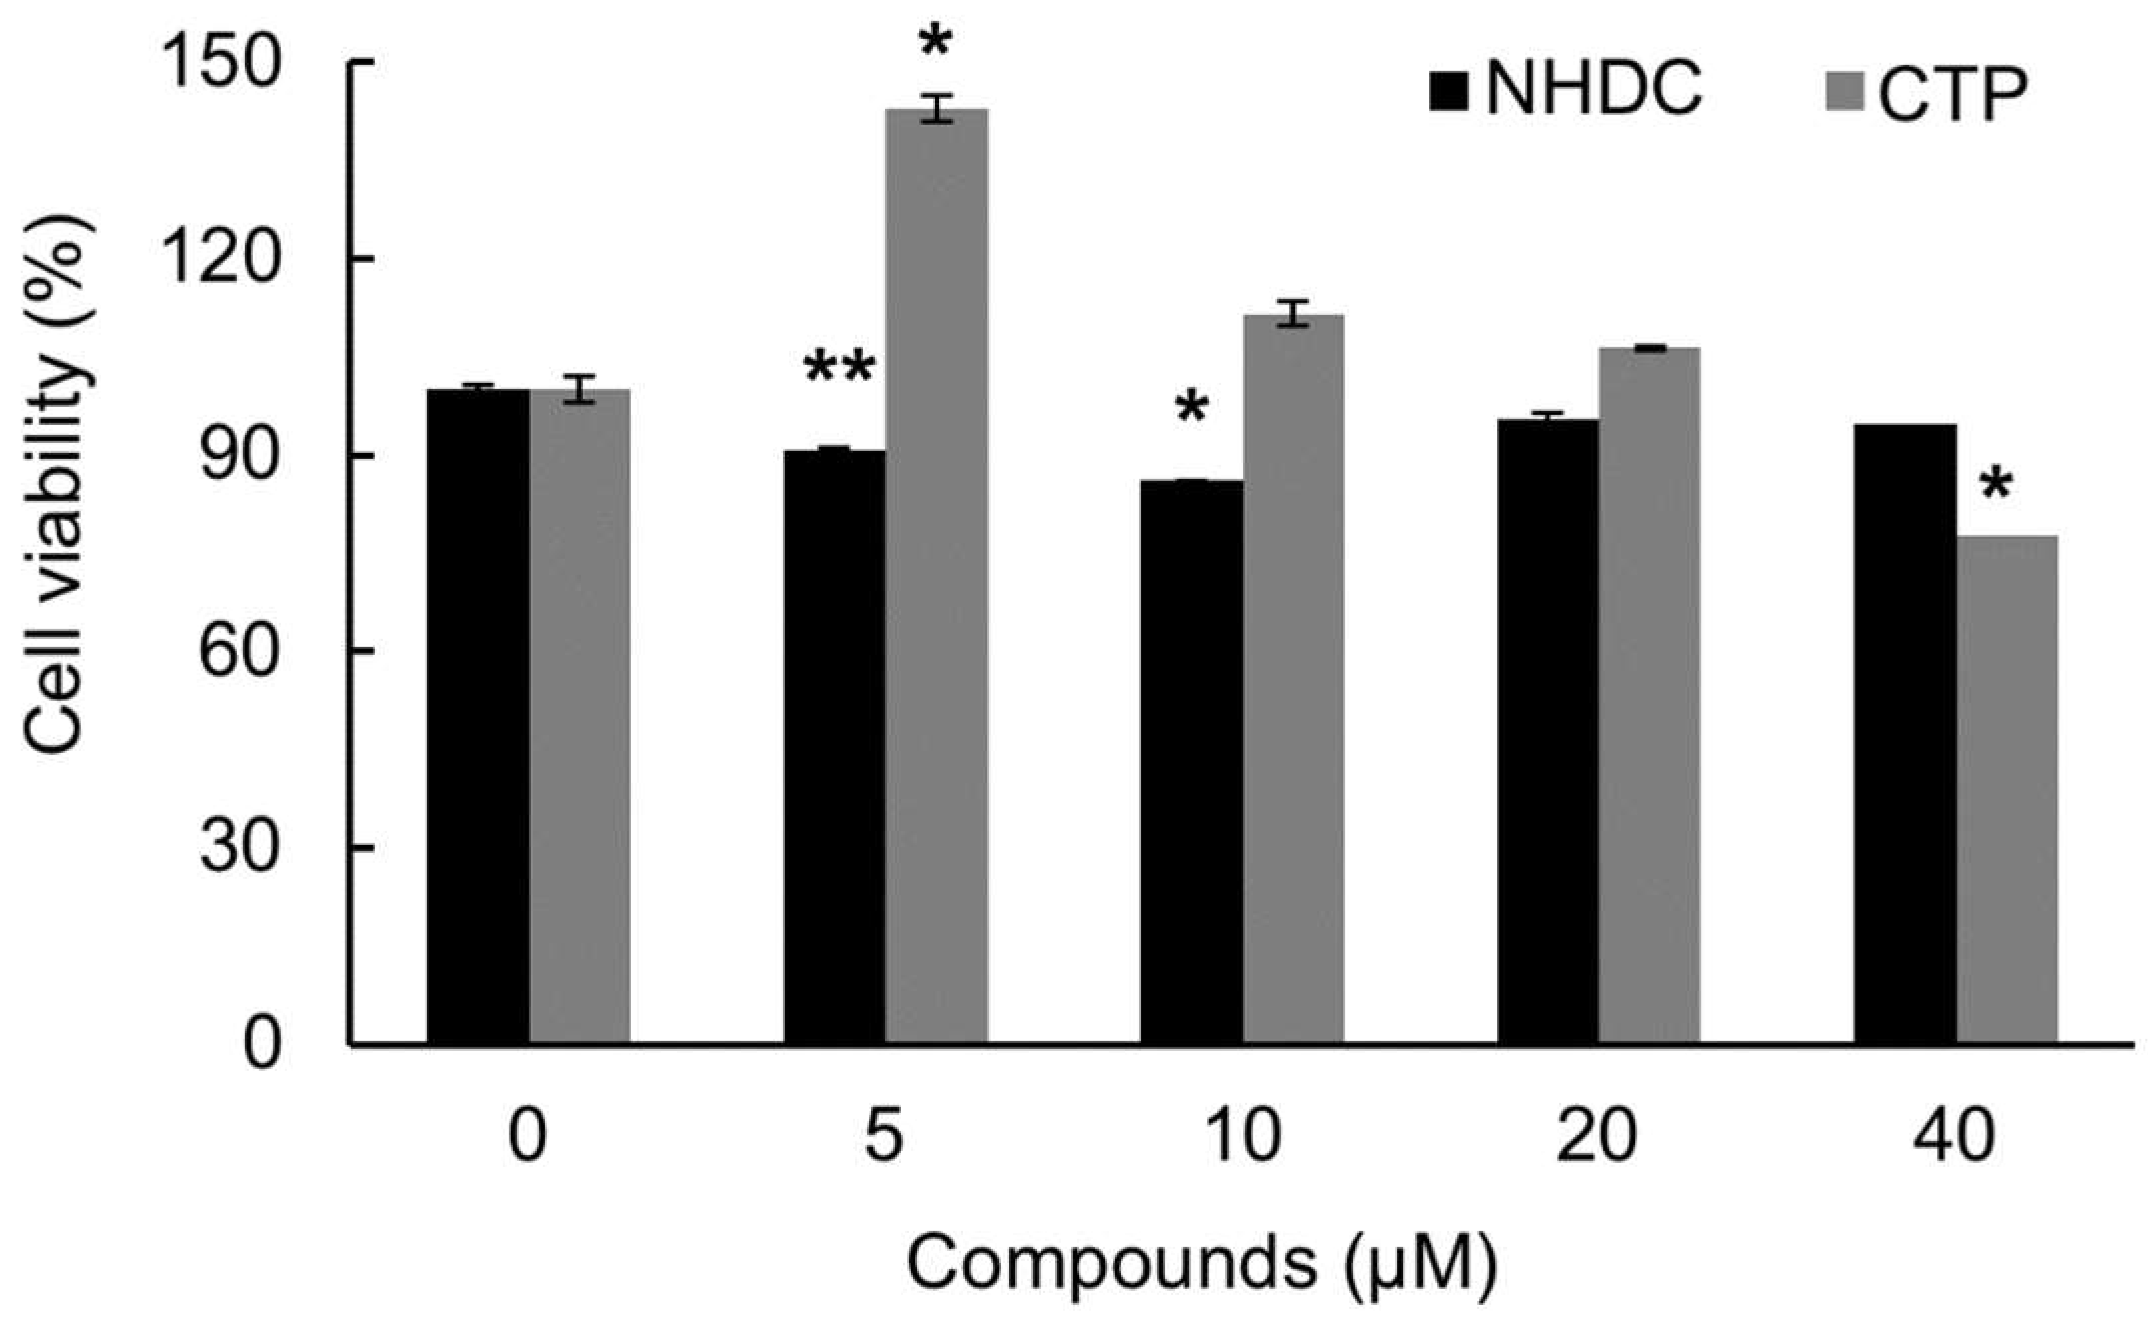
2.2. Cell Viability of hASCs after NHDC and CTP Treatment
- Control group (Con): Neither NHDC nor CTP treatment during proliferation media treatment only.
- Differentiation group (Diff): Neither NHDC nor CTP treatment during proliferation and differentiation media treatment.
- Experimental group (NHDC of CTP): NHDC or CTP treatment during proliferation and differentiation media treatment.
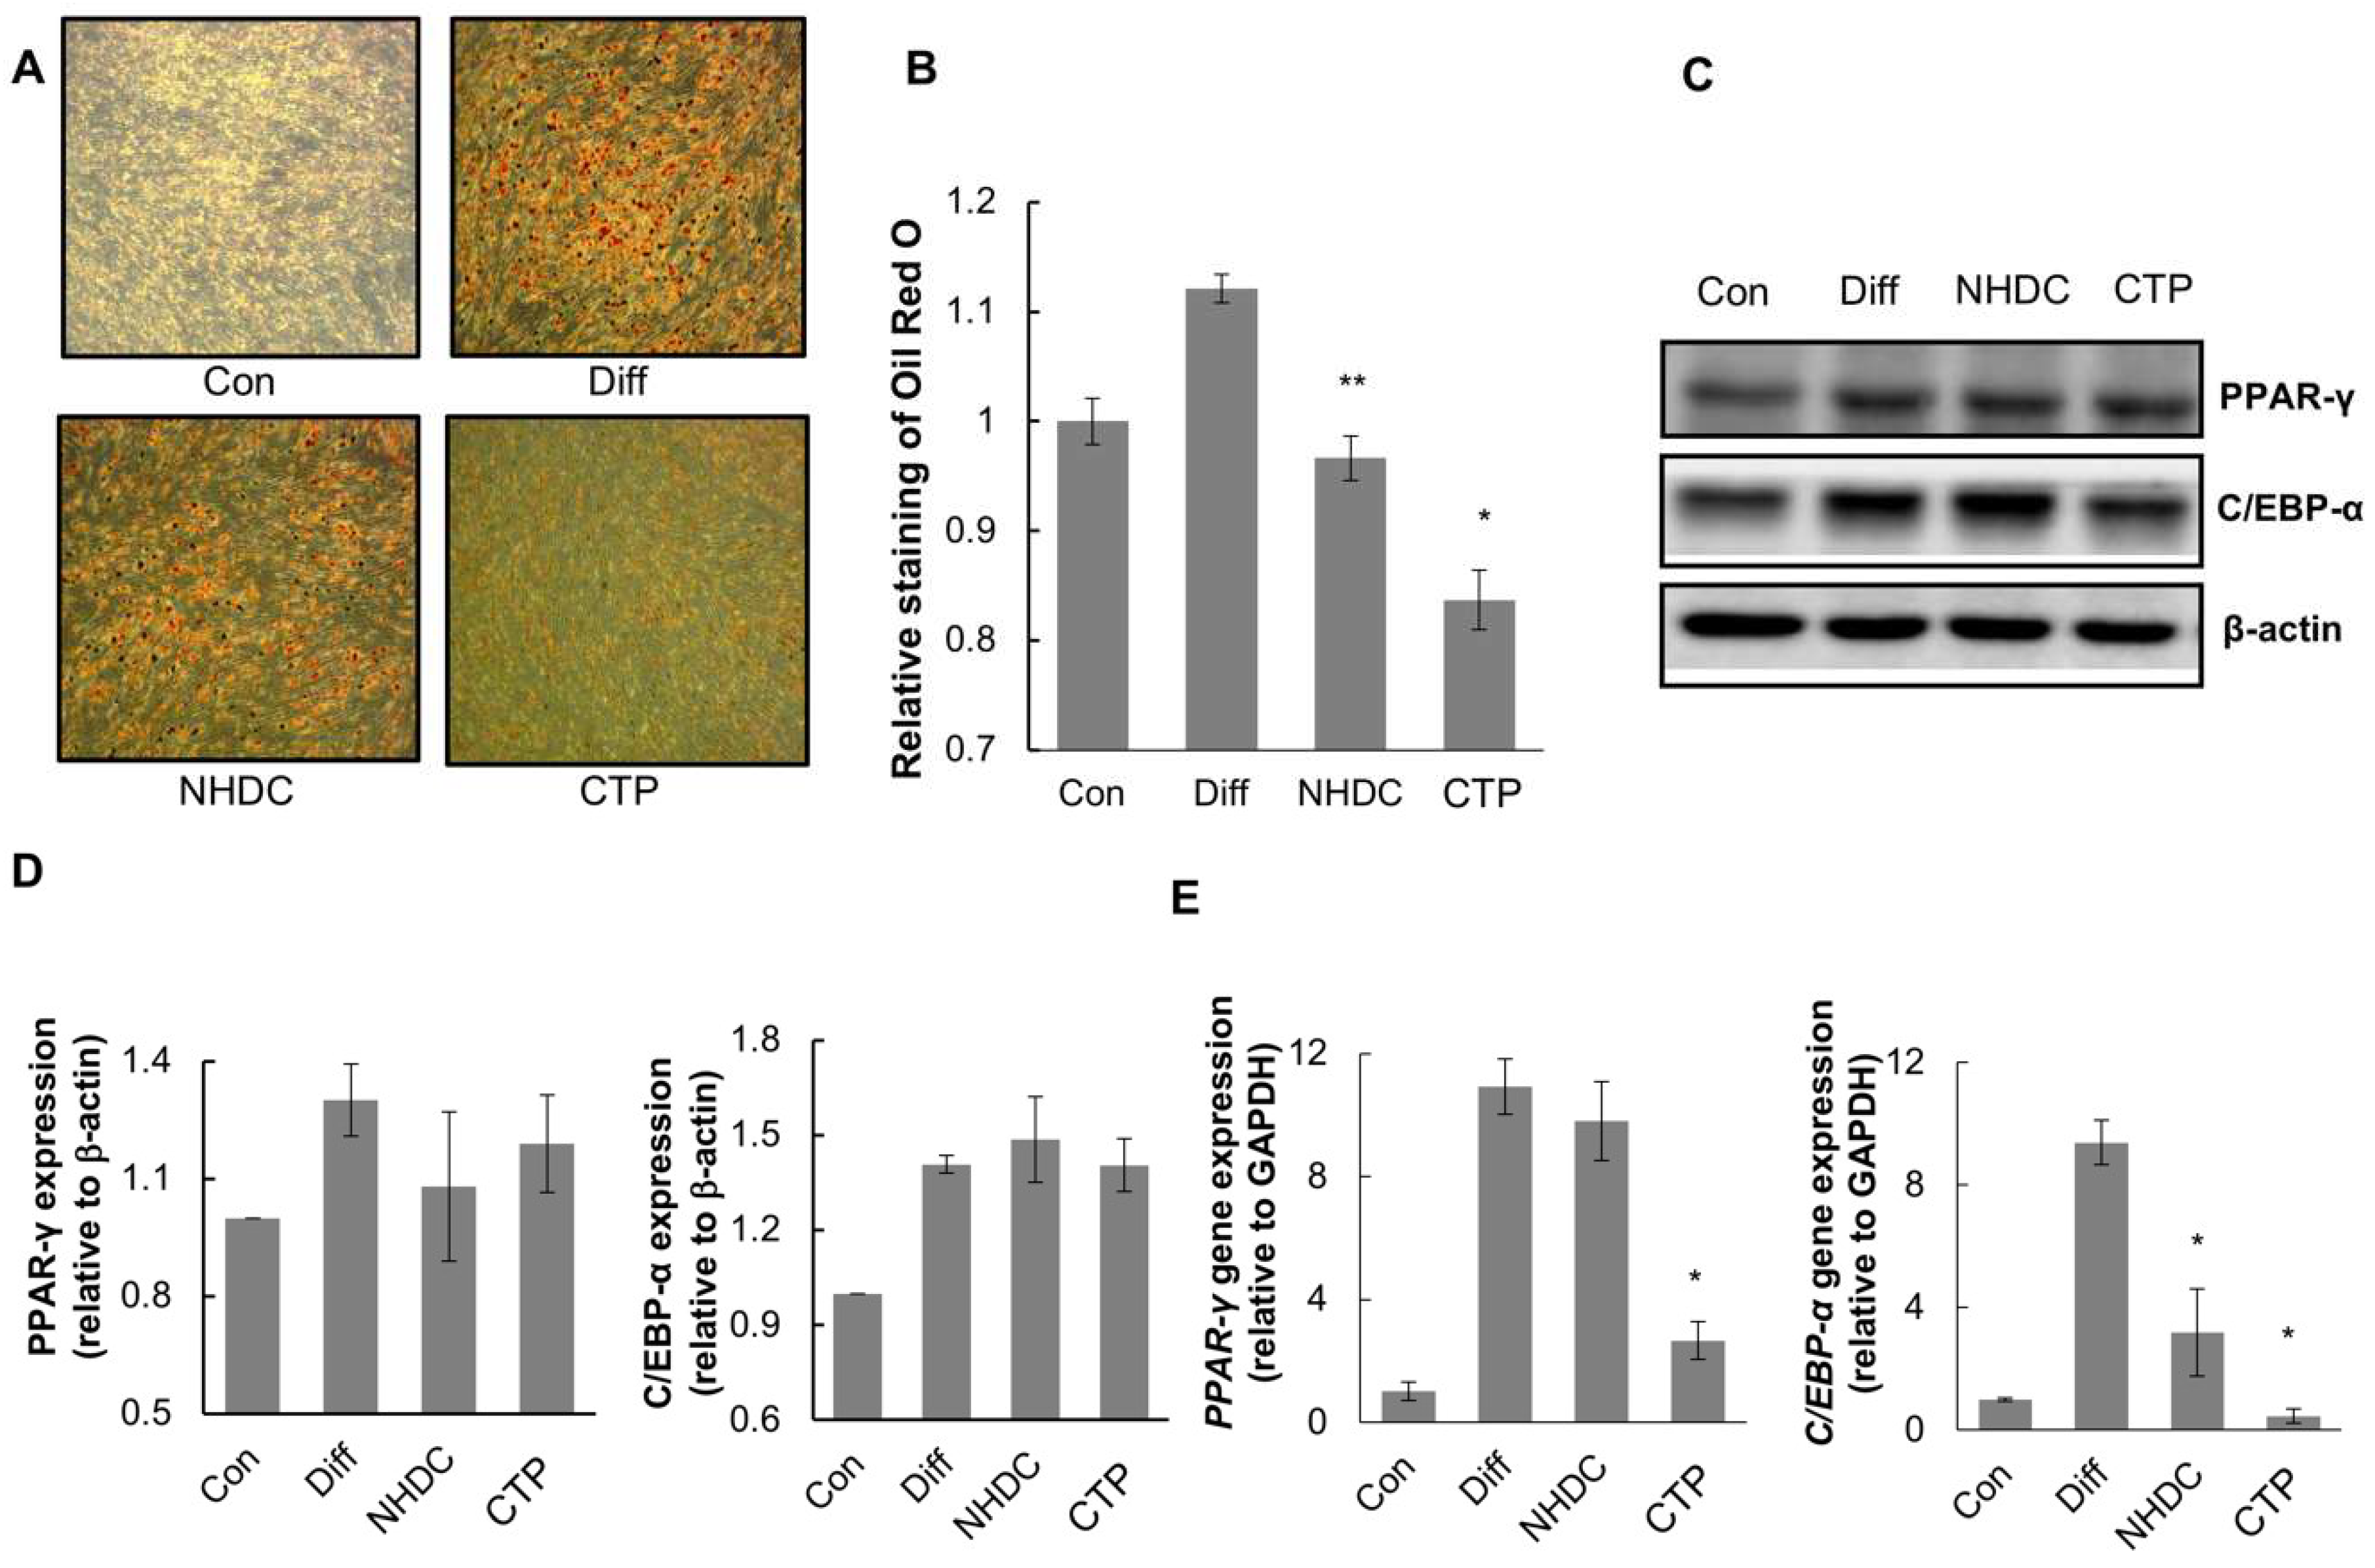
2.3. Inhibition Effects of CTP on the Adipogenic Differentiation of hASCs
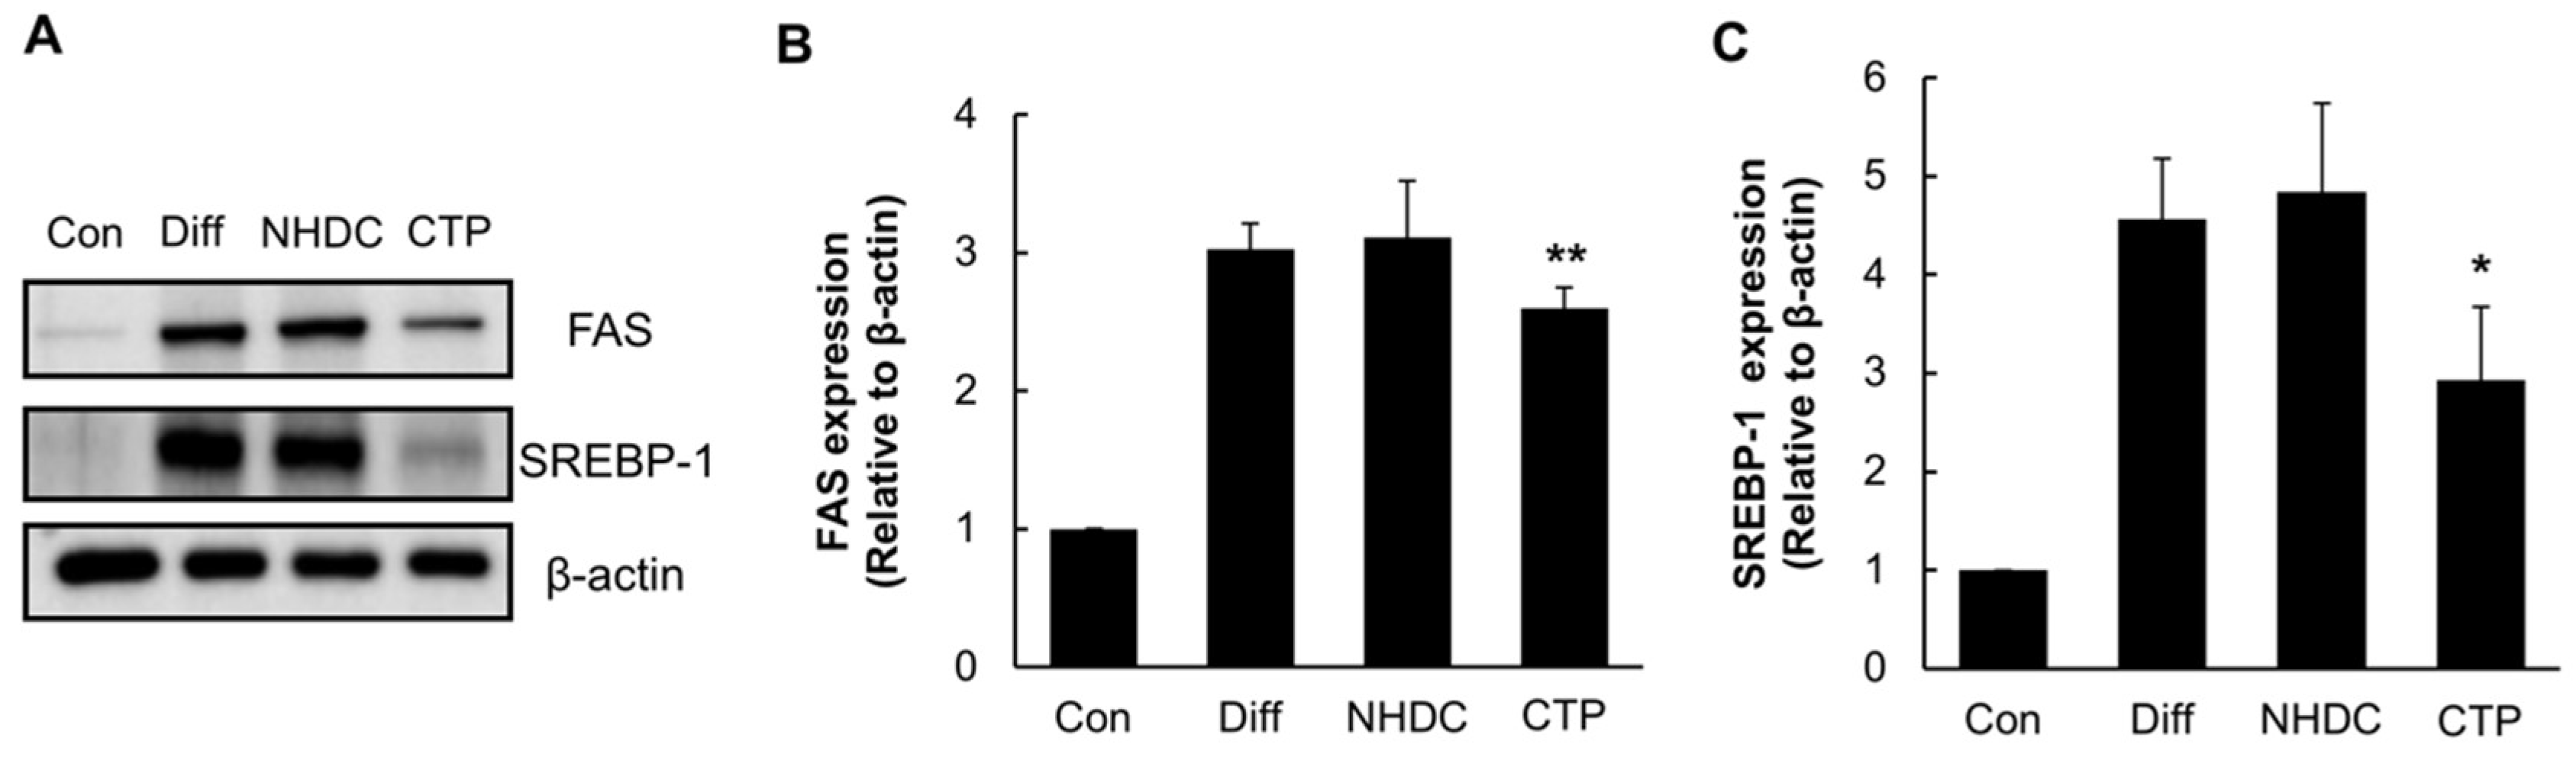
2.4. Anti-Lipogenic Effect of CTP during Adipogenic Differentiation of hASCs
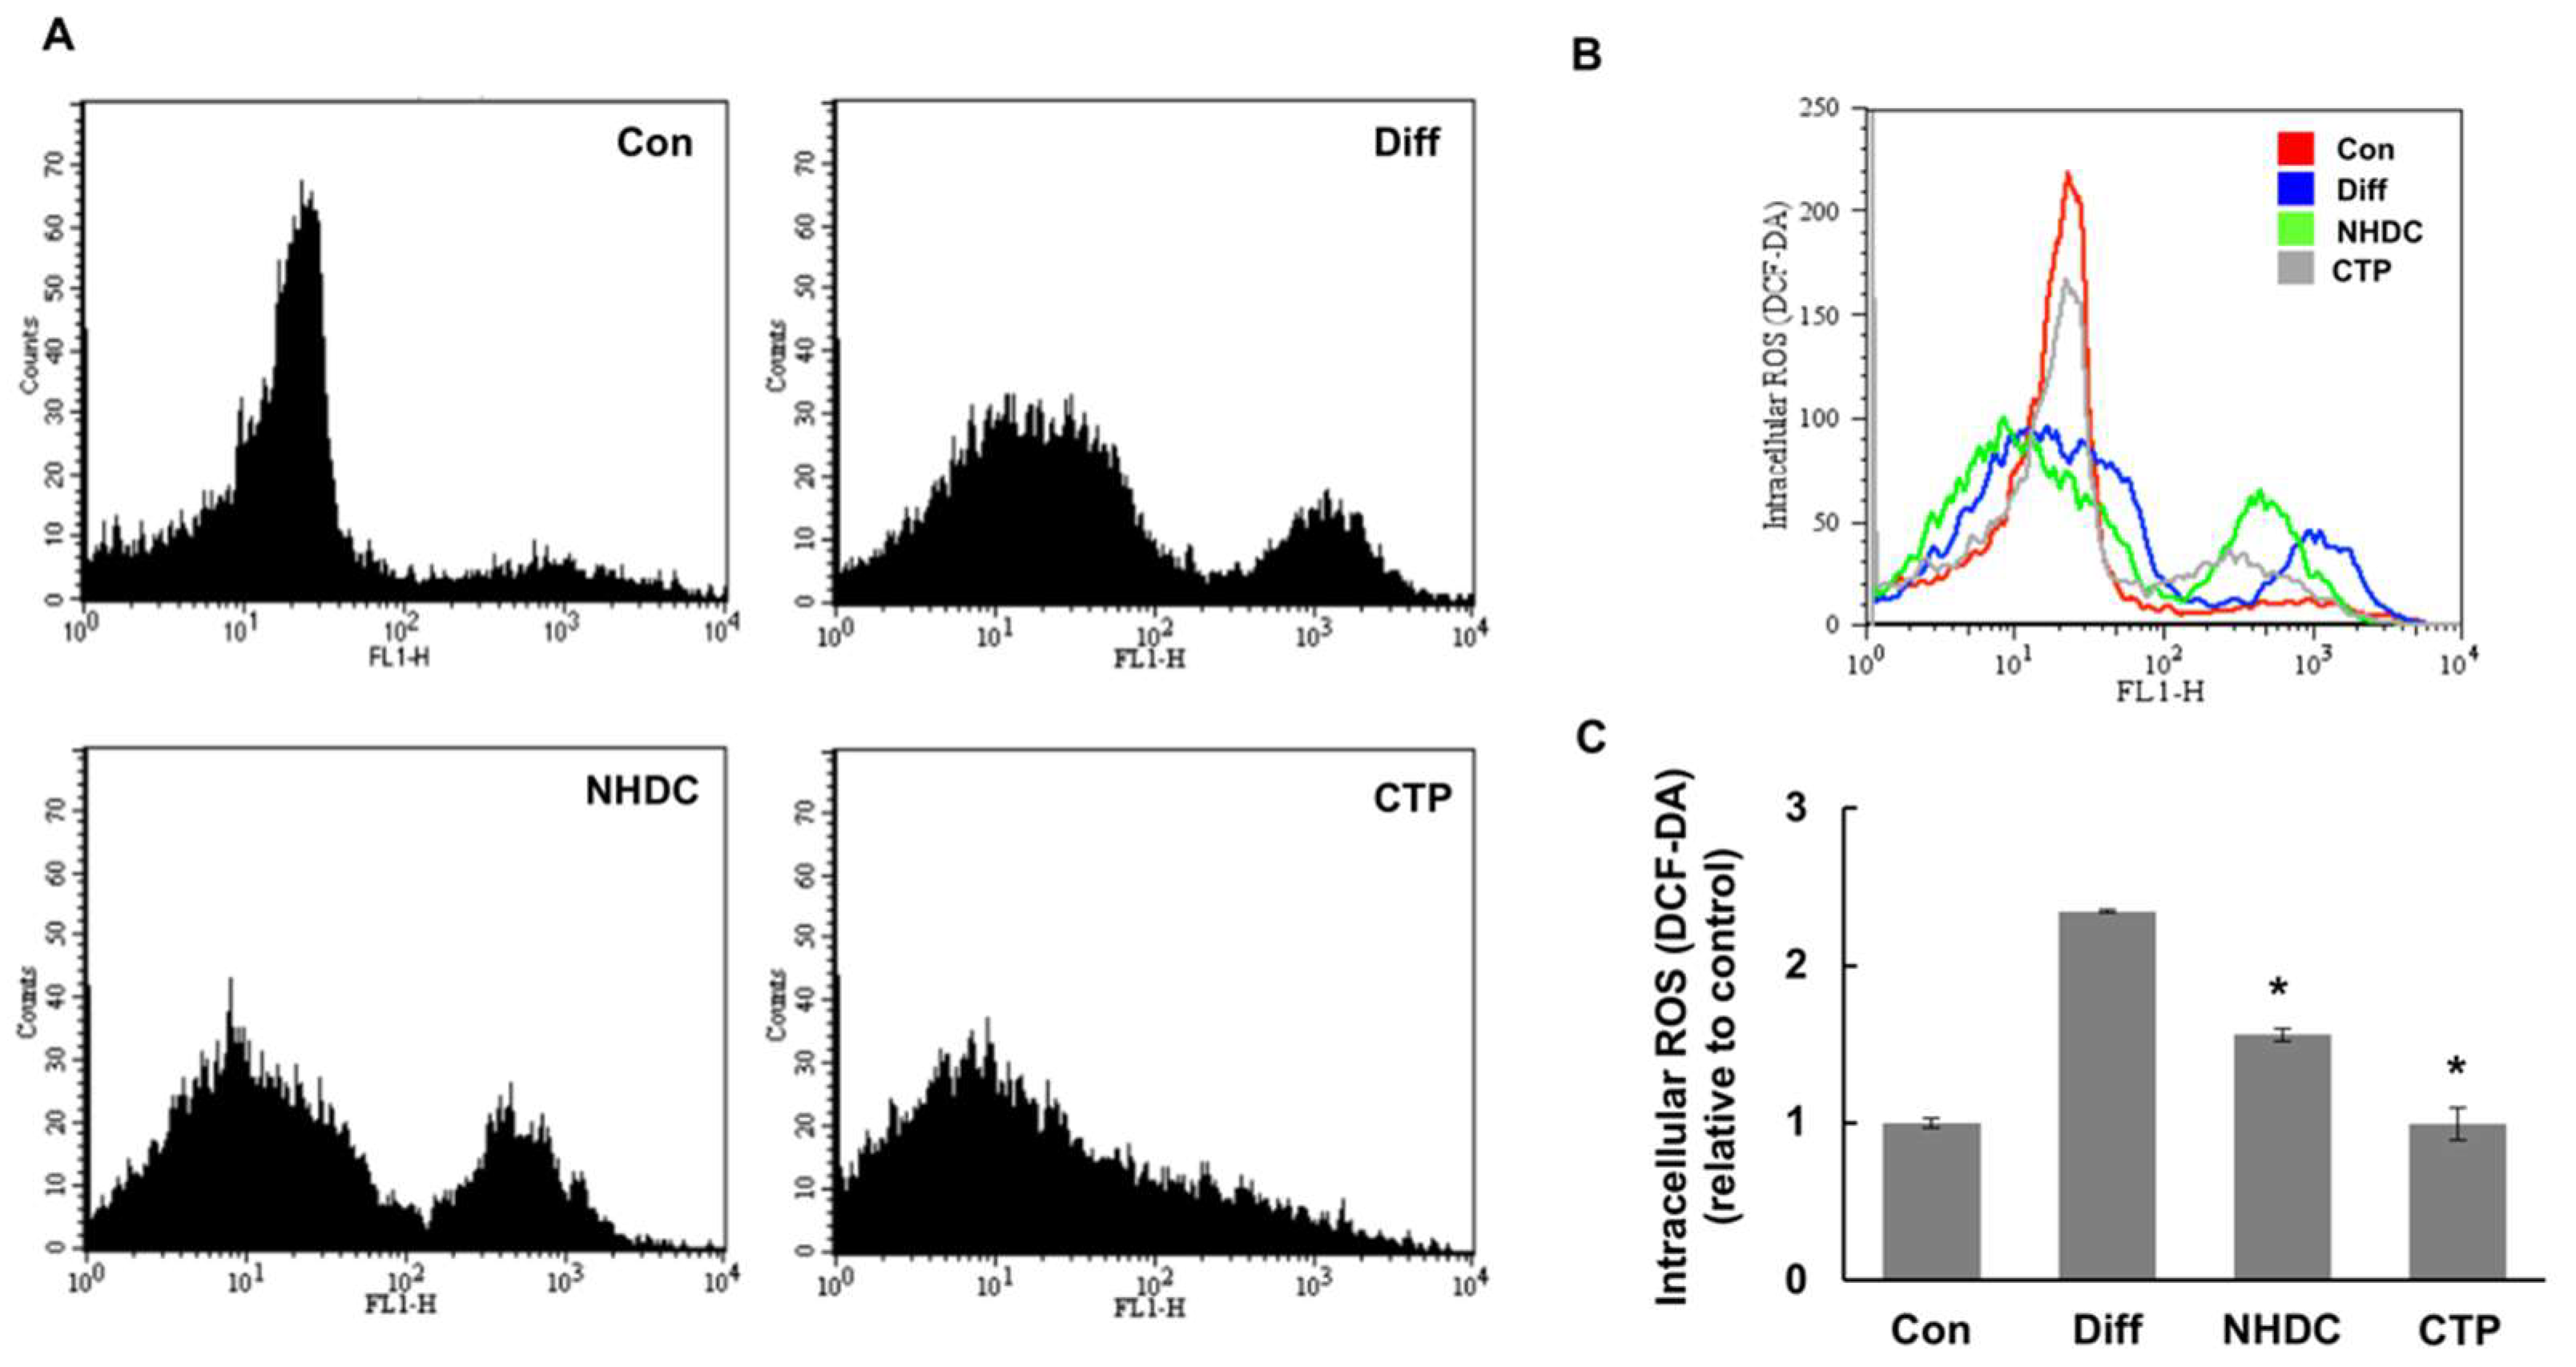
2.5. Effect of CTP on ROS Generation during Adipogenic Differentiation of hASCs
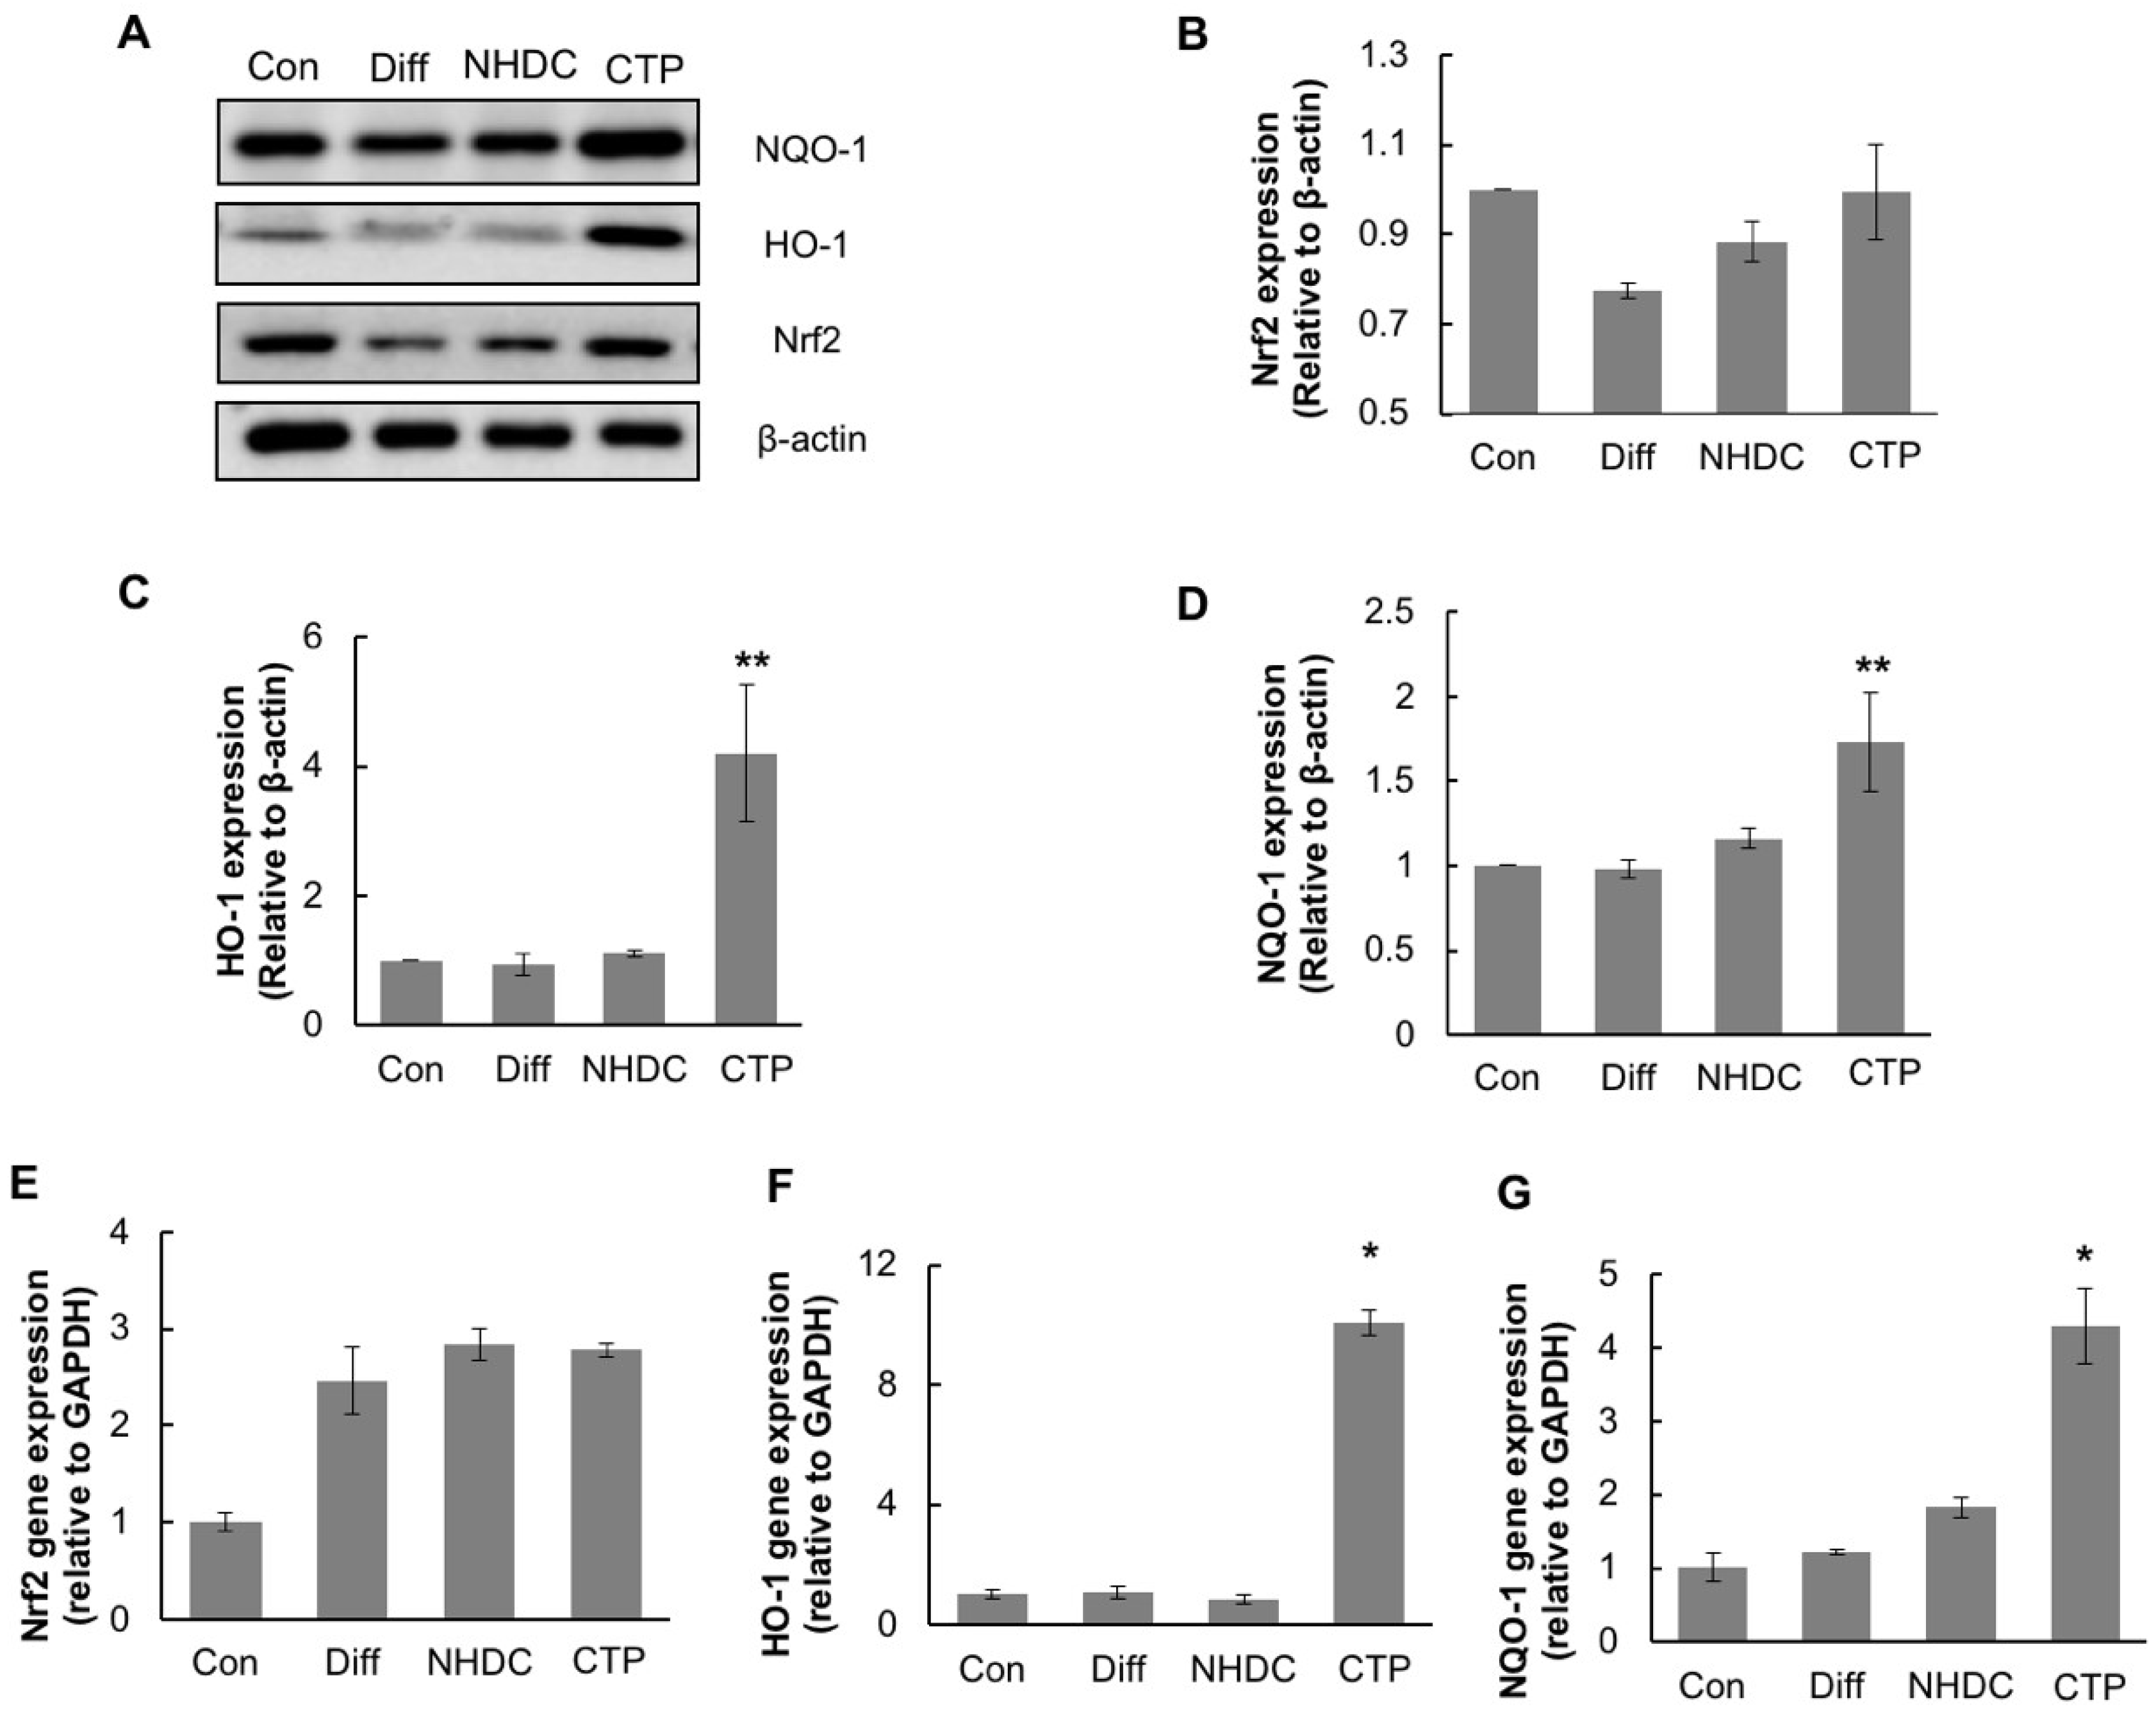
2.6. Induction of Nrf2 and Its Downstream Antioxidant Enzymes by CTP in Adipogenic Differentiation of hASCs
3. Discussion
4. Materials and Methods
4.1. Chemicals and Reagents
4.2. Synthesis of (E)-3-(4-Chlorophenyl)-1-(2,4,6-Trimethoxyphenyl)prop-2-en-1-one
4.3. Cell Culture
4.4. Cell Viability of hASCs with NHDC and CTP
4.5. In Vitro Adipogenic Differentiation of hASCs Under NHDC and CTP Treatment
4.6. Measurement of Lipid Accumulation during Adipogenic Differentiation of hASCs with and without NHDC and CTP
4.7. ROS Measurement
4.8. Quantitative Reverse Transcription–Polymerase Chain Reaction (qRT-PCR) Analysis
4.9. Western Blot Analysis
4.10. Statistical Analysis
5. Conclusions
Author Contributions
Acknowledgments
Conflicts of Interest
References
- Bianchini, F.; Kaaks, R.; Vainio, H. Overweight, obesity, and cancer risk. Lancet Oncol. 2002, 3, 565–574. [Google Scholar] [CrossRef]
- Janssen, I. The public health burden of obesity in canada. Can. J. Diabetes 2013, 37, 90–96. [Google Scholar] [CrossRef] [PubMed]
- Wang, Y.; Chen, X.; Song, Y.; Caballero, B.; Cheskin, L. Association between obesity and kidney disease: A systematic review and meta-analysis. Kidney Int. 2008, 73, 19–33. [Google Scholar] [CrossRef] [PubMed]
- Flegal, K.M.; Carroll, M.D.; Kit, B.K.; Ogden, C.L. Prevalence of obesity and trends in the distribution of body mass index among us adults, 1999–2010. JAMA 2012, 307, 491–497. [Google Scholar] [CrossRef] [PubMed]
- Shin, H.-Y.; Kang, H.-T. Recent trends in the prevalence of underweight, overweight, and obesity in korean adults: The korean national health and nutrition examination survey from 1998 to 2014. J. Epidemiol. 2017, 27, 413–419. [Google Scholar] [CrossRef] [PubMed]
- Bondia-Pons, I.; Ryan, L.; Martinez, J.A. Oxidative stress and inflammation interactions in human obesity. J. Physiol. Biochem. 2012, 68, 701–711. [Google Scholar] [CrossRef] [PubMed]
- Chamberlain, G.; Fox, J.; Ashton, B.; Middleton, J. Concise review: Mesenchymal stem cells: Their phenotype, differentiation capacity, immunological features, and potential for homing. Stem Cells 2007, 25, 2739–2749. [Google Scholar] [CrossRef] [PubMed]
- Sawant, A.; Chanda, D.; Isayeva, T.; Tsuladze, G.; Garvey, W.T.; Ponnazhagan, S. Noggin is novel inducer of mesenchymal stem cell adipogenesis: Implications for bone health and obesity. J. Biol. Chem. 2012, 287, 12241–12249. [Google Scholar] [CrossRef] [PubMed]
- Sudo, K.; Kanno, M.; Miharada, K.; Ogawa, S.; Hiroyama, T.; Saijo, K.; Nakamura, Y. Mesenchymal progenitors able to differentiate into osteogenic, chondrogenic, and/or adipogenic cells in vitro are present in most primary fibroblast-like cell populations. Stem Cells 2007, 25, 1610–1617. [Google Scholar] [CrossRef] [PubMed]
- Janderova, L.; McNeil, M.; Murrell, A.N.; Mynatt, R.L.; Smith, S.R. Human mesenchymal stem cells as an in vitro model for human adipogenesis. Obes. Res. 2003, 11, 65–74. [Google Scholar] [CrossRef] [PubMed]
- Nakamura, T.; Shiojima, S.; Hirai, Y.; Iwama, T.; Tsuruzoe, N.; Hirasawa, A.; Katsuma, S.; Tsujimoto, G. Temporal gene expression changes during adipogenesis in human mesenchymal stem cells. Biochem. Biophys. Res. Commun. 2003, 303, 306–312. [Google Scholar] [CrossRef]
- Storz, P. Forkhead homeobox type o transcription factors in the responses to oxidative stress. Antioxid. Redox Signal. 2011, 14, 593–605. [Google Scholar] [CrossRef] [PubMed]
- Furukawa, S.; Fujita, T.; Shimabukuro, M.; Iwaki, M.; Yamada, Y.; Nakajima, Y.; Nakayama, O.; Makishima, M.; Matsuda, M.; Shimomura, I. Increased oxidative stress in obesity and its impact on metabolic syndrome. J. Clin. Investig. 2004, 114, 1752–1761. [Google Scholar] [CrossRef] [PubMed] [Green Version]
- Tormos, K.V.; Anso, E.; Hamanaka, R.B.; Eisenbart, J.; Joseph, J.; Kalyanaraman, B.; Chandel, N.S. Mitochondrial complex iii ros regulate adipocyte differentiation. Cell Metab. 2011, 14, 537–544. [Google Scholar] [CrossRef] [PubMed]
- Owusu-Ansah, E.; Banerjee, U. Reactive oxygen species prime drosophila haematopoietic progenitors for differentiation. Nature 2009, 461, 537–541. [Google Scholar] [CrossRef] [PubMed]
- Horton, J.D.; Goldstein, J.L.; Brown, M.S. Srebps: Activators of the complete program of cholesterol and fatty acid synthesis in the liver. J. Clin. Investig. 2002, 109, 1125–1131. [Google Scholar] [CrossRef] [PubMed]
- Platt, I.D.; El-Sohemy, A. Regulation of osteoblast and adipocyte differentiation from human mesenchymal stem cells by conjugated linoleic acid. J. Nutr. Biochem. 2009, 20, 956–964. [Google Scholar] [CrossRef] [PubMed]
- Yu, W.H.; Li, F.G.; Chen, X.Y.; Li, J.T.; Wu, Y.H.; Huang, L.H.; Wang, Z.; Li, P.; Wang, T.; Lahn, B.T.; et al. Ppargamma suppression inhibits adipogenesis but does not promote osteogenesis of human mesenchymal stem cells. Int. J. Biochem. Cell Biol. 2012, 44, 377–384. [Google Scholar] [CrossRef] [PubMed]
- Nguyen, T.; Nioi, P.; Pickett, C.B. The nrf2-antioxidant response element signaling pathway and its activation by oxidative stress. J. Biol. Chem. 2009, 284, 13291–13295. [Google Scholar] [CrossRef] [PubMed]
- Saw, C.L.-L.; Wu, Q.; Kong, A.-N. Anti-cancer and potential chemopreventive actions of ginseng by activating nrf2 (nfe2l2) anti-oxidative stress/anti-inflammatory pathways. Chin. Med. 2010, 5, 37. [Google Scholar] [CrossRef] [PubMed]
- He, X.; Ma, Q. Nrf2 cysteine residues are critical for oxidant/electrophile-sensing, kelch-like ech-associated protein-1-dependent ubiquitination-proteasomal degradation, and transcription activation. Mol. Pharmacol. 2009, 76, 1265–1278. [Google Scholar] [CrossRef] [PubMed]
- Li, W.; Thakor, N.; Xu, E.Y.; Huang, Y.; Chen, C.; Yu, R.; Holcik, M.; Kong, A.N. An internal ribosomal entry site mediates redox-sensitive translation of nrf2. Nucleic Acids Res 2010, 38, 778–788. [Google Scholar] [CrossRef] [PubMed]
- Kanda, Y.; Hinata, T.; Kang, S.W.; Watanabe, Y. Reactive oxygen species mediate adipocyte differentiation in mesenchymal stem cells. Life Sci. 2011, 89, 250–258. [Google Scholar] [CrossRef] [PubMed]
- Basoli, V.; Santaniello, S.; Cruciani, S.; Ginesu, G.C.; Cossu, M.L.; Delitala, A.P.; Serra, P.A.; Ventura, C.; Maioli, M. Melatonin and vitamin d interfere with the adipogenic fate of adipose-derived stem cells. Int. J. Mol. Sci. 2017, 18, 981. [Google Scholar] [CrossRef] [PubMed]
- Benavente-Garcia, O.; Castillo, J. Update on uses and properties of citrus flavonoids: New findings in anticancer, cardiovascular, and anti-inflammatory activity. J. Agric. Food Chem. 2008, 56, 6185–6205. [Google Scholar] [CrossRef] [PubMed]
- Choi, J.M.; Yoon, B.S.; Lee, S.K.; Hwang, J.K.; Ryang, R. Antioxidant properties of neohesperidin dihydrochalcone: Inhibition of hypochlorous acid-induced DNA strand breakage, protein degradation, and cell death. Biol. Pharm. Bull. 2007, 30, 324–330. [Google Scholar] [CrossRef] [PubMed]
- Lo Furno, D.; Graziano, A.C.E.; Avola, R.; Giuffrida, R.; Perciavalle, V.; Bonina, F.; Mannino, G.; Cardile, V. A citrus bergamia extract decreases adipogenesis and increases lipolysis by modulating ppar levels in mesenchymal stem cells from human adipose tissue. PPAR Res. 2016, 2016, 4563815. [Google Scholar] [CrossRef] [PubMed]
- Su, C.; Xia, X.; Shi, Q.; Song, X.; Fu, J.; Xiao, C.; Chen, H.; Lu, B.; Sun, Z.; Wu, S.; et al. Neohesperidin dihydrochalcone versus ccl4-induced hepatic injury through different mechanisms: The implication of free radical scavenging and nrf2 activation. J. Agric. Food Chem. 2015, 63, 5468–5475. [Google Scholar] [CrossRef] [PubMed]
- Hofbauer, K.G.; Nicholson, J.R.; Boss, O. The obesity epidemic: Current and future pharmacological treatments. Annu. Rev. Pharmacol. Toxicol. 2007, 47, 565–592. [Google Scholar] [CrossRef] [PubMed]
- Shin, S.; Wakabayashi, N.; Misra, V.; Biswal, S.; Lee, G.H.; Agoston, E.S.; Yamamoto, M.; Kensler, T.W. Nrf2 modulates aryl hydrocarbon receptor signaling: Influence on adipogenesis. Mol. Cell. Biol. 2007, 27, 7188–7197. [Google Scholar] [CrossRef] [PubMed]
- Xu, J.; Kulkarni, S.R.; Donepudi, A.C.; More, V.R.; Slitt, A.L. Enhanced nrf2 activity worsens insulin resistance, impairs lipid accumulation in adipose tissue, and increases hepatic steatosis in leptin-deficient mice. Diabetes 2012, 61, 3208–3218. [Google Scholar] [CrossRef] [PubMed]
- Zhang, D.-Y.; Pan, Y.; Zhang, C.; Yan, B.-X.; Yu, S.-S.; Wu, D.-L.; Shi, M.-M.; Shi, K.; Cai, X.-X.; Zhou, S.-S.; et al. Wnt/β-catenin signaling induces the aging of mesenchymal stem cells through promoting the ros production. Mol. Cell. Biochem. 2013, 374, 13–20. [Google Scholar] [CrossRef] [PubMed]
- Dionisi, M.; Alexander, S.; Bennett, A. Oleamide activates peroxisome proliferator-activated receptor gamma (PPARγ) in vitro. Lipids Health Dis. 2012, 11, 51. [Google Scholar] [CrossRef] [PubMed] [Green Version]
- Farmer, S.R. Regulation of ppargamma activity during adipogenesis. Int. J. Obes. 2005, 29 (Suppl. 1), S13–S16. [Google Scholar] [CrossRef] [PubMed]
- Jones, J.R.; Barrick, C.; Kim, K.A.; Lindner, J.; Blondeau, B.; Fujimoto, Y.; Shiota, M.; Kesterson, R.A.; Kahn, B.B.; Magnuson, M.A. Deletion of ppargamma in adipose tissues of mice protects against high fat diet-induced obesity and insulin resistance. Proc. Natl. Acad. Sci. USA 2005, 102, 6207–6212. [Google Scholar] [CrossRef] [PubMed]
- Horton, J.D.; Shah, N.A.; Warrington, J.A.; Anderson, N.N.; Park, S.W.; Brown, M.S.; Goldstein, J.L. Combined analysis of oligonucleotide microarray data from transgenic and knockout mice identifies direct srebp target genes. Proc. Natl. Acad. Sci. USA 2003, 100, 12027–12032. [Google Scholar] [CrossRef] [PubMed]
- Lee, J.H.; Khor, T.O.; Shu, L.; Su, Z.Y.; Fuentes, F.; Kong, A.N. Dietary phytochemicals and cancer prevention: Nrf2 signaling, epigenetics, and cell death mechanisms in blocking cancer initiation and progression. Pharmacol. Ther. 2013, 137, 153–171. [Google Scholar] [CrossRef] [PubMed] [Green Version]
- Lee, J.H.; Shu, L.; Fuentes, F.; Su, Z.-Y.; Kong, A.-N.T. Cancer chemoprevention by traditional chinese herbal medicine and dietary phytochemicals: Targeting nrf2-mediated oxidative stress/anti-inflammatory responses, epigenetics, and cancer stem cells. J. Tradit. Complement. Med. 2013, 3, 69–79. [Google Scholar] [CrossRef] [PubMed]
- He, C.H.; Gong, P.; Hu, B.; Stewart, D.; Choi, M.E.; Choi, A.M.; Alam, J. Identification of activating transcription factor 4 (atf4) as an nrf2-interacting protein. Implication for heme oxygenase-1 gene regulation. J. Biol. Chem. 2001, 276, 20858–20865. [Google Scholar] [CrossRef] [PubMed]
- Katsuoka, F.; Motohashi, H.; Ishii, T.; Aburatani, H.; Engel, J.D.; Yamamoto, M. Genetic evidence that small maf proteins are essential for the activation of antioxidant response element-dependent genes. Mol. Cell. Biol. 2005, 25, 8044–8051. [Google Scholar] [CrossRef] [PubMed]


| Gene | Forward | Reverse |
|---|---|---|
| Nrf2 | 5’-TCC TCT CCA CAG AAG ACC CC-3’ | 5’-TCA GGG TGG TTT TGG TTG AA-3’ |
| HO-1 | 5’-ACA TCT ATG TGG CCC TGG AG-3’ | 5’-TGT TGG GGA AGG TGA AGA AG-3’ |
| NQO-1 | 5’-CAC ACT CCA GCA GAC GCC CG-3’ | 5’-TGC CCA AGT CAT GGC CCA CAG-3’ |
| PPAR-γ | 5’-TCT CTC CGT AAT GGA AGA CC-3’ | 5’-GCA TTA TGA GAC ATC CCC AC-3’ |
| C/EBP-α | 5’-AGA AAG GGG TGG AAA CAT AGG-3’ | 5’-GAA AGC TGA GGG CAA AGG-3’ |
| GAPDH | 5’-AAG GGT CAT CAT CTC TGC CC-3’ | 5’-ATG ATG TTC TGG AGA GCC CC-3’ |
© 2018 by the authors. Licensee MDPI, Basel, Switzerland. This article is an open access article distributed under the terms and conditions of the Creative Commons Attribution (CC BY) license (http://creativecommons.org/licenses/by/4.0/).
Share and Cite
Han, G.E.; Kang, H.-T.; Chung, S.; Lim, C.; Linton, J.A.; Lee, J.-H.; Kim, W.; Kim, S.-H.; Lee, J.H. Novel Neohesperidin Dihydrochalcone Analogue Inhibits Adipogenic Differentiation of Human Adipose-Derived Stem Cells through the Nrf2 Pathway. Int. J. Mol. Sci. 2018, 19, 2215. https://0-doi-org.brum.beds.ac.uk/10.3390/ijms19082215
Han GE, Kang H-T, Chung S, Lim C, Linton JA, Lee J-H, Kim W, Kim S-H, Lee JH. Novel Neohesperidin Dihydrochalcone Analogue Inhibits Adipogenic Differentiation of Human Adipose-Derived Stem Cells through the Nrf2 Pathway. International Journal of Molecular Sciences. 2018; 19(8):2215. https://0-doi-org.brum.beds.ac.uk/10.3390/ijms19082215
Chicago/Turabian StyleHan, Ga Eun, Hee-Taik Kang, Sungkyun Chung, Changjin Lim, John A. Linton, Jin-Hee Lee, Wooki Kim, Seok-Ho Kim, and Jong Hun Lee. 2018. "Novel Neohesperidin Dihydrochalcone Analogue Inhibits Adipogenic Differentiation of Human Adipose-Derived Stem Cells through the Nrf2 Pathway" International Journal of Molecular Sciences 19, no. 8: 2215. https://0-doi-org.brum.beds.ac.uk/10.3390/ijms19082215