Article

Class I-Histone Deacetylase (HDAC) Inhibition is Superior to pan-HDAC Inhibition in Modulating Cisplatin Potency in High Grade Serous Ovarian Cancer Cell Lines

by
Jan J. Bandolik
1,
Alexandra Hamacher
1,
Christian Schrenk
1,
Robin Weishaupt
2 and
Matthias U. Kassack
1,*
1
Institute for Pharmaceutical and Medicinal Chemistry, University of Duesseldorf, 40225 Duesseldorf, Germany
2
Institute for Computer Science, Computational Complexity and Cryptology, University of Duesseldorf, 40225 Duesseldorf, Germany
*
Author to whom correspondence should be addressed.
Int. J. Mol. Sci. 2019, 20(12), 3052; https://0-doi-org.brum.beds.ac.uk/10.3390/ijms20123052
Submission received: 30 May 2019 / Revised: 19 June 2019 / Accepted: 20 June 2019 / Published: 22 June 2019
(This article belongs to the Special Issue Cisplatin in Cancer Therapy: Molecular Mechanisms of Action)

Abstract

:
High grade serous ovarian cancer (HGSOC) is the most common and aggressive ovarian cancer subtype with the worst clinical outcome due to intrinsic or acquired drug resistance. Standard treatment involves platinum compounds. Cancer development and chemoresistance is often associated with an increase in histone deacetylase (HDAC) activity. The purpose of this study was to examine the potential of HDAC inhibitors (HDACi) to increase platinum potency in HGSOC. Four HGSOC cell lines with different cisplatin sensitivity were treated with combinations of cisplatin and entinostat (class I HDACi), panobinostat (pan-HDACi), or nexturastat A (class IIb HDACi), respectively. Inhibition of class I HDACs by entinostat turned out superior in increasing cisplatin potency than pan-HDAC inhibition in cell viability assays (MTT), apoptosis induction (subG1), and caspase 3/7 activation. Entinostat was synergistic with cisplatin in all cell lines in MTT and caspase activation assays. MTT assays gave combination indices (CI values) < 0.9 indicating synergism. The effect of HDAC inhibitors could be attributed to the upregulation of pro-apoptotic genes (CDNK1A, APAF1, PUMA, BAK1) and downregulation of survivin. In conclusion, the combination of entinostat and cisplatin is synergistic in HGSOC and could be an effective strategy for the treatment of aggressive ovarian cancer.

Graphical Abstract

1. Introduction

Ovarian cancer is one of the most lethal gynecological cancer subtypes, such as uterus, breast, cervical or vulva cancer. Compared to the other gynecological cancers, ovarian cancers have the worst survival rate over five years (47.6%, USA; 41%, Germany). In contrast, breast cancer has a 5 year survival rate of 89.9% in the USA and 88% in Germany [1,2,3,4,5,6]. Ovarian cancer can be divided into types I and II. Type I is usually less aggressive and contains the subtypes endometrioid carcinoma and clear cell carcinoma as well as mucinous carcinoma and low-grade serous carcinoma. However, cohort studies from the USA found out that 68% of ovarian cancer cases are type II diseases [7,8]. Type II ovarian cancer is clinically very aggressive and consists of high grade serous ovarian cancer (HGSOC). HGSOC is rapidly growing, shows genomic instability, and dysfunction in tumor suppressors [9,10]. Primary options for treatment are surgery and a combination chemotherapy including platinum compounds like cisplatin or carboplatin and paclitaxel [11]. Initially, most ovarian cancers are chemosensitive. During the treatment, resistance develops and leads to relapse and therapeutic failure. The mechanisms behind a developing platinum resistance are multifactorial in nature and cannot be overcome by increasing the dose of a platinum drug given to a patient [12]. Furthermore, with increasing doses, patients suffer from increased frequency or intensity of side effects like nephrotoxicity or ototoxicity. Combination therapies with small molecule inhibitors are a widely used strategy to increase the platinum sensitivity of the tumor or to prevent/delay the development of therapeutic resistance [13,14]. It is well known that epigenetic modifications such as histone acetylation or DNA methylation are dysregulated in cancer and moreover in chemoresistance development [15,16]. The acetylation and deacetylation of proteins is regulated by histone acetyl transferases (HATs) and histone deacetylase (HDAC) enzymes. Eleven human zinc-dependent HDACs are known (HDAC1-11) which can be clustered into several classes: Class I: HDAC1, 2, 3, 8; class IIa: HDAC4, 5, 7, 9; class IIb: HDAC6, 10; and class IV: HDAC11. Class III comprises non-zinc-dependent HDAC enzymes, the so-called sirtuines which will not be considered in this paper [17]. There are several known overexpression patterns of histone deacetylase (HDAC) enzymes in different cancer subtypes leading to transcriptional repression [15]. For ovarian cancer, an overexpression of HDACs - especially of class I HDACs - is described and correlates with its aggressiveness. Furthermore, HDAC overexpression can serve as a marker of poor clinical outcome [18]. It is also described that chemotherapy leads to an upregulation of HDAC1 expression [19].
Thus, using HDAC inhibitors (HDACi) to normalize a dysregulated acetylation status of histone and non-histone proteins is an increasingly pursued strategy to increase the sensitivity of chemotherapeutic agents [20,21,22]. HDACi can act by regulating pro- and anti-apoptotic gene expression and thus promoting cell cycle arrest and induction of apoptosis [16]. However, the exact regulatory network of HDACi on apoptosis induction in a particular type of cancer is not fully understood. Further, it is not yet clear if subtype-selective HDACi or pan-HDAC inhibition is superior in increasing chemosensitivity of anticancer drugs such as platinum compounds.
The purpose of this study was to test the effect of HDACi with different subtype preferences on the chemosensitivity of cisplatin in HGSOC cell lines. Panobinostat was used as pan-HDACi, entinostat as class I selective HDACi, and nexturastat A as class IIb (HDAC6)-selective HDACi. Due to the intrinsic effect of HDACi regulating gene expression, all inhibitors were incubated 48 h prior to cisplatin treatment. CaOV3, Kuramochi, OVSAHO, and HEY cell lines were chosen as representatives for HGSOC based on literature recommendations [23,24,25,26]. Among these HGSOC cell lines, CaOV3, Kuramochi, and OVSAHO are described as very suitable cellular models for HGSOC [27]. In addition to the four HGSOC cell lines, A2780 was included as a comparison model for ovarian endometrioid adenocarcinoma (type I) [28,29]—a less aggressive type of ovarian cancer. HDACi—induced effects on cisplatin sensitivity were investigated using cell viability assays, apoptosis induction, caspase activation, and analysis of apoptosis-related gene expression. Notably, the class I HDACi entinostat turned out superior to panobinostat in increasing cisplatin potency in HGSOC and was synergistic with cisplatin. The chemosensitizing effect could be attributed to the upregulation of cell cycle arrest and pro-apoptotic genes.

2. Results

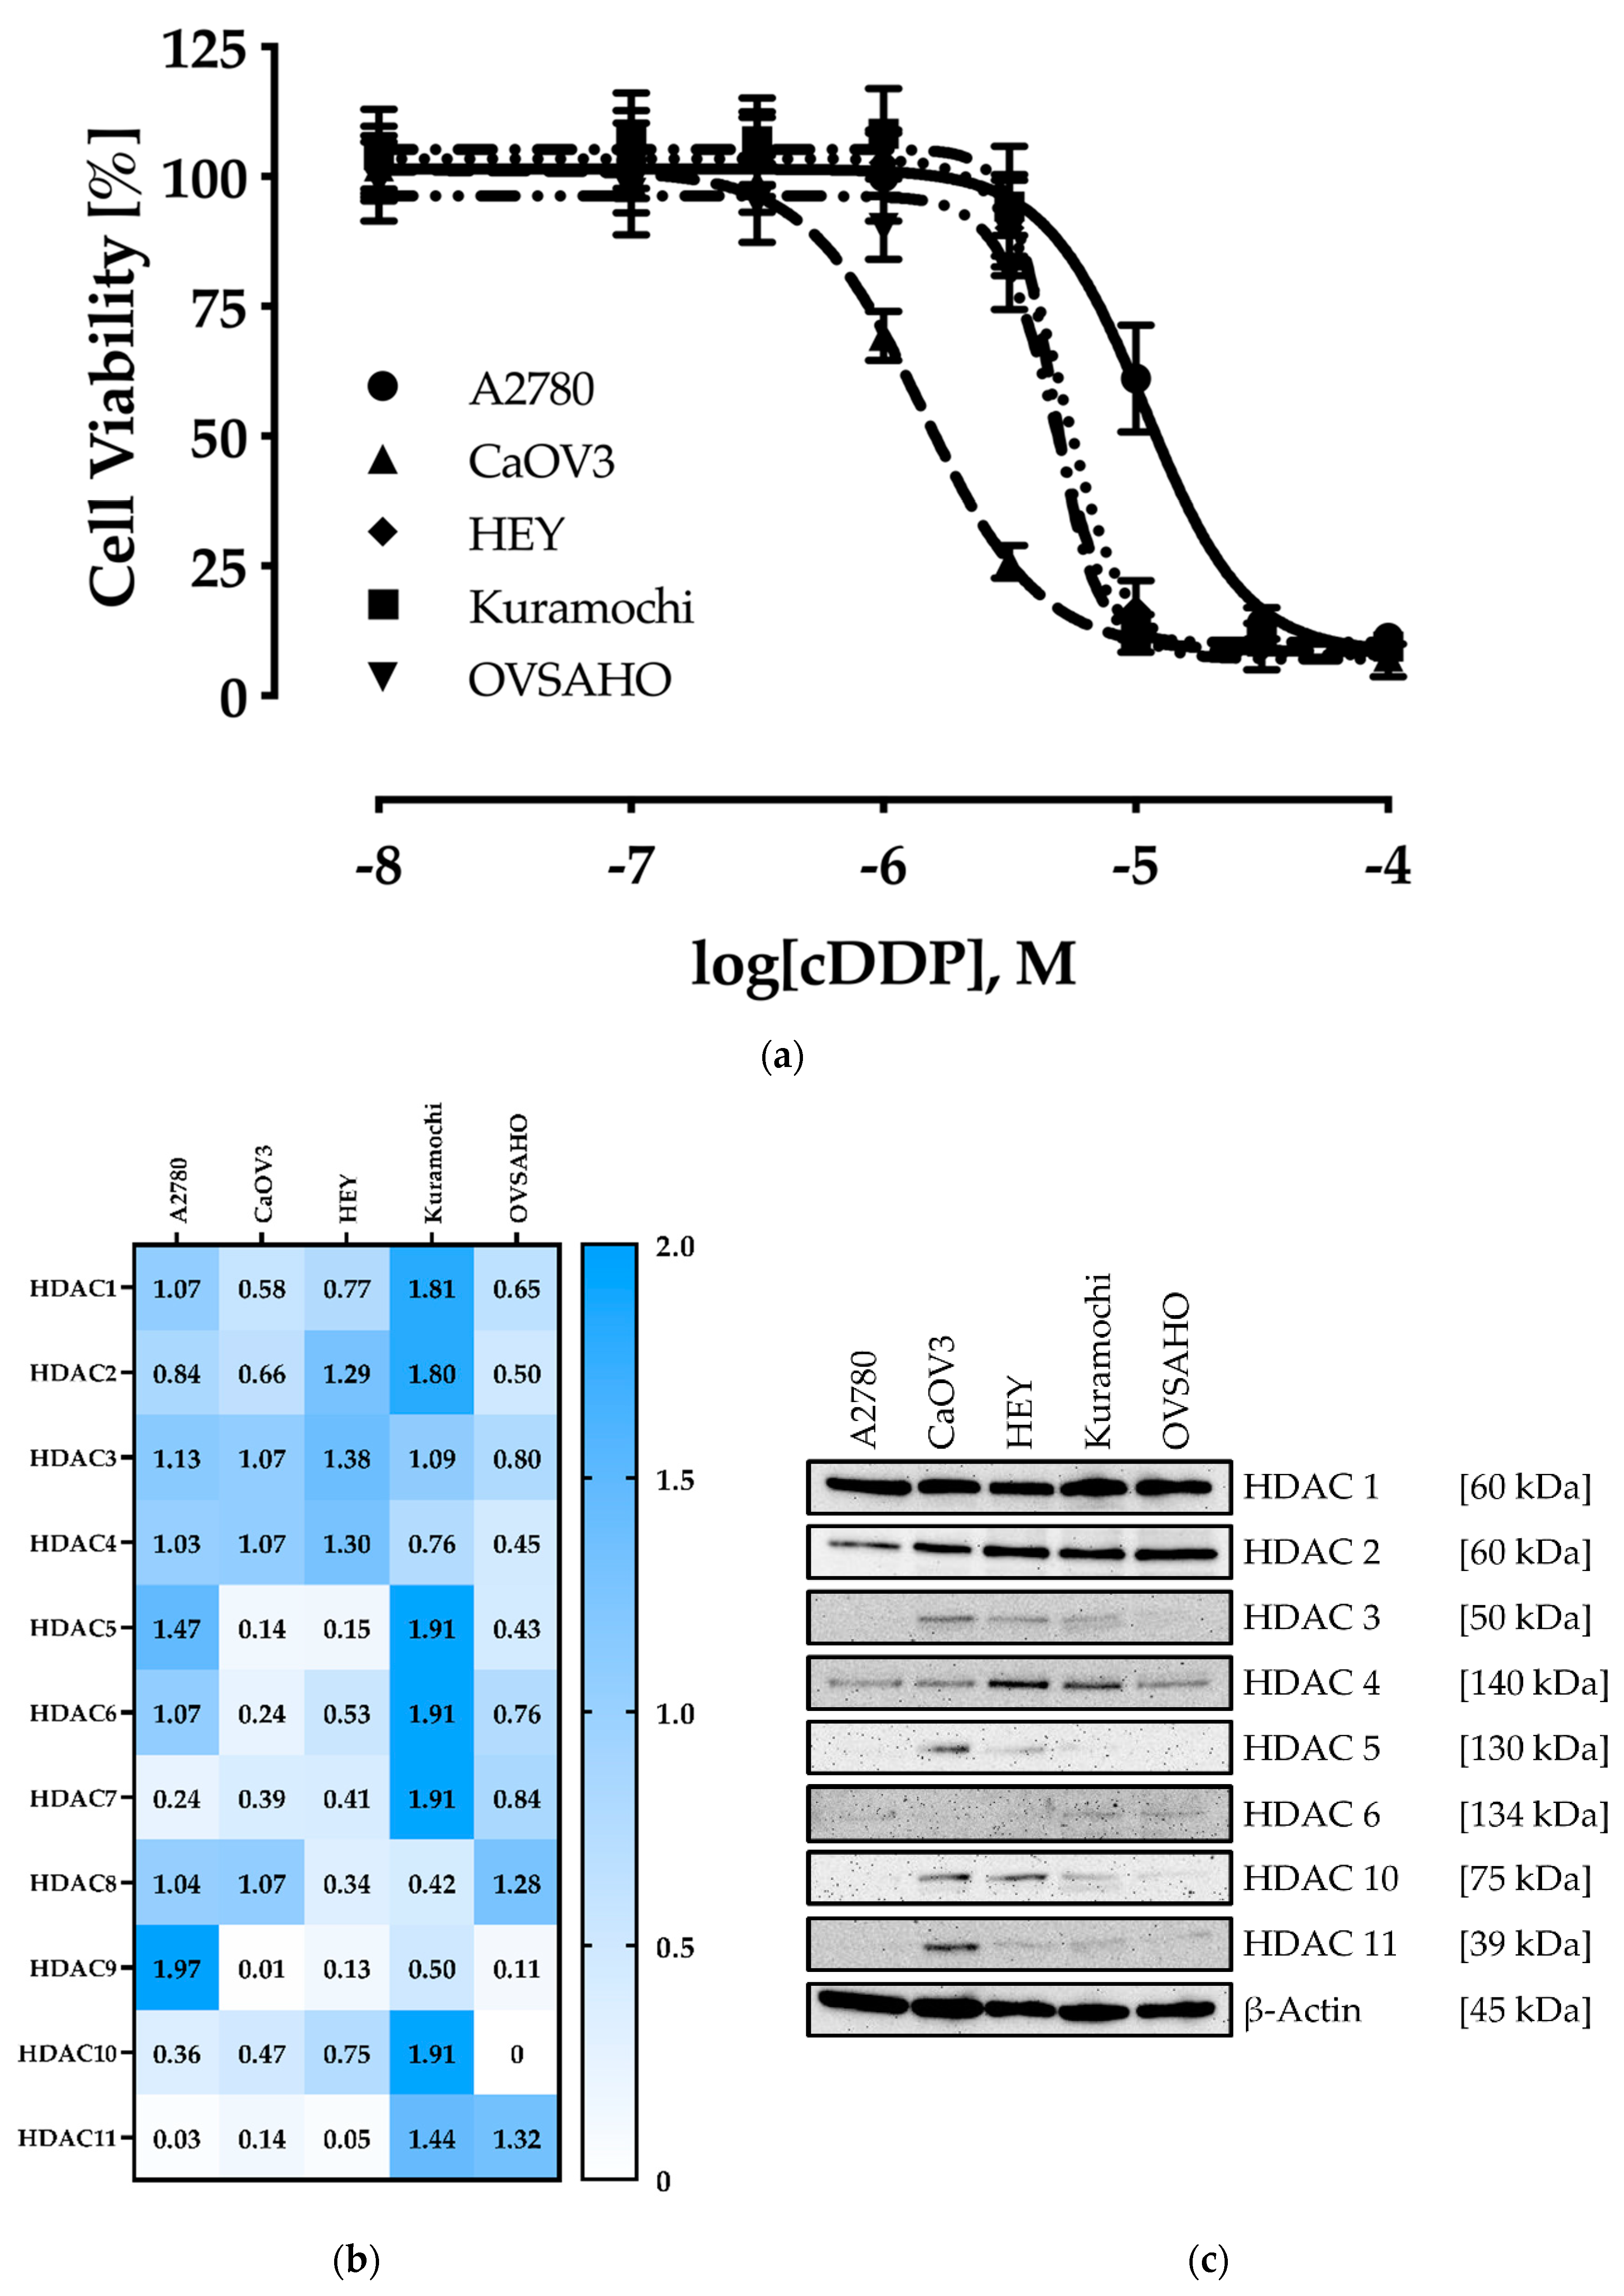
2.1. Characterization of the Human Ovarian Cancer Cell Lines

We chose the human ovarian cancer cell lines A2780, CaOV3, HEY, Kuramochi, and OVSAHO as cellular models for HGSOC (CaOV3, HEY, Kuramochi, and OVSAHO) and ovarian endometrioid adenocarcinoma type I (A2780). First, the cisplatin sensitivity of the cell lines and their HDAC expression profile (mRNA, protein) was analyzed. The results are shown in Figure 1.
IC50 values of the cell lines towards cisplatin ranged from 1.44 µM for CaOV3 up to 11.0 µM for A2780 (Figure 1A and Table 1). In literature, cisplatin plasma levels of 1.90 to 8.72 µM are reported in patients (cmax reached after 1–1.5 h) [30].
A2780 cells showed IC50-values for cisplatin in the one-digit micromolar range in previous studies [20,21,31]. Nevertheless, under the experimental conditions chosen here, an IC50-value of 11.0 µM was obtained. Based on the IC50-values, CaOV3 cells can be classified as cisplatin-sensitive, while HEY, Kuramochi, and OVSAHO cells are mediocre sensitive and A2780 cisplatin-resistant.
Regarding the HDAC enzyme expression, different patterns were obtained. At mRNA level, the cell line Kuramochi showed the highest expression of HDAC 1, 2, 5, 6, 7, 10, and 11 whereas A2780 revealed the highest expression of HDAC9. CaOV3, HEY, and OVSAHO generally showed a low expression of HDACs in comparison to Kuramochi (Figure 1B). Within a particular cell line, HDAC1-4 showed a rather high expression except for Kuramochi and A2780.
Comparing the HDAC gene expression profile with the HDAC protein expression levels, some differences become evident (Figure 1C). HDAC1 and HDAC2 are well expressed in every cell line, whereas HDAC3 was only detected (protein) in CAOV, HEY, and Kuramochi. HDAC4 (class IIa HDAC) is expressed in every cell line with a slightly higher expression in HEY and Kuramochi. HDAC5 is only expressed in CaOV3 and slightly in HEY cells. For HDAC6 and HDAC10, members of class IIb, a more heterogenous expression profile occurred. While HDAC10 is strongly expressed in CaOV3 and HEY cells, it is weakly expressed especially in Kuramochi. For HDAC6 we observed a slight expression in A2780, Kuramochi, and OVSAHO. Expression levels for HDAC11 as representative of class III HDACs show some differences, too. CaOV3 expresses HDAC11 at a higher level, HEY, Kuramochi, and OVSAHO at a very weak level, and A2780 shows no expression. For HDAC4 and HDAC6 a good correlation between mRNA and protein expression levels could be observed. In conclusion, class I HDACs HDAC1 and HDAC2 were highly expressed throughout all ovarian cancer cell lines whereas the other HDAC isoforms are expressed at a much lower level and only in some but not all cell lines (Figure 1B,C).

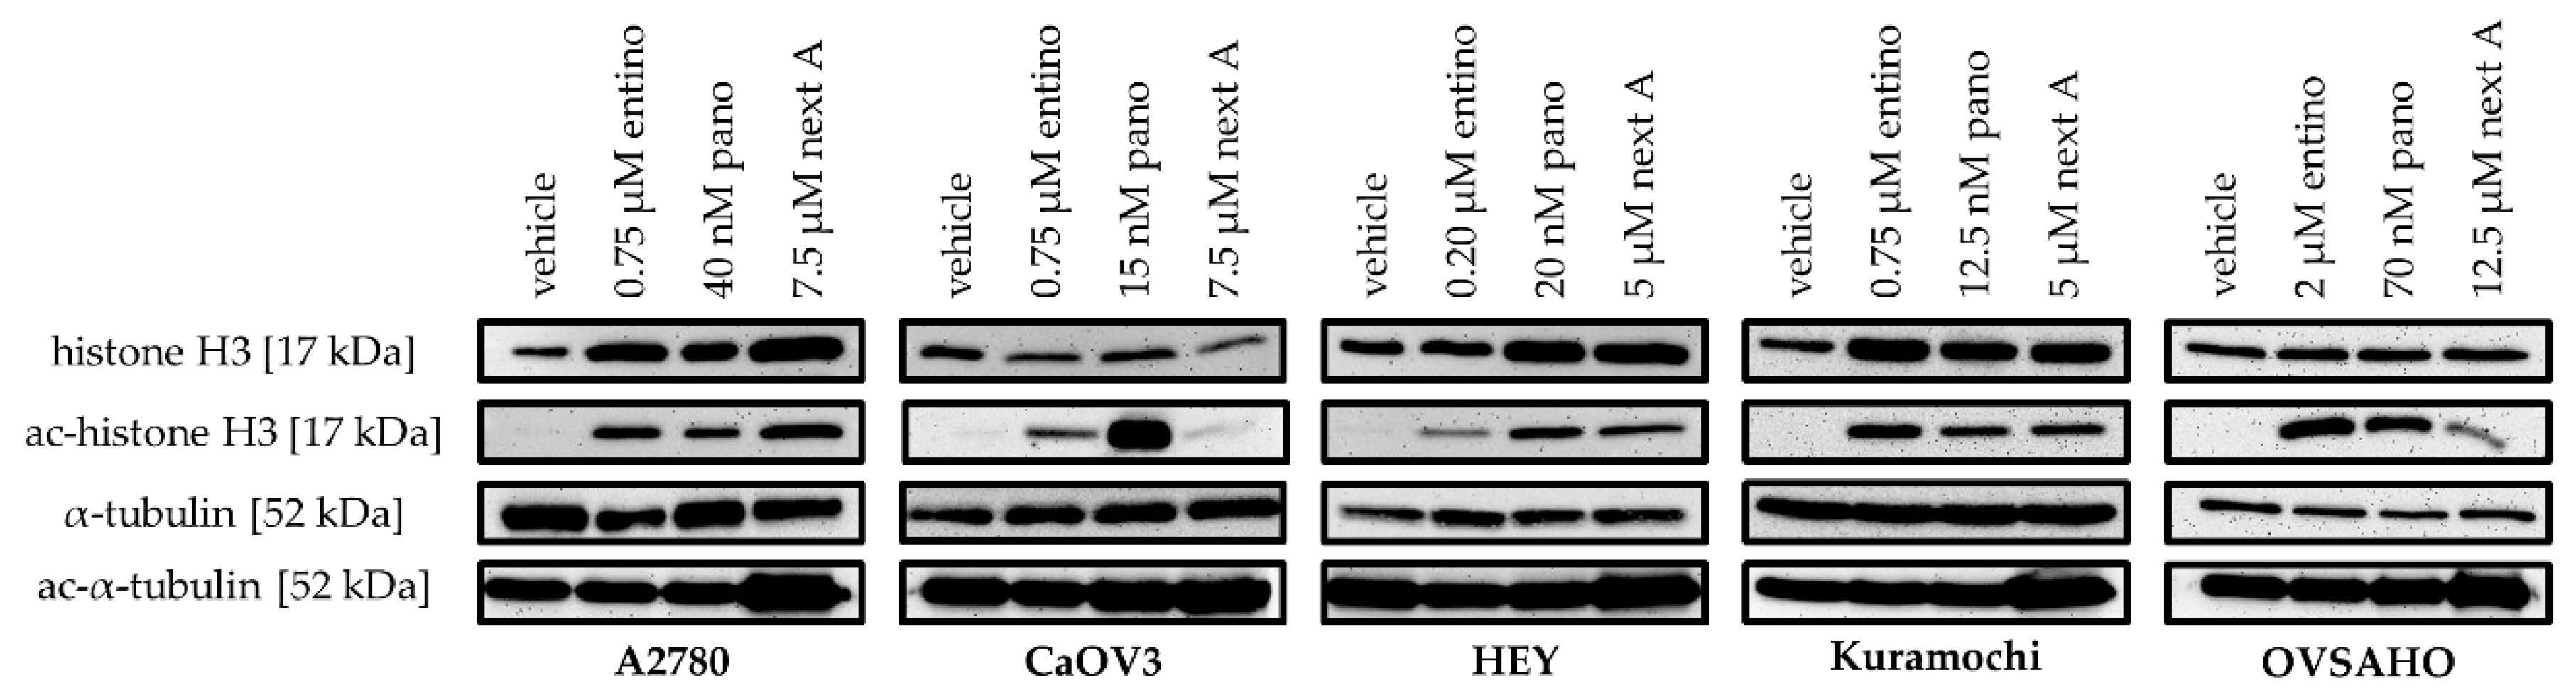
2.2. Cytotoxic and HDAC-Inhibitory Effects of Entinostat, Panobinostat, and Nexturastat A

Next, we analyzed the antiproliferative effects of entinostat, panobinostat, and nexturastat A in the ovarian cancer cell lines. Incubation times applied for the investigation of HDACi alone (absence of cisplatin) were the same as later (chapter 2.3) used in combination experiments of HDACi with cisplatin. Results are shown in Table 2.
Panobinostat showed the highest cytotoxic effects against all five cell lines with IC50-values in the low nanomolar range. Entinostat had moderate cytotoxicity with IC50-values in the submicromolar range. Nexturastat A had micromolar IC50-values. Thus, nexturastat A was not cytotoxic at concentrations where it displays HDAC6 selectivity (in the nanomolar range). To determine the HDAC inhibitory activity of entinostat, panobinostat, and nexturastat A, we performed a whole-cell HDAC inhibition assay. Results are shown in Table 3.
No significant differences were observed between the cell lines regarding the HDAC inhibitory potency of entinostat. The IC50-values for entinostat ranged from 0.22 µM in HEY cells to 0.34 µM in Kuramochi cells. As expected, panobinostat showed IC50-values in the nanomolar range. The IC50-values were between 7.88 nM for CaOV3 cells and 23.1 nM for OVSAHO cells. For nexturastat A, we obtained IC50-values in the low micromolar range and could not detect a large difference in the IC50-values between the individual cell lines. The IC50-values ranged from 3.63 µM for A2780 cells to 5.25 µM in OVSAHO cells. For confirmation of HDAC-inhibitory effects, α-tubulin and histone H3 acetylation were analyzed by western blot (Figure 2).
As can be seen, treatment with the HDACi was associated with a hyperacetylation of histone H3 indicating class I HDAC inhibitory effects. Hyperacetylation of α-tubulin is a marker for HDAC6 inhibition. Incubation with nexturastat A confirmed HDAC6 inhibition in every cell line by yielding increased levels of ac-α-tubulin.

2.3. Enhancement of Cisplatin-Induced Cytotoxicity

To investigate a possible effect of HDACi on the cisplatin sensitivity, the ovarian cancer cells were pretreated with HDACi for 48 h, respectively. After medium exchange, a 72 h treatment followed with freshly added HDACi and different concentrations of cisplatin. The concentrations of HDACi used in this combination experiment were adjusted to exert a maximum effect of 44–60% reduction of cell viability in the absence of cisplatin (i.e., a maximum reduction of the upper plateau of concentration-effect curves of 44–60%). Concentrations of HDACi used in combination treatments are shown in Table 4.
Whereas entinostat retained its class I-selective properties in the used concentration range, nexturastat A was likely to lose HDAC6 selectivity at 5–12.5 µM concentrations used in combinations with cisplatin. However, lower concentrations of nexturastat A did not have effects on the cisplatin sensitivity. To confirm the loss of selectivity of nexturastat A at high concentrations, we performed enzyme HDAC-inhibition assays with nexturastat on representative HDACs for class I, IIa, and IIb.
As can be seen in Table 5, nexturastat A is a nanomolar potency inhibitor at HDAC6 whereas the IC50-value at HDAC2 is 1.99 µM. However, using nexturastat A in combination experiments with cisplatin in concentrations ranging from 5 to 12.5 µM (Table 4) is highly likely to lead to a loss of HDAC6 selectivity. Thus, nexturastat A effects may be attributed to class I and HDAC6 inhibition rather than HDAC6 inhibition only.
Table 6 summarizes the effects of 48 h pretreatment of HDACi on the cisplatin concentration-effect curves in all ovarian cancer cell lines. Besides IC50-values of cisplatin alone, IC50-values of cisplatin in the combination with the respective HDACi are displayed. Further, shift factors (ratio of IC50-value of cisplatin and the IC50-value of the combination) were calculated and included in Table 6. Figure 3 shows the corresponding concentration-effect curves of those HDACi–cisplatin combinations that achieved the largest effect in each of the cell lines.
Only class I-selective entinostat was able to increase cisplatin potency in each cell line in a significant manner (Table 6). Even in cisplatin-sensitive CaOV3 cells, entinostat was able to induce a slight, but significant enhancement of cisplatin potency (shift factor of 2.0, Figure 3B, Table 6). Within the HGSOC cell lines, entinostat gave the highest shift factors (except for HEY and Kuramochi cells where shift factors of entinostat and nexturastat A were not significantly different from each other). Entinostat showed the strongest effect in OVSAHO cells (SF = 4.7, Table 6, Figure 3E). Notably, a similar shift factor was achieved in HEY cells (SF = 3.8) with a remarkably low pretreatment-concentration of entinostat (200 nM) whereas the other cell lines were treated with 750 nM (A2780, CAOV, Kuramochi) or even 2000 nM (OVSAHO) entinostat. Surprisingly, the pan HDACi panobinostat was not superior but even less efficacious than entinostat to increase cisplatin potency except in A2780 cells. However, A2780 do not belong to HGSOC. Nexturastat A showed similar efficacy as entinostat. However, it needs to be considered that the concentrations used for nexturastat A (5 to 12.5 µM) lead to a loss of HDAC6 selectivity. Almost complete inhibition of class I HDACs can be assumed considering the Ki values presented in Table 5. Reducing nexturastat A concentration in pretreatment to 2.5 µM led to complete loss of chemosensitizing activity in HEY cells (Figure S2).
To analyze the type of interaction between HDACi and cisplatin, synergism studies according to Chou-Talalay were performed using MTT assay [32,33]. The cell lines were incubated with varying concentrations of HDACi and cisplatin. Cells were pretreated for 48 h with HDACi alone followed by 72 h treatment with HDACi and cisplatin (termed: “48 h + 72 h”). Concentrations were chosen to achieve a fraction affected (fa; level of cell viability inhibition) between 0.2 and 0.9 in the Chou-Talalay-analysis. Combination indices (CI) were calculated and presented in Table 7.
The interactions between cisplatin and entinostat, panobinostat, or nexturastat A, respectively, were synergistic as indicated by CI-values lower than 0.9. Most CI values were lower than 0.5 indicating strong synergism.

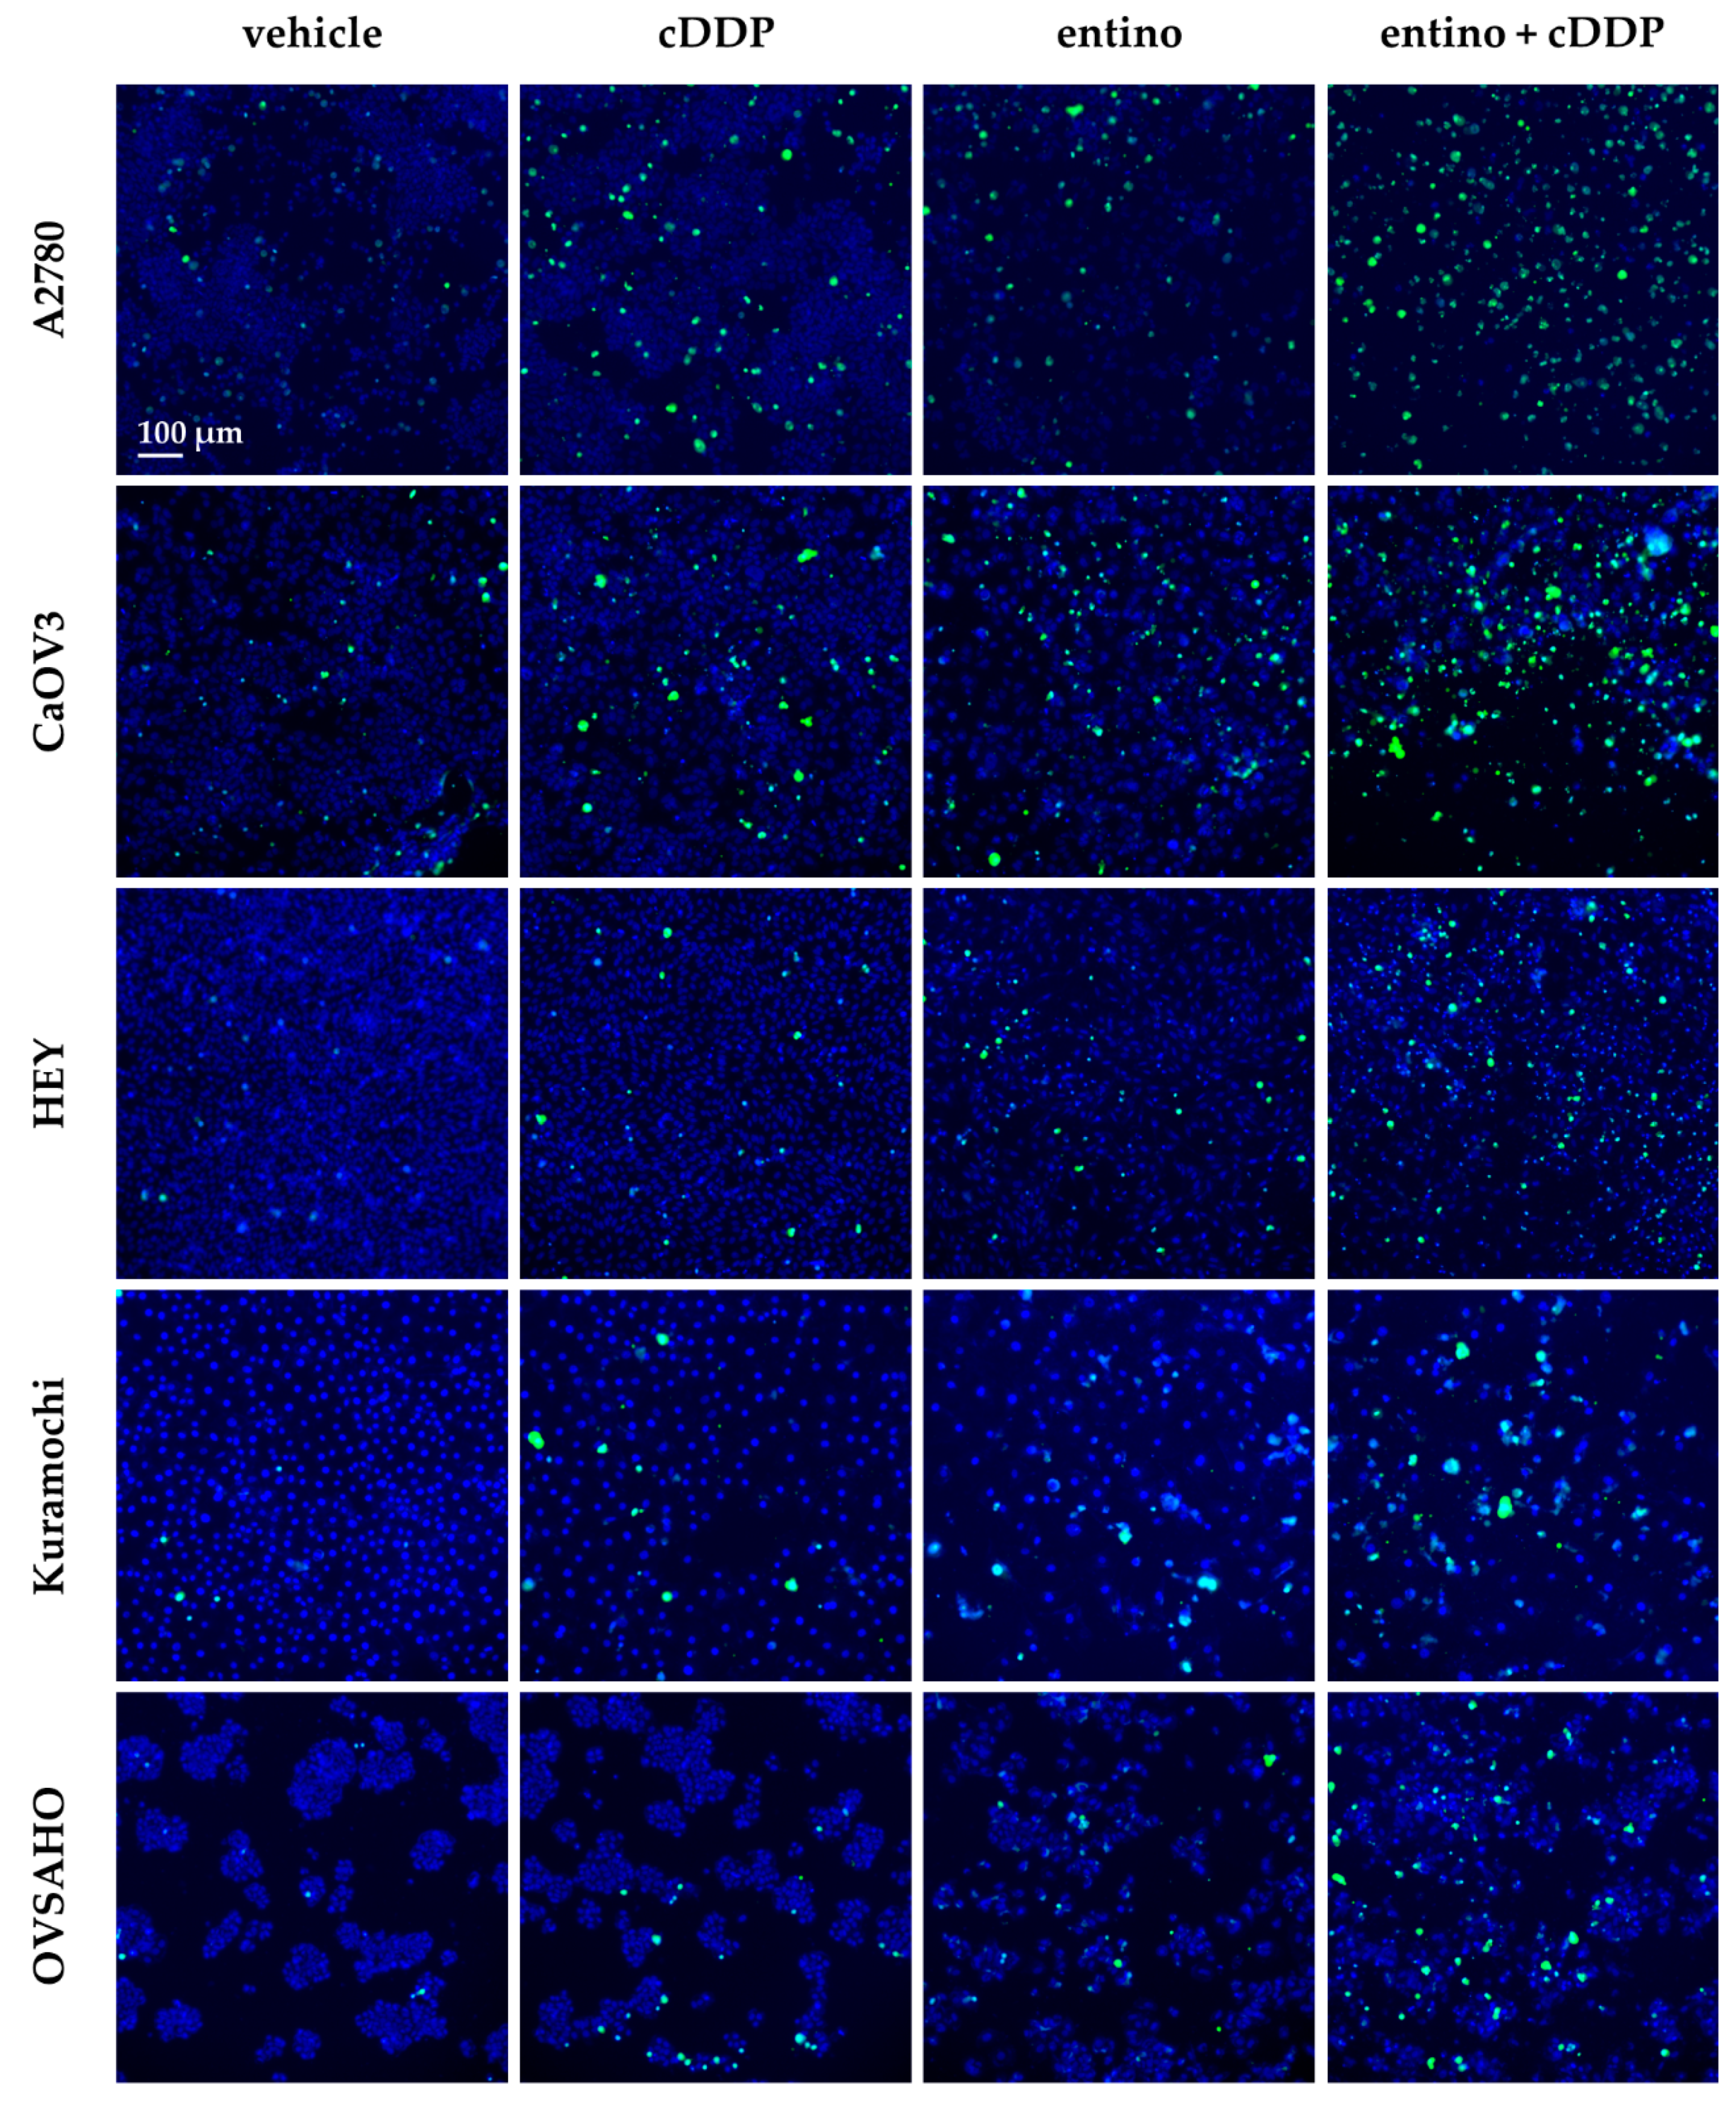
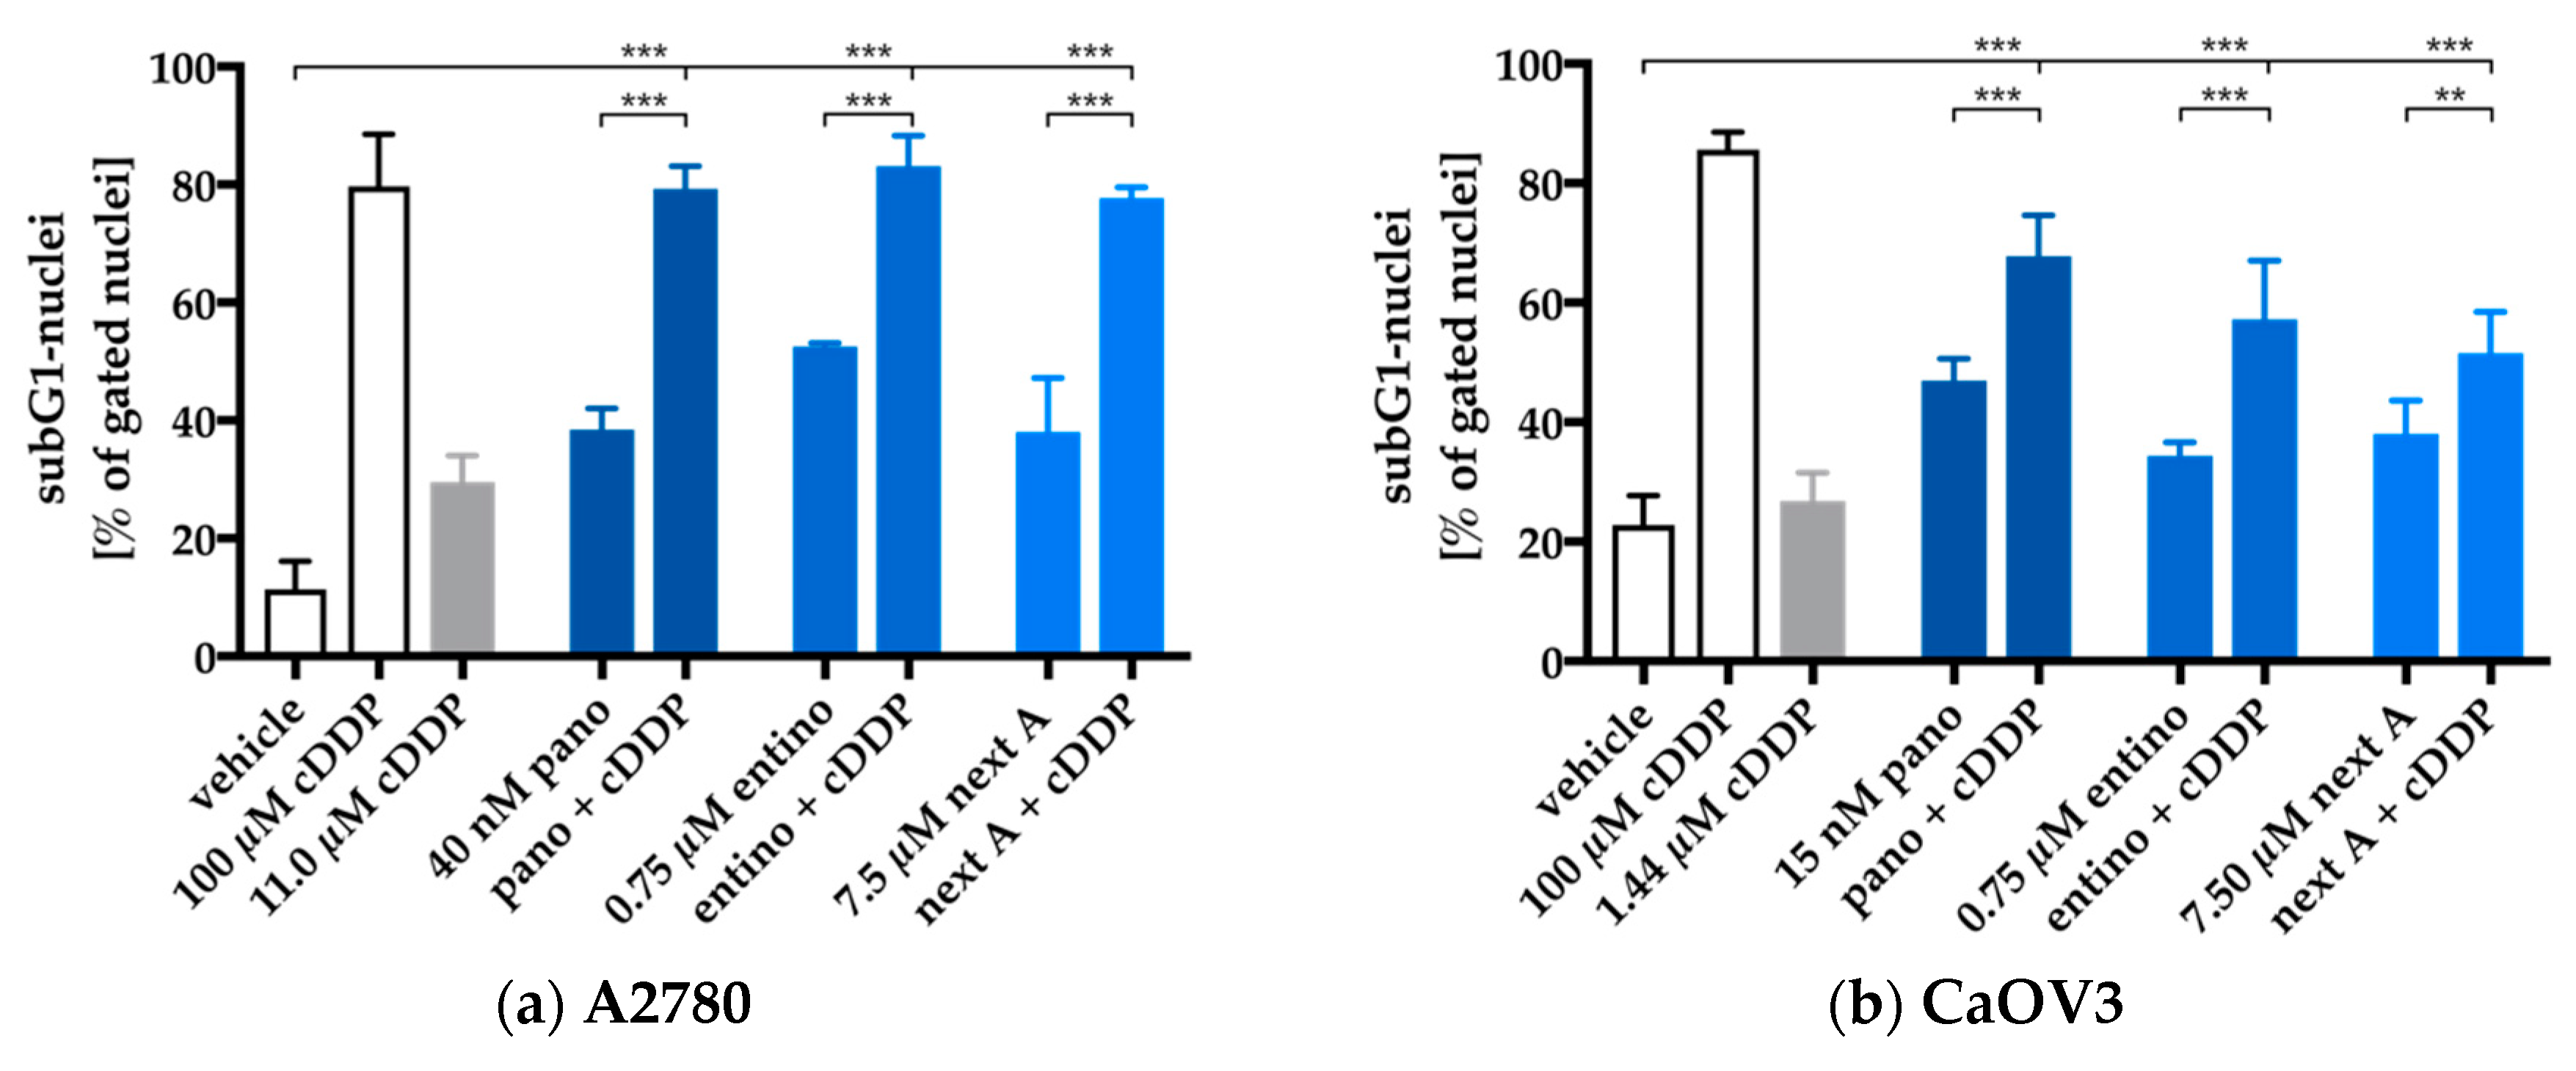
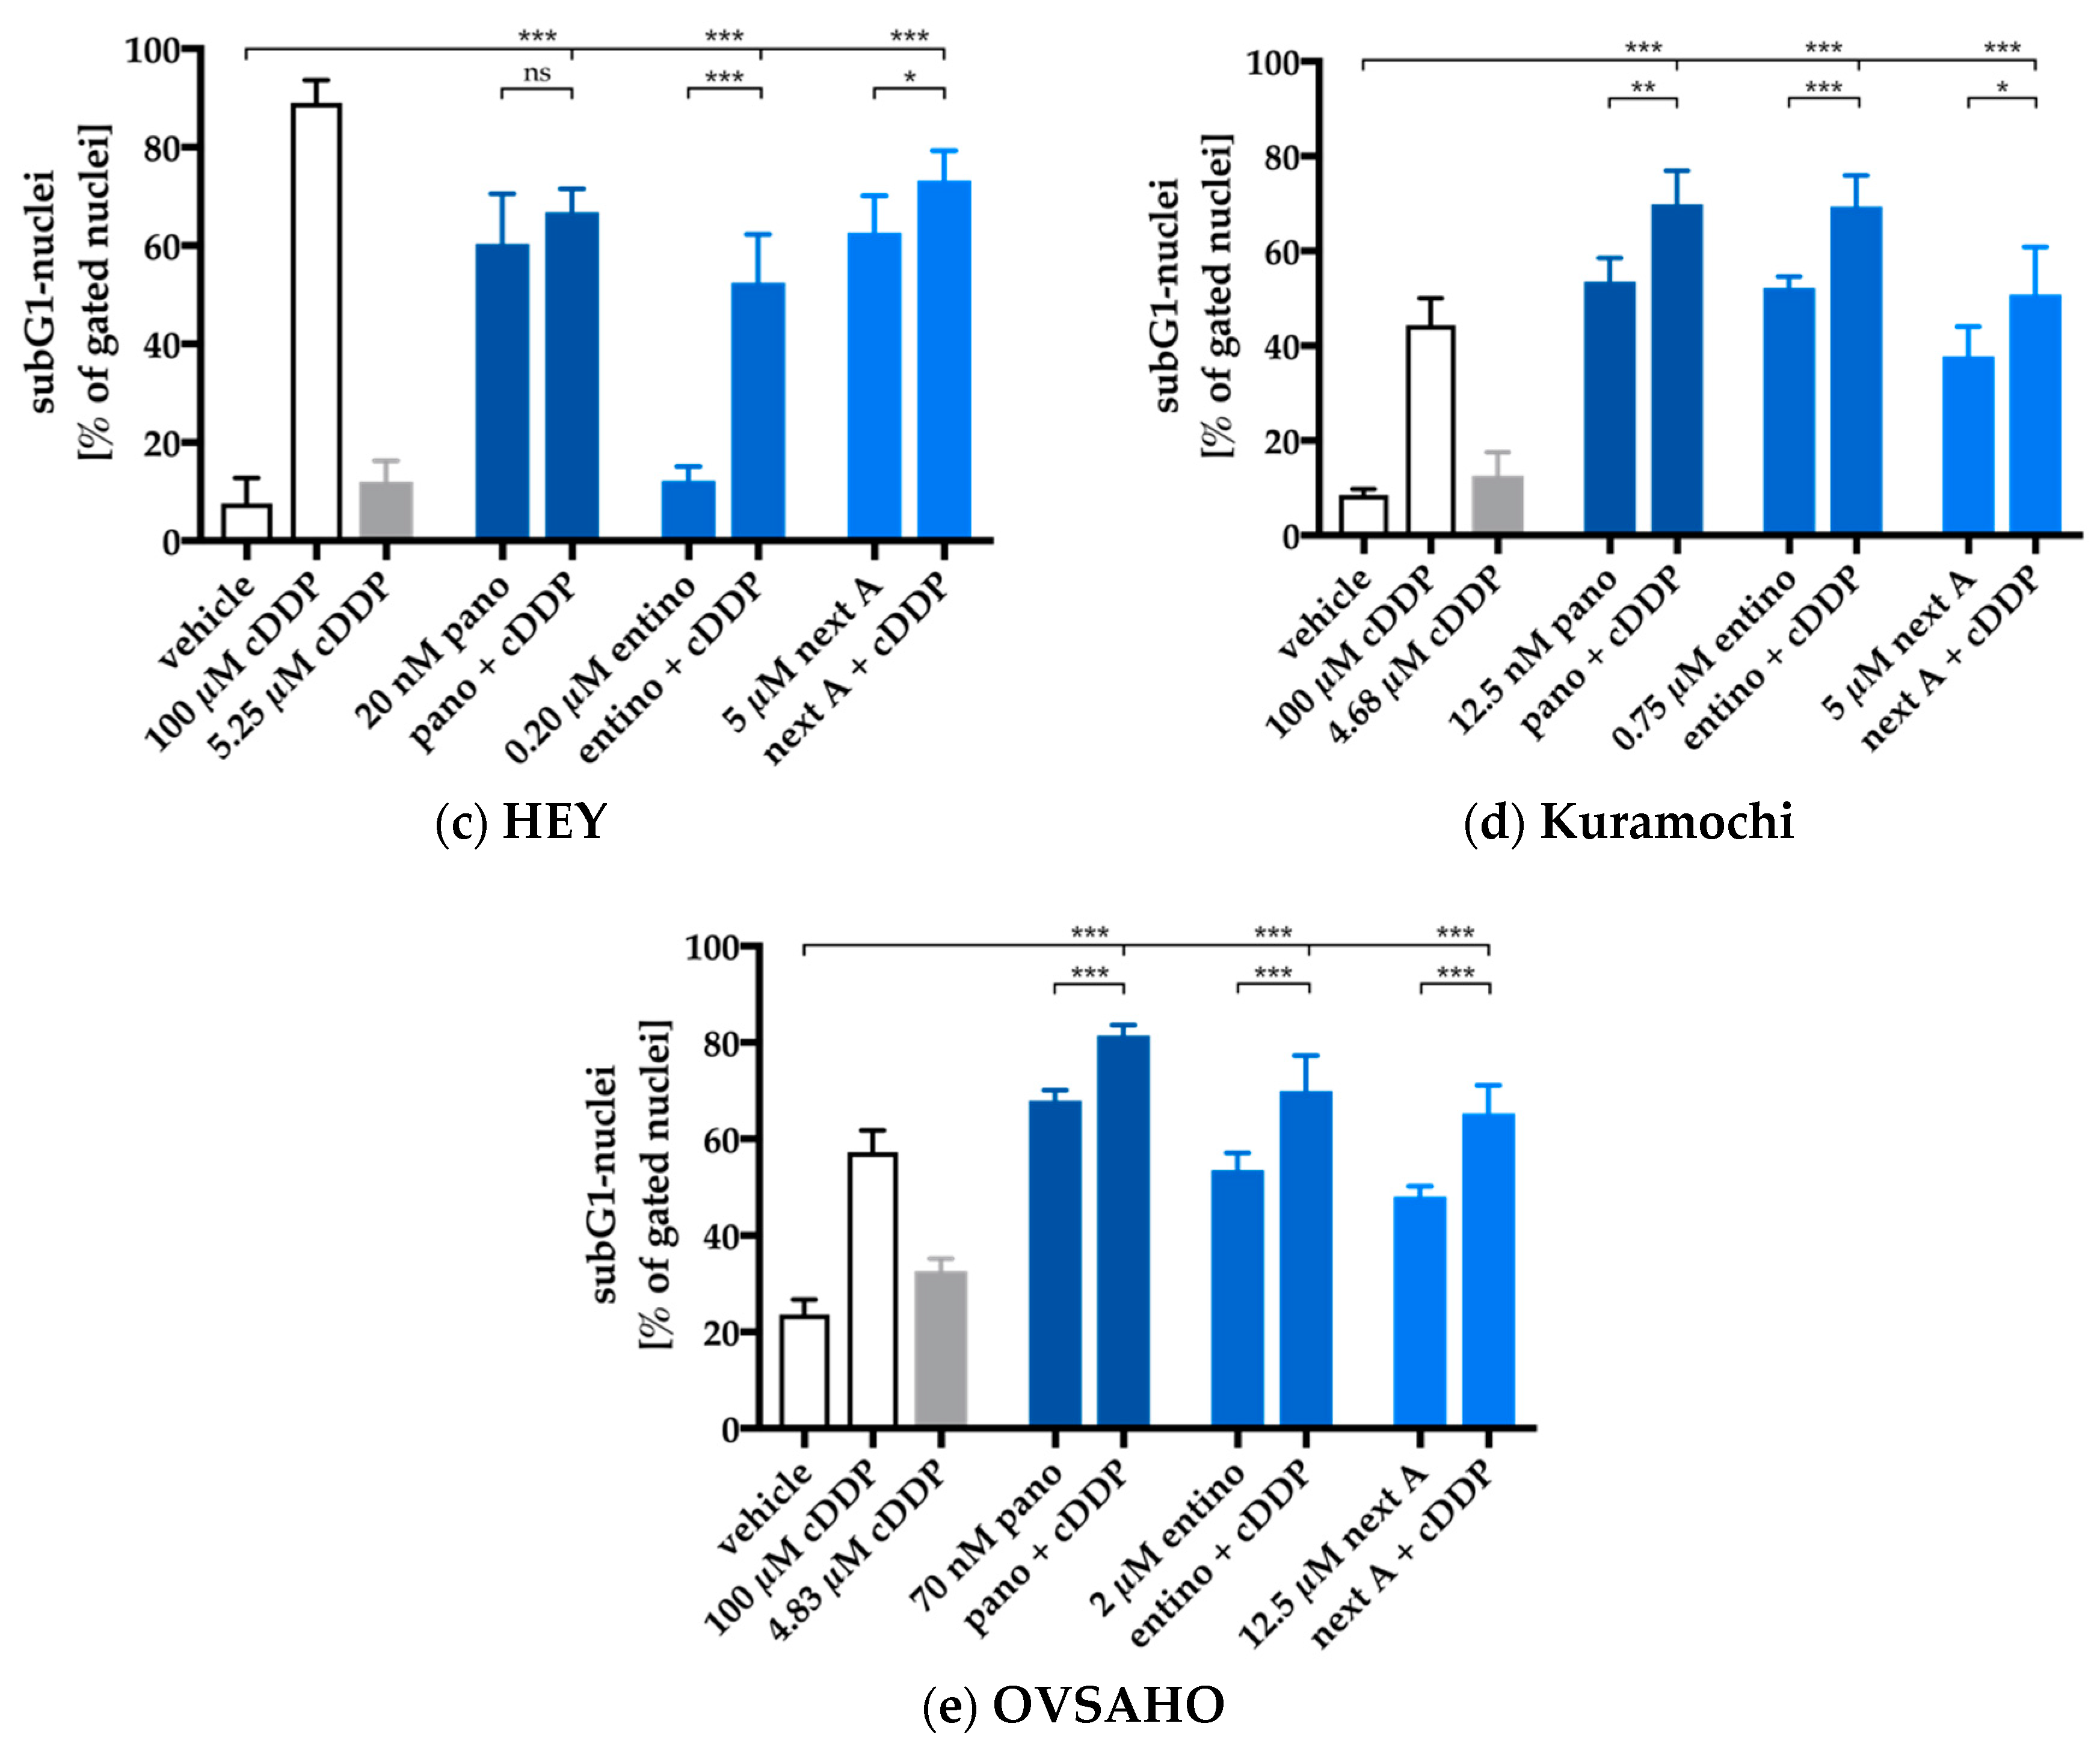
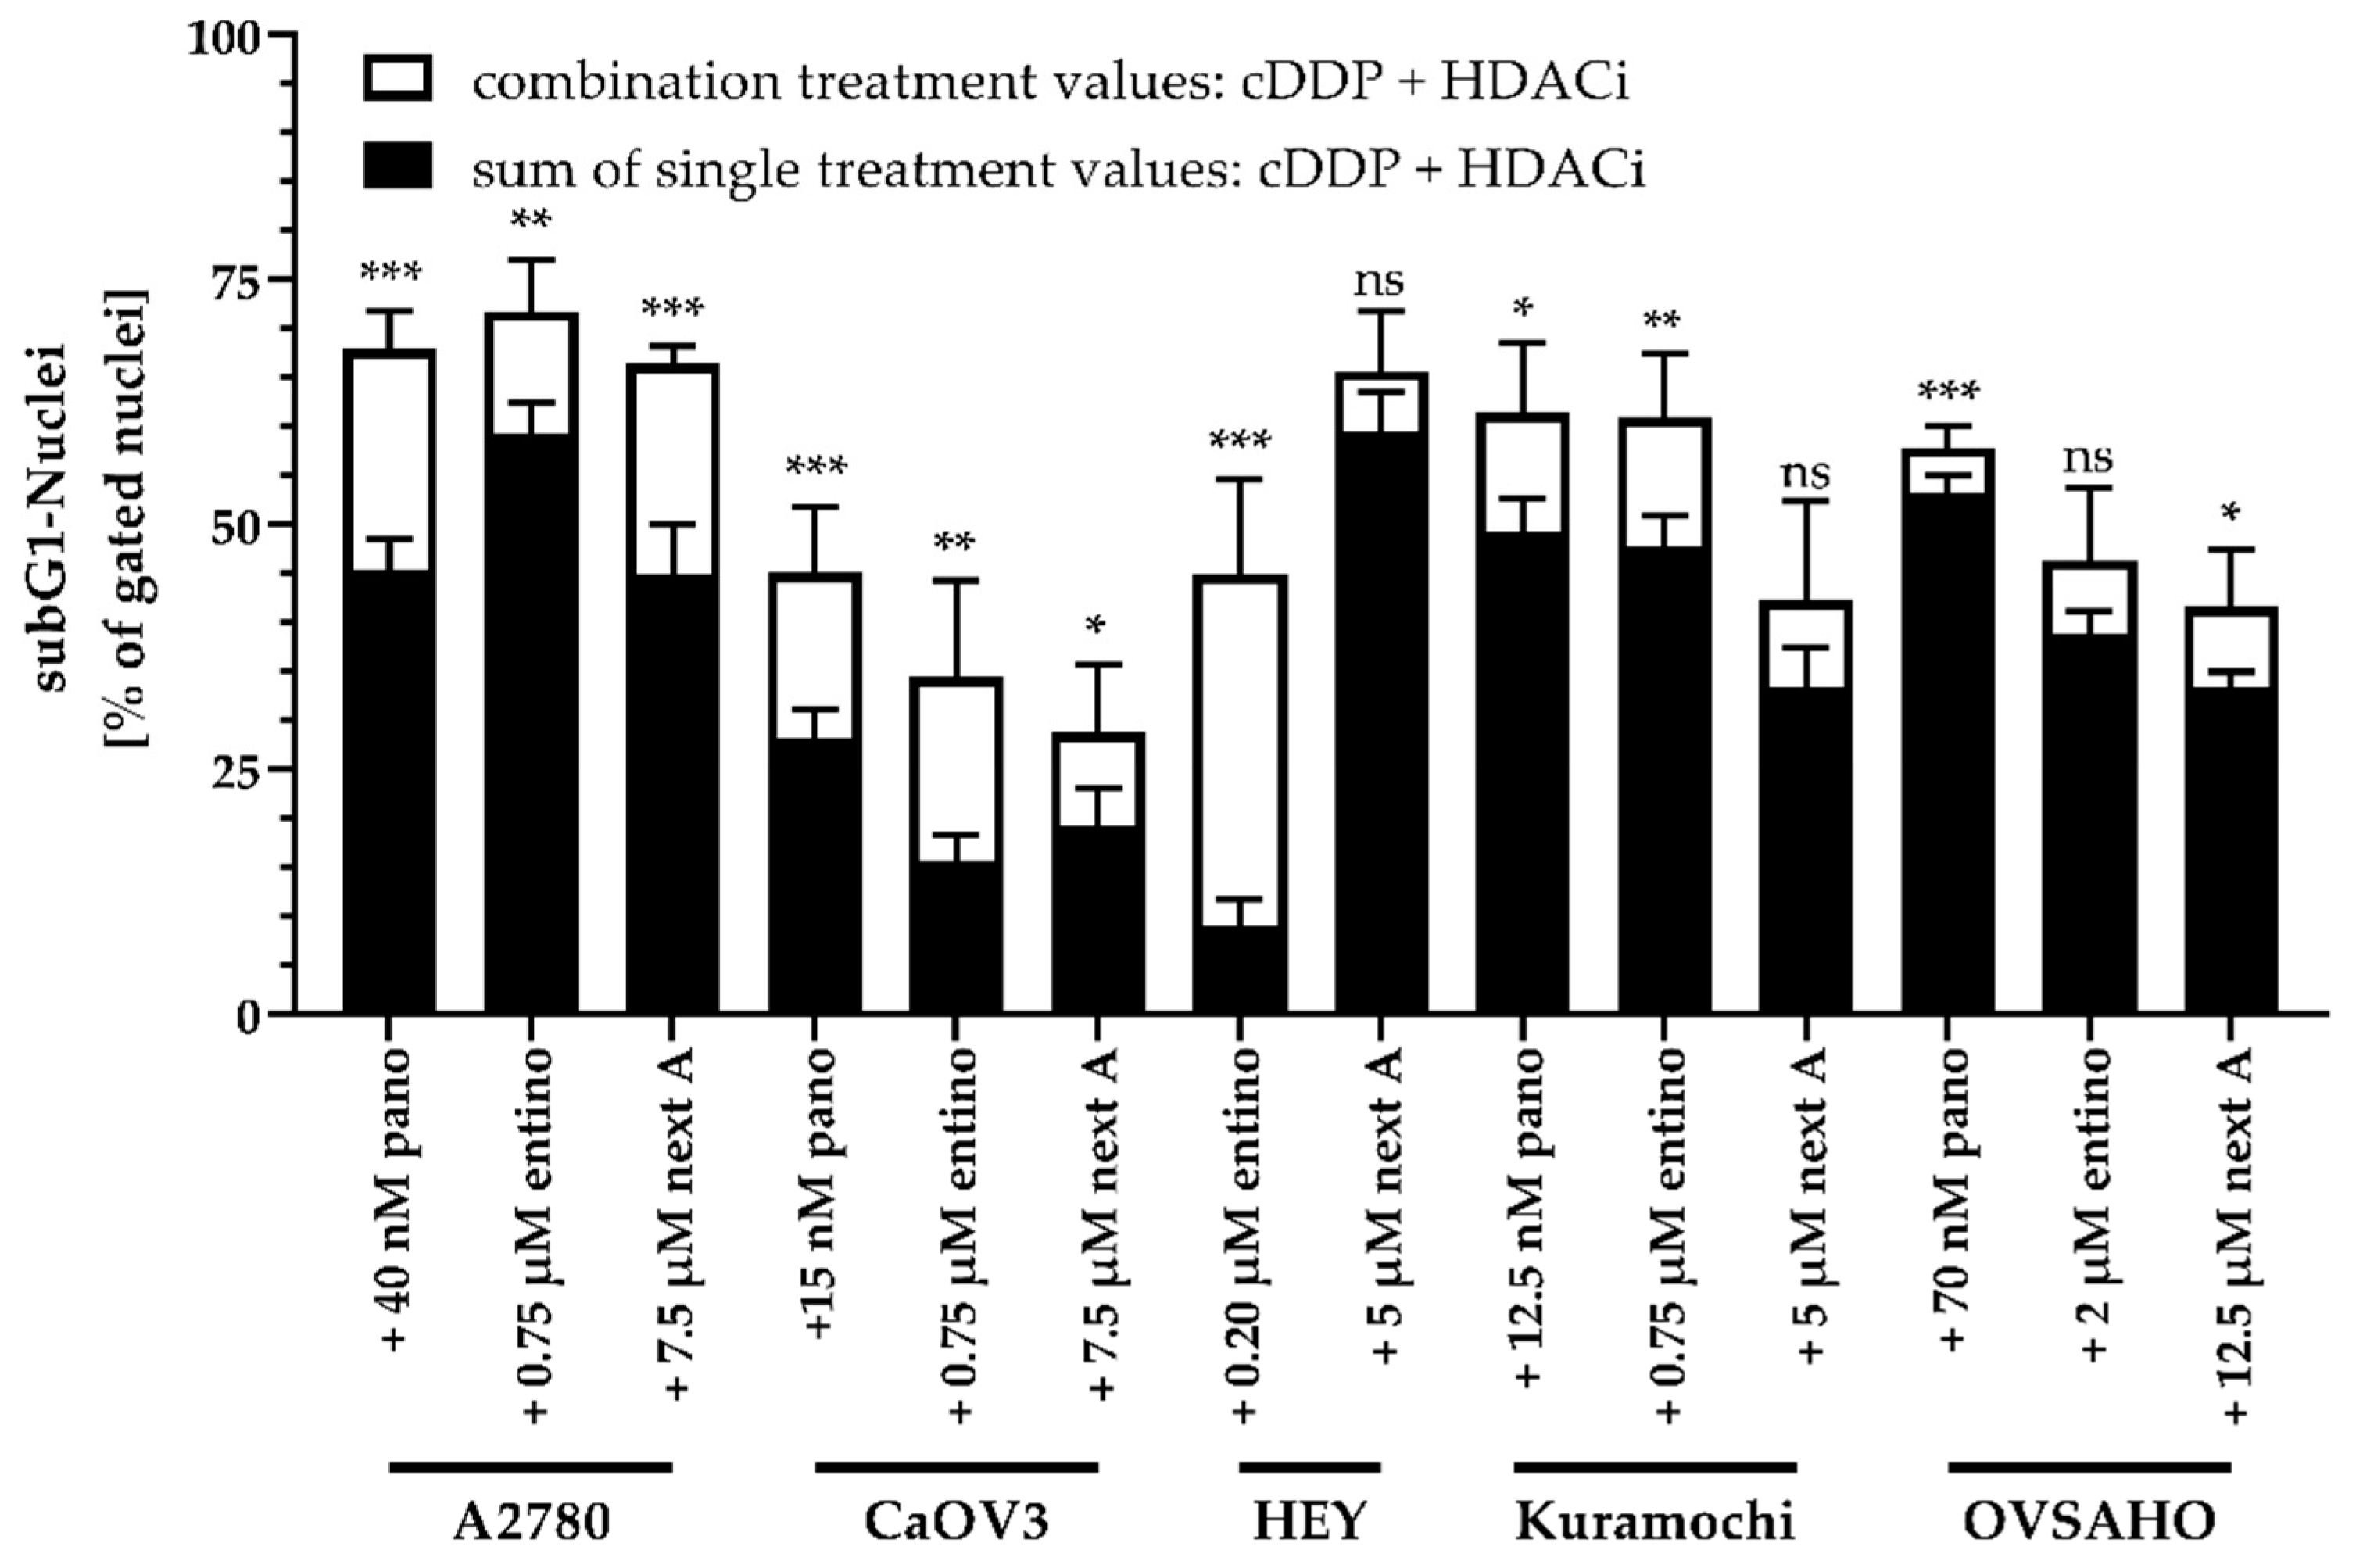
2.4. Enhancement of Cisplatin-Induced Cytotoxicity is Mediated via Apoptosis-Induction

Next, we investigated if the observed synergistic cytotoxic effect was mediated via apoptosis-induction. The cell lines were preincubated for 48 h with the same HDACi concentrations used for the MTT combination treatments (Figure 3, Table 6) followed by addition of cisplatin for another 24 h in an IC50 concentration. Then, cells were subjected to flow-cytometry-based subG1 analysis. Results are shown in Figure 4.
Single treatment with each HDACi had an equal or higher effect on apoptosis induction than treatment with cisplatin alone in each cell line. Every combination treatment showed a significant increase in apoptosis induction compared to cisplatin or HDACi alone. Only the combination of cisplatin and panobinostat in HEY cells showed no difference in apoptosis induction, possibly due to the unexpected high apoptotic effect of panobinostat alone. In order to determine whether the effects of HDACi and cisplatin combinations on apoptosis induction were hyperadditive (= synergistic), we compared the sum of the single treatment effects of HDACi and cisplatin (subG1 nuclei) with the results from the combination treatment (Figure 5). Data were only analyzed if there was a significant increase in subG1 induction in Figure 4.
Interestingly, most combinations turned out to be synergistic. Only nexturastat A in HEY and Kuramochi and entinostat in OVSAHO showed no significant difference, probably due to the larger error of the entinostat data. Entinostat showed the strongest increase in subG1 nuclei in HEY cells. Overall, these combination treatment data from apoptosis induction confirm MTT data (Table 6 and Table 7).

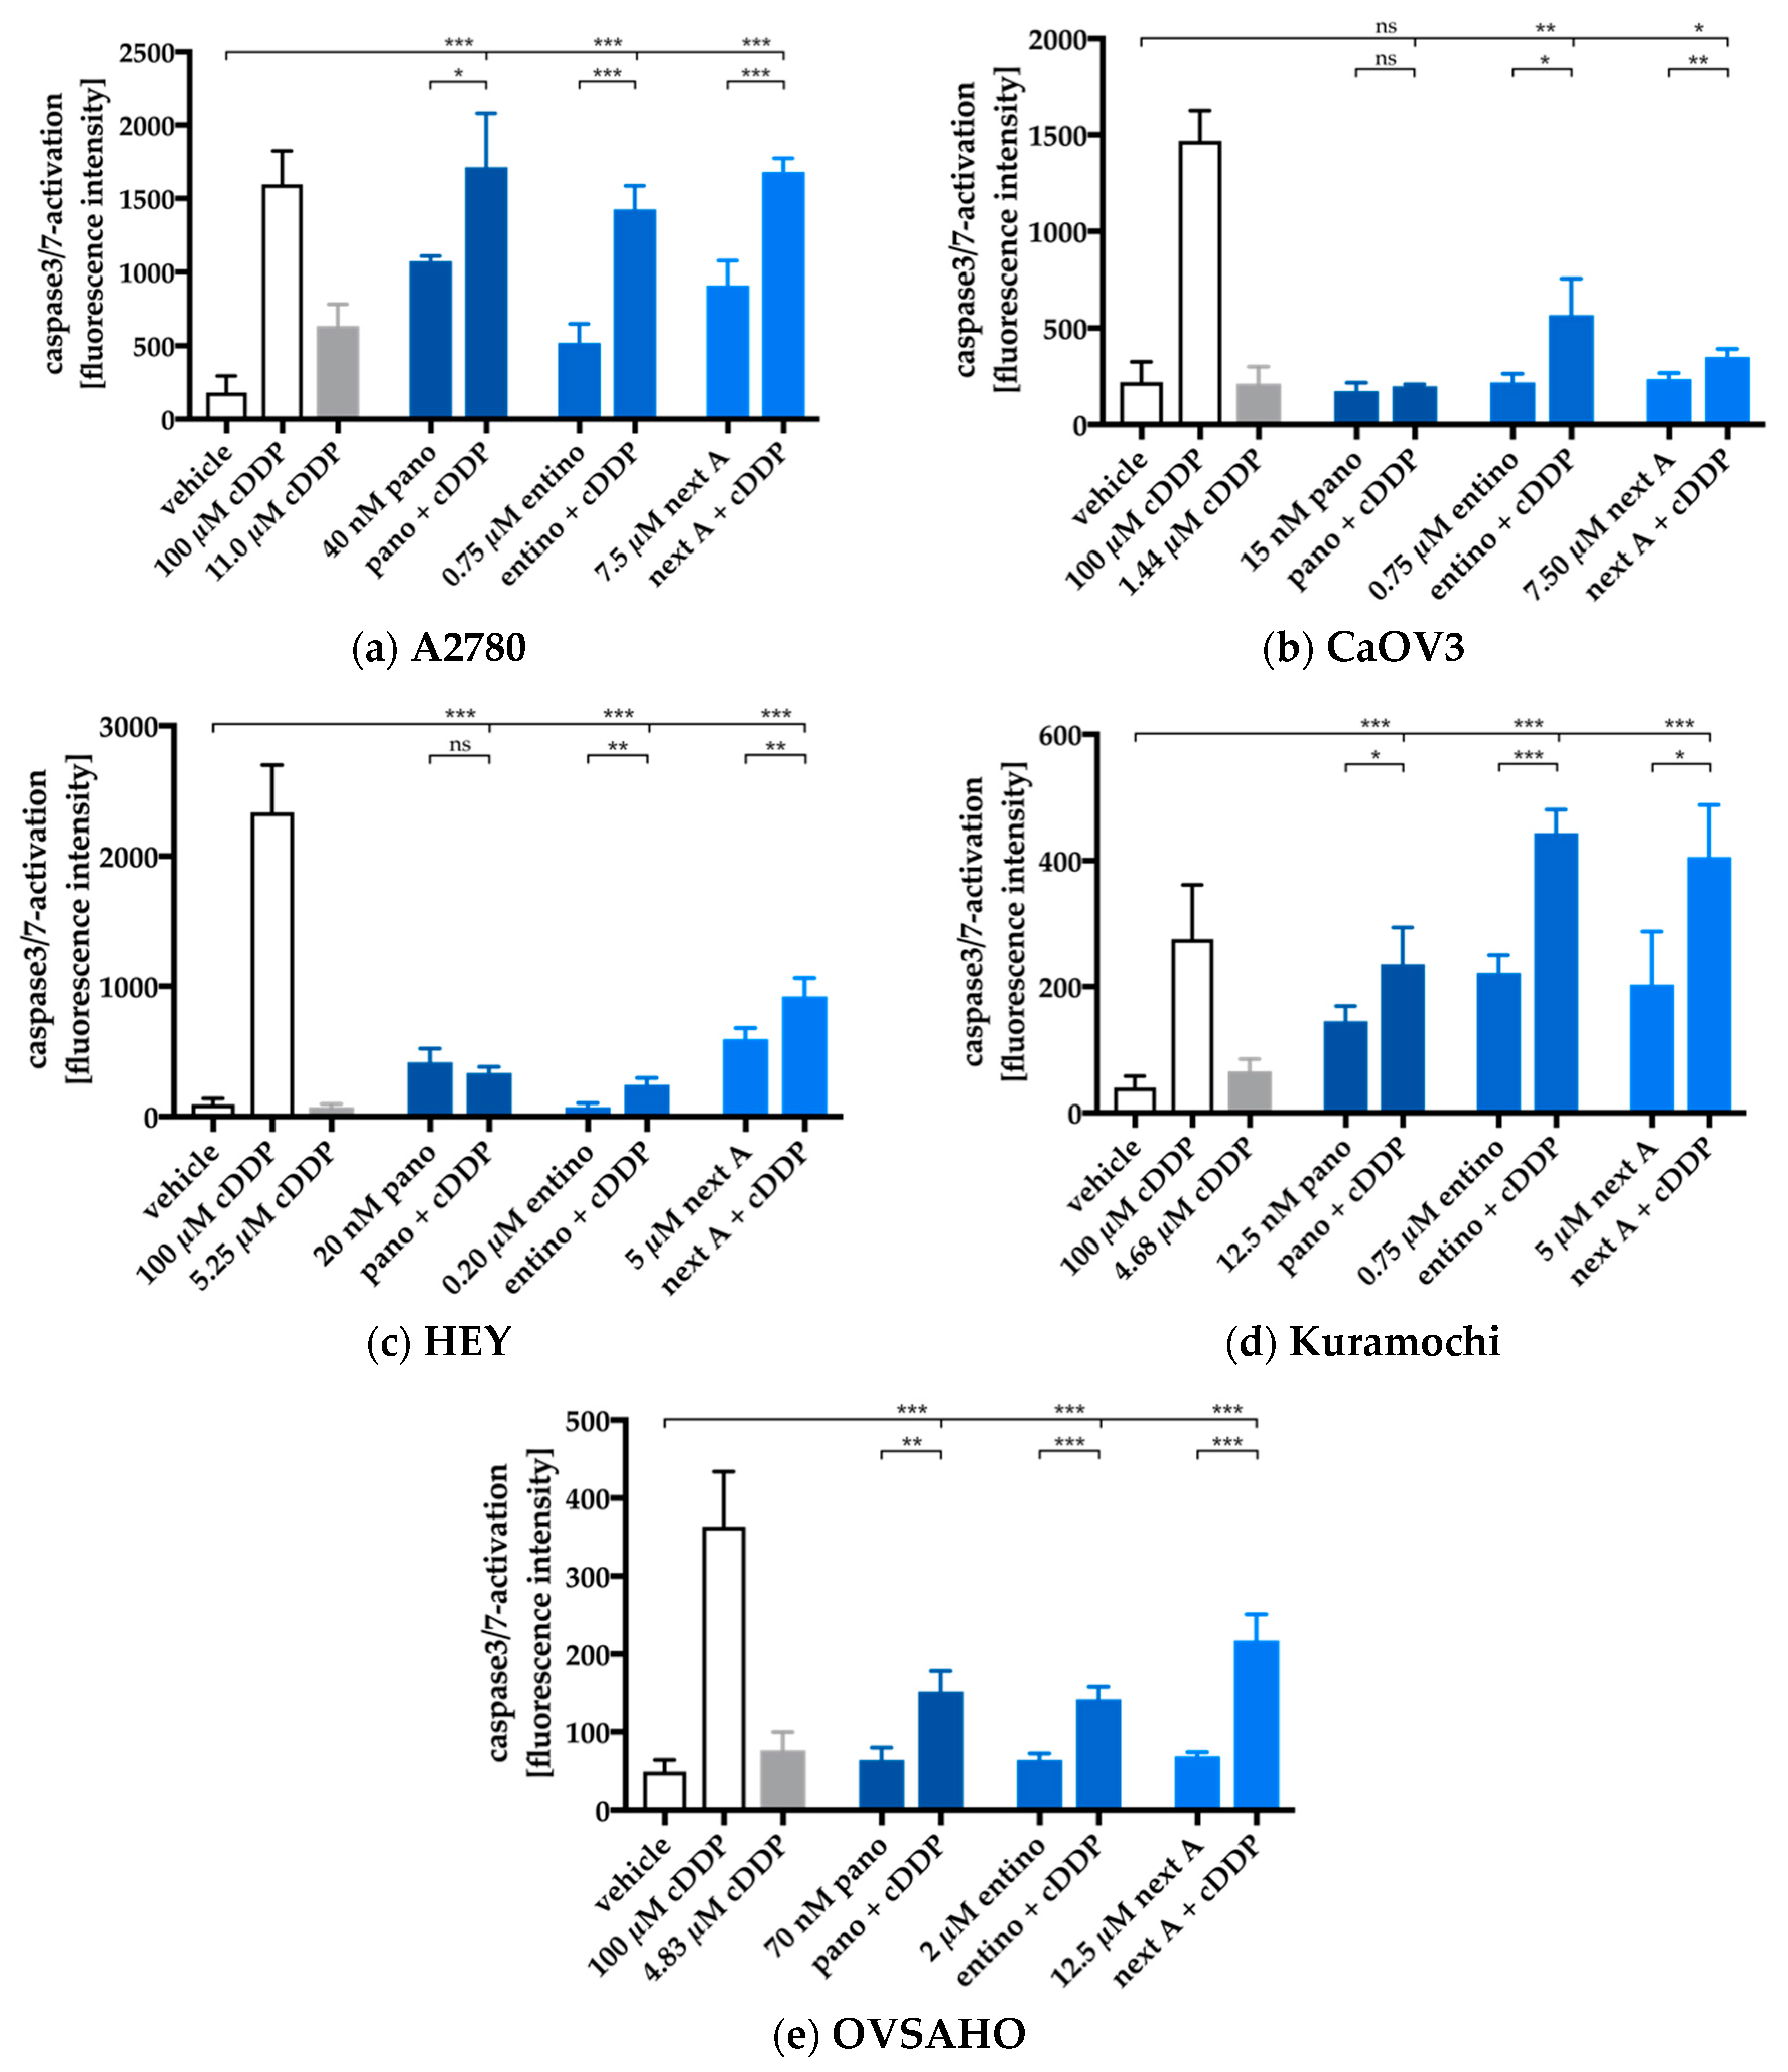
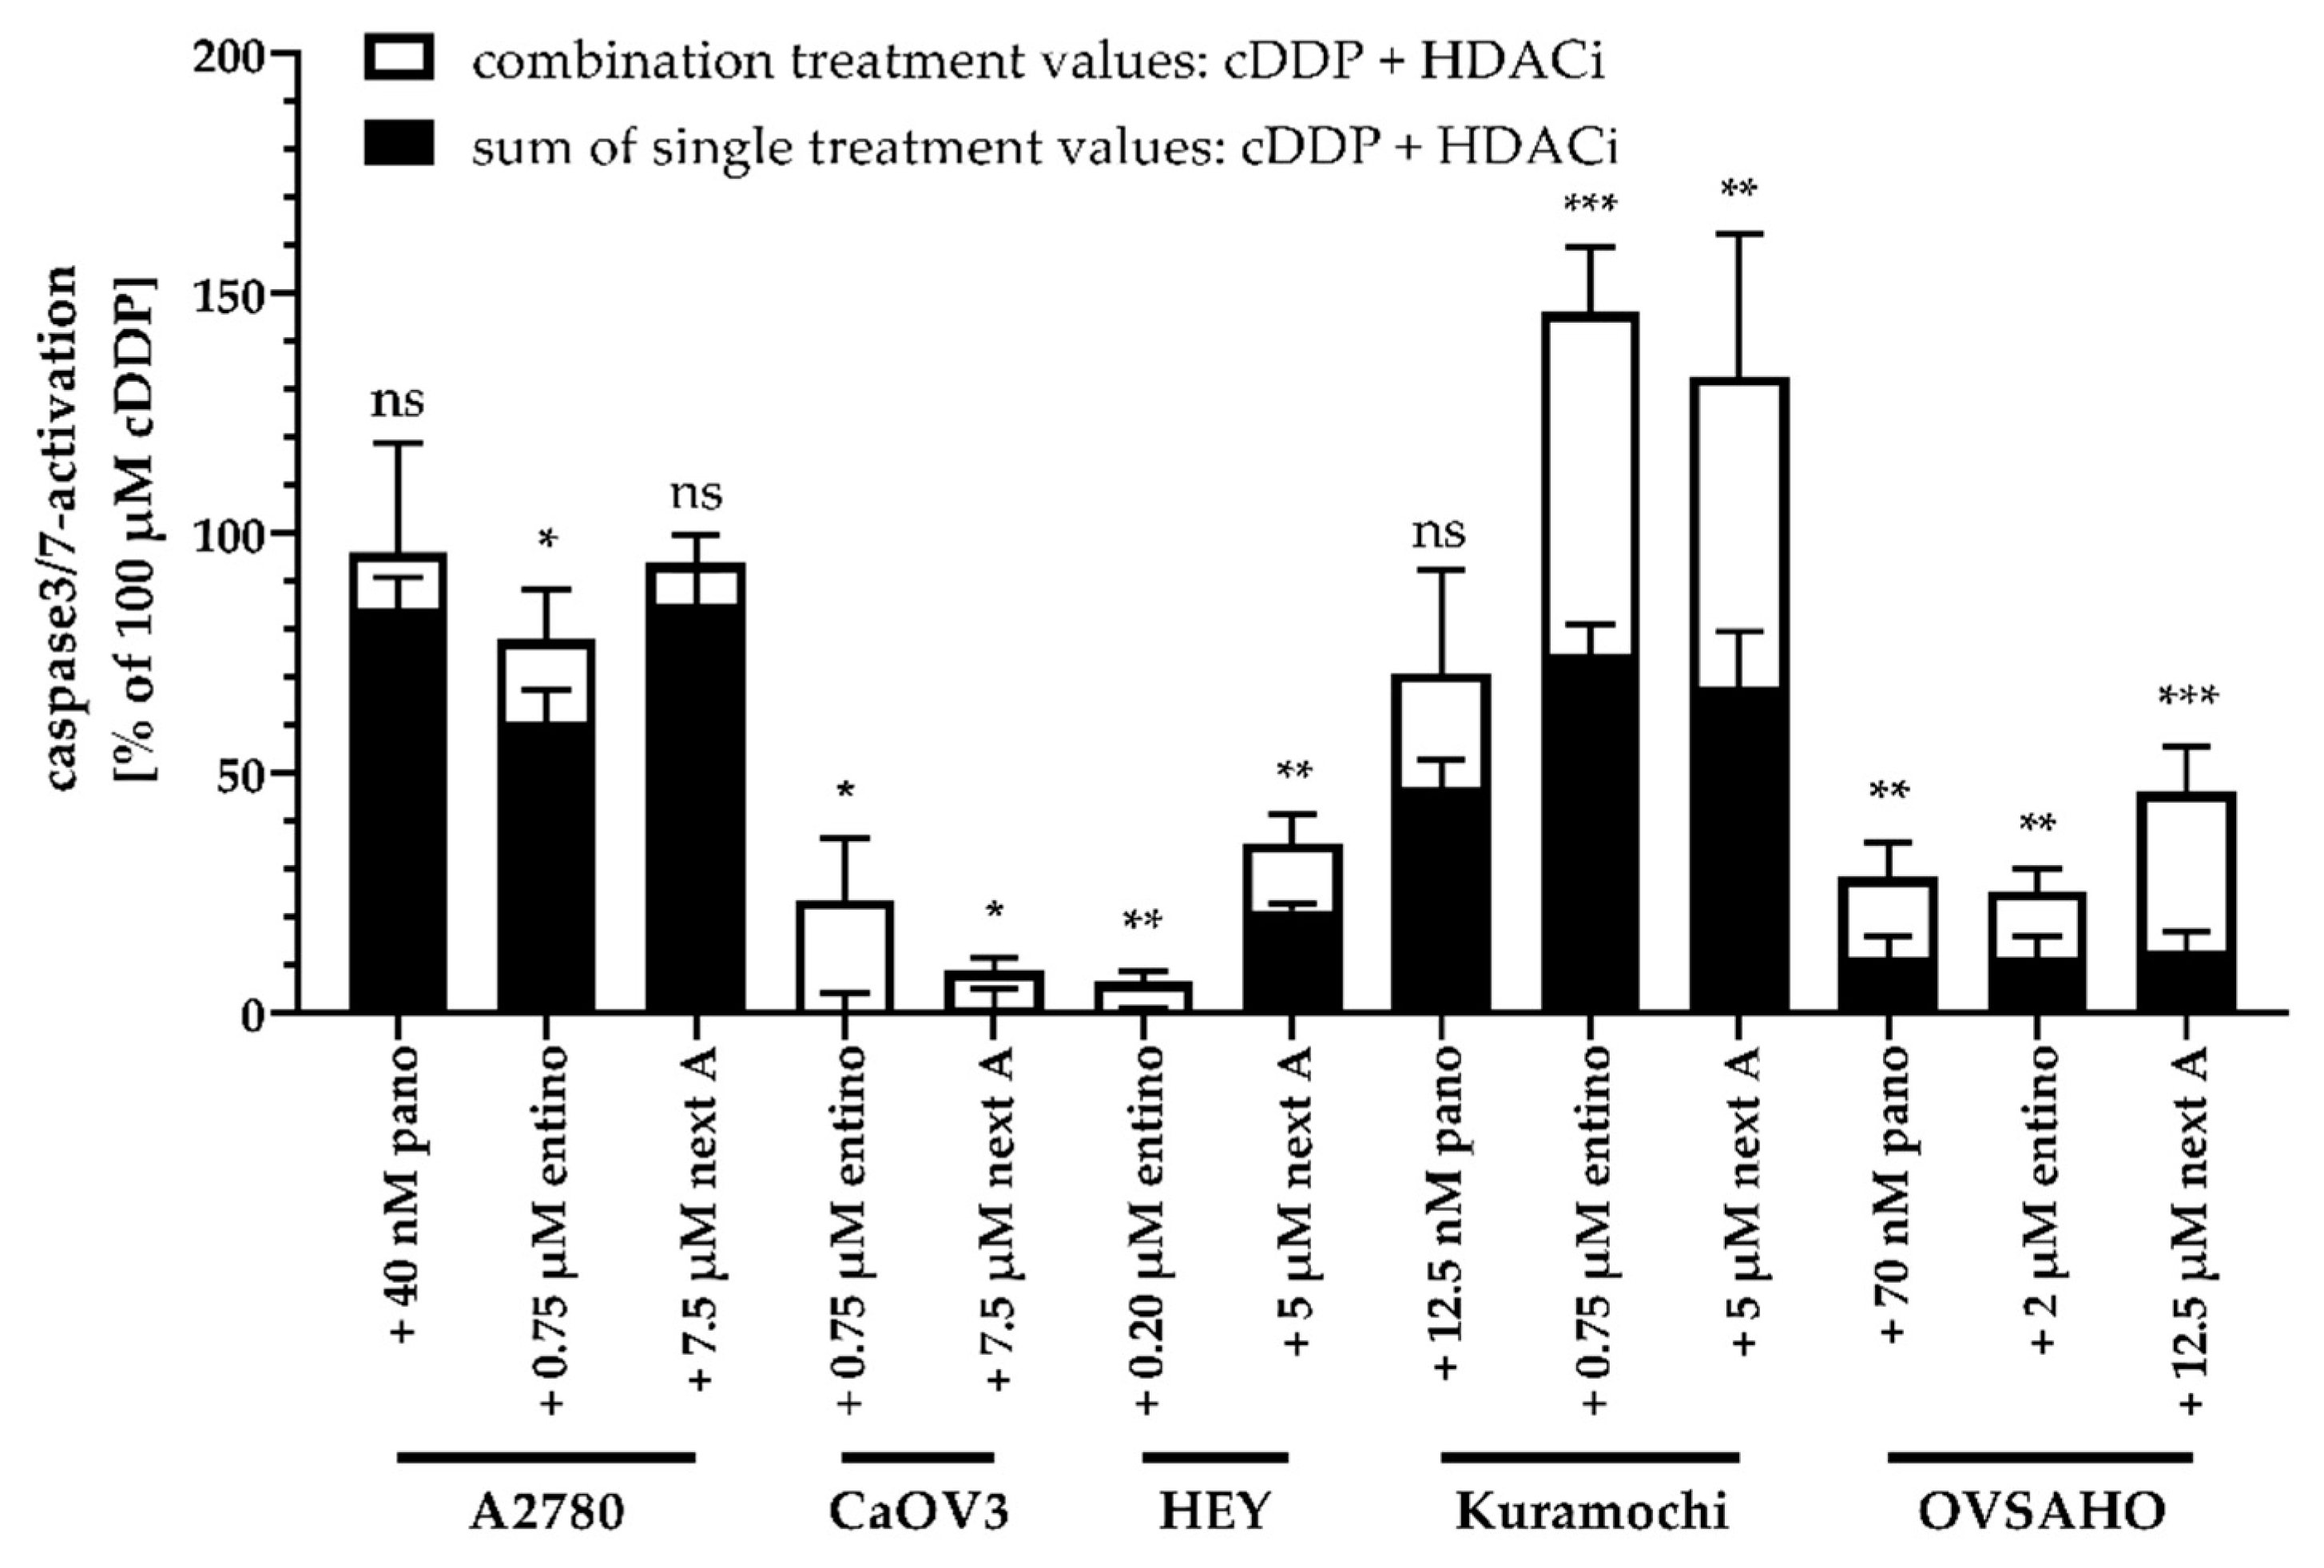
2.5. Apoptosis-Induction of the Combination Treatment is Caspase3/7-Driven

Here, we tested if apoptosis induction is caspase dependent. Caspase3/7-activation was measured by fluorescence imaging. Untreated controls, single compound and combined treatments of HDACi and cisplatin were analyzed. Figure 6 shows as an example fluorescence images for untreated control (vehicle), cisplatin, entinostat, and the combination of entinostat and cisplatin for each cell line.
Caspase3/7-activation images were monitored for all HDACi and cell lines and analyzed to obtain the results in Figure 7.
With exception of the panobinostat pretreatment in CaOV3 and HEY cells, every other experimental condition lead to an increase in caspase3/7-activation. Surprisingly, pan-HDAC-inhibition with panobinostat showed weaker effects than subtype-selective inhibition with entinostat or nexturastat A. In A2780, CaOV3, HEY, and Kuramochi cells, entinostat showed the strongest effect with exception of nexturastat A in OVSAHO. In order to determine whether the significant effects in caspase3/7-activation are synergistic, we compared the sum of the single treatment effects of HDACi and cisplatin (caspase3/7-activation) with the results from the combination treatments (Figure 8). Data were only analyzed if there was a significant increase in caspase3/7-activation in Figure 7.
Entinostat showed a significant synergistic effect on caspase3/7-activation in combination with cisplatin in every cell line. This synergism was mostly pronounced in Kuramochi cells as it reached the largest caspase3/7-activation. Caspase3/7-activation revealed a difference between the A2780 and the HGSOC cell lines. While in A2780 cells only entinostat triggered a synergistic effect (caspase3/7-activation) with cisplatin, both, entinostat and nexturastat A showed synergism with cisplatin in all HGSOC cell lines. However, it needs to be considered that nexturastat A was not HDAC6 selective in the concentrations used in this assay.

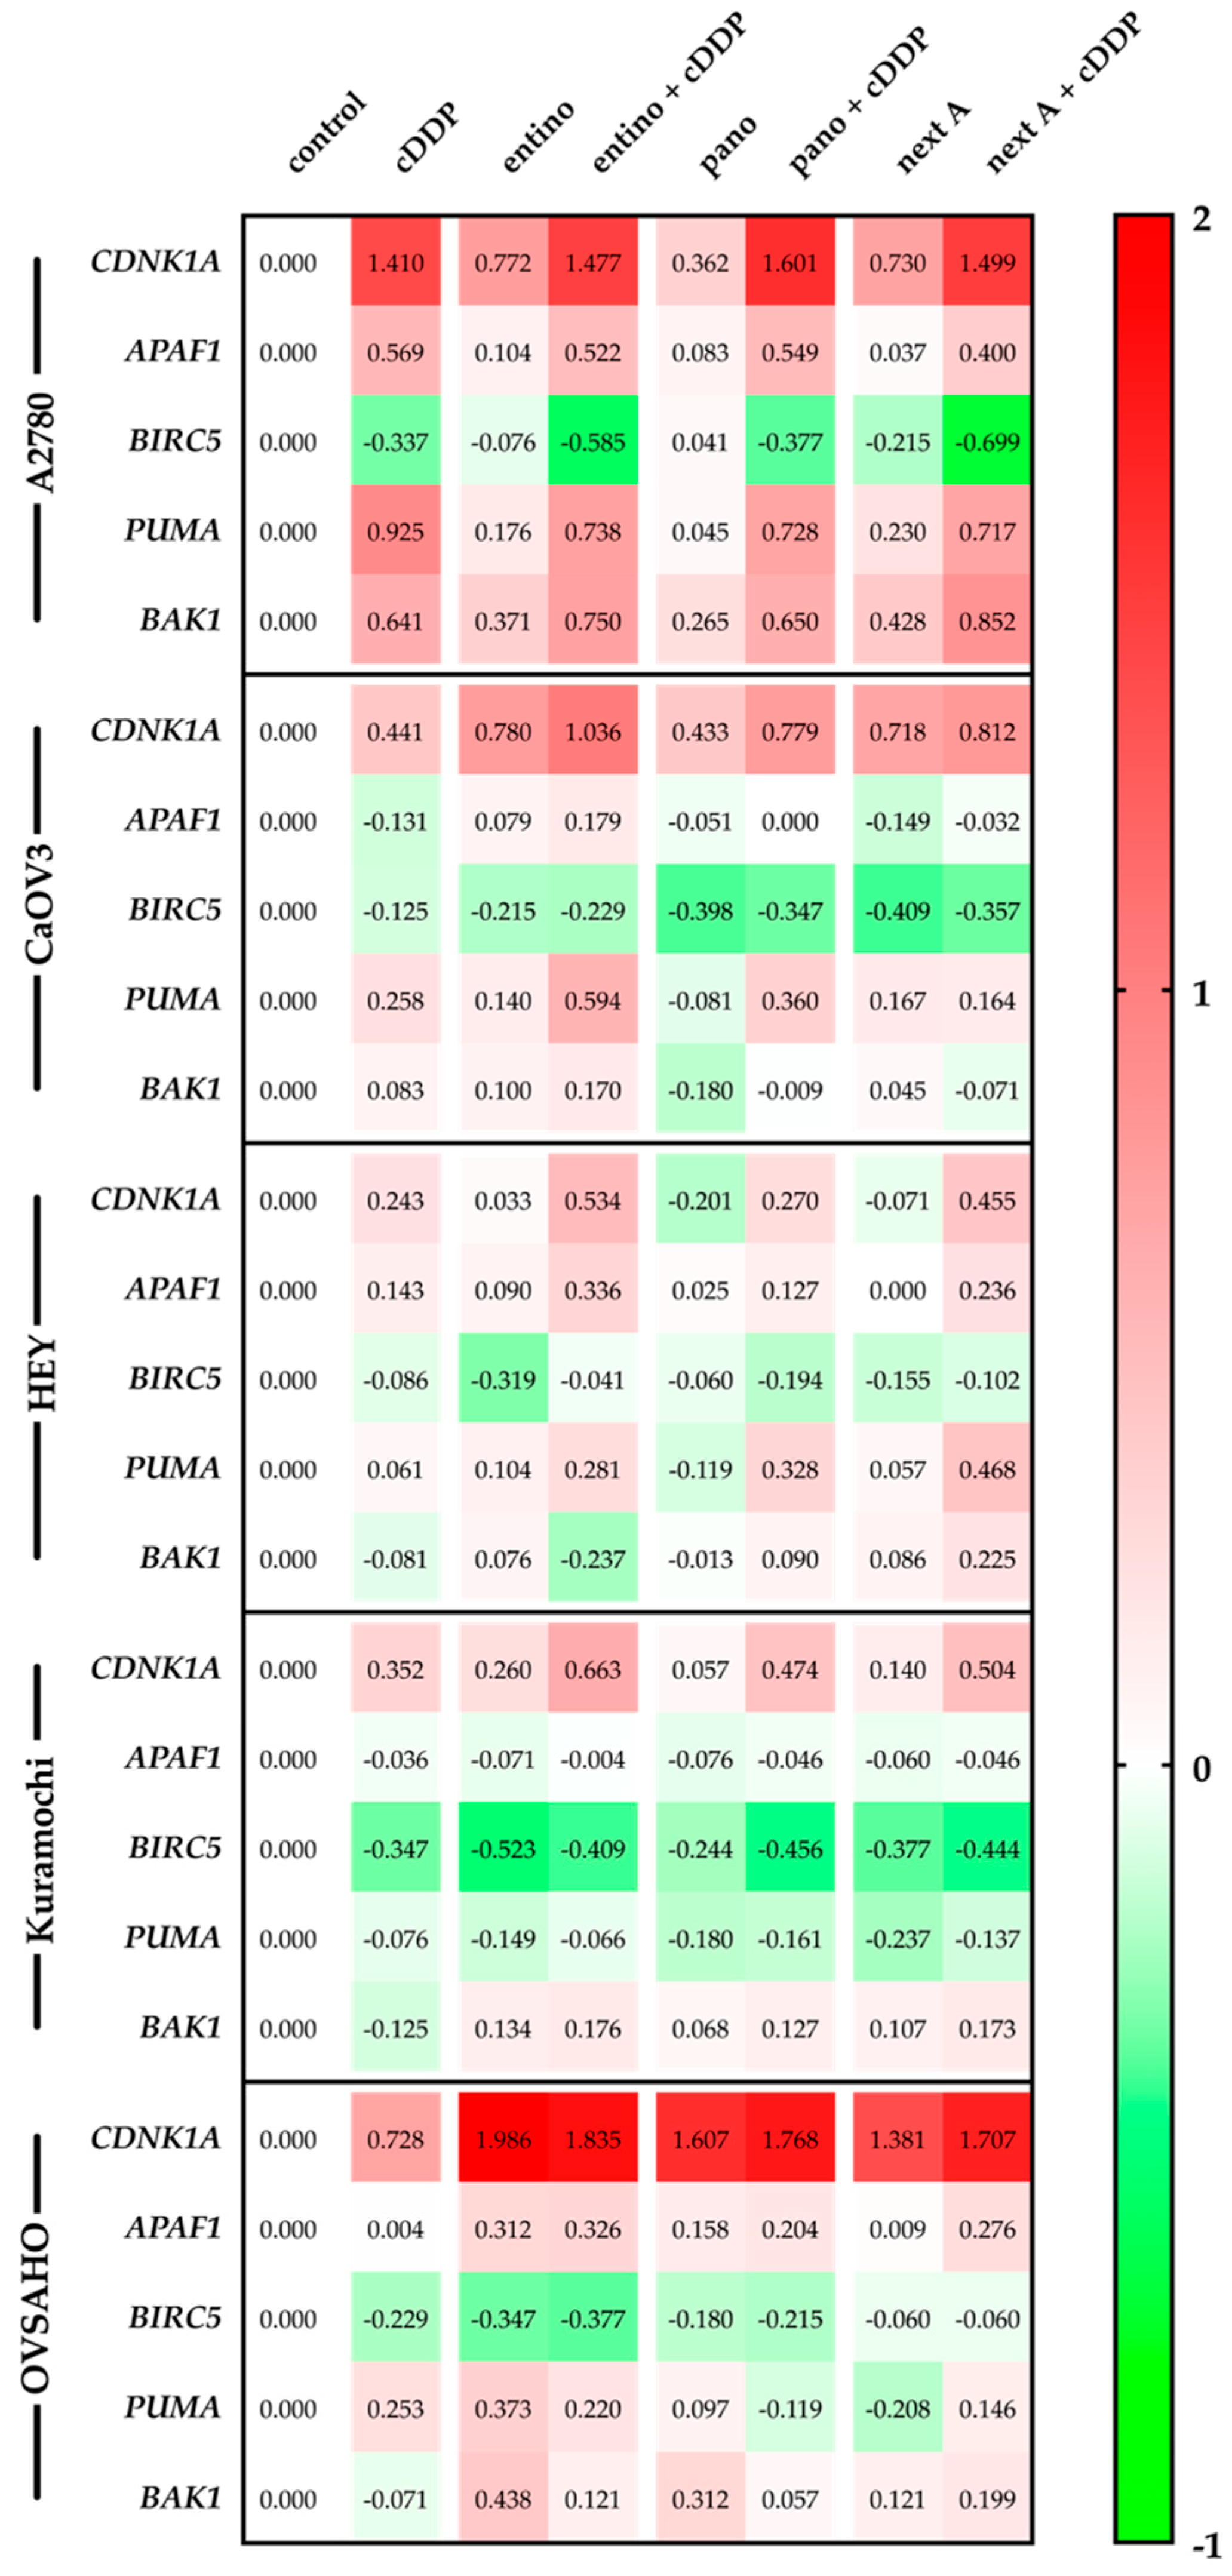
2.6. Alterations in Apoptosis-Related Gene Expression

To get insight into the mechanism by which HDACi increase the potency of cisplatin in MTT assays, apoptosis induction and caspase activation, we performed RT-PCR-based gene expression analysis of apoptosis and cell cycle related genes. CDNK1A (cyclin-dependent kinase inhibitor 1; p21) is a p53-mediated regulator of cell cycle progression at the transition of G1- and S-phase and normally arrests the cell cycle in G1-phase after DNA damage [34]. As proapoptotic factors we investigated the expression of APAF1 (apoptotic protease activating factor 1), PUMA (p53 upregulated modulator of apoptosis), and BAK1 (Bcl-2 homologous antagonist killer) genes. APAF1 is a key factor for the induction of apoptosis, while it forms the apoptosome leading to the activation of the caspase cascade via activation of caspase 9 [35]. PUMA and BAK1 are both proapoptotic members of the Bcl-2 family. As a response to DNA damage, p53 is activated leading to the upregulation of PUMA itself [36]. It is discussed that PUMA interacts with antiapoptotic members of the Bcl-2 family (like Mcl-1, Bcl-2) and inhibits their inhibitory interaction with proapoptotic Bak (coding gene: BAK1) and Bax (also members of Bcl-2 family) resulting in a proapoptotic effect [37]. Upon induction, Bak leads to a loss of mitochondrial membrane potential and thus to cytochrome c release and apoptosis. It is also published that Bak forms an oligomeric pore and leads to the permeabilization of the outer membrane of mitochondria [38]. BIRC5 (baculoviral inhibitor of apoptosis repeat-containing 5; survivin) was chosen as a representative antiapoptotic gene. It is a member of IAP (inhibitors of apoptosis) family and inhibits the activity of caspase 3/7 [39], which are downstream of caspase 9. BIRC5 leads to an inhibitory effect on apoptosis induction. Changes in apoptosis-related gene expression patterns are shown in Figure 9.
RT-PCR data showed varying levels of induction of CDNK1A (p21). While p21 expression is strongly inducible by cisplatin and HDACi or combined treatment in A2780 and OVSAHO cells, the other cell lines showed a lower p21 expression. Except for A2780 cells, the combination of HDACi and cisplatin showed a stronger induction of p21 than cisplatin treatment alone. Interestingly, in OVSAHO cells, HDACi treatment alone had the same effect as the combination of HDACi and cisplatin on p21 induction. In HEY and Kuramochi cell lines, HDACi only treatment had only moderate effects whereas the combination with cisplatin induces p21. In HEY cells, panobinostat and nexturastat A as single treatments led to slight downregulation of p21. Except for CaOV3 and Kuramochi cells, proapoptotic APAF1 was upregulated by cisplatin and/or HDACi treatment. Mostly, combination treatments caused a higher upregulation than single treatment with HDACi. However, in A2780 cells, cisplatin single treatment was as effective in upregulating APAF1 as combination treatments. The anti-apoptotic gene survivin (BIRC5) was downregulated as a result of the different treatment regimens. Mostly, the combination of HDACi with cisplatin caused a stronger downregulation of survivin gene than single treatments. Strongest downregulation of survivin was seen in A2780, CaOV3, and Kuramochi cells. Pro-apoptotic PUMA was upregulated under most treatment conditions except in Kuramochi cells. Whereas in A2780 cells combinations of HDACi and cisplatin were not superior to cisplatin alone, in CAOV3 and HEY cells combination treatments were more effective than cisplatin alone in upregulating PUMA. Pro-apoptotic BAK1 expression was induced in A2780 cells upon cisplatin and HDACi treatment, however the combined treatment did only slightly increase BAK1 expression. In the HGSOC cell lines, BAK1 expression remained largely unaffected by cisplatin single treatment. HDACi mostly increased BAK1 expression modestly. Combinations with cisplatin did not lead to additional BAK1 expression in most cases—except for A2780 cells. As a general tendency, PCR studies showed an upregulation of p21 and of proapoptotic genes APAF1, PUMA, BAK1 as well as a downregulation of the antiapoptotic gene survivin (BIRC5) in ovarian cancer cell lines.

3. Discussion

Chemoresistance is the major problem in managing cancer. Among ovarian cancer, high grade serous ovarian carcinomas (HGSOC) have the lowest 5 year survival rate and do poorly respond to chemotherapy including platinum compounds [1,12]. Targeting epigenetic processes like DNA methylation or histone acetylation in tumors is a promising therapeutic strategy [20,21,22]. It is widely known that cancer cells exhibit hypoacetylation of histones (and other proteins) due to an overexpression of HDACs. Histone hypoacetylation leads to a more condensed heterochromatin structure of DNA with decreased expression of tumor suppressor genes and decreased access for DNA damaging agents like cisplatin [41]. HDACi are able to enhance the chemosensitivity of tumors for platinum-based drugs by normalizing the dysregulated process. Mechanisms behind this effect are among others alterations in the apoptosis-related gene expression pattern [42,43,44]. Studies with approved pan-HDACi like panobinostat and vorinostat (SAHA) explored their effects on gene expression [45,46], but there is still limited data available for cellular and transcriptional effects in solid tumors such as highly aggressive HGSOC. Furthermore, pan-HDACi have no selectivity towards an HDAC isoform or class and can cause severe side effects as known for panobinostat [47,48,49]. In our study, we compared the effects of one pan-HDACi and two isoform-selective HDACi on the cisplatin sensitivity of four HGSOC cell lines and—as control—one endometrioid adenocarcinoma type I (A2780). The aim was to explore if the use of a subtype-selective HDACi (entinostat, nexturastat A) has advantages over pan-HDACi (panobinostat).
The HDAC6-selective HDACi nexturastat A was efficacious in increasing cisplatin potency in the HGSOC and A2780 cells (Figure 3A,C,D, Table 6). However, the concentration needed to exert such effects was beyond HDAC6-selective concentrations. The Ki value of nexturastat A at HDAC6 was estimated as 0.03 µM whereas at HDAC2, the Ki was 1.25 µM. Even though this is a 42-fold selectivity for HDAC6, concentrations needed for nexturastat A to increase cisplatin potency were 5 µM and higher (Figure S2, Table 4, Table 5 and Table 6). In conclusion, effects seen with nexturastat A are in a concentration range where this compound was no longer selective but turned into a class I and class IIb HDACi. Thus, HDAC6 inhibition does not seem to play a major role in sensitization of HGSOC cells against cisplatin.
The pan-HDACi panobinostat was able to increase the cisplatin sensitivity significantly in two out of the four HGSOC cell lines (HEY, OVSAHO) and in A2780 cells. However, in HGSOC cells, panobinostat was less efficacious in increasing cisplatin sensitivity than the class I-HDACi entinostat as seen by lower shift factors for panobinostat (Table 6). In contrast to panobinostat, entinostat was able to significantly increase cisplatin sensitivity in all four HGSOC cell lines (Figure 1B,E, Figure S1A,E,G, Table 6). Since entinostat remains a selective class I HDACi in all concentrations used in this study, it can be concluded that class I HDAC inhibition is sufficient to explain the observed effects and that pan-HDAC inhibition is not only not required but possibly detrimental due to severe side effects associated with pan-HDACi [47,48,49].
HDACi-mediated increase in cisplatin potency was first estimated in cell viability assays (MTT) and required a preincubation of the HDACi prior to addition of cisplatin (Figure 3, Table 4 and Table 6). HDACi and cisplatin combinations were synergistic as shown by the Chou–Talalay analysis (Table 7). HDACi-mediated increase in cisplatin cytotoxicity (MTT) was shown to be associated with increased caspase3/7-activation and apoptosis induction (Figure 5, Figure 6, Figure 7 and Figure 8). Whereas combinatorial effects of cisplatin and nexturastat A or panobinostat, respectively, were not significant in all cell lines, the combinatorial effects of entinostat and cisplatin were always significant and synergistic (caspase3/7-activation, apoptosis induction) except for apoptosis induction in OVSAHO cells (Figure 5). This leaves the class I-HDACi entinostat as the most promising chemosensitizing HDACi in this study. Based on the presented results and the use of the caspase inhibitor QVD (not shown), it can be assumed that apoptosis induction by entinostat (or the other HDACi) and cisplatin treatment is caspase-3/7-driven in HGSOC cell lines.
The next question was what changes are induced by HDACi in HGSOC cells leading to chemosensitization against cisplatin? It is known that HDACi stimulate apoptosis in ovarian cancer cell lines by alteration of gene expression related to cell growth, cell cycle progression and apoptosis [50]. In hepatocellular carcinomas, proapoptotic APAF1 is upregulated by HDACi [51]. Overexpression of survivin is known for most types of cancer and an association with high grade cancers and poor disease prognosis is well described [52]. It was shown in gastric cancer that overexpression of BAK1 is related to induction of apoptosis [53]. High expression of p21 may be a predictor for cisplatin sensitivity in ovarian carcinoma [54]. Proapoptotic PUMA is normally upregulated by p53 [55]. These literature results prompted us to analyze the gene expression profile of the five apoptosis and survival-related genes APAF1, survivin, BAK1, p21, and PUMA by PCR in all ovarian cancer cells used in this study under single and combination treatments of HDACi with cisplatin (Figure 9). As a general summary, we found an upregulation of p21 and proapoptotic genes and a downregulation of survivin upon HDACi treatment. However, variability within the different cell lines was rather large. Whereas survivin was downregulated in all cell lines upon entinostat treatment, APAF1, PUMA, and BAK1 expression were upregulated in all cell lines except Kuramochi cells in which only BAK1 was upregulated upon entinostat treatment. The same holds true for PUMA expression which is regulated by p53 [55]. Since p53-mutations are quite often observed in HGSOC cancer cell lines (e.g., CaOV3, Kuramochi, and OVSAHO [23,25,26]), it is not surprising that PUMA is less upregulated in these cells compared to p53 wt A2780 cells. Although literature describes a direct link between p21 expression and cisplatin sensitivity [54], we could not establish a quantitative link in our cell lines (Figure 9, Table 6). Still, the gene expression analysis upon HDACi treatment of five apoptosis and survival-related genes can explain facilitated apoptosis upon cisplatin treatment in HGSOC and A2780 cells and is in full agreement with literature data on gene expression of proapoptotic genes presented above.
In conclusion, HDACi are able to increase the sensitivity of HGSOC cancer cell lines towards cisplatin. The class I-selective HDACi entinostat turned out superior in increasing cisplatin potency than pan-HDAC inhibition in cell viability assays (MTT), apoptosis induction (subG1), and caspase3/7-activation. Further, entinostat is synergistic with cisplatin in all cell lines in MTT and caspase activation assays. Combination indices estimated according to Chou–Talalay were <0.9, indicating synergism. Mechanistically, HDACi induce an upregulation of cell cycle arrest and pro-apoptotic genes (CDNK1A, APAF1, PUMA, BAK1) and repression of prosurvival genes such as survivin which is in accordance with literature data for different types of cancer [56,57]. In conclusion, the combination of entinostat and cisplatin is synergistic in HGSOC and could be an effective strategy for the clinical treatment of this aggressive ovarian cancer subtype. Furthermore, studies on HDACi-induced gene expression changes (Figure 9) may lead to predictive biomarkers for cisplatin sensitivity in HGSOC.

4. Materials and Methods

4.1. Reagents

Cisplatin was purchased from Sigma (München, Germany) and dissolved in 0.9% sodium chloride solution, propidium iodide (PI) was purchased from PromoKine (Heidelberg, Germany). Stock solutions (10 mM) of entinostat, nexturastat A, and panobinostat (Selleckchem, Houston, Texas, USA) were prepared with DMSO and diluted to the desired concentrations with the appropriate medium. All other reagents were supplied by PAN Biotech (Aidenbach, Germany) unless otherwise stated.

4.2. Cell Lines and Cell Culture

The human ovarian carcinoma cell lines A2780 and HEY were obtained from European Collection of Cell Cultures (ECACC, Salisbury, UK). The cell lines Kuramochi and OVSAHO were obtained from Japanese Collection of Research Bioresources Cell Bank (JCRB Cell Bank, Osaka, Japan). CaOV3 cell line was obtained from ATCC/LGC Standards GmbH (Wesel, Germany). All cell lines were grown at 37 °C under humidified air supplemented with 5% CO2 in RPMI 1640 (A2780, HEY, Kuramochi, OVSAHO) or DMEM (CaOV3) containing 10% heat inactivated fetal calf serum, 120 IU/mL penicillin, and 120 µg/mL streptomycin. The cells were grown to 80% confluency before being used in further assays.

4.3. MTT Cell Viability Assay

The rate of cell-survival under the action of test substances was evaluated by an improved MTT assay as previously described [20,31]. To investigate the effect of entinostat, panobinostat, and nexturastat A on cisplatin induced cytotoxicity, compounds were added 48 h before cisplatin administration. After 72 h, the cytotoxic effect was determined by MTT assay as described above (density of cell seeding for this incubation scheme: A2780 3000 cells/well (c/w), CaOV3 3000 c/w, HEY 3500 c/w, Kuramochi 4500 c/w, and OVSAHO 10,000 c/w), and shift factors were calculated by dividing the IC50 value of cisplatin alone by the IC50 value of the drug combinations. Incubation was ended after 72 h and cell survival was determined by addition of MTT (Serva, Heidelberg, Germany) solution (5 mg/mL in phosphate buffered saline). The formazan precipitate was dissolved in DMSO (VWR, Langenfeld, Germany). Absorbance was measured at 544 nm and 690 nm in a FLUOstar microplate-reader (BMG LabTech, Offenburg, Germany).

4.4. Whole-Cell HDAC Inhibition Assay

The cellular HDAC assay was based on an assay published by Heltweg and Jung [58], Ciossek et al. [59], and Bonfils et al. [60] with minor modifications as described in [20]. Briefly, human cancer cell lines A2780, CaOV3, HEY, Kuramochi, and OVSAHO were seeded in 96-well tissue culture plates (Corning, Kaiserslautern, Germany) at a density of 15,000 c/w, 15,000 c/w, 17,500 c/w, 22,500 c/w, and 50,000 c/w in a total volume of 90 µL of culture medium. After 24 h, cells were incubated for 18 h with increasing concentrations of test compounds. The reaction was started by adding 10 µL of 3 mM Boc-Lys(Ac)-AMC (Bachem, Bubendorf, Switzerland) to reach final concentration of 0.3 mM [61]. The cells were incubated with the Boc-Lys(Ac)-AMC for 3 h under cell culture conditions. After this incubation, 100 µL/well stop solution (25 mM Tris-HCl (pH 8), 137 mM NaCl, 2.7 mM KCl, 1 mM MgCl2, 1 % NP40, 2.0 mg/mL Trypsin, 10 µM Vorinostat) was added and the reaction was developed for 3 h under cell culture conditions. Fluorescence intensity was measured at excitation of 320 nm and emission of 520 mm in a NOVOstar microplate reader (BMG LabTech, Offenburg, Germany).

4.5. Combination Experiments

For the investigation of the effect of HDACi on cisplatin induced cytotoxicity, the compounds were added 48 h before cisplatin administration. After 72 h, the cytotoxic effect was determined with a MTT cell viability assay. Calcusyn software 2.1 (Biosoft, Cambridge, UK) was used to calculate the combination index (CI) as a quantitative measure of the degree of drug interaction.

4.6. Enzyme HDAC Inhibition Assay

All human recombinant enzymes were purchased from Reaction Biology Corp. (Malvern, PA, USA). The HDAC activity assay HDAC2 (cat nr. KDA-21-277), HDAC4 (cat nr. KDA-21-279), HDAC6 (cat nr. KDA-21-213), and HDAC8 (cat nr. KDA-21-481) was performed in 96-well-plates (Corning, Kaiserslautern, Germany). Briefly 20 ng of HDAC2/8, 17.5 ng of HDAC6 and 2 ng of HDAC4 per reaction were used. Recombinant enzymes were diluted in assay buffer (50 mM Tris-HCl, pH 8.0, 137 mM NaCl, 2.7 mM KCl, 1 mM MgCl2, and 1 mg/mL BSA). After a 5 min incubation step the reaction was started with 10 µL of 300 µM (HDAC2), 150 µM (HDAC6) Boc-Lys(Ac)-AMC (Bachem, Bubendorf, Switzerland) or 100 µM (HDAC4), 60 µM (HDAC8) Boc-Lys-(TFa)-AMC (Bachem, Bubendorf, Switzerland). The reaction was stopped after 90 min by adding 100 µL stop solution (16 mg/mL trypsin, 2 µM panobinostat for HDAC2/6/8, 2µM CHDI0039 (kindly provided by the CHDI Foundation Inc., New York, USA) for HDAC4 in 50 mM Tris-HCl, pH 8.0, and 100 mM NaCl. 15 min after the addition of the stop solution the fluorescence intensity was measured at excitation of 355 nm and emission of 460 nm in a NOVOstar microplate reader (BMG LabTech, Offenburg, Germany).

4.7. Measurement of Apoptotic Nuclei

A2780, CaOV3, HEY, Kuramochi, and OVSAHO cells were seeded at a density of 40,000 c/w, 50,000 c/w, 40,000 c/w, 60,000 c/w, and 100,000 c/w in 24-well plates (Sarstedt, Nürnbrecht, Germany). Cells were treated with entinostat, panobinostat, or nexturastat A and cisplatin alone or in combination for the indicated time points. Supernatant was removed after a centrifugation step and the cells were lysed in 500 µL hypotonic lysis buffer (0.1% sodium citrate, 0.1% Triton X-100, 100 µg/mL PI) at 4 °C in the dark overnight. The percentage of apoptotic nuclei with DNA content in sub-G1 was analyzed by flow cytometry using the CyFlow instrument (Partec, Norderstedt, Germany).

4.8. Caspase 3/7 Activation Assay

Compound-induced activation of caspases 3 and 7 was analyzed using the CellEvent Caspase-3/7 green detection reagent (Thermo Scientific, Wesel, Germany) according to the manufacturer’s instructions. Briefly, A2780, CaOV3, HEY, Kuramochi, and OVSAHO cells were seeded in 96-well-plates (Corning, Kaiserslautern, Germany) at a density of 4000 c/w, 7500 c/w, 7500 c/w, 4500 c/w, and 10000 c/w. Cells were treated with entinostat, panobinostat, or nexturastat A 48 h prior to the addition cisplatin and another incubation period of 24 h. Then, medium was removed and 50 µL of CellEvent Caspase 3/7 green detection reagent (2 µM in PBS supplemented with 5% heat inactivated FBS) was added. Cells were incubated for 30 min at 37 °C in a humidified incubator before imaging by using the Thermo Fisher ArrayScan XTI high content screening (HCS) system with a 10× magnification (Thermo Scientific). Hoechst 33342 was used for nuclei staining. The pan caspase inhibitor QVD was used in a concentration of 20 µM diluted in the appropriate medium and incubated 30 min prior to compound addition.

4.9. Immunoblotting

Cells were treated with indicated concentrations of entinostat, panobinostat, or nexturastat A for 48h prior to cisplatin (24 h) or 72 h entinostat, panobinostat, or nexturastat A without cisplatin, or vehicle for 72 h. Cell pellets were dissolved with RIPA buffer (50 mM Tris-HCl pH8.0, 1% Triton X-100, 0.5% sodium deoxycholate, 0.1% SDS, 150 mM sodium chloride, 2 mM EDTA, supplemented with protease and phosphatase inhibitors (Pierce™ protease and phosphatase inhibitor mini tablets, Thermo Scientific, Wesel, Germany)) and clarified by centrifugation. Equal amounts of total protein (20 µg unless otherwise stated) were resolved by SDS-PAGE and transferred to polyvinylidene fluoride membranes (Merck Millipore, Darmstadt, Germany). PageRuler Prestained Protein Ladder, 10 to 180 kDa (Thermo Scientific, Wesel, Germany) was used as protein molecular weight marker. Blots were incubated with primary antibodies against acetylated α-tubulin (Cat. No. sc-23950), α-tubulin (Cat. No. sc-8035) (Santa Cruz Biotechnology, Heidelberg, Germany), histone H3 (Cat. No. MAB9448), acetyl histone H3 (Lys24, Cat. No. NBP2-54615), HDAC1 (Cat. No. NB100-56340), HDAC2 (Cat. No. MAB7679), HDAC3 (Cat. No. NB100-1669), HDAC4 (Cat. No. AF6205), HDAC5 (Cat. No. NBP2-22152), HDAC6 (Cat. No. NB100-56343), HDAC10 (Cat. No. NB100-91801), and HDAC11 (Cat. No. NBP2-16789) (Biotechne, Wiesbaden, Germany). Immunoreactive proteins were visualized using luminol reagent (Santa Cruz Biotechnology, Heidelberg, Germany) with an Intas Imager (Intas, Göttingen, Germany).

4.10. RT-PCR

Cells were treated with indicated concentrations of entinostat, panobinostat, or nexturastat a for 48 h prior to cisplatin (24 h) or 72 h entinostat, panobinostat, or nexturastat A without cisplatin, or cell culture medium for 72 h. RNA was isolated using RNeasy Mini Kit (Qiagen, Hilden, Germany). Afterwards transcription to cDNA was performed with High Capacity cDNA Reverse Transcription Kit (Thermo Scientific, Wesel, Germany). RT-PCR was performed with GoTaq qPCR Master Mix (Promega, USA) in a CFX96 Real-Time System (BIO-RAD, Hercules, California, USA). Relative changes in gene expression were normalized to endogenous control genes GUSB (beta-glucuronidase), TBP (TATA binding protein), and HPRT1 (hypoxanthine-guanine phosphoribosyltransferase) by Vandesompele method [40] and if indicated normalized to vehicle treated control. Primers (Sigma Aldrich, Steinheim, Germany) with an efficacy between 80% and 115% were used (Table 8). They were designed by Primer-BLAST (NIH, Bethesda, Maryland, USA) [62] and efficacy was determined with a template isolated from HeLa cells.

4.11. Data Analysis

Concentration-effect curves were constructed with Prism 7.0 (GraphPad, San Diego, CA, USA) by fitting the pooled data of at least three experiments performed in triplicate to the four-parameter logistic equation. Statistical analysis was performed using t-test or one-way ANOVA. To analyze the synergistic effects of apoptosis induction and caspase3/7-activation, the values of the single treatments were summed up and the standard deviation calculated. This value was compared with the actual measured value of the combination treatment using t-test.

Supplementary Materials

Author Contributions

Conceptualization, M.U.K. and A.H.; Formal analysis, J.J.B. and R.W.; Funding acquisition, M.U.K.; Investigation, J.J.B. and C.S.; Project administration, M.U.K.; Resources, M.U.K.; Supervision, M.U.K. and A.H.; Visualization, J.J.B.; Writing—original draft, J.J.B.; Writing—review & editing: M.U.K. and A.H.

Funding

The Deutsche Forschungsgemeinschaft DFG is acknowledged for funds used to purchase the ArrayScan XTI High Content Platform used in this research (INST 208/690-1).

Conflicts of Interest

The authors declare no conflict of interest.

Abbreviations

HDAChistone deacetylase
HDACihistone deacetylase inhibitor
entinoentinostat
cDDPcis-diamminedichloridoplatinum(II) (cisplatin)
panopanobinostat
next Anexturastat A
BIRC5, survivinbaculoviral inhibitor of apoptosis repeat-containing 5
PUMAp53 upregulated modulator of apoptosis
BAK/BakBcl-2 homologous antagonist killer
CDNK1A, p21cyclin-dependent kinase inhibitor 1
APAF1apoptotic protease activating factor 1
IAPinhibitors of apoptosis
HPRT1hypoxanthine-guanine phosphoribosyltransferase
GUSBbeta-glucuronidase
TBPTATA binding protein
HGSOChigh grade serous ovarian cancer
MTT3-(4,5-Dimethylthiazole-2-yl)-2,5-diphenyltetrazoliumbromide
CIcombination index
RT-PCRreverse transcriptase polymerase chain reaction

References

  1. Cancer of the Ovary - Cancer Stat Facts. Available online: https://seer.cancer.gov/statfacts/html/ovary.html (accessed on 24 April 2019).
  2. Cancer of the Cervix Uteri - Cancer Stat Facts. Available online: https://seer.cancer.gov/statfacts/html/cervix.html (accessed on 24 April 2019).
  3. Cancer of the Breast (Female) - Cancer Stat Facts. Available online: https://seer.cancer.gov/statfacts/html/breast.html (accessed on 24 April 2019).
  4. Cancer of the Vulva - Cancer Stat Facts. Available online: https://seer.cancer.gov/statfacts/html/vulva.html (accessed on 24 April 2019).
  5. Cancer of the Endometrium - Cancer Stat Facts. Available online: https://seer.cancer.gov/statfacts/html/corp.html (accessed on 24 April 2019).
  6. Krebs – Datenbankabfrage. Available online: https://www.krebsdaten.de/Krebs/SiteGlobals/Forms/Datenbankabfrage/datenbankabfrage_stufe2_form.html (accessed on 14 May 2019).
  7. Singh, N.; McCluggage, W.G.; Gilks, C.B. High-grade serous carcinoma of tubo-ovarian origin: recent developments. Histopathology 2017, 71, 339–356. [Google Scholar] [CrossRef] [PubMed]
  8. Köbel, M.; Kalloger, S.E.; Huntsman, D.G.; Santos, J.L.; Swenerton, K.D.; Seidman, J.D.; Gilks, C.B. Cheryl Brown Ovarian Cancer Outcomes Unit of the British Columbia Cancer Agency, Vancouver BC Differences in tumor type in low-stage versus high-stage ovarian carcinomas. Int. J. Gynecol. Pathol. Off. J. Int. Soc. Gynecol. Pathol. 2010, 29, 203–211. [Google Scholar]
  9. Kohn, E.C.; Ivy, S.P. Whence High-Grade Serous Ovarian Cancer. Am. Soc. Clin. Oncol. Educ. Book Am. Soc. Clin. Oncol. Annu. Meet. 2017, 37, 443–448. [Google Scholar] [CrossRef] [PubMed]
  10. Koshiyama, M.; Matsumura, N.; Konishi, I. Subtypes of Ovarian Cancer and Ovarian Cancer Screening. Diagnostics 2017, 7. [Google Scholar] [CrossRef] [PubMed]
  11. Eisenhauer, E.A. Real-world evidence in the treatment of ovarian cancer. Ann. Oncol. Off. J. Eur. Soc. Med. Oncol. 2017, 28, viii61–viii65. [Google Scholar] [CrossRef] [PubMed]
  12. Ghosh, S. Cisplatin: The first metal based anticancer drug. Bioorganic Chem. 2019, 88, 102925. [Google Scholar] [CrossRef] [PubMed]
  13. Ohmichi, M.; Hayakawa, J.; Tasaka, K.; Kurachi, H.; Murata, Y. Mechanisms of platinum drug resistance. Trends Pharmacol. Sci. 2005, 26, 113–116. [Google Scholar] [CrossRef]
  14. Jain, A.; Jahagirdar, D.; Nilendu, P.; Sharma, N.K. Molecular approaches to potentiate cisplatin responsiveness in carcinoma therapeutics. Expert Rev. Anticancer Ther. 2017, 17, 815–825. [Google Scholar] [CrossRef]
  15. Eckschlager, T.; Plch, J.; Stiborova, M.; Hrabeta, J. Histone Deacetylase Inhibitors as Anticancer Drugs. Int. J. Mol. Sci. 2017, 18, 1414. [Google Scholar] [CrossRef]
  16. Kim, H.-J.; Bae, S.-C. Histone deacetylase inhibitors: molecular mechanisms of action and clinical trials as anti-cancer drugs. Am. J. Transl. Res. 2011, 3, 166–179. [Google Scholar]
  17. Gregoretti, I.; Lee, Y.-M.; Goodson, H.V. Molecular Evolution of the Histone Deacetylase Family: Functional Implications of Phylogenetic Analysis. J. Mol. Biol. 2004, 338, 17–31. [Google Scholar] [CrossRef] [PubMed]
  18. Yang, Q.; Yang, Y.; Zhou, N.; Tang, K.; Lau, W.B.; Lau, B.; Wang, W.; Xu, L.; Yang, Z.; Huang, S.; et al. Epigenetics in ovarian cancer: premise, properties, and perspectives. Mol. Cancer 2018, 17, 109. [Google Scholar] [CrossRef] [PubMed] [Green Version]
  19. Yano, M.; Yasuda, M.; Sakaki, M.; Nagata, K.; Fujino, T.; Arai, E.; Hasebe, T.; Miyazawa, M.; Miyazawa, M.; Ogane, N.; et al. Association of histone deacetylase expression with histology and prognosis of ovarian cancer. Oncol. Lett. 2018, 15, 3524–3531. [Google Scholar] [CrossRef] [PubMed] [Green Version]
  20. Marek, L.; Hamacher, A.; Hansen, F.K.; Kuna, K.; Gohlke, H.; Kassack, M.U.; Kurz, T. Histone deacetylase (HDAC) inhibitors with a novel connecting unit linker region reveal a selectivity profile for HDAC4 and HDAC5 with improved activity against chemoresistant cancer cells. J. Med. Chem. 2013, 56, 427–436. [Google Scholar] [CrossRef] [PubMed]
  21. Stenzel, K.; Hamacher, A.; Hansen, F.K.; Gertzen, C.G.W.; Senger, J.; Marquardt, V.; Marek, L.; Marek, M.; Romier, C.; Remke, M.; et al. Alkoxyurea-Based Histone Deacetylase Inhibitors Increase Cisplatin Potency in Chemoresistant Cancer Cell Lines. J. Med. Chem. 2017, 60, 5334–5348. [Google Scholar] [CrossRef] [PubMed]
  22. Krieger, V.; Hamacher, A.; Gertzen, C.G.W.; Senger, J.; Zwinderman, M.R.H.; Marek, M.; Romier, C.; Dekker, F.J.; Kurz, T.; Jung, M.; et al. Design, Multicomponent Synthesis, and Anticancer Activity of a Focused Histone Deacetylase (HDAC) Inhibitor Library with Peptoid-Based Cap Groups. J. Med. Chem. 2017, 60, 5493–5506. [Google Scholar] [CrossRef] [PubMed]
  23. Cellosaurus Cell Line Caov-3 (CVCL_0201). Available online: https://web.expasy.org/cellosaurus/CVCL_0201 (accessed on 17 May 2019).
  24. Cellosaurus Cell Line HEY (CVCL_0297). Available online: https://web.expasy.org/cellosaurus/CVCL_0297 (accessed on 17 May 2019).
  25. Cellosaurus Cell Line Kuramochi (CVCL_1345). Available online: https://web.expasy.org/cellosaurus/CVCL_1345 (accessed on 17 May 2019).
  26. Cellosaurus Cell Line OVSAHO (CVCL_3114). Available online: https://web.expasy.org/cellosaurus/CVCL_3114 (accessed on 17 May 2019).
  27. Domcke, S.; Sinha, R.; Levine, D.A.; Sander, C.; Schultz, N. Evaluating cell lines as tumour models by comparison of genomic profiles. Nat. Commun. 2013, 4, 2126. [Google Scholar] [CrossRef]
  28. Cellosaurus Cell Line A2780 (CVCL_0134). Available online: https://web.expasy.org/cellosaurus/CVCL_0134 (accessed on 17 May 2019).
  29. Beaufort, C.M.; Helmijr, J.C.A.; Piskorz, A.M.; Hoogstraat, M.; Ruigrok-Ritstier, K.; Besselink, N.; Murtaza, M.; van IJcken, W.F.J.; Heine, A.A.J.; Smid, M.; et al. Ovarian Cancer Cell Line Panel (OCCP): Clinical Importance of In Vitro Morphological Subtypes. PLoS ONE 2014, 9, e103988. [Google Scholar] [CrossRef]
  30. Panteix, G.; Beaujard, A.; Garbit, F.; Chaduiron-Faye, C.; Guillaumont, M.; Gilly, F.; Baltassat, P.; Bressolle, F. Population pharmacokinetics of cisplatin in patients with advanced ovarian cancer during intraperitoneal hyperthermia chemotherapy. Anticancer Res. 2002, 22, 1329–1336. [Google Scholar]
  31. Engelke, L.H.; Hamacher, A.; Proksch, P.; Kassack, M.U. Ellagic Acid and Resveratrol Prevent the Development of Cisplatin Resistance in the Epithelial Ovarian Cancer Cell Line A2780. J. Cancer 2016, 7, 353–363. [Google Scholar] [CrossRef] [Green Version]
  32. Chou, T.-C. Drug combination studies and their synergy quantification using the Chou-Talalay method. Cancer Res. 2010, 70, 440–446. [Google Scholar] [CrossRef] [PubMed]
  33. Chou, T.-C.; Talalay, P. Quantitative analysis of dose-effect relationships: the combined effects of multiple drugs or enzyme inhibitors. Adv. Enzyme Regul. 1984, 22, 27–55. [Google Scholar] [CrossRef]
  34. Waldman, T.; Kinzler, K.W.; Vogelstein, B. p21 Is Necessary for the p53-mediated G1 Arrest in Human Cancer Cells. Cancer Res. 1995, 55, 5187–5190. [Google Scholar] [PubMed]
  35. Pop, C.; Timmer, J.; Sperandio, S.; Salvesen, G.S. The Apoptosome Activates Caspase-9 by Dimerization. Mol. Cell 2006, 22, 269–275. [Google Scholar] [CrossRef] [PubMed]
  36. Han, J.; Flemington, C.; Houghton, A.B.; Gu, Z.; Zambetti, G.P.; Lutz, R.J.; Zhu, L.; Chittenden, T. Expression of bbc3, a pro-apoptotic BH3-only gene, is regulated by diverse cell death and survival signals. Proc. Natl. Acad. Sci. 2001, 98, 11318–11323. [Google Scholar] [CrossRef] [PubMed]
  37. Nakano, K.; Vousden, K.H. PUMA, a Novel Proapoptotic Gene, Is Induced by p53. Mol. Cell 2001, 7, 683–694. [Google Scholar] [CrossRef]
  38. McArthur, K.; Whitehead, L.W.; Heddleston, J.M.; Li, L.; Padman, B.S.; Oorschot, V.; Geoghegan, N.D.; Chappaz, S.; Davidson, S.; Chin, H.S.; et al. BAK/BAX macropores facilitate mitochondrial herniation and mtDNA efflux during apoptosis. Science 2018, 359, eaao6047. [Google Scholar] [CrossRef] [Green Version]
  39. Shin, S.; Sung, B.-J.; Cho, Y.-S.; Kim, H.-J.; Ha, N.-C.; Hwang, J.-I.; Chung, C.-W.; Jung, Y.-K.; Oh, B.-H. An Anti-apoptotic Protein Human Survivin Is a Direct Inhibitor of Caspase-3 and -7. Biochemistry 2001, 40, 1117–1123. [Google Scholar] [CrossRef]
  40. Vandesompele, J.; De Preter, K.; Pattyn, F.; Poppe, B.; Van Roy, N.; De Paepe, A.; Speleman, F. Accurate normalization of real-time quantitative RT-PCR data by geometric averaging of multiple internal control genes. Genome Biol. 2002, 3, RESEARCH0034. [Google Scholar] [CrossRef]
  41. Benton, C.B.; Fiskus, W.; Bhalla, K.N. Targeting Histone Acetylation: Readers and Writers in Leukemia and Cancer. Cancer J. Sudbury Mass 2017, 23, 286–291. [Google Scholar] [CrossRef]
  42. Pchejetski, D.; Alfraidi, A.; Sacco, K.; Alshaker, H.; Muhammad, A.; Monzon, L. Histone deacetylases as new therapy targets for platinum-resistant epithelial ovarian cancer. J. Cancer Res. Clin. Oncol. 2016, 142, 1659–1671. [Google Scholar] [CrossRef] [PubMed]
  43. Spiegel, S.; Milstien, S.; Grant, S. Endogenous modulators and pharmacological inhibitors of histone deacetylases in cancer therapy. Oncogene 2012, 31, 537–551. [Google Scholar] [CrossRef] [PubMed]
  44. Ozaki, K.; Kishikawa, F.; Tanaka, M.; Sakamoto, T.; Tanimura, S.; Kohno, M. Histone deacetylase inhibitors enhance the chemosensitivity of tumor cells with cross-resistance to a wide range of DNA-damaging drugs. Cancer Sci. 2008, 99, 376–384. [Google Scholar] [CrossRef] [PubMed]
  45. Chen, S.; Zhao, Y.; Gou, W.; Zhao, S.; Takano, Y.; Zheng, H. The Anti-Tumor Effects and Molecular Mechanisms of Suberoylanilide Hydroxamic Acid (SAHA) on the Aggressive Phenotypes of Ovarian Carcinoma Cells. PLoS ONE 2013, 8, e79781. [Google Scholar] [CrossRef] [PubMed]
  46. Ma, Y.-Y.; Lin, H.; Moh, J.-S.; Chen, K.-D.; Wang, I.-W.; Ou, Y.-C.; You, Y.-S.; Lung, C.-C. Low-dose LBH589 increases the sensitivity of cisplatin to cisplatin-resistant ovarian cancer cells. Taiwan. J. Obstet. Gynecol. 2011, 50, 165–171. [Google Scholar] [CrossRef] [PubMed] [Green Version]
  47. Shah, R.R. Safety and Tolerability of Histone Deacetylase (HDAC) Inhibitors in Oncology. Drug Saf. 2019, 42, 235–245. [Google Scholar] [CrossRef] [PubMed]
  48. Van Veggel, M.; Westerman, E.; Hamberg, P. Clinical Pharmacokinetics and Pharmacodynamics of Panobinostat. Clin. Pharmacokinet. 2018, 57, 21–29. [Google Scholar] [CrossRef]
  49. Tzogani, K.; van Hennik, P.; Walsh, I.; De Graeff, P.; Folin, A.; Sjöberg, J.; Salmonson, T.; Bergh, J.; Laane, E.; Ludwig, H.; et al. EMA Review of Panobinostat (Farydak) for the Treatment of Adult Patients with Relapsed and/or Refractory Multiple Myeloma. The Oncologist 2018, 23, 631–636. [Google Scholar] [CrossRef]
  50. Takai, N.; Narahara, H.; Narahara, T. Human Endometrial and Ovarian Cancer Cells: Histone Deacetylase Inhibitors Exhibit Antiproliferative Activity, Potently Induce Cell Cycle Arrest, and Stimulate Apoptosis. Curr. Med. Chem. 2007, 14, 2548–2553. [Google Scholar] [CrossRef]
  51. Buurman, R.; Sandbothe, M.; Schlegelberger, B.; Skawran, B. HDAC inhibition activates the apoptosome via Apaf1 upregulation in hepatocellular carcinoma. Eur. J. Med. Res. 2016, 21, 26. [Google Scholar] [CrossRef] [Green Version]
  52. Jaiswal, P.K.; Goel, A.; Mittal, R.D. Survivin: A molecular biomarker in cancer. Indian J. Med. Res. 2015, 141, 389–397. [Google Scholar] [PubMed]
  53. Tong, Q.-S.; Zheng, L.-D.; Wang, L.; Liu, J.; Qian, W. BAK overexpression mediates p53-independent apoptosis inducing effects on human gastric cancer cells. BMC Cancer 2004, 4, 33. [Google Scholar] [CrossRef] [PubMed]
  54. Rose, S.L.; Goodheart, M.J.; DeYoung, B.R.; Smith, B.J.; Buller, R.E. p21 expression predicts outcome in p53-null ovarian carcinoma. Clin. Cancer Res. Off. J. Am. Assoc. Cancer Res. 2003, 9, 1028–1032. [Google Scholar]
  55. Yu, J.; Zhang, L. The transcriptional targets of p53 in apoptosis control. Biochem. Biophys. Res. Commun. 2005, 331, 851–858. [Google Scholar] [CrossRef] [PubMed]
  56. Sanders, Y.Y.; Hagood, J.S.; Liu, H.; Zhang, W.; Ambalavanan, N.; Thannickal, V.J. Histone deacetylase inhibition promotes fibroblast apoptosis and ameliorates pulmonary fibrosis in mice. Eur. Respir. J. 2014, 43, 1448–1458. [Google Scholar] [CrossRef] [PubMed]
  57. Glozak, M.A.; Seto, E. Histone deacetylases and cancer. Oncogene 2007, 26, 5420–5432. [Google Scholar] [CrossRef] [PubMed] [Green Version]
  58. Heltweg, B.; Jung, M. A Microplate Reader-Based Nonisotopic Histone Deacetylase Activity Assay. Anal. Biochem. 2002, 302, 175–183. [Google Scholar] [CrossRef]
  59. Ciossek, T.; Julius, H.; Wieland, H.; Maier, T.; Beckers, T. A homogeneous cellular histone deacetylase assay suitable for compound profiling and robotic screening. Anal. Biochem. 2008, 372, 72–81. [Google Scholar] [CrossRef]
  60. Bonfils, C.; Kalita, A.; Dubay, M.; Siu, L.L.; Carducci, M.A.; Reid, G.; Martell, R.E.; Besterman, J.M.; Li, Z. Evaluation of the pharmacodynamic effects of MGCD0103 from preclinical models to human using a novel HDAC enzyme assay. Clin. Cancer Res. Off. J. Am. Assoc. Cancer Res. 2008, 14, 3441–3449. [Google Scholar] [CrossRef]
  61. Hoffmann, K.; Brosch, G.; Loidl, P.; Jung, M. A non-isotopic assay for histone deacetylase activity. Nucleic Acids Res. 1999, 27, 2057–2058. [Google Scholar] [CrossRef]
  62. Ye, J.; Coulouris, G.; Zaretskaya, I.; Cutcutache, I.; Rozen, S.; Madden, T.L. Primer-BLAST: A tool to design target-specific primers for polymerase chain reaction. BMC Bioinform. 2012, 13, 134. [Google Scholar] [CrossRef] [PubMed]
Figure 1. Characterization of the ovarian cancer cell lines. (a) Cell viability was measured by MTT assay after 72 h incubation with different concentrations of cisplatin. Data shown are mean ± SD of at least three independent experiments each carried out in triplicates, calculated as percentage of control. The cell line specific IC50 values are shown in Table 1. (b) Gene expression profile for HDAC enzymes was obtained by RT-PCR. Data shown are normalized to endogenous control gene expression of HPRT1 (hypoxanthine-guanine phosphoribosyltransferase), TBP (TATA binding protein), and GUSB (beta-glucuronidase). (c) Representative immunoblot analysis of HDAC enzymes. One representative immunoblot with a protein molecular weight marker is shown in Figure S3.
Ijms 20 03052 g001
Figure 2. Effect of HDACi on acetylation level of α-tubulin and histone H3. Representative immunoblot analysis of histone H3, ac-histone H3, α-tubulin, and ac-α-tubulin in the different human ovarian cancer cell lines. Cells were treated with the indicated concentrations of HDACi. Control cells were incubated with vehicle. One representative immunoblot with a protein molecular weight marker is shown in Figure S3.
Ijms 20 03052 g002
Figure 3. HDACi pretreatment enhances the cytotoxic effects of cisplatin. A2780 (a), CaOV3 (b), HEY (c), Kuramochi (d), and OVSAHO (e) were pretreated with the indicated HDACi 48 h prior to cisplatin (cDDP) administration. After another 72 h, IC50-values were determined by MTT assay. Data shown are normalized to vehicle control and mean ± SD of at least three experiments each carried out in triplicates. The vertical arrows show the antiproliferative effects of HDACi in the absence of cisplatin and the horizontal arrows show the shifts of the IC50-values of cisplatin (absence and presence of HDACi). Statistical analysis was performed using t-test. Levels of significance: ns (p > 0.05); * (p ≤ 0.05); ** (p ≤ 0.01); *** (p ≤ 0.001).
Ijms 20 03052 g003
Figure 4. HDACi pretreatment enhances cisplatin-induced apoptosis. A2780 (a), CaOV3 (b), HEY (c), Kuramochi (d), and OVSAHO (e) cells were preincubated with HDACi for 48 h. Cisplatin was added in an IC50 concentration for each cell line for a further incubation period of 24 h. Apoptosis was analyzed by determining the sub-G1 cell fractions by flow cytometry analysis. 100 µM cisplatin served as positive control for apoptosis induction. 0.2% DMSO was added as a control for vehicle treated cells. All experimental conditions were incubated for same time periods. Data are the mean ± SD, n ≥ 2. Statistical analysis to compare the apoptosis induction by cisplatin or HDACi alone and the combination of HDACi and cisplatin was performed using t-test. Levels of significance: ns (p > 0.05); * (p ≤ 0.05); ** (p ≤ 0.01); *** (p ≤ 0.001).
Ijms 20 03052 g004aIjms 20 03052 g004b
Figure 5. Synergistic effects of the combination of HDACi and cisplatin on apoptosis induction. The sum of single treatment effects (HDACi, cisplatin) are shown in black bars. The extended white bars show the difference (superadditive (= synergistic) part) between the sum of single treatment effects and the effect of combination treatments. Vehicle treated control was subtracted. Data are the mean ± SD. Statistical analysis was performed using t-test. Levels of significance: ns (p > 0.05); * (p ≤ 0.05); ** (p ≤ 0.01); *** (p ≤ 0.001).
Ijms 20 03052 g005
Figure 6. Representative fluorescent imaging pictures (10× magnification) are shown for each cell line for the treatment of cisplatin (IC50 concentration), entinostat, and the combination of cisplatin and entinostat. Cell nuclei were stained by Hoechst 33342 and appear blue while cells with activated caspases3/7 showed green fluorescence. Scale bar in upper left image is 100 µm and applies to all images.
Ijms 20 03052 g006
Figure 7. A2780 (a), CaOV3 (b), HEY (c), Kuramochi (d), and OVSAHO (e) cells were preincubated with HDACi for 48 h. Cisplatin was added in an IC50 concentration for each cell line for a further incubation period of 24 h. Caspase3/7-activation was analyzed by incubation with CellEvent Caspase-3/7 green detection reagent (Thermo Scientific, Germany) and visualized by ArrayScan XTI. Cisplatin 100 µM (24 h) was added as positive control for caspase3/7-activation. 0.2% DMSO was added as a control for vehicle treated cells. All experimental conditions were incubated for same time periods. To verify the involvement of caspases in the observed effects, 20 µM QVD was preincubated for 30 min prior to compound addition. No caspase3/7-activation was obtained (data not shown). Data are the mean ± SD. Statistical analysis to compare the caspase3/7-activation by cisplatin or HDACi alone and the combination of HDACi and cisplatin was performed using t-test. Levels of significance: ns (p > 0.05); * (p ≤ 0.05); ** (p ≤ 0.01); *** (p ≤ 0.001).
Ijms 20 03052 g007
Figure 8. Synergistic effects of caspase3/7-activation upon combination treatment of HDACi and cisplatin. The sum of single treatment effects (HDACi, cisplatin) are shown in black bars. The extended white bars show the difference (superadditive (= synergistic) part) between the sum of single treatment effects and the effect of combination treatments. Results are shown for treatments significantly enhancing caspase3/7-activation (Figure 7). Before calculation, values were normalized to the effect of 100 µM cDDP and vehicle treated control was subtracted. Data shown are mean ± SD. Statistical analysis was performed using t-test. Levels of significance: ns (p > 0.05); * (p ≤ 0.05); ** (p ≤ 0.01); *** (p ≤ 0.001).
Ijms 20 03052 g008
Figure 9. Gene expression data were obtained by RT-PCR and analyzed according to Vandesompele [40]. Cells were pretreated with concentrations of HDACi shown in Table 4 for 48 h followed by treatment with cisplatin for 24 h in an IC50 concentration. Data shown are normalized to endogenous control gene expression of HPRT1 (hypoxanthine-guanine phosphoribosyltransferase), TBP (TATA binding protein), and GUSB (beta-glucuronidase) and rescaled to cell line specific control (72 h incubation with vehicle). Data are shown on a decadic logarithmic scale. Negative values marked in green show a lower expression compared to cell line specific control. Positive values marked in red show a higher expression compared to cell line specific control.
Ijms 20 03052 g009
Table 1. IC50 and pIC50 for cisplatin after a 72h incubation.
Cell LineIC50
[µM]
pIC50 ± SEM
A278011.04.96 ± 0.01
CaOV31.445.84 ± 0.01
HEY5.255.28 ± 0.01
Kuramochi4.685.33 ± 0.02
OVSAHO4.835.32 ± 0.01
Data shown are the mean of pooled data from at least three experiments, each carried out in triplicate.
Table 2. Cytotoxic activity of entinostat, panobinostat, and nexturastat A.
Cell LineHDACi
EntinostatPanobinostatNexturastat A
IC50
[nM]
pIC50 ± SEMIC50
[nM]
pIC50 ± SEMIC50
[nM]
pIC50 ± SEM
A27806066.22 ± 0.0315.37.82 ± 0.0277785.11 ± 0.09
CaOV311465.94 ± 0.037.628.12 ± 0.0352915.28 ± 0.03
HEY2516.60 ± 0.022.688.57 ± 0.0217245.76 ± 0.03
Kuramochi4856.31 ± 0.0311.27.95 ± 0.0253025.28 ± 0.02
OVSAHO18285.74 ± 0.0242.47.37 ± 0.0516,2184.79 ± 0.02
Cell viability was measured by MTT assay after 48 h preincubation followed by an additional 72 h incubation. Data shown are the mean of pooled data from at least three experiments each carried out in triplicates.
Table 3. HDAC inhibitory activity of entinostat, panobinostat, and nexturastat A.
Cell LineHDACi
EntinostatPanobinostatNexturastat A
IC50
[nM]
pIC50 ± SEMIC50
[nM]
pIC50 ± SEMIC50
[nM]
pIC50 ± SEM
A27803136.50 ± 0.0412.17.91 ± 0.0636335.44 ± 0.04
CaOV33336.48 ± 0.037.888.10 ± 0.0535005.46 ± 0.03
HEY2196.60 ± 0.0413.67.87 ± 0.0338745.41 ± 0.03
Kuramochi3396.47 ± 0.049.878.01 ± 0.0737335.43 ± 0.03
OVSAHO3266.49 ± 0.0223.17.64 ± 0.0452495.28 ± 0.02
Data shown are the mean of pooled data from at least three experiments each carried out in triplicates.
Table 4. HDACi concentrations used for combination treatment.
Cell LineEntinostat [nM]Panobinostat [nM]Nexturastat A [nM]
A278075040.07500
CaOV375015.07500
HEY20020.05000
Kuramochi75012.55000
OVSAHO200070.012,500
Table 5. IC50 and inhibitory constants (Ki) of nexturastat A on HDAC2, 4, 6, and 8.
HDAC2HDAC4HDAC6HDAC8
Compd.IC50 ± SD
[µM]
Ki
[µM]
IC50 ± SD
[µM]
Ki
[µM]
IC50 ± SD
[µM]
Ki
[µM]
IC50 ± SD
[µM]
Ki
[µM]
Nexturastat A1.99 ± 0.251.2512.0 ± 1.697.570.05 ± 0.010.0322.6 ± 2.5512.8
Data shown are the mean ± SD of pooled data from at least three experiments each carried out in triplicates.
Table 6. Effect of HDACi pretreatment on cisplatin-induced cytotoxicity (MTT assay).
Cell LineCisplatin+ 48 h HDACi Pretreatment
EntinostatPanobinostatNexturastat A
IC50IC50SFIC50SFIC50SF
A278011.04.992.2 (***)2.585.6 (***)1.447.6 (***)
CaOV31.440.722.0 (*)0.742.0 (ns)1.331.1 (ns)
HEY5.251.393.8 (***)2.751.9 (*)1.284.1 (***)
Kuramochi4.683.281.4 (*)5.14< 1 (ns)3.221.5 (**)
OVSAHO4.831.024.7 (***)3.011.6 (**)1.433.4 (***)
Data shown are the mean of pooled data from at least three experiments, each carried out in triplicate. Shift-factors (SF) were calculated by dividing the IC50-values without and with HDACi-preincubation. pIC50 and SEM are shown in supplemental Table S1. Statistical analysis was performed using t-test. Levels of significance: ns (p > 0.05); * (p ≤ 0.05); ** (p ≤ 0.01); *** (p ≤ 0.001).
Table 7. Synergism studies (CI-values) between HDACi entinostat, panobinostat, or nexturastat A and cisplatin.
Cisplatin
[µM]
Entinostat
[µM]
Panobinostat
[nM]
Nexturastat A
[µM]
0.100.250.500.75102030401.252.505.007.50
A27800.50*0.400.360.380.210.100.150.15*0.320.240.28
1.000.640.380.350.390.250.120.170.18*0.360.280.32
2.000.830.430.340.400.350.160.220.210.970.470.300.33
4.000.730.440.340.380.350.210.270.25>1.10.570.380.39
6.000.590.350.320.370.290.230.260.260.830.520.370.40
0.250.500.751.00--------
CaOV30.20*0.660.710.42
0.40*0.560.590.33
0.600.560.410.490.28
0.800.330.300.310.23
1.000.210.200.210.16
0.100.150.200.255.010.015.020.01.252.503.755.00
HEY0.32***0.27**0.190.14**0.320.27
0.50***0.26**0.210.15**0.330.29
1.00**0.310.25**0.250.16**0.360.27
2.00*0.370.290.24*0.410.250.17*0.630.330.26
4.000.350.280.240.230.510.330.280.200.620.420.290.27
0.250.500.751.00----1.252.503.755.00
Kuramochi1.000.430.420.510.62*0.730.660.66
2.000.420.430.490.60*0.780.740.72
3.000.460.440.480.57*0.800.770.75
4.000.440.420.440.530.840.790.770.74
5.000.450.430.470.520.780.780.740.70
0.501.001.502.00405060705.007.5010.012.5
OVSAHO1.000.500.390.410.440.360.330.270.26*0.820.840.78
2.000.410.290.340.370.250.230.210.210.870.770.750.67
3.000.420.280.320.360.240.220.210.210.800.760.650.60
4.000.390.280.310.350.230.220.210.210.720.690.610.57
5.000.390.290.330.360.240.230.220.220.640.590.530.53
Data shown are combination indices (CI) calculated using CompuSyn 1.0 based on the Chou–Talalay method. CI > 1.1 indicates antagonism, CI = 1 indicates an additive effect, and CI < 0.9 indicates synergism. * means fraction affected is less than 0.20. Values are the mean of two experiments. SD is < 10 % of the mean. Combinations marked with ◦ were not investigated because they did not show significant shift factors in combination treatment as can be seen in Table 6.
Table 8. Primer sequences for RT-PCR.
GenePrimer ForwardPrimer ReverseEfficacy [%]
HPRT1CCTGGCGTCGTGATTAGTGACGAGCAAGACGTTCAGTCCT93.6
TBPGTGACCCAGCATCACTGTTTCGAGCATCTCCAGCACACTCT86.9
GUSBACCTCCAAGTATCCCAAGGGTGTCTTGCTCCACGCTGGT83.1
HDAC1TGCAAAGAAGTCCGAGGCATACCCTCTGGTGATACTTTAGCA84.9
HDAC2AATGGAAATATATAGGCCCCGTTATCTGGTCTTATTGACCG96.4
HDAC3GGCAACTTCCACTACGGAGCGCATATTGGTGGGGCTGACT97.2
HDAC4TTGGATGTCACAGACTCCGCCCTTCTCGTGCCACAAGTCT80.8
HDAC5GGAGAGCTCAAGAATGGATTTGCCTGCTGTAGGAGTTTTGCG97.2
HDAC6CTGGCGGAGTGGAAGAACCTCTGCCTACTTCTTCGCTGC104
HDAC7TCTCGTGAGCTAAAGAATGGCTGTTGAATGATCTGCATGG96.5
HDAC8CCACCTTCCACACTGATGCTGCTGGGCAGTCATAACCTAGC97.7
HDAC9TGTAGCTGGTGGAGTTCCCTCTCTGAGGCAAAGGTGCAGA103
HDAC10TGGCCTTTGAGTTTGACCCTCCGATGGCTGAGTCAAATCCT97.3
HDAC11CGGAAAATGGGGCAAAGTGACAACAGCAAAGGACCACTTG100
CDNK1A (p21)TGCCGAAGTCAGTTCCTTGTGTTCTGACATGGCGCCTCC94.7
BIRC5 (Survivin)TGAGAACGAGCCAGACTTGGTGTTCCTCTATGGGGTCGTCA108
APAF1AGTGGAATAACTTCGTATGTAAGGAAAACAACTGGCCTCTGTGGT98.7
BAK1TCATCGGGGACGACATCAACCAAACAGGCTGGTGGCAATC111
PUMAGAGCGGCGGAGACAAGAGTAAGGGCAGGAGTCCCATGA94.7

