Article

Genetic Structure Analysis of a Collection of Tunisian Durum Wheat Germplasm

1
National Gene Bank of Tunisia, Boulevard du Leader Yasser Arafat Z. I Charguia 1, Tunis 1080, Tunisia
2
SINAGRI S.r.l., Spin Off of the University of Bari Aldo Moro, Via Amendola 165/A, 70126 Bari, Italy
3
Biotechnology and Physiology Laboratory, National Agronomic Research Institute of Tunisia (INRAT), Hedi Karray Street, Ariana 2049, Tunisia
4
Institute of Biosciences and Bioresources of the National Research Council (IBBR-CNR), Via Amendola 165/A, 70126 Bari, Italy
5
Department of Soil, Plant and Food Sciences (DiSSPA), Sect. Genetics and Plant Breeding, University of Bari Aldo Moro, Via Amendola 165/A, 70126 Bari, Italy
*
Authors to whom correspondence should be addressed.
Int. J. Mol. Sci. 2019, 20(13), 3362; https://0-doi-org.brum.beds.ac.uk/10.3390/ijms20133362
Submission received: 24 May 2019 / Revised: 26 June 2019 / Accepted: 4 July 2019 / Published: 9 July 2019
(This article belongs to the Special Issue Genome Editing in Plants)

Abstract

:
The Tunisian durum wheat germplasm includes modern cultivars and traditional varieties that are still cultivated in areas where elite cultivars or intensive cultivation systems are not suitable. Within the frame of a collection program of the National Gene Bank of Tunisia (NGBT), durum wheat germplasm was collected from different Tunisian agro-ecological zones. The collected samples were studied using simple sequence repeats (SSRs) markers to explore the genetic diversity and evaluate the genetic structure in Tunisian germplasm. The results demonstrated significant diversity in the Tunisian durum wheat germplasm, with clear differentiation between traditional varieties and modern cultivars. The population structure analysis allowed the identification of five subpopulations, two of which appear to be more strongly represented in germplasm collected in central and southern Tunisia, where environmental conditions at critical development phases of the plant are harsher. Moreover these subpopulations are underrepresented in modern varieties, suggesting that traits of adaptation useful for breeding more resilient varieties might be present in central and southern germplasm. Moreover, our results will support, the activity of in situ on farm conservation of Tunisian durum wheat germplasm started by the National Gene Bank of Tunisia along with the ex situ approach.

Graphical Abstract

1. Introduction

Durum (Triticum turgidum L. subsp. durum, genome AABB, 2n = 4× = 28) and common (Triticum aestivum L. subsp. aestivum, genome AABBDD, 2n = 6× = 42) wheats are species with significant agricultural importance as cereal grains throughout much of the world. In particular, durum wheat is grown mainly in the Mediterranean basin, and is primarily used for pasta, couscous and bread. Durum wheat, which originated in the Fertile Crescent, spread west of the Mediterranean basin, reaching the Iberian Peninsula and North Africa ca. 7000 years BC [1,2]. Wheat reached this area through Egypt, which acted as the bridge to the Fertile Crescent for the diffusion of wheat in North Africa. Other sources of wheat were maritime: wheat was introduced to Libya from Greece and Crete [3]. Moreover from the south of the Italian peninsula through the Sicily region, wheat reached the coasts of Tunisia, Morocco and Algeria [3]. This migration process, combined with both natural and human selection, led to the creation of local varieties along the Mediterranean basin that were well adapted to its different agro-ecological zones. Indeed, Tunisia and Algeria have a large collection of durum local varieties with great diversity, as observed for the first time by Boeuf in 1932 [4]. Contrasting environmental conditions of North Africa triggered a wide diversification of the durum wheat genome determining the development of several local populations. Thereby, North Africa is considered one of the principal secondary centers of diversification of durum wheat [5]. Studies on the origin and migration of durum wheat based on genetic diversity of landraces have shown that Tunisian landraces and those from the Mediterranean basin have a shared allelic identity and, consequently, that they originated from related seed sources and were exposed to similar environmental pressures and accumulated distinct mutations over time [6]. Durum wheat cultivation has continued to the present day as a staple food for local populations and possesses an outstanding socio-economical value as an important basic constituent of the diet in Maghreb countries [7,8].
In Tunisia during the 2018/2019 season, 0.5 M ha of durum wheat were cultivated, representing about 85% of the area devoted to wheat (common and durum), which in turn accounted for more than half of the cereal cultivated area [9]. The durum wheat germplasm cultivated includes about 45 varieties [10] grouped in (a) traditional varieties selected from Tunisian landraces (developed up to 1930s), (b) old cultivars produced by crossing Tunisian traditional varieties and foreign materials (developed up to 1970s) and (c) modern cultivars obtained in national and international breeding centers (developed up to present). The traditional varieties still prevail in rural areas where farmers still use traditional farming systems due to the impossibility of adopting modern intensive ones, or where this germplasm ensures tolerance to stresses [11,12]. The traditional varieties can be defined as the consequence of an empiric breeding program focused on exploiting the phenotypic variability among Tunisian durum landraces, such as ‘Biskri’, ‘Bidi’, ‘Mahmoudi’, ‘Chili’ and ‘Jenah Khottifa’ [7,8].
Several descriptions exist to define a ‘landrace’ [13,14]. Villa et al. [15] remarked that a landrace is ‘a dynamic population of a cultivated plant that has historical origin, distinct identity and lacks formal crop improvement, as well as often being genetically diverse, locally adapted and associated with traditional farming systems’. An autochthonous wheat landrace can be defined as a traditional variety with a high capacity to tolerate biotic and abiotic stresses, resulting in high yield stability and an intermediate yield level under a low input agricultural system [16]. Wheat landraces are valuable sources for broadening the genetic base of cultivated wheat. In fact, several studies using morphological, physiological and agronomic traits have shown that genetically diverse local germplasm well adapted to a broad range of environmental conditions can be considered an important reservoir of useful genes for exploitation in wheat breeding programs [17,18,19,20].
Molecular markers provide a satisfactory option for several genetic plant studies, since they are highly polymorphic and almost unlimited in number, do not vary among tissues or developmental stages of a plant and are not affected by environmental factors. Therefore, molecular markers can be used for genome analysis, and many of these have been applied with success for genetic mapping [21,22], cultivar identification [23] and diversity studies [19,20]. Different molecular markers have been developed (see review [24]). In particular, simple sequence repeats (SSRs) markers represent a useful alternative marker system because of their abundance in the wheat genome and easy detection as PCR-based molecular markers. Moreover, the advantages of SSRs include high information content, codominant inheritance, locus specificity and high reproducibility. Fifteen SSRs and five primer pair combinations of amplified fragment length polymorphism (AFLP) were tested by Medini et al. [10] in a wheat collection including Tunisian cultivars and wild wheat species. Cluster analysis separated the wild wheat species from the durum wheat cultivars, and these latter were further split in old and modern cultivars. The discriminant analysis carried out on 196 durum wheat lines issued from landraces collected in Tunisia and genotyped with diversity array technology sequencing (DArTseq) distinguished five groups that matched with the farmer’s variety nomenclature [25].
Nowadays, thanks to the activity of the National Gene Bank of Tunisia (NGBT), a program to collect durum wheat germplasm has been started. This program includes the idea of fostering the cultivation of traditional Tunisian durum germplasm by on farm conservation [26]. Within this framework, the maintenance and sustainable management of the genetic diversity present in autochthonous durum wheats are an absolute priority in order to preserve this genetic heritage, ensure food sovereignty and help smallholders cope with climate change. In this context the main goals of this work were to: (i) explore the genetic diversity in Tunisian durum wheat germplasm collected in different agro-ecological regions; (ii) evaluate the genetic structure of the Tunisian durum wheat genotypes; and (iii) clarify synonymy cases among the Tunisian durum wheat samples collected.

2. Results

2.1. Agro-Ecological Conditions of Tunisian Durum Wheat Zones

The socio-agro-ecological zones of Tunisia follow a distribution similar to the natural regions (Figure 1). In the North, the agro-ecological zone of ‘Kroumirie and Mogods’ has an average yearly rainfall between 650 and 1500 mm, with severely reduced seasonal and annual variability. This area has two well-identified seasons: a wet season from October to April, and a dry season from June to September (Figure S1). In the Center, the agro-ecological zone of ‘Dorsal and Tell’ is formed by two different climatic units, due to the presence of mountain ridges that intercept the humid currents from the Mediterranean (Figure 1). This is a semi-arid bio-climate with cool and temperate winters and precipitations varying with the elevations (higher in the mountain area and lower moving East). The South is characterized by an arid Mediterranean climate with a long dry season (8–9 months) and rainfall ranging from 100 to 200 mm (Figure S1).
In these three zones, the production of durum wheat shows a strong North-to-South decline along the cline determined by the bio-climate of the areas, as reported by Latiri et al. [27]. The durum wheat germplasm utilized in the present study is representative of the three agro-ecological zones previously described.

2.2. Genetic Diversity

A set of 16 selected simple sequence repeats (SSR) markers were used to study the genetic diversity in a durum wheat collection including 41 Tunisian samples and 13 cultivars (Table 1). A total of 95 alleles was obtained, ranging from 13 (Xgwm193) to 2 (Xgwm154). The polymorphism information content (PIC) was used to evaluate the informativeness of SSRs. The PIC mean value of the 16 SSRs was 0.57 with a range from 0.82 (Xgwm193) to 0.28 (Xwmc406) as reported in Table 1. A strong relationship (r = 0.84***; p < 0.001) was observed between the number of alleles and PIC values. The Shannon’s information index (I) value ranged from 2.07 (Xgwm193) to 0.51 (Xwmc406). The expected heterozygosity (He), which corresponds to heterozygosity at a single locus, ranged from 0.28 (Xwmc406) to 0.82 (Xgwm193). The fixation index (F), which compares the expected heterozygosity (He) with observed heterozygosity (Ho) to estimate the degree of allelic fixation, ranged from –0.30 (Xgwm154) to 1.00 (Xbarc45 and Xgwm193 having all the alleles fixed) (Table 1). The F mean value was found to be 0.82 for the whole collection, and F values were positive in 15 SSR markers, revealing that the majority of the alleles were fixed.
Based on the dissimilarity matrix, a neighbor-joining dendrogram clearly showed the presence of two main clusters (Figure 2). The first cluster included 24 Tunisian durum wheat samples and 12 cultivars. This group included nine Tunisian durum wheat cultivars, suggesting a genetic relationship among them. Indeed, Karim and Razzak were the parental lines of several modern durum cultivars obtained from the breeding programs of the National Agronomic Research Institute of Tunisia (INRAT). The second cluster incorporated mainly Tunisian samples and the cultivar Taganrog. In this cluster, the group constituted by four Tunisian durum samples, (Chili_Lans, Chili_Msaken, Chili_Kef and Aouija_Chorb) was found to be genetically identical. This result suggests that, probably, the name ‘Aouija’ could have been erroneously attributed by local farmers to Chili, although morphologically different. Moreover, four Tunisian durum samples named Biskri_Saou, Biskri_OS, Biskri_Jouf and Biskri_Gafsa were found to be genetically identical and undistinguishable from three samples named Mahmoudi_OS, Mahmoudi_Jouf and Mahmoudi_Site1, thus suggesting a putative case of synonymy. The two main clusters identified in the dendrogram were used to calculate the AMOVA, revealing that 22% of the total variation was found among the clusters while the rest (78%) was within clusters (Table 2). Finally, cluster analysis distinguished the samples with white glumes and black awns from the rest of samples. The durum wheat samples with these traits are included in the second cluster, confirming that the landraces Mahmoudi, Biskri and Chili were similar in these traits [8].

2.3. Genetic Structure

For population genetic structure analysis, Bayesian clustering modeling was performed using STRUCTURE software with genotyping data generated according to 16 SSR markers. As the clustering model presumes the underlying existence of K clusters, an Evanno [29] test was performed and yielded K = 5 as the highest log-likelihood (Figure S2). In this way, the durum wheat collection showed a genetic structure split into five subpopulations. A durum wheat sample was considered belonging to a subpopulation if its membership coefficient (Q) was > 0.60, as suggested by Chen et al. [30]. The five subpopulations obtained by the Bayesian method were used to calculate the AMOVA, revealing that 37% of the total variation was found among the subpopulations, while the rest of variation (63%) was within subpopulations (Table 3).
The collection was divided in four groups: three included the Tunisian durum wheat samples, spilt according to the agro-ecological zones of sampling location (North, Center, and South); the fourth group included the modern durum cultivars (Figure 3). In each group, the mean Q of the five subpopulations, detected by structure analysis, was calculated and showed a strong genetic stratification. In particular, two main subpopulations (in orange and red) were relatively abundant in Tunisian durum samples, but rare (<10%) in modern durum cultivars. Two subpopulations (in orange and green) were found the main genetic components (some 80%) of durum wheat samples collected in the South of Tunisia. A subpopulation (in yellow) was present at a frequency >60% in modern durum cultivars and almost absent (<1%) in durum wheat samples collected in the South of Tunisia. The AMOVA confirmed that 9% of the total variation was found among Tunisian durum samples split according agro-ecological zones, while the rest (91%) was within groups (Table 4).

3. Discussion

During the second half of the last century, a significant increase in wheat yield was observed in Tunisia. This was a consequence of the introduction of modern high-yielding varieties able to optimize water and soil resources, as well as a result of improvements in agronomic techniques, such as better crop management [7,8].
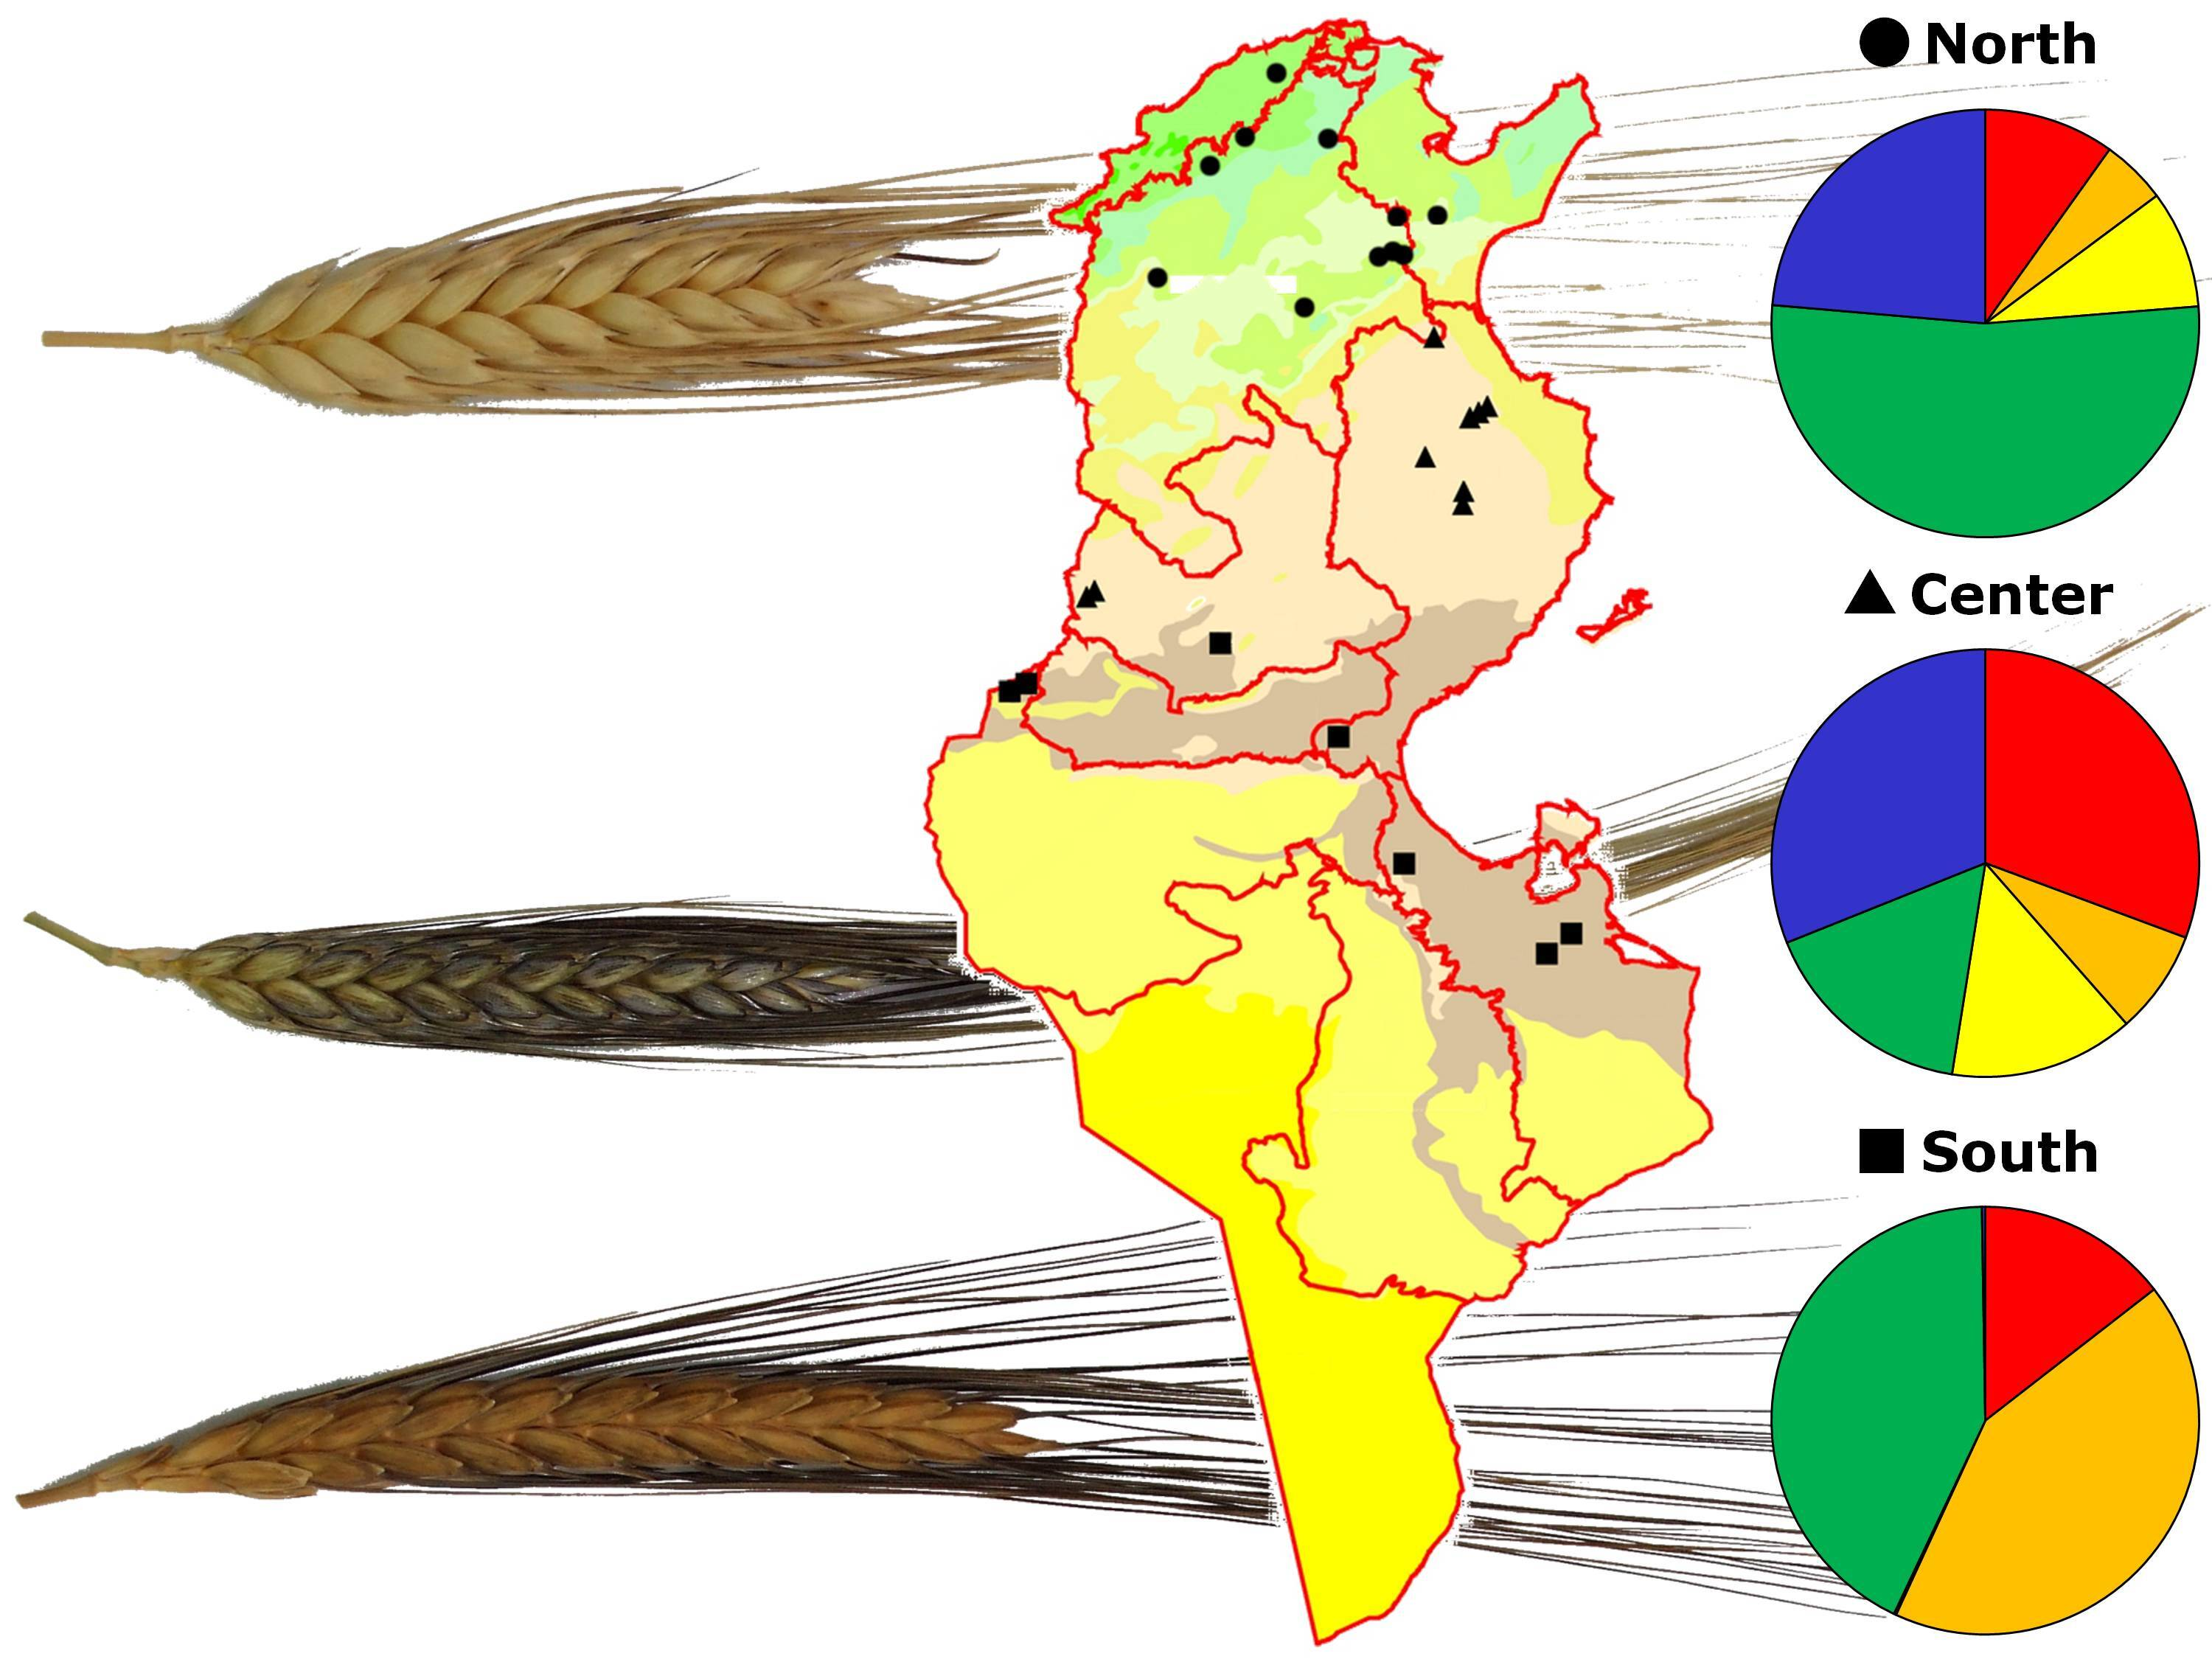
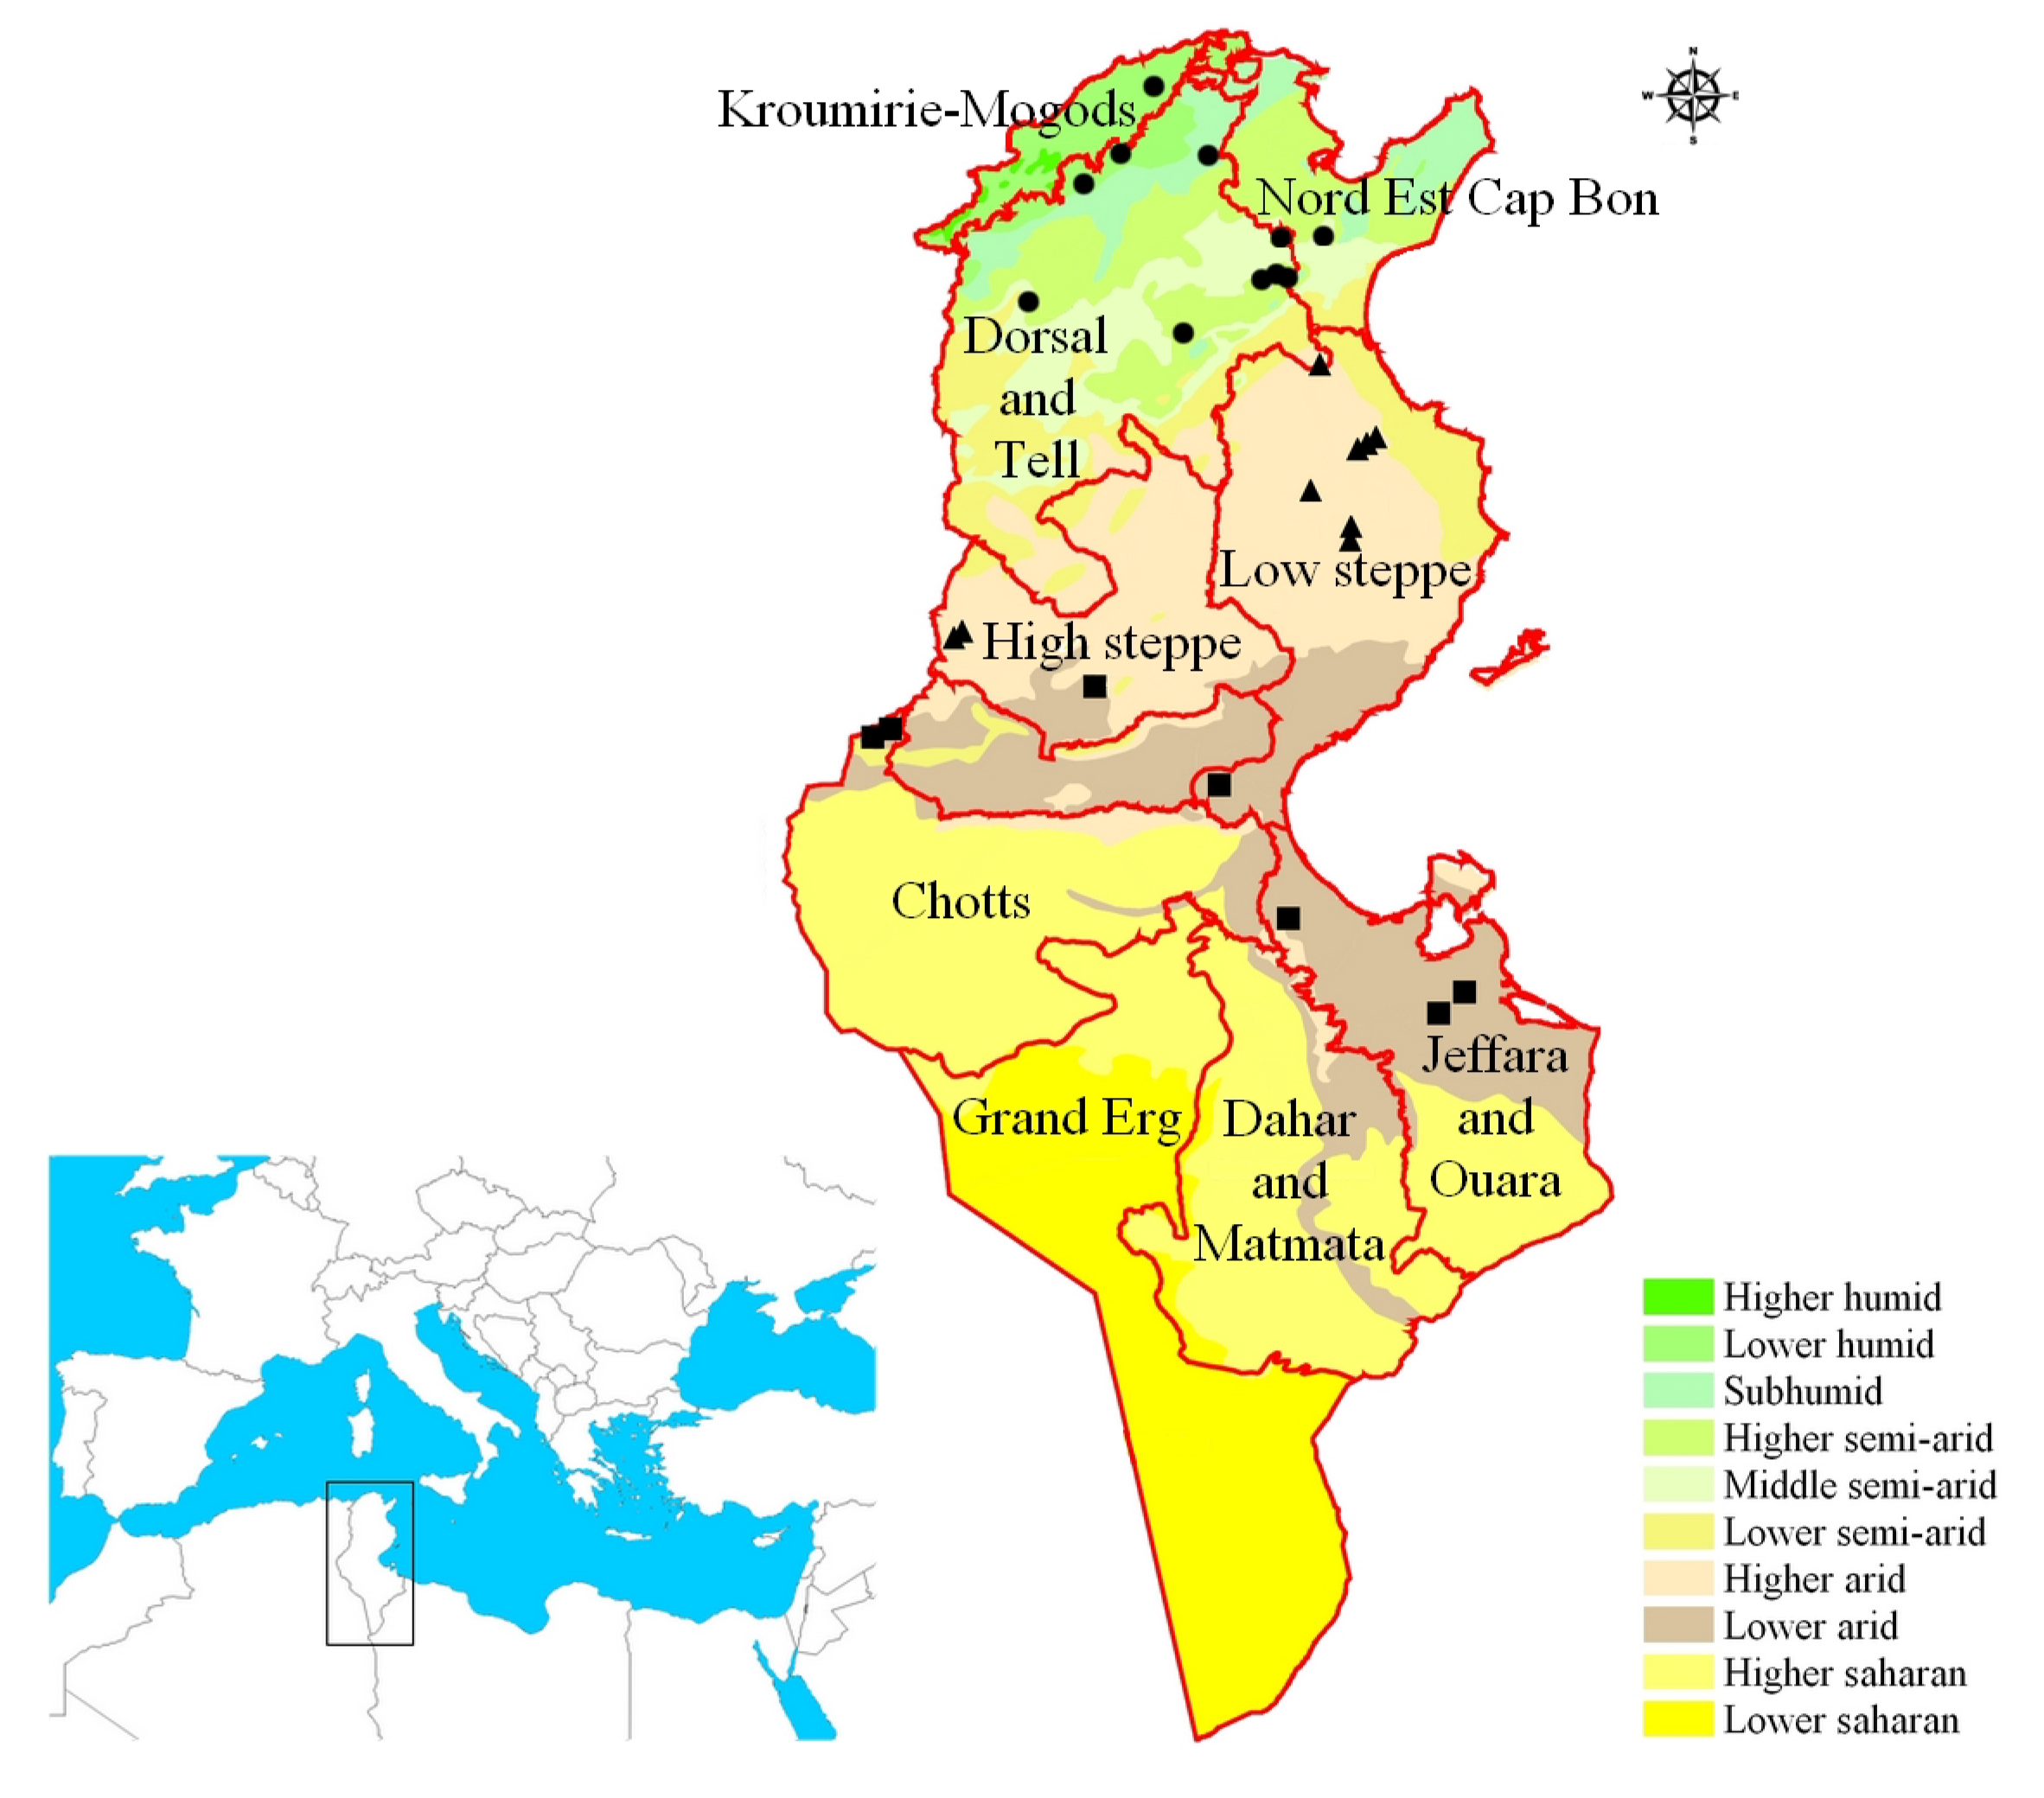
In Tunisia, as in the whole Mediterranean region, rainfall is highly variable in its yearly distribution [27]. The overall yearly rainfall is differently distributed over the country, with northern regions much wetter than the Center and South (Figure 1 and Figure S1). The growing season of wheat, with sowing between November and December, extends through the wet and cool season when in central/southern regions there is a reduced level of precipitation but evaporation is relatively low, thus securing enough water for the plants’ needs. More critical is the period between April and May, the period of flowering-to-grain filling, when high temperatures or drought stress can dramatically reduce kernel setting, and thus yield [22,27,31]. In this period, the difference in precipitation among the three regions of Tunisia drastically increases (Figure S1). Therefore, it is possible to suppose that plants adapted to central and principally southern environments should possess traits of adaptation, allowing them to escape from these limiting environmental conditions.
In our study, a set of 16 SSR markers with a good coverage of the A and B genomes of durum wheat were tested in the composed durum wheat collection. They allowed the identification of 95 alleles, with an average of 5,9 alleles/SSR locus. The considerable number of alleles was due to the multi-allelic nature of these markers that facilitates variability detection [32]. Similar results were reported by Chen et al. [30] in a Chinese winter wheat collection, although a large range of alleles per locus (4.5–18.1) was reported in the literature for a wider germplasm collection [33,34]. The genetic diversity of the collection (He = 0.58) was similar to the values reported by previous studies involving durum wheat collections (He values between 0.55 and 0.68) [33,35].
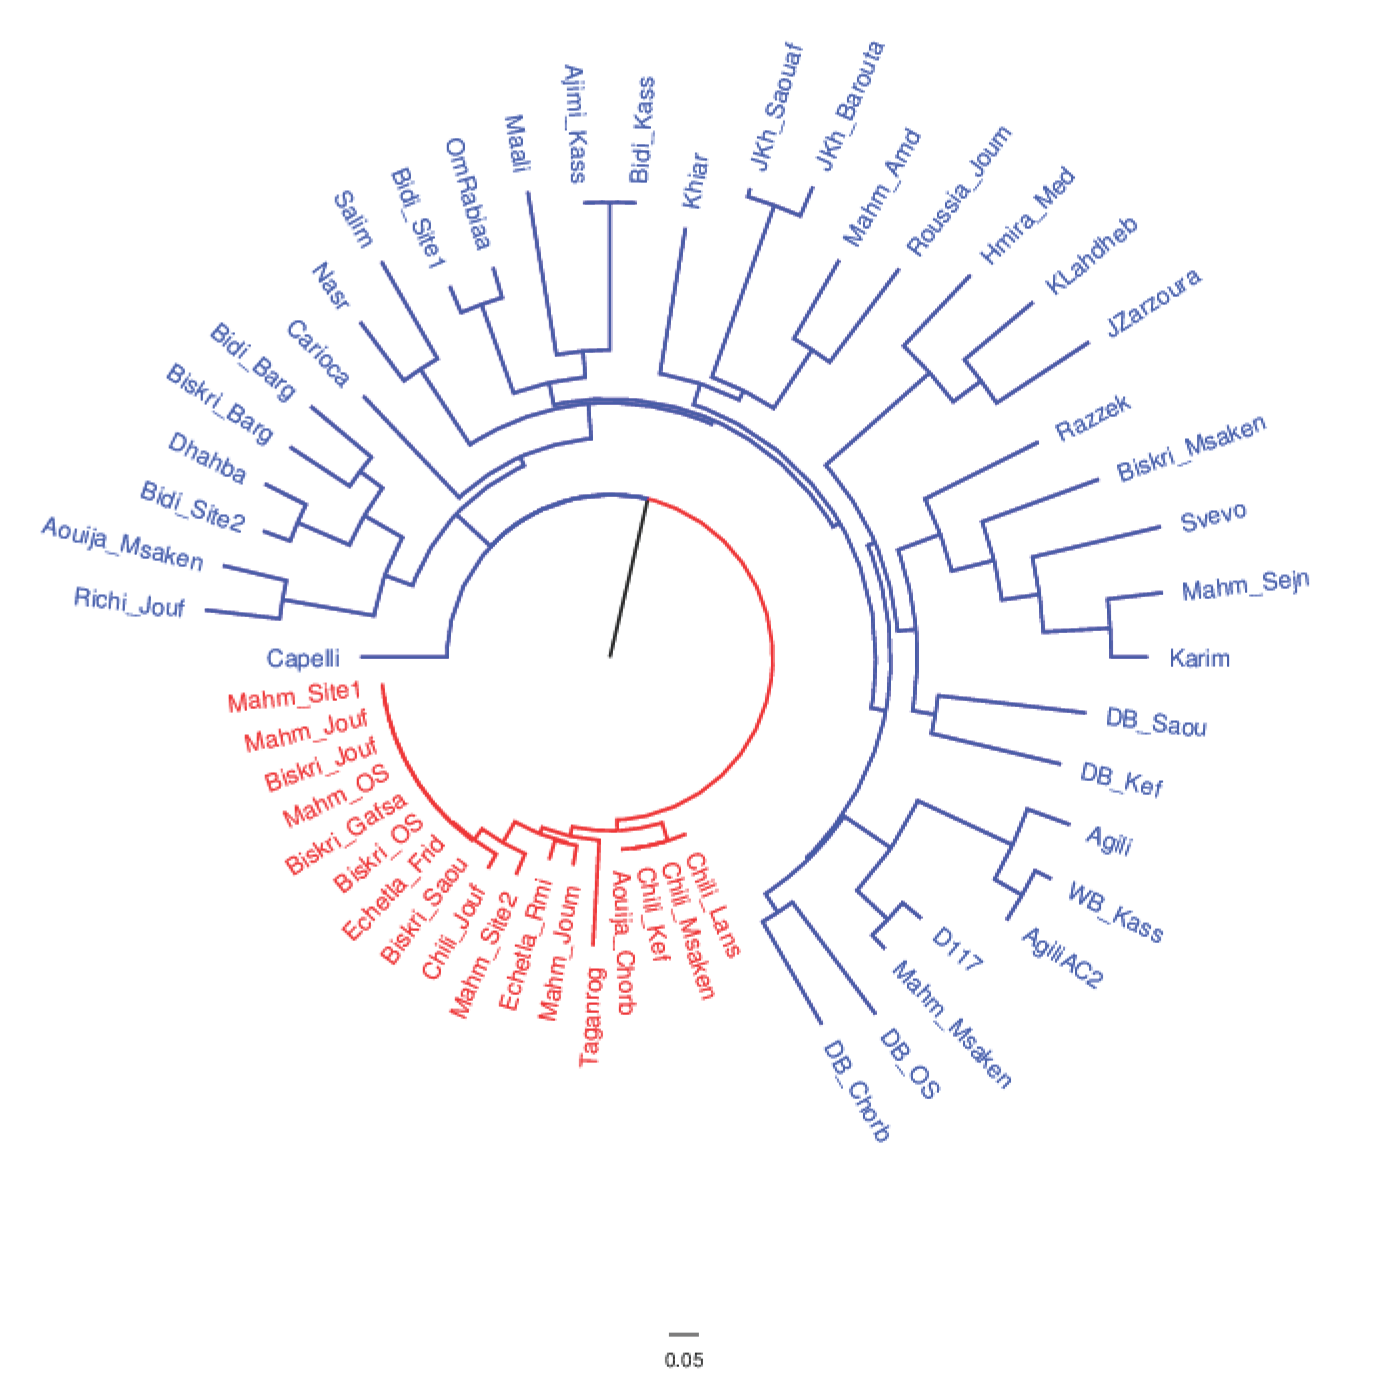
To define the genetic distances among samples, the matrix obtained with a simple matching coefficient was also used to produce a neighbor-joining dendrogram (Figure 2). This dendrogram clearly divided collected germplasm into two distinct groups: the one hosting only traditional varieties, (mostly Biskri, Mahmoudi and Chili), and one with a more assorted composition (including both traditional and modern varieties). In this latter group, the distances separating the entries are much higher than in the former one, which we will refer to as the ‘core traditional varieties’ (CTVs) group.
To better investigate this result, an analysis of the molecular variance was performed to test different sources of variation. In the first instance, we tested the distribution of molecular variation among the CTV group and the rest of the analyzed germplasm. The results clearly indicate that the CTV group is unquestionably differentiated from the rest of the analyzed material, since 22% of the total variation is between the two groups of samples (Table 2). In a second run, three groups were tested: the CTV, the one formed by entries described by farmers as traditional varieties and, finally, modern cultivars. In this case, AMOVA demonstrated that the distribution of the molecular variance conformed to the grouping, even though at a lower extent than in the former analysis (Table S1).
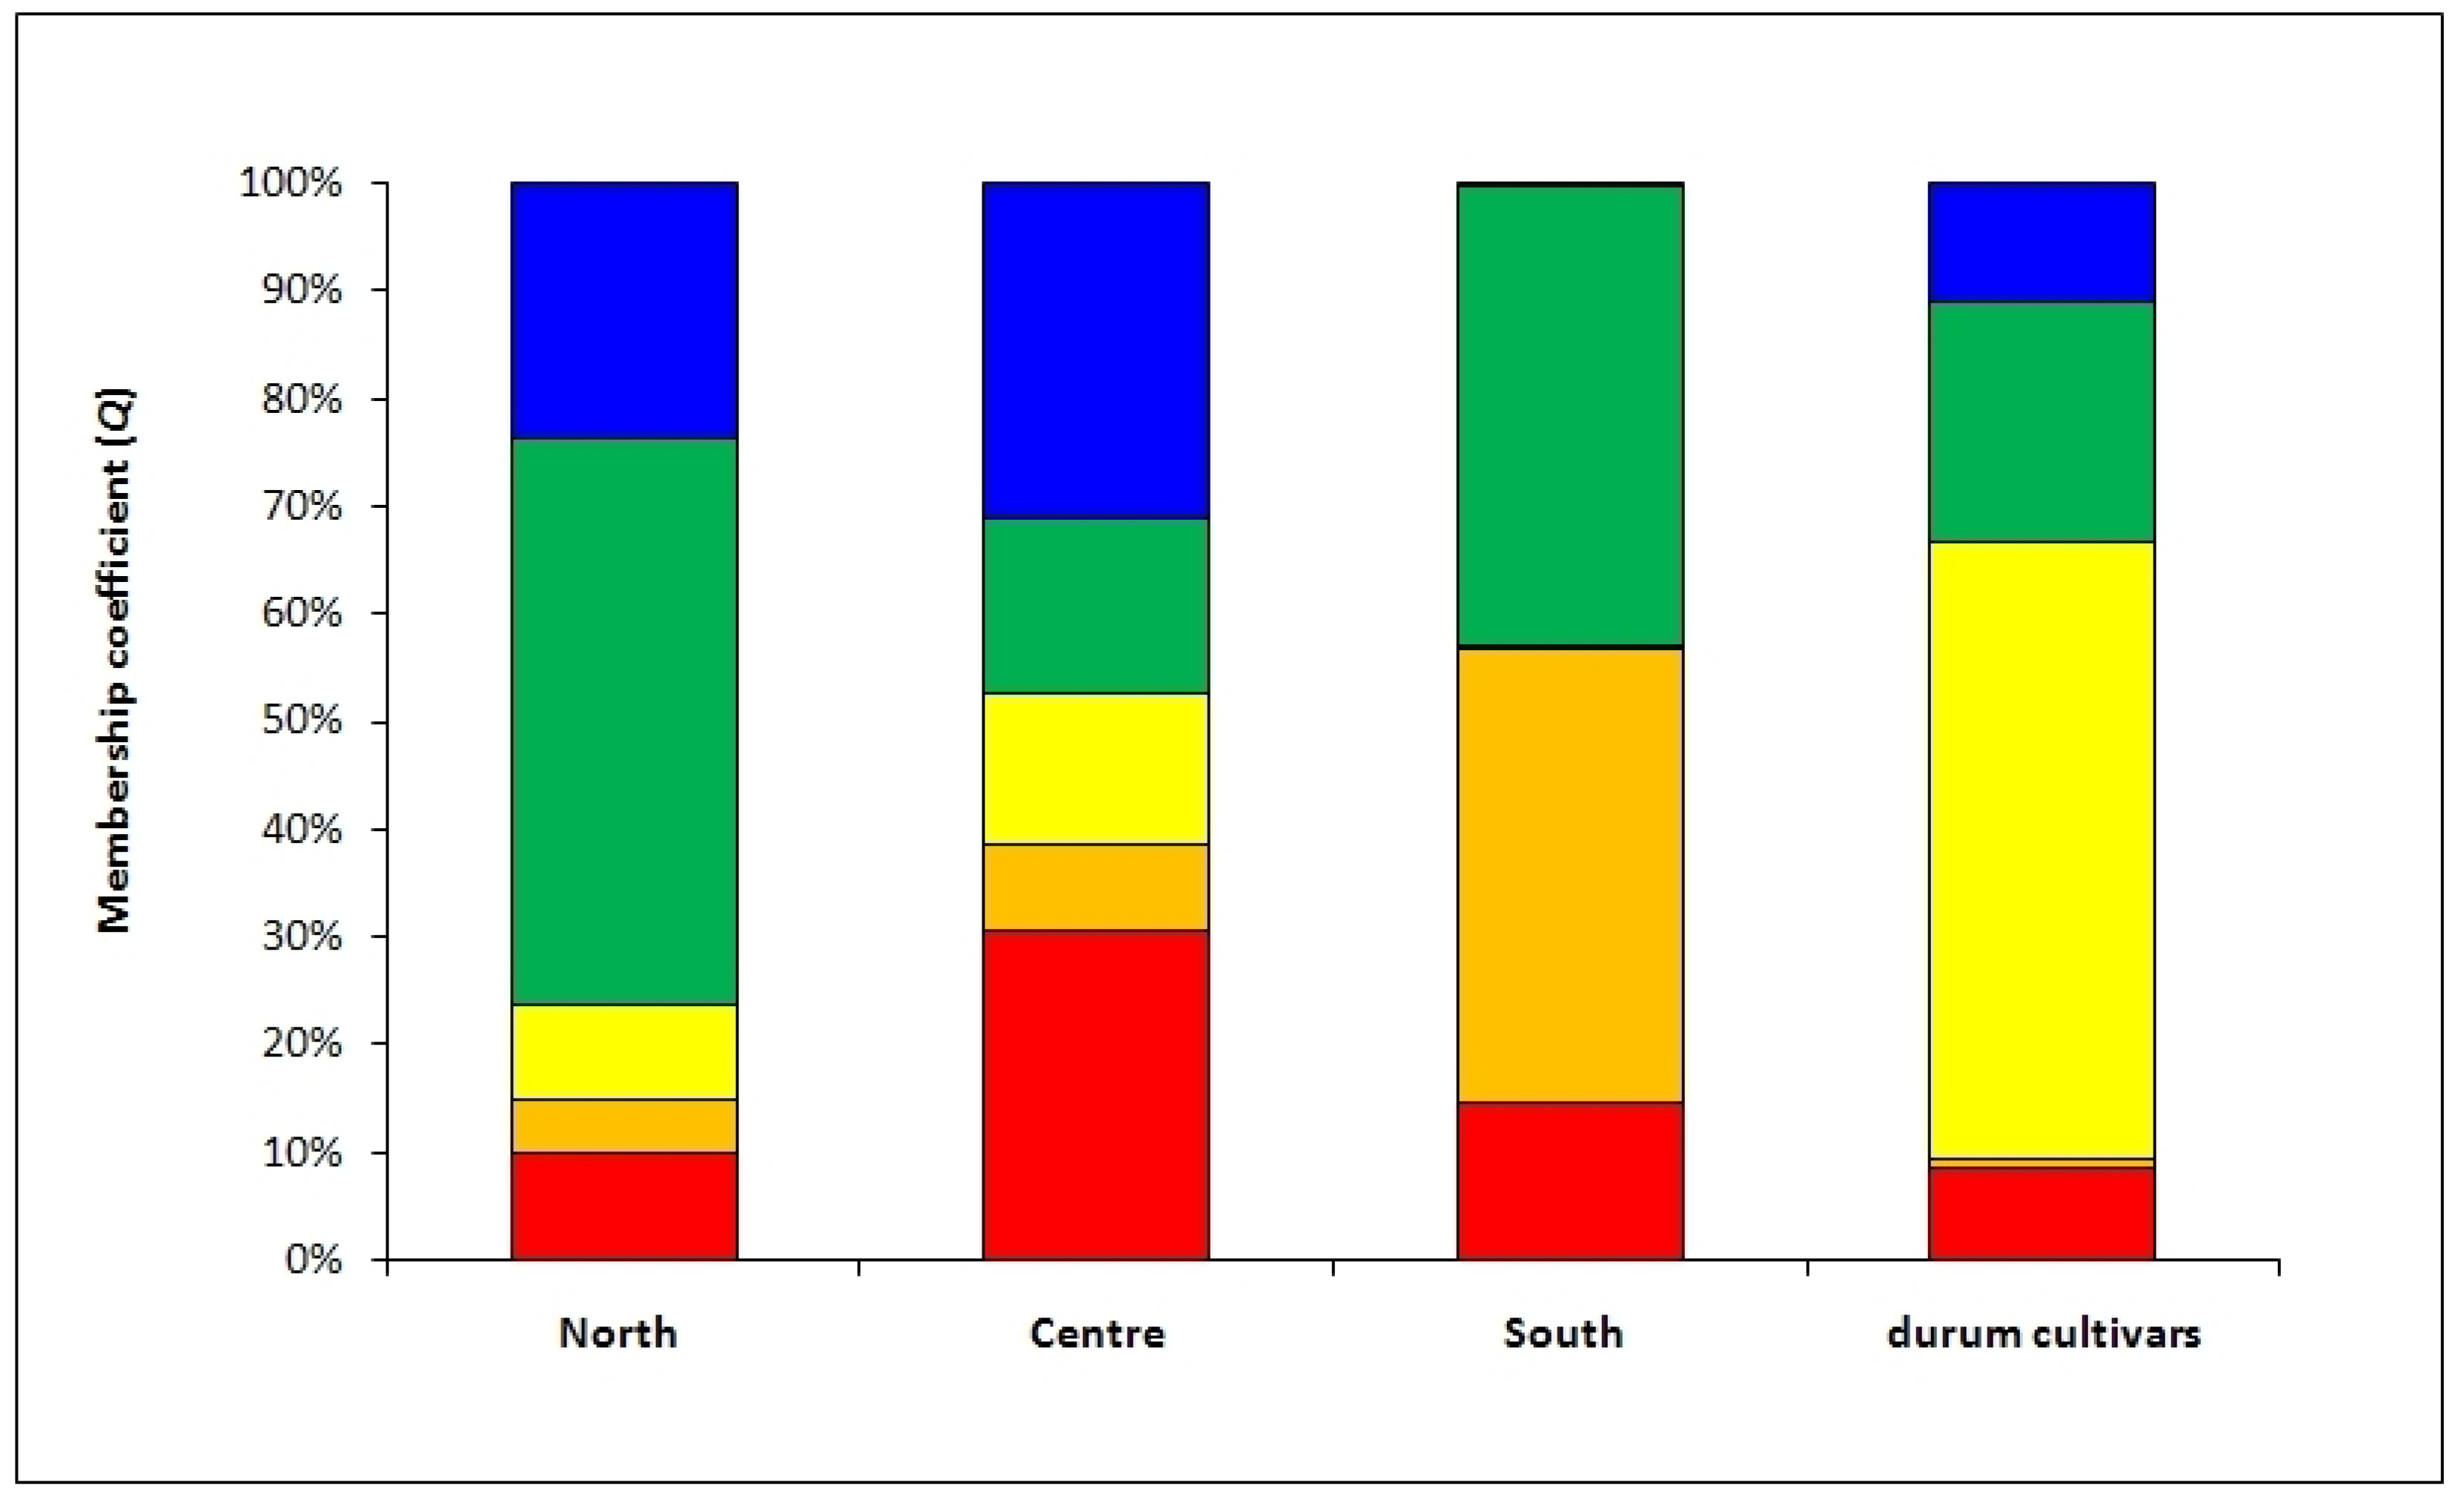
Nevertheless, the above analyses did not provide any information on the distribution of genotypes along the geographic cline. To this end a Bayesian approach was utilized by analyzing genotypic data through the STRUCTURE software. Structure analysis assigns each genotype to a specific subpopulation and five different ones were identified after the Evanno test [29]. The robustness of these results was confirmed by the AMOVA used to test the distribution of variation among and within these five subpopulations. In fact, the AMOVA indicated that 37% of the total variation observed was among these five groups (
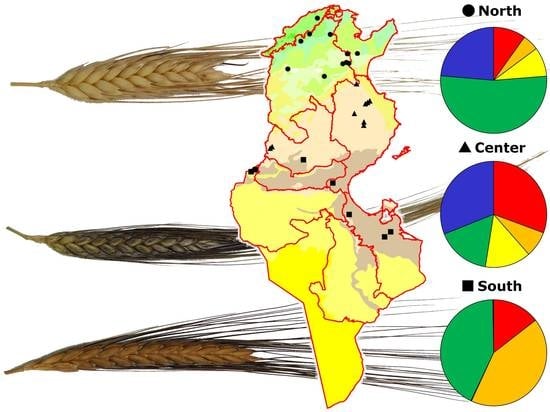
Table 3). After assigning each genotype to a specific subpopulation, as described in the results section, we tested the richness of each subpopulation using the three collection zones (North, Center, and South) as discriminating factors for Tunisian samples; a fourth discriminating factor was the modern durum cultivars (see Figure 3).
The approach described above allowed us to observe that some genotypes (belonging to the subpopulations indicated with the colors red and orange in Figure 3) were increasingly frequent along the North–South cline, while at the same time the modern cultivars tended to be decreasingly represented. Conversely, in the modern cultivars, the presence of traditional germplasm was scarce.
This picture indicates that: (a) modern varieties are more fit for cultivation in the northern part of Tunisia, where the rainfall is adequate for new high-yielding varieties that develop their full potential only in the presence of moderate to high inputs; (b) there is an increased presence of traditional varieties and CTVs in the Center and South groups, which are characterized by reduced and more erratic precipitations.
These findings indicate that the traditional varieties, originally developed from North African landraces, might possess traits of resistance to unfavorable climatic conditions that are absent in the modern cultivars. This is not surprising since landraces and derived traditional varieties are the result of a non-scientific process of selection driven by farmers’ cultural values and by natural adaptation to local environment [13].
The fact that some old cultivars, such as AgiliAC2, are still called by the names of traditional varieties might be the result of different causes. In fact, the improved material of the 1970s–1990s might have been distributed using the names of the traditional varieties in order to overcome the diffidence of more traditional farmers against innovations. Another reason might reside in a phenotypic resemblance of some morphological traits of the new introductions with those of the CTVs, or by the misnaming of landraces during seed exchange among farmers or during the collecting missions undertaken by the NGBT [25].
In conclusion, our results showed that the molecular markers distinguished Tunisian durum wheat germplasm (named the CTV group) and detected putative synonymy and homonymy cases. These results could be useful to increase ex situ conservation efficiency, because SSRs allow the detection of redundant duplications within durum germplasm conserved in the NGBT. In situ on-farm conservation, in addition to the ex situ approach, could ensure the long-term conservation of genetically diverse Tunisian durum wheat available in local germplasm, which is a reservoir of genes for drought, heat and salinity tolerance and quality traits. The traditional varieties could help maintain the use of local knowledge and challenge ongoing genetic erosion due to the spread of modern pure line cultivars.
The population structure analysis suggests a strong genetic stratification along the North–South cline of Tunisia. This could be the result of breeding programs from the second half of the last century that produced high-yielding varieties for the northern highly productive areas rather than tackling the agro-ecological conditions of the Center and South.
The strategy of incorporating adaptation traits found in the genetic diversity pool of landraces and traditional varieties into modern breeding programs is widely supported [36]. In this way it will also be possible to contend with the challenges imposed by climate change and the survival of agriculture in marginal lands [36,37,38]. Correct and scientifically driven programs aiming at in situ conservation of agro-biodiversity on farms are essential, particularly for those species that are the food staple of Mediterranean populations and Tunisians in particular, such as durum wheat [39]. In fact, the end-use caracteristics are among the selection drivers used by past farmers during the non-scientific selection of traditional landraces. This explains the preference of genotypes providing better couscous or more valuable tabouna (a traditional sort of bread).

4. Materials and Methods

4.1. Plant Material

A durum wheat collection including 41 Tunisian samples (Table 5) and 13 cultivars (Table 6) were considered in this study. The Tunisian durum samples, named as indicated by the farmers, were collected during 2012–2018 (Figure 1) and conserved by the National Gene Bank of Tunisia (NGBT). The Tunisian durum cultivars (9), and French durum cultivar (Carioca) were obtained from NGBT, while the three Italian durum cultivars (Cappelli, Svevo and Taganrog), used as references, were obtained from the Department of Soil, Plant and Food Sciences (DiSSPA), Sect. Genetics and Plant Breeding, University of Bari Aldo Moro (Italy).
The data of monthly rainfall were obtained from the National Institute of Meteorology of Tunisia and derived from the mean of the last 30 years (1988–2018). The data were recorded at three stations in the North (Bizerte, Tunis and Tabarka), three stations in the Center (Kairouan, Monastir and Sfax) and two stations in the South (Djerba and Tozeur).

4.2. DNA Extraction and SSR Assays

The genomic DNA was extracted from 3 g of fresh young leaves from a single plant for each sample using the cetyltrimethyl ammonium bromide (CTAB) method [44]. The DNA quality was evaluated in agarose gel (0.8%) (Biomatik, Wilmington, DE, USA) and quantified using NanoDropTM ND2000 (Thermo Scientific, MA, USA). All samples were normalized to a standard concentration of 50 ng by adding HPLC-grade water (Sigma Aldrich, St. Louis, MO, USA). The durum wheat collection was evaluated with a set of 16 simple sequence repeats (SSRs) markers (reported in Table 1). The SSRs were selected based on the consensus map of tetraploid wheat [45] and following criteria proposed by Laidò et al. [43]: locus-specific amplification, low complexity, robust amplification and good genome coverage (nearly one marker for each chromosome arm). The sequence primers were available in the GrainGenes database [46]. The amplification reactions were performed in a final volume of 20 μL, containing the template DNA (50 ng) forward primer with the M13 (−21bp) tail at its 5′ end (0.06 μM), reverse primer (0.16 μM), M13 primer labeled with 6-Carboxyfluorescein (6-FAM) (0.05 μM) or 2’-chloro-5’-fluoro-7’,8’-fused phenyl-1.4-dichloro-6-carboxyfluorescein (NED) (0.10 μM), or 2′-chloro-7′phenyl-1,4-dichloro-6-carboxy-fluorescein (VIC) (0.05 μM), dNTPs (2 mM), buffer (1×) and Taq DNA polymerase (0.6 U). PCR reactions were performed in a thermal cycler (Bio-Rad Laboratories, Hercules, CA, USA) as follows: an initial denaturing step at 94 °C for 3 min, followed by 35 cycles of 94 °C for 1 min, 59 °C for 1 min, 72 °C for 2 min and a final extension step at 72 °C for 7 min. In order to verify the PCR efficiency, the PCR fragments were separated on 2.0% agarose gels containing Nancy-520 DNA Gel Stain (Sigma Genosys, St. Louis, MO, USA), and visualized under UV light. The amplification products were detected by the automatic capillary sequencer ABI PRISM 3100 Genetic Analyzer (Applied Biosystems, Waltham, MA, USA), and the sample analyses were carried out with GeneMapper genotyping software version 5.0 (Figure S3). The internal molecular weight standard was GeneScanTM 600 LIZ dye Size Standard (ThermoFisher Scientific, Waltham, MA, USA).

4.3. Data Analysis

The genetic indices as number of alleles (Na), Shannon’s information index (I), heterozygosity observed (Ho), heterozygosity expected (He) and fixation index (F = He − Ho/He) were calculated using the GenAlEx program version 6.5 [47,48]. The informativeness of SSR markers was measured by the polymorphism information content (PIC) according to Weber [49] and Anderson et al. [50]. The allelic data was used to obtain the dissimilarity matrix using the simple matching coefficient by DARwin program version 6.01 [51]. This dissimilarity matrix was utilized for constructing the dendrogram using the neighbor-joining algorithm [52]. The confidence interval of the genetic relationships among the samples was determined by 1000 bootstraps.
The molecular data were processed using the STRUCTURE program version 2.3.4 [53]. The number of sub-populations (K) was estimated by 20 independent runs for each K (from 2 to 20) applying the admixture model, 100,000 Markov Chain Monte Carlo (MCMC) repetitions and a 100,000 burn-in period. The means of the log-likelihood estimates for each K were calculated. The true K was determined using the Evanno ΔK [29] using STRUCTURE HARVESTER [54,55]. Analysis of molecular variance (AMOVA) was used to partition the genetic variation into inter- and intra-gene pool diversities in the durum wheat collection using GenAlEx program version 6.5 with 1000 permutations.

Supplementary Materials

Supplementary materials can be found at https://0-www-mdpi-com.brum.beds.ac.uk/1422-0067/20/13/3362/s1. Figure S1: Monthly rainfall (mm) in the three Tunisian macro areas: North (in green), Center (in red) and South (in yellow). Figure S2: Delta ΔK for differing numbers of subpopulations (K) estimated in durum wheat collection with 16 SSR markers. Table S1: Analysis of molecular variance (AMOVA) of durum wheat collection split in three groups: Core Traditional Varieties (CTVs), entries named as traditional varieties by farmers and durum cultivars. Figure S3: Electropherogram of Tunisian durum wheats D117 and Agili AC2 tested with Xgwm193 SSR marker labeled with fluorescent dye NED. The alleles 182 and 186 bp were found in D117 and Agili AC2 durum samples, respectively.

Author Contributions

Conceptualization, A.S. and G.M.; Formal analysis, A.S., L.P., H.C.K. and M.R.; Funding acquisition, R.C., C.M., G.M. and D.P; Investigation, A.S., L.P., H.C.K., M.R., C.R., R.C., D.P. and G.M.; Methodology, G.M. and D.P.; Resources, A.S. and C.R.; Supervision, G.M.; Validation, A.S. and G.M.; Writing—original draft, A.S. and C.R.; Writing—review & editing, A.S., D.P. and G.M.

Funding

The work was carried out within the framework of the project “Ressources phytogénétiques tunisiennes mieux conservées et valorisées”, funded by the Italian Cooperation to the Tunisian Ministry of Local Affairs and Environment.

Acknowledgments

The authors wish to thank Amine Hmid, Anis Khlij, Alberto Dragotta, of Mediterranean Agronomic Institute of Bari, Italia (CIHEAM-IAM), Olfa Saddoud, and Mbarek Ben Naceur, of National Gene Bank of Tunisia for project administration.

Conflicts of Interest

The authors declare no conflict of interest.

Abbreviations

NGBTNational Gene Bank of Tunisia
CTABCetylTrimethyl Ammonium Bromide
SSRSimple Sequence Repeat
NaNumber of alleles
IShannon’s information index
HoHeterozygosity observed
HeHeterozygosity expected
FFixation index
PICPolymorphism Information Content
MCMCMarkov Chain Monte Carlo
AMOVAAnalysis of molecular variance
CTVCore Traditional Varieties

References

  1. Feldman, M. Origin of cultivated wheat. In The World Wheat Book: A History of Wheat Breeding; Bonjean, A.P., Angus, W.J., Eds.; Lavoisier: Paris, France, 2001; pp. 3–56. [Google Scholar]
  2. Nazco, R.; Villegas, D.; Ammar, K.; Peña, R.J.; Moragues, M.; Royo, C. Can Mediterranean Durum Wheat Landraces Contribute to Improved Grain Quality Attributes in Modern Cultivars? Euphytica 2012, 185, 1–17. [Google Scholar] [CrossRef]
  3. Bonjean, A. Histoire de la culture des céréales et en particulier de celle du blé tendre (Triticum aestivum L.). Dossier de L’environnement de l’INRA 2001, 21, 29–37. (In French) [Google Scholar]
  4. Boeuf, F. Le blé en Tunisie: La Plante. Le Milieu Physico-Chimique; Société Anonyme de L’Imprimerie Rapide de Tunis: Tunis, Tunisia, 1932; Volume 1. [Google Scholar]
  5. Harlan, J.R. Agricultural origins: Centers and noncenters. Science 1971, 174, 468–474. [Google Scholar] [CrossRef] [PubMed]
  6. Kabbaj, H.; Sall, A.T.; Al-Abdallat, A.; Geleta, M.; Amri, A.; Filali-Maltouf, A.; Belkadi, B.; Ortiz, R.; Bassi, F.M. Genetic Diversity within a Global Panel of Durum Wheat (Triticum durum) Landraces and Modern Germplasm Reveals the History of Alleles Exchange. Front. Plant Sci. 2017, 8, 1277. [Google Scholar] [CrossRef]
  7. Daaloul, A.; Harrabi, M.; Amara, H. Evaluation de la collection nationale de blé dur. In Revue de l’INAT; Institut National Agronomique de Tunisie: Tunis, Tunisia, 1997; pp. 337–358. (In French) [Google Scholar]
  8. Deghaïs, M.; Kouki, M.; Gharbi, M.S.; El Felah, M. Les Variétés de Céréales Cultivées en Tunisie (blé dur, blé Tendre, orge et Triticale); INRAT: Tunis, Tunisia, 2007. (In French) [Google Scholar]
  9. USDA. Available online: http://www.fas.usda.gov/data/tunisia-grain-and-feed-annual-2 (accessed on 30 April 2019).
  10. Medini, M.; Hamza, S.; Rebai, A.; Baum, M. Analysis of genetic diversity in Tunisian durum wheat cultivars and related wild species by SSR and AFLP markers. Genet. Resour. Crop Evol. 2005, 52, 21–31. [Google Scholar] [CrossRef]
  11. FAO. Roles and importance of biodiversity for food and agriculture. In The State of the World’s Biodiversity for Food and Agriculture; Bélanger, J., Pilling, D., Eds.; FAO Commission on Genetic Resources for Food and Agriculture Assessments: Rome, Italy, 2019; pp. 17–62. ISBN 978-92-5-131270-4. [Google Scholar]
  12. Jaradat, A. Wheat landraces: A mini review. Emir. J. Food Agric. 2013, 25, 20–29. [Google Scholar] [CrossRef]
  13. Harlan, J.R. Chapter 7. In Crops and Man, 1st ed.; American Society of Agronomy: Madison, WI, USA, 1975; pp. 150–189. [Google Scholar]
  14. Casañas, F.; Simó, J.; Casals, J.; Prohens, J. Toward an evolved concept of landrace. Front. Plant Sci. 2017, 8, 145. [Google Scholar] [CrossRef] [PubMed]
  15. Villa, T.C.C.; Maxted, N.; Scholten, M.; Ford-Lloyd, B. Defining and identifying crop landraces. Plant Genet. Resour. 2005, 3, 373–384. [Google Scholar] [CrossRef] [Green Version]
  16. Zeven, A.C. Landraces: A review of definitions and classifications. Euphytica 1998, 104, 127–139. [Google Scholar] [CrossRef]
  17. Lopes, M.S.; El-Basyoni, I.; Baenziger, P.S.; Singh, S.; Royo, C.; Ozbek, K.; Aktas, H.; Ozer, E.; Ozdemir, F.; Manickavelu, A.; et al. Exploiting Genetic Diversity from Landraces in Wheat Breeding for Adaptation to Climate Change. J. Exp. Bot. 2015, 66, 3477–3486. [Google Scholar] [CrossRef]
  18. Pignone, D.; De Paola, D.; Rapanà, N.; Janni, M. Single seed descent: A tool to exploit durum wheat (Triticum durum Desf.) genetic resources. Genet. Resour. Crop Evol. 2015, 62, 1029–1035. [Google Scholar] [CrossRef]
  19. Mangini, G.; Margiotta, B.; Marcotuli, I.; Signorile, M.A.; Gadaleta, A.; Blanco, A. Genetic diversity and phenetic analysis in wheat (Triticum turgidum subsp. durum and Triticum aestivum subsp. aestivum) landraces based on SNP markers. Genet. Resour. Crop Evol. 2017, 64, 1269–1280. [Google Scholar]
  20. Mangini, G.; Nigro, D.; Margiotta, B.; De Vita, P.; Gadaleta, A.; Simeone, R.; Blanco, A. Exploring SNP diversity in wheat landraces germplasm and setting of a molecular barcode for fingerprinting. Cereal Res. Commun. 2018, 46, 377–387. [Google Scholar] [CrossRef] [Green Version]
  21. Mangini, G.; Taranto, F.; Delvecchio, L.N.; Pasqualone, A.; Blanco, A. Development and validation of a new Ppo-A1 marker useful for marker-assisted selection in tetraploid wheats. Mol. Breed. 2014, 34, 385–392. [Google Scholar] [CrossRef]
  22. Mangini, G.; Gadaleta, A.; Colasuonno, P.; Marcotuli, I.; Signorile, A.M.; Simeone, R.; De Vita, P.; Mastrangelo, A.M.; Laidò, G.; Pecchioni, N.; et al. Genetic dissection of the relationships between grain yield components by genome-wide association mapping in a collection of tetraploid wheats. PLoS ONE 2018, 13, e0190162. [Google Scholar] [CrossRef]
  23. Mangini, G.; Taranto, F.; Giove, S.L.; Gadaleta, A.; Blanco, A. Identification of durum wheat cultivars by a minimum number of microsatellite markers. Cereal Res. Commun. 2010, 38, 155–162. [Google Scholar] [CrossRef]
  24. Nadeem, M.A.; Nawaz, M.A.; Shahid, M.Q.; Doğan, Y.; Comertpay, G.; Yıldız, M.; Hatipoğlu, R.; Ahmad, F.; Alsaleh, A.; Labhane, N.; et al. DNA molecular markers in plant breeding: Current status and recent advancements in genomic selection and genome editing. Biotechnol. Biotechnol. Equip. 2018, 32, 261–285. [Google Scholar] [CrossRef]
  25. Robbana, C.; Kehel, Z.; Ben Naceur, M.; Sansaloni, C.; Bassi, F.; Amri, A. Genome-Wide Genetic Diversity and Population Structure of Tunisian Durum Wheat Landraces Based on DArTseq Technology. Int. J. Mol. Sci. 2019, 20, 1352. [Google Scholar] [CrossRef]
  26. FAO. Available online: http://www.fao.org/plant-treaty/areas-of-work/benefit-sharing-fund/projects-funded/bsf-details/en/c/359514/?iso3=TUN (accessed on 30 April 2019).
  27. Latiri, K.; Lhommeb, J.P.; Annabia, M.; Setter, T.L. Wheat production in Tunisia: Progress, inter-annual variability and relation to rainfall. Eur. J. Agron. 2010, 33, 33–42. [Google Scholar] [CrossRef]
  28. CNEA. Elaboration D’une Etude sur l’état de Désertification Pour Une Gestion Durable; Centre National des Etudes Agricoles: Tunis, Tunisia, 2007. (In French)
  29. Evanno, G.; Regnaut, S.; Goudet, J. Detecting the number of clusters of individuals using the software structure: A simulation study. Mol. Ecol. 2005, 14, 2611–2620. [Google Scholar] [CrossRef]
  30. Chen, X.; Min, D.; Yasir, T.A.; Hu, Y.G. Genetic diversity, population structure and linkage disequilibrium in elite Chinese winter wheat investigated with SSR markers. PLoS ONE 2012, 7, e44510. [Google Scholar] [CrossRef] [PubMed]
  31. Mangini, G.; Matteu, L.; Signorile, M.A.; Cattivelli, L.; Simeone, R.; Blanco, A. Yield component variations in a set of recombinant inbred lines of durum wheat grown in drought environments. J. Genet. Breed. 2007, 61, 135–142. [Google Scholar]
  32. Joshi, S.P.; Ranjekar, P.K.; Gupta, V.S. Molecular markers in plant genome analysis. Curr. Sci. 1999, 77, 230–240. [Google Scholar]
  33. Eujayl, I.; Sorrells, M.E.; Baum, M.; Wolters, P.; Powell, W. Isolation of EST-derived microsatellite markers for genotyping the A and B genomes of wheat. Theor. Appl. Genet. 2002, 104, 399–407. [Google Scholar] [CrossRef] [PubMed]
  34. Huang, X.; Börner, A.; Röder, M.; Ganal, M. Assessing genetic diversity of wheat (Triticum aestivum L.) germplasm using microsatellite markers. Theor. Appl. Genet. 2002, 105, 699–707. [Google Scholar] [CrossRef]
  35. Achtar, S.; Moualla, M.Y.; Kalhout, A.; Roder, M.S.; MirAli, N. Assessment of genetic diversity among Syrian durum (Triticum turgidum ssp. durum) and bread wheat (Triticum aestivum L.) using SSR markers. Russ. J. Genet. 2010, 46, 1320–1326. [Google Scholar]
  36. Pignone, D.; Hammer, K. Conservation, evaluation, and utilization of biodiversity. In Genomics and Breeding for Climate-Resilient Crops; Kole, C., Ed.; Springer: Berlin/Heidelberg, Germany, 2013; pp. 9–26. [Google Scholar]
  37. Moore, G. Strategic pre-breeding for wheat improvement. Nat. Plants 2015, 1, 15018. [Google Scholar] [CrossRef] [PubMed]
  38. Pignone, D.; De Paola, D.; Rapanà, N.; Janni, M. Capturing Wild Relative and Landrace Diversity for Crop Improvement Using a New Selection Tool to Exploit Genetic Resources in Durum Wheat; CABI International: New Delhi, India, 2016; pp. 47–53. ISBN 9781780646138. [Google Scholar]
  39. Dawson, T.P.; Jackson, S.T.; House, J.I.; Prentice, I.C.; Mace, G.M. Beyond predictions: Biodiversity conservation in a changing climate. Science 2011, 332, 53–58. [Google Scholar] [CrossRef]
  40. Arraouadi, S.; Hajlaoui, H.; Boughattas, N.H.; Nasraoui, R.; Gharbi, W. Variability and diversity studies in durum wheat (Triticum durum Desf.) cultivated in SidiBouzid (Tunisia). Agric. Biotechnol. 2015, 20, 804–809. [Google Scholar]
  41. Hammami, R.; (INRAT, Tunis, Tunisia). Personal communication, 2018.
  42. Lin, X.; N’Diaye, A.; Walkowiak, S.; Nilsen, K.T.; Cory, A.T.; Haile, J.; Hadley, R.; Kutcher, H.; Ammar, K.; Loladze, A.; et al. Genetic analysis of resistance to stripe rust in durum wheat (Triticum turgidum L. var. durum). PLoS ONE 2018, 13, e0203283. [Google Scholar] [CrossRef]
  43. Laidò, G.; Mangini, G.; Taranto, F.; Gadaleta, A.; Blanco, A.; Cattivelli, L.; Marone, D.; Mastrangelo, A.M.; Papa, R.; De Vita, P. Genetic diversity and population structure of tetraploid wheats (Triticum turgidum L.) estimated by SSR, DArT and Pedigree Data. PLoS ONE 2013, 8, e67280. [Google Scholar] [CrossRef] [PubMed]
  44. Saghai-Maroof, M.A.; Soliman, K.M.; Jorgensen, R.A.; Allard, R.W. Ribosomal DNA spacer length polymorphisms in barley: Mendelian inheritance, chromosomal location, and population dynamics. Proc. Natl. Acad. Sci. USA 1984, 81, 8014–8019. [Google Scholar] [CrossRef] [PubMed]
  45. Maccaferri, M.; Ricci, A.; Salvi, S.; Milner, S.G.; Noli, E.; Martelli, P.L.; Casadio, R.; Akhunov, E.; Scalabrin, S.; Vendramin, V.; et al. A high-density, SNP-based consensus map of tetraploid wheat as a bridge to integrate durum and bread wheat genomics and breeding. Plant Biotechnol. J. 2015, 13, 648–663. [Google Scholar] [CrossRef]
  46. GrainGenes: A Database for Triticeae and Avena. Available online: http://wheat.pw.usda.gov/GG3/ (accessed on 10 November 2018).
  47. Peakall, R.; Smouse, P.E. GENALEX 6: Genetic analysis in excel. Population genetic software for teaching and research. Mol. Ecol. Notes 2006, 6, 288–295. [Google Scholar] [CrossRef]
  48. Peakall, R.; Smouse, P.E. GenAlEx 6.5: Genetic analysis in Excel. Population genetic software for teaching and research an update. Bioinformatics 2012, 28, 2537–2539. [Google Scholar] [CrossRef]
  49. Weber, J.L. Informativeness of human (dC-dA)n x (dG-dT)n polymorphisms. Genomics 1990, 7, 524–530. [Google Scholar] [CrossRef]
  50. Anderson, J.A.; Churchill, G.A.; Sutrique, J.E.; Tanksley, S.D.; Sorrells, M.E. Optimizing parental selection for genetic linkage maps. Genome 1993, 36, 181–186. [Google Scholar] [CrossRef]
  51. Perrier, X.; Jacquemoud-Collet, J. DARwin: Dissimilarity Analysis and Representation for Windows; Version 5.0.158; CIRAD: Montpellier, France, 2006. [Google Scholar]
  52. Saitou, N.; Nei, M. The neighbor-joining method: A new method for reconstructing phylogenetic trees. Mol. Biol. Evol. 1987, 4, 406–425. [Google Scholar]
  53. Pritchard, J.K.; Stephens, M.; Donnelly, P. Inference of population structure using multilocus genotype data. Genetics 2000, 155, 945–959. [Google Scholar]
  54. Structure Harvester. Available online: http://taylor0.biology.ucla.edu/structureHarvester/ (accessed on 22 November 2018).
  55. Earl, D.A.; vonHoldt, B.M. Structure harvester: A website and program for visualizing structure output and implementing the Evanno method. Conserv. Genet. Resour. 2012, 4, 359–361. [Google Scholar] [CrossRef]
Figure 1. Agro-ecological map of Tunisia redrawn from CNEA [28]. The symbols ●, ▲ and ■ are used to indicate the location of sampling from the North, Center and South Tunisia, respectively.
Ijms 20 03362 g001
Figure 2. Dendrogram of durum wheat collection resulting from the neighbor-joining cluster analysis based on the dissimilarity matrix obtained from SSR allelic data. The colors blue and red were used to distinguish the two main clusters.
Ijms 20 03362 g002
Figure 3. Membership coefficient (Q) mean of the Tunisian durum samples split according to the agro-ecological zones of sampling location (North, Center and South) and modern durum cultivars. The different colors indicate the five subpopulations detected using a Bayesian approach (red: subpopulation 1; orange: subpopulation 2; yellow: subpopulation 3; green: subpopulation 4 and blue: subpopulation 5).
Ijms 20 03362 g003
Table 1. Summary of genetic variation detected in the durum wheat collection tested with 16 SSR markers.
LocusChromosome ArmRepeat MotifAllele Size RangeNaPICIHoHeF
Xgwm6331ASnot available131–15160.601.220.020.600.97
Xgwm1241BL(CT)27(GT)18 imp208–22450.360.720.020.360.95
Xwmc4061BS(CA)16225–23730.280.510.060.280.79
Xgwm3112AL(GA)29132–176100.771.830.090.770.89
Xgwm2992BL(GA)31(TAG)4204–26650.611.190.120.610.81
BQ17080112BS(AC)n130–13830.350.620.020.350.95
Xbarc453AS(TAA)10193–23360.641.280.000.641.00
BJ27495213BS(ACGAT)n170–17630.510.740.040.510.93
Xwmc2624AL(GA)29163–20960.641.310.100.640.84
Xgwm4954BL(GA)20174–19270.721.550.020.720.97
Xgwm1545AS(GAT)37 imp162–17420.360.540.460.36−0.30
Xgwm4085BL(CA)>22(TA)(CA)7(TA)9162–19640.500.890.210.500.58
Xwmc2355BL(CA)25239–25150.681.240.060.680.91
Xgwm4276AL(CA)31(CA)22200–24470.621.320.080.620.87
Xgwm1936BS(CT)24 imp (CA)8174–206130.822.070.000.821.00
Xgwm5377BS(CA)18(TA)13211–256100.761.750.040.760.95
Expressed sequence tag; PIC = polymorphism information content; Na = number of alleles, I = Shannon’s information index; Ho = heterozygosity observed; He = heterozygosity expected; F = fixation index.
Table 2. Analysis of molecular variance (AMOVA) of durum wheat collection subdivided into the two main groups and detected using the neighbor-joining algorithm in DARwin software version 6.01.
Source of VariationdfSSMSEst. Var.%p Values
Among groups1122.57122.574.5622<0.001
Within groups52852.2316.3916.3978
Total53974.80 20.95100
df = degree of freedom; SS = sum of squares; MS = mean squares; Est. var. = estimate of variance; % = percentage of total variation.
Table 3. Analysis of molecular variance (AMOVA) of durum wheat collection split according to genetic structure estimated using Bayesian approach in STRUCTURE software version 2.3.4.
Source of VariationdfSSMSEst. Var.%p Values
Among subpopulations4347.2686.827.3137<0.001
Within subpopulations52607.0312.6512.6563
Total53954.2819.95100
df = degree of freedom; SS = sum of squares; MS = mean squares; Est. var. = estimate of variance; % = percentage of total variation.
Table 4. Analysis of molecular variance (AMOVA) of durum wheat collection split according to the eco-geographical zones in which they were collected (North, Center, South).
Source of VariationDfSSMSEst. Var.%p Values
Among eco-geographical groups3113.9837.991.619<0.001
Within eco-geographical groups50860.8417.2217.2291
Total53974.8018.83100
df = degree of freedom; SS = sum of squares; MS = mean squares; Est. var. = estimate of variance; % = percentage of total variation.
Table 5. List of Tunisian durum wheat samples included in the collection.
IDLocal NameAgro-ecological ZoneGovernorateLocationLatitude (N)Longitude (E)
NGBT001Mahm_AmdNorthBejaAin Rihana36.86999.074
NGBT002Mahm_JoumBizerteKef Zoraâ36.314710.0844
NGBT003Roussia_Joum"Kef Zoraâ36.99329.2262
NGBT004Mahm_Sejn"Sejnane37.14839.375
NGBT005Chili_KefKefEddir36.21818.7689
NGBT006DB_Kef"Eddir36.21818.7689
NGBT007Chili_LansMannoubaLansarine36.83379.6598
NGBT008Biskri_BargSilianaMarjaâ Aouam36.08699.5344
NGBT009Bidi_Barg"Marjaâ Aouam36.400310.1498
NGBT010Biskri_JoufZaghouanEl Jouf36.299910.113
NGBT011Chili_Jouf"El Jouf36.315210.0854
NGBT012Mahm_Jouf"El Jouf35.662510.4881
NGBT013Richi_Jouf"El Jouf36.99329.2262
NGBT014Biskri_OS"Oued Sbaihya36.305910.1157
NGBT015DB_OS"Oued Sbaihya36.400310.1498
NGBT016Mahm_OS"Oued Sbaihya36.400310.1498
NGBT017Mahm_Site2"Oued Sbaihya36.496110.2321
NGBT018Biskri_Saou"Saouaf36.400310.1498
NGBT019DB_Saou"Saouaf36.29110.1514
NGBT020JKh_Saouaf"Saouaf36.29110.1514
NGBT021Mahm_Site1"Saouaf36.29110.1514
NGBT022JKh_BaroutaCenterKairouanBarrouta36.29110.1514
NGBT023D117"Koudiat Sisseb35.412810.1615
NGBT024Ajimi_KassKasserineOm Lagsab35.977610.2145
NGBT025Bidi_Kass"Om Lagsab34.81198.3764
NGBT026WB_Kass"Om Lagsab34.81198.3764
NGBT027Aouija_ChorbMahdiaChahda Est34.81428.3842
NGBT028Bidi_Site1"Chahda Est35.317510.3681
NGBT029Bidi_Site2"Chahda Est35.317510.3681
NGBT030DB_Chorb"Chahda Est35.309210.3681
NGBT031Aouija_MsakenSousseKnaies35.317510.3678
NGBT032Biskri_Msaken"Knaies35.639410.4734
NGBT033Chili_Msaken"Knaies35.644910.4792
NGBT034Mahm_Msaken"Knaies35.642810.4747
NGBT035JZarzouraSouthGabèsMatmata33.630310.0517
NGBT036KLahdheb"Menzel Habib34.19899.7092
NGBT037Biskri_GafsaGafsaOuled Whiba34.66759.088
NGBT038Hmira_MedMédenineChahbania33.246110.8281
NGBT039Agili"Dkhilet Esstout33.323910.9239
NGBT040Echetla_FridTozeurEl Frid34.46318.0477
NGBT041Echetla_Rmi "Rmitha34.42667.9858
Table 6. Durum wheat cultivars included in the collection.
CultivarOriginPedigree
Agili AC2 aTunisiaselected from Agili landrace
Karim bMexico/TunisiaJori-69(SIB)/(SIB)Anhinga//(SIB)Flamingo
Khiar bMexico/TunisiaChen(SIB)//Rus(SIB)/(SIB)Flamingo//Mexicali-75/3/Shearwater
Maâli bTunisiaCMH80A.1046/4TTURA/CMH77//CMH77.774/3YAV79/5/Razzak/6
Nasr bTunisia/SyriaGdoVz512/Cit//Ruff/Fg/3/Pin/Gre//Trob ICD85-1340-ABL-0TR-10b-3b-0b
Razzak bTunisiaDMx69-331/Karim
Salim bTunisiaAltar84/FD84-19-126-1-2/Razzak/3/Krf/BaladiaHamra D93-21-2b-9b-0b-2b-6b-0b
Dhahbi cTunisiaKarim/4/BD2337//D68-8-6A-3A/Karim’’S’’/3/Src2/Src1
OmRabia aTunisia/SyriaJO/Haurani
Carioca dFranceCID 479402
Cappelli eItalyselected from Jenah Khottifa landrace
Svevo eItalyCIMMYT’s selection/Zenit
Taganrog eItalyselected from Taganrog landrace
a) [8]; b) [40]; c) [41]; d) [42]; e) [43].

