Development of Polymer Blend Electrolyte Membranes Based on Chitosan: Dextran with High Ion Transport Properties for EDLC Application

 ,
,
Abstract
:
1. Introduction
2. Results and Discussion
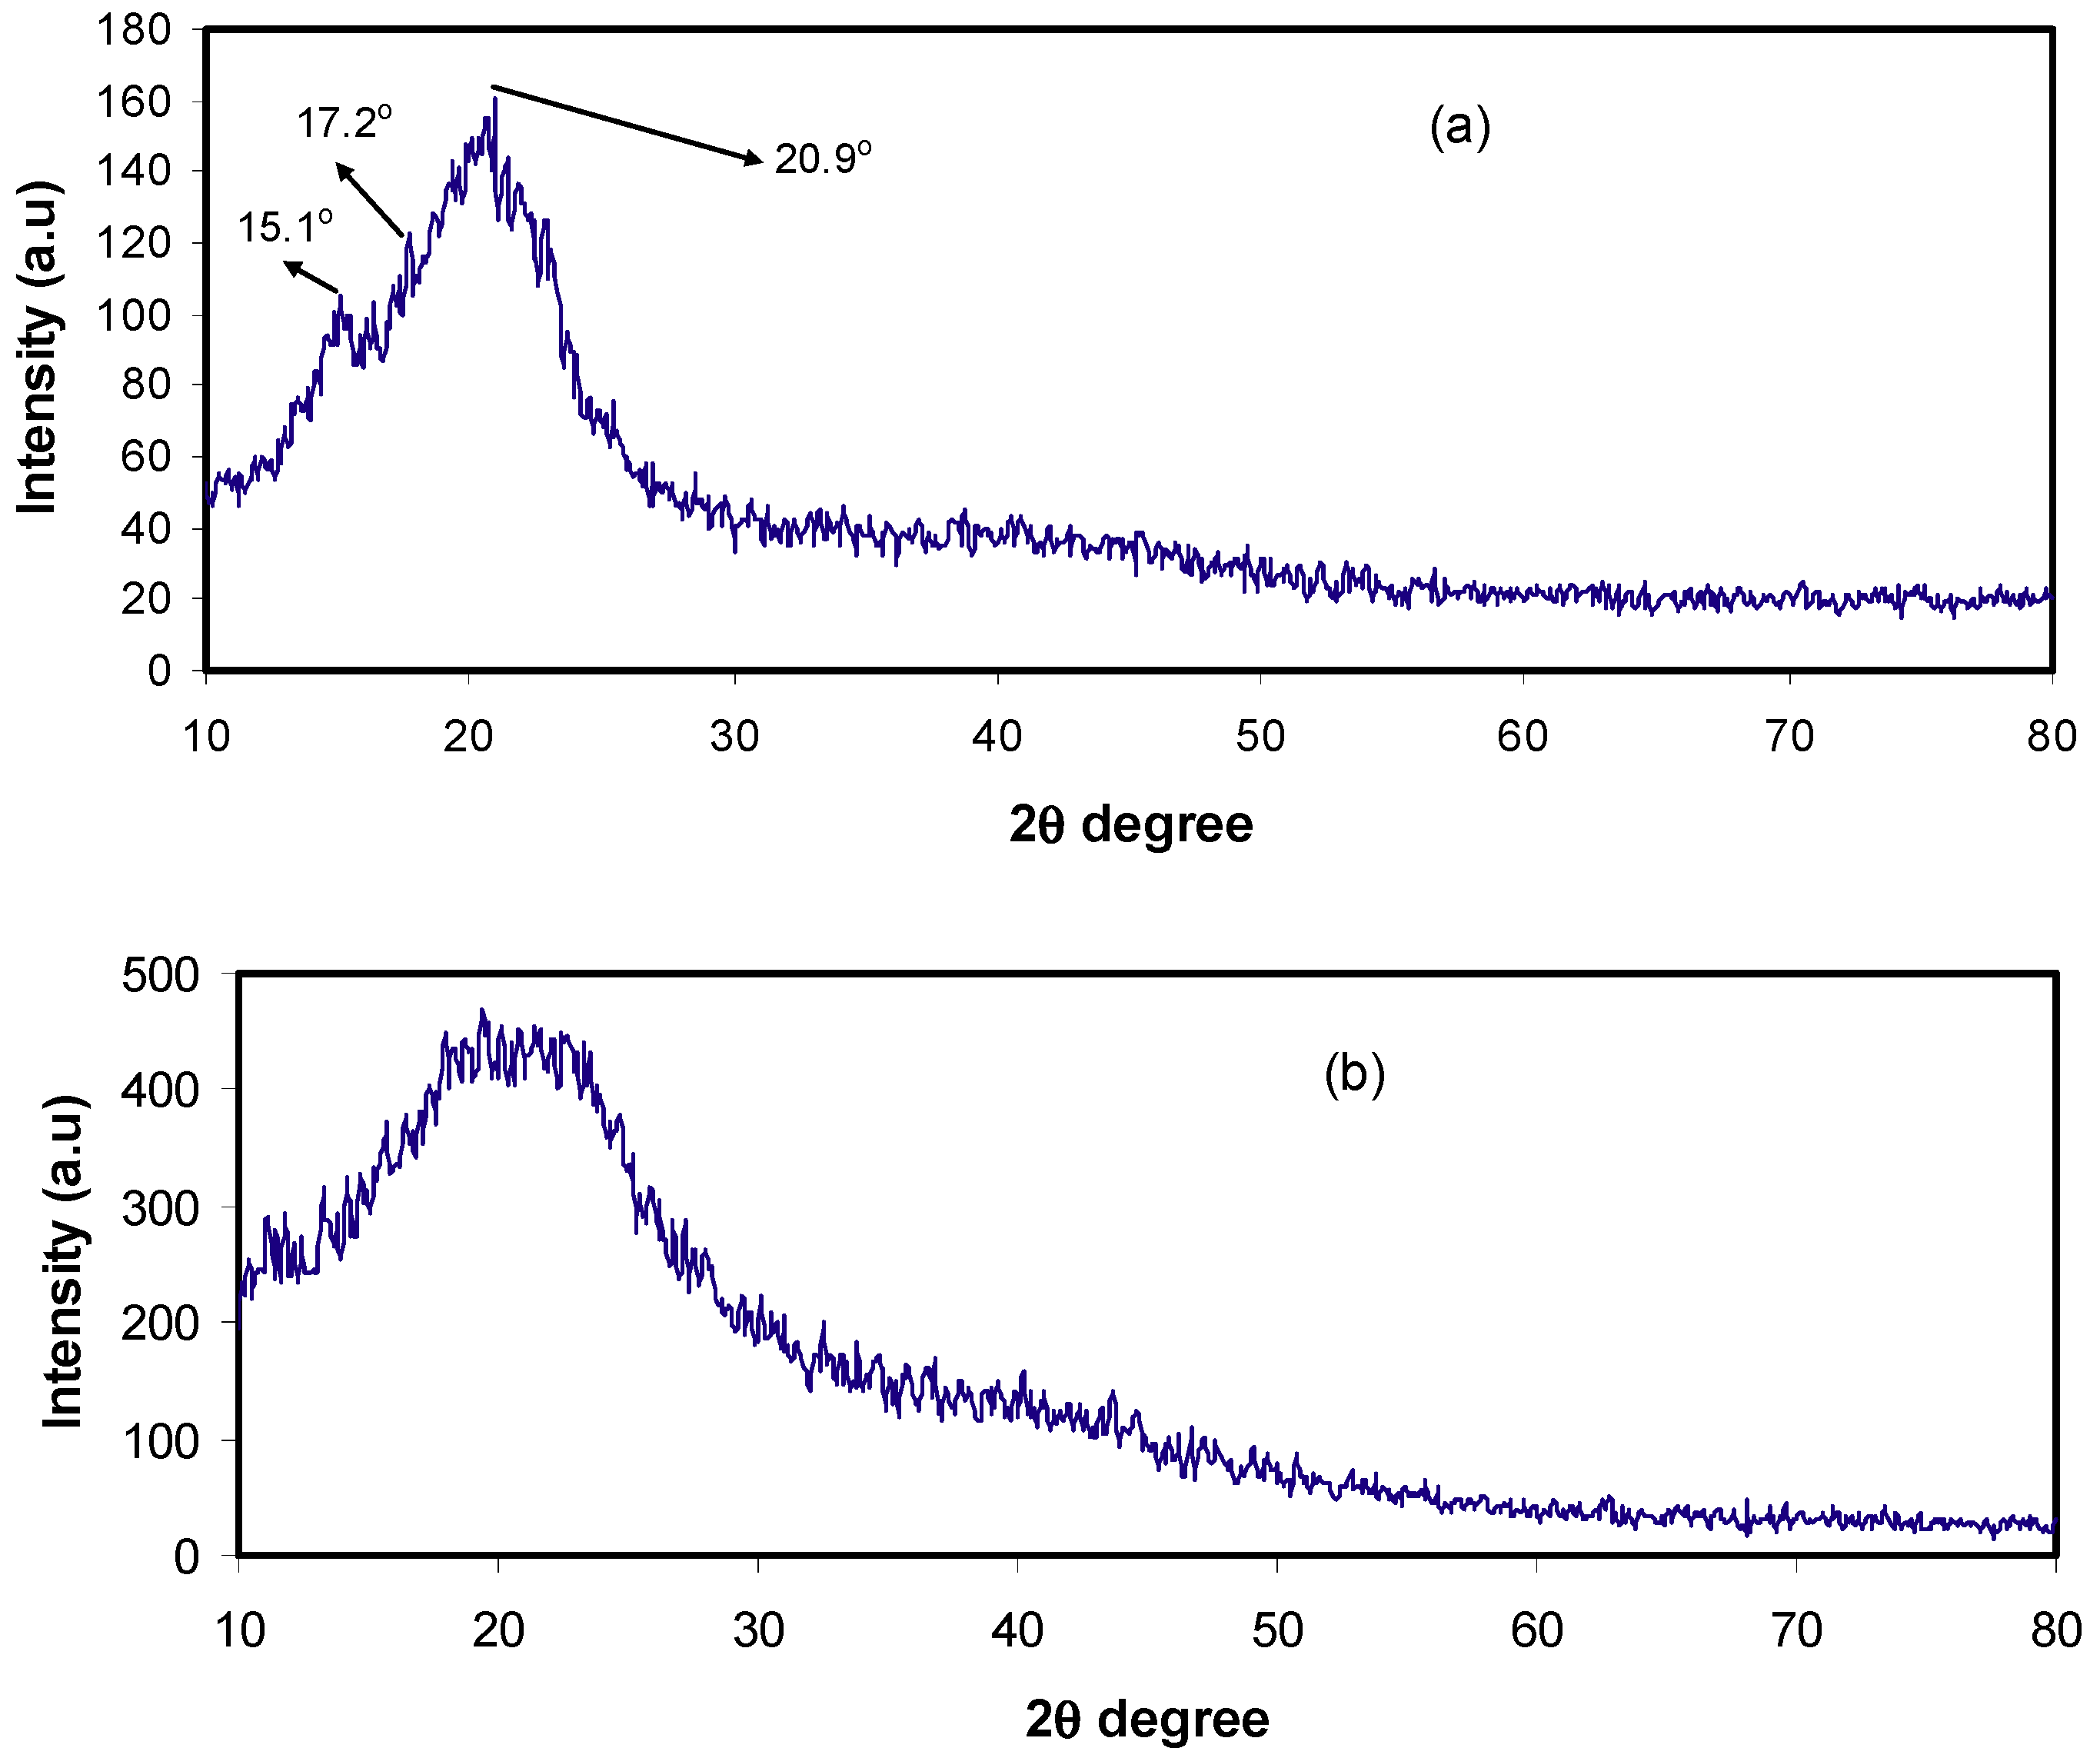
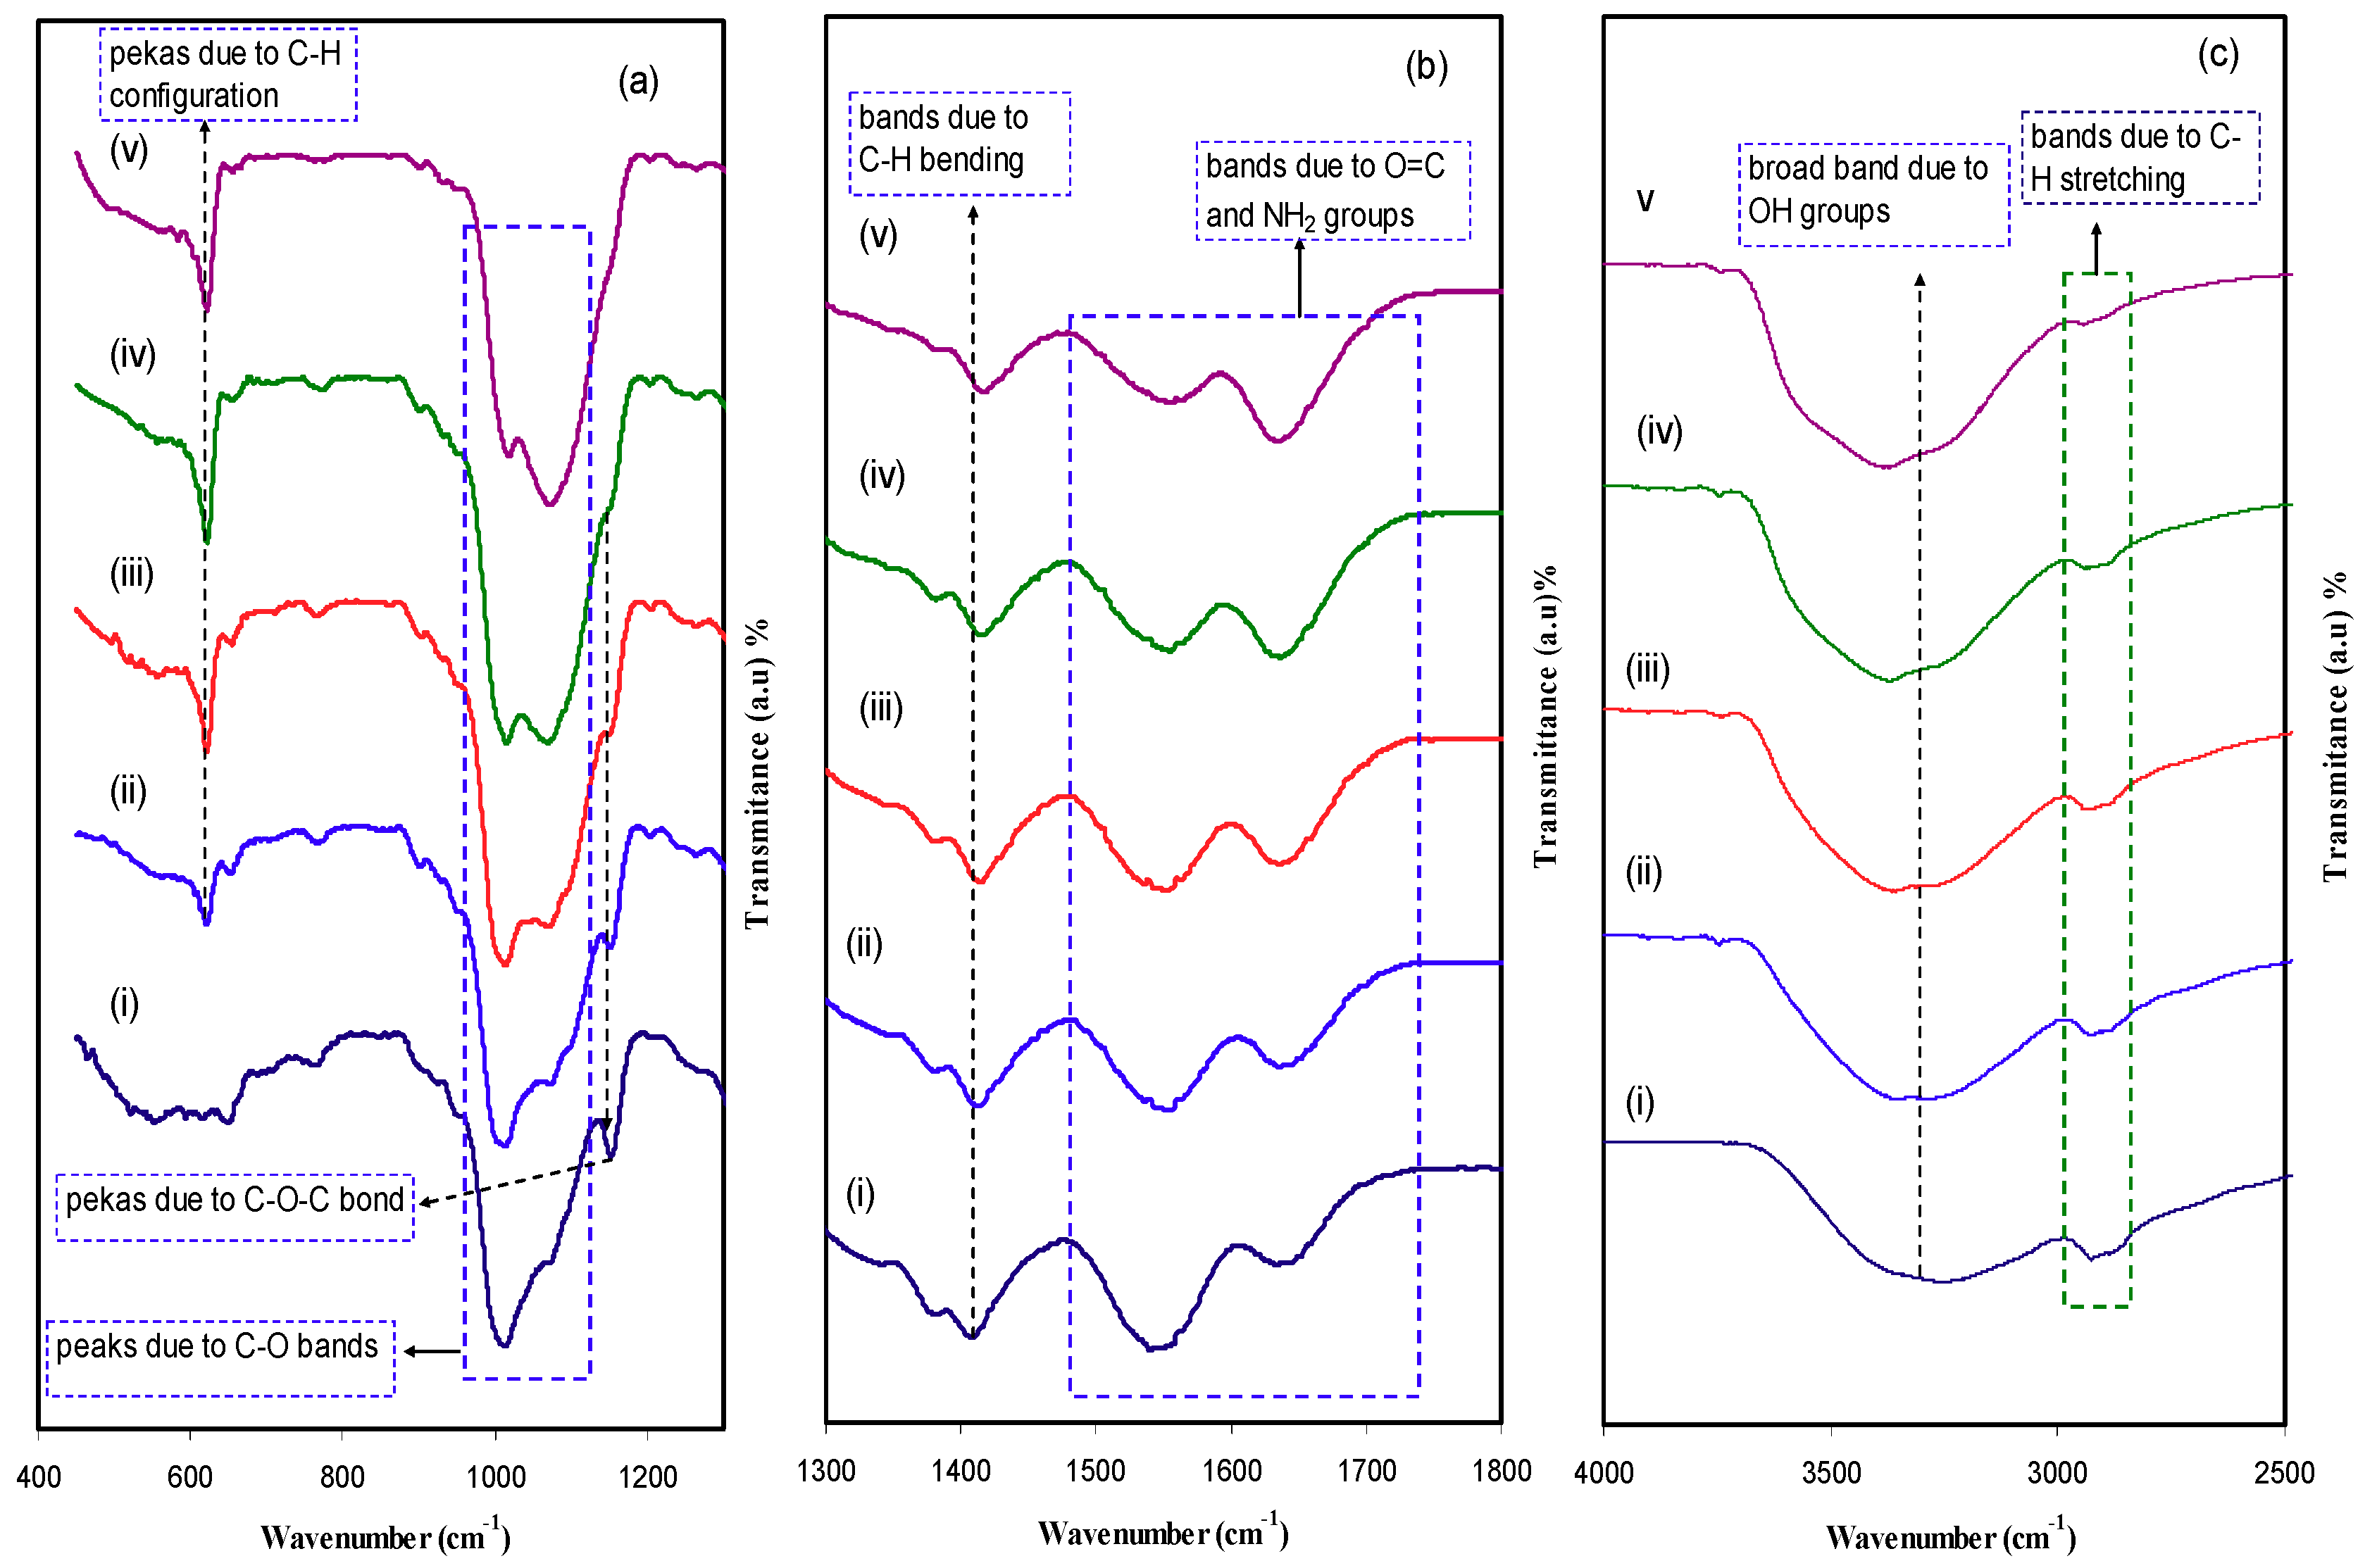
2.1. Structural (XRD and FTIR) Analysis
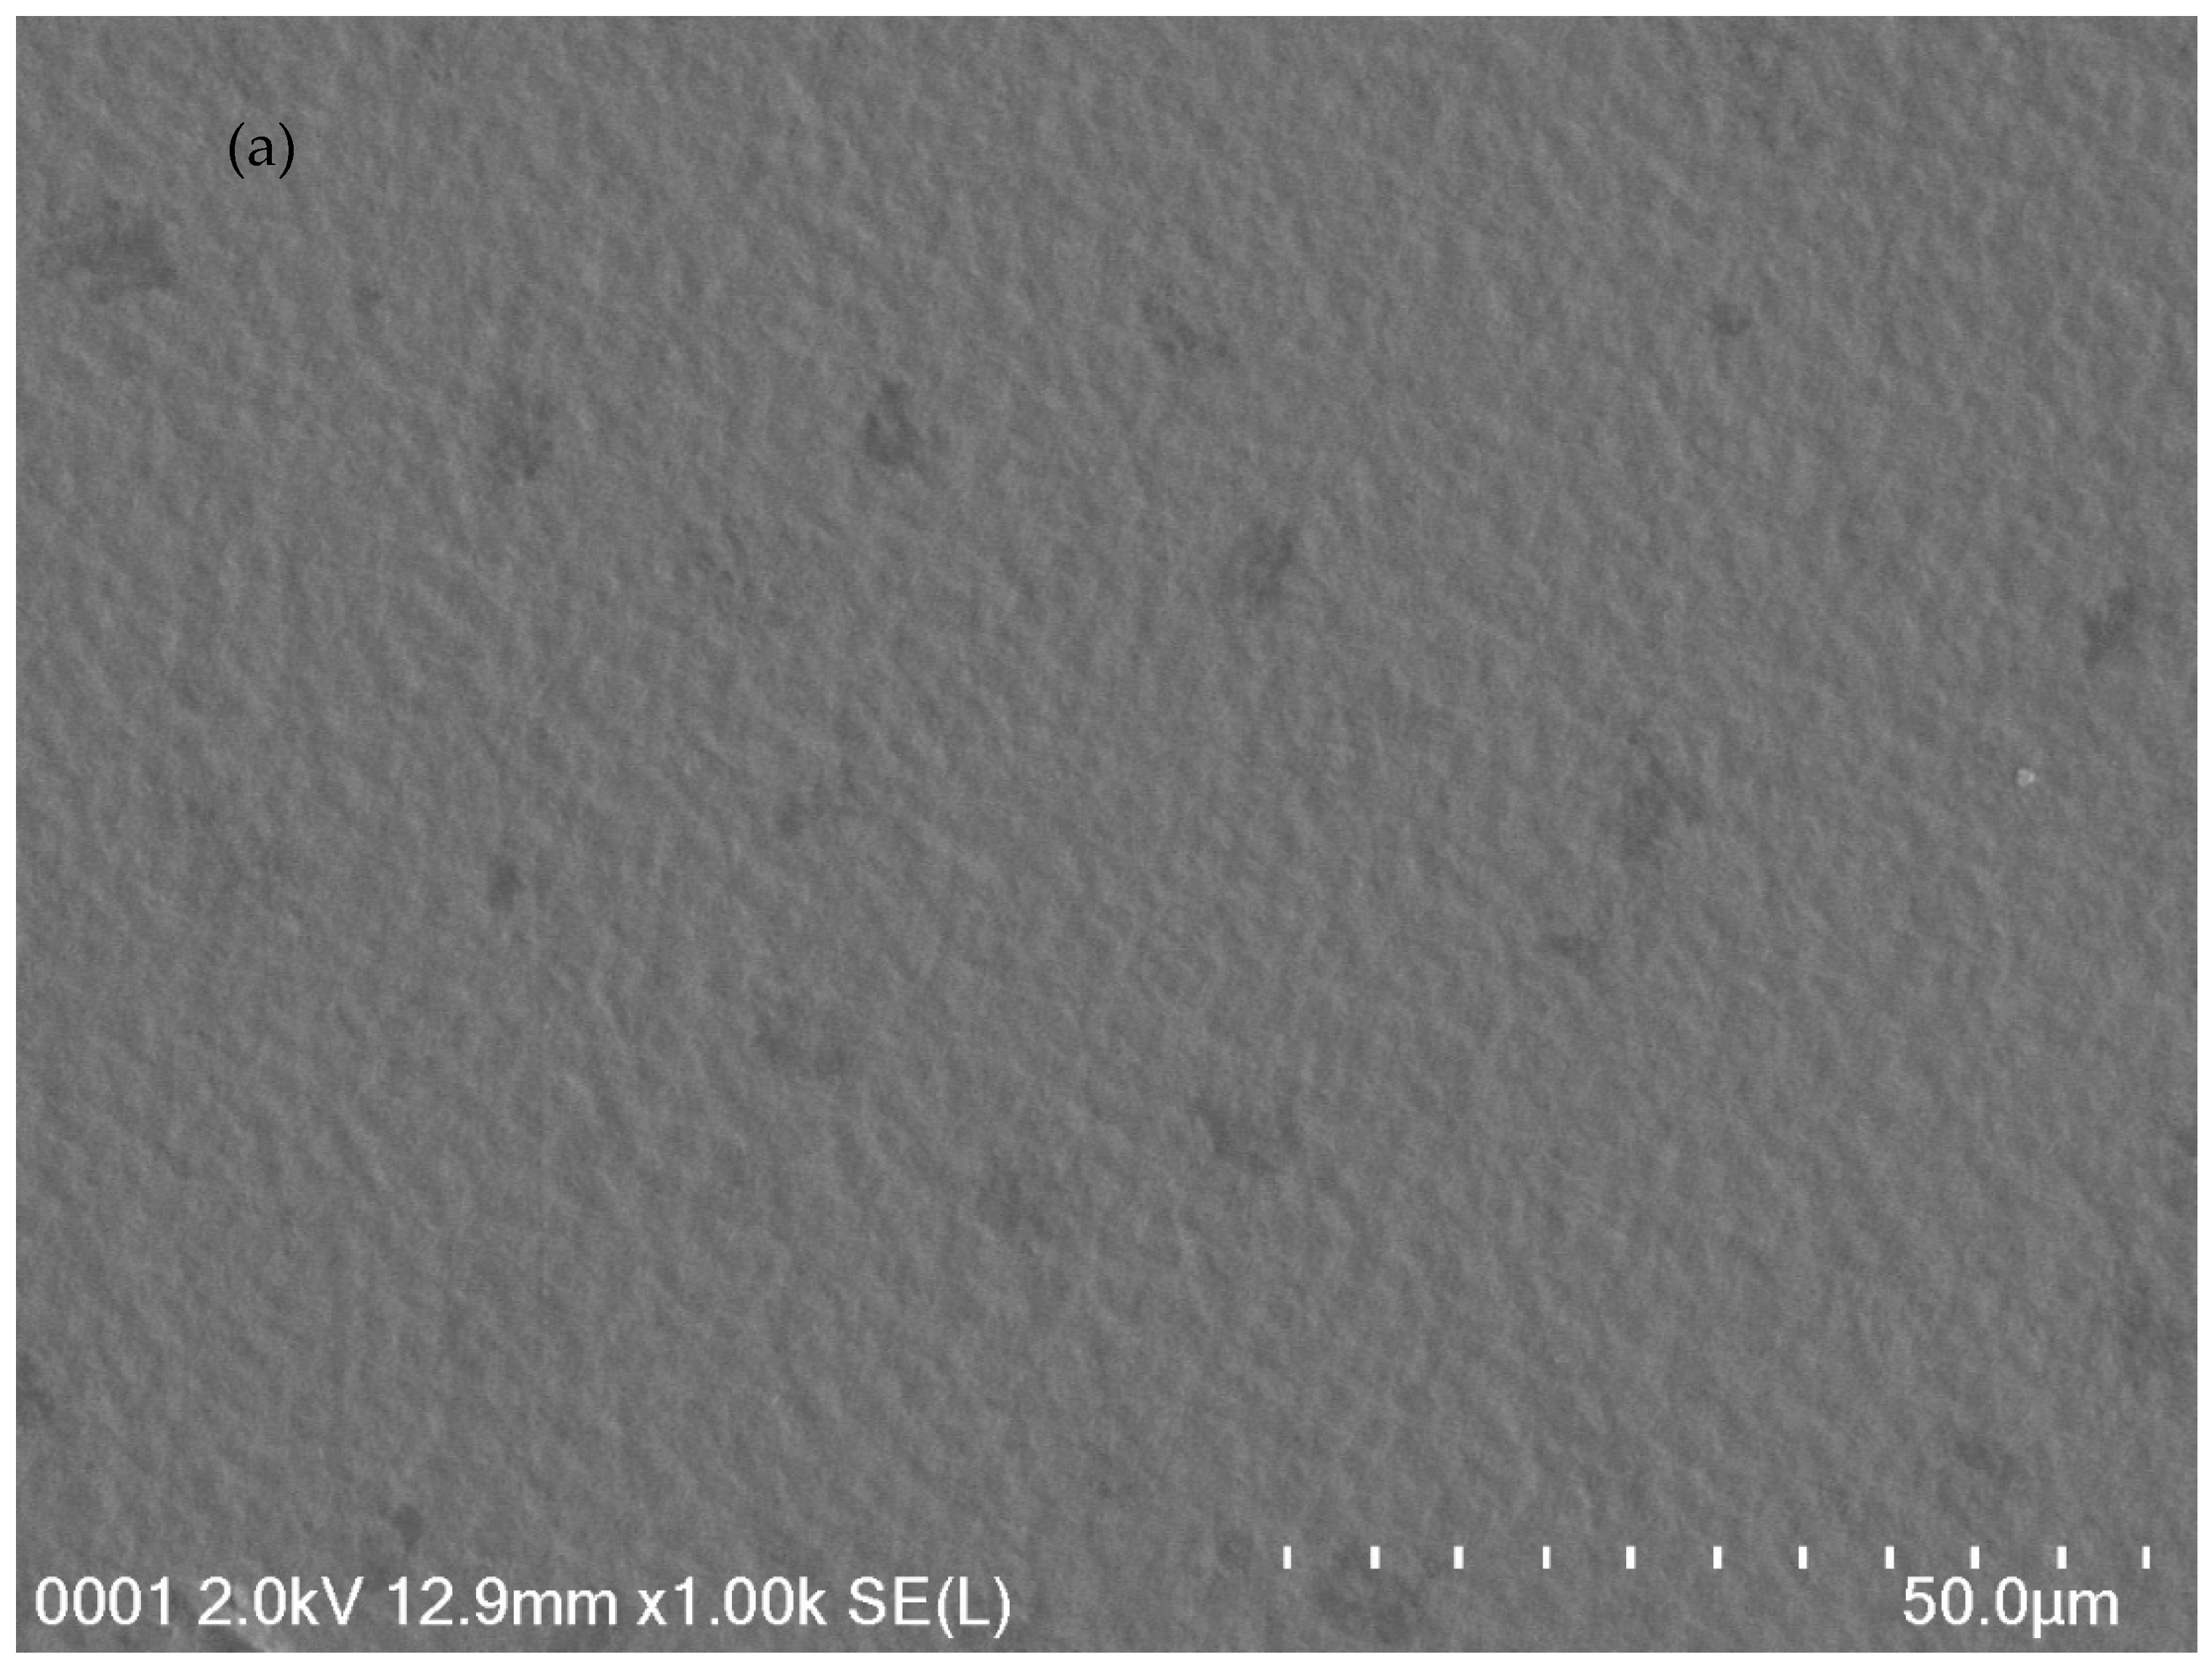
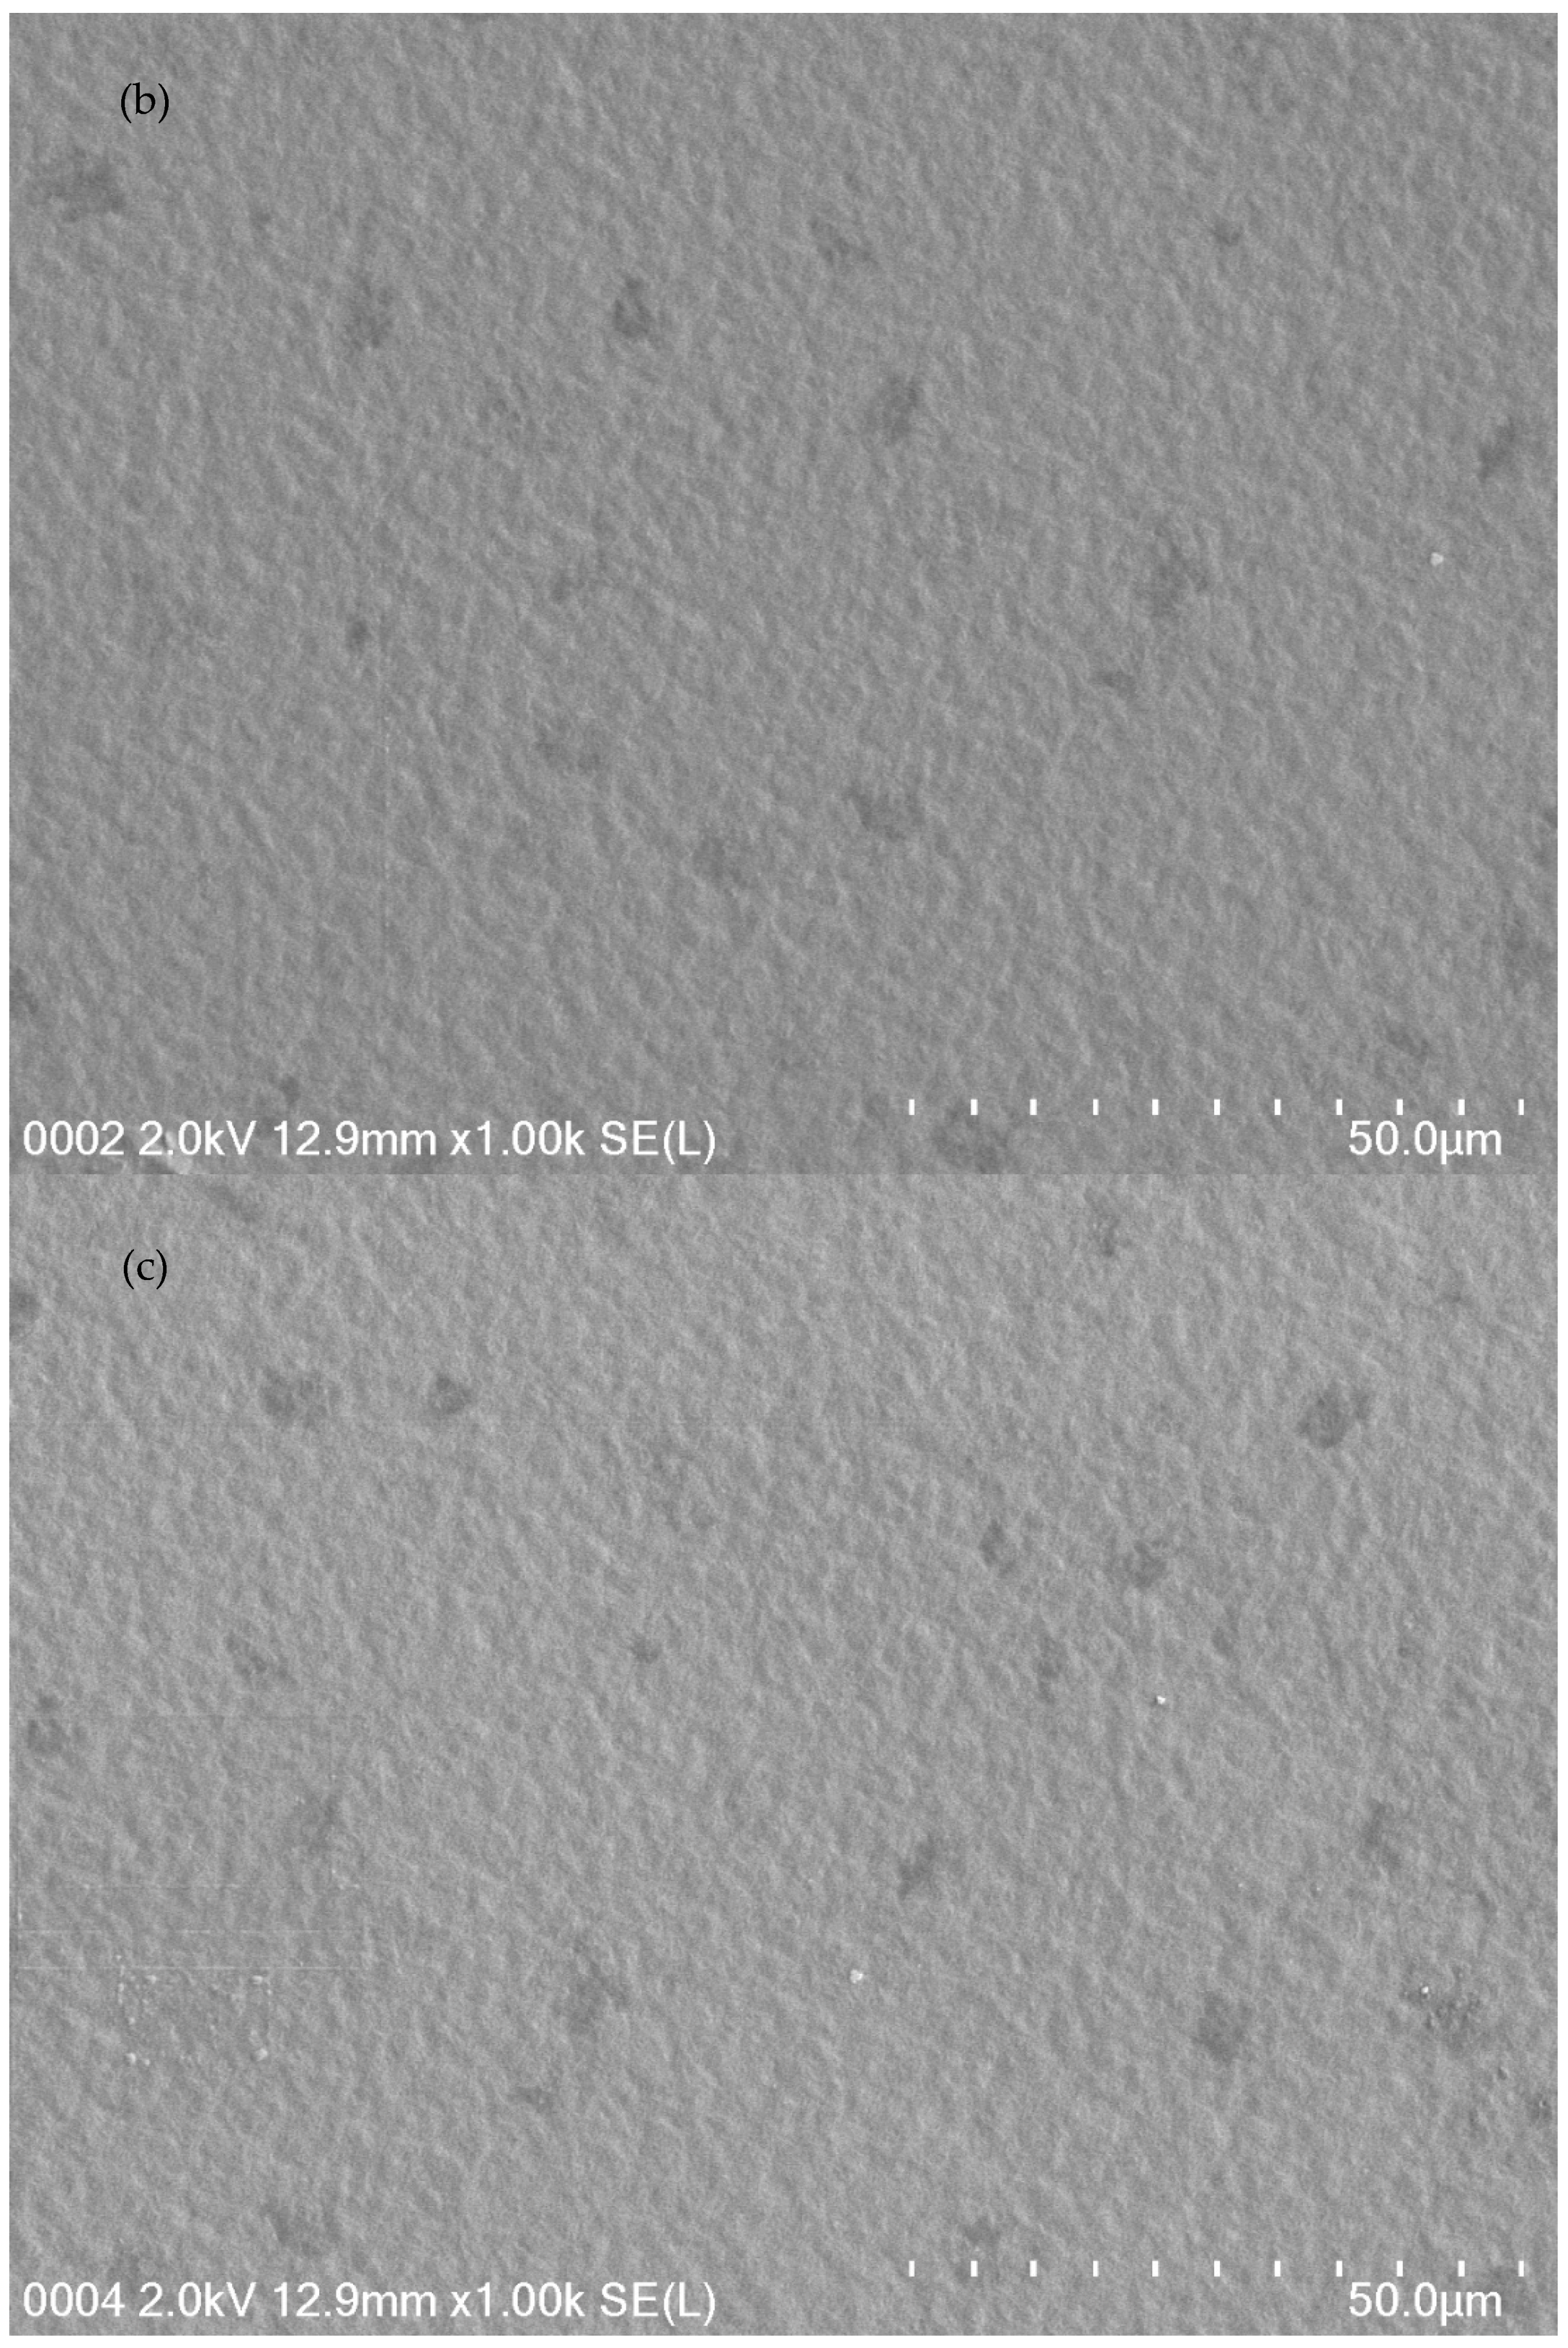
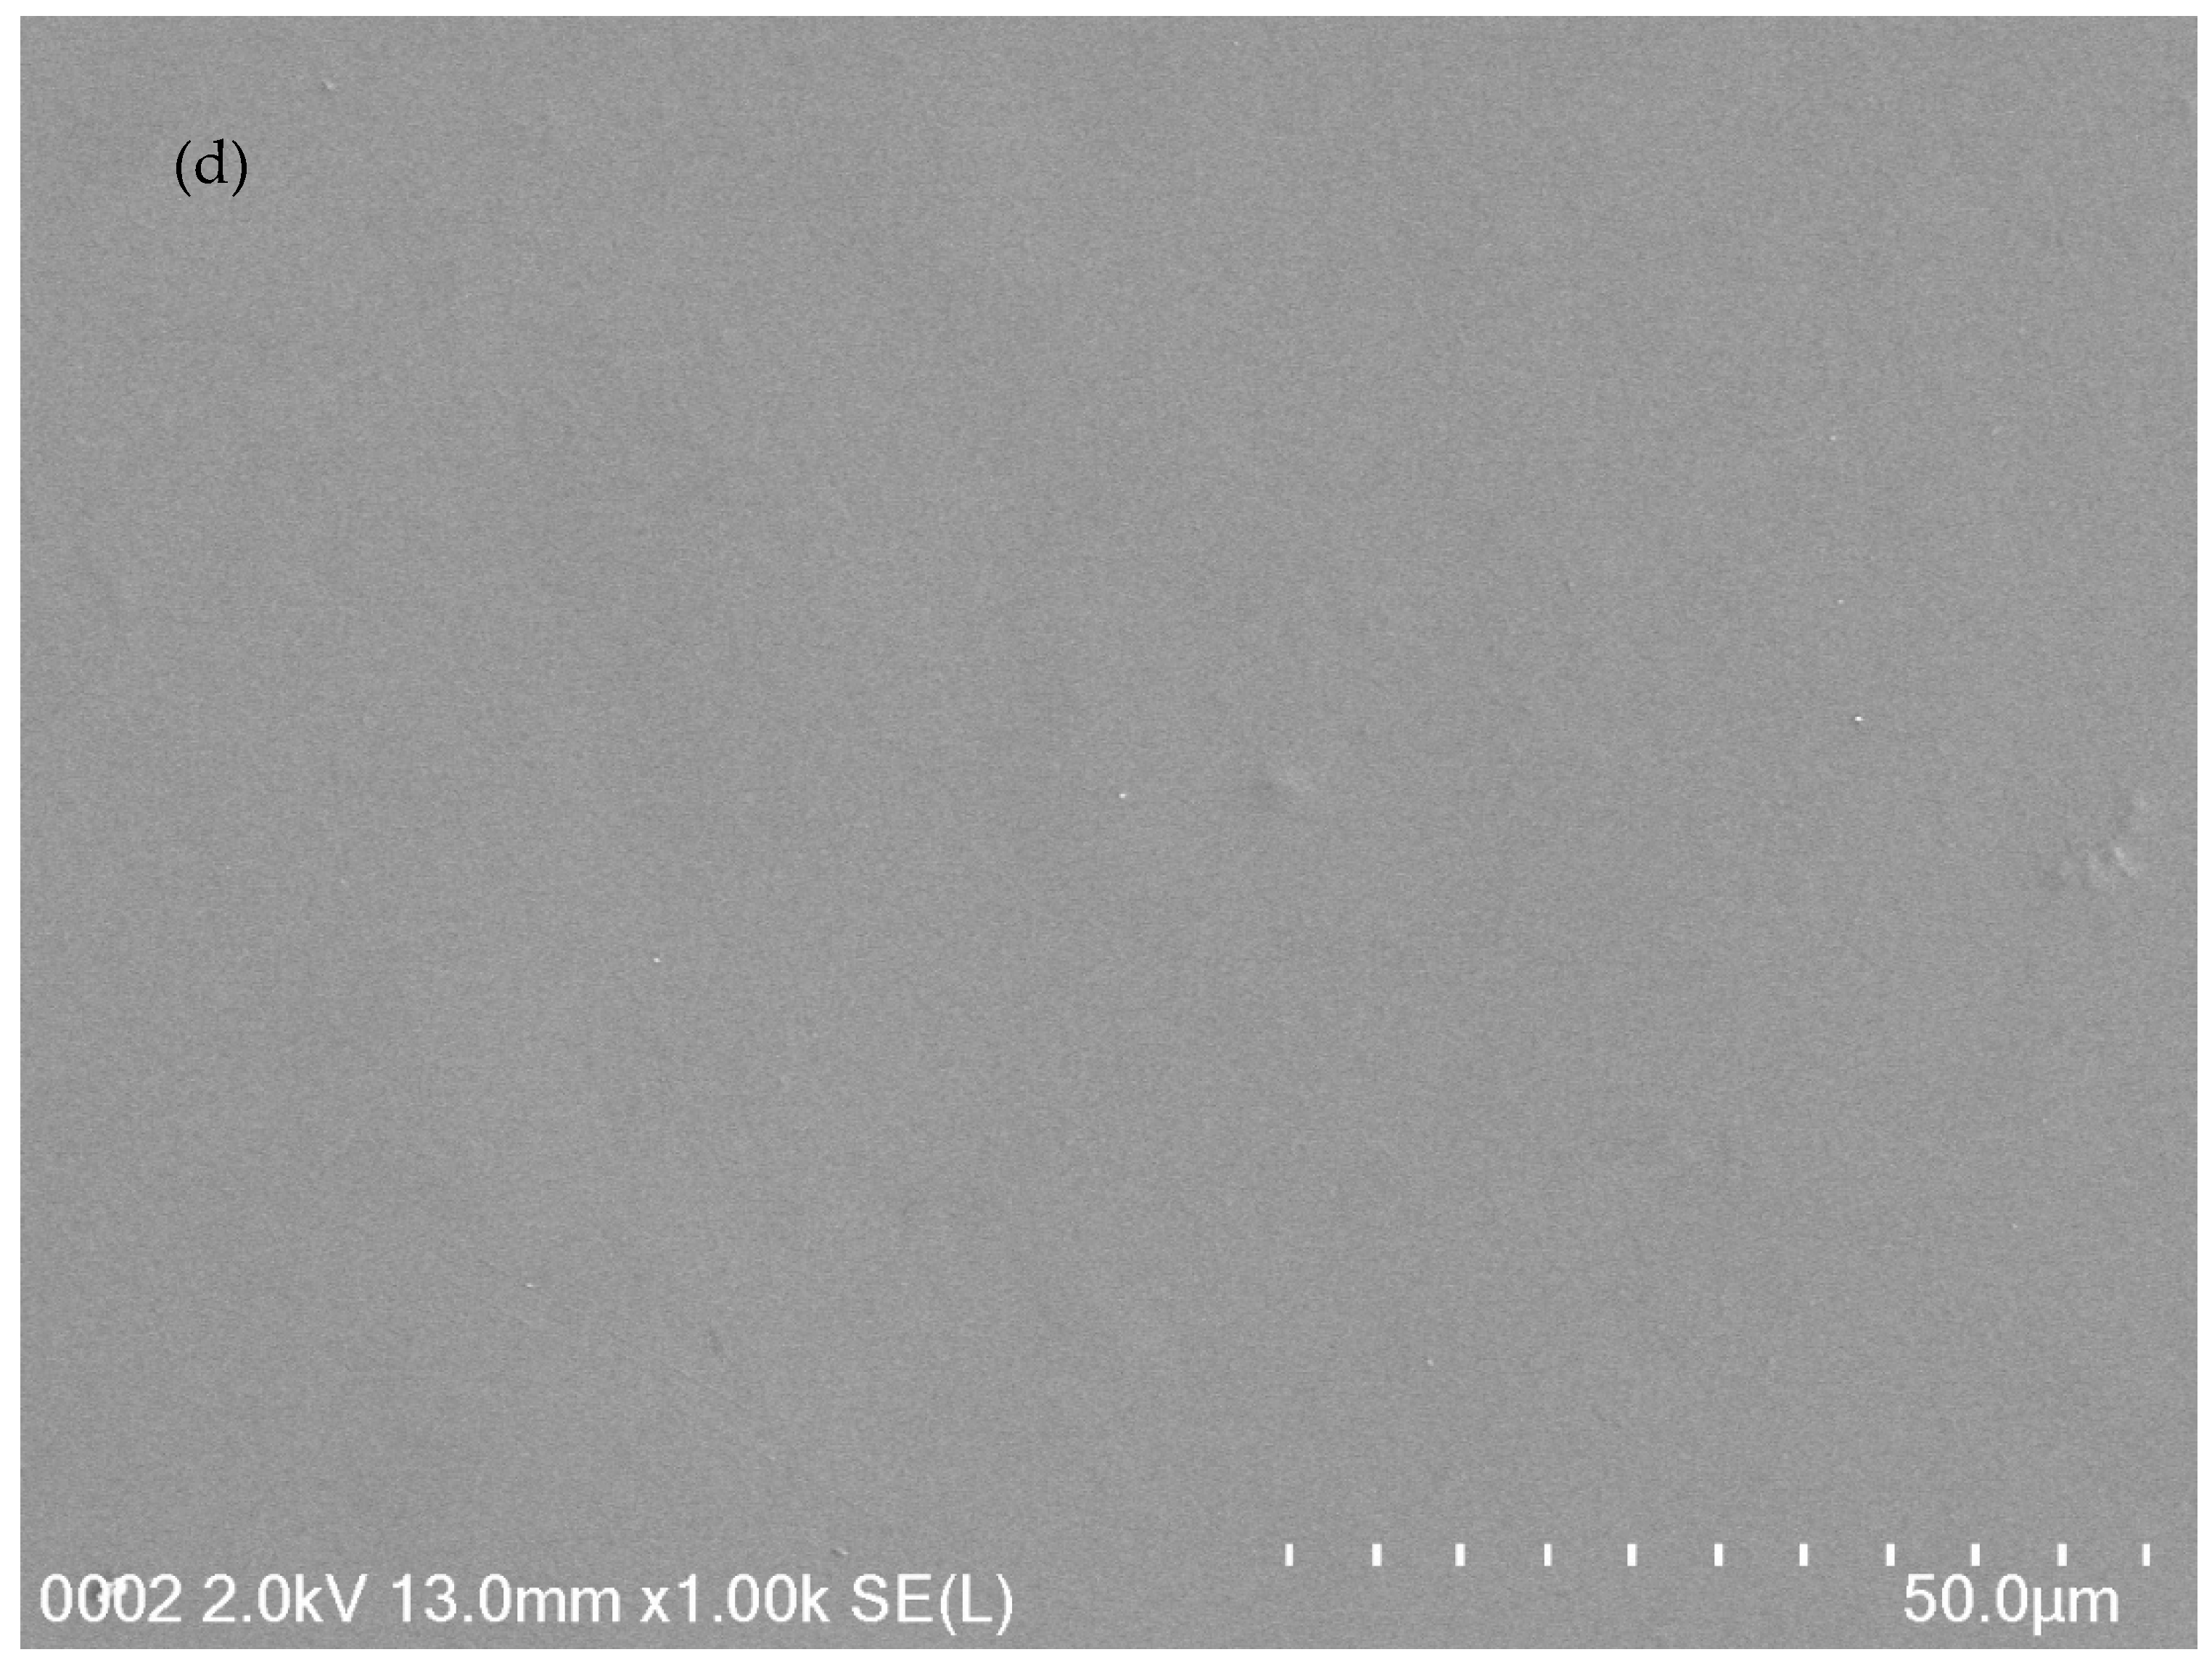
2.2. Morphological Study
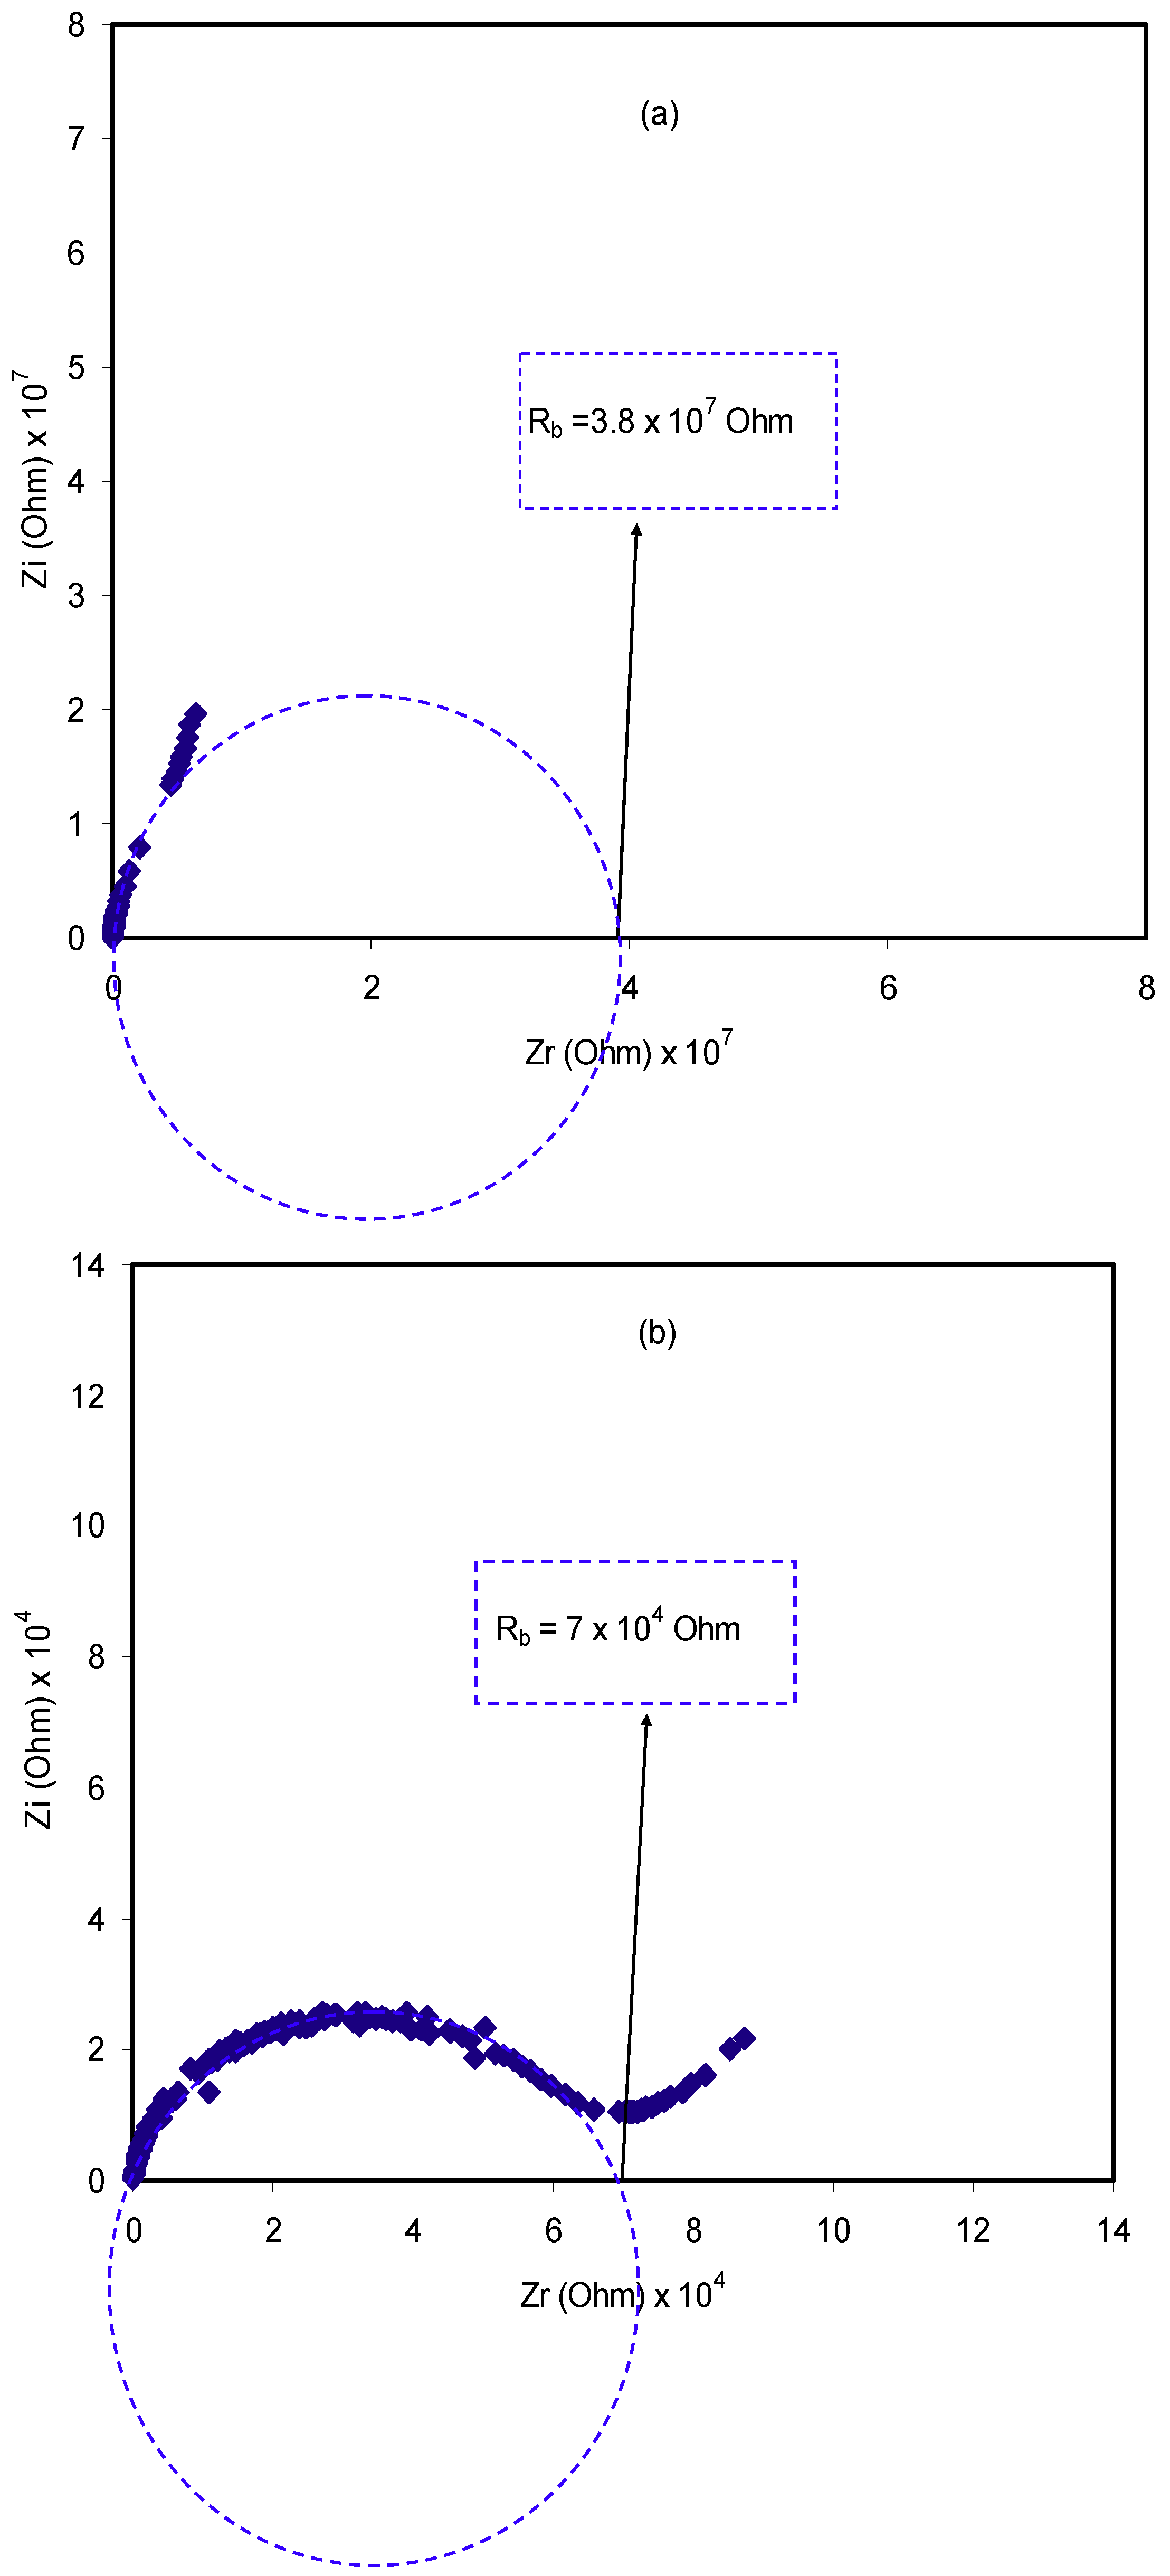
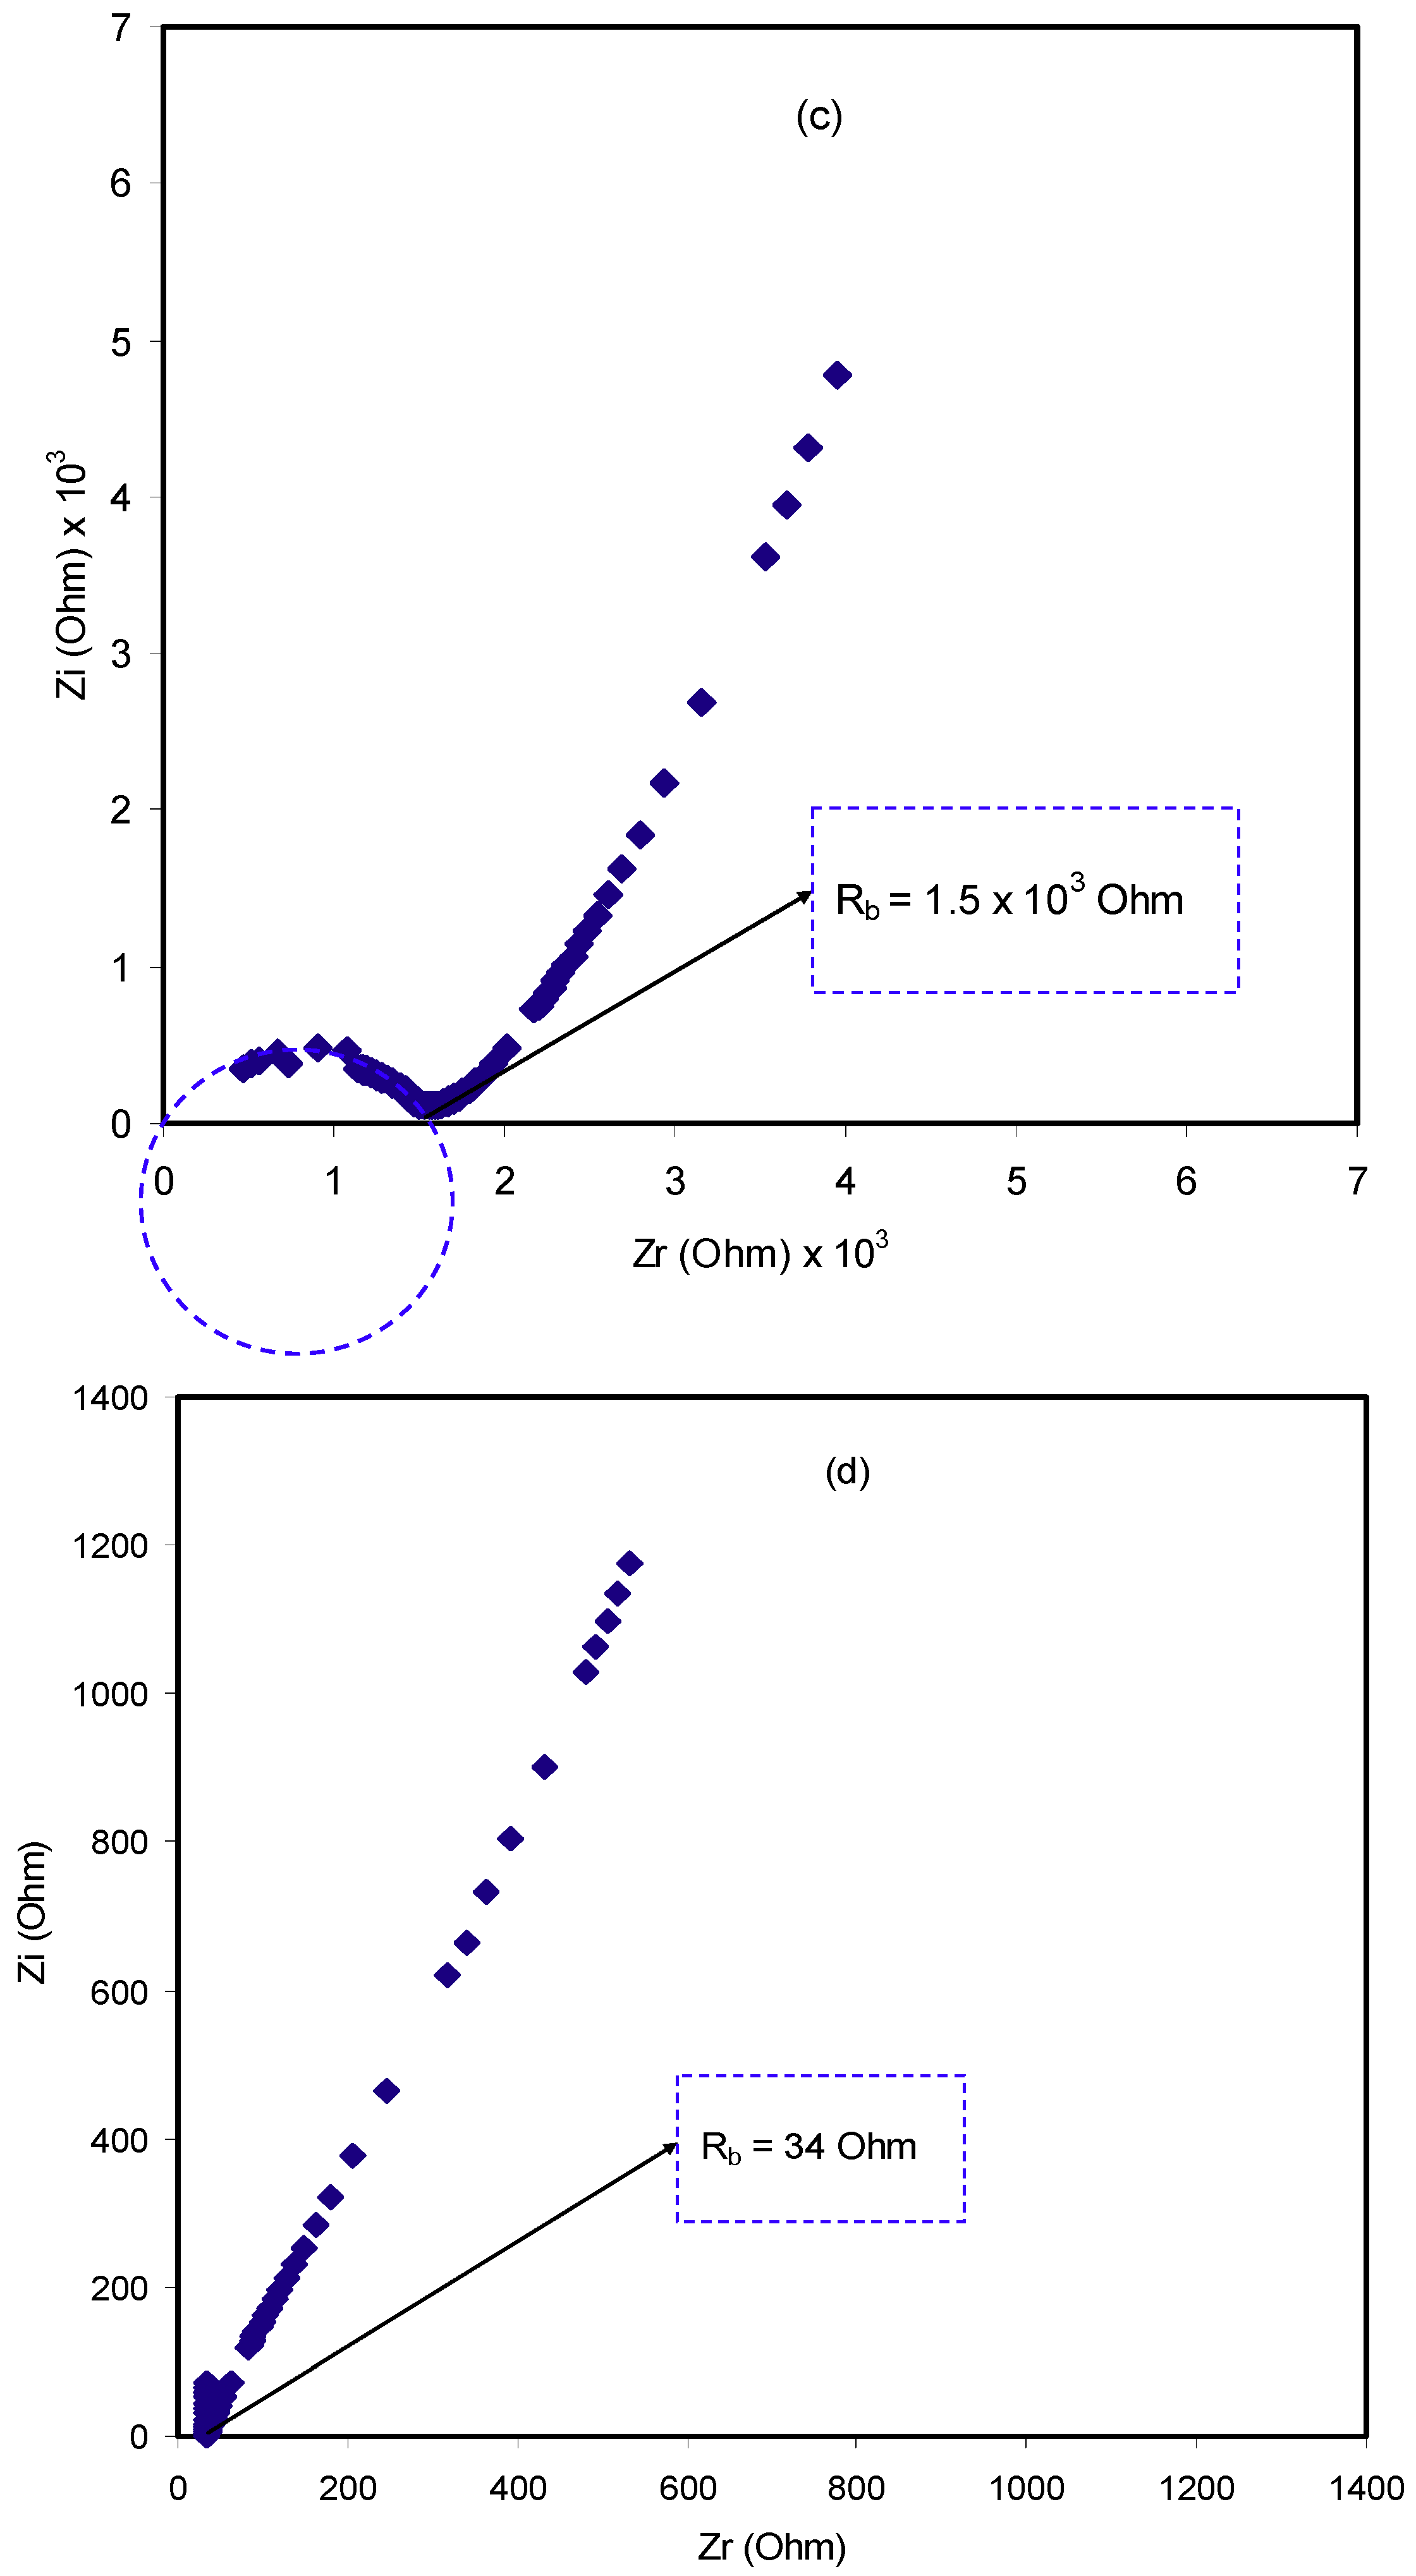
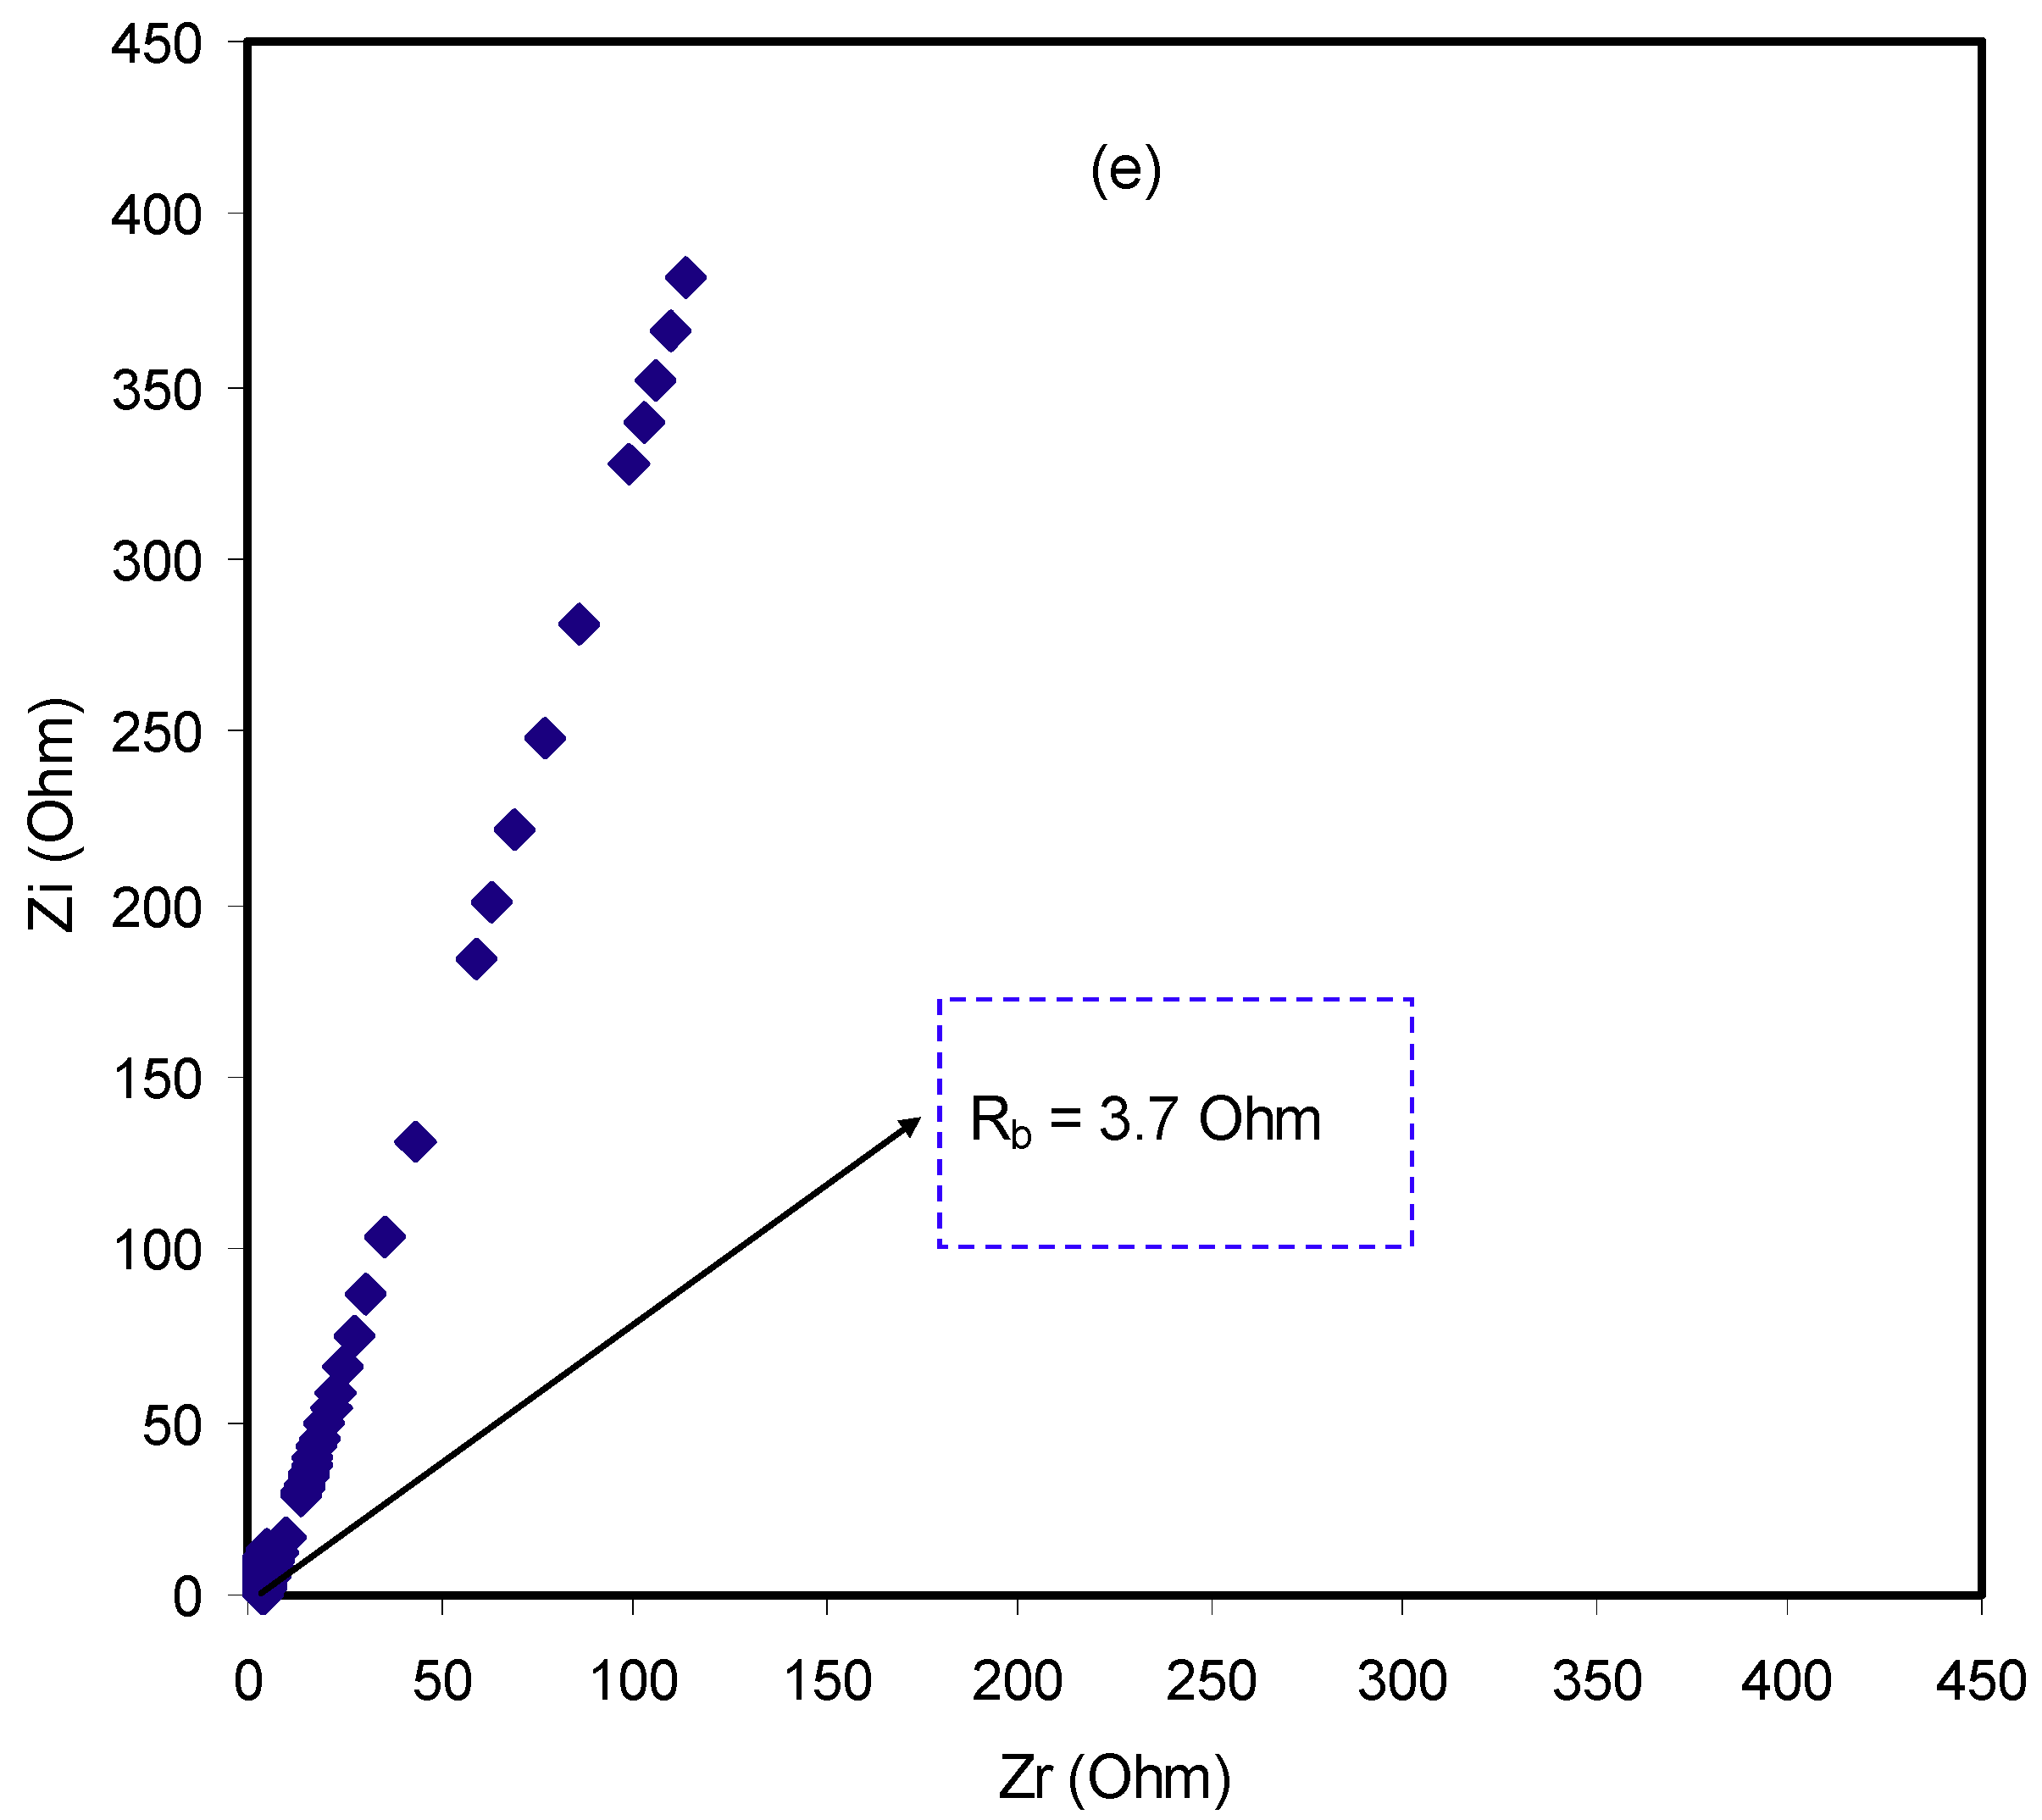
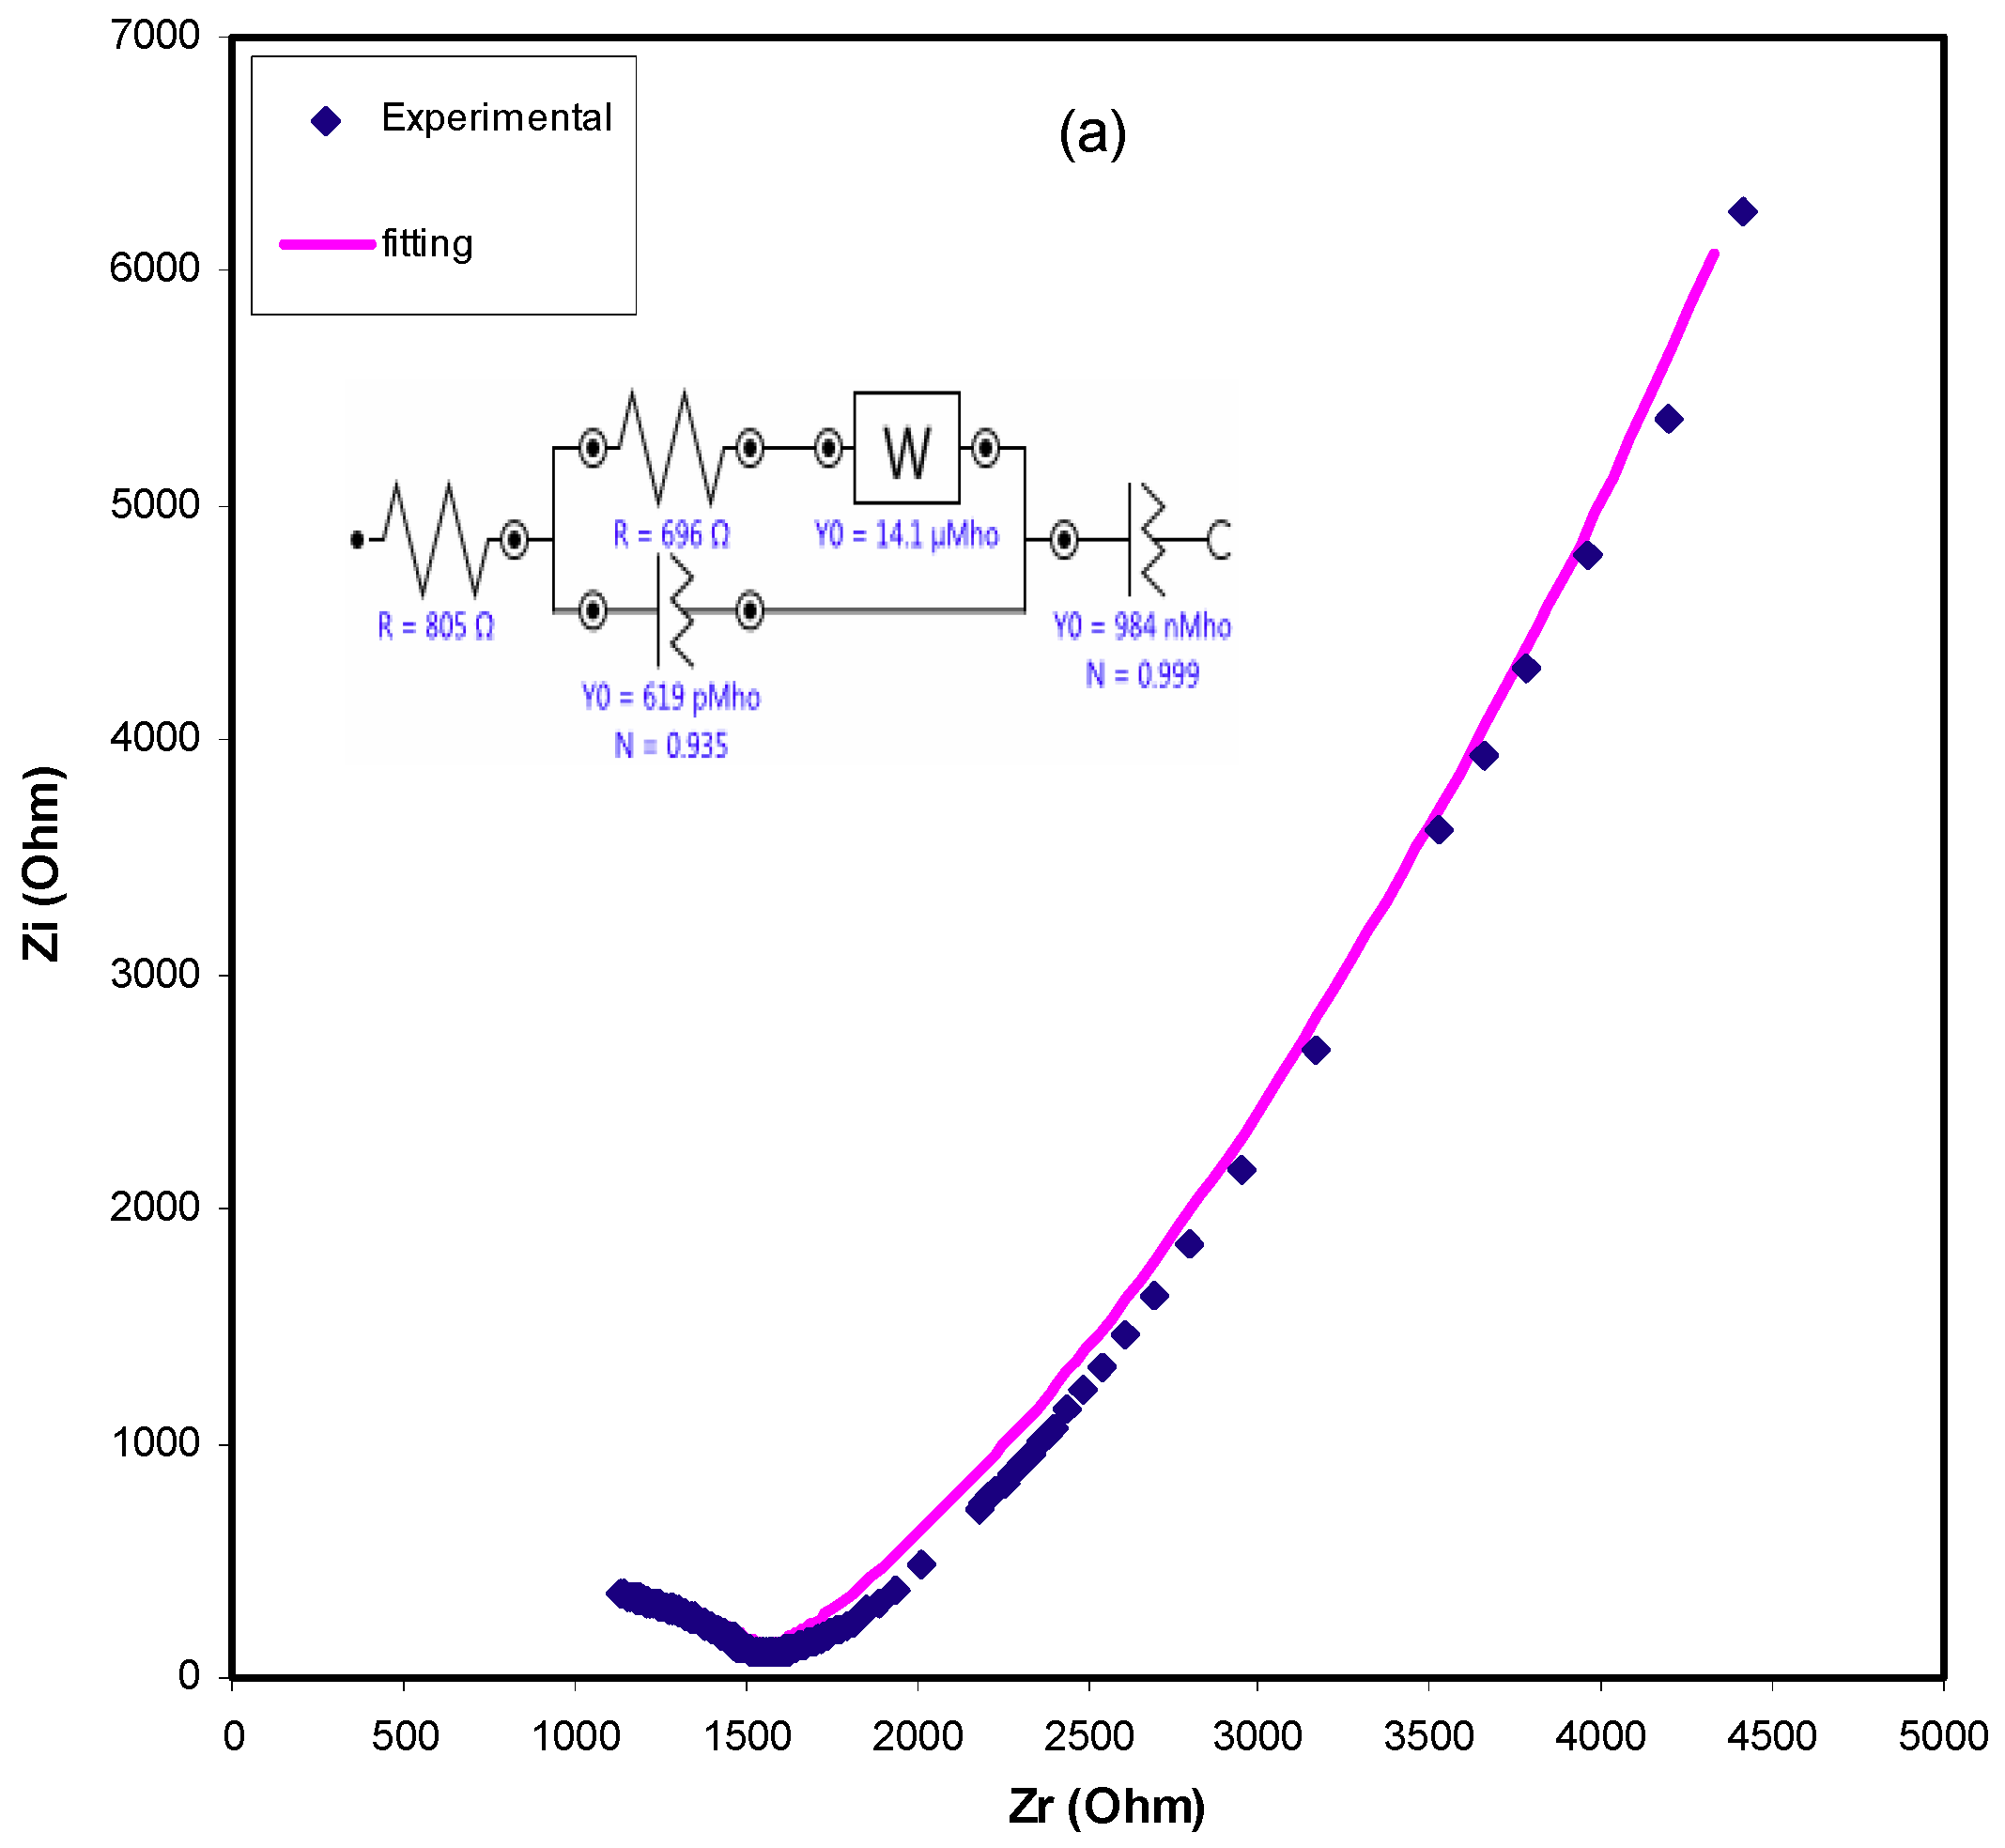
2.3. Impedance Study
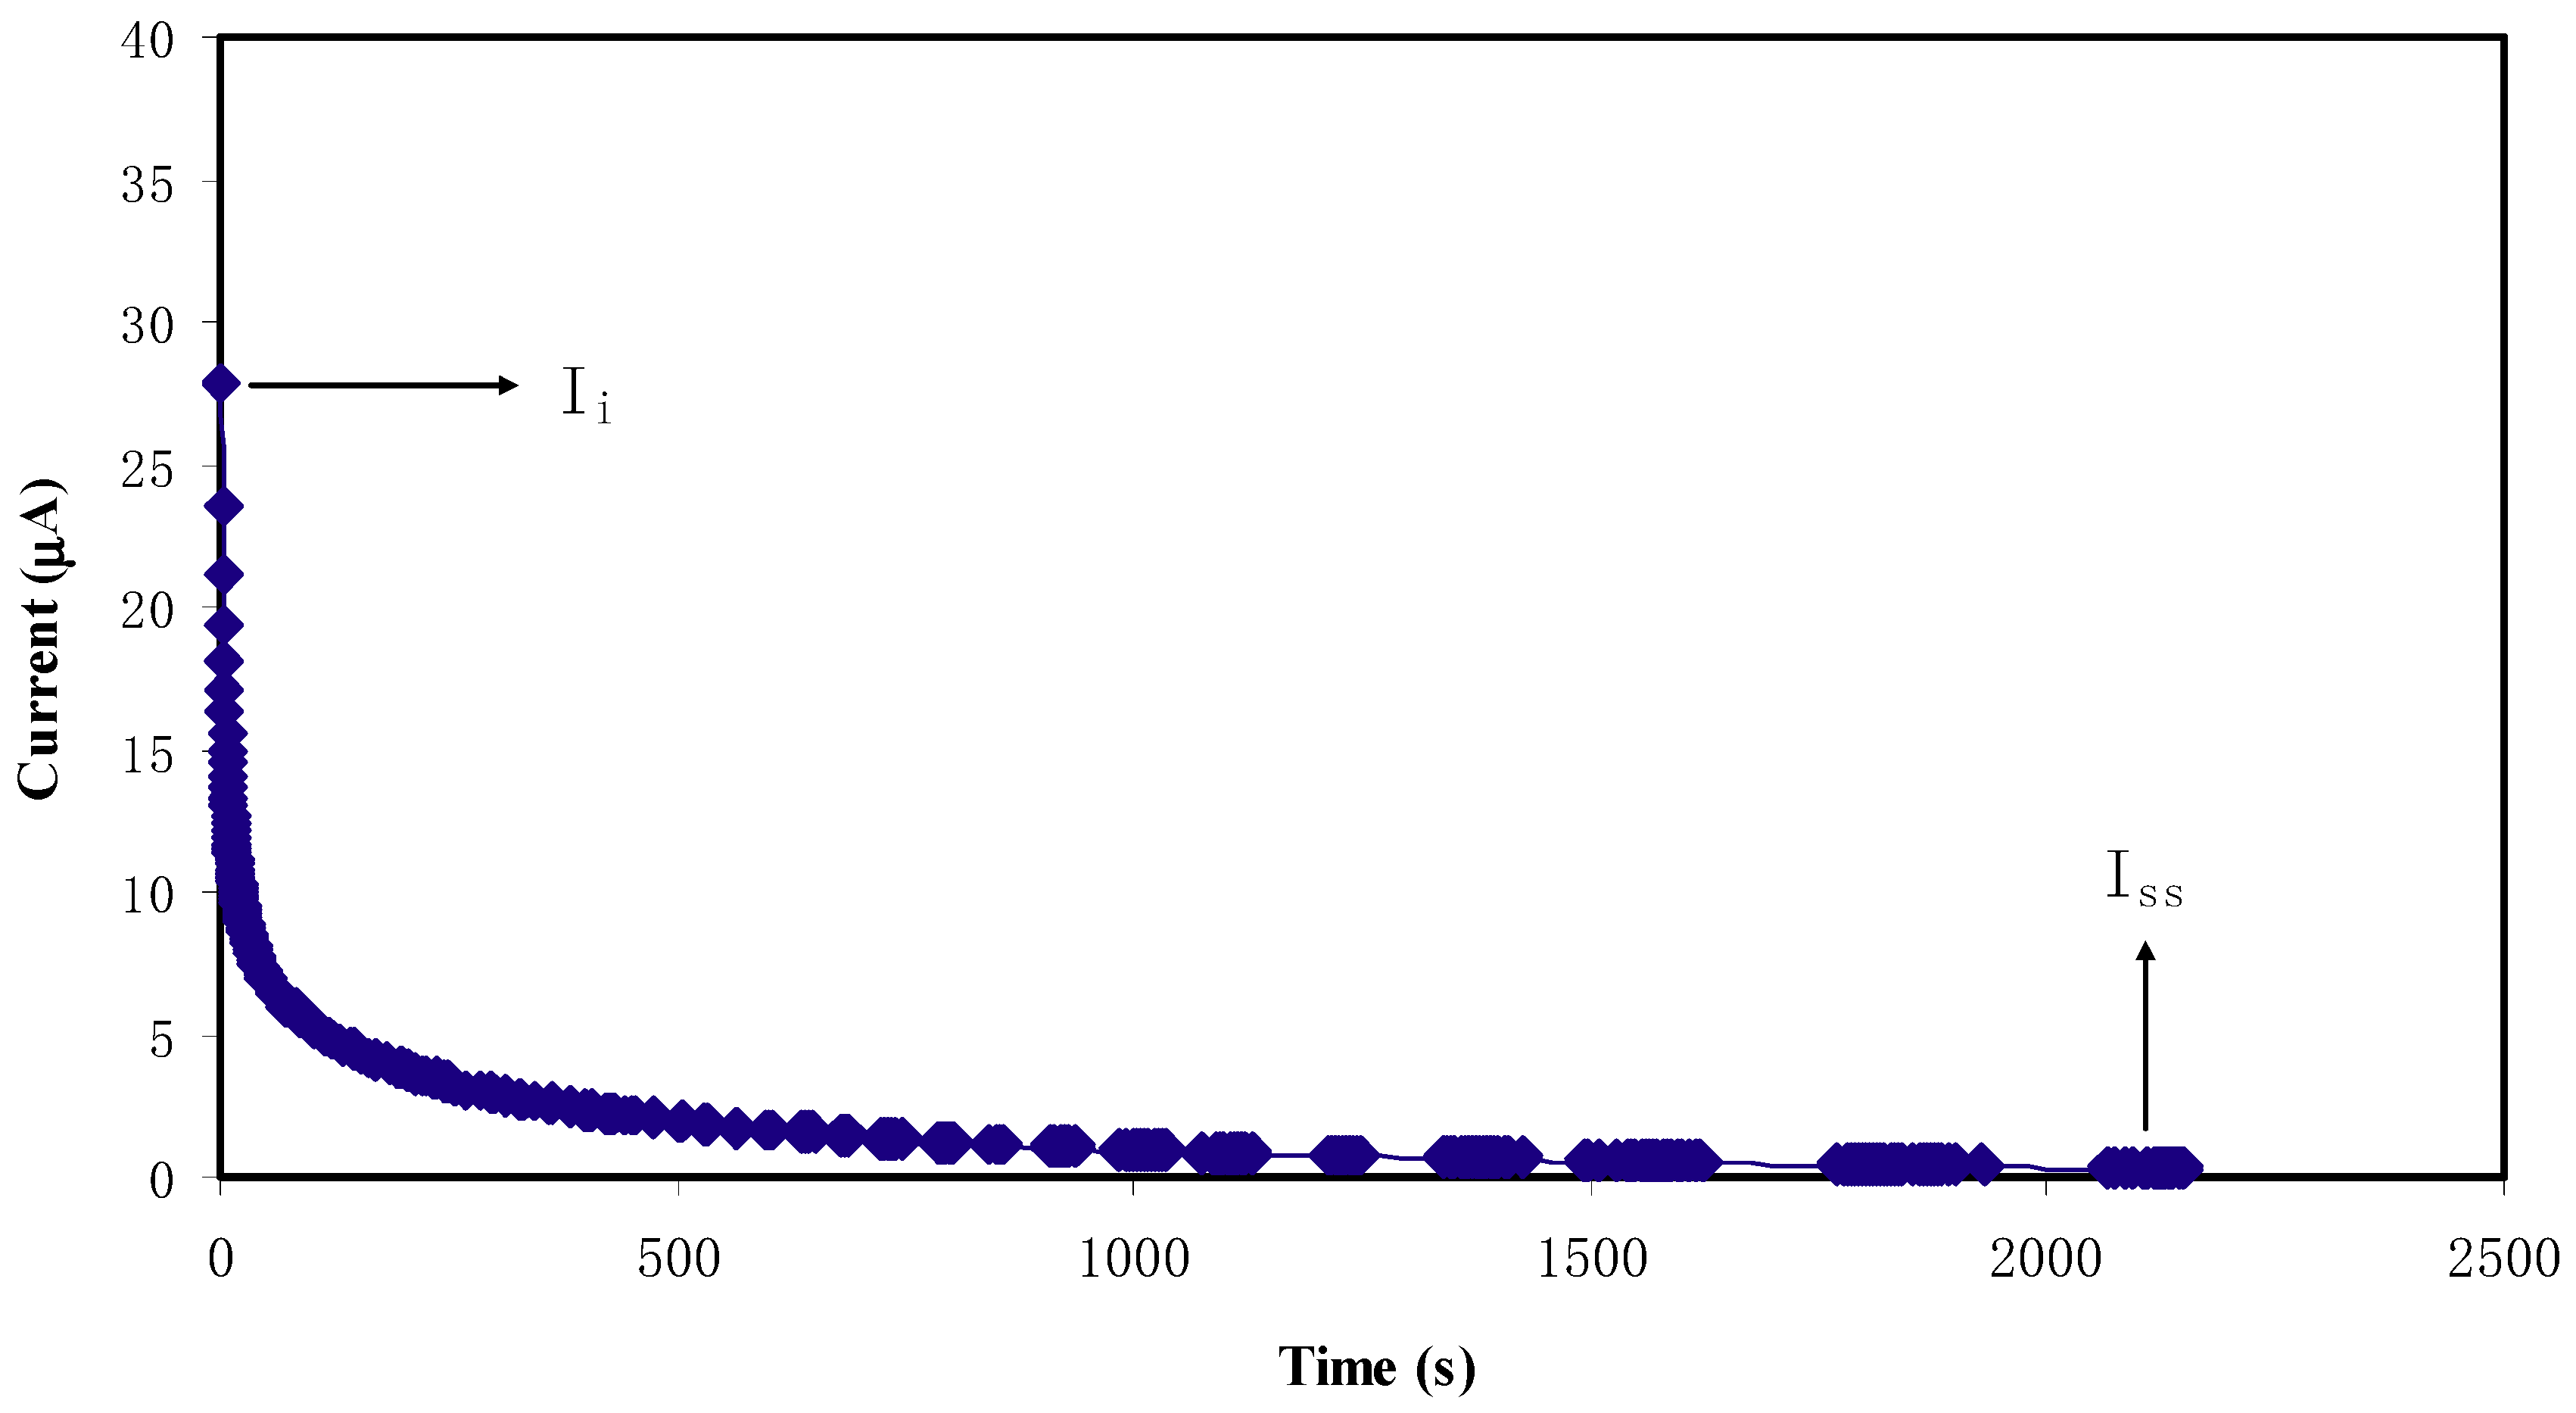
2.4. Transference Number Measurement (TNM) Study
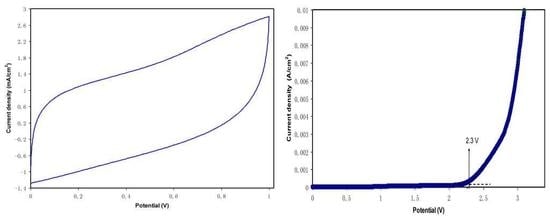
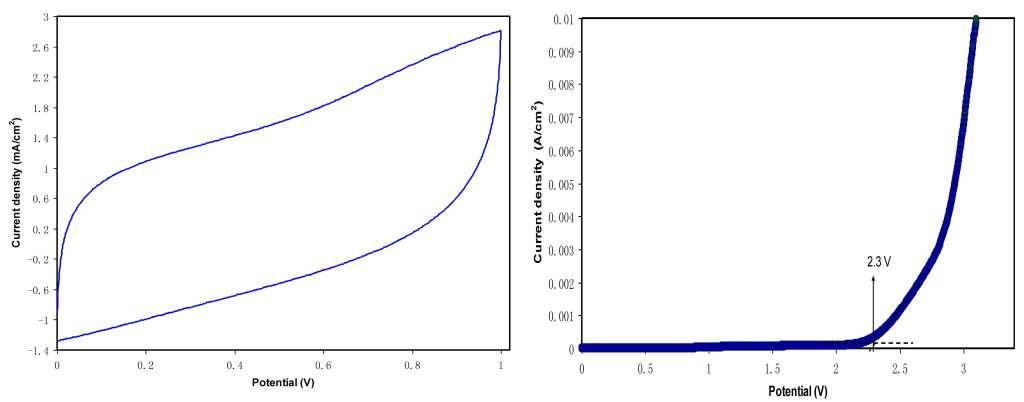
2.5. LSV Analysis
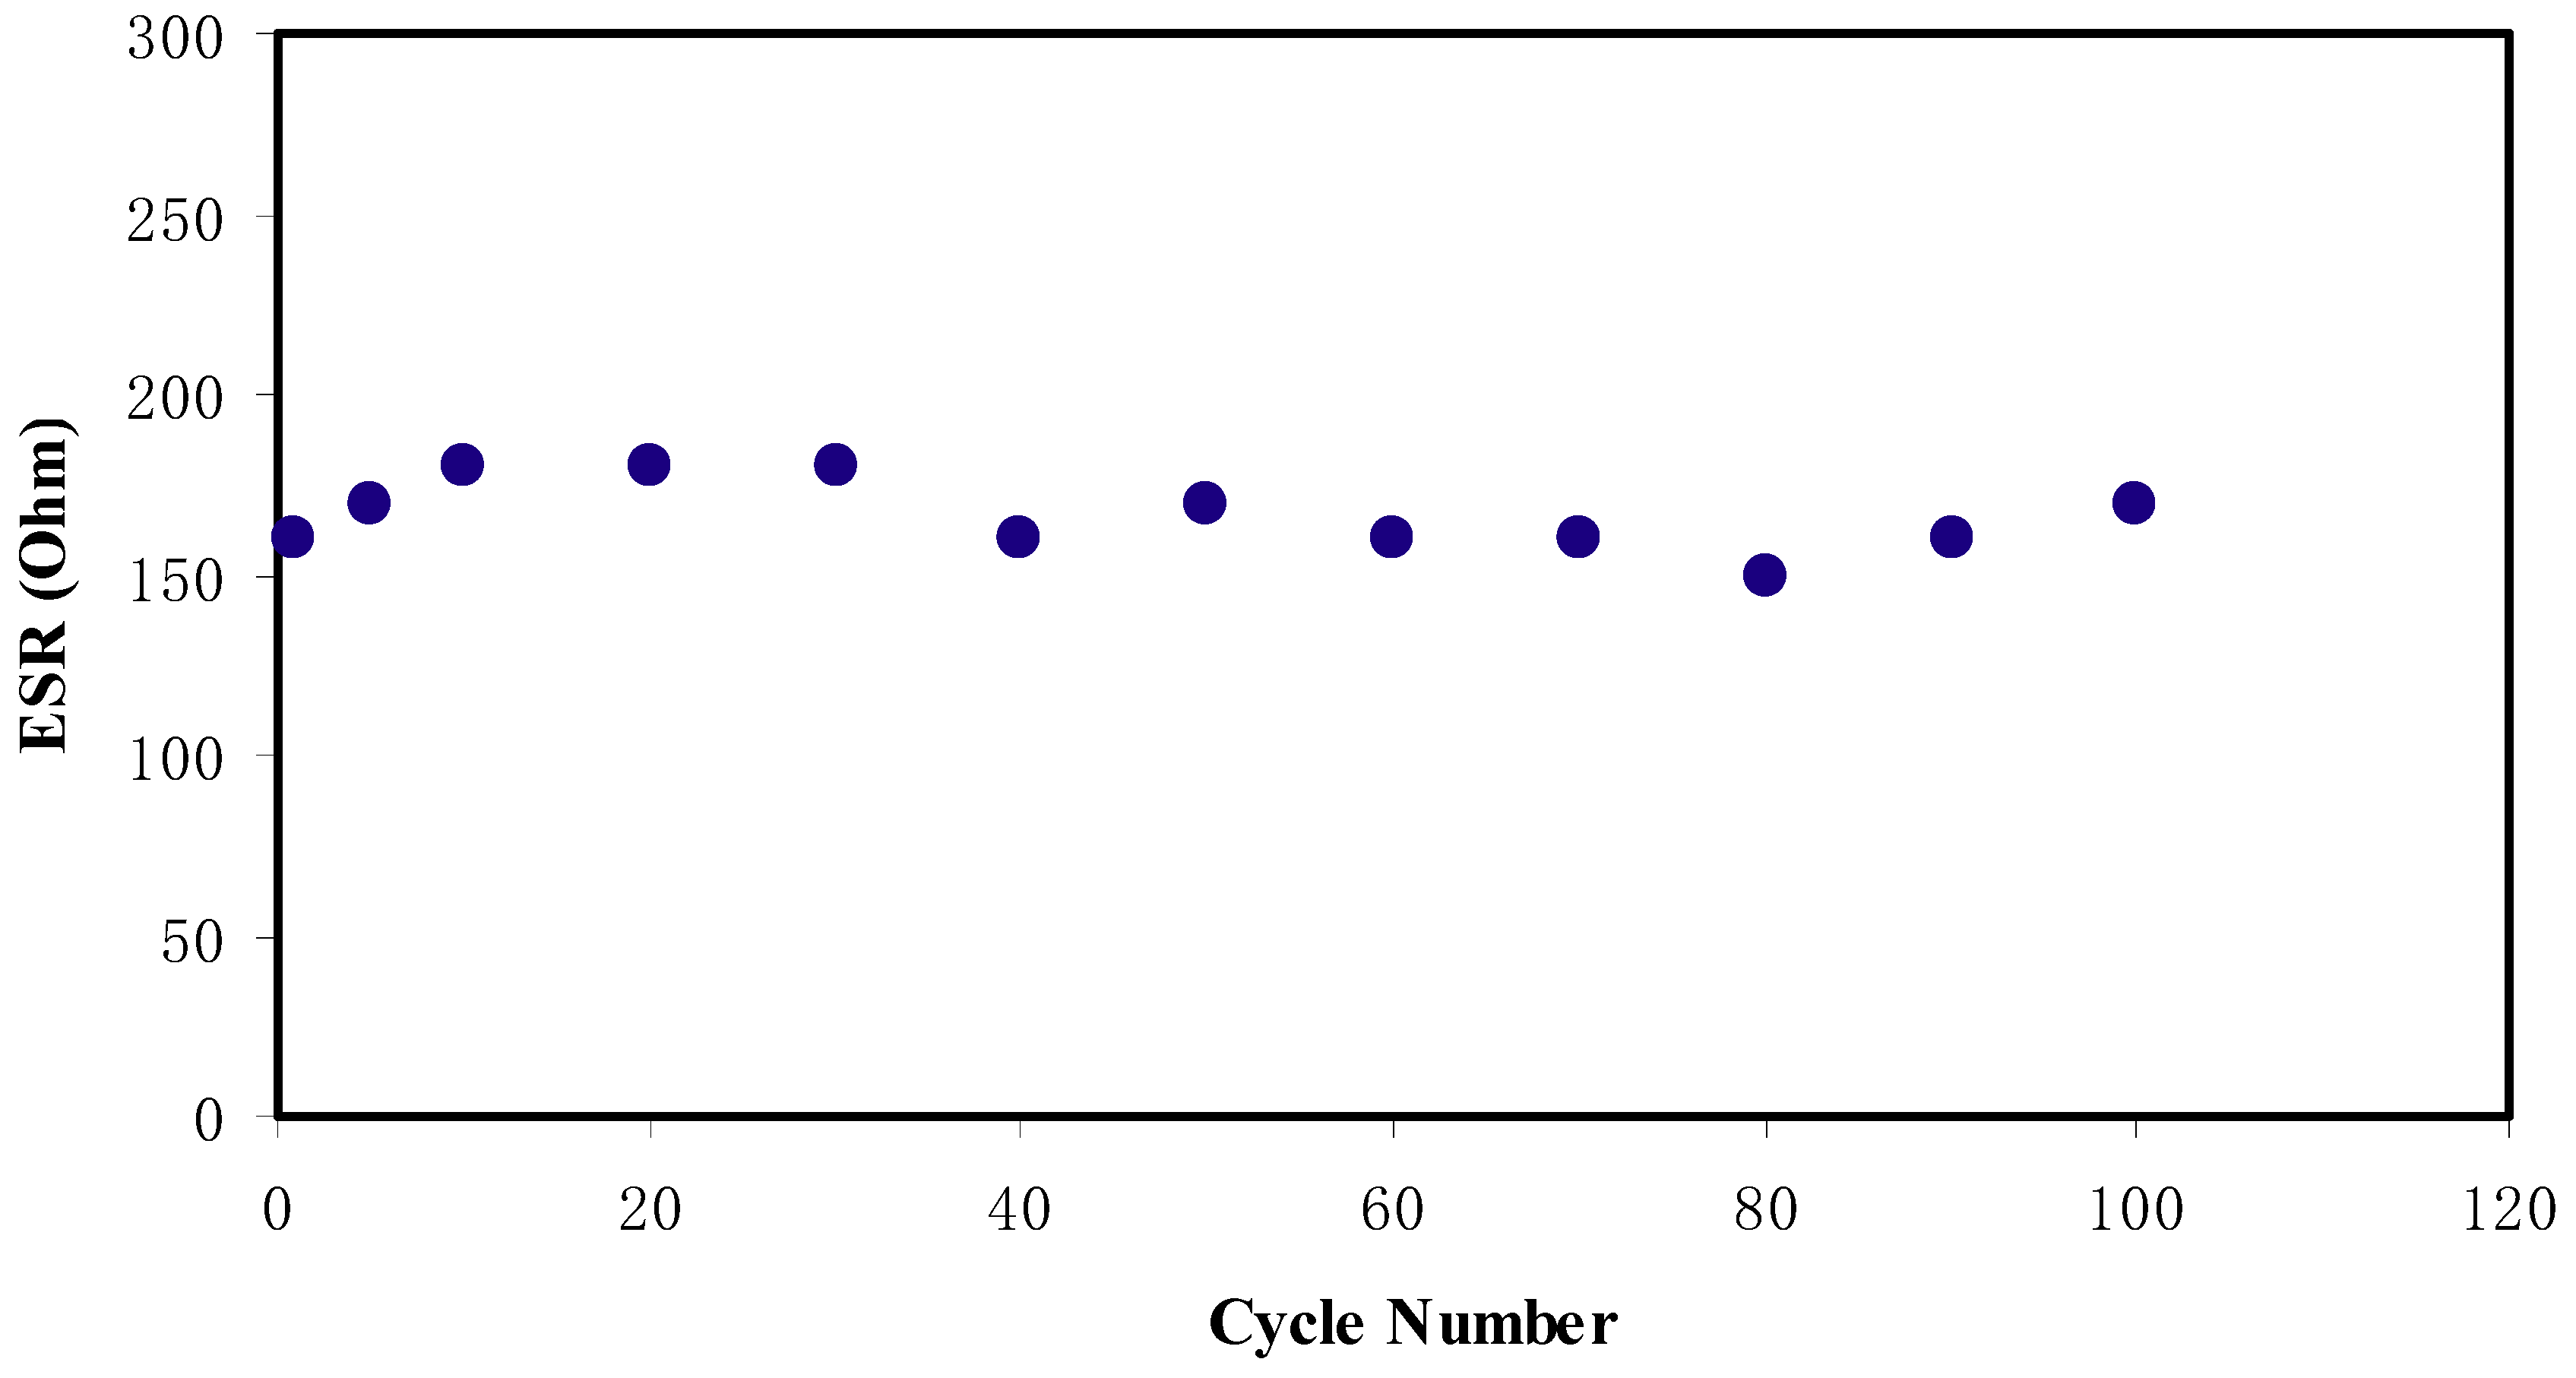
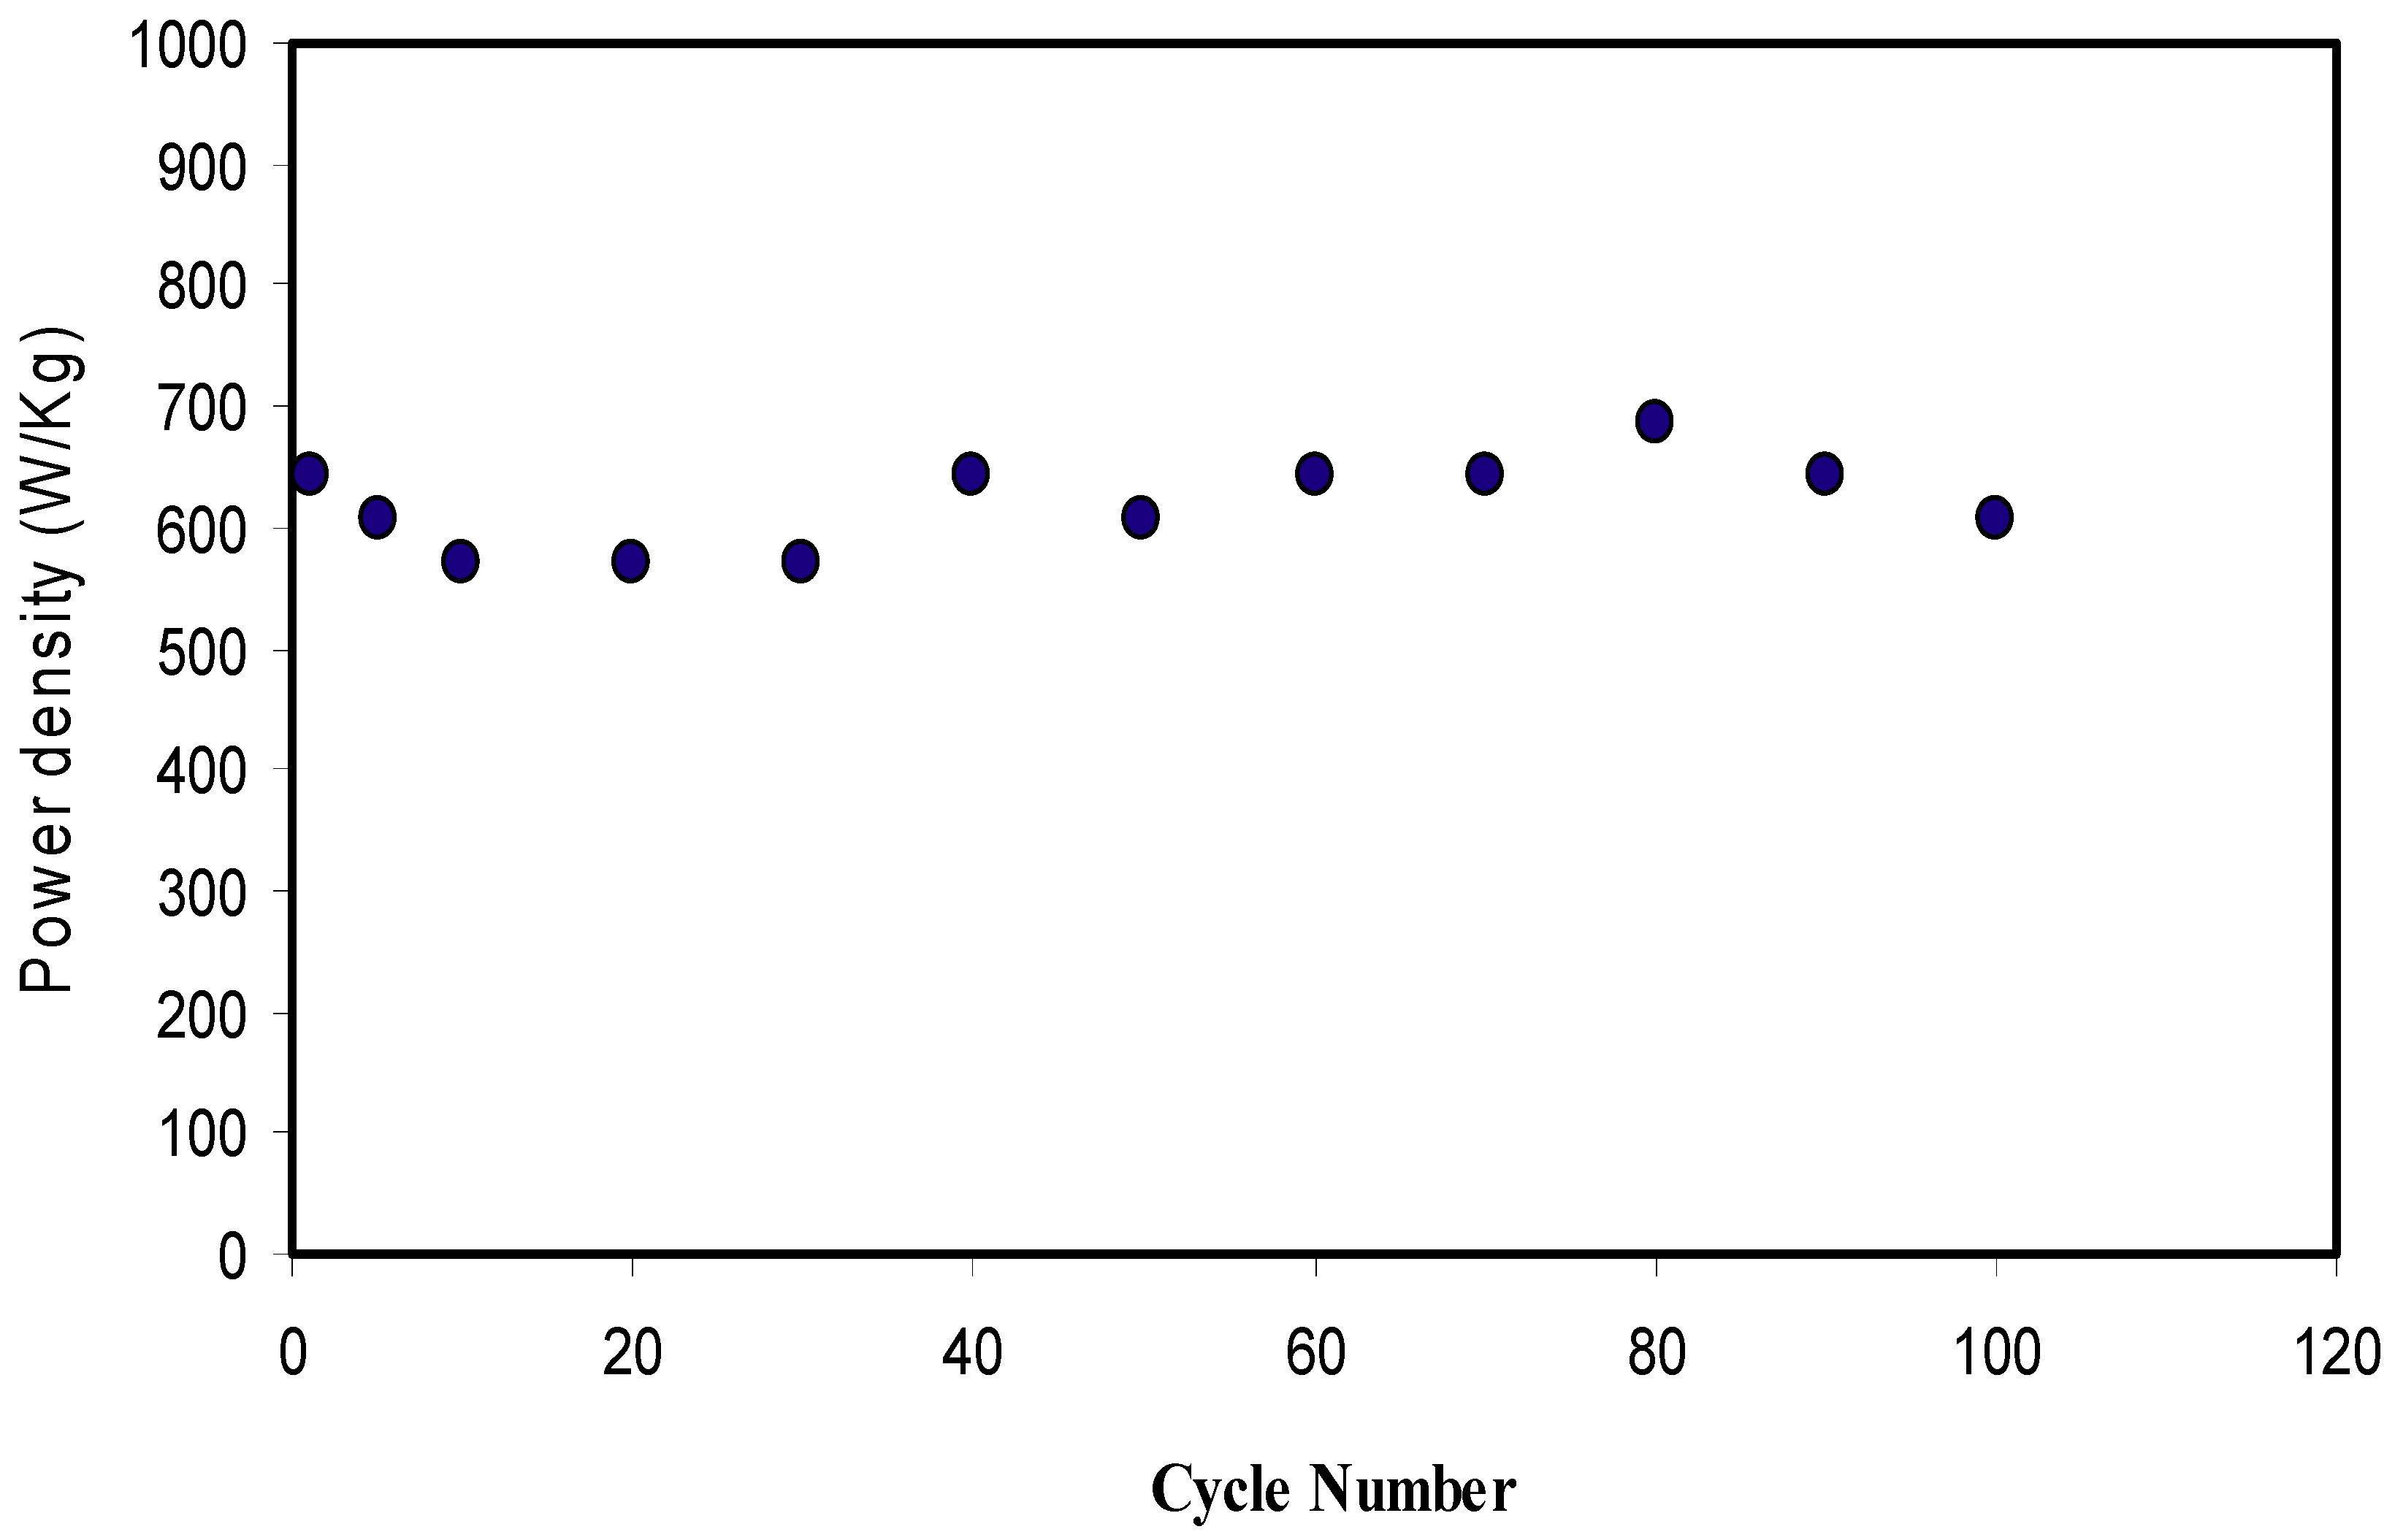
2.6. EDLC Study
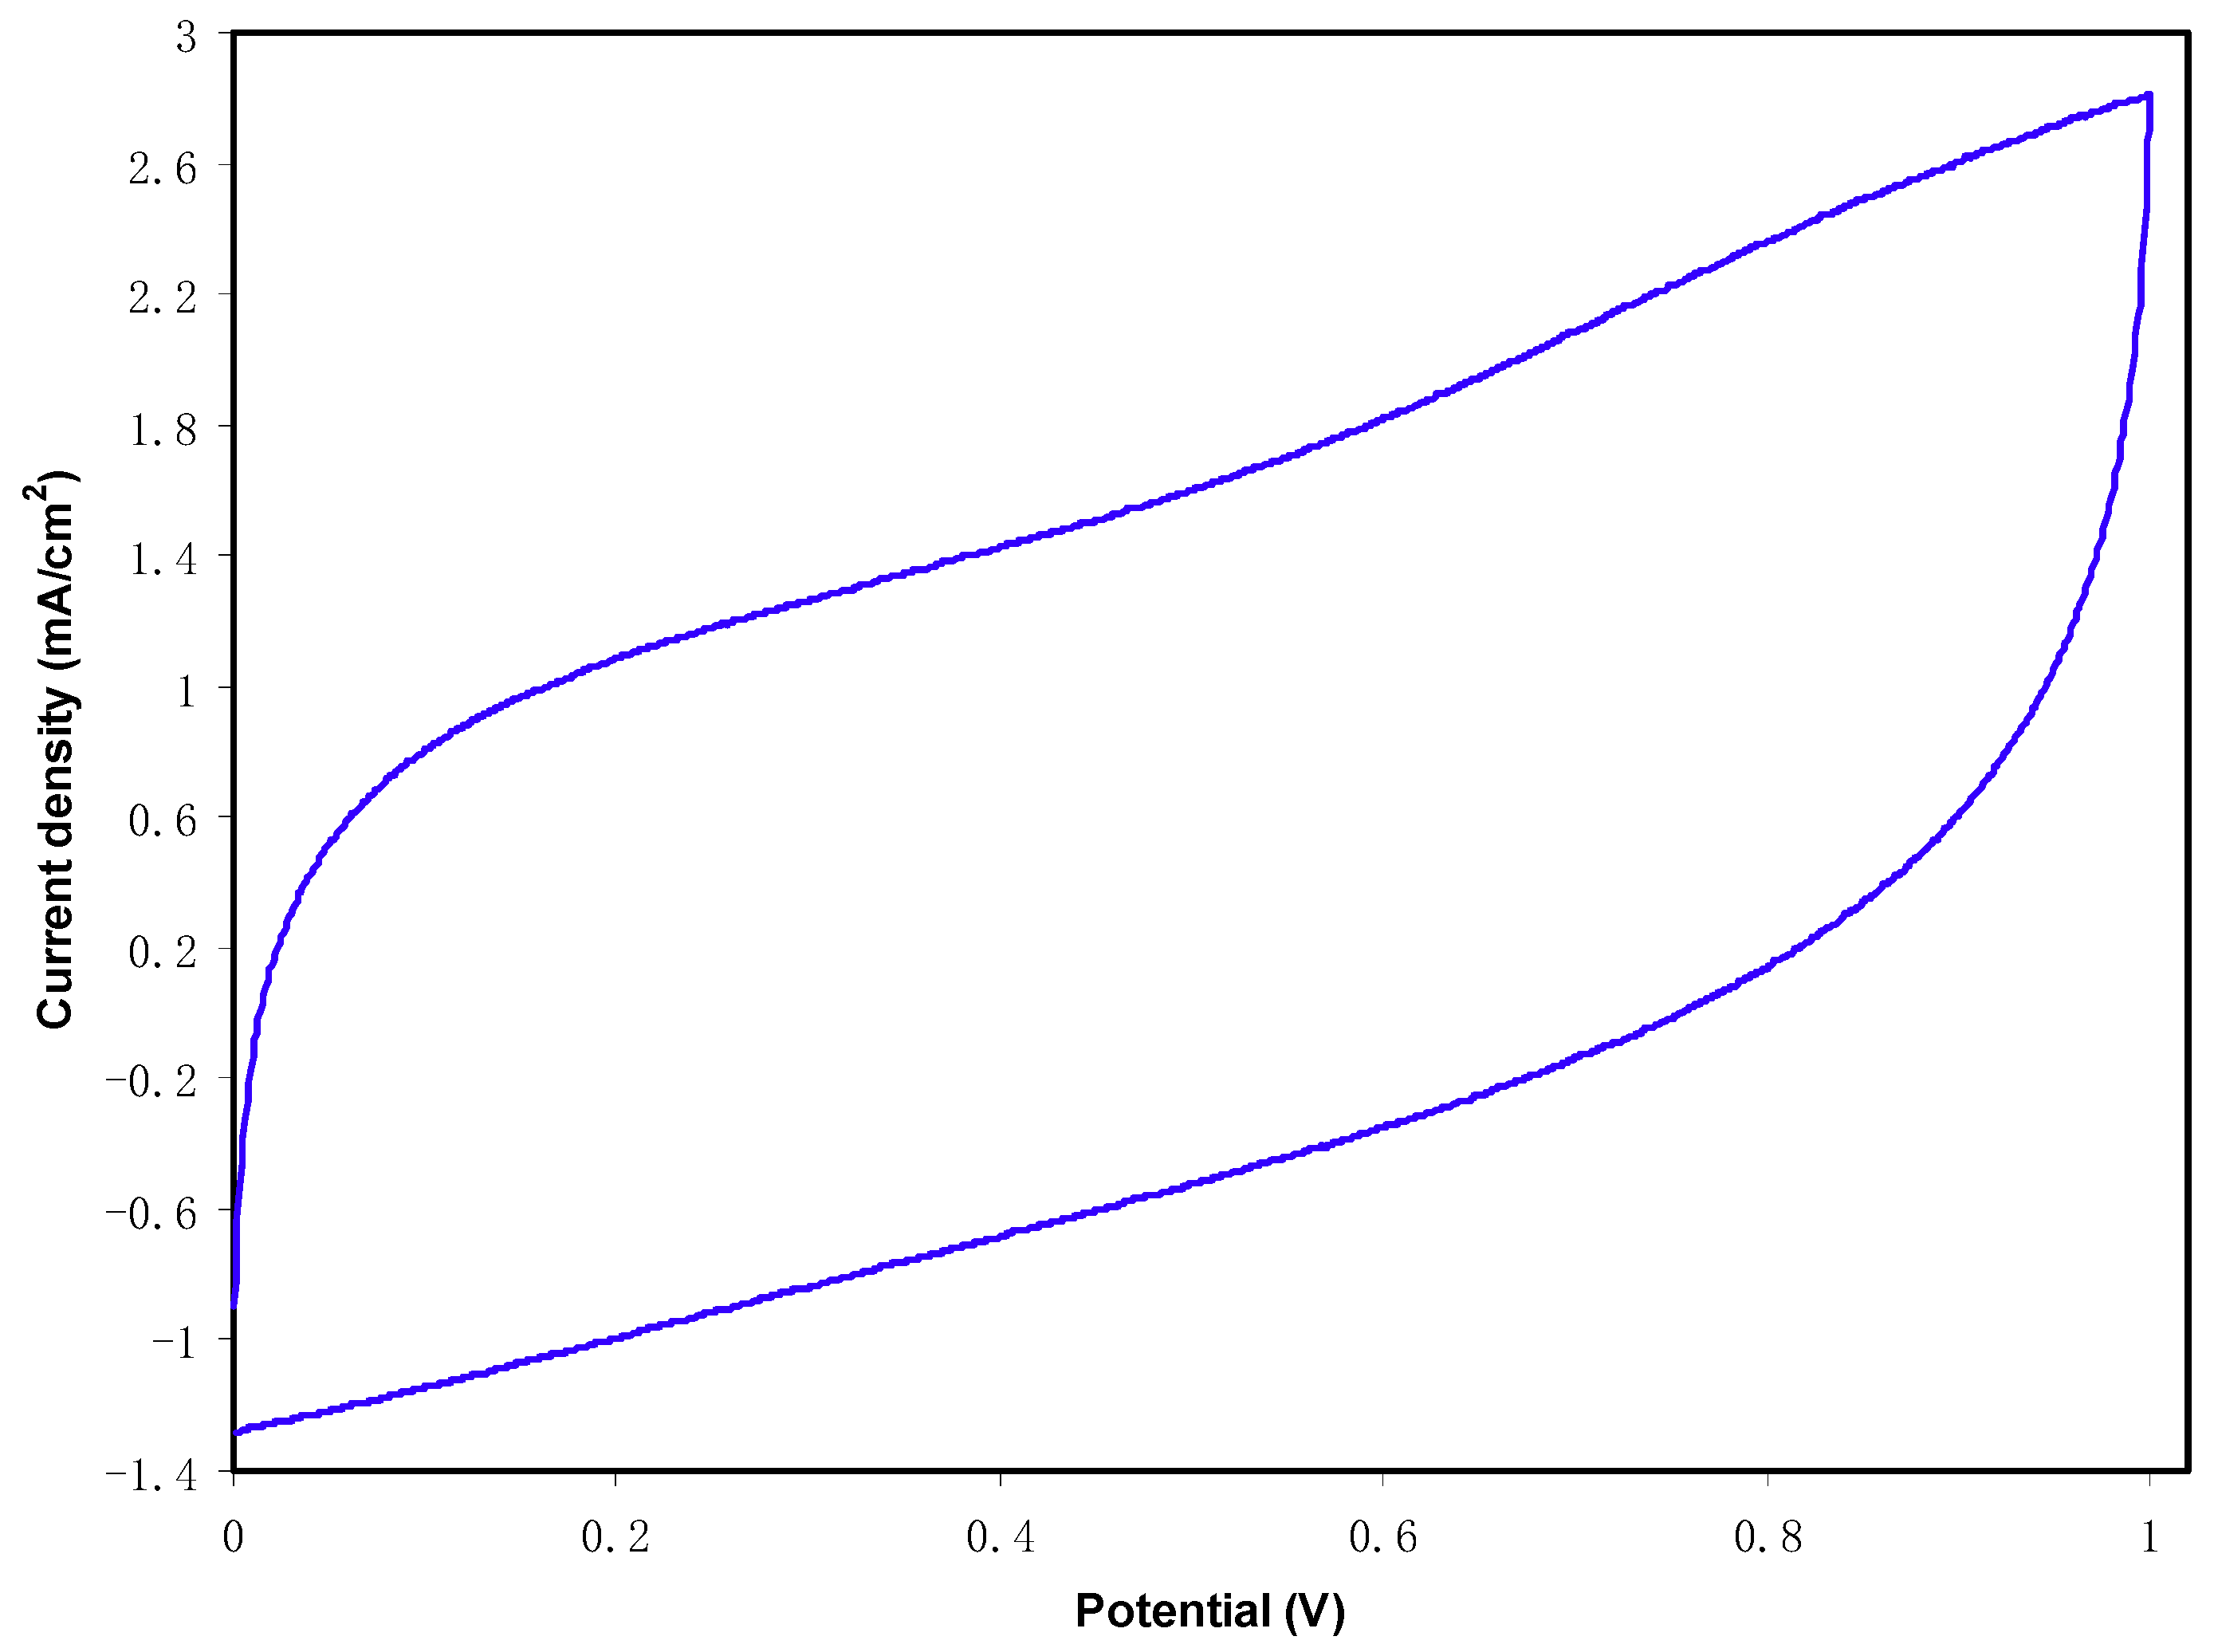
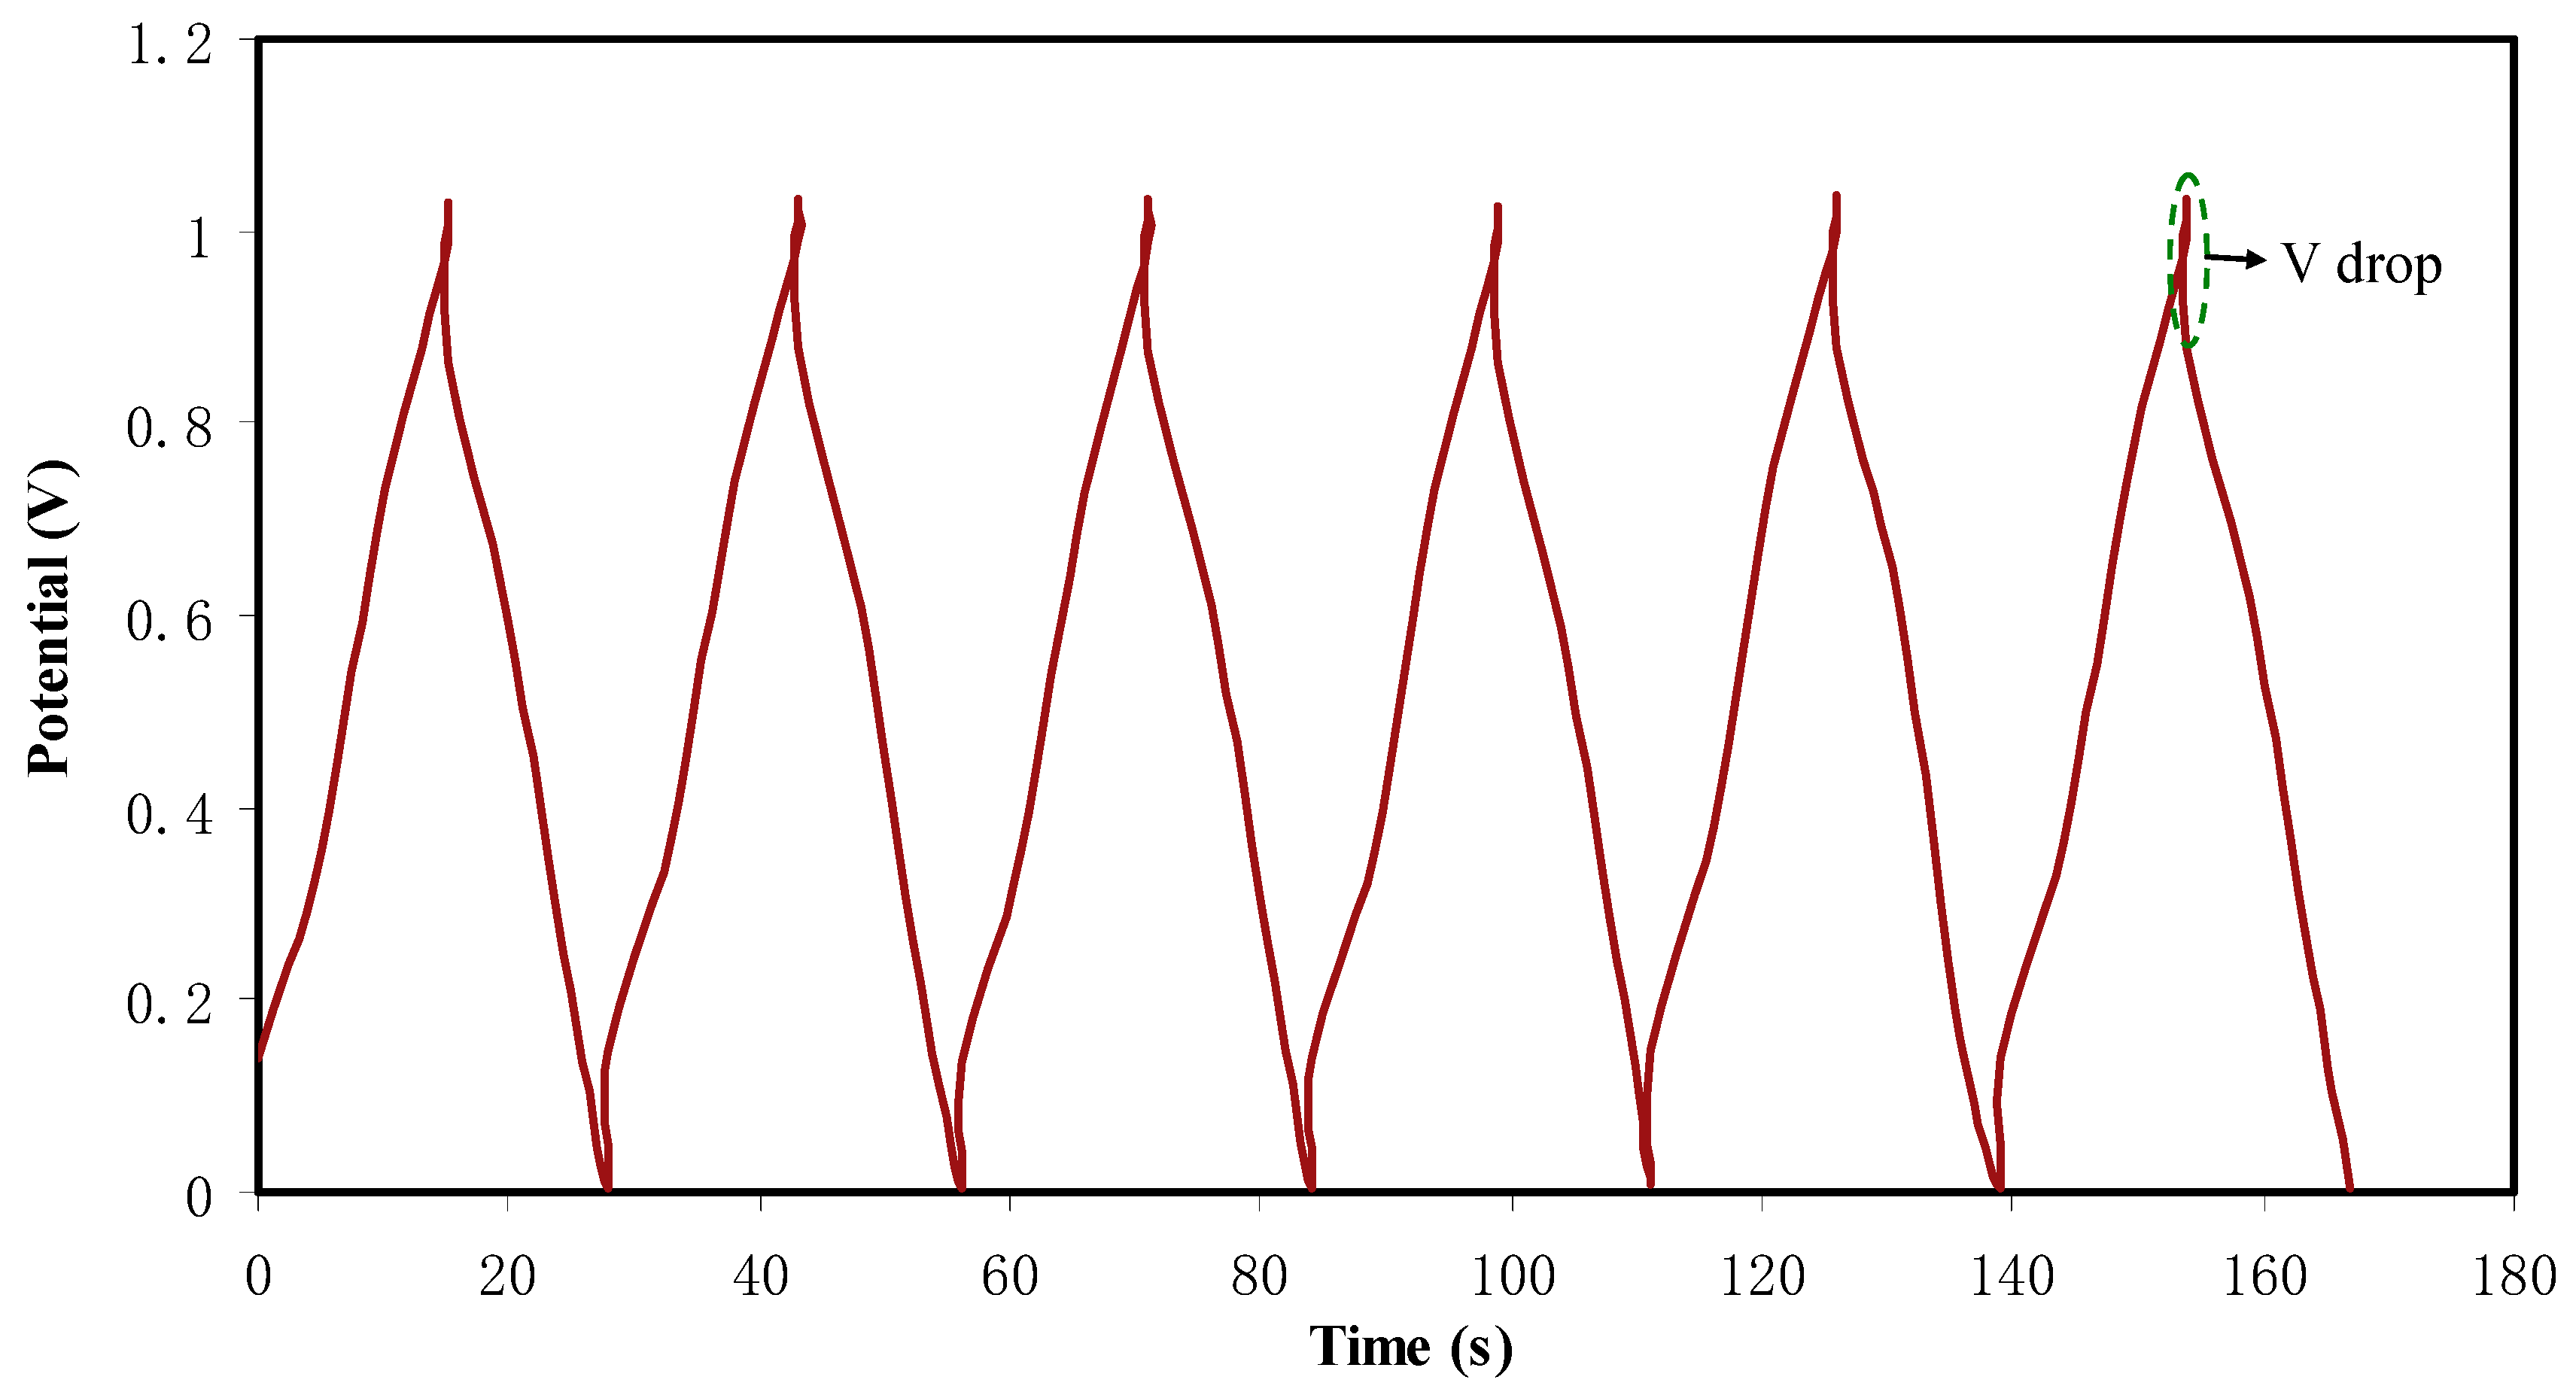
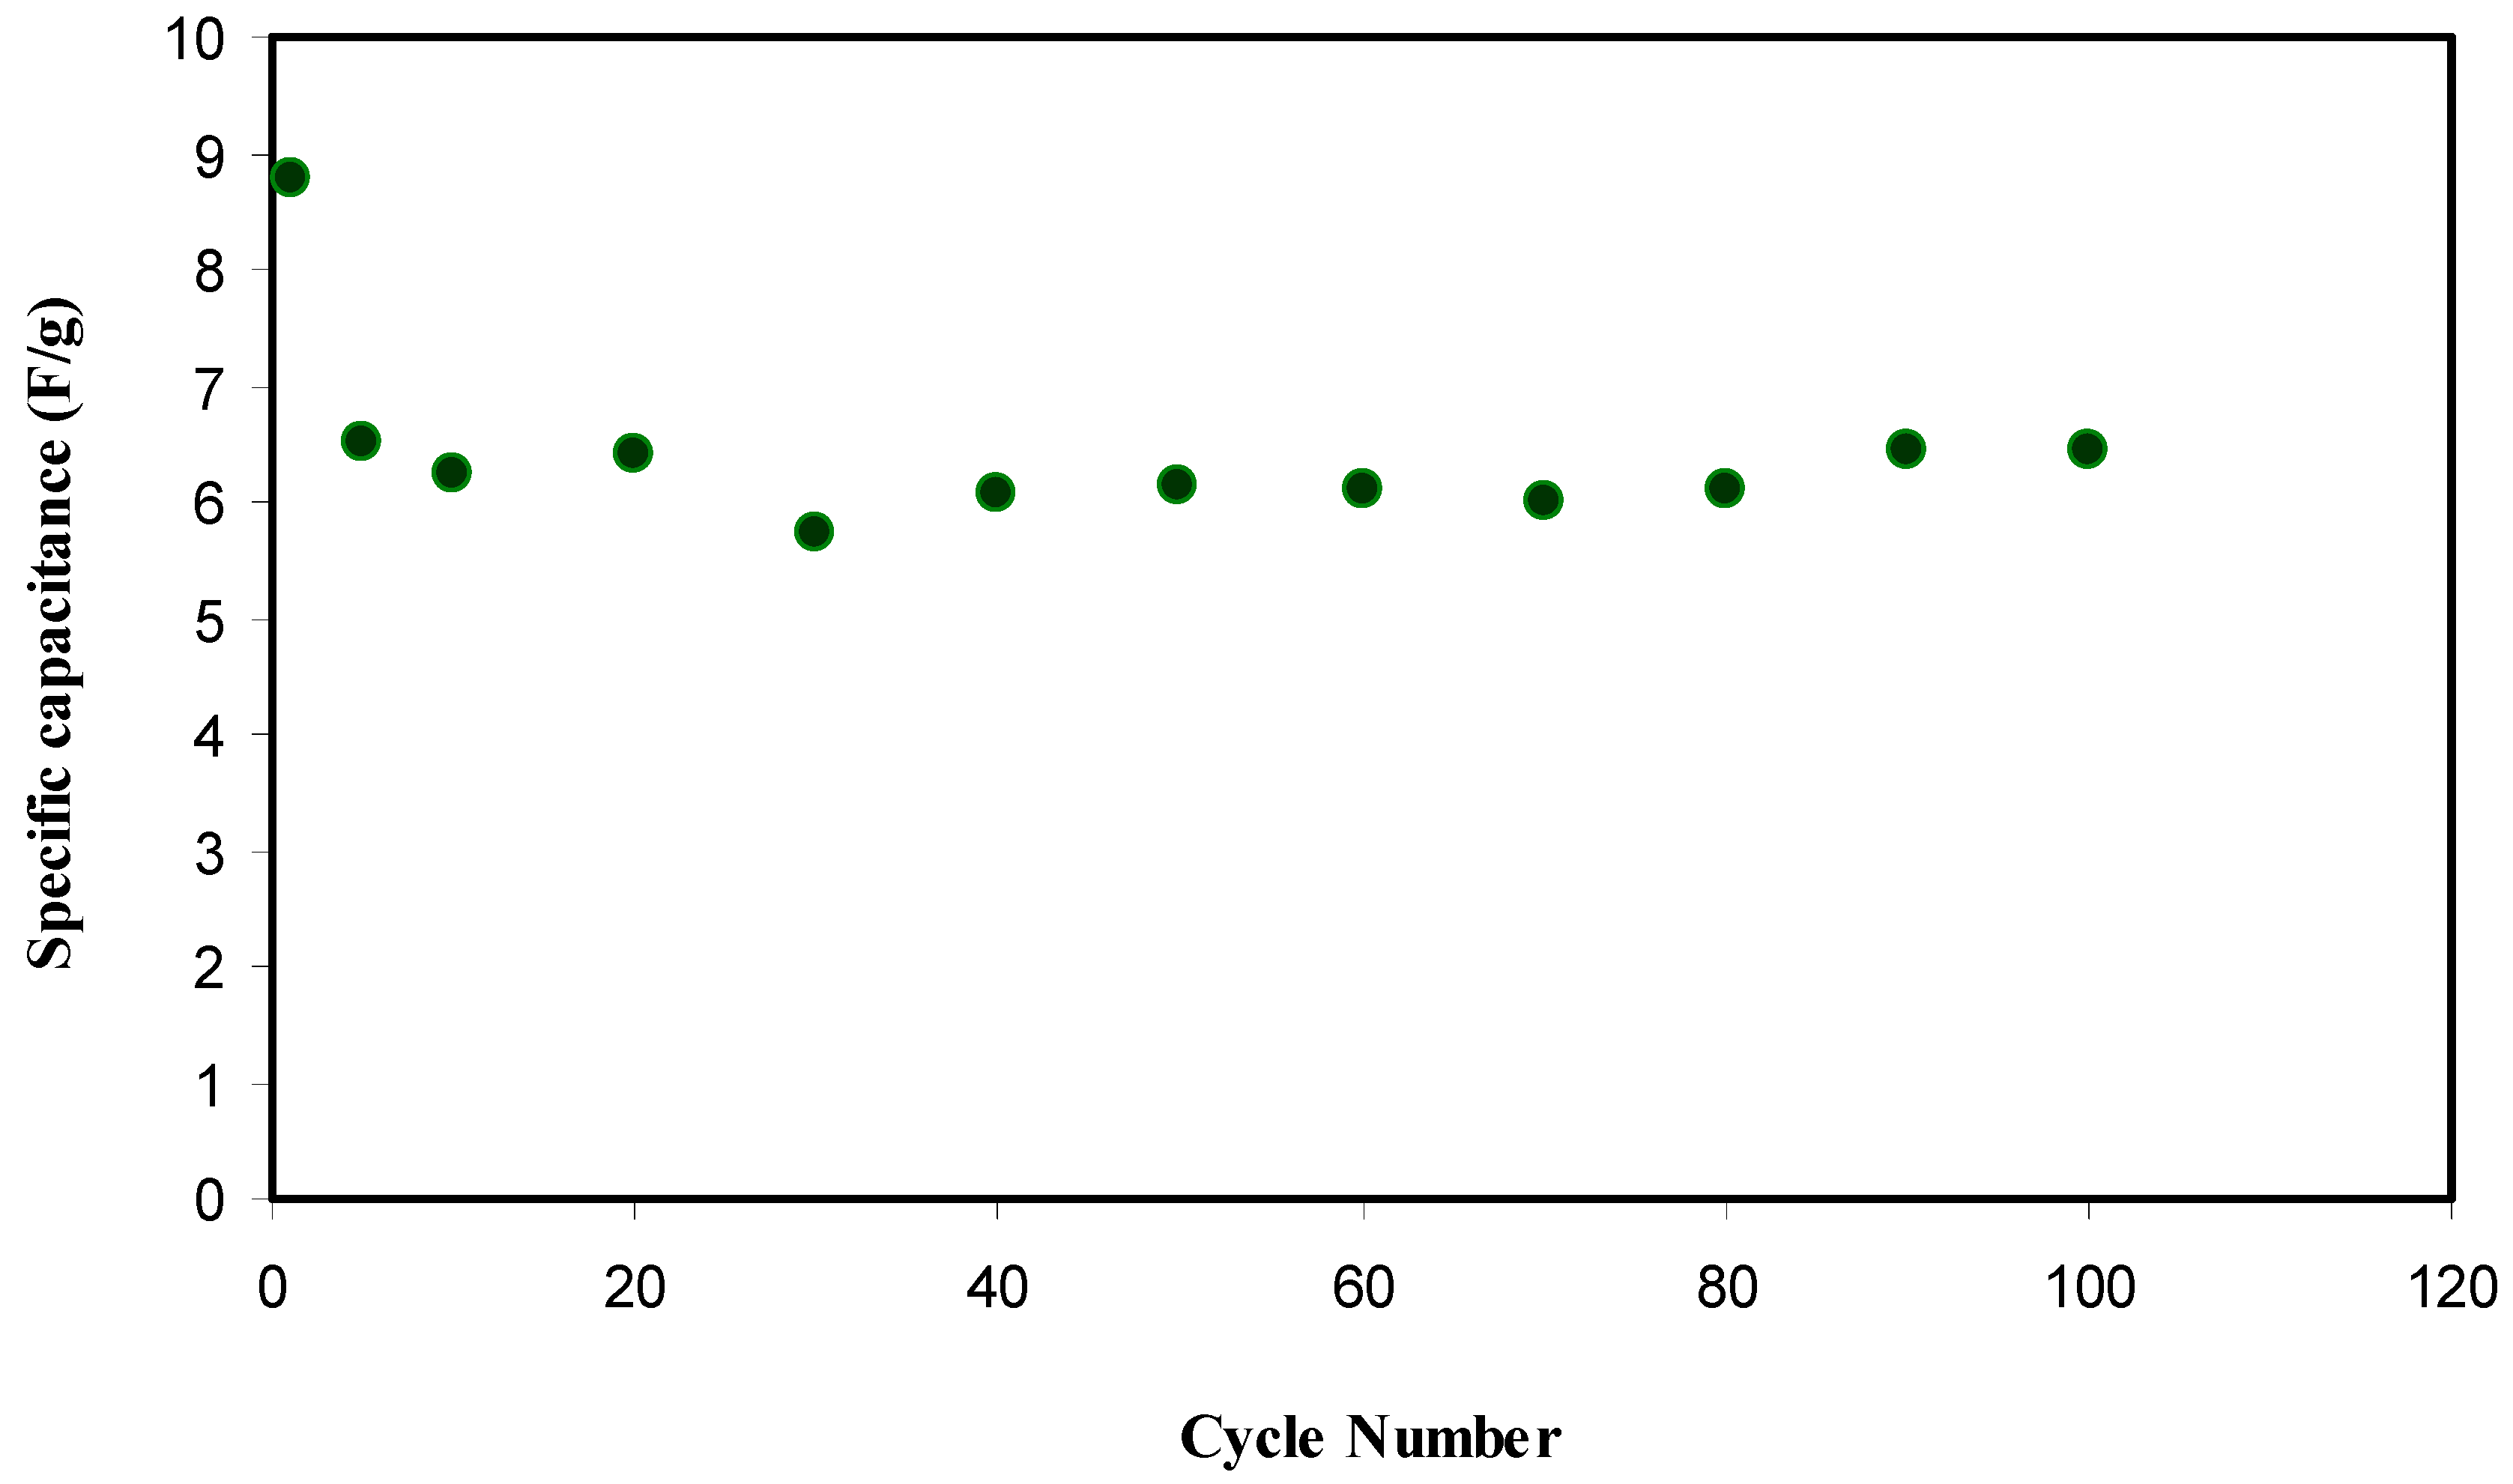
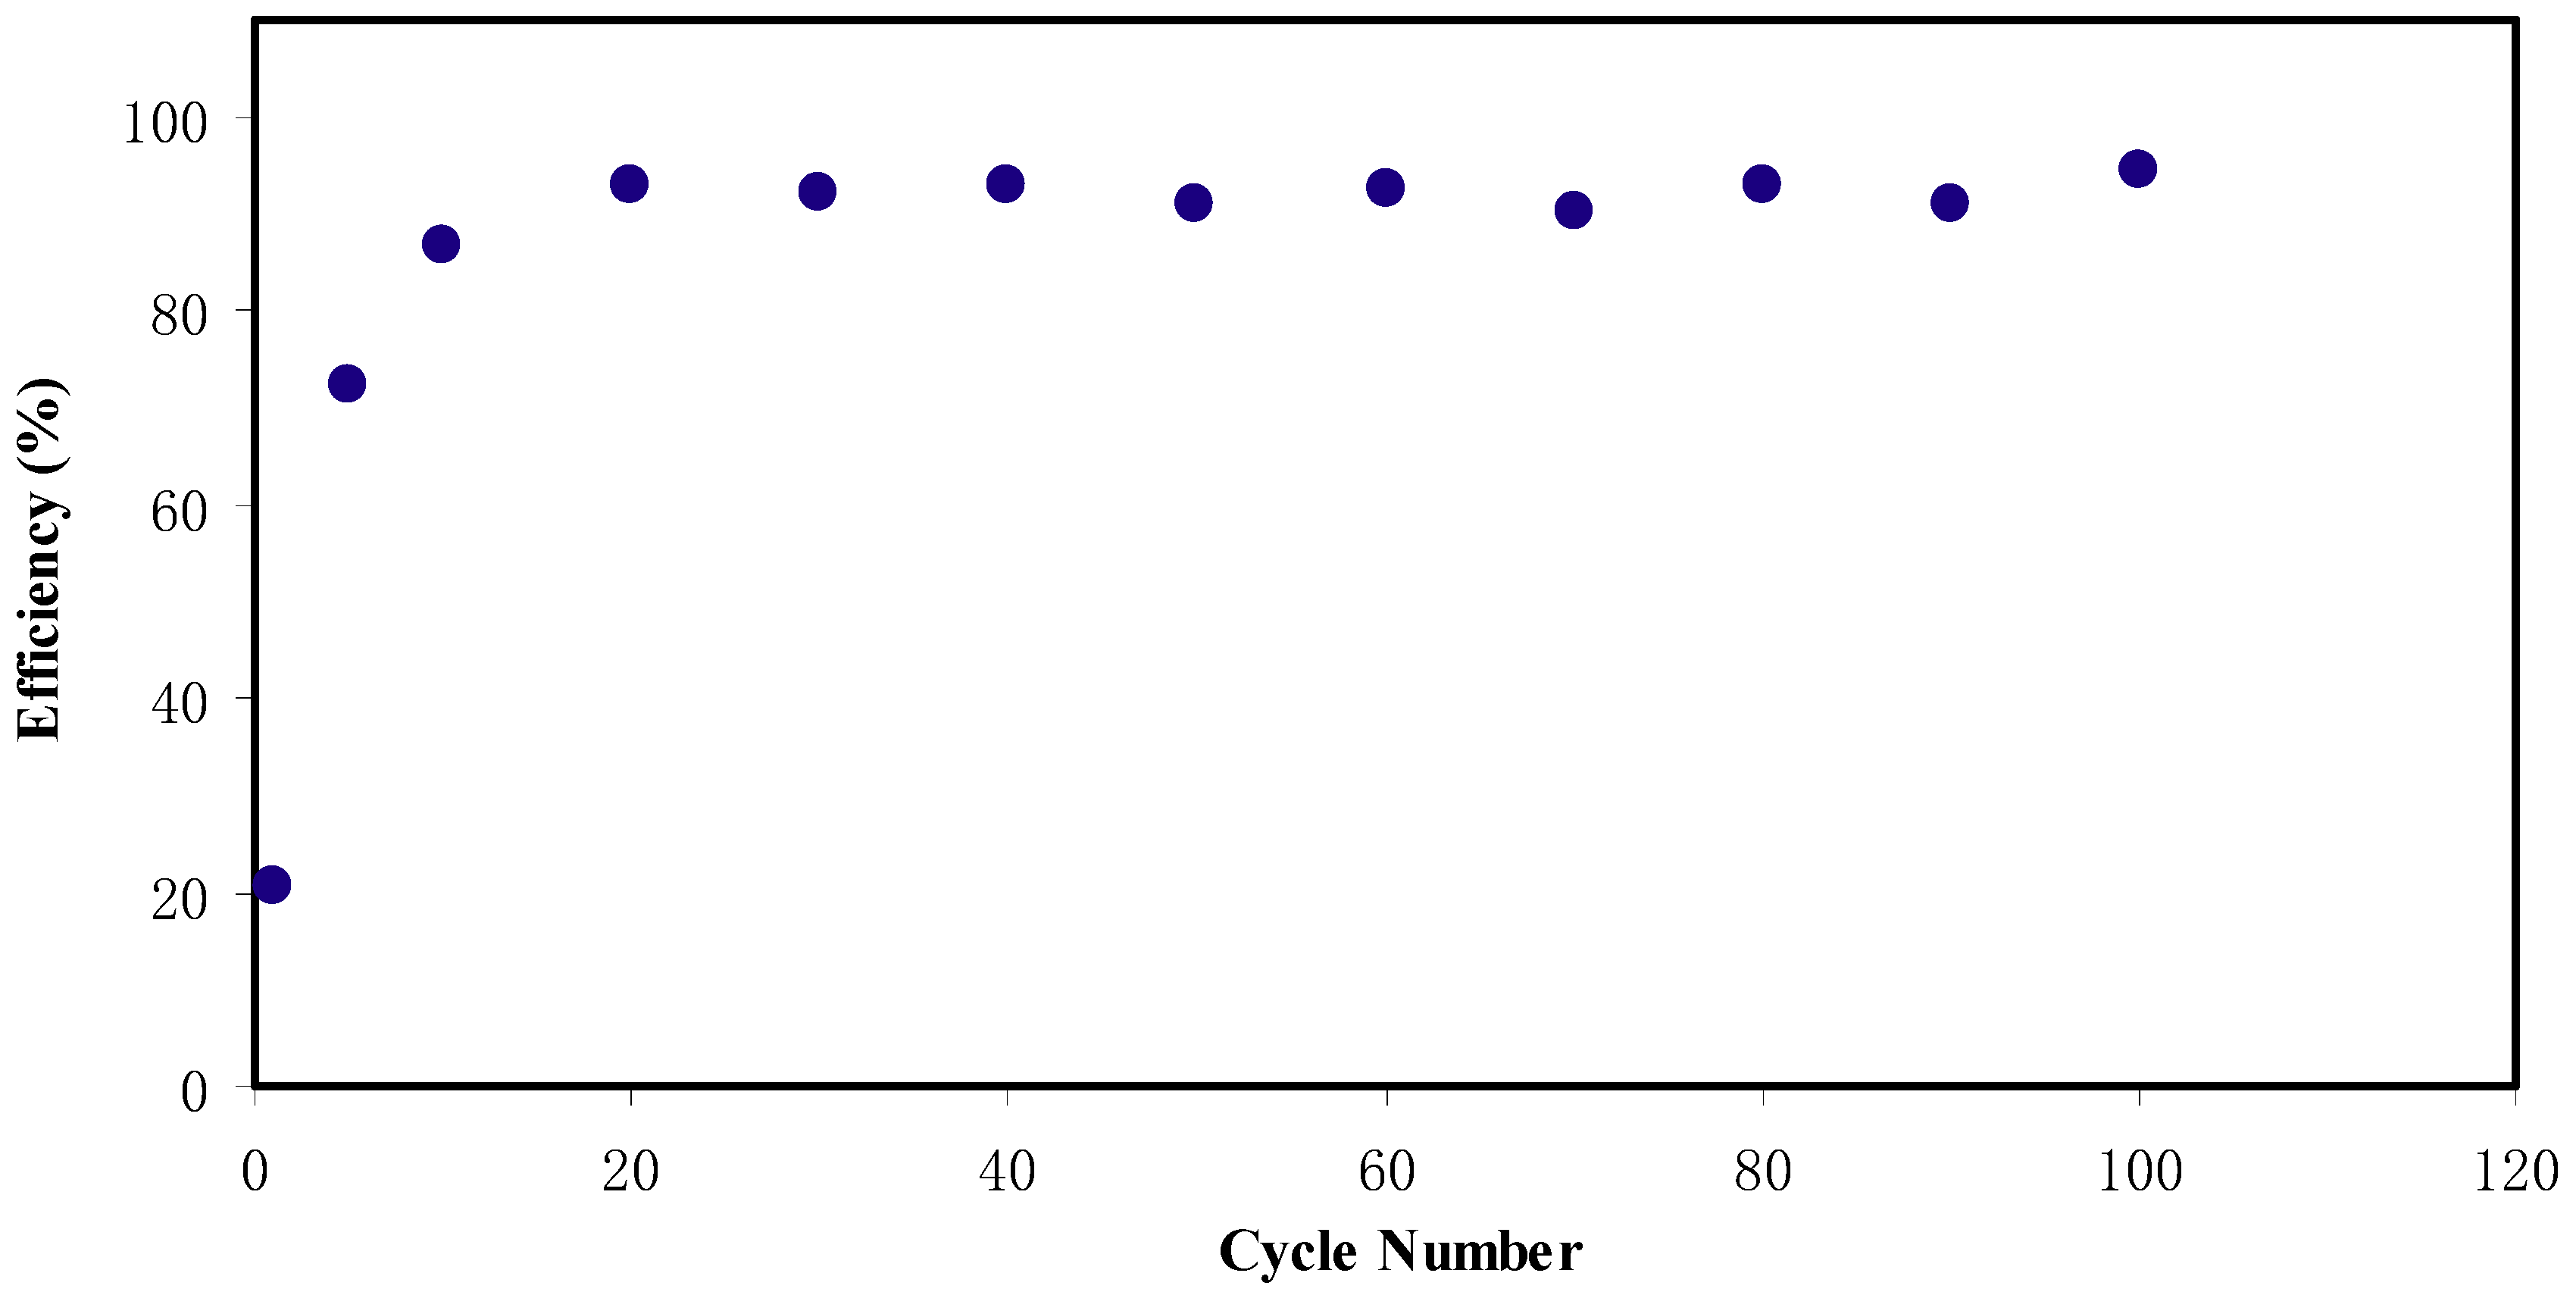
CV and EDLC Characteristics
3. Experimental Method
3.1. Materials and Sample Preparation
3.2. TNM and LSV Measurements
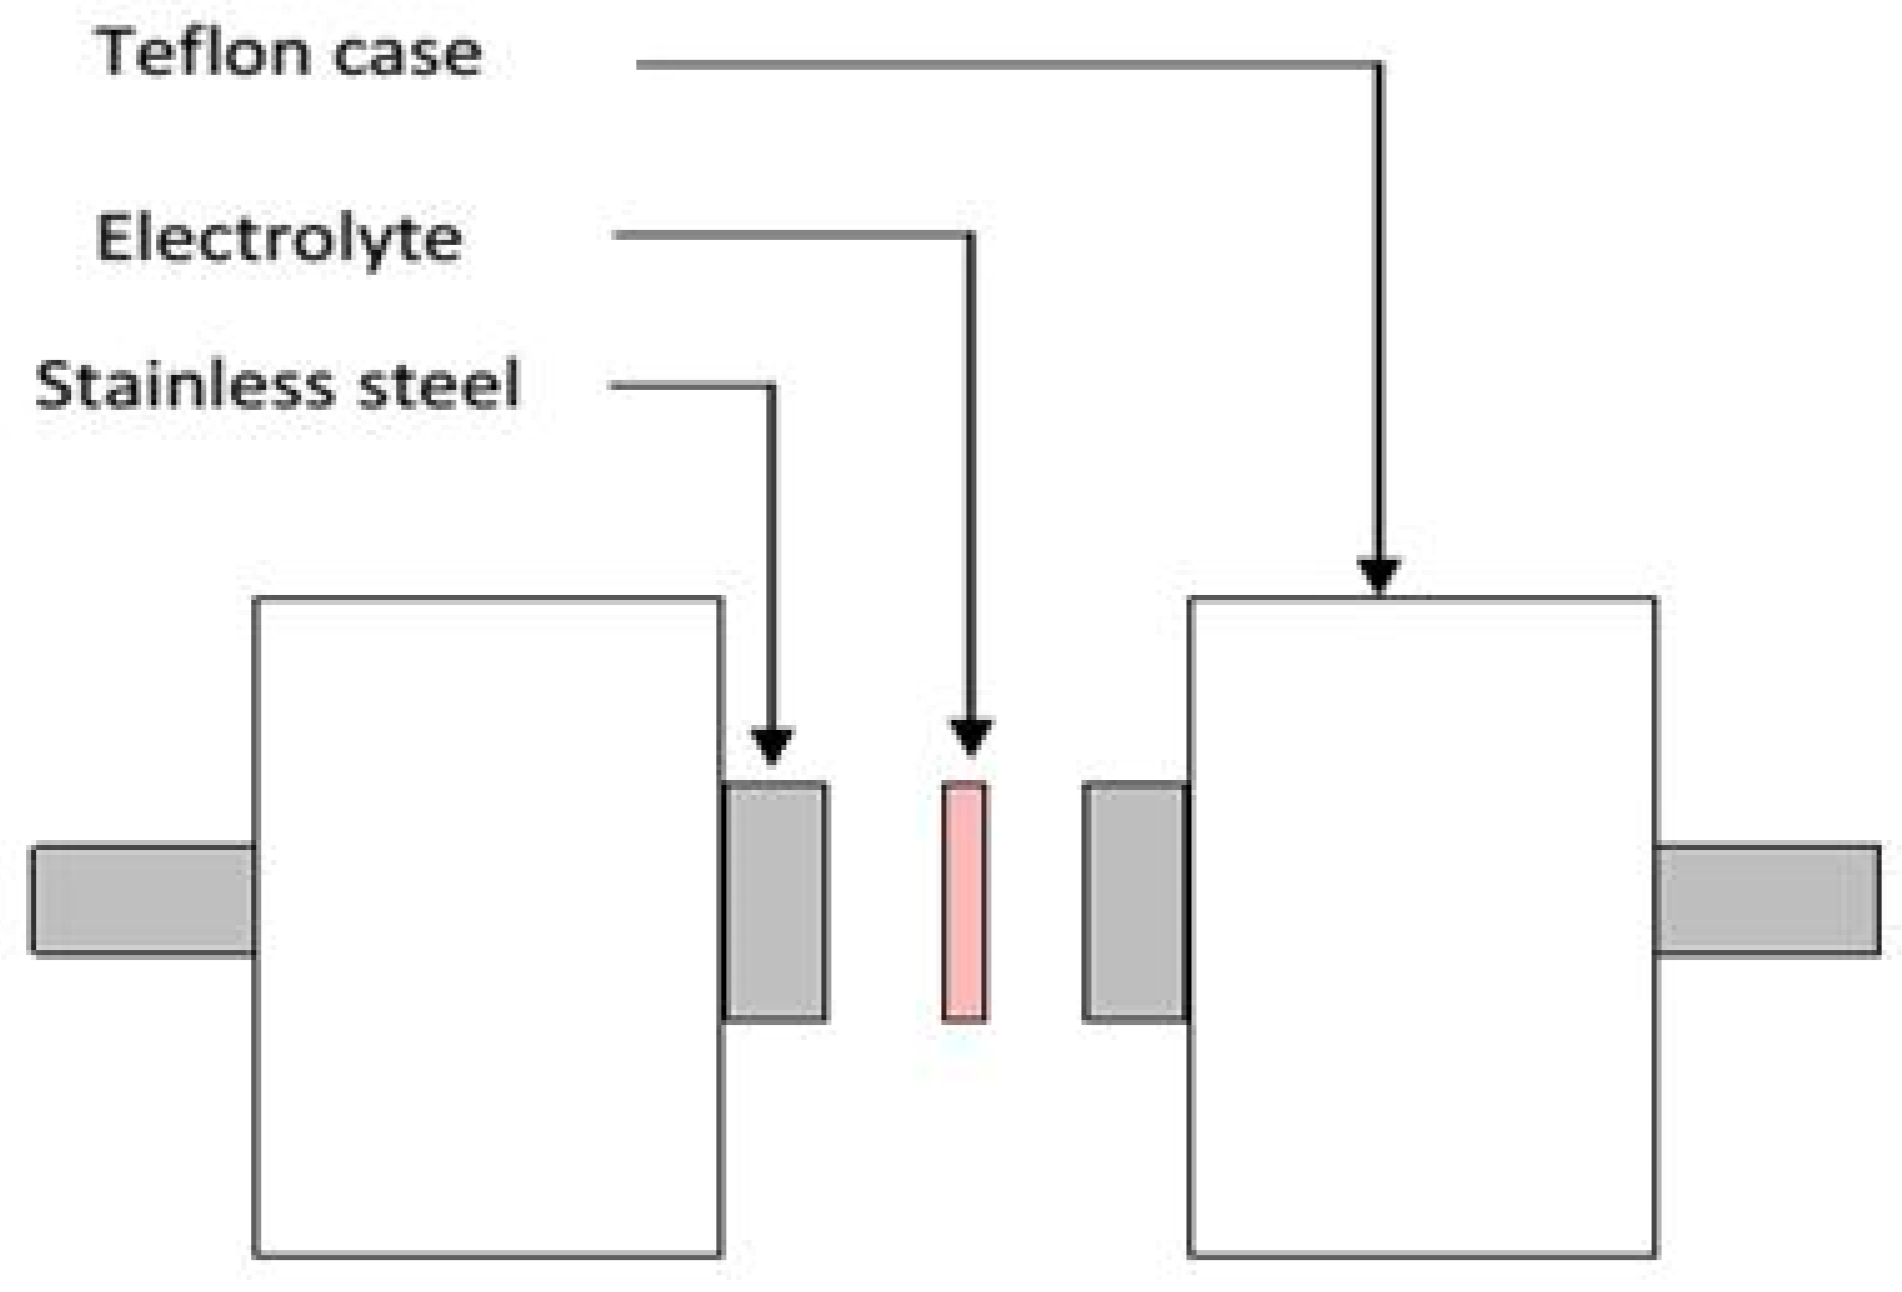
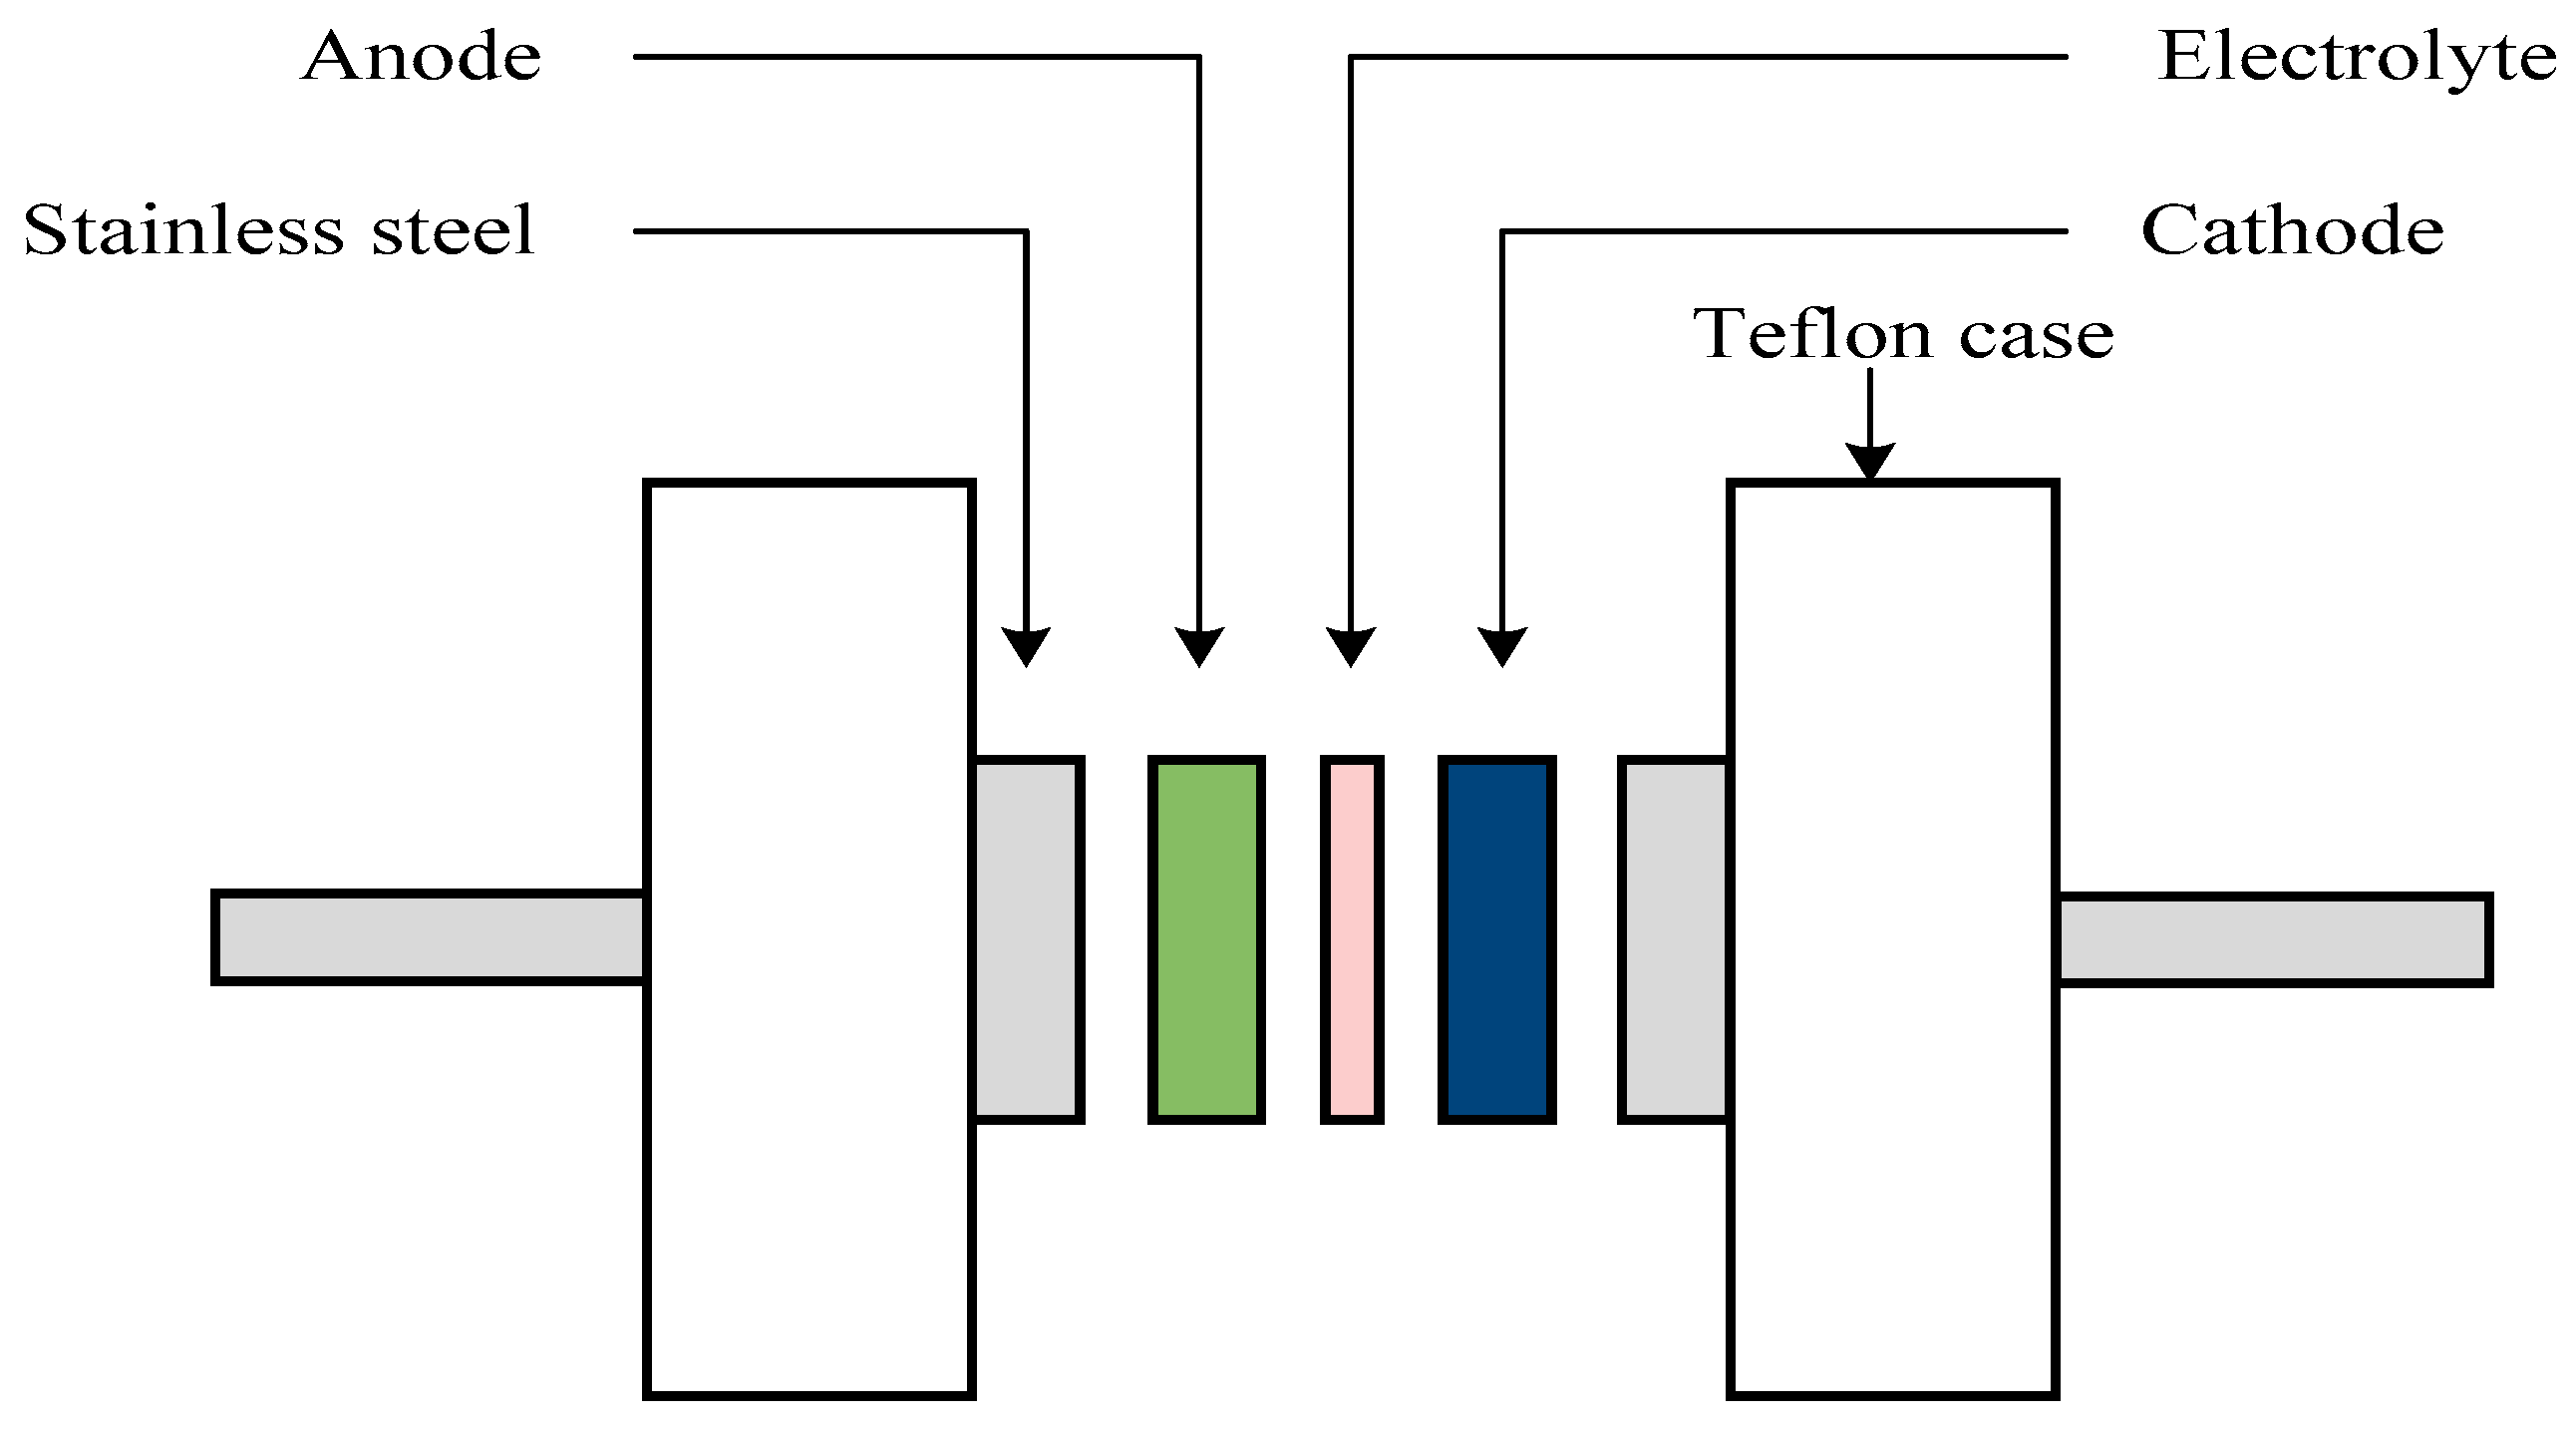
3.3. EDLC Preparation
3.4. Structural, Morphological, and Impedance Characterizations
4. Conclusions
Author Contributions
Funding
Acknowledgments
Conflicts of Interest
References
- Iro, Z.S.; Subramani, C.; Dash, S.S. A Brief Review on Electrode Materials for Supercapacitor. Int. J. Electrochem. Sci. 2016, 11, 10628–10643. [Google Scholar] [CrossRef]
- Kiamahalleh, M.V.; Zein, S.S.H.; Najafpour, G.; Sata, S.A.; Buniran, S. Multiwalled carbon nanotubes based nanocomposites for supercapacitors: A review of electrode materials. Nano 2012, 7, 1230002. [Google Scholar] [CrossRef]
- Shobana, V.; Parthiban, P.; Balakrishnan, K. Lithium based battery-type cathode material for hybrid supercapacitor. J. Chem. Pharm. Res. 2015, 7, 207–212. [Google Scholar]
- Kamarudin, K.H.; Hassan, M.; Isa, M.I.N. Lightweight and Flexible Solid-State EDLC based on Optimized CMC-NH4NO3 Solid Bio-Polymer Electrolyte. ASM Sci. J. Spec. Issue 2018, 1, 29–36. [Google Scholar]
- Shukur, A.; Fadhlullah, M. Characterization of Ion Conducting Solid Biopolymer Electrolytes Based on Starch-Chitosan Blend and Application in Electrochemical Devices. Ph.D. Dissertation, University of Malaya, Wilayah Persekutuan Kuala Lumpur, Malaysia, 2015. [Google Scholar]
- Kadir, M.F.Z.; Salleh, N.S.; Hamsan, M.H.; Aspanut, Z.; Majid, N.A.; Shukur, M.F. Biopolymeric electrolyte based on glycerolized methyl cellulose with NH4Br as proton source and potential application in EDLC. Ionics 2017, 24, 1651–1662. [Google Scholar] [CrossRef]
- Aziz, S.B.; Hamsan, M.H.; Abdullah, R.M.; Kadir, M.F.Z. A Promising Polymer Blend Electrolytes Based on Chitosan: Methyl Cellulose for EDLC Application with High Specific Capacitance and Energy Density. Molecules 2019. accpected for publication. [Google Scholar]
- Wang, H.; Lin, J.; Shen, Z.X. Polyaniline (PANi) based electrode materials for energy storage and conversion. J. Sci. Adv. Mater. Devices 2016, 1, 225–255. [Google Scholar] [CrossRef] [Green Version]
- Hamsan, M.H.; Aziz, B.; Shukur, M.F.; Kadir, M.F.Z. Protonic cell performance employing electrolytes based on plasticized methylcellulose-potato starch-NH4NO3. Ionics 2019, 25, 559–572. [Google Scholar] [CrossRef]
- Nyuk, C.M.; Isa, M.I.N. Solid biopolymer electrolytes based on carboxymethyl cellulose for use in coin cell proton batteries. J. Sustain. Sci. Manag. 2018, 2017, 42–48. [Google Scholar]
- Salleh, N.S.; Aziz, S.B.; Aspanut, Z.; Kadir, M.F.Z. Electrical impedance and conduction mechanism analysis of biopolymer electrolytes based on methyl cellulose doped with ammonium iodide. Ionics 2016, 22, 2157–2167. [Google Scholar] [CrossRef]
- Hassan, M.F.; Azimi, N.S.N.; Kamarudin, K.H.; Sheng, C.K. Solid Polymer Electrolytes Based on Starch-Magnesium Sulphate: Study on Morphology and Electrical Conductivity. ASM Sci. J. Spec. Issue 2018, 1, 17–28. [Google Scholar]
- Du, B.W.; Hu, S.Y.; Singh, R.; Tsai, T.T.; Lin, C.C.; Ko, F.U. Eco-Friendly and Biodegradable Biopolymer Chitosan/Y2O3 Composite Materials in Flexible Organic Thin-Film Transistors. Materials 2017, 10, 1026. [Google Scholar]
- Moniha, V.; Alagar, M.; Selvasekarapandian, S.; Sundaresan, B.; Hemalatha, R.; Boopathi, G. Synthesis and characterization of bio-polymer electrolyte based on iota-carrageenan with ammonium thiocyanate and its applications. J. Solid State Electrochem. 2018, 22, 3209–3223. [Google Scholar] [CrossRef]
- Netsopa, S.; Niamsanit, S.; Sakloetsakun, D.; Milintawisamai, N. Characterization and Rheological Behavior of Dextran from Weissella confusa R003. Int. J. Polym. Sci. 2018, 2018, 5790526. [Google Scholar] [CrossRef]
- Sarwat, F.; Ahmed, N.; Aman, A.; Qader, S.A.U. Optimization of growth conditions for the isolation of dextran producing Leuconostoc spp. from indigenous food sources Pak. J. Pharm. Sci. 2013, 26, 793–797. [Google Scholar]
- Barsbay, M.; Guner, A. Miscibility of dextran and poly(ethylene glycol) in solid state: Effect of the solvent choice, Carbohydr. Polymers 2007, 69, 214–223. [Google Scholar] [CrossRef]
- Telegeev, G.; Kutsevo, N.; Chumachenko, V.; Naumenko, A.; Telegeeva, P.; Filipchenko, S.; Harahuts, Y. Dextran-Polyacrylamide as Matrices for Creation of Anticancer Nanocomposite. Int. J. Polym. Sci. 2017, 2017, 4929857. [Google Scholar] [CrossRef]
- Misenan, M.S.M.; Isa, M.I.N.; Khiar, A.S.A. Electrical and structural studies of polymer electrolyte based on chitosan/methyl cellulose blend doped with BMIMTFSI. Mater. Res. Express 2018, 5, 055304. [Google Scholar] [CrossRef]
- Hamsan, M.H.; Shukur, M.F.; Kadir, M.F.Z. The effect of NH4NO3 towards the conductivity enhancement and electrical behavior in methyl cellulose-starch blend based ionic conductors. Ionics 2017, 23, 1137–1154. [Google Scholar] [CrossRef]
- Kharbachi, A.E.; Hu, Y.; Yoshida, K.; Vajeeston, P.; Kim, S.; Sørby, M.H.; Orimo, S.; Fjellvåg, H.; Hauback, B.C. Lithium ionic conduction in composites of Li(BH4)0.75I0.25 and amorphous 0.75Li2S0.25P2S5 for battery applications. Electrochim. Acta 2018, 278, 332–339. [Google Scholar] [CrossRef]
- Tamilselvi, P.; Hema, M. Conductivity studies of LiCF3SO3 doped PVA: PVdF blend polymer electrolyte. Physica B 2014, 437, 53–57. [Google Scholar] [CrossRef]
- Yusof, Y.M.; Shukur, M.F.; Illias, H.A.; Kadir, M.F.Z. Conductivity and electrical properties of corn starch–chitosan blend biopolymer electrolyte incorporated with ammonium iodide. Phys. Scr. 2014, 89, 035701–035711. [Google Scholar] [CrossRef]
- Kadir, M.F.Z.; Hamsan, M.H. Green electrolytes based on dextran-chitosan blend and the effect of NH4SCN as proton provider on the electrical response studies. Ionics 2018, 24, 2379–2398. [Google Scholar] [CrossRef]
- Aziz, S.B.; Abidin, Z.H.Z.; Kadir, M.F.Z. Innovative method to avoid the reduction of silver ions to silver nanoparticles in silver ion conducting based polymer electrolytes. Phys. Scr. 2015, 90, 035808. [Google Scholar] [CrossRef]
- Aziz, S.B.; Kadir, M.F.Z.; Abidin, Z.H.Z. Structural, morphological and electrochemical impedance study of CS:LiTf based solid polymer electrolyte: Reformulated Arrhenius equation for ion transport study. Int. J. Electrochem. Sci. 2016, 11, 9228–9244. [Google Scholar] [CrossRef]
- Hamsan, M.H.; Shukur, M.F.; Aziz, S.B.; Kadir, M.F.Z. Dextran from Leuconostoc mesenteroides-doped ammonium salt-based green polymer electrolyte. Bull. Mater. Sci. 2019, 42, 57. [Google Scholar] [CrossRef]
- Aziz, S.B.; Abidin, Z.H.Z.; Arof, A.K. Effect of silver nanoparticles on the DC conductivity in chitosan–silver triflate polymer electrolyte. Physica B 2010, 405, 4429–4433. [Google Scholar] [CrossRef]
- Malathi, J.; Kumaravadivel, M.; Brahmanandhan, G.M.; Hema, M.; Baskaran, R.; Selvasekarapandian, S. Structural, thermal and electrical properties of PVA–LiCF3SO3 polymer electrolyte. J. Non-Cryst. Solids 2010, 356, 2277–2281. [Google Scholar] [CrossRef]
- Aziz, S.B. Role of dielectric constant on ion transport: Reformulated Arrhenius equation. Adv. Mater. Sci. Eng. 2016, 2016, 2527013. [Google Scholar] [CrossRef]
- Shukla, R.; Shukla, S.; Bivolarski, V.; Iliev, I.; Ivanova, I.; Goyal, A. Structural Characterization of Insoluble Dextran Produced by Leuconostoc mesenteroides NRRL B-1149 in the Presence of Maltose. Food Technol. Biotechnol. 2011, 49, 291–296. [Google Scholar]
- Vettori, M.H.P.B.; Franchetti, S.M.M.; Contiero, J. Structural characterization of a new dextran with a low degree of branching produced by Leuconostoc mesenteroides FT045B dextransucrase. Carbohydr. Polym. 2012, 88, 1440–1444. [Google Scholar] [CrossRef] [Green Version]
- Dumitraşcu, M.; Meltzer, V.; Sima, E.; Vîrgolici, M.; Albu, M.G.; Ficai, A.; Moise, V.; Minea, R.; Vancea, C.; Scărişoreanu, A.; et al. Characterization of electron beam irradiated collagenpolyvinylpyrrolidone (PVP) and collagen-dextran (DEX) blends. Dig. J. Nanomater. Biostruct. 2011, 6, 1793–1803. [Google Scholar]
- Aziz, S.B.; Abidin, Z.H.Z. Electrical conduction mechanism in solid polymer electrolytes: New concepts to arrhenius equation. J. Soft Matter 2013, 2013, 323868. [Google Scholar] [CrossRef]
- Nikoli, G.S.; Caki, M.; Miti, Z.; Ili, B.; Premovic, P. Attenuated Total Reflectance–Fourier Transform Infrared Microspectroscopy of Copper(II) Complexes with Reduced Dextran Derivatives. Russian J. Phys. Chem. A 2009, 83, 1520–1525. [Google Scholar] [CrossRef]
- Wei, D.; Sun, W.; Qian, W.; Ye, Y.; Ma, X. The synthesis of chitosan-based silver nanoparticles and their antibacterial activity. Carbohydr. Res. 2009, 344, 2375–2382. [Google Scholar] [CrossRef] [PubMed]
- Mitić, Ž.; Cakić, M.; Nikolić, G. Fourier-Transform IR spectroscopic investigations of Cobalt(II)–dextran complexes by using D2O isotopic exchange. Spectroscopy 2010, 24, 269–275. [Google Scholar] [CrossRef]
- Han, C.C.; Shi, W.; Jin, J. Morphology and Crystallization of Crystalline/Amorphous Polymer Blends. Encyclopedia Polym. Compos. 2013, 1–19. [Google Scholar] [CrossRef]
- Aziz, S.B.; Abdullah, R.M.; Kadir, M.F.Z.; Ahmed, H.M. Non suitability of silver ion conducting polymer electrolytes based on chitosan mediated by barium titanate (BaTiO3) for electrochemical device applications. Electrochim. Acta 2019, 296, 494–507. [Google Scholar] [CrossRef]
- Aziz, S.B.; Abdullah, O.G.; Rasheed, M.A.; Ahmed, H.M. Effect of high salt concentration (HSC) on structural, morphological, and electrical characteristics of chitosan based solid polymer electrolytes. Polymers 2017, 9, 187. [Google Scholar] [CrossRef]
- Shukur, M.F.; Kadir, M.F.Z. Hydrogen ion conducting starch-chitosan blend based electrolyte for application in electrochemical devices. Electrochim. Acta 2015, 158, 152–165. [Google Scholar] [CrossRef]
- Polu, A.R.; Kumar, R. AC impedance and dielectric spectroscopic studies of Mg2+ionconducting PVA–PEG blended polymer electrolytes. Bull. Mater. Sci. 2011, 34, 1063–1067. [Google Scholar] [CrossRef]
- Aziz, S.B.; Woo, T.J.; Kadir, M.F.Z.; Ahmed, H.M. A conceptual review on polymer electrolytes and ion transport models. J. Sci. Adv. Mater. Devices 2018, 3, 1–17. [Google Scholar] [CrossRef]
- Aziz, S.B.; Abidin, Z.H.Z.; Arof, A.K. Influence of silver ion reduction on electrical modulus parameters of solid polymer electrolyte based on chitosan-silver triflate electrolyte membrane. ExpressPolym. Lett. 2010, 4, 300–310. [Google Scholar] [CrossRef]
- Aziz, S.B. The mixed contribution of ionic and electronic carriers to conductivity in chitosan based solid electrolytes mediated by CuNt Salt. J. Inorg. Organomet. Polym. 2018, 28, 1942. [Google Scholar] [CrossRef]
- Hirankumar, G.; Selvasekarapandian, S.; Bhuvaneswari, M.S.; Baskaran, R.; Vijayakumar, M. AC Impedance Studies on Proton Conducting Polymer Electrolyte Complexes (PVA+CH3COONH 4). Ionics 2004, 10, 135. [Google Scholar] [CrossRef]
- Aziz, S.B.; Faraj, M.G.; Abdullah, O.G. Impedance Spectroscopy as a Novel Approach to Probe the Phase Transition and Microstructures Existing in CS:PEO Based Blend Electrolytes. Sci. Rep. 2018, 8, 14308. [Google Scholar] [CrossRef] [PubMed]
- Eftekhari, A. The mechanism of ultrafast supercapacitors. J. Mater. Chem. A. 2018, 6, 2866–2876. [Google Scholar] [CrossRef]
- Eftekhari, A. Surface Diffusion and Adsorption in Supercapacitors. ACS Sustain. Chem. Eng. 2019, 7, 3692–3701. [Google Scholar] [CrossRef]
- Pradhan, D.K.; Choudhary, P.; Samantaray, B.K.; Karan, N.K.; Katiyar, R.S. Effect of Plasticizer on Structural and Electrical Properties of Polymer Nanocompsoite Electrolytes. Int. J. Electrochem. Sci. 2007, 2, 861–871. [Google Scholar]
- Mohapatra, S.R.; Thakur, A.K.; Choudhary, R.N.P. Effect of nanoscopic confinement on improvement in ion conduction and stability properties of an intercalated polymer nanocomposite electrolyte for energy storage applications. J. Power Sources 2009, 191, 601–613. [Google Scholar] [CrossRef]
- Shukur, M.F.; Ithnin, R.; Kadir, M.F.Z. Electrical characterization of corn starch-LiOAc electrolytes and application in electrochemical double layer capacitor. Electrochim. Acta 2014, 136, 204–216. [Google Scholar] [CrossRef]
- Aziz, S.; Abdullah, R.M. Crystalline and amorphous phase identification from the tanδ relaxation peaks and impedance plots in polymer blend electrolytes based on [CS: AgNt]x:PEO (x−1)(10 ≤ x ≤ 50). Electrochim. Acta 2018, 285, 30–46. [Google Scholar] [CrossRef]
- Teo, L.P.; Buraidah, M.H.; Nor, A.F.M.; Majid, S.R. Conductivity and dielectric studies of Li2SnO3. Ionics (Kiel) 2012, 18, 655–665. [Google Scholar] [CrossRef]
- Hema, M.; Selvasekarapandian, S.; Arunkumar, D.; Sakunthala, A.; Nithya, H.F.T.I.R. FTIR, XRD and ac impedance spectroscopic study on PVA based polymer electrolyte doped with NH4X (X = Cl, Br, I). J. Non-Cryst. Solids 2009, 355, 84–90. [Google Scholar] [CrossRef]
- Kufian, M.Z.; Aziz, M.F.; Shukur, M.F.; Rahim, A.S.; Ariffin, N.E.; Shuhaimi, N.E.A.; Arof, A.K. PMMA-LiBOB gel electrolyte for application in lithium ion batteries. Solid State Ionics 2012, 208, 36–42. [Google Scholar] [CrossRef]
- Diederichsen, K.M.; McShane, E.J.; McCloskey, B.D. McCloskey Promising Routes to a High Li+ Transference Number Electrolyte for Lithium Ion Batteries. ACS Energy Lett. 2017, 2, 2563–2575. [Google Scholar] [CrossRef]
- Othman, L.; Isa, K.B.; Osman, Z.; Yahya, R. Ionic Conductivity, Morphology and Transport Number of Lithium Ions in PMMA Based Gel Polymer Electrolytes. Defect Diffus. Forum 2013, 334–335, 137–142. [Google Scholar] [CrossRef]
- Sampathkumar, L.; Selvin, P.C.; Selvasekarapandian, S.; Perumal, P.; Chitra, R.; Muthukrishnan, M. Synthesis and characterization of biopolymer electrolyte based on tamarind seed polysaccharide, lithium perchlorate and ethylene carbonate for electrochemical applications. Ionics 2019, 25, 1067–1082. [Google Scholar] [CrossRef]
- Monisha, S.; Mathavan, T.; Selvasekarapandian, S.; Benial, A.M.F.; Premalatha, M. Preparation and characterization of cellulose acetate and lithium nitrate for advanced electrochemical devices. Ionics 2017, 23, 2697–2706. [Google Scholar] [CrossRef]
- Liew, C.W.; Ramesh, S. Electrical, structural, thermal and electrochemical properties of corn starch-based biopolymer electrolytes. Carbohydr. Polym. 2015, 124, 222–228. [Google Scholar] [CrossRef]
- Kadir, M.F.Z.; Arof, A.K. Application of PVA–chitosan blend polymer electrolyte membrane in electrical double layer capacitor. Mater. Res. Innov. 2013, 15, 217–220. [Google Scholar] [CrossRef]
- Bandaranayake, C.M.; Weerasinghe, W.A.D.; Vidanapathirana, K.P.; Perera, K.S. A Cyclic Voltammetry study of a gel polymer electrolyte based redox-capacitor. Sri. Lankan J. Phys. 2015, 16, 19–27. [Google Scholar] [CrossRef]
- Teoh, K.H.; Liew, C.W.; Ramesh, S. Electric double layer capacitor based on activated carbon electrode and biodegradable composite polymer electrolyte. Ionics 2014, 20, 251–258. [Google Scholar]
- Teoh, K.H.; Lim, C.S.; Liew, C.W.; Ramesh, S. Electric double-layer capacitors with corn starch-based biopolymer electrolytes incorporating silica as filler. Ionics 2015, 21, 2061–2068. [Google Scholar] [CrossRef]
- Pandey, G.P.; Kumar, Y.; Hashmi, S.A. Ionic liquid incorporated PEO based polymer electrolyte for electrical double layer capacitors: A comparative study with lithium and magnesium systems. Solid State Ionics 2011, 190, 93–98. [Google Scholar] [CrossRef]
- Lim, C.S.; Teoh, K.H.; Liew, C.W.; Ramesh, S. Capacitive behavior studies on electrical double layer capacitor using poly (vinyl alcohol)-lithium perchlorate based polymer electrolyte incorporated with TiO2. Mater. Chem. Phys. 2014, 143, 661–667. [Google Scholar] [CrossRef]
- Arof, A.K.; Kufian, M.Z.; Syukur, M.F.; Aziz, M.F.; Abdelrahman, A.E.; Majid, S.R. Electrical double layer capacitor using poly(methyl methacrylate)–C4BO8Li gel polymer electrolyte and carbonaceous material from shells of mata kucing (Dimocarpus longan) fruit. Electrochim. Acta 2012, 74, 39–45. [Google Scholar] [CrossRef]
- Hamsan, M.H.; Shukur, M.F.; Kadir, M.F.Z. NH4NO3 as charge carrier contributor in glycerolized potato starch-methyl cellulose blend-based polymer electrolyte and the application in electrochemical double-layer capacitor. Ionics 2017, 23, 3429–3453. [Google Scholar] [CrossRef]
- Shukur, M.F.; Ithnin, R.; Kadir, M.F.Z. Protonic transport analysis of starch-chitosan blend based electrolytes and application in electrochemical device. Mol. Cryst. Liq. Cryst. 2014, 603, 52–65. [Google Scholar] [CrossRef]


| Sample Designation | DC Conductivity (S/cm) |
|---|---|
| CS:Dex | 5.01 × 10⁻¹⁰ |
| CSDPB1 | 2.73 × 10⁻⁷ |
| CSDPB2 | 1.27 × 10⁻⁵ |
| CSDPB3 | 5.62 × 10⁻⁴ |
| CSDPB4 | 5.16 × 10⁻³ |
| Sample | R1/Ohm | Y1 | n1 | Rs | Y2/nMho | n2 |
|---|---|---|---|---|---|---|
| CSDPB2 | 696 | 619 pMho | 0.9345 | 805 | 984 | 0.99 |
| CSDPB4 | 3.56 | 27 μMho | 0.817 | - | - | - |
© 2019 by the authors. Licensee MDPI, Basel, Switzerland. This article is an open access article distributed under the terms and conditions of the Creative Commons Attribution (CC BY) license (http://creativecommons.org/licenses/by/4.0/).
Share and Cite
Aziz, S.B.; Hamsan, M.H.; Kadir, M.F.Z.; Karim, W.O.; Abdullah, R.M. Development of Polymer Blend Electrolyte Membranes Based on Chitosan: Dextran with High Ion Transport Properties for EDLC Application. Int. J. Mol. Sci. 2019, 20, 3369. https://0-doi-org.brum.beds.ac.uk/10.3390/ijms20133369
Aziz SB, Hamsan MH, Kadir MFZ, Karim WO, Abdullah RM. Development of Polymer Blend Electrolyte Membranes Based on Chitosan: Dextran with High Ion Transport Properties for EDLC Application. International Journal of Molecular Sciences. 2019; 20(13):3369. https://0-doi-org.brum.beds.ac.uk/10.3390/ijms20133369
Chicago/Turabian StyleAziz, Shujahadeen B., Muhamad H. Hamsan, Mohd F. Z. Kadir, Wrya O. Karim, and Ranjdar M. Abdullah. 2019. "Development of Polymer Blend Electrolyte Membranes Based on Chitosan: Dextran with High Ion Transport Properties for EDLC Application" International Journal of Molecular Sciences 20, no. 13: 3369. https://0-doi-org.brum.beds.ac.uk/10.3390/ijms20133369