Article

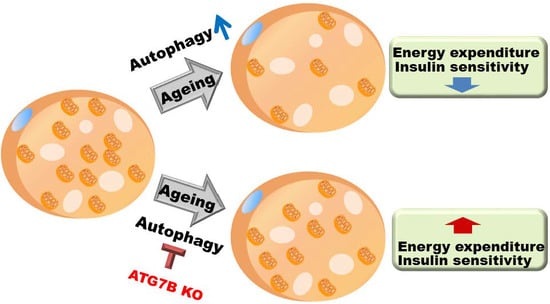
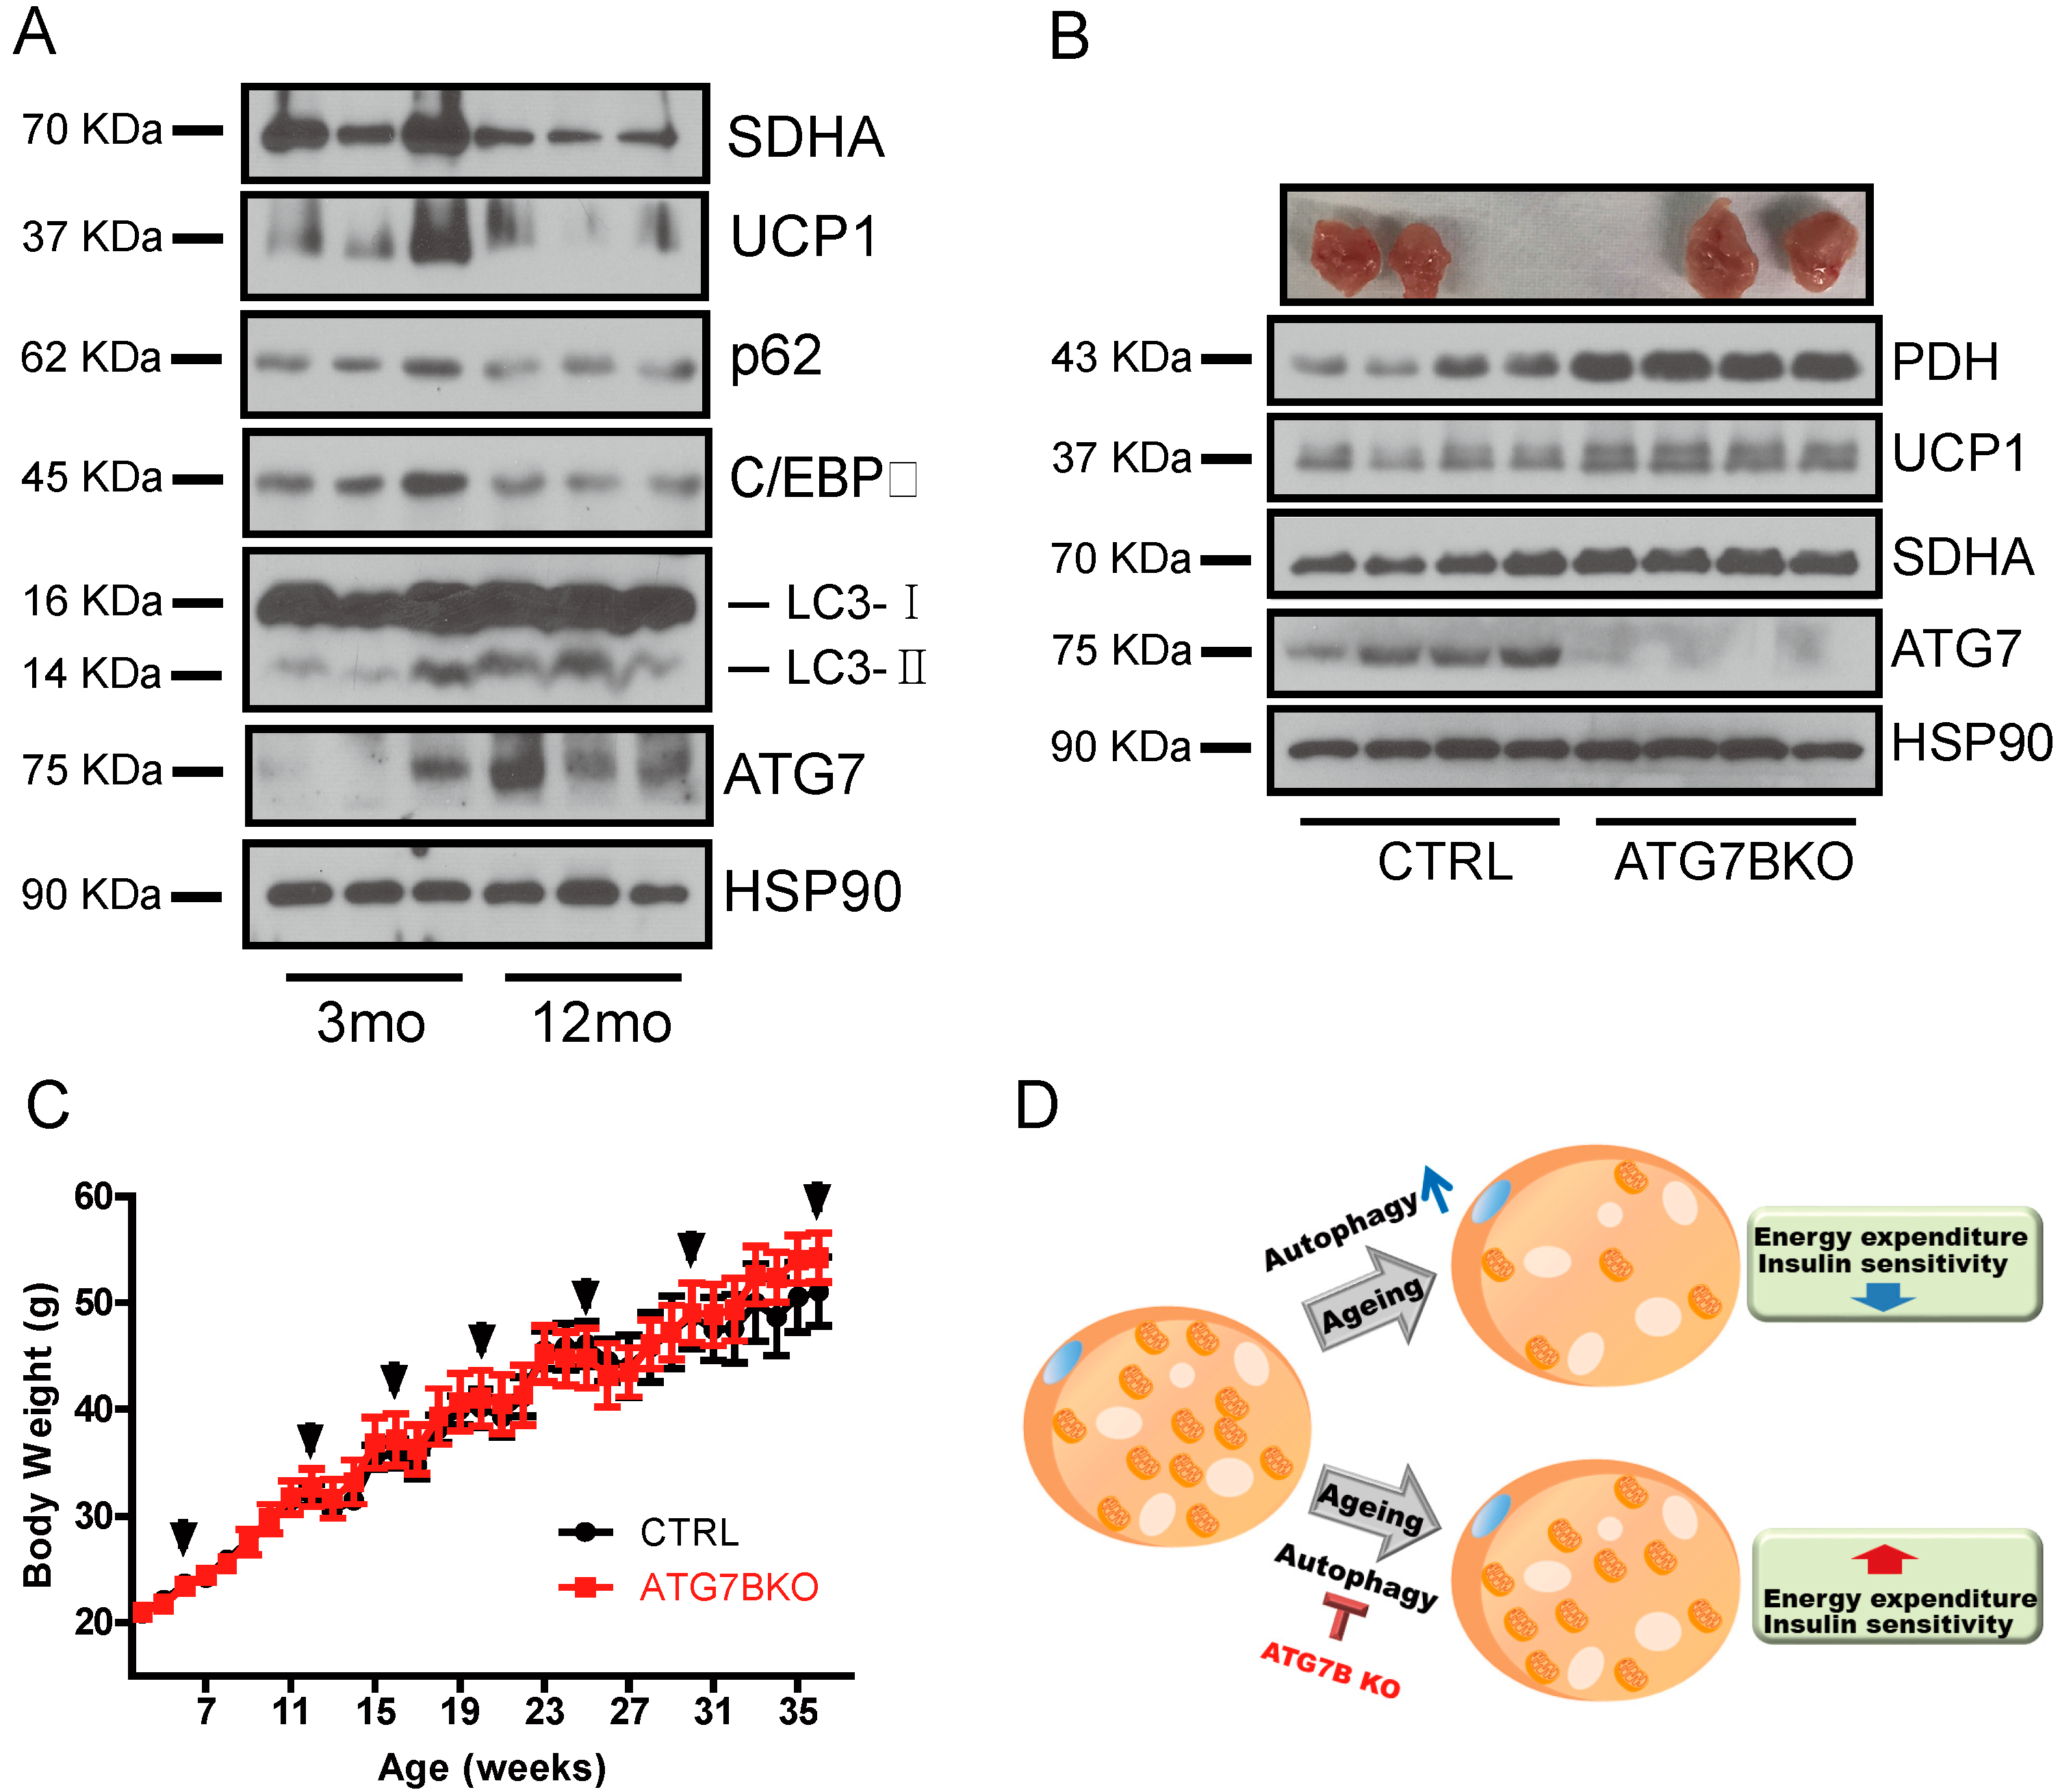
Suppression of Brown Adipocyte Autophagy Improves Energy Metabolism by Regulating Mitochondrial Turnover

1
Department of Biomedical Sciences, University of Ulsan College of Medicine, Seoul 05505, Korea
2
Bio-Medical Institute of Technology (BMIT), University of Ulsan College of Medicine, Seoul 05505, Korea
3
Department of Clinical Epidemiology and Biostatistics, University of Ulsan College of Medicine, Seoul 05505, Korea
4
Asan Institute for Life Sciences, Asan Medical Center, Seoul 05505, Korea
*
Author to whom correspondence should be addressed.
Int. J. Mol. Sci. 2019, 20(14), 3520; https://0-doi-org.brum.beds.ac.uk/10.3390/ijms20143520
Submission received: 20 June 2019 / Revised: 15 July 2019 / Accepted: 16 July 2019 / Published: 18 July 2019

Abstract

:
The high abundance of mitochondria and the expression of mitochondrial uncoupling protein 1 (UCP1) confer upon brown adipose tissue (BAT) the unique capacity to convert chemical energy into heat at the expense of ATP synthesis. It was long believed that BAT is present only in infants, and so, it was not considered as a potential therapeutic target for metabolic syndrome; however, the discovery of metabolically active BAT in adult humans has re-stimulated interest in the contributions of BAT metabolic regulation and dysfunction to health and disease. Here we demonstrate that brown adipocyte autophagy plays a critical role in the regulation BAT activity and systemic energy metabolism. Mice deficient in brown adipocyte autophagy due to BAT-specific deletion of Atg7—a gene essential for autophagosome generation—maintained higher mitochondrial content due to suppression of mitochondrial clearance and exhibited improved insulin sensitivity and energy metabolism. Autophagy was upregulated in BAT of older mice compared to younger mice, suggesting its involvement in the age-dependent decline of BAT activity and metabolic rate. These findings suggest that brown adipocyte autophagy plays a crucial role in metabolism and that targeting this pathway may be a potential therapeutic strategy for metabolic syndrome.

Graphical Abstract

1. Introduction

The maintenance of systemic energy homeostasis involves the precise sensing of energy levels, integration and transduction of metabolic signals, and co-ordinated regulation of energy intake and expenditure. Dysregulation of any one of these processes may cause metabolic disorders. As a primary calorie reservoir and endocrine organ, the adipose tissue plays a central role in maintaining energy balance. In mammals, adipose tissues are classified into three distinct types, white adipose tissue (WAT), brown adipose tissue (BAT) and beige adipose tissue, according to anatomical location, morphology, and function. WAT is the major site of energy storage. Under conditions of over-nutrition, WAT preserves surplus energy as unilocular lipid droplets in the form of triglycerides, which are mobilized by lipolysis and delivered to other organs via the systemic circulation under conditions of energy depletion, to maintain metabolic homeostasis. Unlike WAT, BAT contains lipid droplets in multilocular forms and instead of storing energy, it uses glucose and lipid as fuel to generate heat and regulate thermogenesis [1]. Uncoupling protein 1 (UCP1) is the critical molecule conferring thermogenic activity to BAT. Whereas other tissues use the proton gradient generated from mitochondrial respiration for ATP synthesis, UCP1 specifically expressed in the mitochondrial inner membrane of BAT generates heat by allowing the ATP synthesis-independent (uncoupled) translocation of protons to the mitochondrial matrix [2,3,4,5]. BAT is characterized by rich mitochondrial content and dense vascularization, to facilitate heat transmission throughout the body [6,7,8]. Recently, a third adipocyte phenotype—beige adipocytes—was identified as interspersed throughout the subcutaneous WAT. Upon stimulation by a variety of signals—including chronic cold exposure, adrenergic signaling and exercise—these cells acquire BAT-like characteristics, while withdrawal of these stimuli induces reversion to a WAT-like phenotype.
Adipose tissue is one of the most metabolically active organs and it exhibits constant remodeling in response to changes in metabolic status through the synthesis and degradation of cellular components and organelles. One of the most important mechanisms regulating tissue remodeling is autophagy. Autophagy is a cellular catabolic process that wraps aberrant or superfluous cellular components within double-membrane vesicles termed autophagosomes, which are delivered to lysosomes for the degradation and recycling of macromolecules to be used in the synthesis of new cellular components [9]. In contrast to proteasomes—which are specialized for protein quality control—autophagy regulates the turnover of a wide range of cellular components, including proteins, lipids, and entire organelles, in the process of tissue remodeling [10,11].
Tissue-specific autophagy-related gene knockout mice have revealed unexpected functions for autophagy in major metabolic tissues. In the hypothalamus, autophagy is induced by starvation, and regulates the expression of AgRP (Agouti-related protein) and food intake [12]. Autophagy regulates the projection of anorexigenic pro-opiomelanocortin (POMC) neurons, and mice lacking POMC neuron autophagy exhibit increased food intake and decreased energy expenditure [13,14]. In the liver, autophagy regulates endoplasmic reticulum (ER) stress, and hepatic overexpression of the autophagosome biogenesis regulator gene Atg7 improves obesity-induced steatosis and glucose metabolism [15]. Genetic ablation of Atg7—specifically in pancreatic β-cells—reduces total β-cell mass and insulin secretion [16,17], whereas Atg7 deletion in the skeletal muscle improves whole-body energy and glucose metabolism by enhancing Fgf21 expression [18]. Recently, Martinez-Lopez et al. (2013) reported that autophagy is involved in brown adipocyte differentiation, as knockout of Atg7 in mouse Myf5+ lineages—common progenitor cells for brown adipocytes and skeletal myocytes—exhibited defective BAT and skeletal muscle development [19]. While these studies demonstrate critical roles for autophagy in the metabolism, autophagic function in mature brown adipocytes has not been addressed. Thus, in this study, we investigated the role of autophagy in brown adipocytes and whole-body energy homeostasis.

2. Results

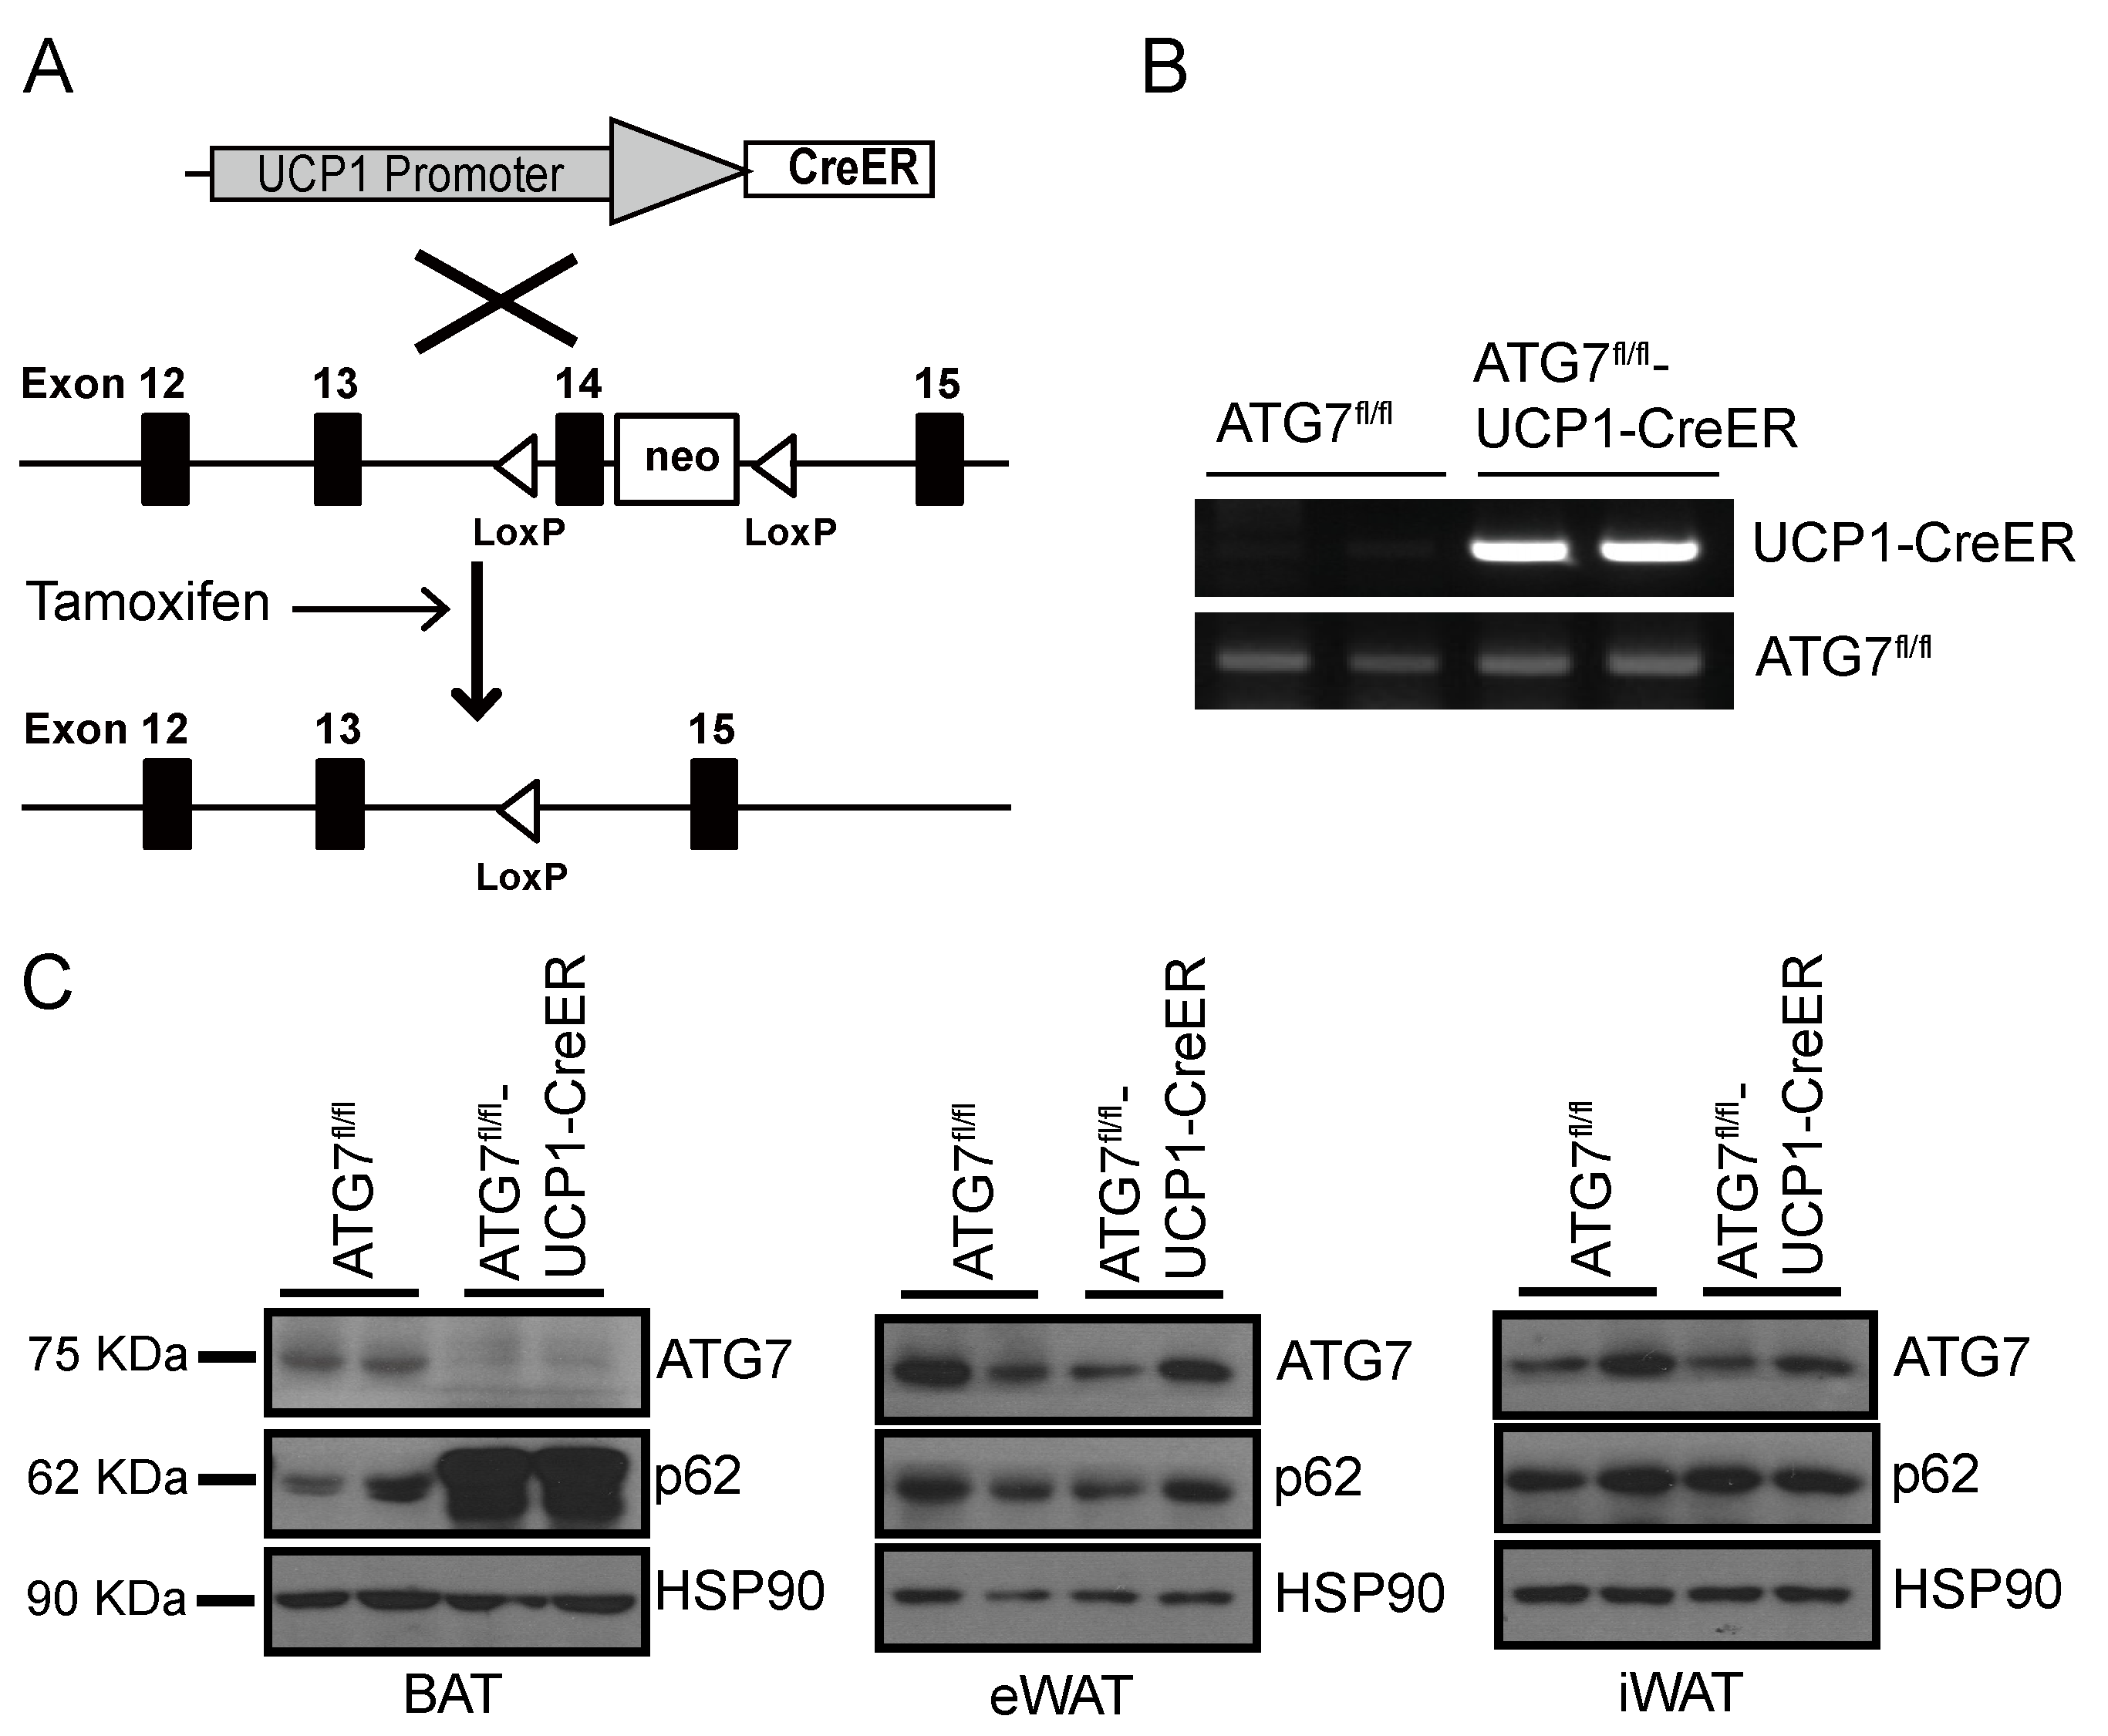
2.1. Generation of Brown Adipocyte-Specific Atg7 Knockout Mice

The protein autophagy related 7 (ATG7) is an essential regulator of autophagosome formation, and multiple in vitro and in vivo studies have demonstrated that the genetic ablation of Atg7 inactivates autophagy. To investigate the role of autophagy in brown adipocytes, we crossed Atg7-floxed mice (Atg7fl/fl) [20] with transgenic mice expressing the tamoxifen-dependent Cre recombinase (CreER) driven by the UCP1 promoter [21,22], and generated a brown adipocyte-specific autophagy-defective mouse model (Atg7fl/fl-UCP1-CreER+/) (Figure 1a,b). Although the brown adipocytes of Atg7fl/fl-UCP1-CreER+/ mice constitutively express CreER, recombination does not occur until CreER is activated by tamoxifen treatment. Compared to Atg7fl/fl mice (referred to as control mice hereafter), oral administration of tamoxifen dramatically decreased Atg7 expression in BATs of Atg7fl/fl-UCP1-CreER+/ mice (referred to as ATG7B KO mice hereafter) (Figure 1c, left panel). Conversely, Atg7 expression in epididymal WAT (eWAT) and inguinal WAT (iWAT) of ATG7B KO mice was comparable to that in control mice (Figure 1c, middle and right panels), confirming BAT-specific expression. Moreover, the autophagy marker protein p62 was upregulated only in BAT of ATG7B KO mice (Figure 1c). These results suggest that Atg7 was specifically deleted in the BAT of ATG7B KO mice and thus inhibited autophagy exclusively in the BAT.

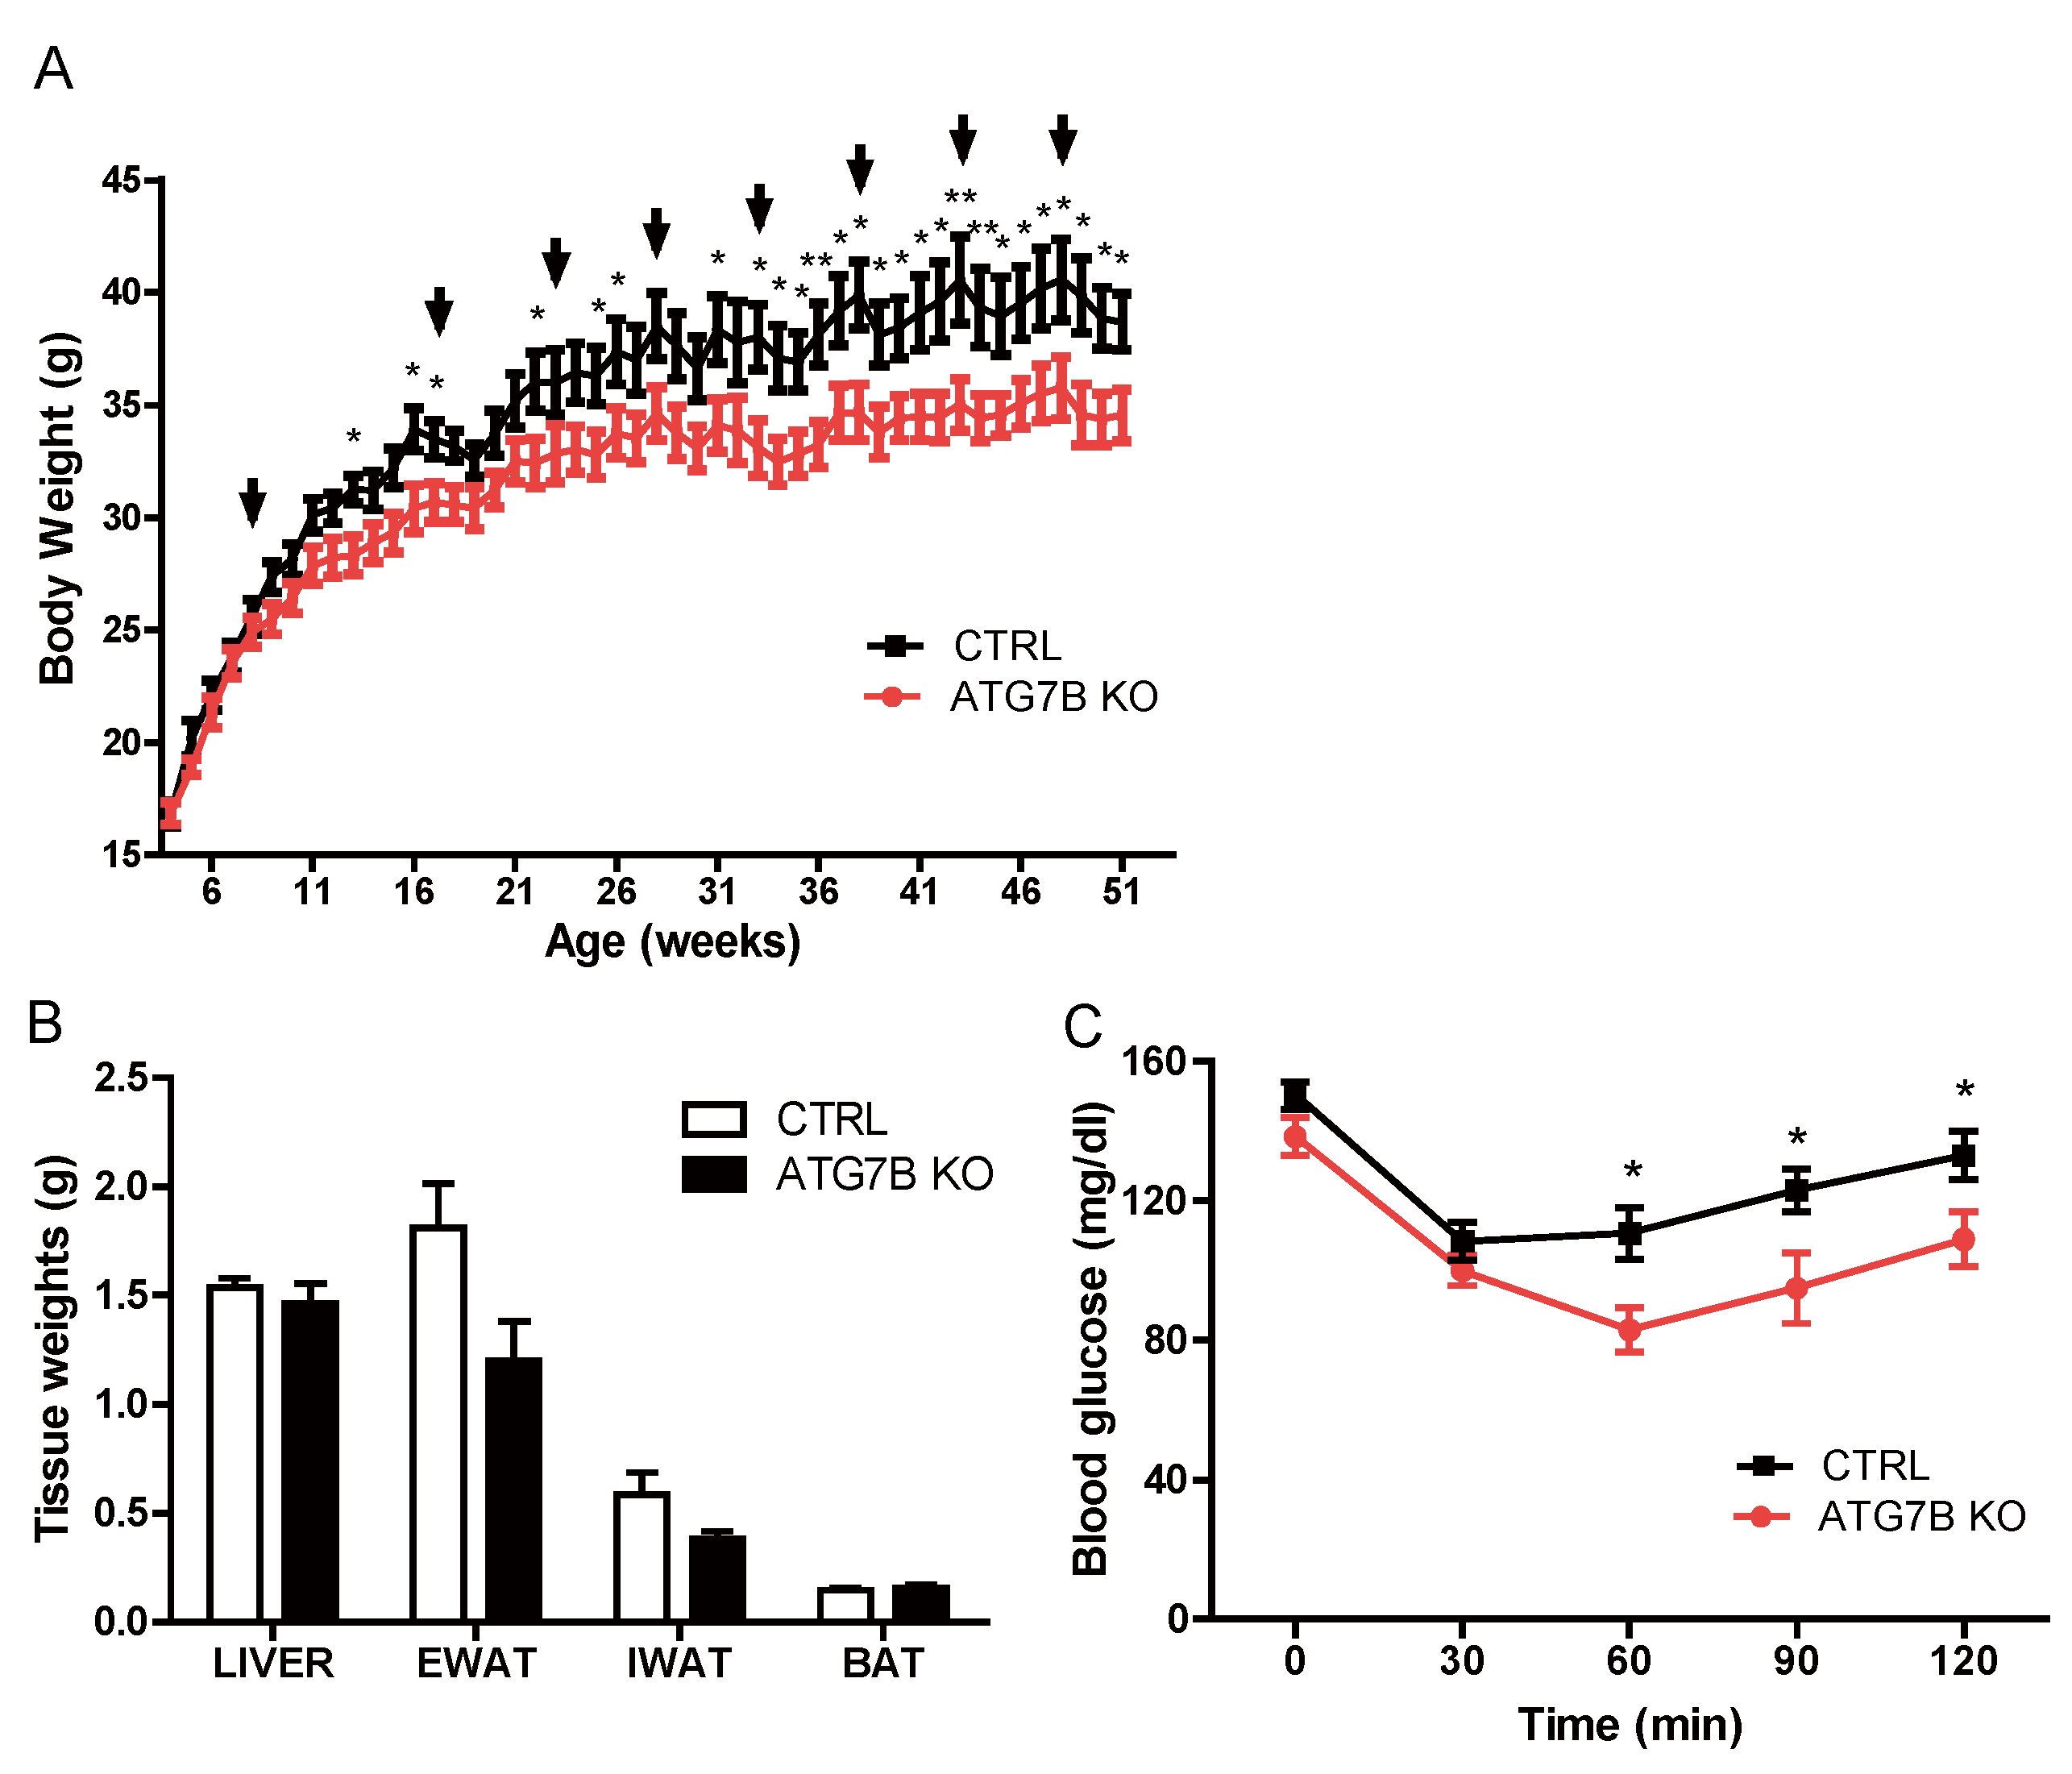
2.2. Suppression of BAT Autophagy Reduces Body Weight and Improves Glucose Metabolism

After confirming the suppression of autophagy in BAT of ATG7B KO mice, we examined the impact of this brown adipocyte-specific autophagy deficit on metabolism. Initially, control and ATG7B KO mice displayed comparable body weights; however, tamoxifen administration suppressed body weight gain in ATG7B KO mice compared to control mice. The body weight difference between groups diverged progressively during the 5 months of tamoxifen treatment and was maintained thereafter (Figure 2a). At the age of 1 year—45 weeks after the initiation of tamoxifen administration—we dissected various organs from ATG7B KO and control mice and measured their weights. The weights of major metabolic tissues including liver, BAT, and WAT were comparable between ATG7B KO and control mice (Figure 2b). Consistent with improved metabolic efficiency, ATG7B KO mice exhibited greater whole-body insulin sensitivity as assessed by insulin tolerance testing (ITT) (Figure 2c).

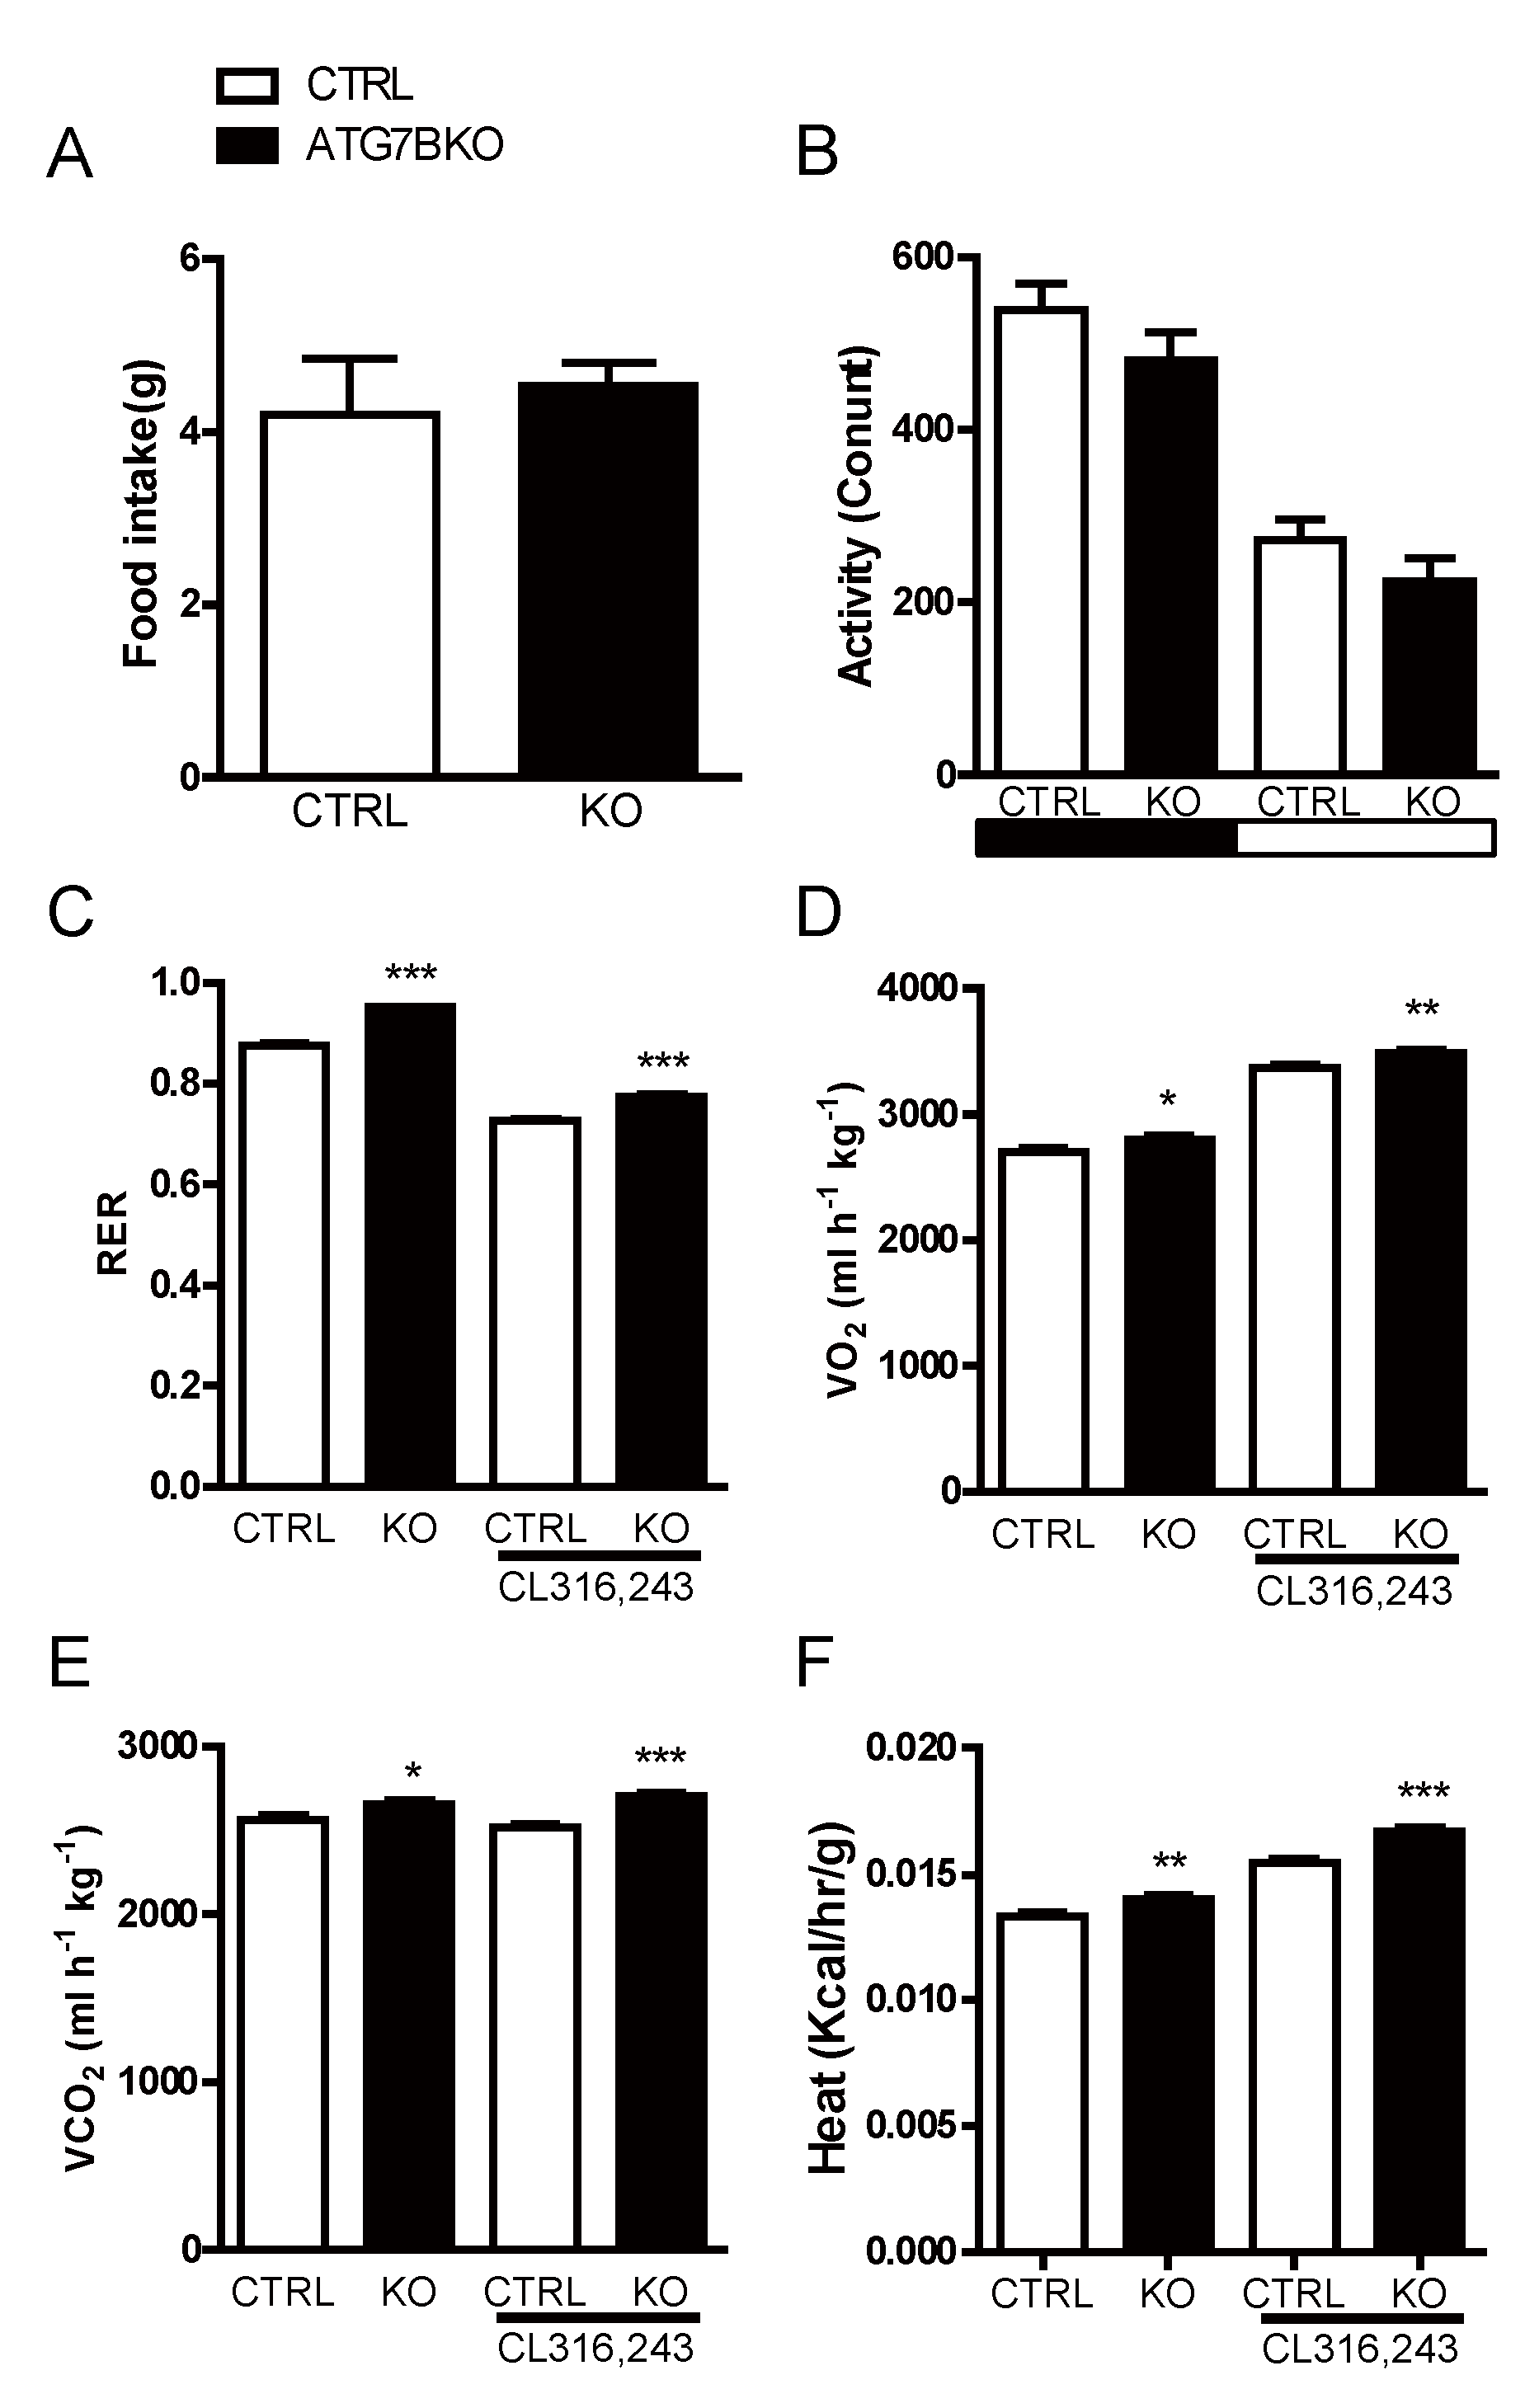
2.3. Body Weight Reduction in ATG7B KO Mice Is Due to Enhanced Energy Expenditure

In principle, reduced body weight can result from a decrease in energy intake, an increase in energy expenditure, or a combination of both. ATG7B KO mice—despite maintaining lower body weight (Supplementary Figure S1)—showed nearly identical 24-h food intake and physical activity relative to control mice (Figure 3a,b). We then examined if the body weight reduction observed in ATG7B KO mice was due to an alteration in energy expenditure from BAT, by comparing control and ATG7B KO mice in metabolic cage studies. Consistent with the improved insulin sensitivity (Figure 2c), the respiratory quotient (respiratory exchange ratio [RER]) was higher in ATG7B KO mice than control mice (Figure 3c). In addition, oxygen consumption (O2) and carbon dioxide production (CO2) rates in both basal and β3-AR stimulated conditions were substantially elevated in ATG7B KO mice (Figure 3d,e). As a result, energy expenditure was also higher in ATG7B KO mice than control mice (Figure 3f).

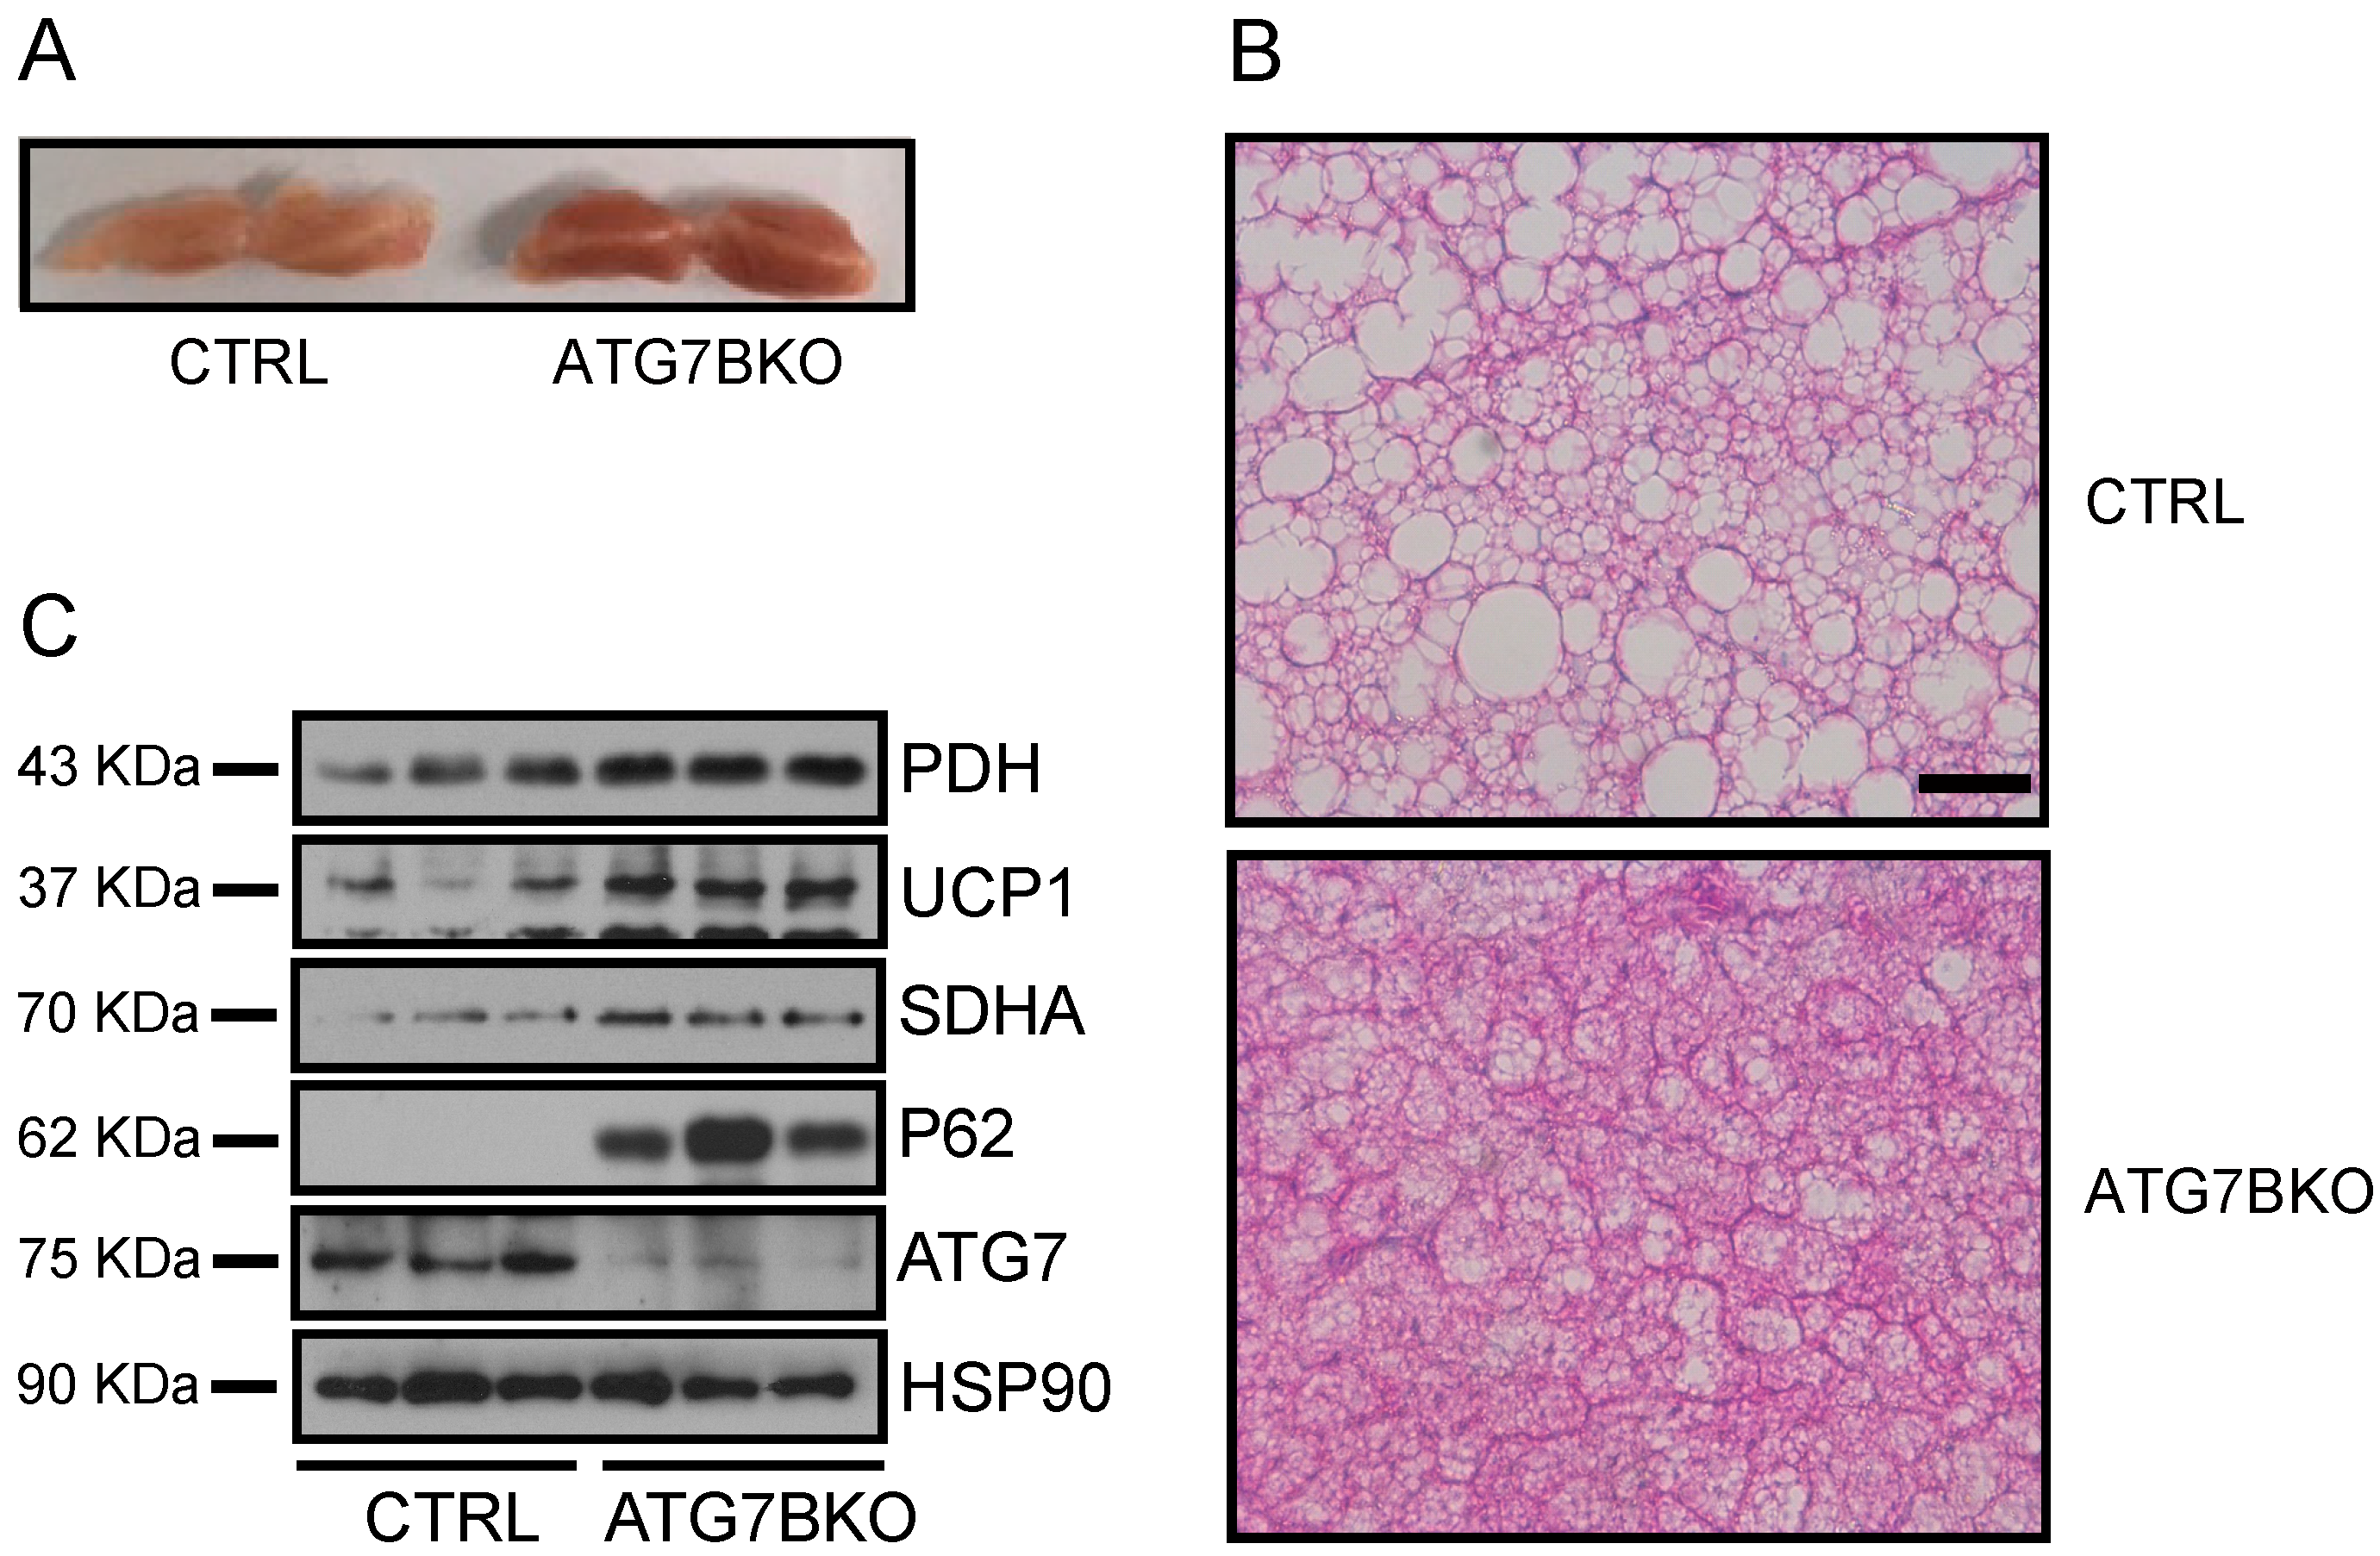
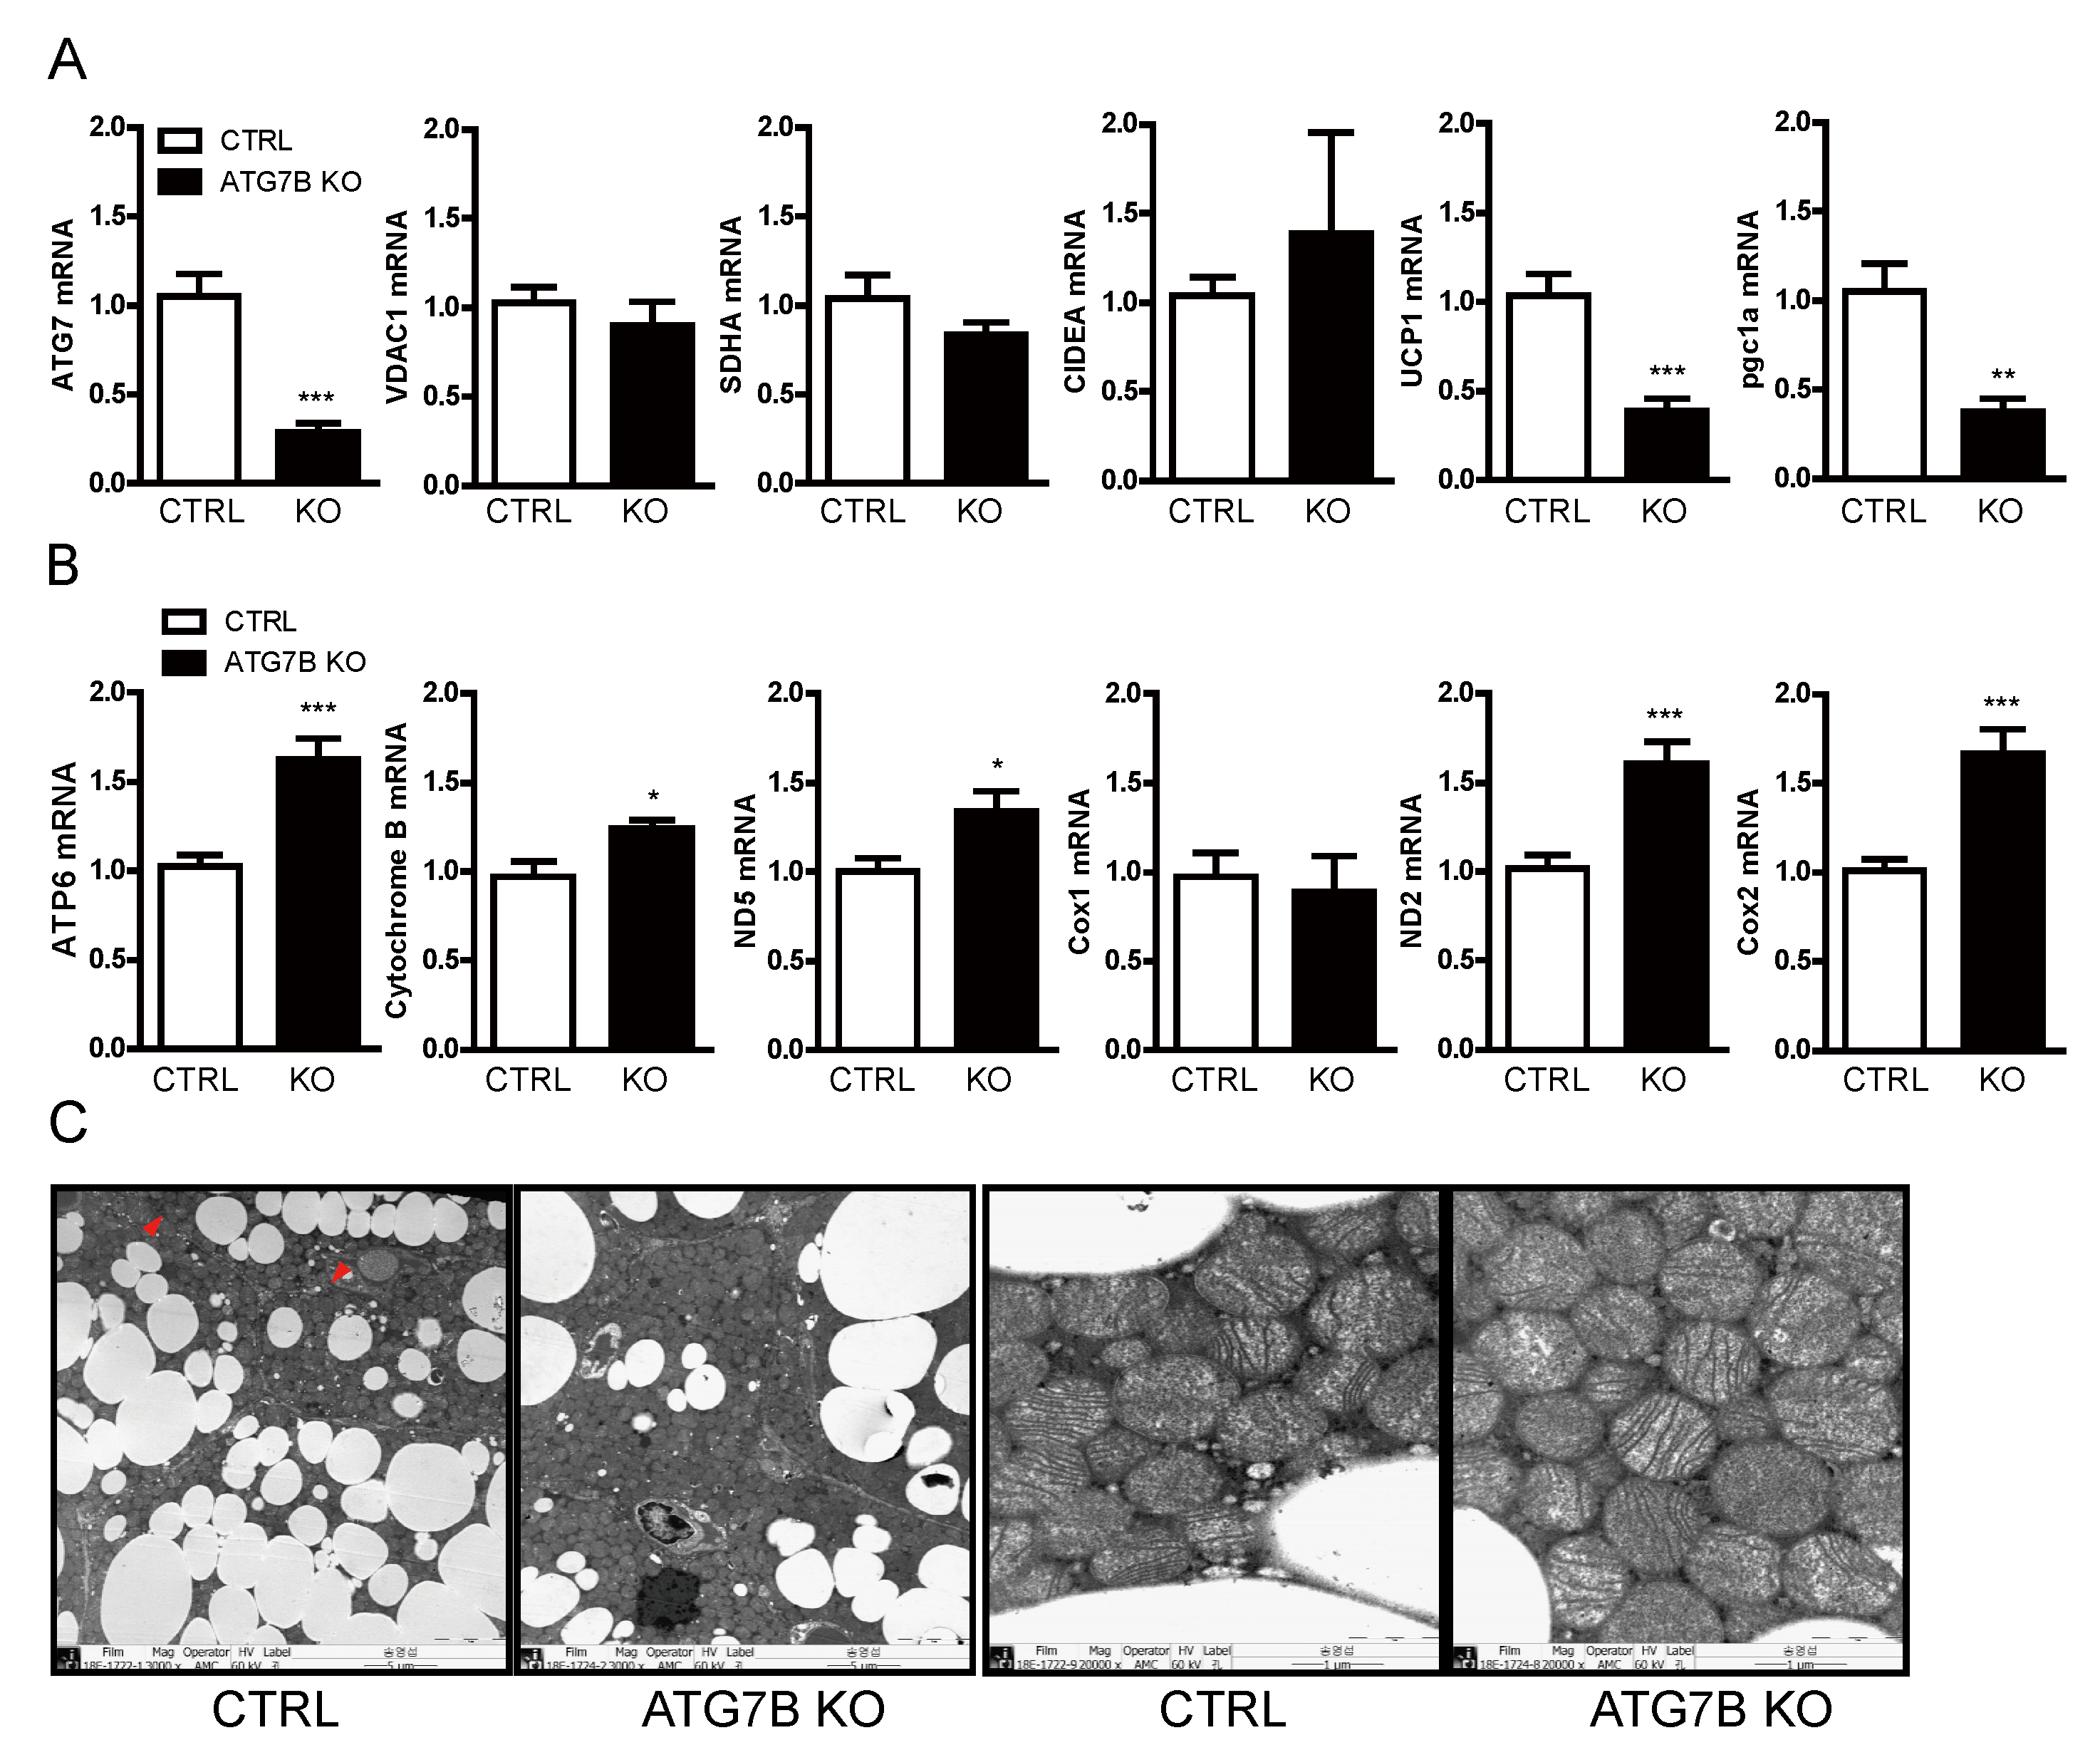
2.4. Increased Mitochondrial Content in BAT of ATG7B KO Mice

The BAT of ATG7B KO mice was redder and contained fewer and smaller lipid vacuoles than the BAT of control mice (Figure 4a,b). Brown adipocyte lipid content is associated with the rate of fatty acid oxidation—which occurs in the mitochondrial matrix—and mitochondrial content and activity are often proportional to brown adipocyte activity. These relationships suggest elevated mitochondrial content in the BAT of ATG7B KO mice. Indeed, mitochondrial content—as assessed by the expression levels of the mitochondria-localized proteins [23,24] pyruvate dehydrogenase (PDH), succinate dehydrogenase complex flavoprotein subunit A (SDHA), and UCP1—was upregulated in the BAT of ATG7B KO mice compared to controls (Figure 4c). Conversely, mitochondrial protein expression levels were comparable in the eWAT and iWAT of ATG7B KO and control mice, suggesting that increased mitochondrial content was specific to the BAT (Supplementary Figure S2).
To decipher the mechanisms regulating mitochondrial content by brown adipocyte autophagy, we first examined the mRNA levels of genes encoding mitochondrial proteins. Contrary to the upregulation of SDHA and UCP1 protein levels in BAT of ATG7B KO mice (Figure 4c), SDHA mRNA level was nearly identical and UCP1 mRNA level was actually lower in ATG7B KO mice compared to control mice. Further, the mRNA levels of two other chromosome-derived mitochondrial proteins—voltage-dependent anion channels (VDAC1) and cell death-inducing DFFA-like effector a (CIDEA)—were also comparable in the BAT of ATG7B KO and control mice (Figure 5a). In contrast, the mRNA levels of the mitochondria-encoded genes ATP6, CytB, ND2, ND5 and Cox2 were higher in ATG7B KO mice than in control mice (Figure 5b). Moreover, the mRNA level of Pgc1α—a critical player in mitochondrial biogenesis [25]—was significantly lower in the BAT of ATG7B KO mice, suggesting that the increase in the BAT mitochondrial content of ATG7B KO mice is caused by the inhibition of mitochondrial turnover rather than enhanced mitochondrial biogenesis. Transmission electron microscopy showed fewer lipid vacuoles in the BAT of ATG7B KO mice, but comparable mitochondrial appearance relative to control mice (Figure 5c), suggesting no difference in mitochondrial quality.

2.5. Age-Associated Increase in Brown Adipocyte Autophagy

BAT mass and activity are often negatively correlated with age and body weight, and the chronic downregulation of BAT activity results in BAT whitening and eventual degeneration [26,27]. We directly examined if reduced BAT mass in aged and obese mice is associated with autophagy. Consistent with previous findings, the total amount of mitochondrial protein was lower in BAT of older mice compared to young mice. Older mice also maintained higher levels of autophagy proteins ATG7 and LC3-2 in BAT than younger mice, suggesting that diminished BAT activity with age may be associated with decreased mitochondrial content due to enhanced autophagy (Figure 6a). Finally, to test whether the suppression of BAT autophagy attenuates diet-induced obesity, we challenged control and ATG7B KO mice with a 60% high-fat diet (HFD). Consistent with the reduced autophagic elimination of mitochondria, ATG7B KO mice maintained elevated levels of mitochondrial protein expression in BAT (Figure 6b and Supplementary Figure S3a). However, diet-induced BAT whitening and body weight gain were comparable in both groups, so ATG7B KO alone failed to prevent diet-induced obesity (Figure 6c and Supplementary Figure S3b).

3. Discussion

The unique expression of UCP1 allows brown adipocytes to expend chemical energy as heat, via the uncoupling of mitochondrial respiration from ATP synthesis. Thus, in contrast to WAT—which serves as a storage depot for excess energy—the primary function of BAT is to maintain body temperature. While numerous pharmacological and genetic studies in rodent models have demonstrated the critical role of BAT in metabolic regulation [28,29,30,31], it was the discovery of BAT in adult humans that re-ignited interest in the therapeutic potential of BAT activation for the treatment of metabolic syndrome. Adult human BAT is present in the supraclavicular, neck, and paraspinal regions, and its activity is negatively correlated with body mass index (BMI), obesity, diabetes, environmental temperature, and age [26,32,33,34,35,36]. Total BAT activity depends on the rate of fatty acid oxidation, UCP1 expression and activity, brown adipocyte number, and mitochondrial content [37]. Thus, increases in any or all of these factors can increase the total thermogenic activity of BAT.
Here, we investigated if autophagy can regulate brown adipocyte activity by modulating these aforementioned factors. Indeed, we showed that brown adipocyte-specific Atg7 knockout mice displayed improved BAT activity and whole-body energy metabolism due to increased mitochondrial content and UCP1 expression (i.e., greater thermogenic capacity). Mitochondrial content is regulated dynamically by the rate of mitochondrial biogenesis and turnover. Peroxisome proliferator-activated receptor gamma coactivator-1α (Pgc1α) is a transcriptional coactivator that acts as the master regulator of BAT mitochondrial biogenesis and thermogenic activity, by activating the transcription of mitochondrial transcription factor A (Tfam) and UCP1 [38,39]. Adipose tissue-specific Pgc1α and Tfam knockout mice develop insulin resistance associated with reduced mitochondrial content [40,41]. On the other hand, excess or damaged mitochondria are cleared through selective autophagy, termed mitophagy [42,43,44]. Our data suggest that increased mitochondrial content in the BAT of ATG7B KO mice results from the inhibition of mitochondrial clearance (mitophagy). Unexpectedly, despite increased mitochondrial content, the transcript levels of Pgc1α and UCP were downregulated in BAT of ATG7B KO mice. Although we have no direct evidence, we suspect that autophagy deficiency may activate a negative feedback mechanism to suppress mitochondrial biogenesis signaling and thermogenic activity. Future research is warranted to elucidate the molecular mechanisms through which biogenic and clearance systems communicate to regulate mitochondrial homeostasis.
Whereas autophagy has unique effects on metabolism in different tissues [12,13,14,15,16,17,18,45,46,47], it appears that the major function of autophagy in adipose tissue is the regulation of mitochondrial homeostasis [48]. Intriguingly—in line with previous observations in cardiac and skeletal muscle [49,50]—we found that the expression levels of mitochondrial markers were lower in the BAT of older mice than younger mice. Moreover, while p62 expression was downregulated, the expression levels of ATG7 and LC3-2 were elevated in BAT of older mice, suggesting that the age-dependent decline of BAT activity [51,52]–and the increased sensitivity to hypothermia with aging [34,53]—might be due to hyperactive mitophagy. On the other hand, while previous studies have observed upregulated autophagic activity in adipose tissue under obesity and diabetes [54,55,56,57] and the suppression of diet-induced obesity by the inhibition of adipose tissue autophagy [58,59,60,61], ATG7B KO failed to prevent diet-induce obesity despite maintaining elevated mitochondrial content. Thus, inhibition of brown adipocyte autophagy alone is not sufficient to protect from diet-induced obesity. Recently, the Kajimura group demonstrated that the β3-adrenergic receptor (β3-AR) agonist treatment of UCP1+ adipocyte-specific autophagy-null mice enhanced beige adipocyte maintenance and attenuated diet-induced obesity [61]. While their study discovered the importance of beige adipocytes in systemic energy homeostasis, their model system might contain some potential limitations. First, since β3-adrenergic signaling is also associated with the maintenance and recruitment of classical brown adipocytes, it cannot confirm whether the metabolic phenotypes observed in their mouse model are solely due to enhanced beige adipocyte maintenance. Second, because UCP1 is constantly expressed not only in mature adipocytes but also during the differentiation of BAT, Cre-mediated autophagy suppression could influence BAT development [62,63]. Conversely, although we adopted an inducible CreER system and tried to focus on the autophagy function in mature brown adipocytes, because a substantial amount of UCP1 is expressed in subcutaneous WAT (i.e., beige adipocytes in iWAT),. Tthere is a possibility that the improved metabolic phenotypes of ATG7B KO mice could also be due to beige adipocyte autophagy suppression. The development of more specific brown or beige adipocyte markers will clarify the significance and contributions of brown and beige adipocytes to whole-body energy homeostasis.
In summary, the current study demonstrates that brown adipocyte autophagy plays a critical role in the regulation of BAT activity and whole-body energy metabolism. However, while focusing on these, we failed to investigate the influence of brown adipocyte autophagy suppression on different components of metabolic syndrome [64]. For example, BAT is a rich source of vascular endothelial growth factor (VEGF), fibroblast growth factor 21 (FGF21), and adenosine, which are critical players in determining blood pressure via regulating vascularization and vasodilation [65,66,67]. Furthermore, there is a good correlation between body weight and blood pressure [68,69,70], and the age-dependent decline of BAT activity has been observed in hypertensive rats [71]. Therefore, it would be interesting to examine whether ATG7B KO mice maintain lower blood pressure and whether targeting brown adipocyte autophagy may protect against age-associated metabolic syndrome.

4. Materials and Methods

4.1. Animals

All animal experiments were performed according to an approved protocol (approval number: 2016-12-139, approved date: 9 August 2016), from the Institutional Animal Care and Use Committee of Asan Life Science Institute, Asan Medical Center, Seoul, Korea. Mice were housed in a temperature-controlled pathogen-free facility under a 12 h/12 h light/dark cycle (lights on at 08:00) with free access to water and a normal chow diet (Purina Rodent Chow, Seoul, Korea). To establish brown adipocyte-specific Atg7 conditional knockout mice, Atg7fl/fl mice [20,46] were crossed with UCP1-CreER+/ mice [21]. Tamoxifen (1 mg/5 g body weight) (Sigma-Aldrich, St. Louis, MO, USA) dissolved in corn oil (Sigma-Aldrich) was orally administered to their off-spring for five consecutive days. To ablate Atg7 from newly generated brown adipocytes, every fifth week tamoxifen was regularly administered to mice for five consecutive days [21]. In this experiment, Atg7fl/fl mice and Atg7fl/fl-UCP1-CreER+/ mice (ATG7B KO) were used as the control and experimental groups, respectively, and their body weights were monitored every week for 1 year. For diet-induced obesity—1 week after tamoxifen administration—the normal chow diet was switched to a 60% HFD (D12492, Research Diets, New Brunswick, NJ, USA).

4.2. Indirect Mouse Calorimetry Study

For acclimation, control and ATG7B KO mice were individually housed two days prior to the metabolic cage study. The oxygen (O2) consumption, carbon dioxide (CO2) production, locomotor activity, respiratory exchange ratio (RER) and food intake of individually housed mice were monitored using an indirect calorimeter (Columbus Instruments, Columbus, OH, USA) and analyzed as described previously [47]. For β3-adrenergic receptor stimulation experiments, 100 μg/g of CL316,243 (Sigma-Aldrich) was intraperitoneally injected.

4.3. Insulin Tolerance Test

For the ITT, 1 unit/kg of insulin (Humulin, Lilly, Indianapolis, IN, USA) was intraperitoneally administered to 4 h fasted control and ATG7B KO mice, and glucose levels in blood collected from a tail vein were monitored with an Accu-Chek Performa glucometer (Roche, Basel, Switzerland) every 30 min for 2 h.

4.4. Histology

Briefly, eWAT, iWAT, and BAT isolated from control and ATG7B KO mice were immediately fixed with 4% paraformaldehyde for between 1 and 2 days and embedded in paraffin.Sections were prepared at 5 µm thickness and stained with hematoxylin and eosin. For transmission electron microscopy (Jeol Ltd., Tokyo, Japan) analysis, isolated BAT was fixed in 2.5% glutaraldehyde solution in 0.1 M phosphate buffer overnight and then for 90 min with 1% osmium tetroxide before further processing.

4.5. mRNA Analysis

Isolated BAT was immediately frozen in liquid nitrogen and kept at −80 °C for further processing. Total RNA was isolated from BAT ground in liquid nitrogen using the RNA Mini Kit (Favorgen, Ping-Tung, Taiwan) according to the manufacturer’s instructions [72]. First-strand cDNA was synthesized with 550 ng of isolated total RNA and random hexamer using reverse transcriptase (Toyobo, Osaka, Japan) and mRNA expression was analyzed by real-time quantitative RT-PCR using a Light cycler480 (Roche, Basel, Switzerland) with Thunderbird SYBR green qPCR mix (Toyobo). Primers used for the amplification of specific genes are listed in the Supplementary Table S1. The expression of mRNA was normalized to that of L32.

4.6. Antibodies and Immunoblots

Snap-frozen mouse tissues were ground in liquid nitrogen and lysed with lysis buffer (20 mM HEPES pH 7.5, 200 mM NaCl, 1 mM EDTA, 1 mM EGTA, 0.5% Triton X-100, 20 mM Na-pyrophosphate, 50 mM β-glycerophosphate and 50 mM NaF) containing a protease inhibitor cocktail (Tech and Innovation, Chuncheon, Korea). Antibodies against ATG7, p62, SDHA, PDH, LC3 (Cell Signaling Technology, Danvers, MA, USA), C/EBP (Santa Cruz Biotechnology, Inc., Santa Cruz, CA, USA) and UCP1 (Abcam, Cambridge, UK) were used for immunoblotting analysis as indicated in the figures. Expression of HSP90 (Santa Cruz Biotechnology, Inc.) was measured as a gel loading control.

4.7. Statistics

All data are expressed as mean ± S.E.M. Group means and were compared by the nonparametric Mann–Whitney test using GraphPad Prism software (Available online: www.graphad.com). p < 0.05, p < 0.01, and p < 0.001 are represented by *, **, and ***, respectively, and they were considered statistically significant.

Supplementary Materials

Author Contributions

D.K., J.-H.K., Y.-H.K., and J.S.K. performed the experiments, analyzed and validated the data, S.-C.Y. analyzed the data, S.-W.K. analylzed the data and wrote the manuscript, Y.S. conceptualized, conceived, designed, supervised the project, analyzed the data and wrote the manuscript.

Funding

This work was supported by grants from the National Research Foundation of Korea (2014R1A2A1A11050599 and 2017R1A2B2002691).

Acknowledgments

We thank Wolfrum, Christian at ETH Zurich for generously sharing UCP1-CreER mice and Mi-Kyung Kong at the Department of Pathology, Asan Medical Center, for her technical support and analysis of the transmission electron microscopy images.

Conflicts of Interest

The authors declare no conflict of interest

Abbreviations

BATbrown adipose tissue
eWATepididymal white adipose tissue
iWATinguinal white adipose tissue
UCP1uncoupling protein 1
Atg7autophagy related 7
RERrespiratory exchange ratio
KOknock out

References

  1. Cannon, B.; Nedergaard, J. Brown adipose tissue: Function and physiological significance. Physiol. Rev. 2004, 84, 277–359. [Google Scholar] [CrossRef]
  2. Smith, R.E.; Roberts, J.C.; Hittelman, K.J. Nonphosphorylating respiration of mitochondria from brown adipose tissue of rats. Science 1966, 154, 653–654. [Google Scholar] [CrossRef] [PubMed]
  3. Aquila, H.; Link, T.A.; Klingenberg, M. The uncoupling protein from brown fat mitochondria is related to the mitochondrial ADP/ATP carrier. Analysis of sequence homologies and of folding of the protein in the membrane. EMBO J. 1985, 4, 2369–2376. [Google Scholar] [CrossRef] [PubMed]
  4. Echtay, K.S.; Bienengraeber, M.; Mayinger, P.; Heimpel, S.; Winkler, E.; Druhmann, D.; Frischmuth, K.; Kamp, F.; Huang, S.G. Uncoupling proteins: Martin Klingenberg’s contributions for 40 years. Arch. Biochem. Biophys. 2018, 657, 41–55. [Google Scholar] [CrossRef]
  5. Chouchani, E.T.; Kazak, L.; Spiegelman, B.M. New Advances in Adaptive Thermogenesis: UCP1 and Beyond. Cell Metab. 2019, 29, 27–37. [Google Scholar] [CrossRef] [PubMed]
  6. Ma, S.W.; Nadeau, B.E.; Foster, D.O. A nonocclusive cannula for sampling venous blood from the interscapular brown fat of conscious rats. Can. J. Physiol. Pharmacol. 1986, 64, 1434–1439. [Google Scholar] [CrossRef] [PubMed]
  7. Cinti, S. Between brown and white: Novel aspects of adipocyte differentiation. Ann. Med. 2011, 43, 104–115. [Google Scholar] [CrossRef]
  8. Cao, Y. Angiogenesis and vascular functions in modulation of obesity, adipose metabolism, and insulin sensitivity. Cell Metab. 2013, 18, 478–489. [Google Scholar] [CrossRef] [PubMed]
  9. Levine, B.; Klionsky, D.J. Development by self-digestion: Molecular mechanisms and biological functions of autophagy. Dev. Cell 2004, 6, 463–477. [Google Scholar] [CrossRef]
  10. Singh, R.; Kaushik, S.; Wang, Y.; Xiang, Y.; Novak, I.; Komatsu, M.; Tanaka, K.; Cuervo, A.M.; Czaja, M.J. Autophagy regulates lipid metabolism. Nature 2009, 458, 1131–1135. [Google Scholar] [CrossRef] [PubMed] [Green Version]
  11. Mizushima, N.; Komatsu, M. Autophagy: Renovation of cells and tissues. Cell 2011, 147, 728–741. [Google Scholar] [CrossRef] [PubMed]
  12. Kaushik, S.; Rodriguez-Navarro, J.A.; Arias, E.; Kiffin, R.; Sahu, S.; Schwartz, G.J.; Cuervo, A.M.; Singh, R. Autophagy in hypothalamic AgRP neurons regulates food intake and energy balance. Cell Metab. 2011, 14, 173–183. [Google Scholar] [CrossRef] [PubMed]
  13. Quan, W.; Kim, H.K.; Moon, E.Y.; Kim, S.S.; Choi, C.S.; Komatsu, M.; Jeong, Y.T.; Lee, M.K.; Kim, K.W.; Kim, M.S.; et al. Role of hypothalamic proopiomelanocortin neuron autophagy in the control of appetite and leptin response. Endocrinology 2012, 153, 1817–1826. [Google Scholar] [CrossRef] [PubMed]
  14. Coupe, B.; Ishii, Y.; Dietrich, M.O.; Komatsu, M.; Horvath, T.L.; Bouret, S.G. Loss of autophagy in pro-opiomelanocortin neurons perturbs axon growth and causes metabolic dysregulation. Cell Metab. 2012, 15, 247–255. [Google Scholar] [CrossRef] [PubMed]
  15. Yang, L.; Li, P.; Fu, S.; Calay, E.S.; Hotamisligil, G.S. Defective hepatic autophagy in obesity promotes ER stress and causes insulin resistance. Cell Metab. 2010, 11, 467–478. [Google Scholar] [CrossRef] [PubMed]
  16. Ebato, C.; Uchida, T.; Arakawa, M.; Komatsu, M.; Ueno, T.; Komiya, K.; Azuma, K.; Hirose, T.; Tanaka, K.; Kominami, E.; et al. Autophagy is important in islet homeostasis and compensatory increase of beta cell mass in response to high-fat diet. Cell Metab. 2008, 8, 325–332. [Google Scholar] [CrossRef] [PubMed]
  17. Fujitani, Y.; Kawamori, R.; Watada, H. The role of autophagy in pancreatic beta-cell and diabetes. Autophagy 2009, 5, 280–282. [Google Scholar] [CrossRef] [PubMed]
  18. Kim, K.H.; Jeong, Y.T.; Oh, H.; Kim, S.H.; Cho, J.M.; Kim, Y.N.; Kim, S.S.; Kim do, H.; Hur, K.Y.; Kim, H.K.; et al. Autophagy deficiency leads to protection from obesity and insulin resistance by inducing Fgf21 as a mitokine. Nat. Med. 2013, 19, 83–92. [Google Scholar] [CrossRef]
  19. Martinez-Lopez, N.; Athonvarangkul, D.; Sahu, S.; Coletto, L.; Zong, H.; Bastie, C.C.; Pessin, J.E.; Schwartz, G.J.; Singh, R. Autophagy in Myf5+ progenitors regulates energy and glucose homeostasis through control of brown fat and skeletal muscle development. EMBO Rep. 2013, 14, 795–803. [Google Scholar] [CrossRef]
  20. Komatsu, M.; Waguri, S.; Chiba, T.; Murata, S.; Iwata, J.; Tanida, I.; Ueno, T.; Koike, M.; Uchiyama, Y.; Kominami, E.; et al. Loss of autophagy in the central nervous system causes neurodegeneration in mice. Nature 2006, 441, 880–884. [Google Scholar] [CrossRef]
  21. Rosenwald, M.; Perdikari, A.; Rulicke, T.; Wolfrum, C. Bi-directional interconversion of brite and white adipocytes. Nat. Cell Biol. 2013, 15, 659–667. [Google Scholar] [CrossRef] [PubMed]
  22. Rosenwald, M.; Wolfrum, C. The origin and definition of brite versus white and classical brown adipocytes. Adipocyte 2014, 3, 4–9. [Google Scholar] [CrossRef] [PubMed]
  23. Joplin, R.; Wallace, L.L.; Johnson, G.D.; Lindsay, J.G.; Yeaman, S.J.; Palmer, J.M.; Strain, A.J.; Neuberger, J.M. Subcellular localization of pyruvate dehydrogenase dihydrolipoamide acetyltransferase in human intrahepatic biliary epithelial cells. J. Pathol. 1995, 176, 381–390. [Google Scholar] [CrossRef] [PubMed]
  24. Jezek, P.; Jaburek, M.; Porter, R.K. Uncoupling mechanism and redox regulation of mitochondrial uncoupling protein 1 (UCP1). Biochim. Biophys. Acta Bioenerg. 2019, 1860, 259–269. [Google Scholar] [CrossRef] [PubMed]
  25. Wu, Z.; Puigserver, P.; Andersson, U.; Zhang, C.; Adelmant, G.; Mootha, V.; Troy, A.; Cinti, S.; Lowell, B.; Scarpulla, R.C.; et al. Mechanisms controlling mitochondrial biogenesis and respiration through the thermogenic coactivator PGC-1. Cell 1999, 98, 115–124. [Google Scholar] [CrossRef]
  26. Cypess, A.M.; Lehman, S.; Williams, G.; Tal, I.; Rodman, D.; Goldfine, A.B.; Kuo, F.C.; Palmer, E.L.; Tseng, Y.H.; Doria, A.; et al. Identification and importance of brown adipose tissue in adult humans. N. Engl. J. Med. 2009, 360, 1509–1517. [Google Scholar] [CrossRef] [PubMed]
  27. Ouellet, V.; Routhier-Labadie, A.; Bellemare, W.; Lakhal-Chaieb, L.; Turcotte, E.; Carpentier, A.C.; Richard, D. Outdoor temperature, age, sex, body mass index, and diabetic status determine the prevalence, mass, and glucose-uptake activity of 18F-FDG-detected BAT in humans. J. Clin. Endocrinol. Metab. 2011, 96, 192–199. [Google Scholar] [CrossRef] [PubMed]
  28. Kopecky, J.; Clarke, G.; Enerback, S.; Spiegelman, B.; Kozak, L.P. Expression of the mitochondrial uncoupling protein gene from the aP2 gene promoter prevents genetic obesity. J. Clin. Investig. 1995, 96, 2914–2923. [Google Scholar] [CrossRef] [PubMed]
  29. Stefl, B.; Janovska, A.; Hodny, Z.; Rossmeisl, M.; Horakova, M.; Syrovy, I.; Bemova, J.; Bendlova, B.; Kopecky, J. Brown fat is essential for cold-induced thermogenesis but not for obesity resistance in aP2-Ucp mice. Am. J. Physiol. 1998, 274, E527–E533. [Google Scholar] [CrossRef]
  30. Mantzoros, C.S.; Frederich, R.C.; Qu, D.; Lowell, B.B.; Maratos-Flier, E.; Flier, J.S. Severe leptin resistance in brown fat-deficient uncoupling protein promoter-driven diphtheria toxin A mice despite suppression of hypothalamic neuropeptide Y and circulating corticosterone concentrations. Diabetes 1998, 47, 230–238. [Google Scholar] [CrossRef]
  31. Hamann, A.; Flier, J.S.; Lowell, B.B. Obesity after genetic ablation of brown adipose tissue. Z. Ernahrungswiss 1998, 37, 1–7. [Google Scholar] [PubMed]
  32. Nedergaard, J.; Bengtsson, T.; Cannon, B. Unexpected evidence for active brown adipose tissue in adult humans. Am. J. Physiol. Endocrinol. Metab. 2007, 293, E444–E452. [Google Scholar] [CrossRef] [PubMed]
  33. van Marken Lichtenbelt, W.D.; Vanhommerig, J.W.; Smulders, N.M.; Drossaerts, J.M.; Kemerink, G.J.; Bouvy, N.D.; Schrauwen, P.; Teule, G.J. Cold-activated brown adipose tissue in healthy men. N. Engl. J. Med. 2009, 360, 1500–1508. [Google Scholar] [CrossRef] [PubMed]
  34. Saito, M.; Okamatsu-Ogura, Y.; Matsushita, M.; Watanabe, K.; Yoneshiro, T.; Nio-Kobayashi, J.; Iwanaga, T.; Miyagawa, M.; Kameya, T.; Nakada, K.; et al. High incidence of metabolically active brown adipose tissue in healthy adult humans: Effects of cold exposure and adiposity. Diabetes 2009, 58, 1526–1531. [Google Scholar] [CrossRef]
  35. Virtanen, K.A.; Lidell, M.E.; Orava, J.; Heglind, M.; Westergren, R.; Niemi, T.; Taittonen, M.; Laine, J.; Savisto, N.J.; Enerback, S.; et al. Functional brown adipose tissue in healthy adults. N. Engl. J. Med. 2009, 360, 1518–1525. [Google Scholar] [CrossRef] [PubMed]
  36. Vijgen, G.H.; Bouvy, N.D.; Teule, G.J.; Brans, B.; Schrauwen, P.; van Marken Lichtenbelt, W.D. Brown adipose tissue in morbidly obese subjects. PLoS ONE 2011, 6, e17247. [Google Scholar] [CrossRef]
  37. Richard, D.; Picard, F. Brown fat biology and thermogenesis. Front. Biosci. (Landmark Ed) 2011, 16, 1233–1260. [Google Scholar] [CrossRef]
  38. Puigserver, P.; Wu, Z.; Park, C.W.; Graves, R.; Wright, M.; Spiegelman, B.M. A cold-inducible coactivator of nuclear receptors linked to adaptive thermogenesis. Cell 1998, 92, 829–839. [Google Scholar] [CrossRef]
  39. Kelly, D.P.; Scarpulla, R.C. Transcriptional regulatory circuits controlling mitochondrial biogenesis and function. Genes Dev. 2004, 18, 357–368. [Google Scholar] [CrossRef] [Green Version]
  40. Kleiner, S.; Mepani, R.J.; Laznik, D.; Ye, L.; Jurczak, M.J.; Jornayvaz, F.R.; Estall, J.L.; Chatterjee Bhowmick, D.; Shulman, G.I.; Spiegelman, B.M. Development of insulin resistance in mice lacking PGC-1alpha in adipose tissues. Proc. Natl. Acad. Sci. USA 2012, 109, 9635–9640. [Google Scholar] [CrossRef]
  41. Vernochet, C.; Damilano, F.; Mourier, A.; Bezy, O.; Mori, M.A.; Smyth, G.; Rosenzweig, A.; Larsson, N.G.; Kahn, C.R. Adipose tissue mitochondrial dysfunction triggers a lipodystrophic syndrome with insulin resistance, hepatosteatosis, and cardiovascular complications. FASEB J. 2014, 28, 4408–4419. [Google Scholar] [CrossRef] [PubMed] [Green Version]
  42. Vives-Bauza, C.; Zhou, C.; Huang, Y.; Cui, M.; de Vries, R.L.; Kim, J.; May, J.; Tocilescu, M.A.; Liu, W.; Ko, H.S.; et al. PINK1-dependent recruitment of Parkin to mitochondria in mitophagy. Proc. Natl. Acad. Sci. USA 2010, 107, 378–383. [Google Scholar] [CrossRef] [PubMed]
  43. Vives-Bauza, C.; Przedborski, S. Mitophagy: The latest problem for Parkinson’s disease. Trends Mol. Med. 2011, 17, 158–165. [Google Scholar] [CrossRef] [PubMed]
  44. Ashrafi, G.; Schwarz, T.L. The pathways of mitophagy for quality control and clearance of mitochondria. Cell Death Differ. 2013, 20, 31–42. [Google Scholar] [CrossRef] [PubMed]
  45. Masiero, E.; Agatea, L.; Mammucari, C.; Blaauw, B.; Loro, E.; Komatsu, M.; Metzger, D.; Reggiani, C.; Schiaffino, S.; Sandri, M. Autophagy is required to maintain muscle mass. Cell Metab. 2009, 10, 507–515. [Google Scholar] [CrossRef] [PubMed]
  46. Kang, Y.H.; Cho, M.H.; Kim, J.Y.; Kwon, M.S.; Peak, J.J.; Kang, S.W.; Yoon, S.Y.; Song, Y. Impaired macrophage autophagy induces systemic insulin resistance in obesity. Oncotarget 2016, 7, 35577–35591. [Google Scholar] [CrossRef]
  47. Kwon, M.; Eom, J.; Kim, D.; Kim, J.; Heredia, J.; Kang, S.W.; Song, Y. Skeletal Muscle Tissue Trib3 Links Obesity with Insulin Resistance by Autophagic Degradation of AKT2. Cell Physiol. Biochem. 2018, 48, 1543–1555. [Google Scholar] [CrossRef]
  48. Altshuler-Keylin, S.; Kajimura, S. Mitochondrial homeostasis in adipose tissue remodeling. Sci. Signal. 2017, 10, eaai9248. [Google Scholar] [CrossRef] [Green Version]
  49. Short, K.R.; Bigelow, M.L.; Kahl, J.; Singh, R.; Coenen-Schimke, J.; Raghavakaimal, S.; Nair, K.S. Decline in skeletal muscle mitochondrial function with aging in humans. Proc. Natl. Acad. Sci. USA 2005, 102, 5618–5623. [Google Scholar] [CrossRef] [Green Version]
  50. Tate, E.L.; Herbener, G.H. A morphometric study of the density of mitochondrial cristae in heart and liver of aging mice. J. Gerontol. 1976, 31, 129–134. [Google Scholar] [CrossRef]
  51. Yoneshiro, T.; Aita, S.; Matsushita, M.; Okamatsu-Ogura, Y.; Kameya, T.; Kawai, Y.; Miyagawa, M.; Tsujisaki, M.; Saito, M. Age-related decrease in cold-activated brown adipose tissue and accumulation of body fat in healthy humans. Obesity (Silver Spring) 2011, 19, 1755–1760. [Google Scholar] [CrossRef] [PubMed]
  52. Yamashita, H.; Sato, Y.; Mori, N. Difference in induction of uncoupling protein genes in adipose tissues between young and old rats during cold exposure. FEBS Lett. 1999, 458, 157–161. [Google Scholar] [CrossRef]
  53. McDonald, R.B.; Horwitz, B.A. Brown adipose tissue thermogenesis during aging and senescence. J. Bioenerg. Biomembr. 1999, 31, 507–516. [Google Scholar] [CrossRef] [PubMed]
  54. Ost, A.; Svensson, K.; Ruishalme, I.; Brannmark, C.; Franck, N.; Krook, H.; Sandstrom, P.; Kjolhede, P.; Stralfors, P. Attenuated mTOR signaling and enhanced autophagy in adipocytes from obese patients with type 2 diabetes. Mol. Med. 2010, 16, 235–246. [Google Scholar] [CrossRef] [PubMed]
  55. Kovsan, J.; Bluher, M.; Tarnovscki, T.; Kloting, N.; Kirshtein, B.; Madar, L.; Shai, I.; Golan, R.; Harman-Boehm, I.; Schon, M.R.; et al. Altered autophagy in human adipose tissues in obesity. J. Clin. Endocrinol. Metab. 2011, 96, E268–E277. [Google Scholar] [CrossRef] [PubMed]
  56. Jansen, H.J.; van Essen, P.; Koenen, T.; Joosten, L.A.; Netea, M.G.; Tack, C.J.; Stienstra, R. Autophagy activity is up-regulated in adipose tissue of obese individuals and modulates proinflammatory cytokine expression. Endocrinology 2012, 153, 5866–5874. [Google Scholar] [CrossRef]
  57. Kosacka, J.; Kern, M.; Kloting, N.; Paeschke, S.; Rudich, A.; Haim, Y.; Gericke, M.; Serke, H.; Stumvoll, M.; Bechmann, I.; et al. Autophagy in adipose tissue of patients with obesity and type 2 diabetes. Mol. Cell. Endocrinol. 2015, 409, 21–32. [Google Scholar] [CrossRef]
  58. Leu, S.Y.; Tsai, Y.C.; Chen, W.C.; Hsu, C.H.; Lee, Y.M.; Cheng, P.Y. Raspberry ketone induces brown-like adipocyte formation through suppression of autophagy in adipocytes and adipose tissue. J. Nutr. Biochem. 2018, 56, 116–125. [Google Scholar] [CrossRef]
  59. Zhang, Y.; Goldman, S.; Baerga, R.; Zhao, Y.; Komatsu, M.; Jin, S. Adipose-specific deletion of autophagy-related gene 7 (atg7) in mice reveals a role in adipogenesis. Proc. Natl. Acad. Sci. USA 2009, 106, 19860–19865. [Google Scholar] [CrossRef]
  60. Shimizu, I.; Aprahamian, T.; Kikuchi, R.; Shimizu, A.; Papanicolaou, K.N.; MacLauchlan, S.; Maruyama, S.; Walsh, K. Vascular rarefaction mediates whitening of brown fat in obesity. J. Clin. Investig. 2014, 124, 2099–2112. [Google Scholar] [CrossRef] [Green Version]
  61. Altshuler-Keylin, S.; Shinoda, K.; Hasegawa, Y.; Ikeda, K.; Hong, H.; Kang, Q.; Yang, Y.; Perera, R.M.; Debnath, J.; Kajimura, S. Beige Adipocyte Maintenance Is Regulated by Autophagy-Induced Mitochondrial Clearance. Cell Metab. 2016, 24, 402–419. [Google Scholar] [CrossRef] [PubMed] [Green Version]
  62. Wikstrom, J.D.; Mahdaviani, K.; Liesa, M.; Sereda, S.B.; Si, Y.; Las, G.; Twig, G.; Petrovic, N.; Zingaretti, C.; Graham, A.; et al. Hormone-induced mitochondrial fission is utilized by brown adipocytes as an amplification pathway for energy expenditure. EMBO J. 2014, 33, 418–436. [Google Scholar] [CrossRef] [PubMed]
  63. Cairo, M.; Villarroya, J.; Cereijo, R.; Campderros, L.; Giralt, M.; Villarroya, F. Thermogenic activation represses autophagy in brown adipose tissue. Int. J. Obes. (Lond.) 2016, 40, 1591–1599. [Google Scholar] [CrossRef] [PubMed]
  64. Shu, J.; Matarese, A.; Santulli, G. Diabetes, body fat, skeletal muscle, and hypertension: The ominous chiasmus? J. Clin. Hypertens. (Greenwich) 2019, 21, 239–242. [Google Scholar] [CrossRef] [PubMed]
  65. Ruan, C.C.; Kong, L.R.; Chen, X.H.; Ma, Y.; Pan, X.X.; Zhang, Z.B.; Gao, P.J. A2A Receptor Activation Attenuates Hypertensive Cardiac Remodeling via Promoting Brown Adipose Tissue-Derived FGF21. Cell Metab. 2018, 28, 476–489. [Google Scholar] [CrossRef] [PubMed]
  66. He, J.L.; Zhao, M.; Xia, J.J.; Guan, J.; Liu, Y.; Wang, L.Q.; Song, D.X.; Qu, M.Y.; Zuo, M.; Wen, X.; et al. FGF21 ameliorates the neurocontrol of blood pressure in the high fructose-drinking rats. Sci. Rep. 2016, 6, 29582. [Google Scholar] [CrossRef] [PubMed]
  67. Facemire, C.S.; Nixon, A.B.; Griffiths, R.; Hurwitz, H.; Coffman, T.M. Vascular endothelial growth factor receptor 2 controls blood pressure by regulating nitric oxide synthase expression. Hypertension 2009, 54, 652–658. [Google Scholar] [CrossRef]
  68. Must, A.; Spadano, J.; Coakley, E.H.; Field, A.E.; Colditz, G.; Dietz, W.H. The disease burden associated with overweight and obesity. JAMA 1999, 282, 1523–1529. [Google Scholar] [CrossRef]
  69. Hruby, A.; Hu, F.B. The Epidemiology of Obesity: A Big Picture. Pharmacoeconomics 2015, 33, 673–689. [Google Scholar] [CrossRef]
  70. Garrison, R.J.; Kannel, W.B.; Stokes, J., 3rd; Castelli, W.P. Incidence and precursors of hypertension in young adults: The Framingham Offspring Study. Prev. Med. 1987, 16, 235–251. [Google Scholar] [CrossRef]
  71. Kong, L.R.; Zhou, Y.P.; Chen, D.R.; Ruan, C.C.; Gao, P.J. Decrease of Perivascular Adipose Tissue Browning Is Associated With Vascular Dysfunction in Spontaneous Hypertensive Rats During Aging. Front. Physiol. 2018, 9, 400. [Google Scholar] [CrossRef] [PubMed] [Green Version]
  72. Bang, S.; Won, K.H.; Moon, H.R.; Yoo, H.; Hong, A.; Song, Y.; Chang, S.E. Novel regulation of melanogenesis by adiponectin via the AMPK/CRTC pathway. Pigment Cell Melanoma Res. 2017, 30, 553–557. [Google Scholar] [CrossRef] [PubMed]
Figure 1. Generation of brown adipocyte-specific Atg7 knockout (ATG7B KO) mice. (A). Schematic illustration of the strategy for establishing brown adipocyte-specific conditional autophagy-deficient mice. Atg7fl/fl mice were crossed with uncoupling protein 1 (UCP1-CreER+/) transgenic mice, and tamoxifen was administered to induce the nuclear migration of CreER. (B). Genotyping results for Atg7fl/fl (control) mice and Atg7fl/fl-UCP1-CreER+/ (ATG7B KO) mice. The top panel shows the genotyping results for the UCP1-CreER allele and the bottom panel shows the genotyping results for the Atg7fl/fl allele. (C). Western blot analysis of ATG7 and p62 expression in brown adipose tissue (BAT) (left panel), epididymal white adipose tissue (eWAT; middle panel) and inguinal white adipose tissue (iWAT; right panel) of control and ATG7B KO mice.
Ijms 20 03520 g001
Figure 2. Brown adipocyte-specific Atg7 knockout mice exhibit reduced body weight and improved insulin sensitivity. (A). Weekly body weight chart of control (n = 7) and ATG7B KO mice (n = 7), maintained on a normal chow diet. Arrows indicate weeks that control and ATG7B KO mice were treated with tamoxifen. (B). Weights of liver, eWAT, iWAT, and BAT from 1-year-old control (n = 7) and ATG7B KO mice (n = 7). (C). Insulin tolerance test (ITT) of normal chow-fed control (n = 7) and ATG7B KO mice (n = 7). Statistical significance was determined by Mann–Whitney test. * and ** represent p < 0.05 and p < 0.01 respectively.
Ijms 20 03520 g002
Figure 3. Increased energy expenditure in ATG7B KO mice. Shown are comparisons of (A). 24-h food intake and (B). physical activity of control (n = 3) and ATG7B KO mice (n = 5) (C). Respiratory exchange ratio (RER), (D). relative oxygen consumption, (E). carbon dioxide production, and (F). energy expenditure of night-time basal and CL316,243 treated control (n = 4) and ATG7B KO mice (n = 4), maintained on a normal chow diet were analyzed using indirect calorimetry. Statistical significance was determined by the Mann–Whitney test. *, ** and *** represent p < 0.5, p < 0.01 and p < 0.001 respectively.
Ijms 20 03520 g003
Figure 4. Increased mitochondrial content in ATG7B KO mice. (A). Appearance of BAT depots dissected from control and ATG7B KO mice. (B). Histological analysis of hematoxylin and eosin (H & E) stained sections of BAT from control and ATG7B KO mice. The scale bar represents 200 μm. (C). Immunoblotting for UCP1 and mitochondria-resident proteins PDH and SDHA in BAT depots of control and ATG7B KO mice.
Ijms 20 03520 g004
Figure 5. Suppression of mitochondrial turnover in BAT of ATG7B KO mice. Relative mRNA levels of (A). ATG7, PGC1α and the chromosome-encoded mitochondrial proteins VDAC1, SDHA and CIDEA, and (B). the mitochondrial-encoded proteins ATP6, cytochrome b, ND2, ND5, Cox1, and Cox2 from BAT of control and ATG7B KO mice as quantified by quantitative reverse PCR (qRT-PCR). Statistical significance was determined by Mann–Whitney test. *, ** and *** represent p < 0.05, p < 0.01, and p < 0.001 respectively. (C). Transmission electron microscopy images of the BAT from control and ATG7B KO mice. Left two panels (3000×), right two panels (20,000×).
Ijms 20 03520 g005
Figure 6. Age-associated changes of BAT autophagy and mitochondrial content. (A). The relative protein levels of mitochondrial (SDHA, UCP1) and autophagy (ATG7, p62) markers in BAT of young (3-month-old) and aged (12-month-old) mice (B). Appearance of BAT depots and immunoblotting results for ATG7, UCP1 and mitochondrial-resident proteins from BAT of control and ATG7B KO mice maintained on a 60% high-fat diet (HFD). (C). Body weight chart of control (n = 7) and ATG7B KO mice (n = 9) fed 60% HFD. Arrows indicate weeks that control and ATG7B KO mice were treated with tamoxifen. (D). Schematic illustration proposing the role of brown adipocyte autophagy in age-associated decline of BAT activity.
Ijms 20 03520 g006

