Article

ASD Phenotype—Genotype Associations in Concordant and Discordant Monozygotic and Dizygotic Twins Stratified by Severity of Autistic Traits

by
Valerie W. Hu
*,
Christine A. Devlin
and
Jessica J. Debski
Department of Biochemistry and Molecular Medicine, School of Medicine and Health Sciences, The George Washington University, Washington, DC 20037, USA
*
Author to whom correspondence should be addressed.
Current address: Department of Biochemistry, University of Illinois at Urbana-Champaign, Urbana, IL 61801, USA.
Current address: Rowan University School of Osteopathic Medicine, 1 Medical Center Dr., Stratford, NJ 08084, USA.
Int. J. Mol. Sci. 2019, 20(15), 3804; https://0-doi-org.brum.beds.ac.uk/10.3390/ijms20153804
Submission received: 13 July 2019 / Revised: 30 July 2019 / Accepted: 31 July 2019 / Published: 3 August 2019

Abstract

:
Autism spectrum disorder (ASD) is a highly heterogeneous neurodevelopmental disorder characterized by impaired social communication coupled with stereotyped behaviors and restricted interests. Despite the high concordance rate for diagnosis, there is little information on the magnitude of genetic contributions to specific ASD behaviors. Using behavioral/trait severity scores from the Autism Diagnostic Interview-Revised (ADI-R) diagnostic instrument, we compared the phenotypic profiles of mono- and dizygotic twins where both co-twins were diagnosed with ASD or only one twin had a diagnosis. The trait distribution profiles across the respective twin populations were first used for quantitative trait association analyses using publicly available genome-wide genotyping data. Trait-associated single nucleotide polymorphisms (SNPs) were then used for case-control association analyses, in which cases were defined as individuals in the lowest (Q1) and highest (Q4) quartiles of the severity distribution curves for each trait. While all of the ASD-diagnosed twins exhibited similar trait severity profiles, the non-autistic dizygotic twins exhibited significantly lower ADI-R item scores than the non-autistic monozygotic twins. Case-control association analyses of twins stratified by trait severity revealed statistically significant SNPs with odds ratios that clearly distinguished individuals in Q4 from those in Q1. While the level of shared genomic variation is a strong determinant of the severity of autistic traits in the discordant non-autistic twins, the similarity of trait profiles in the concordantly autistic dizygotic twins also suggests a role for environmental influences. Stratification of cases by trait severity resulted in the identification of statistically significant SNPs located near genes over-represented within autism gene datasets.

Graphical Abstract

1. Introduction

Autism spectrum disorder (ASD) is a highly heritable and heterogeneous neurodevelopmental disorder which is characterized by deficits in social communication and reciprocal interactions as well as by stereotyped behavior and restricted interests, often accompanied by language difficulties, especially in the area of pragmatics [1]. ASD is often comorbid with disorders such as anxiety, attention-deficit/hyperactivity disorder, and intellectual disability, and some affected individuals also suffer from gastrointestinal, immune system, and sleep disorders, suggestive of systemic dysregulation. Severity levels of autism vary broadly with some cases having only mild deficits in social interactions, while other cases exhibit severe deficits in social behaviors and manifest noticeably aberrant stereotypic behaviors, including self-injury. Boys are four times more likely than girls to have an ASD diagnosis and treatment options are limited in part due to the heterogeneity of the disorder as well as a lack of knowledge of the underlying biology [2].
Ever since the twin study of Bailey et al. [3] reported a concordance rate for autism of 60% for genetically identical monozygotic (MZ) twins and 0% for dizygotic (DZ) twins, autism has been perceived as a strongly genetic disorder. However, a review of twin studies conducted between 1977 and 2011 suggests that concordance rates for autism are quite variable ranging from 36% to 96% for MZ twins, depending in part on sex as well as whether or not the diagnosis was narrowly defined (i.e., strict autism) or more broadly defined as autism spectrum disorder (ASD) [4]. The differences in concordance rates and the incomplete penetrance have been attributed to undefined environmental factors. To tease out the contributions of genetics and environment, there have been increased efforts to assemble large twin cohorts not only for genetic analyses but also for studies on the associated phenotypes of autism, including neurodevelopmental differences [5,6,7,8]. In fact, heritability rates of ASD vary greatly in different studies conducted since 2011, with Hallmayer et al. reporting a moderate genetic effect of 38% [9], Gaugler et al. reporting a narrow-sense (strictly defined) autism heritability of 52% [10], and Tick et al. estimating heritability at 64–91% in a meta-analysis of twin studies [11], with each study acknowledging the effects of shared environment to explain the non-genetic component of ASD. Heritability studies that included subclinical (i.e., broad autism phenotype) diagnoses also indicate that heritability is determined by both genetics and non-shared environment, but that concordance rates are somewhat dependent on diagnostic method [12]. Using three different diagnostic methods, Colvert et al. showed that concordance rates among monozygotic twins ranged from 62% to 75%, while the rate varied from 5% to 40% among dizygotic twins. More recently, several studies using monozygotic and dizygotic twins have investigated the association between autistic traits and specific phenotypes, such as atypical sensory reactivity [13], face identify recognition [14], and social cognition [15], with all of these studies reinforcing genetic links to these phenotypes. However, few studies have used a broad range of specific phenotypic differences among clinically discordant non-autistic twins to determine how zygosity influences the severity of autistic traits.
While twin studies make it apparent that genetics plays a significant role in ASD and associated phenotypes, no one genetic profile emerges due to the heterogeneity of ASD. In order to overcome this issue, some groups have attempted to reduce the heterogeneity by clustering individuals according to clinical, behavioral, or molecular subphenotypes. Previously, we used cluster analyses of severity scores on a broad spectrum of traits and behaviors probed by the Autism Diagnostic Interview-Revised (ADI-R) instrument [16] to identify four phenotypic subgroups of individuals which were qualitatively described as severely language-impaired, intermediate, mild, and savant [17]. In addition, transcriptomic analyses of lymphoblastoid cell lines derived from individuals in three of the four subgroups showed that the ASD subgroups could be distinguished from a group of non-autistic controls as well as from each other, suggesting the contribution of different biological processes to specific subphenotypes of ASD [18]. Furthermore, case-control association analyses based upon the four ASD phenotypic subgroups using SNPs derived from quantitative trait association analyses which were based on ADI-R scores for multiple traits identified novel and statistically significant SNPs that were subtype-dependent [19]. Similarly, a linkage analysis based on these subphenotypes revealed novel genetic loci with highly significant LOD scores that were not detected in the absence of subtyping in addition to intra-family phenotypic and genetic heterogeneity [20]. Another study used a cohort of ASD individuals with extreme sleep onset delay as a means to decrease heterogeneity of cases to tease out significant variants in genes for melatonin pathway enzymes [21]. Recently, subgrouping of females with autism using X chromosome inactivation status as an epigenetic marker revealed a novel alternatively-spliced isoform of an X-linked chromatin gene, KDM5C, which contained the 3′UTR from a retrotransposed gene and was differentially expressed in this subgroup of autistic females relative to controls [22]. Collectively, these studies based on reducing heterogeneity among cases suggest the potential for relating genotype as well as gene structure with specific subphenotypes of ASD. However, there is little information on the relationship between genotype and the specific traits or subphenotypes observed in ASD.
The goals of this study were to: (1) investigate how genetics influences specific autism-associated behaviors and traits among monozygotic versus dizygotic twins, either concordant or discordant for autism diagnosis; (2) utilize ASD trait distribution profiles based on individual ADI-R scores in quantitative trait association analyses to identify single nucleotide polymorphisms (SNPs or quantitative trait nucleotides [QTNs]) that associate with specific traits; (3) determine whether the QTNs can differentiate cases from controls using individuals with ASD at the extremes of each trait distribution profile to reduce the phenotypic heterogeneity of cases for case-control association analyses; and (4) identify genes, pathways, and biological functions associated with specific traits. The results of these deep phenotyping analyses suggest that while shared genotype is a strong determinant of the severity of autistic traits in discordant monozygotic twins, the similarity of trait profiles of genetically distinct dizygotic twins concordant for diagnosis of ASD also suggests a role for shared environment. Moreover, genetic analyses which utilize both quantitative trait and case-control association analyses in which clinical or phenotypic heterogeneity is reduced by limiting the cases to those at the extremes of trait severities reveal highly significant SNPs associated with genes enriched in autism datasets and over-represented in neurological functions relevant to ASD.

2. Results

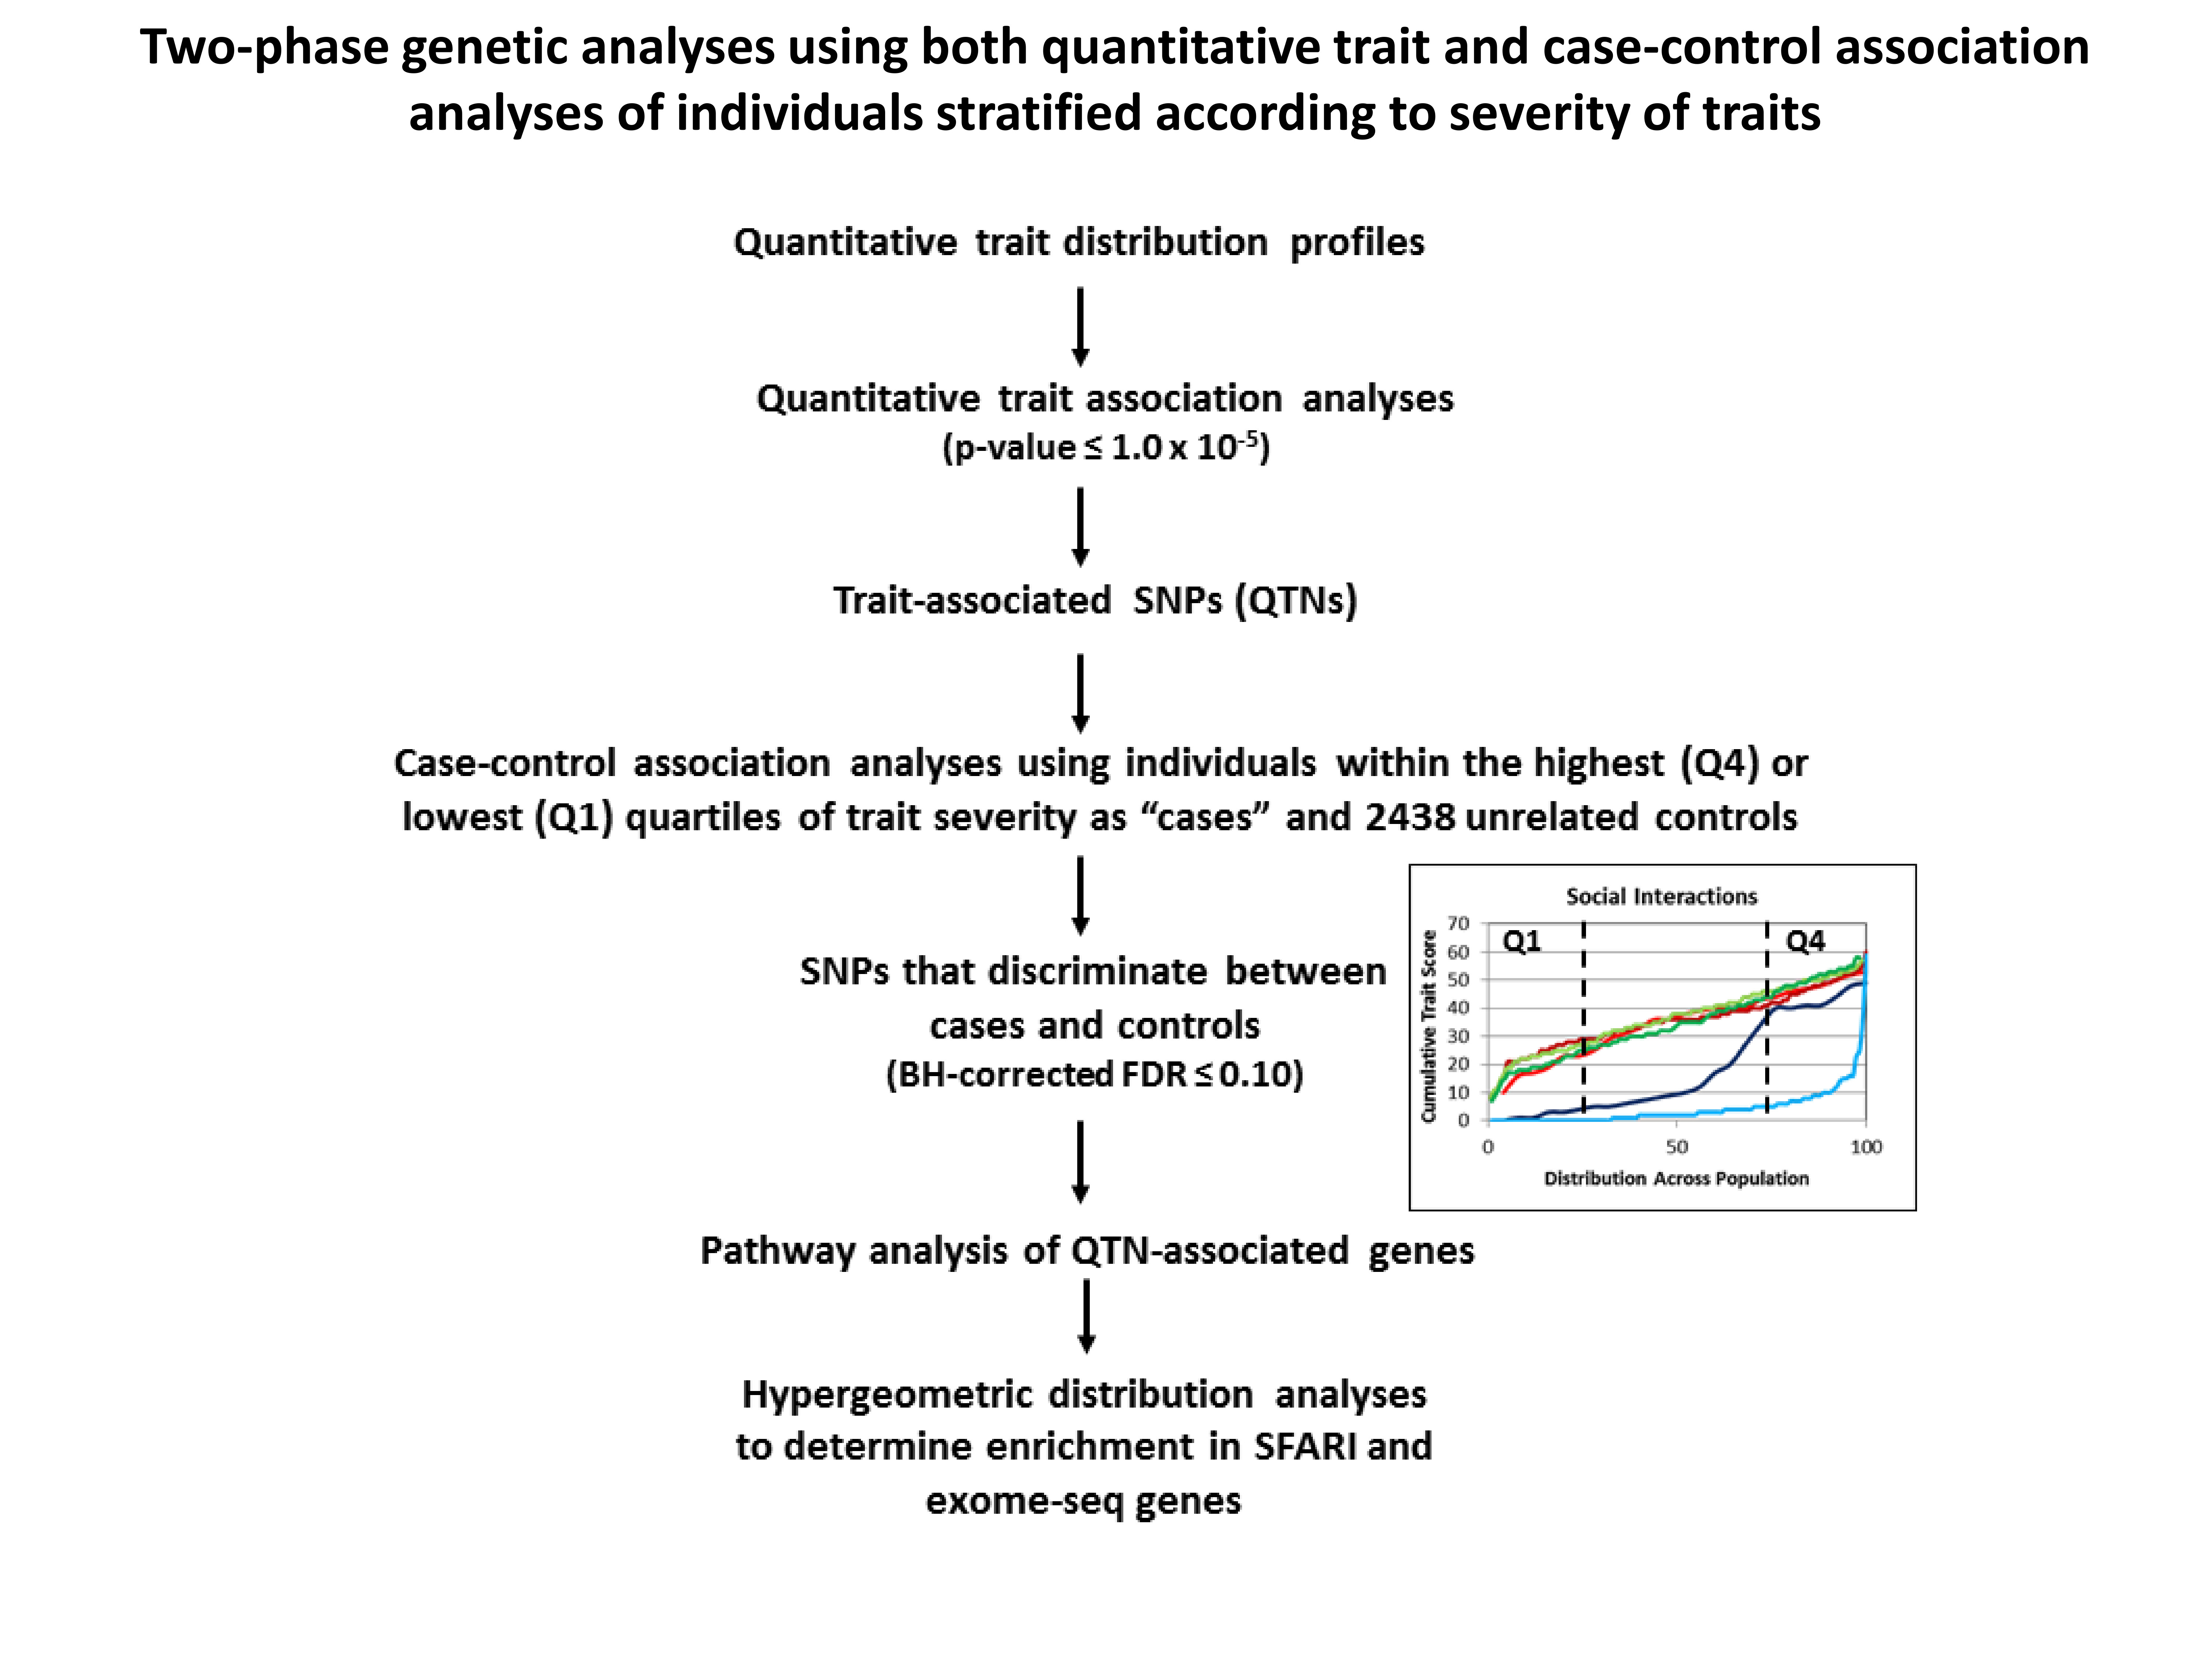
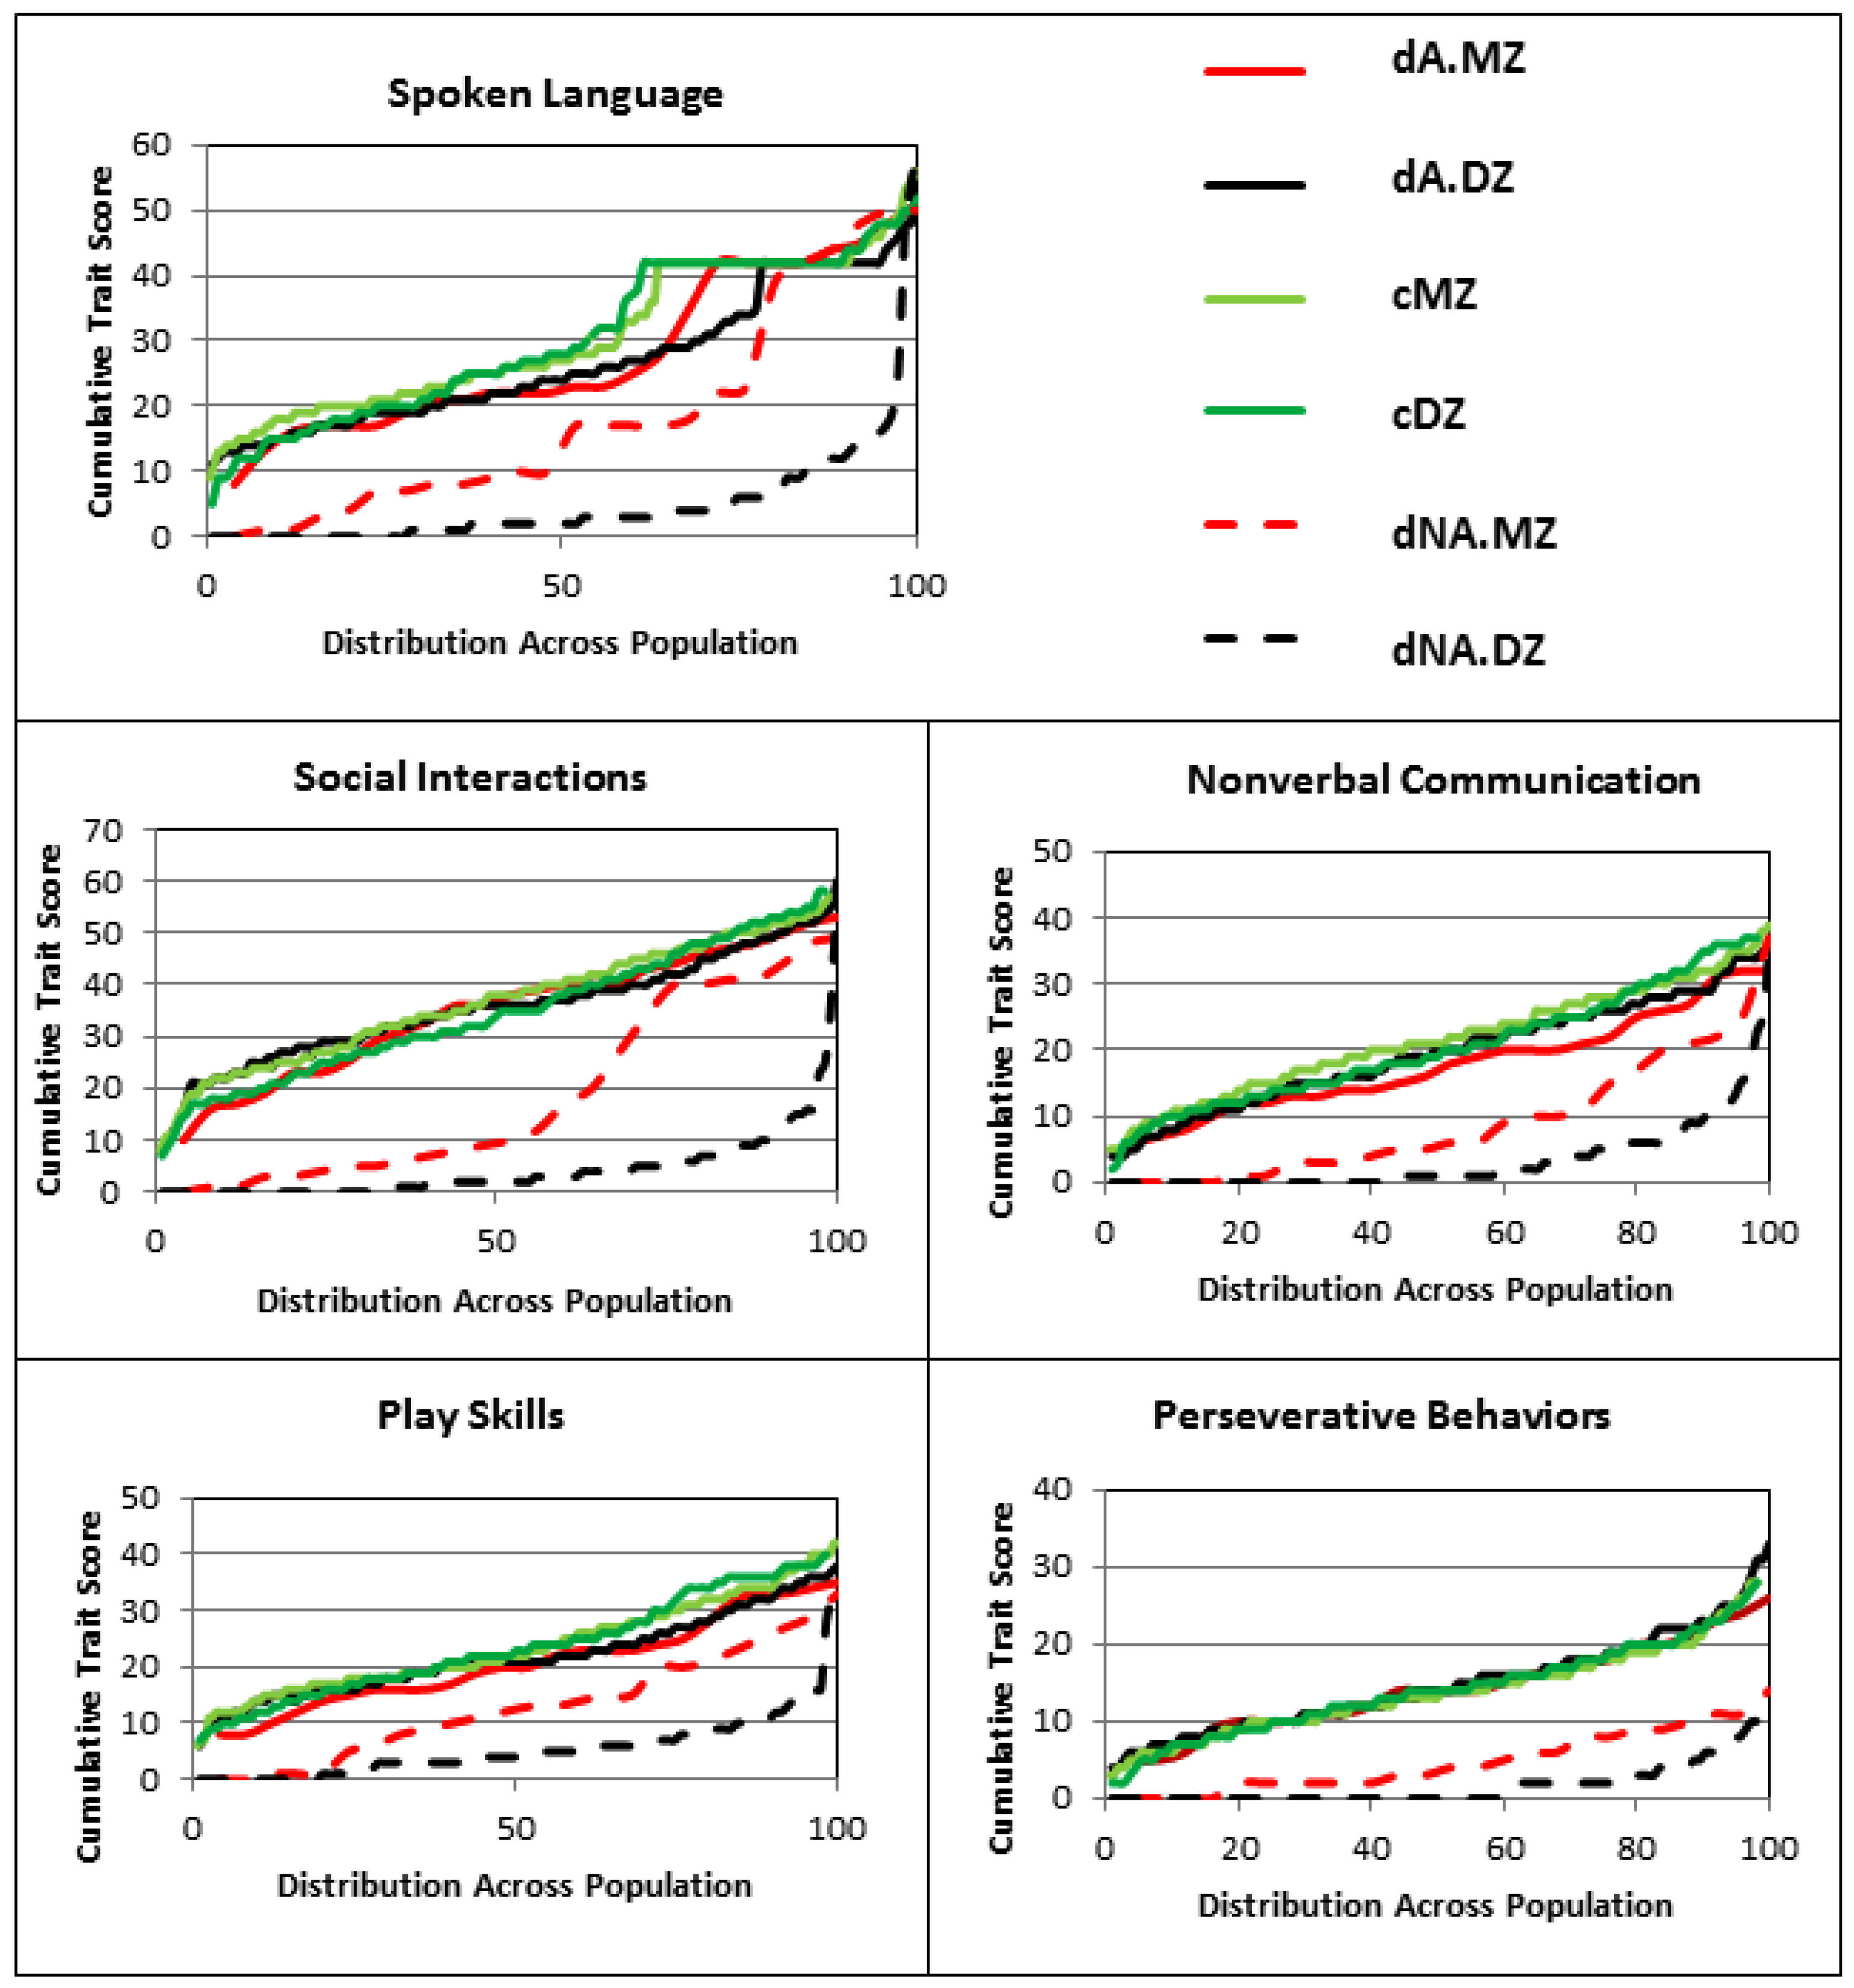
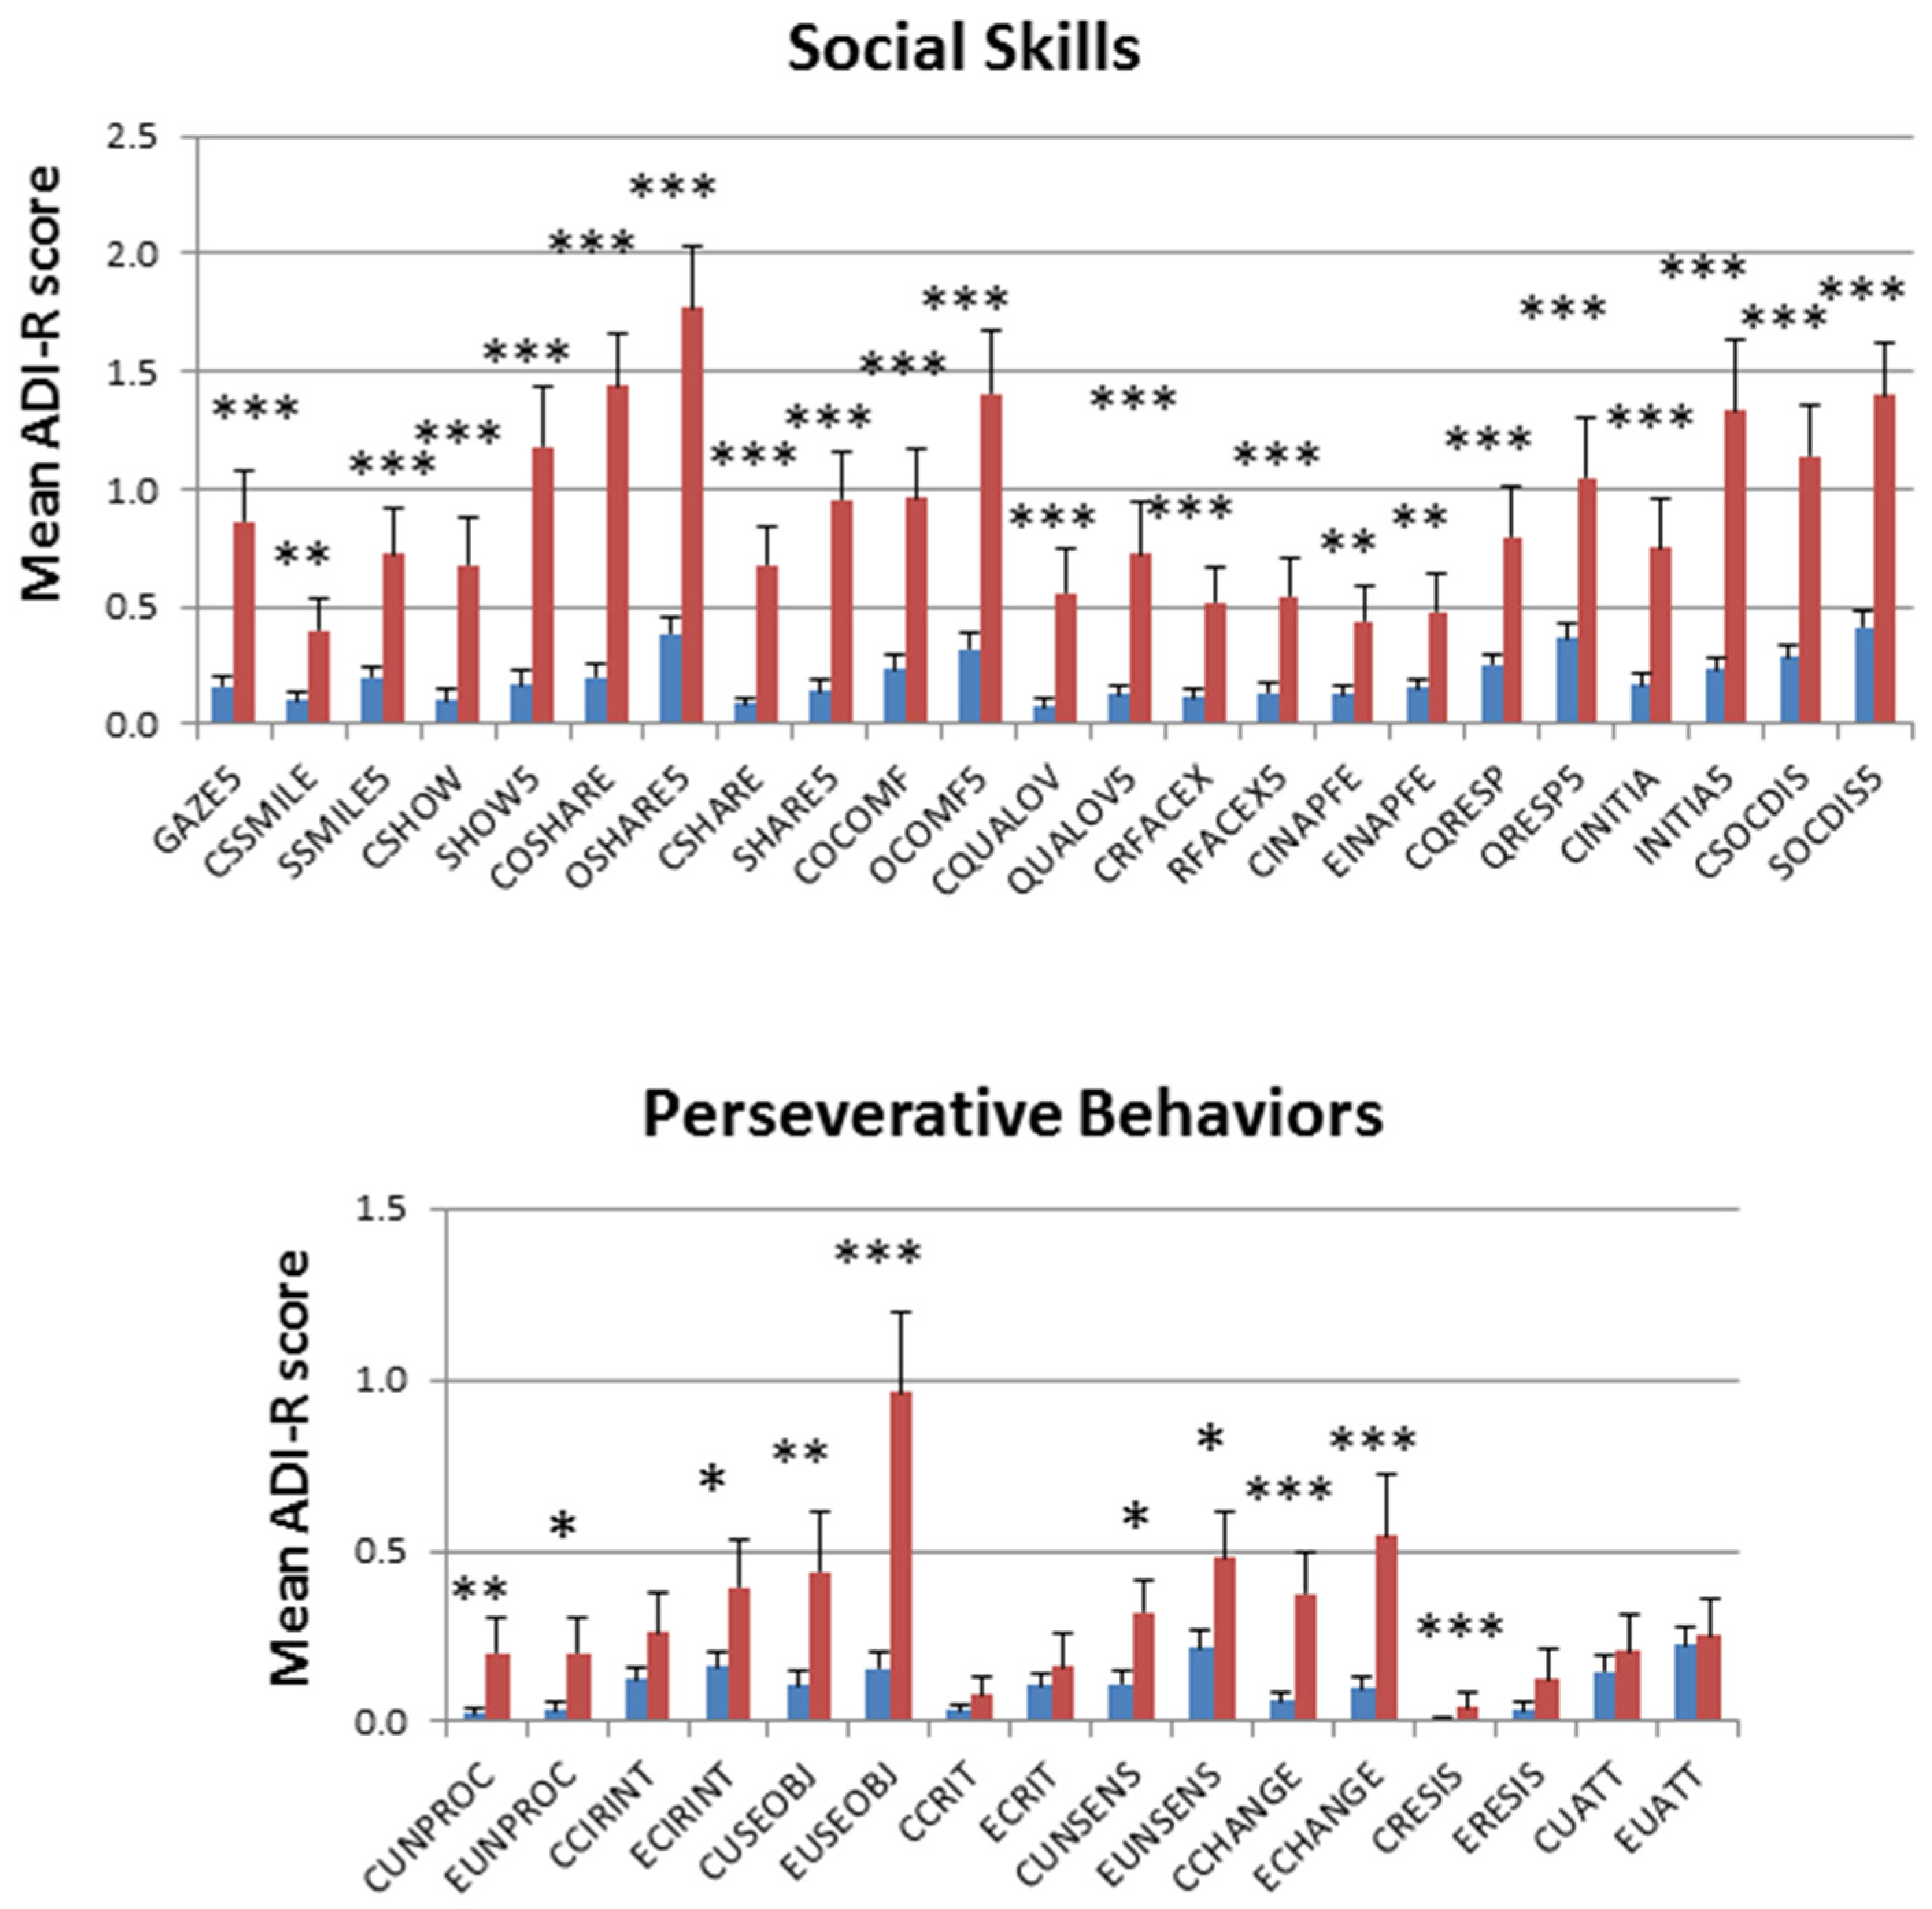
2.1. Deep Phenotypic Analyses of MZ and DZ Twins: Influence of Zygosity and Diagnostic Concordance

A total of 284 pairs of twins represented in the Autism Genetic Resource Exchange (AGRE) were included in this study. The twins were sorted into subgroups based on validated zygosity (monozygotic versus dizygotic) as well as by diagnostic concordance (concordant or discordant) for ASD. Each individual’s ADI-R scores for 88 items covering five ASD traits (spoken language, nonverbal communication, play skills, social interactions, and perseverative behaviors) were downloaded from AGRE and were used to establish trait severity distribution profiles for each subgroup of twins (Figure 1, see legend for nomenclature used for different twin subgroups). Among discordant twins who do not meet the ADI-R diagnostic criteria for autism (i.e., non-autistic co-twins), the trait distribution profiles show noticeably lower severity, as indicated by lower cumulative trait scores, among the DZ twins in comparison to the MZ twins. On the other hand, the discordant MZ and DZ twins who received an autism diagnosis exhibited similar severity profiles across each trait which closely tracked the severity profiles of both MZ and DZ twins who were concordant for autism diagnosis.
Boxplots of the cumulative trait scores for each trait exhibit the same pattern of severity where the non-autistic DZ twins have a significantly lower average severity for each trait in comparison to the non-autistic MZ twins, but all ASD-diagnosed twins exhibit similar average trait severity scores, regardless of zygosity or concordance (Figure 2). The comparisons of average severity scores for all ADI-R items that comprise each trait also reveal significant differences (p-values ≤ 0.05) between the non-autistic MZ and DZ twins for a majority of the items (Figure 3). Taken together, the significantly higher trait severity of non-autistic MZ twins in comparison to non-autistic DZ twins supports the notion that genetics is a strong determinant of the severity of virtually all autistic traits and behaviors, even in undiagnosed individuals. On the other hand, the almost identical severity profiles of the concordantly autistic but genetically different DZ co-twins suggest that shared environment may also contribute to trait severity. However, the specific relationships among genotype, environmental factors, and ASD phenotypes remain unknown.

2.2. Genotype–Phenotype Relationships Revealed by Quantitative Trait Association Analyses

Scheme 1 illustrates the overall design and workflow for the genetic analyses conducted in this study. Based upon the severity differences in multiple traits exhibited in each of the subgroups of twins, we conducted a series of quantitative trait association analyses to discover SNPs that may associate with the phenotypic differences in trait severity. Quantitative trait association analyses were conducted using the cumulative trait scores for each individual in each twin subgroup and their respective genotyping data derived from the study by Wang et al. (2009). QTNs with unadjusted p-values ≤ 1 × 10⁻⁵ were selected for subsequent case-control association analyses. Results of the QTL analyses for each subgroup of twins are shown in Tables S1–S6 in Supplementary Materials. The combined sets of genes associated with the QTNs across all twin groups are shown in Table 1, with a Venn diagram showing the distribution of the overlapping genes among four of the five traits (Figure 4). Notably, there were no genes shared between those associated with perseverative behaviors and any of the other four traits. Hypergeometric distribution analyses of each set of QTN-associated genes indicated significant enrichment in genes from the SFARI database for all traits except non-verbal communication (Table 2).

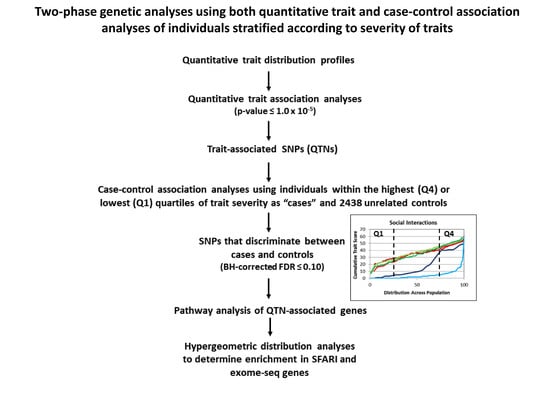
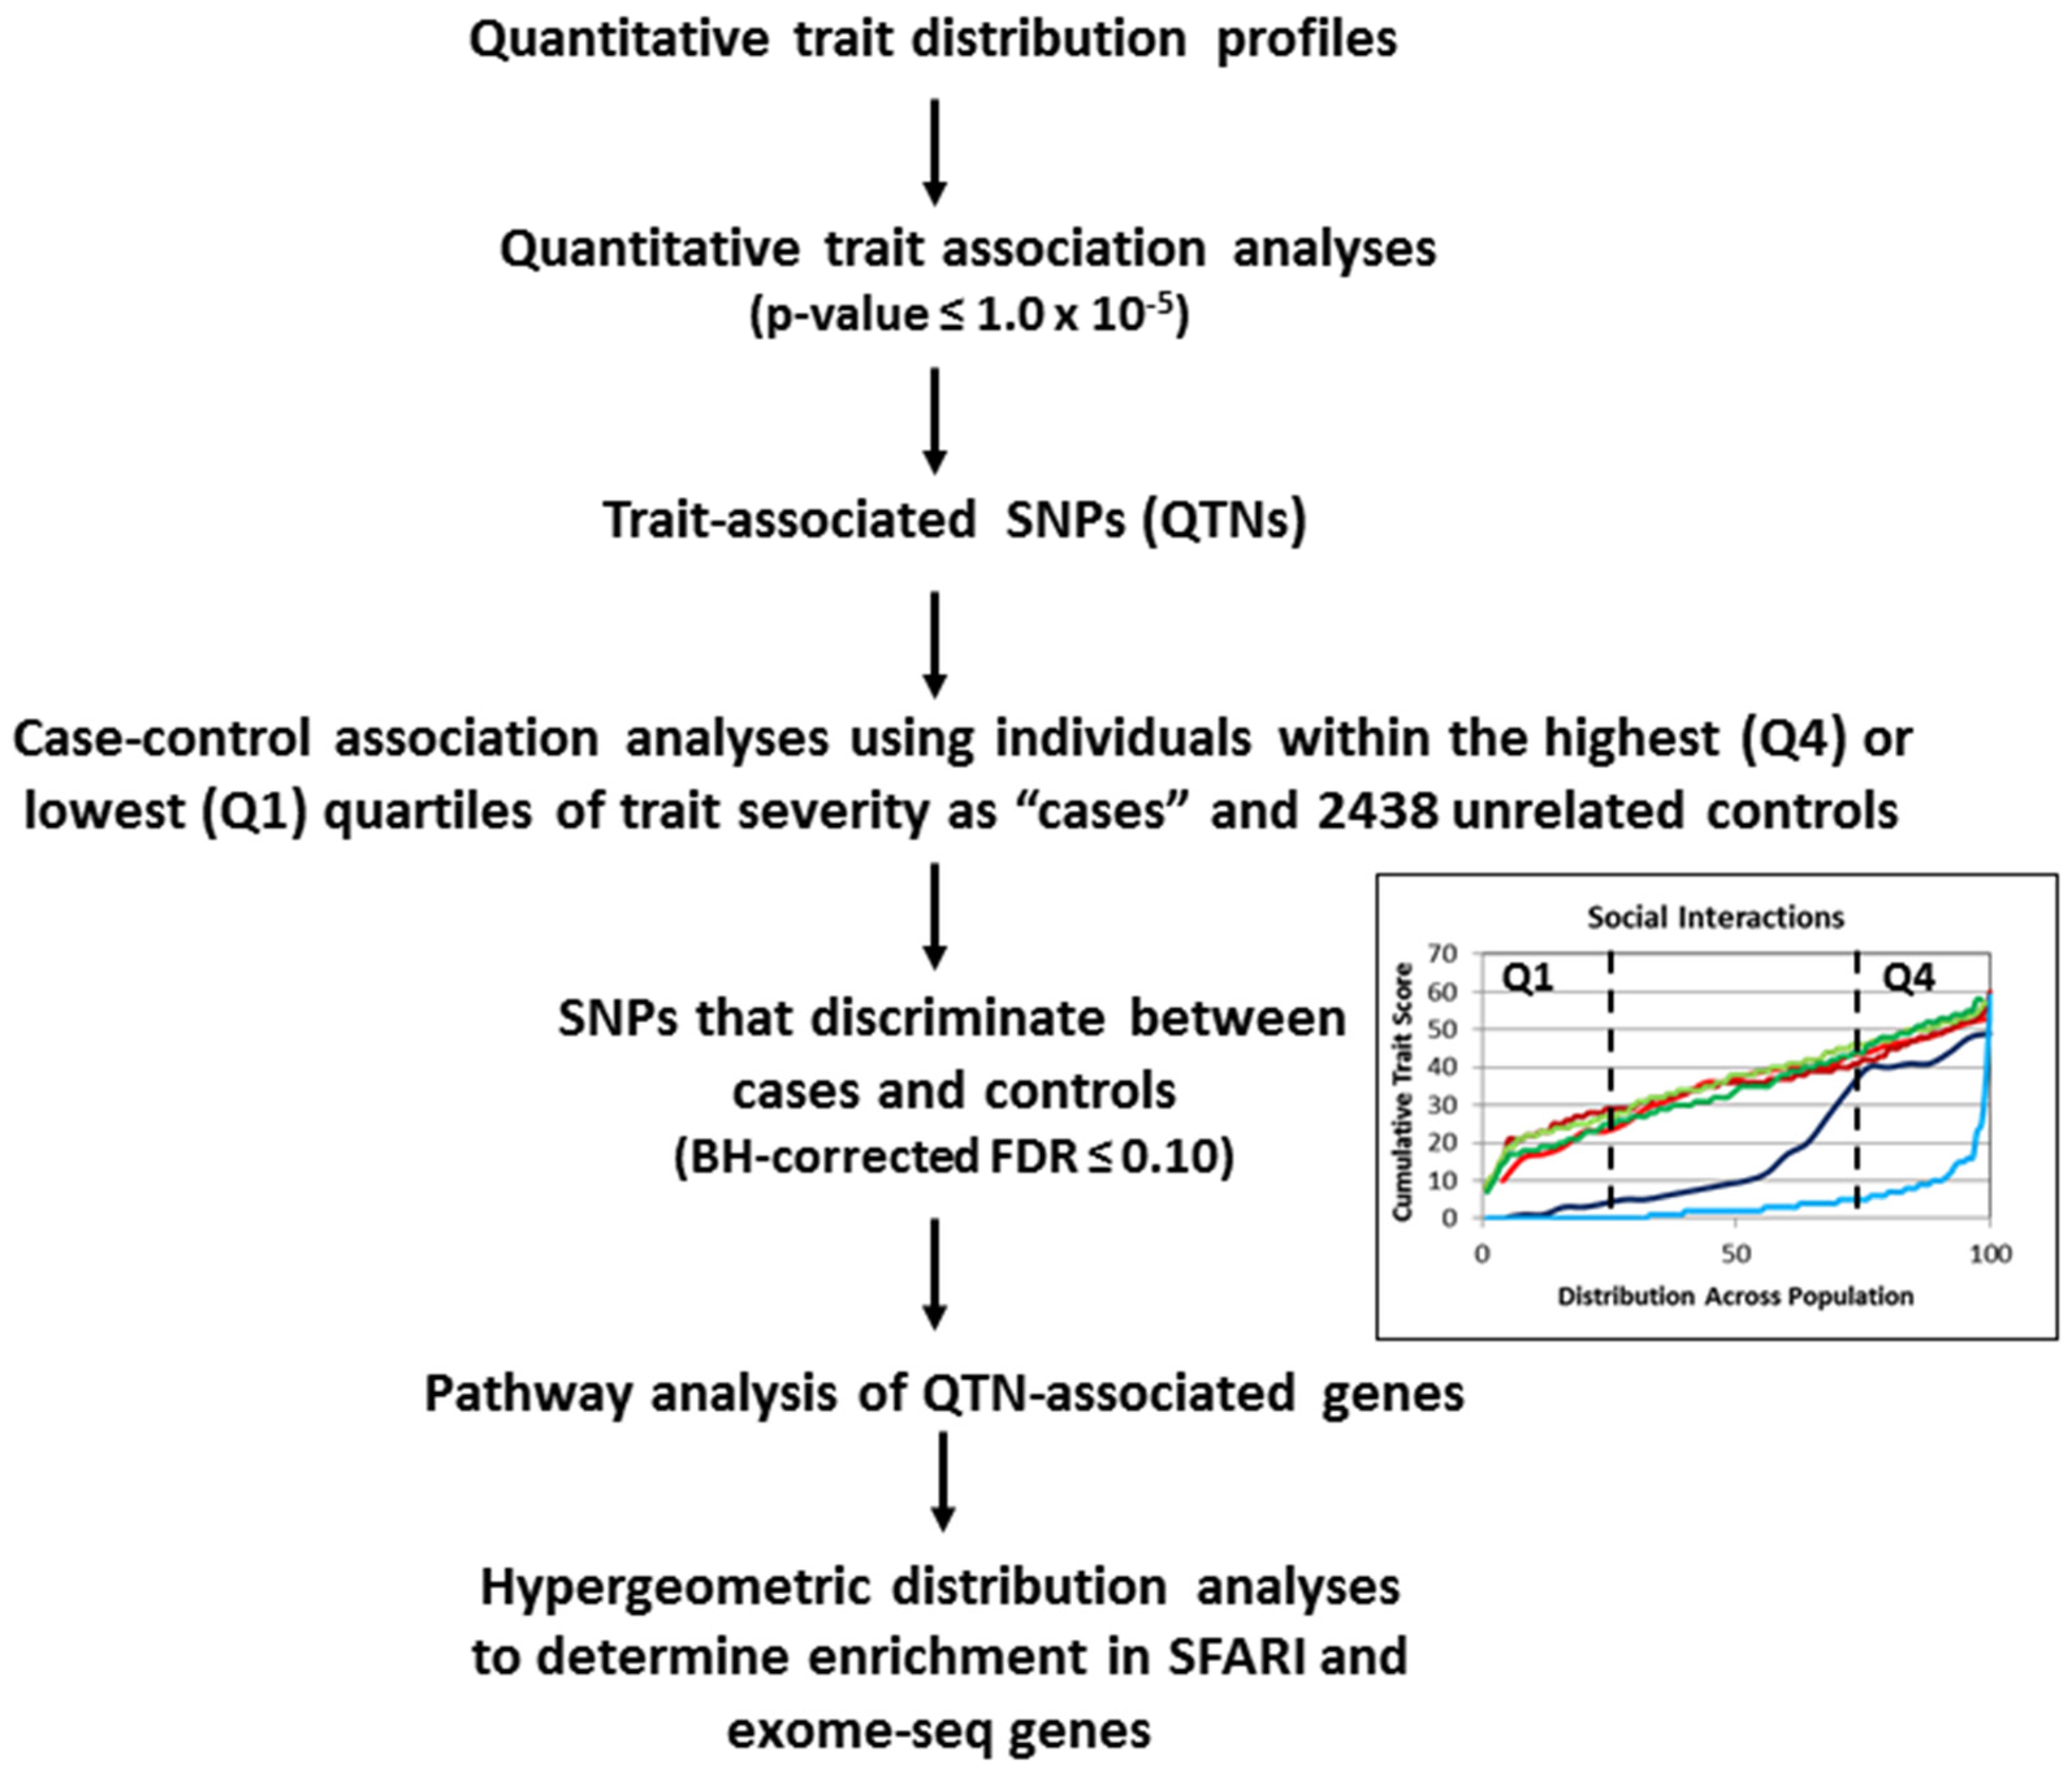
2.3. Case-Control Association Analyses Based on Individuals Stratified by Trait Severity for Each Subgroup of Twins

The SNPs used for case-control association analyses were limited to the trait-associated SNPs derived from QTL analyses involving the corresponding twin groups. Results of these case-control association analyses are presented in Tables S7–S12. Examination of these results for each set of twins reveals significant SNPs (corrected for multiple testing by Bonferroni and/or Benjamini–Hochberg methods) that differentiate between cases and controls. Moreover, for all SNPs that were found to be significantly associated with both the lowest quartile (Q1) and highest quartile (Q4) cases diagnosed with ASD, the minor allele frequencies (MAF) relative to that of controls were noticeably different, resulting in different odds ratios. That is, a specific trait-associated SNP that may be considered as predisposing to ASD in the Q4 subgroup with a high odds ratio (>1.0) was found to have a lower odds ratio (often <1.0) in the Q1 subgroup, further suggesting relevance to severity of that specific trait. Although a SNP may occasionally have a higher odds ratio in the Q1 than in the Q4 case group, the differences in MAFs still suggest that these subgroups based on trait severity are genetically distinct with respect to that genetic variant. Notably, the majority of significant SNPs in the non-autistic subgroups (dNA.MZ and dNA.DZ) were found in Q4, at the highest severity end of the trait distribution.

2.4. Enrichment of Known Autism Risk Genes from Case-Control Association Analyses

The SNP-associated genes derived from the case-control association analyses described above were compared to the complete set of autism risk genes that comprise the SFARI gene database. Table 3 shows that genes mapped to the trait-associated SNPs that are significant by case-control association analyses using individuals in both Q1 and Q4 as cases for each subgroup of twins are enriched among SFARI genes in three of the six twin groups (dNA.MZ, dNA.DZ, and cDZ). Together with the results shown in Table 2, these findings suggest that the experimental strategy of combining quantitative trait association analyses with case-control association analyses using cases stratified by trait severity is capable of identifying significant autism risk genes even with relatively small numbers of samples. Furthermore, the SNPs identified can be associated with severity of specific traits, thereby associating genotype with phenotype.

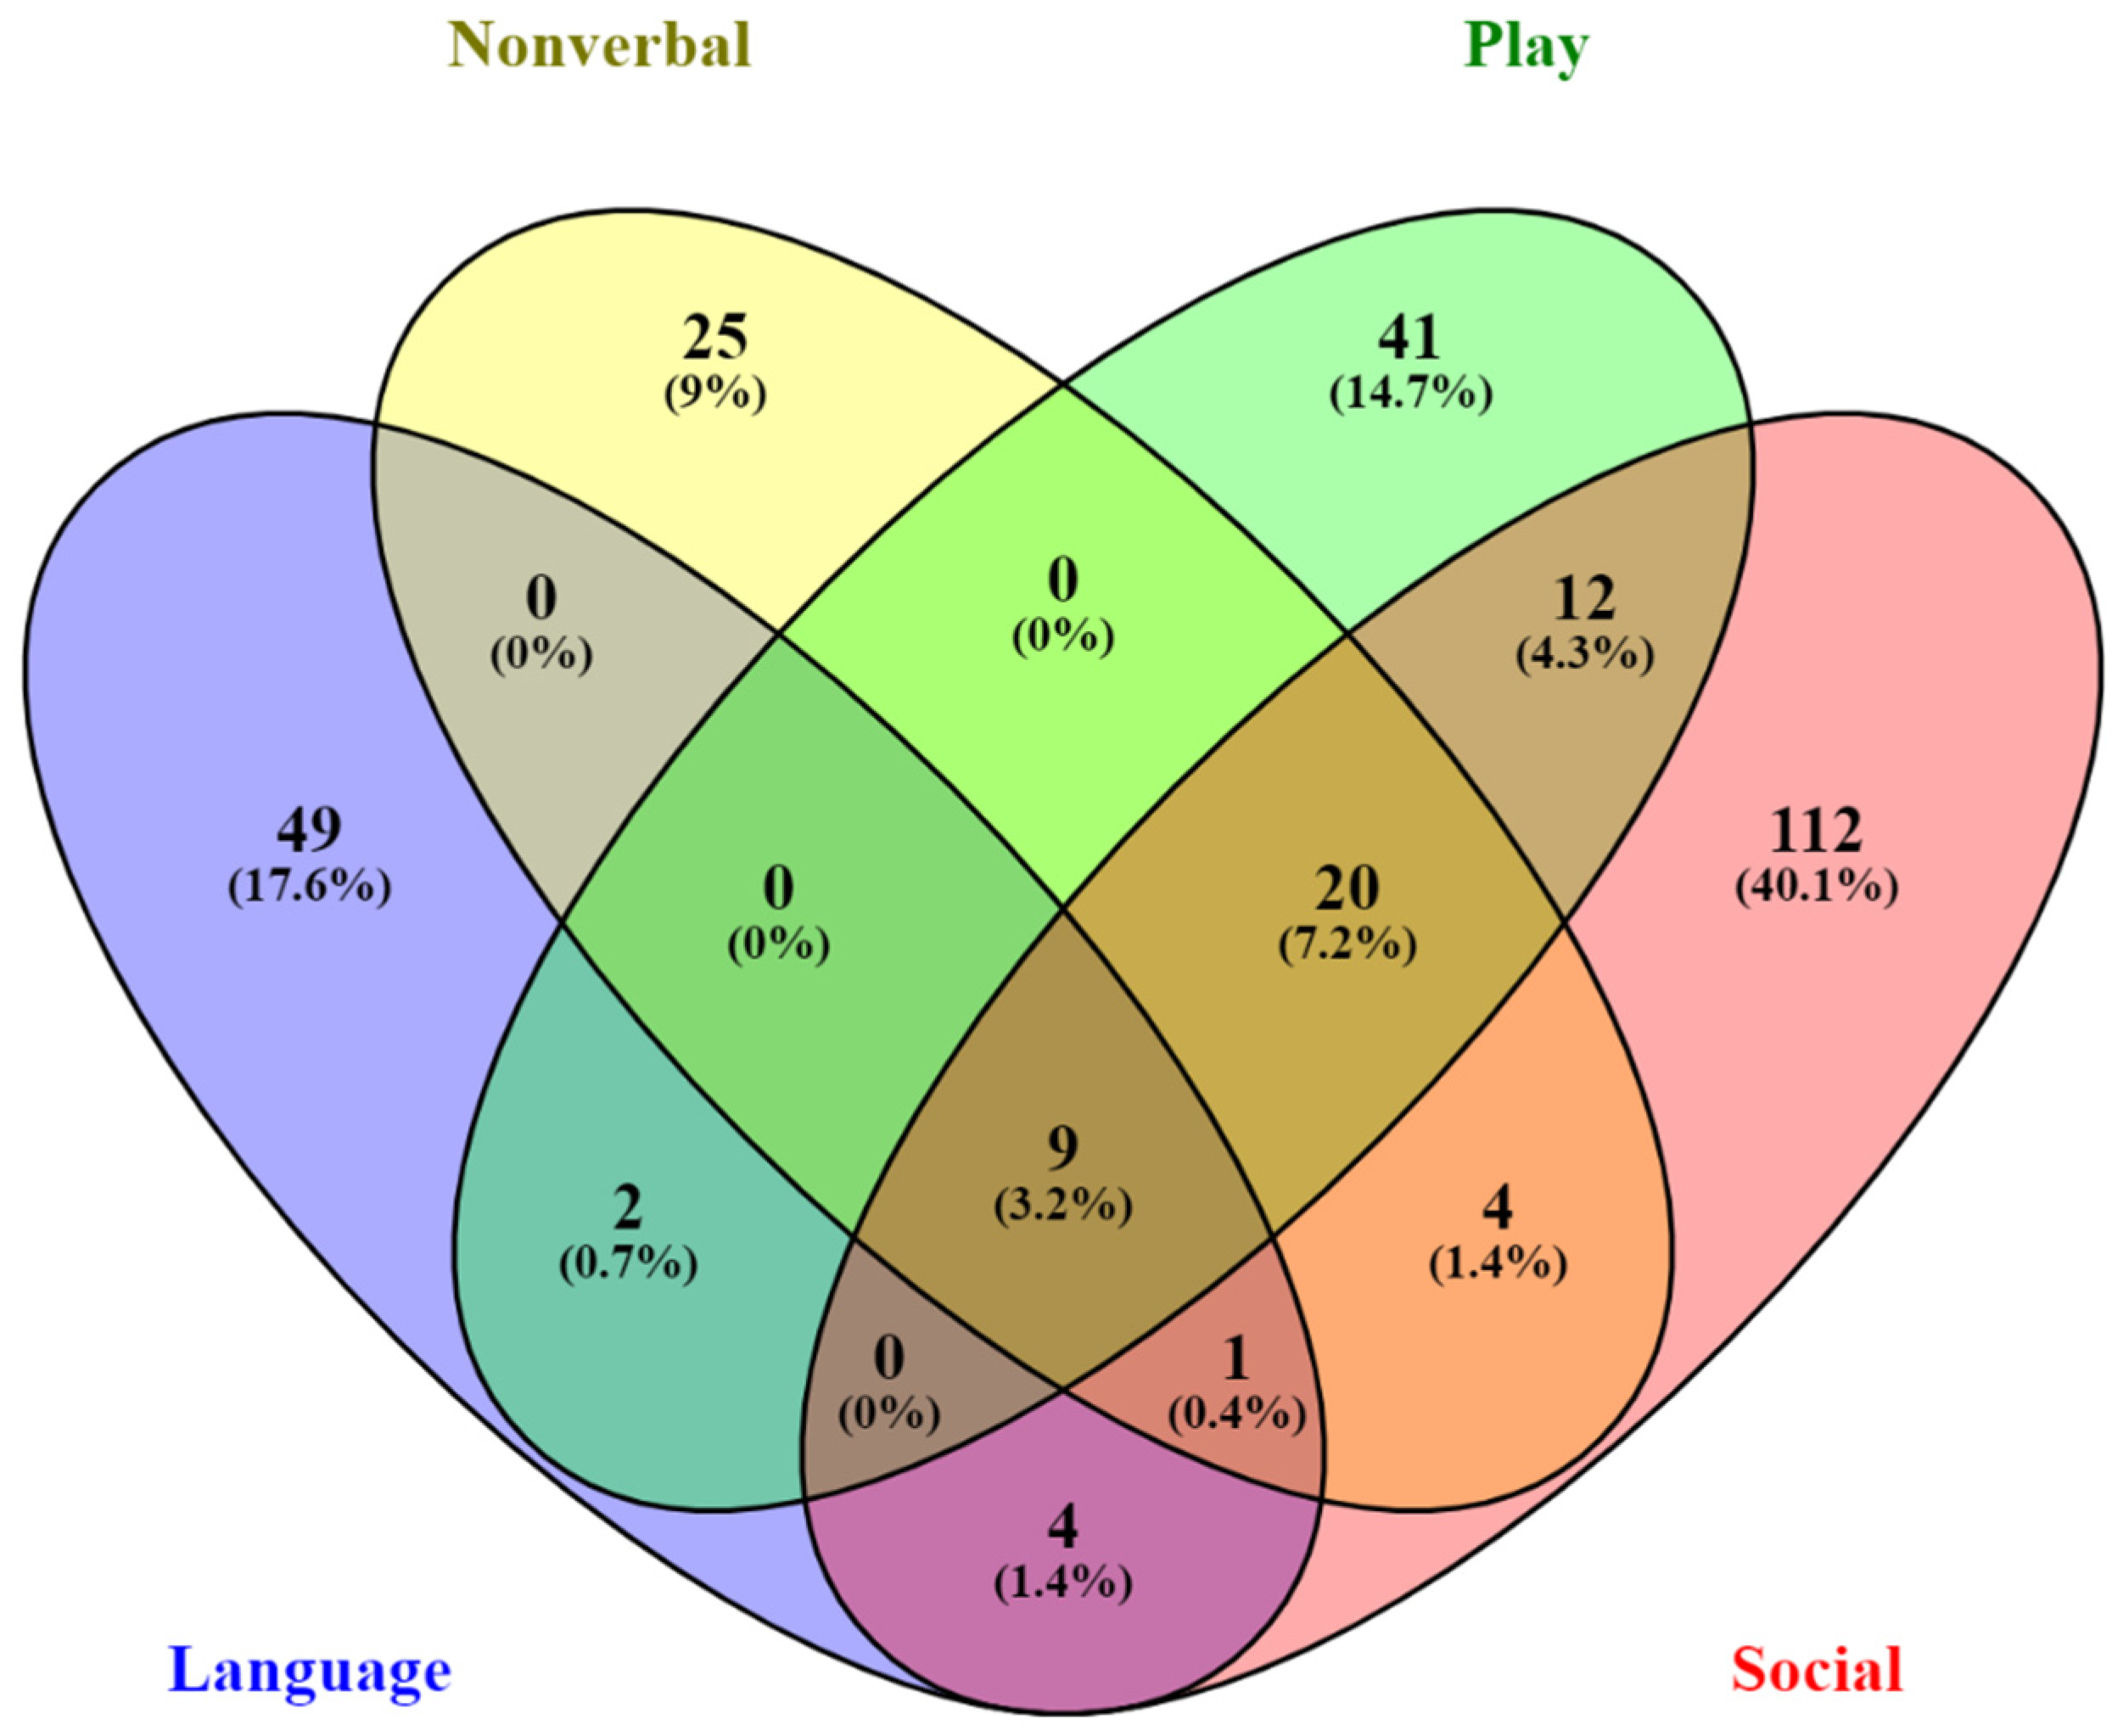
2.5. Functional Analysis of Genes Associated with QTNs from Quantitative Trait and Case-Control Association Analyses

Genes implicated by QTNs were analyzed using Ingenuity Pathway Analysis (IPA) software with a focus on identifying genes that impact nervous system development and function. Table 4, Table 5, Table 6, Table 7 and Table 8 show the neurological functions that are statistically enriched among genes implicated by QTNs associated with spoken language, nonverbal communication, play skills, social skills, and perseverative behaviors, respectively, for each subgroup of twins. Notably, many of the annotated functions are relevant to what is known about specific neuronal processes disrupted in ASD. Moreover, IPA analyses of genes associated with significant SNPs identified by case-control association analyses of both dNA.MZ and dNA.DZ subgroups in addition to the cDZ subgroup which are all enriched in SFARI genes also revealed significant over-representation of genes involved in neurological functions, behaviors, and disorders relevant to ASD, as shown in Table 9, Table 10 and Table 11, respectively.

2.6. Case-Control Association Analysis Using dNA.DZ Twins as Controls for dA.DZ Co-Twins

Given the differential diagnosis of discordant dizygotic twins with presumed genetic differences between the autistic and non-autistic co-twins, we conducted an exploratory case-control association analysis using the dNA.DZ twins (n = 36) as controls for the diagnosed dA.DZ co-twins (n = 38). Interestingly, over 140 genes were associated with a total of 390 SNPs that exhibited a nominal p-value ≤ 0.05 and odds ratio ≥ 3 (Table 12, complete case-control association data in Table S13). Hypergeometric distribution analyses showed that this set of genes was highly enriched for autism risk genes from the SFARI database (q = 1.84 × 10⁻⁷) and from an exome-sequencing study [23] (q = 4.64 × 10⁻⁸). Pathway analysis of this gene set using IPA revealed that netrin signaling (involving PRKG1, DCC, and PRKAG2) and axon guidance signaling (involving PRKCE, PDGFD, DCC, ROBO1, SLIT3, PRKAG2, NTNG1, PLCG2) were among the top 10 canonical pathways represented with Fisher’s Exact p-values of 2.56 × 10⁻³ and 6.18 × 10⁻³, respectively. Several of the above-mentioned genes (specifically, PRKCE, PRKAG2, and PLCG2) are also significantly over-represented in additional pathways potentially relevant to ASD, including melatonin signaling (p = 1.18 × 10⁻²) and synaptic long-term potentiation (p = 4.45 × 10⁻²). Functional analysis showed significant over-representation of many neurological processes commonly impacted by autism, notably neuritogenesis, axonogenesis, neuronal migration, and axon guidance (Table 13).

3. Discussion

The goals of this study were to: (1) examine the influence of genetics on specific behaviors and traits of ASD; (2) identify SNPs (i.e., QTNs) that associate with a particular ASD trait; (3) determine if trait QTNs can discriminate between cases and controls, where the cases are individuals at the extremes of phenotypic severity across five autistic traits; and (4) to identify pathways and functions implicated by the genes associated with the QTNs. To accomplish these goals, we developed a novel approach which utilized MZ and DZ twins who are either concordant or discordant for diagnosis of autism to reveal differences in phenotypic severity among and within the subgroups of twins defined by diagnostic status and by zygosity. Then, we used the phenotypic (trait) profiles of each subgroup of twins to perform quantitative trait association analyses to identify SNPs that may be functionally associated with the respective ASD trait (i.e., QTNs). Case-control association analyses were then performed with the QTNs for five autistic behavioral traits using the six different subgroups of twins at the extreme ends (i.e., lowest and highest quartiles) of the respective quantitative trait distribution curves as cases and a large group of unrelated controls. We show here that this novel combination of experimental strategies allowed us to identify significant SNPs that could distinguish individuals with autism from controls. Genes harboring these SNPs are significantly enriched for autism risk genes annotated by SFARI Gene.

3.1. Severity of Autistic Traits Are Strongly Influenced by Genetics

Numerous studies using both monozygotic and dizygotic twins have sought to determine the role of genetics versus environment with varying results, as described earlier. The quantitative trait distribution profiles generated in this study demonstrate significant differences in severity between clinically discordant non-autistic MZ and DZ co-twins, with the profiles of the MZ twins being significantly more severe than DZ twins across all traits, while the profiles of all diagnosed twins are virtually indistinguishable from each other, regardless of zygosity (Figure 1 and Figure 2). These differences in trait severity between the non-autistic MZ and DZ twins are seen even at the most fundamental level, that is, at the level of specific ADI-R items which comprise each trait, demonstrating the strong influence of genetics on a broad spectrum of ASD-associated behaviors and characteristics (Figure 3). In other words, a non-autistic identical twin exhibits a significantly higher severity of autistic traits in comparison to an undiagnosed non-identical twin who shares only a part of his/her autistic co-twin’s genes.

3.2. Quantitative Trait Association Analyses Reveal SNPs that Associate with a Specific ASD Trait

QTL association analyses allowed us to discover SNPs that may be functionally relevant to autism traits. The genes associated with trait QTNs (Table 1) are over-represented in a number of neurological functions related to autism. The neurological functions associated with each set of trait genes are shown in Table 4, Table 5, Table 6, Table 7 and Table 8. SNPs associated with spoken language implicate genes involved in cell–cell adhesion of neurons, axon guidance and fasciculation, GABA-mediated receptor currents, and morphology of different brain regions, including the cerebral cortex, cerebellum, and corpus callosum, which are all impacted in ASD (Table 4). Another set of SNPs associated with nonverbal communication implicate genes that play a role in cell–cell adhesion of astrocytes, organization and morphology of mossy fibers, axon pruning, migration of pyramidal neurons, and synaptic transmission of collateral synapses (Table 5). SNPs associated with play skills highlight genes involved in dendritic spine formation, synaptic transmission, and long-term potentiation of Purkinje cells (Table 6). Purkinje cell morphology, neurotransmission, axonogenesis, and differentiation of motor neurons are functions over-represented among genes associated with social QTNs (Table 7). QTNs associated with perseverative behaviors point to genes involved in epileptic encephalopathy, loss of hippocampal neurons, and certain higher level functions such as social transmission of food preference, mating, spatial learning, and motor learning (Table 8). Interestingly, the genes associated with the QTNs for perseverative behaviors do not overlap with those associated with any of the other traits, while there is an overlap of 20 genes harboring QTNs for nonverbal, play and social skills (Figure 4), suggesting interrelated proficiencies involving the latter functions. These studies thus help to link genotype to genes and phenotypes and reveal some of the biological processes that may underlie specific ASD traits. The relevance of the above-described neurological functions to ASD further suggested that some of these QTNs may be able to distinguish cases from controls.

3.3. Trait-Associated QTNs Can Discriminate between Cases and Controls

Case-control association analyses using individuals at the extremes of phenotypic (i.e., trait) severity (Q1 and Q4) as cases enabled the identification of significant trait QTNs that were demonstrated to discriminate between cases and controls. This approach allowed reduction in the phenotypic heterogeneity of the individuals within each subgroup of twins for genetic analyses. In fact, genetic differences between the first and fourth quartiles of trait severity for all twin subgroups are quite clear. Notably, for SNPs associated with both Q1 and Q4 subgroups, the odds ratios for the two extreme groups are distinctly different and often in opposite directions (that is, greater or less than 1) relative to unrelated controls (Tables S7–S12), thereby supporting the associative nature of the specific SNP with that particular trait. Thus, the genetic heterogeneity of cases with respect to these trait-associated SNPs reflects the phenotypic heterogeneity of individuals at the extreme ends of the trait distribution profiles. In addition, hypergeometric distribution analyses of the genes derived from case-control analyses of twin subgroups show significant enrichment in SFARI autism risk genes in three of the twin subgroups (dNA.MZ, dNA.DZ, and cDZ) (Table 3). The over-representation of SFARI-annotated autism risk genes among those revealed here through case-control analyses indicates that the reduction in heterogeneity of cases at the extremes of the trait spectrum allows the detection of significant genetic variants differentiating cases and controls with relatively few samples, while also implicating novel ASD-associated genes that may be replicated by future studies. Although there is precedence for the use of individuals at the extremes of autistic traits for phenotype analyses [24,25,26,27], no other study has utilized individuals within these phenotypically extreme populations for genome-wide genetic association analyses.

3.4. Genetic Differences between Discordant DZ Twins Strongly Associate with Autism Risk Genes

The availability of genome-wide genotype data for both autistic and non-autistic DZ co-twins in our study prompted us to examine the feasibility of performing a case-control analysis in which the group of non-autistic DZ twins was used as a control for the group of autistic co-twins. Although none of the 3400 SNPs with raw p-values ≤ 0.05 remained significant after correction for multiple testing, there were 390 SNPs with nominal p-values ≤ 0.05 and odds ratios ≥ 3 (ranging from 3 to 11) (Table S13). Hypergeometric distribution analysis of the 146 SNP-associated protein-coding genes showed significant enrichment in ASD-risk genes annotated by SFARI Gene as well as in genes revealed by exome sequencing [23]. Table 13 shows that this set of genes is highly enriched for ASD-associated neuronal functions including development, migration and pathfinding of neurons, neuritogenesis, axonogenesis, and guidance of axons, as well as synaptic development and transmission.
While the use of discordant non-autistic DZ twins as a control group for their autistic co-twins in case-control association analyses may seem unconventional, there is precedence for family-based genetic studies in which concordant MZ twin pairs were compared against their parents by whole genome and exome sequencing, with each study revealing novel and rare variants in the probands [28,29]. The use of both concordant and discordant MZ and DZ twins to investigate the contribution of pre-and post-zygotic de novo CNVs to ASD and other neurodevelopmental disorders [30] further illustrates the value of using diagnostic concordance and discordance in dissecting the complex genetic underpinnings of ASD.

3.5. Advantages and Limitations of Study Design

An advantage of quantitative trait association analysis is that it allows the identification of SNPs that may potentially be more functionally related to the condition, thus reducing the number of SNPs to be considered for further case-control association analyses. A possible disadvantage is that this procedure may exclude some ASD-relevant but not trait-associated SNPs from case-control analyses. Another limitation is that we did not separately analyze male and female twins due to the relatively small and variable number of females in the different subgroups of twins, and thus cannot eliminate sex as a confounding factor. However, a prior analysis of affected males and females from the AGRE repository using cluster analyses of ADI-R scores as described previously [17] showed no obvious sex differences in subphenotypes [31].
Because of the extreme heterogeneity of ASD, there has been increasing attempts to stratify or subgroup individuals with ASD by specific phenotypes to obtain more homogeneous sample groups for large-scale genetics analyses. While some autism studies have been conducted using individuals at the top 5% of an autistic trait [24,25,27,32], no other study has performed genetic case-control association analyses on subgroups of twins stratified by trait severity in this manner. Although the use of both MZ and DZ twins at the extremes of trait severity reduces the genetic heterogeneity of ‘cases’ when compared against a large group of unrelated controls, sample sizes at these extremes are a limitation of this study. Another limitation is that there is no empirical validation of the significant SNPs identified by case-control analyses as this was purely an in silico study, and we did not have access to the twins’ biological samples for follow-up genotype analyses. On the other hand, the identification of some significant SNPs (with different odds ratios) for samples in the first and fourth quartiles of trait severity in case-control analyses replicates the association of those SNPs with ASD in distinct subgroups of individuals. Despite these limitations, case-control analyses revealed a number of significant trait-associated SNPs that implicate genes that converge on certain neurological functions associated with ASD, suggesting that disruption of those functions or pathways may play a role in the manifestation of that specific trait in ASD. Notably, multiple genes are associated with each of the five traits reflecting the multi-genic nature of ASD, even at these fundamental levels. However, no information is available on the functional significance of the specific SNPs with respect to gene regulation or to protein function and expression, and many SNPs are in noncoding regions which require further exploration.
Case-control association analyses using clinically discordant DZ twins as both cases and controls, while underpowered, identified a large number of nominally significant SNPs associated with genes that are significantly enriched in autism risk genes. While this study shows that reduction of genetic heterogeneity by stratification of cases according to trait severity or by use of discordant DZ twins as cases and controls increases the ability to identify common genetic variants associated with ASD, future studies with greater numbers of individuals in each subgroup are required to replicate these findings.

4. Summary

We present here a novel experimental design using MZ and DZ twins, either concordant or discordant for ASD, which evaluates the role of genetics in contributing to the severity of autistic traits and identifies significant SNPs that can distinguish cases from unaffected controls by capitalizing on the extreme phenotypic differences exhibited especially by discordant MZ and DZ twins. Although prior studies have consistently indicated that genetics is a major contributor to the overall diagnosis of ASD, deep phenotypic profiling shows that almost all ASD traits are significantly more severe in non-autistic MZ twins than in non-autistic DZ twins, suggesting a dominant influence of genotype on ASD phenotypes probed by the majority of items on the ADI-R diagnostic instrument [16]. At the same time, the similarity of trait-severity profiles among all autistic subgroups suggests that the ADI-R, often considered the gold-standard instrument for autism diagnostics, captures the essential components of ASD across the ASD population.
Quantitative trait association analyses using ASD trait profiles reveal SNPs (QTNs) associated with genes that provide meaningful insight into neurological functions and pathways commonly associated with ASD, thus linking genotype to phenotype (i.e., specific traits) as well as to underlying molecular pathology. Moreover, reducing phenotypic heterogeneity by using individuals at the extremes of trait severity for case-control association analyses with the trait-associated QTNs resulted in the identification of SNPs that significantly discriminate both affected and non-autistic co-twins from a large group of unrelated controls. These results suggest an underlying genetic liability towards autistic traits, even in the undiagnosed individuals (i.e., non-autistic co-twins). Genes implicated by the QTNs that survive correction for multiple testing in case-control association analyses are statistically enriched in ASD-associated genes revealed by significant overlap with those in the SFARI Gene database. Finally, case-control association analysis using dA.DZ twins as cases and their discordant non-autistic co-twins (dNA.DZ) as ‘controls’ also reveals a large number of neurologically relevant genes that are significantly over-represented in both SFARI Gene and exome sequencing datasets.

5. Materials and Methods

5.1. ASD Subphenotype Analysis and Generation of Trait Severity Distribution Profiles

Detailed demographic information of the 284 pairs of twins included in this study is shown in Table S14. Of these sets of twins, 88 monozygotic (MZ) pairs were concordant for diagnosis of ASD, while 25 MZ pairs were discordant. Among the dizygotic (DZ) twins, 56 pairs were concordantly autistic, while 115 pairs were discordant for diagnosis. As mentioned earlier, we label the concordant autistic MZ and DZ twin subgroups as cMZ and cDZ, respectively, and the discordant autistic (dA) and non-autistic (dNA) MZ and DZ twin subgroups as dA.MZ, dA.DZ, dNA.MZ, and dNA.DZ, respectively. ADI-R diagnostic scoresheets for all sets of twins were downloaded from the AGRE repository. It should be noted that ADI-R scoresheets were available for both the autistic and non-autistic (discordant) co-twins in order to establish concordance. Raw scores for 88 items from the ADI-R scoresheet which related to five ASD traits (spoken language, nonverbal communication, play skills, social skills, and perservative behaviors) were extracted from each individual’s scoresheet, and the ADI-R scores were then adjusted according to previously described methods [17]. The specific items related to each trait are shown in Table S15. The average score for each ADI-R item, as well as the cumulative score for a specific trait, was calculated for each of the six twin subgroups. Quantitative trait distribution profiles for each twin subgroup were created by graphing each individual’s cumulative score for each trait. To account for differences in the number of individuals in the different subgroups of twins, the total number of individuals in each subgroup was normalized to 100 to facilitate graphical comparisons between trait severity distribution profiles based on zygosity as well as on diagnostic concordance or discordance. The student’s two-sample t-test in the StatPac statistical software package (https://statpac.com/index.htm) was used to determine significance of differences in severity scores of overall ASD traits and specific ADI-R items based on p-values ≤ 0.05.

5.2. Source of Genetic Data

Genome-wide genotype data for the twins and 2438 unaffected (non-autistic) controls were derived from a previously published genome-wide association study (GWAS) by Wang et al. [33], with data previously cleaned by Jennifer K. Lowe in the laboratory of Daniel H. Geschwind, M.D., Ph.D. at UCLA. Briefly, genotyping data were generated on Illumina HumanHap550 BeadChip arrays with over 550,000 SNP markers. Quality control procedures required DNA samples to have ≥ 0.95 call rate with minor allele frequency ≥ 0.05, and p-values testing significant deviation from Hardy–Weinberg equilibrium that were ≥ 0.001. Only subjects of European ancestry were genotyped and thus, only Caucasian twins could be included in the genetic association analyses, eliminating concerns about population stratification as a confounding factor. This publicly available dataset contained the genotypes for 74.3% of MZ twins (85 pairs) and ~85.4% of DZ twins (146 pairs) in this study. Controls were comprised of 2438 unrelated non-autistic individuals of European ancestry for whom genome-wide genotyping data was also available from the same GWAS study [33]. The workflow for the genetic association analyses performed on the twin data is shown in Scheme 1 for clarity.

5.3. Quantitative Trait Loci (QTL) Association Analyses

PLINK 1.07 software [34] was used to perform all genetic association analyses. Quantitative trait association analyses utilized the cumulative trait scores and the respective genotype data from the above-mentioned dataset for each individual within a specific twin subgroup as previously described [19]. Single nucleotide polymorphisms (SNPs) with unadjusted p-value ≤ 1.0 × 10⁻⁵ were identified as QTNs which were subsequently used in case-control association analyses as described below. The overlap of trait-associated genes implicated by the SNPs was determined using Venny 2.1.0, an online software package for creating Venn diagrams [35].

5.4. Case-Control Association Analyses

To reduce ASD heterogeneity for genetic analyses, only cases at the extremes of a defined ASD trait were used in separate case-control association analyses. These individuals exhibited cumulative trait severity scores within the first or fourth quartiles. The first quartile (Q1) was comprised of twins who exhibited the least severe phenotype for that trait and the fourth quartile (Q4) was comprised of twins who exhibited the highest severity for that trait. Cumulative trait scores at Q1 and Q4 for each subgroup of twins were determined using Tyers Box Plot software [36] (see Scheme 1 and Figure 2). Individuals with cumulative scores less than or equal to that determined by Q1 and greater than or equal to that determined by Q4 were used in case-control association analyses against 2438 unrelated controls from the study of Wang et al. [33], focusing on the SNPs discovered by QTL analysis. Discordant non-autistic twins for whom genome-wide genotyping data were available were also stratified and analyzed in the same way. Because only one individual of a pair of MZ twins was included in the original genome-wide genotyping analysis [33], the genotype data of each dA.MZ twin was used for his or her respective dNA.MZ co-twin in case-control analyses. SNPs were considered significant if the adjusted Benjamini–Hochberg FDR was ≤ 0.10.

5.5. SNP Annotation and Functional Analyses of Associated Genes

Significant SNPs were annotated using SNPper [37] and/or SNPnexus [38]. Both are web-based applications that allow downloading of information on SNPs according to user-defined criteria, such as chromosomal position, band, alleles, closest gene, role (e.g., coding exon, promoter, intron, 3′-UTR), amino acid change, and position. The SNP-associated genes were analyzed using Ingenuity Pathway Analysis (IPA) software (QIAGEN, Redwood City, CA) with a focus on genes involved in neurological functions and pathways. Significance for enrichment of genes associated with a particular pathway or function included in IPA’s Knowledgebase was determined by right-tailed Fisher’s exact test (p-value ≤ 0.05).

5.6. Hypergeometric Distribution Analyses for Gene Enrichment

SNP-associated genes were then compared to a list of known autism risk genes in the SFARI Gene database [39] and/or a list of ASD-associated genes identified by an exome sequencing study [23]. Hypergeometric distribution probabilities for over-representation of overlapped genes within the SFARI dataset or among ASD genes identified by exome sequencing were calculated using the CASIO Keisan Online Calculator (http://keisan.casio.com/exec/system/1180573201), with significance determined by an upper cumulative q-value ≤ 0.05.

6. Conclusions

Deep phenotyping analysis of monozygotic and dizygotic twins concordant or discordant for diagnosis of ASD indicates that the identical genotype of non-autistic MZ twins with their respective affected co-twins strongly influences the severity of autistic traits in comparison to the trait severity expressed by non-autistic DZ twins. Quantitative trait association analyses using trait distribution profiles and genotype data for the respective twin groups identify SNPs linked to traits. Case-control association analyses using these QTNs and individuals at the extremes of trait distribution profiles reveal significant SNPs associated with genes that are functionally significant to the known pathobiology of ASD. Finally, we suggest that more effective treatment strategies may be derived by associating specific phenotypes with genotype-implicated genes and related functional deficits manifested by a given subgroup of individuals.

Supplementary Materials

Supplementary materials can be found at https://0-www-mdpi-com.brum.beds.ac.uk/1422-0067/20/15/3804/s1, Table S1: All trait QTNs for cMZ twins, Table S2: All trait QTNs for dA.MZ twins, Table S3: All trait QTNs for dNA.MZ twins, Table S4: All trait QTNs for cDZ twins, Table S5: All trait QTNs for dA.DZ twins, Table S6: All trait QTNs for dNA.DZ twins, Table S7: Case-control by quartile analysis of cMZ twins, Table S8: Case-control by quartile analysis of dA.MZ twins, Table S9: Case-control by quartile analysis of dNA.MZ twins, Table S10: Case-control by quartile analysis of cDZ twins, Table S11: Case-control by quartile analysis of dA.DZ twins, Table S12: Case-control by quartile analysis of dNA.DZ twins, Table S13: Case-control analysis using dA.DZ as cases and dNA.DZ as controls, Table S14: Demographic information for all twins from AGRE repository, Table S15: ADI-R items used for quantitative trait severity profiles and analyses.

Author Contributions

Conceptualization, V.W.H.; Phenotype analysis, C.A.D.; Genetic analyses, V.W.H.; SNP annotation and hypergeometric analyses, J.J.D. and V.W.H.; Original draft preparation, V.W.H. and C.A.D.; Review and editing, C.A.D., J.J.D., and V.W.H.; Supervision, V.W.H.

Acknowledgments

This research received no external funding. This study was an in silico reanalysis of existing genome-wide genotyping data. The authors are grateful to Zohreh Talebizadeh (Children’s Mercy Hospital, Kansas City, MO, USA) and Olivia Veatch (Univ. of Pennsylvania, Philadelphia, PA, USA) for helpful discussion and comments on a draft of the manuscript.

Conflicts of Interest

The authors declare no conflict of interest.

References

  1. American Psychiatric Association. Diagnostic and Statistical Manual of Mental Disorders (DSM-5); American Psychiatric Publishing: Washington, DC, USA, 2013. [Google Scholar]
  2. Masi, A.; DeMayo, M.M.; Glozier, N.; Guastella, A.J. An overview of autism spectrum disorder, heterogeneity and treatment options. Neurosci. Bull. 2017, 33, 183–193. [Google Scholar] [CrossRef] [PubMed]
  3. Bailey, A.; Le Couteur, A.; Gottesman, I.; Bolton, P. Autism as a strongly genetic disorder: Evidence from a british twin study. Psychol. Med. 1995, 25, 63–77. [Google Scholar] [CrossRef] [PubMed]
  4. Ronald, A.; Hoekstra, R.A. Autism spectrum disorders and autistic traits: A decade of new twin studies. Am. J. Med. Genet. Part B Neuropsychiatr. Genet. 2011, 156, 255–274. [Google Scholar] [CrossRef] [PubMed]
  5. Trouton, A.; Spinath, F.M.; Plomin, R. Twins Early Development Study (TEDS): A multivariate, longitudinal genetic investigation of language, cognition and behavior problems in childhood. Twin Res. 2002, 5, 444–448. [Google Scholar] [CrossRef] [PubMed]
  6. Mevel, K.; Fransson, P.; Bölte, S. Multimodal brain imaging in autism spectrum disorder and the promise of twin research. Autism 2015, 19, 527–541. [Google Scholar] [CrossRef]
  7. Frans, E.M.; Sandin, S.; Reichenberg, A.; Långström, N.; Lichtenstein, P.; McGrath, J.J.; Hultman, C.M. Autism risk across generations: A population-based study of advancing grandpaternal and paternal age. JAMA Psychiatry 2013, 70, 516–521. [Google Scholar] [CrossRef]
  8. Bölte, S.; Willfors, C.; Berggren, S.; Norberg, J.; Poltrago, L.; Mevel, K.; Coco, C.; Fransson, P.; Borg, J.; Sitnikov, R.; et al. The roots of autism and ADHD twin study in Sweden (RATSS). Twin Res. Hum. Genet. 2014, 17, 164–176. [Google Scholar] [CrossRef]
  9. Hallmayer, J.; Cleveland, S.; Torres, A.; Phillips, J.; Cohen, B.; Torigoe, T.; Miller, J.; Fedele, A.; Collins, J.; Smith, K.; et al. Genetic heritability and shared environmental factors among twin pairs with autism. Arch. Gen. Psychiatry 2011, 68, 1095–1102. [Google Scholar] [CrossRef]
  10. Gaugler, T.; Klei, L.; Sanders, S.J.; Bodea, C.A.; Goldberg, A.P.; Lee, A.B.; Mahajan, M.; Manaa, D.; Pawitan, Y.; Reichert, J.; et al. Most genetic risk for autism resides with common variation. Nat. Genet. 2014, 46, 881–885. [Google Scholar] [CrossRef] [Green Version]
  11. Tick, B.; Bolton, P.; Happé, F.; Rutter, M.; Rijsdijk, F. Heritability of autism spectrum disorders: A meta-analysis of twin studies. J. Child Psychol. Psychiatry Allied Discip. 2016, 57, 585–595. [Google Scholar] [CrossRef]
  12. Colvert, E.; Tick, B.; McEwen, F.; Stewart, C.; Curran, S.R.; Woodhouse, E.; Gillan, N.; Hallett, V.; Lietz, S.; Garnett, T.; et al. Heritability of autism spectrum disorder in a UK population-based twin sample. JAMA Psychiatry 2015, 72, 415–423. [Google Scholar] [CrossRef] [PubMed]
  13. Taylor, M.J.; Gustafsson, P.; Larsson, H.; Gillberg, C.; Lundström, S.; Lichstenstein, P. Examining the association between autistic traits and atypical sensory reactivity: A twin study. J. Am. Acad. Child Adolesc. Psychiatry 2018, 57, 96–102. [Google Scholar] [CrossRef] [PubMed]
  14. Lewis, G.J.; Shakeshaft, N.G.; Plomin, R. Face identity recognition and the social difficulties component of the autism-like phenotype: Evidence for phenotypic and genetic links. J. Autism Dev. Disord. 2018, 48, 2758–2765. [Google Scholar] [CrossRef] [PubMed]
  15. Isaksson, J.; Van’t Westeinde, A.; Cauvet, É.; Kuja-Halkola, R.; Lundin, K.; Neufeld, J.; Willfors, C.; Bolte, S. Social cognition in autism and other neurodevelopmental disorders: A co-twin control study. J. Autism Dev. Disord. 2019, 49, 2838–2848. [Google Scholar] [CrossRef] [PubMed]
  16. Lord, C.; Rutter, M.; Couteur, A.L. Autism diagnostic interview-revised: A revised version of a diagnostic interview for caregivers of individuals with possible pervasive developmental disorders. J. Autism Dev. Disord. 1994, 24, 659–685. [Google Scholar] [CrossRef] [PubMed]
  17. Hu, V.W.; Steinberg, M.E. Novel clustering of items from the autism diagnostic interview-revised to define phenotypes within autism spectrum disorders. Autism Res. 2009, 2, 67–77. [Google Scholar] [CrossRef] [PubMed]
  18. Hu, V.W.; Sarachana, T.; Kim, K.S.; Nguyen, A.; Kulkarni, S.; Steinberg, M.E.; Luu, T.; Lai, Y.; Lee, N.H. Gene expression profiling differentiates autism case-controls and phenotypic variants of autism spectrum disorders: Evidence for Circadian rhythm dysfunction in severe autism. Autism Res. 2009, 2, 78–97. [Google Scholar] [CrossRef]
  19. Hu, V.W.; Addington, A.; Hyman, A. Novel autism subtype-dependent genetic variants are revealed by quantitative trait and subphenotype association analyses of published GWAS data. PLoS ONE 2011, 6, e19067. [Google Scholar] [CrossRef]
  20. Talebizadeh, Z.; Arking, D.E.; Hu, V.W. A novel stratification method in linkage studies to address inter and intra family heterogeneity in autism. PLoS ONE 2013, 8, e67569. [Google Scholar] [CrossRef]
  21. Veatch, O.J.; Pendergast, J.S.; Allen, M.J.; Leu, R.M.; Johnson, C.H.; Elsea, S.H.; Malow, B.A. Genetic variation in melatonin pathway enzymes in children with autism spectrum disorder and comorbid sleep onset delay. J. Autism Dev. Disord. 2014, 45, 100–110. [Google Scholar] [CrossRef]
  22. Talebizadeh, Z.; Shah, A.; DiTacchio, L. The potential role of a retrotransposed gene and a long noncoding RNA in regulating an X-linked chromatin gene (KDM5C): Novel epigenetic mechanism in autism. Autism Res. 2019, 12, 1007–1021. [Google Scholar] [CrossRef]
  23. Iossifov, I.; O’Roak, B.J.; Sanders, S.J.; Ronemus, M.; Krumm, N.; Levy, D.; Stessman, H.A.; Witherspoon, K.T.; Vives, L.; Patterson, K.E.; et al. The contribution of de novo coding mutations to autism spectrum disorder. Nature 2014, 515, 216–221. [Google Scholar] [CrossRef] [Green Version]
  24. Ronald, A.; Happé, F.; Price, T.S.; Baron-Cohen, S.; Plomin, R. Phenotypic and genetic overlap between autistic traits at the extremes of the general population. J. Am. Acad. Child Adolesc. Psychiatry 2006, 45, 1206–1214. [Google Scholar] [CrossRef]
  25. Robinson, E.B.; Koenen, K.C.; McCormick, M.C.; Munir, K.; Hallett, V.; Happé, F.; Plomin, R.; Ronald, A. Evidence that autistic traits show the same etiology in the general population and at the quantitative extremes (5%, 2.5%, and 1%). Arch. Gen. Psychiatry 2011, 68, 1113–1121. [Google Scholar] [CrossRef]
  26. Frazier, T.W.; Thompson, L.; Youngstrom, E.A.; Law, P.; Hardan, A.Y.; Eng, C.; Morris, N. A twin study of heritable and shared environmental contributions to autism. J. Autism Dev. Disord. 2014, 44, 2013–2025. [Google Scholar] [CrossRef]
  27. Veatch, O.J.; Sutcliffe, J.S.; Warren, Z.E.; Keenan, B.T.; Potter, M.H.; Malow, B.A. Shorter sleep duration is associated with social impairment and comorbidities in ASD. Autism Res. 2017, 10, 1221–1238. [Google Scholar] [CrossRef]
  28. McKenna, B.; Koomar, T.; Vervier, K.; Kremsreiter, J.; Michaelson, J.J. Whole-genome sequencing in a family with twin boys with autism and intellectual disability suggests multimodal polygenic risk. Cold Spring Harbor Mol. Case Stud. 2018, 4, a003285. [Google Scholar] [CrossRef]
  29. Egawa, J.; Watanabe, Y.; Sugimoto, A.; Nunokawa, A.; Shibuya, M.; Igeta, H.; Inoue, E.; Hoya, S.; Orime, N.; Hayashi, T.; et al. Whole-exome sequencing in a family with a monozygotic twin pair concordant for autism spectrum disorder and a follow-up study. Psychiatry Res. 2015, 229, 599–601. [Google Scholar] [CrossRef]
  30. Stamouli, S.; Anderlid, B.-M.; Willfors, C.; Thiruvahindrapuram, B.; Wei, J.; Berggren, S.; Nordgren, A.; Scherer, S.W.; Lichtenstein, P.; Tammimies, K.; et al. Copy number variation analysis of 100 twin pairs enriched for neurodevelopmental disorders. Twin Res. Hum. Genet. 2018, 21, 1–11. [Google Scholar] [CrossRef]
  31. Hu, V.W. Cluster Analyses of Females with Autism According to ADI-R Severity Scores. Unpublished.
  32. Robinson, E.B.; Koenen, K.C.; McCormick, M.C.; Munir, K.; Hallett, V.; Happé, F.; Plomin, R.; Ronald, A. A multivariate twin study of autistic traits in 12-year-olds: Testing the fractionable autism triad hypothesis. Behav. Genet. 2012, 42, 245–255. [Google Scholar] [CrossRef]
  33. Wang, K.; Zhang, H.; Ma, D.; Bucan, M.; Glessner, J.T.; Abrahams, B.S.; Salyakina, D.; Imielinski, M.; Bradfield, J.P.; Sleiman, P.M.A.; et al. Common genetic variants on 5p14.1 associate with autism spectrum disorders. Nature 2009, 459, 528–533. [Google Scholar] [CrossRef]
  34. Purcell, S.; Neale, B.; Todd-Brown, K.; Thomas, L.; Ferreira, M.A.R.; Bender, D.; Maller, J.; Sklar, P.; De Bakker, P.I.W.; Daly, M.J.; et al. PLINK: A tool set for whole-genome association and population-based linkage analyses. Am. J. Hum. Genet. 2007, 81, 559–575. [Google Scholar] [CrossRef]
  35. Oliveros, J.C.; Venny. An Interactive Tool for Comparing Lists with Venn’s Diagrams. 2007. Available online: http://bioinfogp.cnb.csic.es/tools/venny/index.html (accessed on 17 June 2019).
  36. Spitzer, M.; Wildenhain, J.; Rappsilber, J.; Tyers, M. BoxPlotR: A web tool for generation of box plots. Nat. Methods 2014, 11, 121–122. [Google Scholar] [CrossRef]
  37. Riva, A.; Kohane, I.S. SNPper: Retrieval and analysis of human SNPs. Bioinformatics 2002, 18, 1681–1685. [Google Scholar] [CrossRef]
  38. Dayem Ullah, A.Z.; Oscanoa, J.; Wang, J.; Nagano, A.; Lemoine, N.R.; Chelala, C. SNPnexus: Assessing the functional relevance of genetic variation to facilitate the promise of precision medicine. Nucleic Acids Res. 2018, 46, W109–W113. [Google Scholar] [CrossRef]
  39. Basu, S.N.; Kollu, R.; Banerjee-Basu, S. AutDB: A gene reference resource for autism research. Nucleic Acids Res. 2009, 37, D832–D836. [Google Scholar] [CrossRef]
Figure 1. Phenotypic (trait) profiles based on cumulative ADI-R scores for spoken language, nonverbal communication, play skills, social skills/interactions, and perseverative behaviors. In order to better compare the distribution of traits in each twin subgroup, the total number of individuals comprising each group was normalized to 100. The concordant autistic monozygotic (MZ) and dizygotic (DZ) twin subgroups are identified as cMZ and cDZ, respectively, and the discordant autistic (dA) and non-autistic (dNA) MZ and DZ twin subgroups are referred to as dA.MZ, dA.DZ, dNA.MZ, and dNA.DZ, respectively.
Ijms 20 03804 g001
Figure 2. Boxplots showing range of trait scores of all twin groups. Student’s t-test was used to show that there were significant differences between the trait scores for dNA.MZ and dNA.DZ twins. *** p-value ≤ 0.001.
Ijms 20 03804 g002
Figure 3. Comparison of average severity scores for dNA.MZ (red bars) and dNA.DZ (blue bars) twins across all ADI-R items (along horizontal axes) used to derive a cumulative trait score. * p-value ≤ 0.05, ** p-value ≤ 0.01, *** p-value ≤ 0.001.
Ijms 20 03804 g003aIjms 20 03804 g003b
Scheme 1. Workflow for two-phase genetic analyses using both quantitative trait and case-control association analyses of individuals stratified according to severity of traits.
Ijms 20 03804 sch001
Figure 4. Venn diagram showing SNP-associated gene overlap among language, nonverbal communication, play skills, and social skills. There was no gene overlap between the genes associated with perseverative behaviors and those associated with any of the other four traits.
Ijms 20 03804 g004
Table 1. Summary of genes associated with QTNs for each trait across all twin groups.
Spoken LanguageNonverbal Commun.Play SkillsSocial SkillsPers. Behav.
ADAM12KLHL29ABHD6MGAT4CADAMTS8KALRNABCC4DCAF16LHPPRCOR1APOLD1
ALOX12P1L3MBTL4ADAMTS8MICAADPRHL1KIRREL3ABCD3DCDC5LMO1REV1BNIP3L
ANGPT1LHFPL3AGMOMTCP1AGMOL3MBTL4ACBD5DGKHLPPR4RNASE8C2orf88
BMP5LHX4AK097143NCALDAMPD3LARGEADAMTS8DLG2LPPR5RNF144BCDH13
BMPR2LRRFIP1ANKRD44NCAPGANKRD44LCORLADARB1DMRT2LRIG3RPTORCORO2A
C12orf42LYPD6BANKS1BNOP58BEND4LECT1AGMODNAH9LRRC4CRUNX1FAM136B
C3orf55MGAT4CBCAS3NUP210P1BMPR2MARK3AKAP6DPF3MAGI3SGCZFHAD1
CCDC152MGAT5BMPR2PAX3C1orf143MGAT4CALPK1ELK3MARK3SHISA6GABRR2
CCDC85ANCALDCADM1PCDHGA1CA10MTCP1AMPD2ELOVL6MCPH1SLC16A9GPC6
CCND3NOP58CCDC85APIEZO2CCDC102BMYH11ANKRD32EPHB1MECOMSLC44A1GRAMD1C
CD101NOS1APCCND3PLCXD3CCDC60NCALDANKRD44EPS15MGAT4CSLCO2B1GRIP1
CDK5R1NPAS3CDH20RARBCCDC8NCAPGAOC1EYSMMP9SPATA13IL31RA
CHRM1NRXN1CEP95RNF24CCDC85ANOP58ARHGAP26FAM210BMTCP1SPOPKCNAB1
CHRNA7NTMCHL1RYR2CCND3NRG2ARL15FAM89AMYH11SRD5A1MAML2
CNTN1OVCH2CMKLR1SKAP2CHN2PAG1ASAP1FAT4MYO18BSRGAP3MRPS6
CNTN4PAX3COL20A1SLC22A23CHRM3PARK2ASXL3FBXL7NAALAD2ST6GALNAC3MTBP
CPMPDE4BCSMD1SLC27A6CLMPPAX3BC093087FCER2NCALDSTACMXRA5
CREMPIEZO2DCAF16SPATA13CMKLR1PAX7BMPR2FHITNCAPGSTK11OR2H2
CSMD1PPIEDLG2STACCMTM7PCDHGA1BPIFB1FRRS1LNDRG2STX8PLCB1
DCTN5SLC1A7EPHB1STK32BCOBLL1PLCXD3C10orf11GCNT1NOP58SUPT3HPLD6
DGKHSLC30A8EYSTHEG5CPEPSD3C6orf106GNEOPA3THEG5PRICKLE1
DSCAMSMEK1FAT4TMEM38ACSMD1RARBC9orf171GRID1P4HA2THSD4PTPRD
DSCAML1STX8FLVCR1TRIOBPCTNND2RPTORCA10GRID2PARK2TMEM108RAPGEF5
E2F7SYT6GCNT1WBSCR17DCAF16SH3PXD2BCASP6GRM7PAX3TMEM135RNLS
EP400TCHPIL1R2WNK2DFFASLC16A9CASP8HBS1LPCDHGA1TMEM245SLC22A18
FAM49BTLN2ITIH5ZNF207DISC1SLCO4A1CCDC102BHDAC11PCSK5TNS3SORBS2
FMN1TMEM192KCNIP4 DLG2SOX5CCDC85AHIST1H1DPDE8ATRDNST8SIA5
GOSR1TNS3L3MBTL4 DNAJC10SPOPCCND3HIST1H2BFPDGFCTTC27SYNPO2L
GPR139TOP2BLARGE DPF3STACCCSER1HIST1H4EPFKPUSP37UNC13C
ID3UNC5DLCORL E2F7STEAP1BCDH8HIST1H4GPIEZO2WDSUB1
JAZF1WWC2LDB2 EPHB1STK38CDK17IGSF21PITPNAWNK2
KIAA0947YY1LIM2 EYSTECRLCDK2IKBKAPPKD1L1XYLT1
KIAA1549 LRRC4C FAT4THEG5CEP95ITGB3PLCXD3ZFP64
FIP1L1TMEM144CMIPKCND2PLXDC1ZNF142
FZD4TMEM161BCMKLR1KCNIP4PREPZNF630
GALNTL6TNFSF12CMYA5KIAA0319PRKCDBPZNF804B
GCNT1TP53CNTN1KIAA1377PSD3
GPR56TRDNCOLEC12KIF13APTPRE
GREM1VAV3CR2KLF12PTPRK
HBS1LWNK2CSMD1L3MBTL4RABGAP1L
ID3ZCCHC14CTNNAL1LARGERARB
ITSN1ZNF385DCTTNBP2LCORLRBFOX1
Table 2. Hypergeometric distribution analyses of trait-associated genes and SFARI genes.
Hypergeometric Distribution Analyses of Enrichment of SFARI Genes Among ASD Trait-Associated Genes
TraitNumber of Trait-Associated Genes# Genes Represented within SFARI Genep-Value * for Enrichment
Language deficits65114.20 × 10−4
Nonverbal communication5952.01 × 10−1
Play skills8493.30 × 10−2
Social skills162199.48 × 10−4
Perseverative behaviors2951.68 × 10−2
* For the hypergeometric distribution analyses, the total number of genes in the population was estimated to be 20,406, and the total number of ASD-associated genes in the SFARI gene database was 1079.
Table 3. Hypergeometric analyses of case-control associated genes and SFARI genes.
Case Groups (Combined Q1 and Q4) vs. Unaffected ControlsNumber of Case-Associated Genes# Genes Represented within SFARI GeneQ-Value * for Enrichment
dA.MZ1301
dA.DZ801
dNA.MZ5391.69 × 10−3
dNA.DZ1941.59 × 10−2
cMZ2924.58 × 10−1
cDZ2343.10 × 10−2
* For the hypergeometric distribution analyses, the total number of genes in the population was estimated to be 20,406; and the total number of ASD-associated genes in the SFARI gene database was 1079.
Table 4. Neurological functions associated with genes implicated by language QTNs.
Functions Annotationp-Value *Genes
cell-cell adhesion of neurons9.52 × 10−6CDK5R1, CNTN4, NRXN1
guidance of axons9.66 × 10−6CDK5R1, CNTN1, CNTN4, LHX4, NRXN1, UNC5D
fasciculation of axons8.24 × 10−5CDK5R1, CNTN1, CNTN4
abnormal morphology of brain1.86 × 10−4CDK5R1, CHRM1, CHRNA7, CNTN1, ID3, LHX4, NPAS3, TOP2B
GABA-mediated receptor currents6.98 × 10−4CHRNA7, NRXN1
abnormal morphology of granule cells9.17 × 10−4CDK5R1, CNTN1
abnormal morphology of nervous system1.48 × 10−3CDK5R1, CHRM1, CHRNA7, CNTN1, CNTN4, ID3, LHX4, NPAS3, TOP2B
stratification of cerebral cortex1.75 × 10−3CDK5R1, TOP2B
formation of brain2.52 × 10−3BMP5, CDK5R1, CNTN1, CREM, DSCAML1, NPAS3, TOP2B
memory2.58 × 10−3CDK5R1, CHRM1, CHRNA7, CREM, NPAS3
abnormal morphology of molecular layer of cerebellum2.63 × 10−3CDK5R1, CNTN1
formation of enteric ganglion2.82 × 10−3PAX3
morphology of motor cortex2.82 × 10−3CDK5R1
origination of axons2.82 × 10−3CDK5R1
reorganization of molecular layer2.82 × 10−3CDK5R1
sprouting of mossy fiber cells2.82 × 10−3CDK5R1
* Fisher exact p-value which indicates the probability that the list of SNP-associated genes is not enriched for annotated function, using genes in IPA’s Knowledgebase as the reference set of genes.
Table 5. Neurological functions associated with genes implicated by nonverbal QTNs.
Functions Annotationp-Value *Genes
organization of mossy fibers2.60 × 103 CHL1
formation of enteric ganglion2.60 × 103 PAX3
targeting of retinal ganglion cells2.60 × 103 EPHB1
cell-cell adhesion of astrocytes2.60 × 103 CADM1
maintenance of neural crest5.18 × 103PAX3
survival of neural crest5.18 × 103PAX3
innervation of forelimb7.77 × 103BMPR2
differentiation of satellite cells1.03 × 102PAX3
morphogenesis of optic nerve1.29 × 102EPHB1
migration of pyramidal neurons1.29 × 102CHL1
abnormal pruning of axons1.29 × 102EPHB1
excitatory postsynaptic potential of neurons1.39 × 102DLG2, RARB
formation of pyramidal neurons1.55 × 102CHL1
synaptic depression of collateral synapses1.80 × 102EPHB1
synaptic transmission of collateral synapses1.80 × 102EPHB1
abnormal morphology of axons2.29 × 102CHL1, EPHB1
development of retinal pigment epithelium2.31 × 102RARB
abnormal morphology of optic tract2.31 × 102EPHB1
abnormal morphology of hypoglossal nerve2.82 × 102RARB
abnormal morphology of olfactory receptor neurons3.32 × 102CHL1
abnormal morphology of mossy fibers4.07 × 102CHL1
projection of axons4.57 × 102CHL1
synaptic transmission of nervous tissue4.74 × 102ANKS1B, EPHB1
abnormal morphology of neural arch4.82 × 102RARB
* Fisher exact p-value which indicates the probability that the list of SNP-associated genes is not enriched for annotated function, using genes in IPA’s Knowledgebase as the reference set of genes.
Table 6. Neurological functions associated with genes implicated by play skills QTNs.
Functions Annotationp-Value *Genes
formation of dendritic spines6.97 × 104ITSN1, KALRN
short-term depression of calyx-type synapse7.29 × 104ITSN1
neurotransmission of synapse8.88 × 104CHRM3, PRKN
formation of tip of neurite-like extensions1.46 × 103KALRN
elongation of dendritic spine neck1.46 × 103ITSN1
long-term potentiation of Purkinje cells1.46 × 103CHRM3
arrest in axonal transport of mitochondria1.46 × 103PRKN
quantity of catecholaminergic neurons1.46 × 103PRKN
length of neurons2.18 × 103ITSN1, KALRN
excitation of striatal neurons2.18 × 103PRKN
differentiation of satellite cells2.91 × 103PAX7
replenishment of synaptic vesicles2.91 × 103ITSN1
abnormal morphology of locus ceruleus2.91 × 103PRKN
afterhyperpolarization of pyramidal neurons4.36 × 103CHRM3
morphology of corticcal neurons4.36 × 103KALRN
sensorimotor integration5.09 × 103PRKN
abnormal morphology of substantia nigra5.81 × 103PRKN
neurotransmission6.89 × 103CHRM3,,KALRN, PRKN
morphogenesis of dendritic spines7.26 × 103KALRN
retraction of dendrites7.99 × 103KALRN
maturation of dendritic spines8.71 × 103KALRN
length of axons9.43 × 103KALRN
abnormal morphology of cerebral cortex9.91 × 103KALRN,,PRKN
length of dendritic spines1.38 × 10−2ITSN1
coordination1.43 × 10−2KALRN, PRKN
* Fisher exact p-value which indicates the probability that the list of SNP-associated genes is not enriched for annotated function, using genes in IPA’s Knowledgebase as the reference set of genes.
Table 7. Neurological functions associated with genes implicated by social skills QTNs.
Functions Annotationp-Value *Genes
abnormal morphology of thoracic vertebra1.19 × 103DMRT2, FAT4, NDRG2
action potential of neurons4.63 × 103DLG2, GRID2, KCND2, PARK7, RARB
abnormal morphology of Purkinje cells4.78 × 103CNTN1, GRID2, PITPNA
innervation of climbing fiber7.24 × 103GRID2
formation of enteric ganglion7.24 × 103PAX3
development of climbing fiber7.24 × 103GRID2
differentiation of branchial motor neurons7.24 × 103RUNX1
targeting of retinal ganglion cells7.24 × 103EPHB1
differentiation of visceral motor neurons7.24 × 103RUNX1
abnormal morphology of Golgi interneurons7.24 × 103CNTN1
proliferation of neuroglia7.26 × 103CCND3, CDK2, CNTN1, MMP9, RUNX1
abnormal morphology of white matter7.39 × 103PITPNA, SRGAP3
function of blood-brain barrier9.99 × 103ABCC4, MMP9
abnormal morphology of lumbar vertebra1.09 × 102DMRT2, FAT4
function of brain1.12 × 102ABCC4, KCNIP4, MMP9
morphology of brain1.18 × 102CASP6, CNTN1, EPHB1, GRID1, GRID2, MCPH1, MECOM, PARK7, PITPNA, SRGAP3
axonogenesis1.31 × 102CASP6, EPHB1, GRID2, LRRC4C, PTPRE, STK11
arrest in cell cycle progression of oligodendrocyte precursor cells1.44 × 102CDK2
abnormal morphology of superior ganglion of glossopharyngeal nerve1.44 × 102MECOM
delay in initiation of pruning of axons1.44 × 102CASP6
maintenance of neural crest1.44 × 102PAX3
blood-cerebrospinal fluid barrier function1.44 × 102ABCC4
* Fisher exact p-value which indicates the probability that the list of SNP-associated genes is not enriched for annotated function, using genes in IPA’s Knowledgebase as the reference set of genes.
Table 8. Neurological functions associated with genes implicated by Perseverative behavior QTNs.
Diseases or Functions Annotationp-value *Genes
paired-pulse facilitation of parallel fiber-Purkinje cell synapses1.27 × 103UNC13C
early infantile epileptic encephalopathy type 121.27 × 10³PLCB1
loss of hippocampal neurons6.36 × 103PLCB1
epilepsy1.27 × 10−2GABRR2, PLCB1, PRICKLE1
afterhyperpolarization of neurons2.27 × 10−2KCNAB1
progressive myoclonic epilepsy2.64 × 10−2PRICKLE1
status epilepticus4.13 × 10−2GABRR2
density of synapse4.61 × 10−2GRIP1
sedation4.61 × 10−2GABRR2
* Fisher exact p-value which indicates the probability that the list of SNP-associated genes is not enriched for annotated function, using genes in IPA’s Knowledgebase as the reference set of genes.
Table 9. Neurological functions implicated by QTN-associated genes in dNA.MZ.
Functions Annotationp-value *Genes
abnormal morphology of pyramidal neurons5.59 × 105CHL1, CHRNA7, KALRN
GABA-mediated receptor currents4.19 × 104CHRNA7, NRXN1
abnormal morphology of cerebral cortex1.12 × 103CHL1, CHRNA7, KALRN, NPAS3
organization of mossy fibers2.19 × 103CHL1
cell-cell adhesion of astrocytes2.19 × 103CADM1
developmental process of synapse2.35 × 103CADM1, CHRNA7, KALRN, NRXN1
formation of tip of neurite-like extensions4.37 × 10−3KALRN
hyperexcitation of hippocampal neurons; short-term potentiation of hippocampus; nicotine-mediated receptor current4.37 × 103CHRNA7
abnormal morphology of enlarged fourth cerebral ventricle6.54 × 103NPAS3
miniature excitatory postsynaptic currents7.15 × 103KALRN, NRXN1
abnormal morphology of lateral cerebral ventricle7.64 × 103CHL1, NPAS3
differentiation of satellite cells8.71 × 103PAX7
abnormal morphology of cingulate gyrus8.71 × 103NPAS3
abnormal morphology of GABAergic neurons8.71 × 103CHRNA7
migration of pyramidal neurons1.09 × 102CHL1
pervasive developmental disorder1.13 × 10−2BCAS3, PREP, SLC1A7
excitatory postsynaptic current1.26 × 102KALRN, NRXN1
morphology of cortical neurons1.30 × 10−2KALRN
formation of pyramidal neurons1.30 × 10−2CHL1
maturatin of neurons1.46 × 10−2KALRN, NRXN1
branching of axons1.49 × 102KALRN, STK11
prepulse inhibition1.56 × 102KALRN, NRXN1
abnormal morphology of enlarged third cerebral ventricle1.74 × 102NPAS3
paired-pulse inhibition1.74 × 102NRXN1
coordination1.79 × 102CHRNA7, KALRN, NPAS3
abnormal morphology of cerebral aqueduct1.95 × 102NPAS3
morphogenesis of dendritic spines2.16 × 102KALRN
retraction of dendrites2.38 × 10−2KALRN
activation of dopaminergic neurons2.59 × 102CHRNA7
maturation of dendritic spines2.59 × 102KALRN
abnormal morphology of olfactory receptor neurons2.81 × 102CHL1
length of axons2.81 × 102KALRN
spatial memory2.88 × 102CHRNA7, KALRN, NPAS3
sleep disorders3.06 × 102CHRNA7, PDE4B
neurotransmission3.20 × 102ANKS1B, CHRNA7, KALRN, NRXN1
development of neurons3.44 × 102CADM1, CHL1, CHRNA7, KALRN, NRXN1, STK11
* Fisher exact p-value which indicates the probability that the list of SNP-associated genes is not enriched for annotated function, using genes in IPA’s Knowledgebase as the reference set of genes.
Table 10. Neurological functions implicated by QTN-associated genes in dNA.DZ.
Diseases or Functions Annotationp-Value *Genes
adhesion of cerebellar granule cell8.65 × 104ADGRG1
migration of CA1 neuron8.65 × 104DISC1
abnormal morphology of lumbar dorsal root ganglion8.62 × 10−3GABBR1
abnormal morphology of somatic nervous system1.03 × 10−2GABBR1
pervasive developmental disorder1.44 × 10−2CORO2A, GABBR1
abnormal morphology of sciatic nerve1.46 × 10−2GABBR1
positioning of neurons1.55 × 10−2DISC1
development of olfactory cilia1.80 × 10−2DISC1
progressive myoclonic epilepsy1.80 × 10−2PRICKLE1
maturation of synapse1.89 × 10−2DISC1
migration of neuronal progenitor cells1.97 × 10−2ADGGRG1
fragile X syndrome2.48 × 10−2GABBR1
elongation of axons2.73 × 10−2DISC1
migration of neurons2.81 × 10−2ADGRG1, DISC1
abnormal morphology of myelin sheath2.99 × 10−2GABBR1
differentiation of oligodendroccyte precursor cells3.24 × 10−2DISC1
absense seizure3.24 × 10−2GABBR1
passive avoidance learning3.49 × 10−2GABBR1
inhibitory postsynaptic current4.41 × 10−2GABBR1
electrophysiology of nervous system4.74 × 10−2GABBR1
* Fisher exact p-value which indicates the probability that the list of SNP-associated genes is not enriched for annotated function, using genes in IPA’s Knowledgebase as the reference set of genes.
Table 11. Neurological functions implicated by QTN-associated genes in cDZ.
Diseases or Functions Annotationp-Value *Genes
morphology of brain1.51 × 10−3DSCAM, LHX4, PRKN, TOP2B
abnormal morphology of abducens nerve1.73 × 10−3LHX4
arrest in axonal transport of mitochondria1.73 × 10−3PRKN
quantity of catecholaminergic neurons1.73 × 10−3PRKN
delay in specification of corticotroph cells1.73 × 10−3LHX4
excitation of striatal neurons2.59 × 10−3PRKN
startle response2.60 × 10−3PLCB1, PRKN
development of granule cell layer3.46 × 10−3CREM
function of central pattern generator3.46 × 10−3DSCAM, LHX4, PRKN, TOP2B
development of cortical subplate3.46 × 10−3TOP2B
abnormal morphology of locus ceruleus3.46 × 10−3PRKN
morphogenesis of dendrites3.67 × 10−3DSCAM, FMN1
loss of hippocampal neurons4.32 × 10−3PLCB1, PRKN
development of central nervous system5.75 × 10−3CREM, PLCB1, PRKN, TOP2B
abnormal morphology of amacrine cells6.04 × 10−3DSCAM
sensorimotor integration6.04 × 10−3PRKN
abnormal morphology of substantia nigra6.90 × 10−3PRKN
abnormal morphology of neurons7.53 × 10−3DSCAM, LHX4, PRKN
abnormal morphology of nervous system8.50 × 10−3DSCAM, LHX4, PRKN, TOP2B
abnormal morphology of hypoglossal nerve9.48 × 10−3LHX4
thickness of cerebral cortex1.03 × 10−2DSCAM
quantity of gonadotropes1.12 × 10−2LHX4
innervation of motor neurons1.20 × 10−2TOP2B
abnormal morphology of brain1.22 × 10−2LHX4, PRKN, TOP2B
loss of neurons1.27 × 10−2PLCB1, PRKN
curvature of vertebral column1.80 × 10−2TOP2B
formation of brain1.83 × 10−2CREM, PLCB1, TOP2B
stratification of cerebral cortex1.89 × 10−2TOP2B
innervation of muscle1.89 × 10−2TOP2B
abnormal morphology of adenohypophysis1.97 × 10−2LHX4
quantity of nerve ending2.14 × 10−2PRKN
guidance of motor axons2.23 × 10−2LHX4
loss of dopaminergic neurons2.23 × 10−2PRKN
abnormal morphology of spinal nerve2.48 × 10−2LHX4
fasciculation of axons2.56 × 10−2DSCAM
abnormal morphology of motor neurons2.82 × 10−2LHX4
neuritogenesis3.00 × 10−2DSCAM, FMN1, TOP2B
abnormal morphology of subventricular zone3.07 × 10−2TOP2B
memory3.36 × 10−2CREM, PLCB1
morphology of dendritic spines3.57 × 10−2DSCAM
quantity of dendritic spines3.99 × 10−2DSCAM
development of spinal cord4.49 × 10−2TOP2B
abnormal morphology of olfactory bulb4.57 × 10−2TOP2B
cell viability of cortical neurons4.74 × 10−2PRKN
electrophysiology of nervous system4.74 × 10−2PRKN
* Fisher exact p-value which indicates the probability that the list of SNP-associated genes is not enriched for annotated function, using genes in IPA’s Knowledgebase as the reference set of genes.
Table 12. Genes associated with SNPs identified by case-control association analyses using dA.DZ twins as cases and dNA.DZ twins as controls.
Case-control Association Analysis of dA.DZ vs. dNA.DZOverlap with SFARIOverlap with Exome-seq #
(146 genes associated with SNPs with p ≤ 0.05 and OR ≥ 3)* Q = 1.84 × 10⁻⁷* Q = 4.64 × 10⁻⁸
ABCA13DCCKCTD16PCSK6RPH3ALABCA13ABCA13OR1J2
ACVRL1DKK3KIAA0232PDCD4SCOCCACNA1AALDH3B2PCM1
ALDH3B2DMDKIAA1407PDE3ASEC16BCACNA2D3ALMS1PCSK6
ALMS1DNAH5KLHDC7APDE9ASETBP1CNTN4ARHGAP28PDCD4
ANO4DSTKLHL1PDGFDSFMBT2CSMD1ATP8B4PDE9A
ARHGAP28ESRRBKSR2PDXKSLC12A2CTNND2C20orf96PDGFD
ATP8B4EXOSC1LDLRAD3PDZD2SLC22A23DMDCACNA1APDZD2
ATXN3FAM216ALIN52PEX13SLC25A21DSTCACNA2D3PKNOX2
BBIP1FAM89ALPHN3PGAM1P5SLC39A11ESRRBCDK14PLCG2
C20orf96FAT4LRP11PIP5K1BSLC5A12FERCSMD1PRKAG2
CACNA1AFERLRP1BPIP5K1CSLIT3FHITCSMD3PRKCE
CACNA2D3FERMT1MAL2PKNOX2SMC6GABRB1CTNND2PRPF4B
CACNG2FHITMARCH1PLCG2SNTG2GRIP1DCCPSD3
CARD6FLIP1LMAST4POU2F3SNX9MCPH1DMDRBMS3
CCDC102BFREM1MCPH1PPARGC1ASORCS2NELL1DNAH5RHBDF2
CCDC111GABRB1MIPEPPRKAG2SYT9NTNG1DSTRNF213
CCDC176GALCMPP7PRKCETBCENXPH1ESRRBROBO1
CCDC3GAS7MYO15BPRKG1TMEM182PSD3FAT4RPH3AL
CD36GNNMYOM3PRPF4BTMTC2RBMS3FERMT1SCOC
CDK14GPR124NCOR2PSD3TRIP11ROBO1GALCSEC16B
CDKAL1GPR125NELL1QRTRTD1TTC7ASETBP1HEG1SETBP1
CLYBLGRIP1NMNAT2RABGAP1LTUBGCP5SLC39A11KIAA0232SLC22A23
CMSS1HALNRDE2RASGEF1BVITSLIT3KIAA1407SLC39A11
CNOT10HEG1NTNG1RBMS3XRCC4SNTG2LRP11SMC6
CNTN4HSPA12ANXPH1RCN1YIPF5TUBGCP5LRP1BTMTC2
CSMD1HVCN1OAS2RGS17ZDDGGC16 MCPH1TRIP11
CSMD3IFT81OR1J2RHBDF2 MYOM3TTC7A
CTNND2IRS1OR8U8RNF180 NCOR2TUBGCP5
CWC27KCNIP4PALLDRNF213 NELL1YIPF5
CYMPKCNN3PCM1ROBO1 NTNG1
* Q indicates probability of enrichment in SFARI or exome-seq genes from hypergeometric distribution analysis. # Exome-seq genes were downloaded from study by Iossifov et al. [23].
Table 13. Neurological functions of SNP-associated genes from dA.DZ vs. dNA.DZ case-control association analysis.
Function Annotationp-Value *Genes
development of neurons5.50 × 106ADGRL3, CACNA1A, CACNG2, CNTN4, CTNND2, DCC, DMD, FER, GAS7, KLHL1, NTNG1, PALLD, PCM1, PIP5K1B, PIP5K1C, PRKCE, PRKG1, ROBO1, SLC12A2, SLIT3, TBCE
neuritogenesis3.57 × 105CACNA1A, CNTN4, CTNND2, DCC, FER, GAS7, KLHL1, NTNG1, PALLD, PIP5K1B, PIP5K1C, PRKCE, PRKG1, ROBO1, SLIT3, TBCE
axonogenesis2.58 × 104CACNA1A, CNTN4, DCC, NTNG1, PIP5K1C, PRKG1, ROBO1, TBCE
migration of neurons6.40 × 104ADGRL3, DCC, PCM1, PEX13, PIP5K1C, PRKG1, ROBO1, SLC12A2
development of sensory projections7.83 × 104ROBO1, SLIT3
pathfinding of neurons2.02 × 103DCC, ROBO1
morphology of nervous system2.62 × 103ADGRA2, BBIP1, CACNA1A, CNTN4, DCC, KLHL1, MCPH1, NCOR2, PALLD, PCSK6, PEX13, PPARGC1A, ROBO1, SLC12A2, XRCC4
guidance of axons4.61 × 103 CNTN4, DCC, PRKG1, ROBO1, SLIT3
abnormal morphology of forebrain4.80 × 103 ADGRA2, BBIP1, DCC, NCOR2, PPARGC1A, ROBO1
formation of dendrites4.83 × 103 CACNA1A, GAS7, KLHL1, PRKG1, ROBO1
developmental process of synapse5.28 × 103ADGRL3, CACNA1A, CACNG2, DCC, DMD, SLC12A2
quantity of oxytocin neurons6.19 × 103DCC
synaptic transmission of stellate cells6.19 × 103 CACNG2
guidance of corticocortical axons1.23 × 102ROBO1
quantity of vasopressin neurons1.23 × 102DCC
activation of Purkinje cells1.23 × 102CACNA1A
afterhyperpolarization of dopaminergic neurons1.23 × 102KCNN3
size of hippocampal commissure1.23 × 102ROBO1
startle response1.74 × 102CACNA2D3, CSMD1, PPARGC1A
inhibition of presympathetic neurons1.85 × 102 SLC12A2
fragmentation of myelin sheath1.85 × 102 GALC
maturation of cerebellum1.85 × 102 CACNA1A
turnover of synaptic vesicles1.85 × 102 CACNA1A
density of synapse2.20 × 102CTNND2, GRIP1
morphogenesis of neurites2.43 × 102CACNA1A, CNTN4, CTNND2, FER, GAS7, PALLD, PRKG1, ROBO1
* Fisher exact p-value which indicates the probability that the list of SNP-associated genes is not enriched for annotated function, using genes in IPA’s Knowledgebase as the reference set of genes.

