Article

Identification and Clinical Validation of a Novel 4 Gene-Signature with Prognostic Utility in Colorectal Cancer

1
Department of Pathology, Anatomic Pathology Section, Medical College of Georgia at Augusta University, Augusta, GA 30912, USA
2
Department of Molecular Biology and Biochemistry, Guru Nanak Dev University, Amritsar 143005, India
3
Department of Orthopedics, Medical College of Georgia at Augusta University, Augusta, GA 30912, USA
4
Department of Medicine, Hematology Oncology Section, Medical College of Georgia at Augusta University, Augusta, GA 30912, USA
*
Authors to whom correspondence should be addressed.
Int. J. Mol. Sci. 2019, 20(15), 3818; https://0-doi-org.brum.beds.ac.uk/10.3390/ijms20153818
Submission received: 11 July 2019 / Revised: 31 July 2019 / Accepted: 2 August 2019 / Published: 5 August 2019
(This article belongs to the Section Molecular Oncology)

Abstract

:
Colorectal cancer (CRC) is a high burden disease with several genes involved in tumor progression. The aim of the present study was to identify, generate and clinically validate a novel gene signature to improve prediction of overall survival (OS) to effectively manage colorectal cancer. We explored The Cancer Genome Atlas (TCGA), COAD and READ datasets (597 samples) from The Protein Atlas (TPA) database to extract a total of 595 candidate genes. In parallel, we identified 29 genes with perturbations in > 6 cancers which are also affected in CRC. These genes were entered in cBioportal to generate a 17 gene panel with highest perturbations. For clinical validation, this gene panel was tested on the FFPE tissues of colorectal cancer patients (88 patients) using Nanostring analysis. Using multivariate analysis, a high prognostic score (composite 4 gene signature—DPP7/2, YWHAB, MCM4 and FBXO46) was found to be a significant predictor of poor prognosis in CRC patients (HR: 3.42, 95% CI: 1.71–7.94, p < 0.001 *) along with stage (HR: 4.56, 95% CI: 1.35–19.15, p = 0.01 *). The Kaplan-Meier analysis also segregated patients on the basis of prognostic score (log-rank test, p = 0.001 *). The external validation using GEO dataset (GSE38832, 122 patients) corroborated the prognostic score (HR: 2.7, 95% CI: 1.99–3.73, p < 0.001 *). Additionally, higher score was able to differentiate stage II and III patients (130 patients) on the basis of OS (HR: 2.5, 95% CI: 1.78–3.63, p < 0.001 *). Overall, our results identify a novel 4 gene prognostic signature that has clinical utility in colorectal cancer.

1. Introduction

Colorectal cancer (CRC) affects nearly 1.4 million individuals every year, which makes up to 10% of the global burden of cancer [1]. According to 2019 cancer statistics report, colorectal cancer caused third highest number of deaths due to cancer in United States [2]. The progress in early detection, surgical and chemotherapeutic interventions have significantly reduced the mortality rate, however, the high relapse and variable survival among the patients highlights the need of better prognostic biomarkers [3]. Several recent studies have identified gene expression signatures in cancer that have prognostic utility [4,5,6]. OncotypeDX [7], GeneFx Colon [8] Coloprint [9] signatures are available and are currently being evaluated independently in multiple independent cohorts [10]. There is need for new signatures as all the existing prognostic signatures have been shown to offer only a marginal clinical utility compared to conventional risk factors [11]. Further, a robust risk-gene signature is required to further assist clinicians to tailor personalized treatment for diversity of CRC patients. Over the past few years, several consortium efforts have yielded massive data on multiple types of cancers. The TCGA Research network is one such project with 2.5 petabytes of data that catalogs DNA sequences and its modifications along with transcriptome data of more than 11,000 individuals in over 30 types of cancers [12]. Building on TCGA datasets, secondary databases like TPA and cBioportal can provide hundreds of potential prognostic genes. These genes need additional validation through independent studies and our study is one such effort.
The protein atlas (TPA) database has analyzed transcriptome variation with respect to clinical outcome in 17 major cancers [13]. Another platform, the cBioportal is a graphic web interface to explore aberrations at the genetic, epigenetic and expressional level in multiple types of cancer [14]. The top hits from TPA database and cBioportal were combined to build a prognostic gene panel. The resulting 17-gene panel was internally tested on Formalin fixed, paraffin embedded (FFPE) tissues of CRC patients. In the past, FFPE tissues with clinical information have been instrumental in facilitating prognostic biomarker discovery [15,16]. Additionally, RNA molecules identified in FFPE tumor tissues have been shown to be of the same high quality as that seen in fresh frozen tissue [17]. Clinically, the overall survival analysis based on mRNA expression, has also shown consistent results between fresh frozen and FFPE tissues [18,19]. In an effort to explore differential expression between normal and tumor tissues, GEPIA (Gene Expression Profiling Interactive Analysis) database was accessed. GEPIA collates normal gene expression from normal TCGA database and GTEx Genotype-Tissue Expression (GTEx) project [20,21]. The aim of this study was to identify clinically actionable candidate genes from both TPA database and cBioportal and then to validate those genes internally and externally using FFPE tissues from CRC patient and independent GEO (Gene Expression Omnibus) datasets.

2. Results

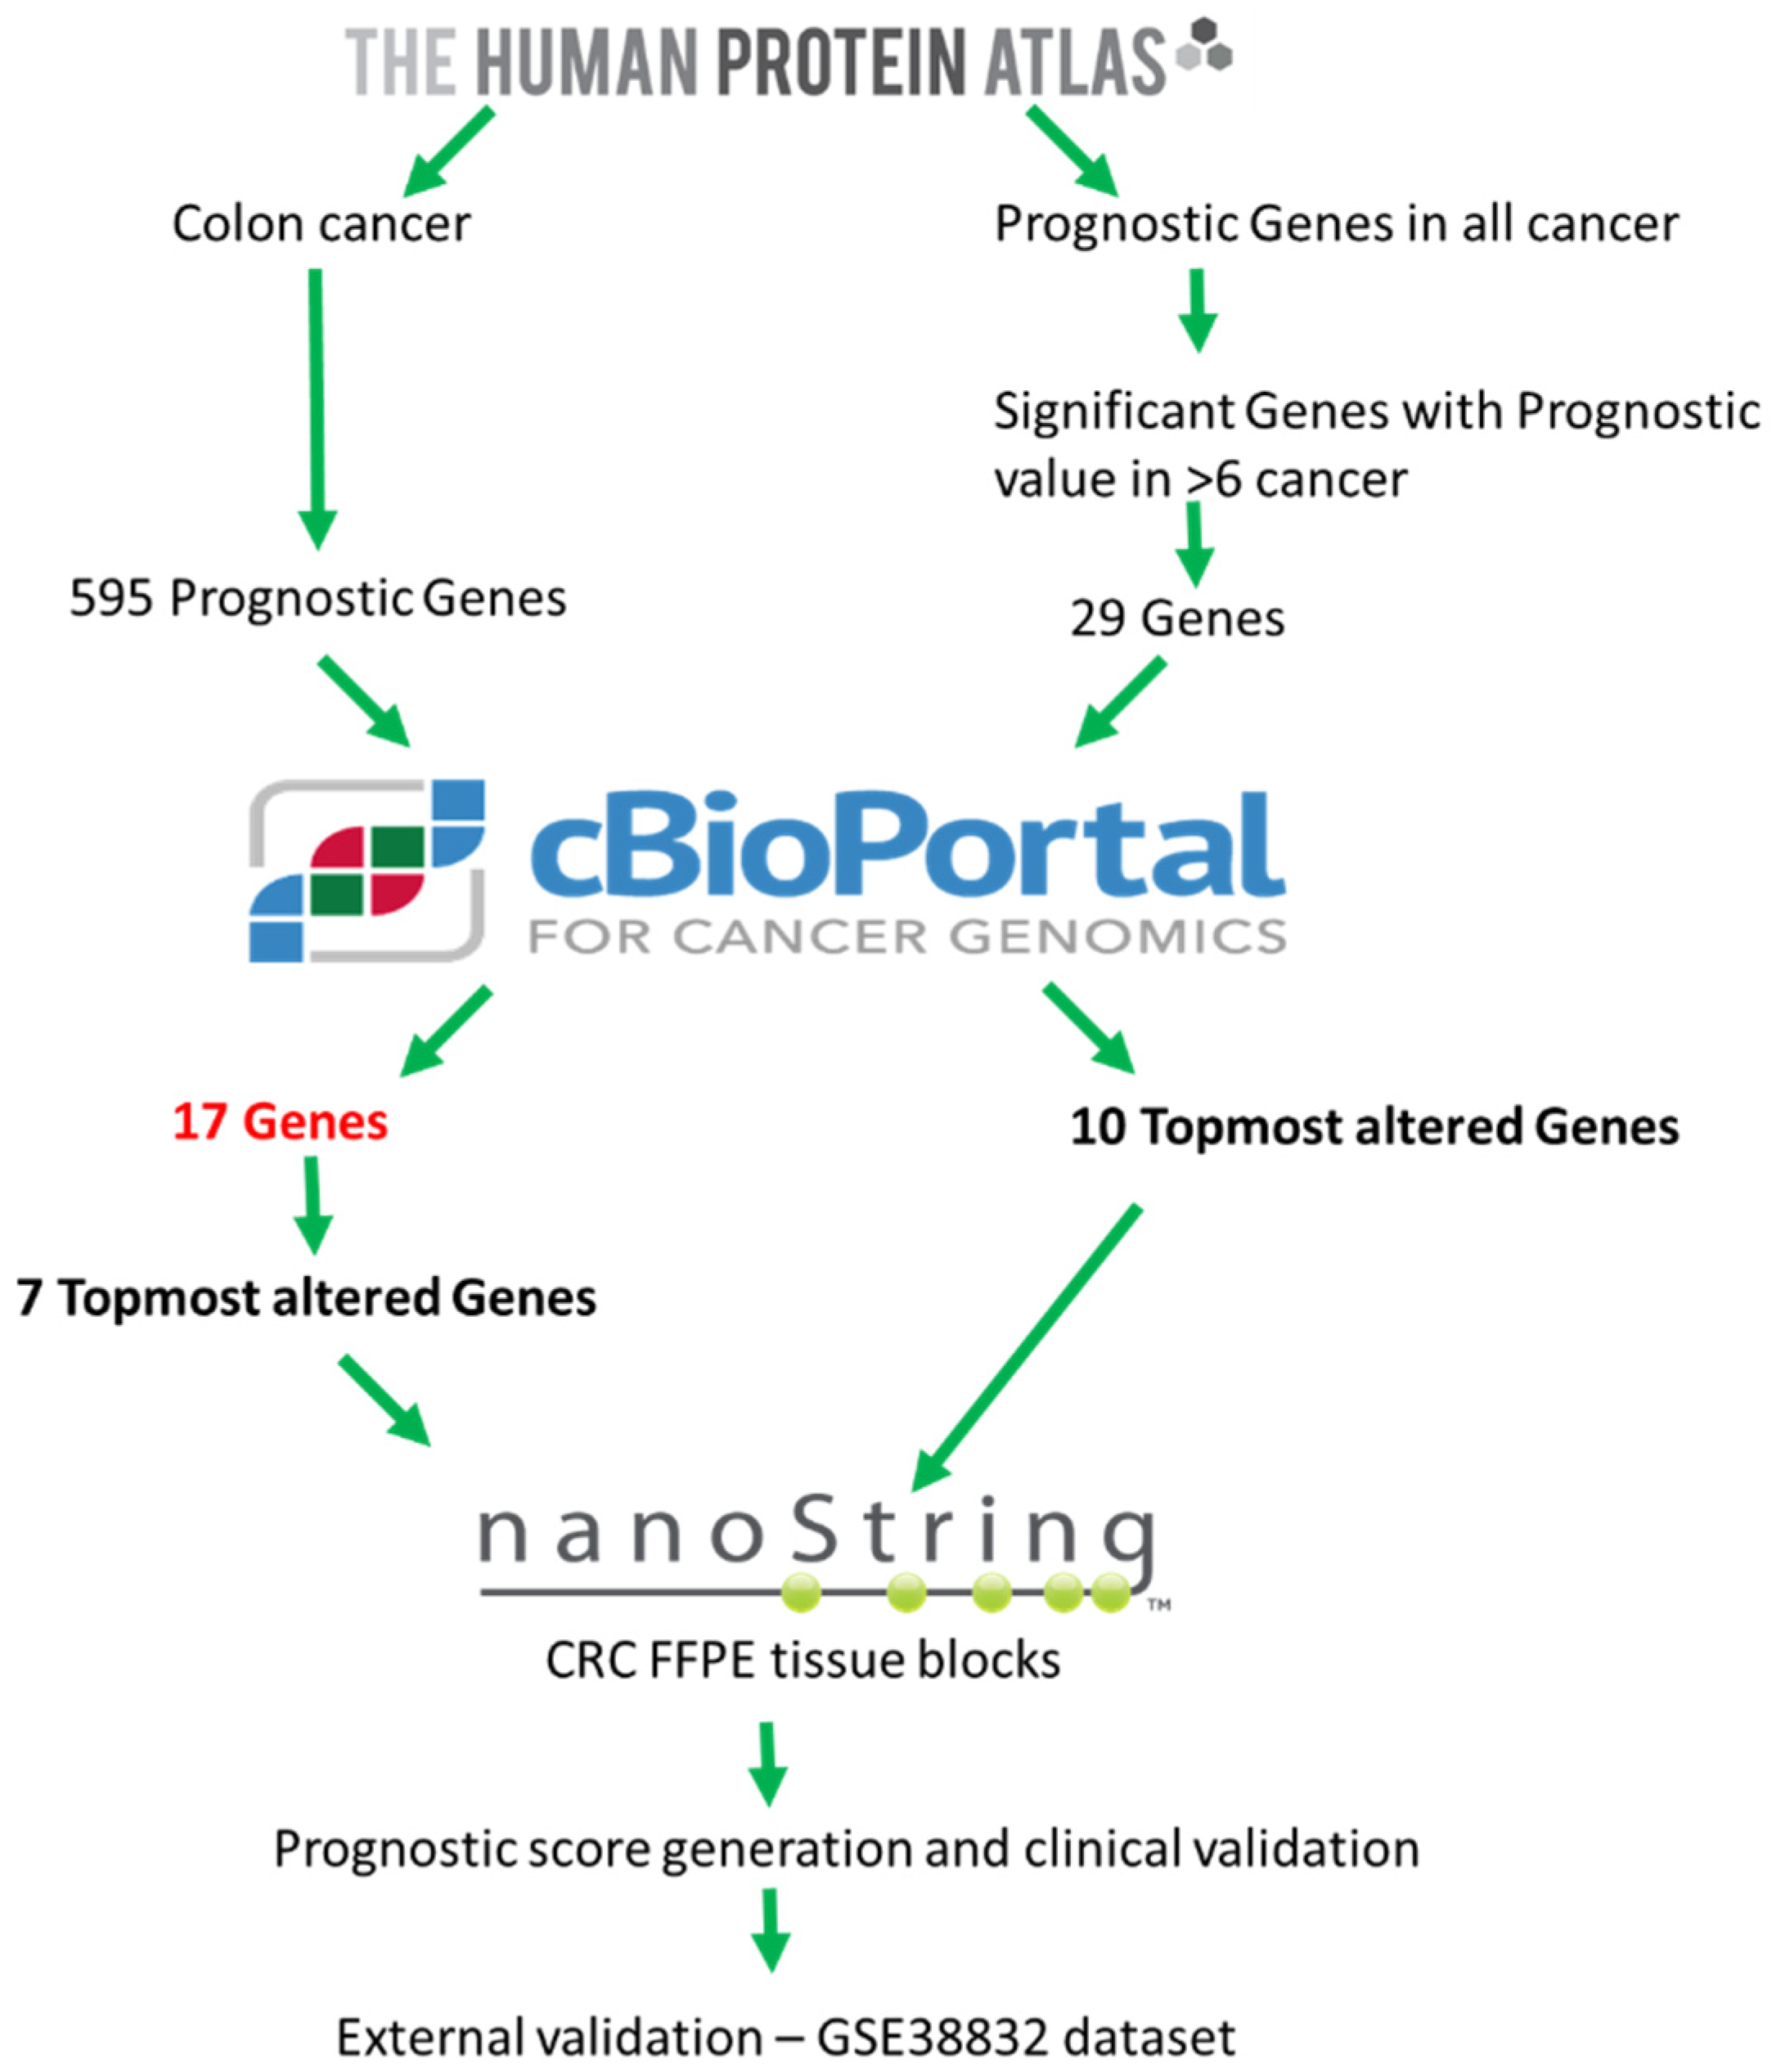
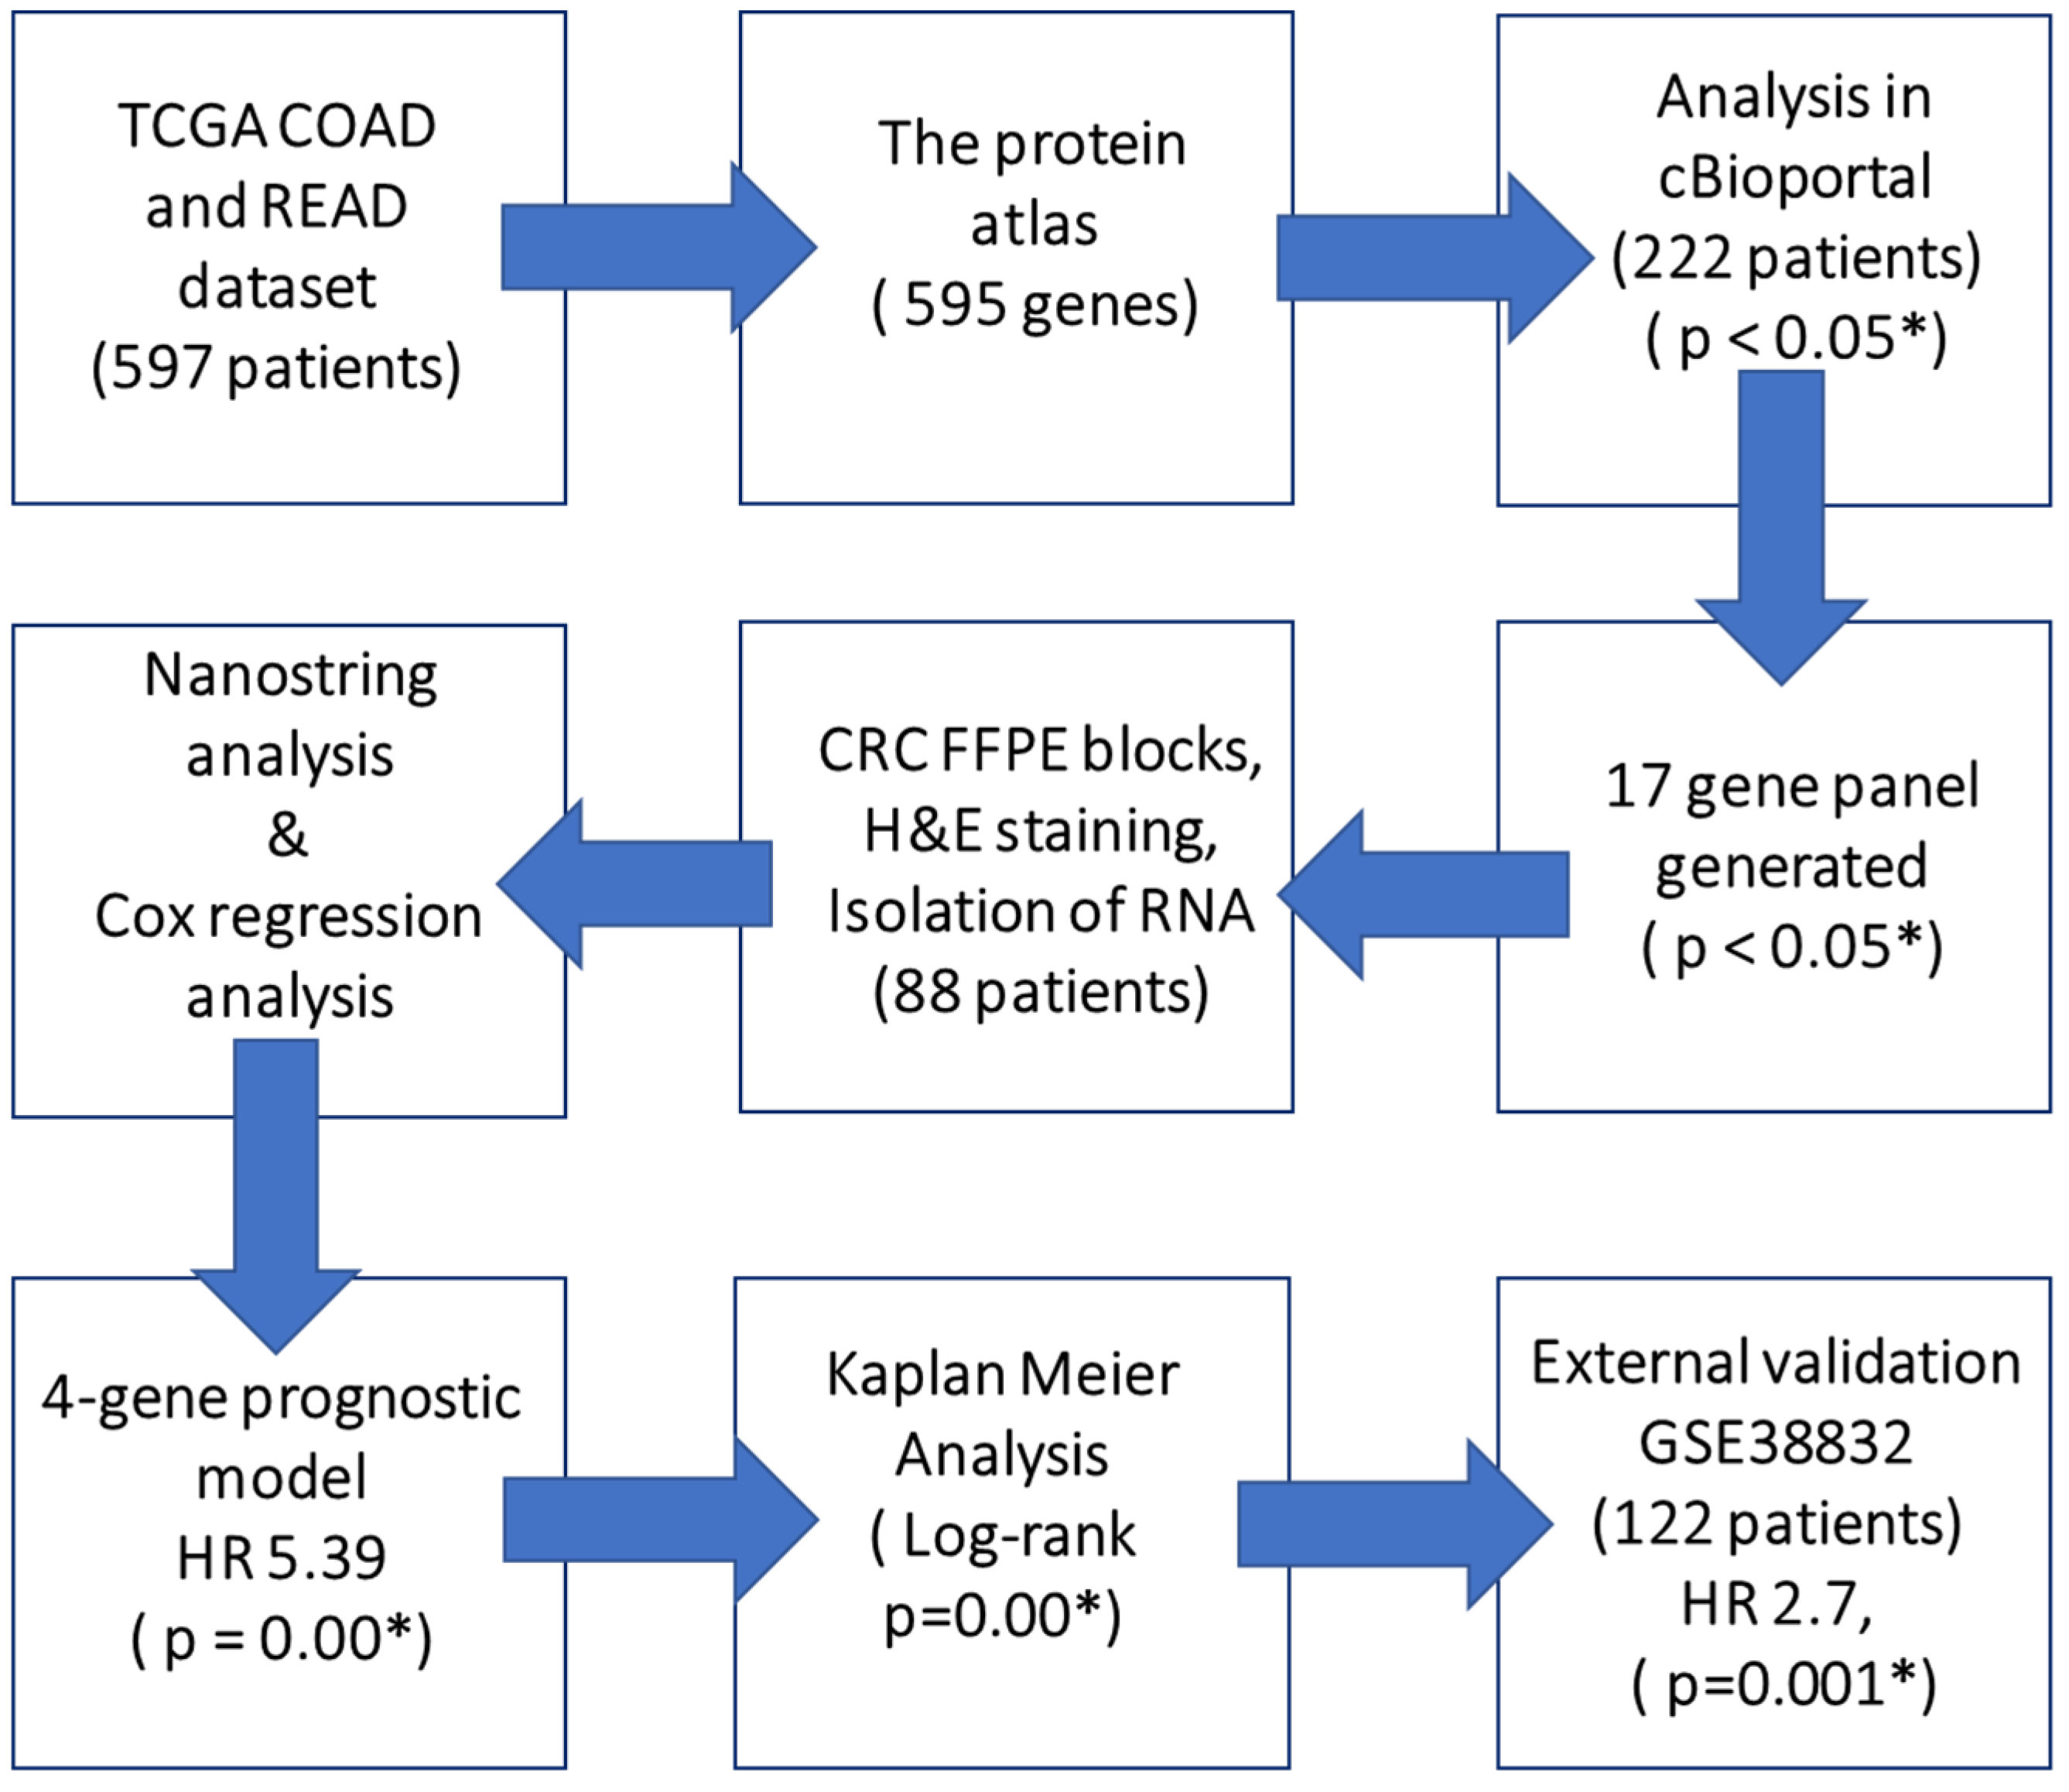
2.1. Exploratory Analysis to Build 17-Gene Panel

To identify risk genes in CRC, 595 candidate genes were accessed through TCGA database through The Human Protein Atlas. The analysis of mRNA expression z-score at a threshold of ± 2.0 revealed significant association (p < 0.05) of combined gene signature using KM analysis in cBioportal. Among 222 CRC patients, a total of 7 genes in combination showed significant alterations with PI4K2B exhibiting the most differential expression in 10% of patients (Table S1). In parallel, 29 genes with prognostic significance in 6 or more varied types of cancers were also run in cBioportal. Most altered gene expression was observed for 10 genes in COAD dataset with YWHAB exhibiting significant changes in 39.10% of CRC patients (Table S2). These 10 genes showed significant prognostic value in > 6 cancers (Table S3). The genes included in the panel are shown in Table 1 along with the comparison between tumor and normal colon gene expression.

2.2. Clinicopathological Characteristics of CRC Patients

The clinicopathological features of the patients included in this study are in Table 2. The clinic-pathological parameters included were: age, gender, stage, grade, metastasis, ethnicity, vital status, and chemotherapy, family history of cancer, alcohol and tobacco consumption. The cut-off for age was determined as 68 years which is average age of diagnosis of colorectal cancer. The median survival time of the patients in the low survival and high survival group was 11.8 and 54.1 months respectively. The Pearson’s chi-square test was utilized to analyze the association between expression of individual genes and clincopathological characteristics (Table S4). CHEK1 showed association with family history of cancer (Pearson χ2 test, p = 0.02 *). The expression of LRRC59 was found to be higher in Stage III and Stage IV patients (Pearson χ2 test, p = 0.01 *). There were no significant associations found for other genes with respect to grade or stage.

2.3. Univariate, Multivariate Analysis and Generation of Prognostic Score

In univariate Cox regression analysis, MCM4 (HR 2.69, p = 0.01 *), YWHAB (HR 3.76, p = 0.001 *), LRRC59 (HR 2.32, p = 0.02 *) and DPP7/2 (HR 0.38, p = 0.02 *) showed significant association with overall survival (Table 3). All combinations were tested that yielded a 4 gene composite signature (YWHAB, MCM4, DPP7/2 and FBXO46) which showed significant association with overall survival independent of other prognostic factors (HR 5.39, 95% CI: 2.19–15.26, p < 0.001 *) (Table 4). Further, independent of other variables, the stage was also found to be significantly associated with OS (HR 2.9, 95% CI: 1.39–6.36, p < 0.001 *) (Table 4). Upon multivariate analysis using Cox regression with other clinicopathological features, the resulting associations with overall survival were: prognostic score (HR 3.42, 95% CI: 1.71–7.94, p <0.001 *), Age (HR 1.05, 95% CI: 0.35–3.19, p = 0.92), Gender (HR 2.34, 95% CI: 0.62–9.37, p = 0.20), patient stage (HR 4.56, 95% CI: 1.33–19.15, p = 0.01 *), Grade (HR 0.19, 95% CI: 0.02–1.18, p = 0.07), ethnicity (HR 2.89, 95% CI: 0.69–12.47, p = 0.14), alcohol consumption (HR 7.38, 95% CI: 1.58–38.14, p = 0.01 *) and tobacco smoking (HR 0.08, 95% CI: 0.01–0.31, p = 0.01 *) (Table 5). The multivariate analysis using only 5 variables (prognostic score, age, stage, ethnicity and alcohol consumption) revealed significant associations between prognostic score (HR 2.6, 95% CI: 1.44–5.10, p < 0.001 *), stage (HR 3.24, 95% CI: 1.32–8.63, p = 0.009 *) and ethnicity (HR 2.46, 95% CI: 0.92–6.75, p = 0.0012 *) (Table S5).

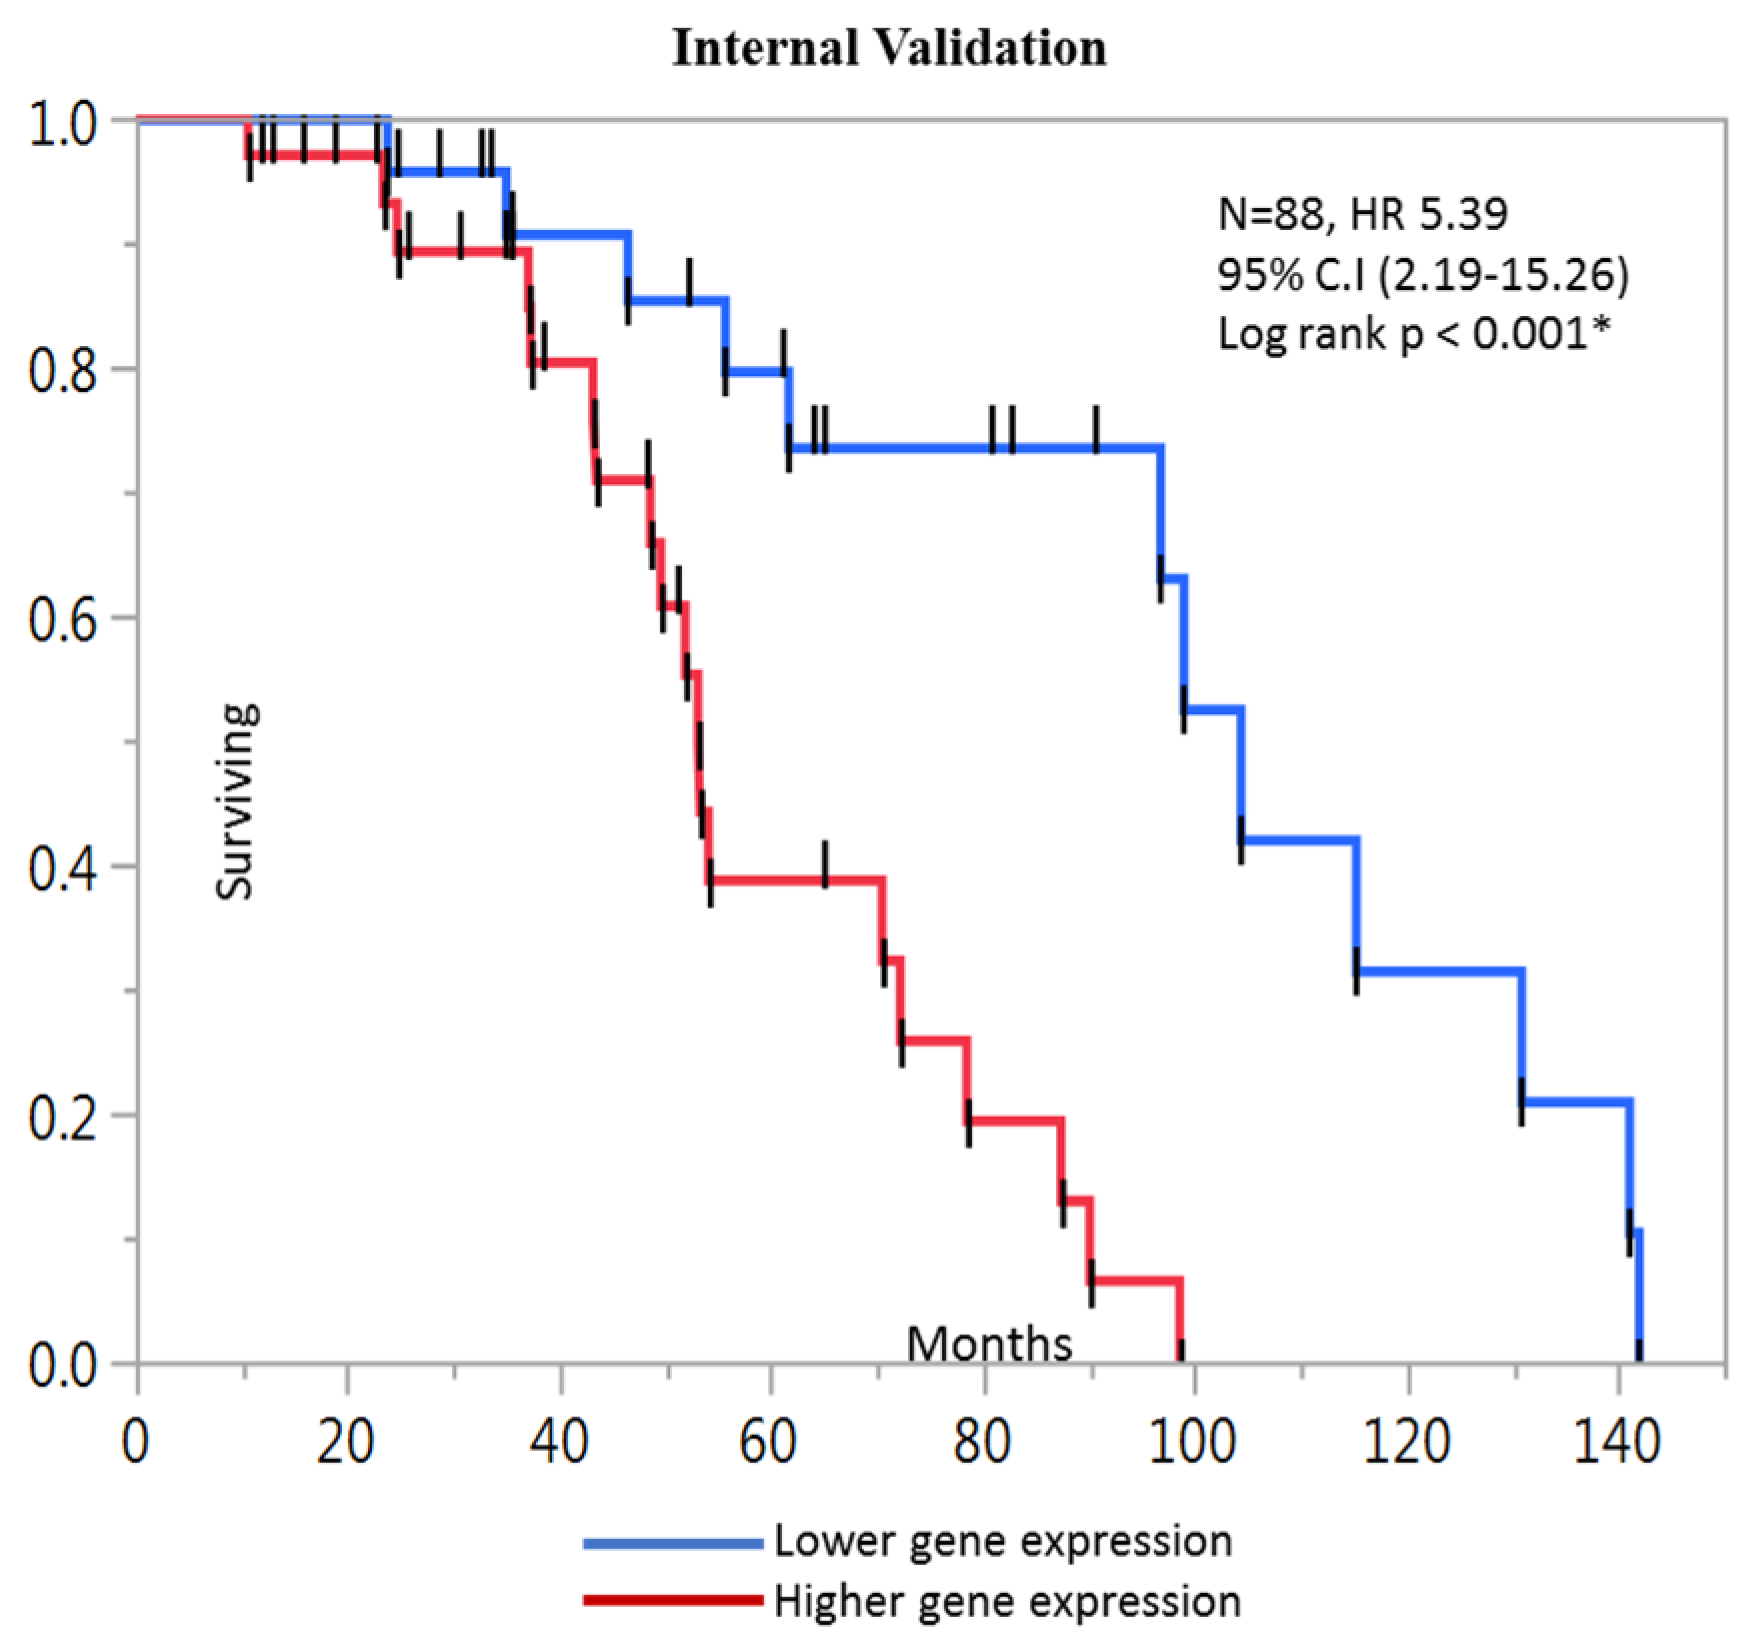
2.4. Kaplan-Meier Analysis

Using Kaplan-Meier analyses, we differentiated high-risk group from low-risk based on gene expression (log-rank test, p < 0.05). The 4 genes relevant to the prognostic score were ran for KM analysis for both internal and external cohorts. In internal dataset the prognostic significance of 4 genes was: YWHAB (HR 3.76, 95% CI: 1.58–9.66, p = 0.001), DPP7/2 (HR 0.38, 95% CI: 0.14–0.89, p = 0.02), MCM4 (HR 2.69, 95% CI: 1.19–6.35, p = 0.01) and FBXO46 (HR 1.4, 95% CI: 0.65–2.94, p = 0.37) (Figure 1). The prognostic score generated after summation of regression coefficient and expression value of four genes separated lower and higher survival among groups, with median survival time of 58 vs. 99 months, respectively (log-rank test, p < 0.001 *) (Figure 2).

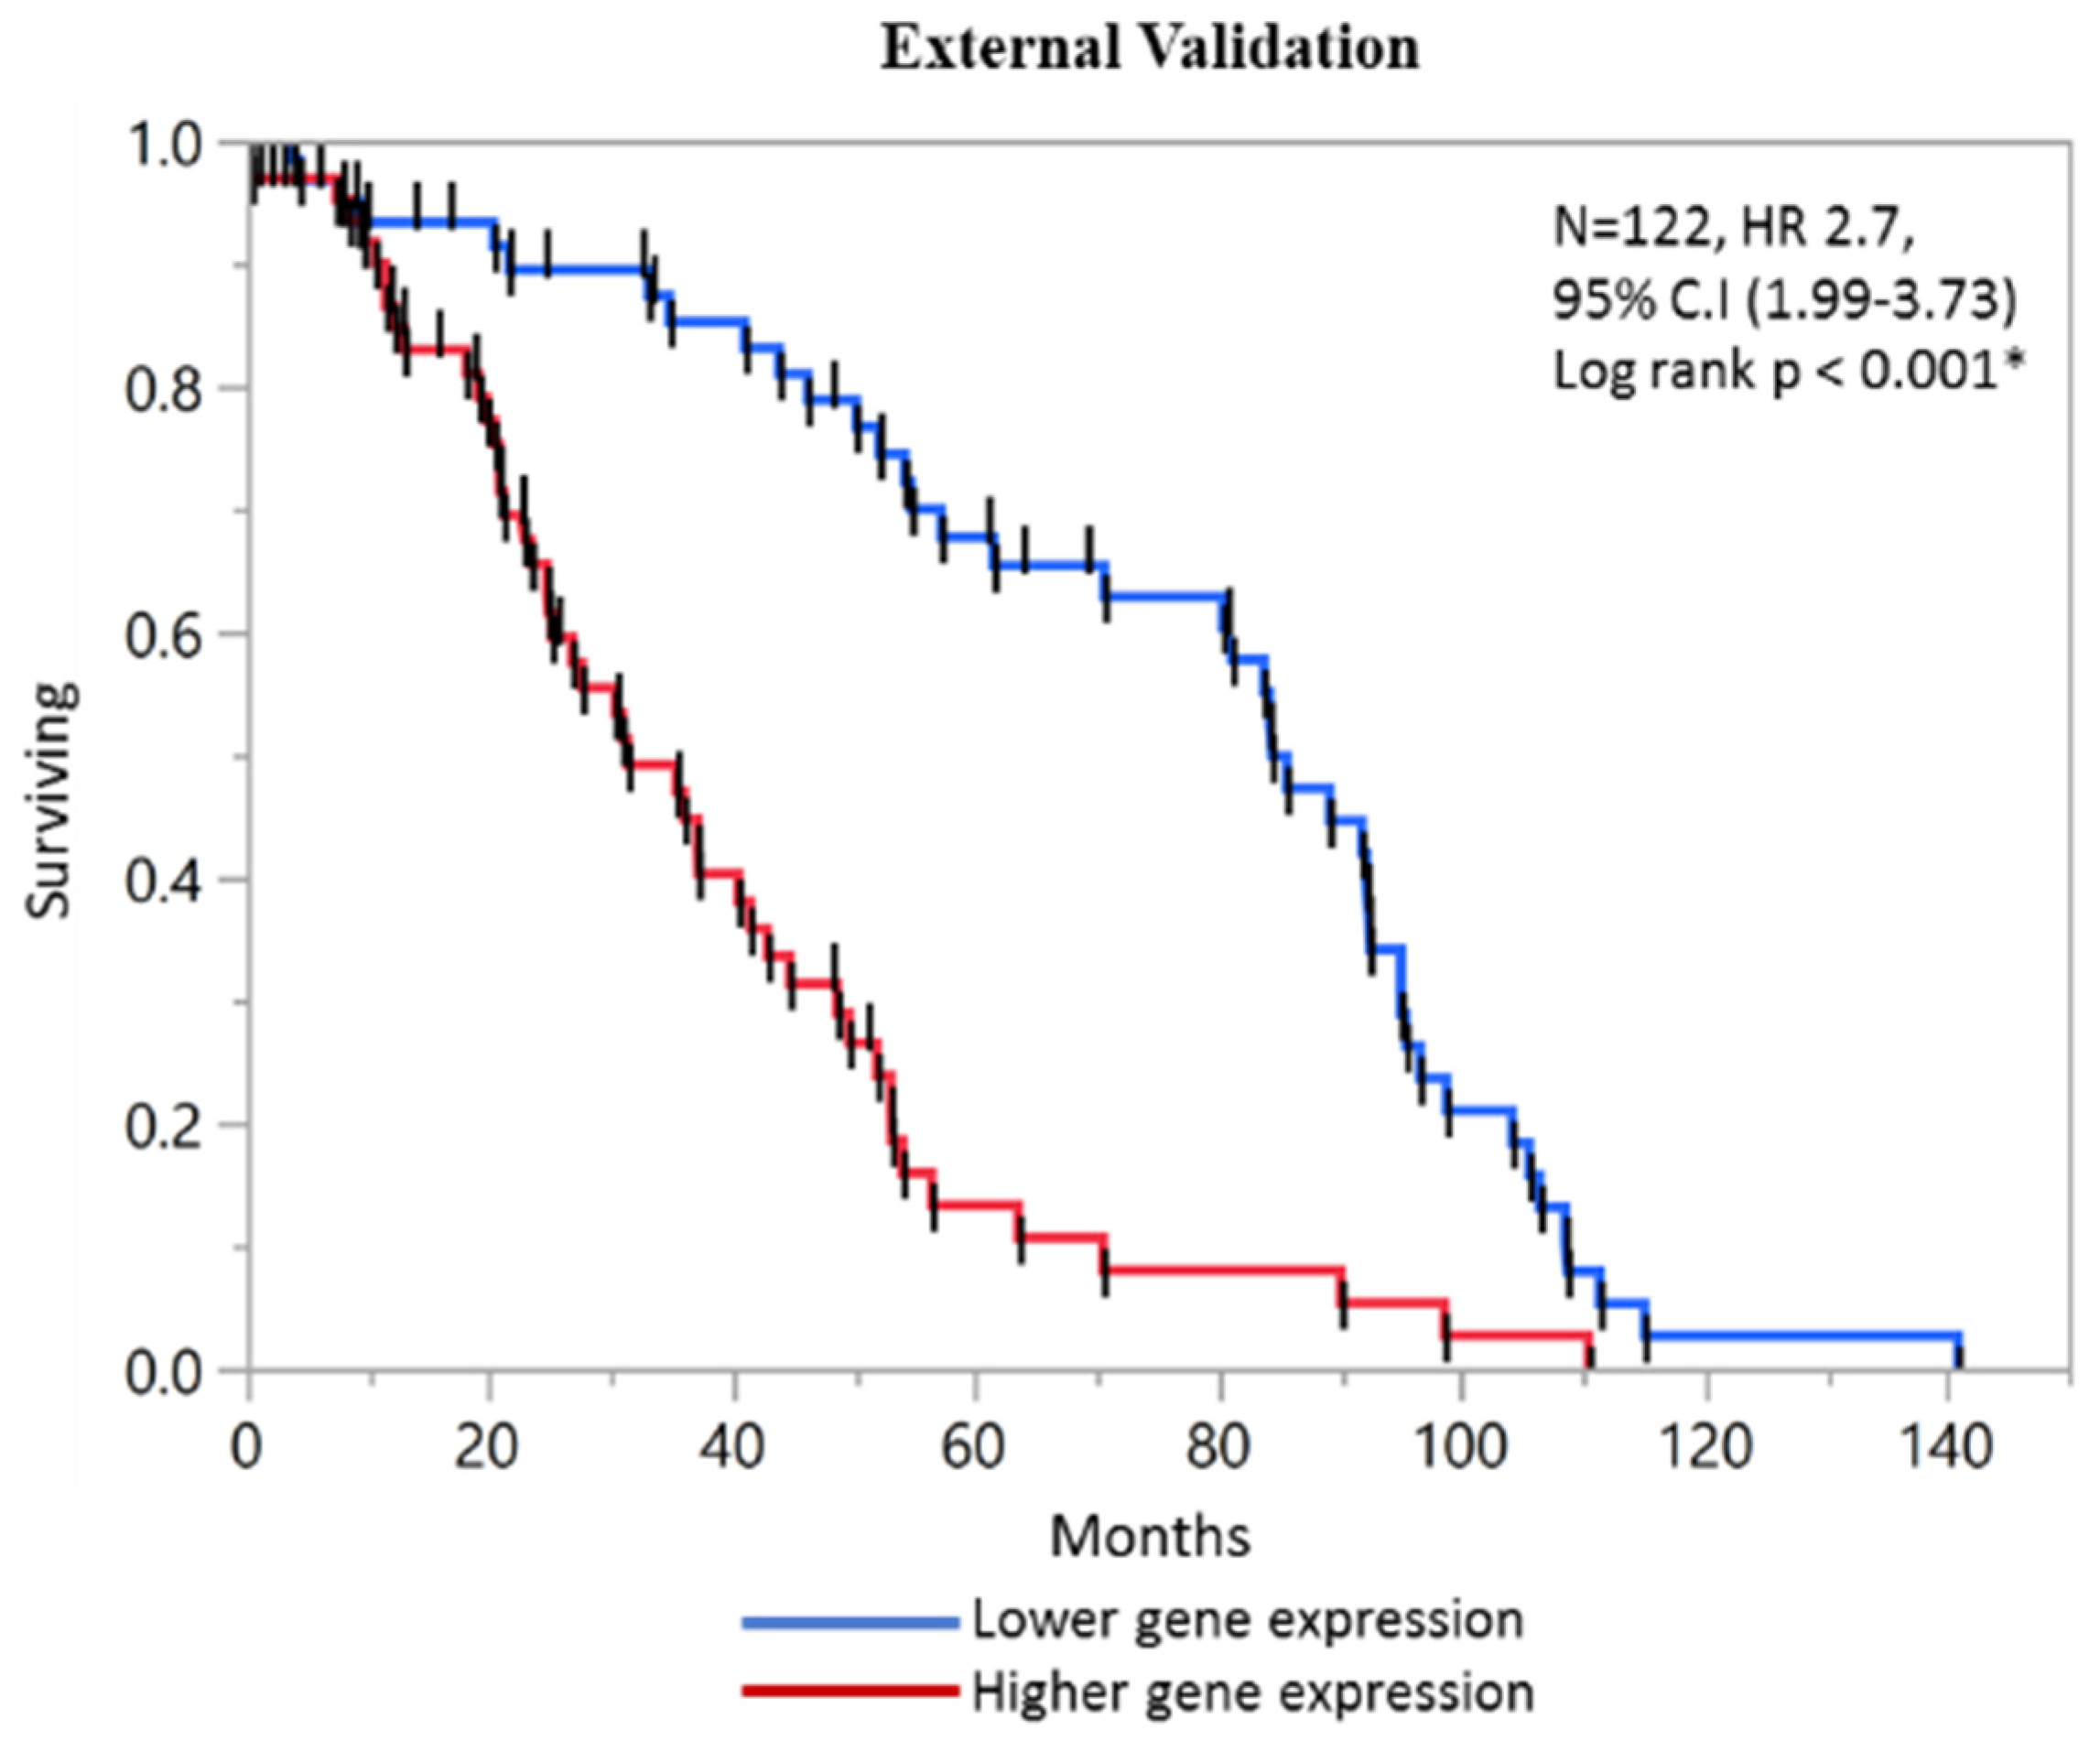
2.5. External Validation of Prognostic Score with GEO Microarray Dataset and ROC analysis

To investigate the predictive potential of our four-gene model, an independent GEO microarray dataset (GSE38832) was acquired. The univariate and multivariate cox regression analysis of this dataset is presented in Table S6. The KM analysis of individual gene is presented in Figure 3. In external dataset the prognostic significance of individual genes was: YWHAB (HR 1.71, 95% CI: 1.12–2.61, p = 0.012), DPP7/2 (HR 0.45, 95% CI: 0.29–0.69, p = 0.0003), MCM4 (HR 3.37, 95% CI: 2.19–5.23, p < 0.001) and FBXO46 (HR 2.02, 95% CI: 1.10–3.69, p = 0.49). The composite prognostic score of all the four genes maintained high significance in achieving separation of lower and high surviving groups, with median of 31 vs. 69 months, respectively (HR 2.7, 95% CI: 1.99–3.73, p < 0.001 *) (Figure 4).
Additionally, ROC analysis was performed on the gene signature. In external dataset, The AUC value of survival at less than 1 year, less than 3 years and more than 3 years was found to be 0.529, 0.705 and 0.722 respectively. In Internal dataset, The AUC value of survival at >1 year, <3 year and >3 years is 0.590, 0.534 and 0.607 respectively (Figure S1).

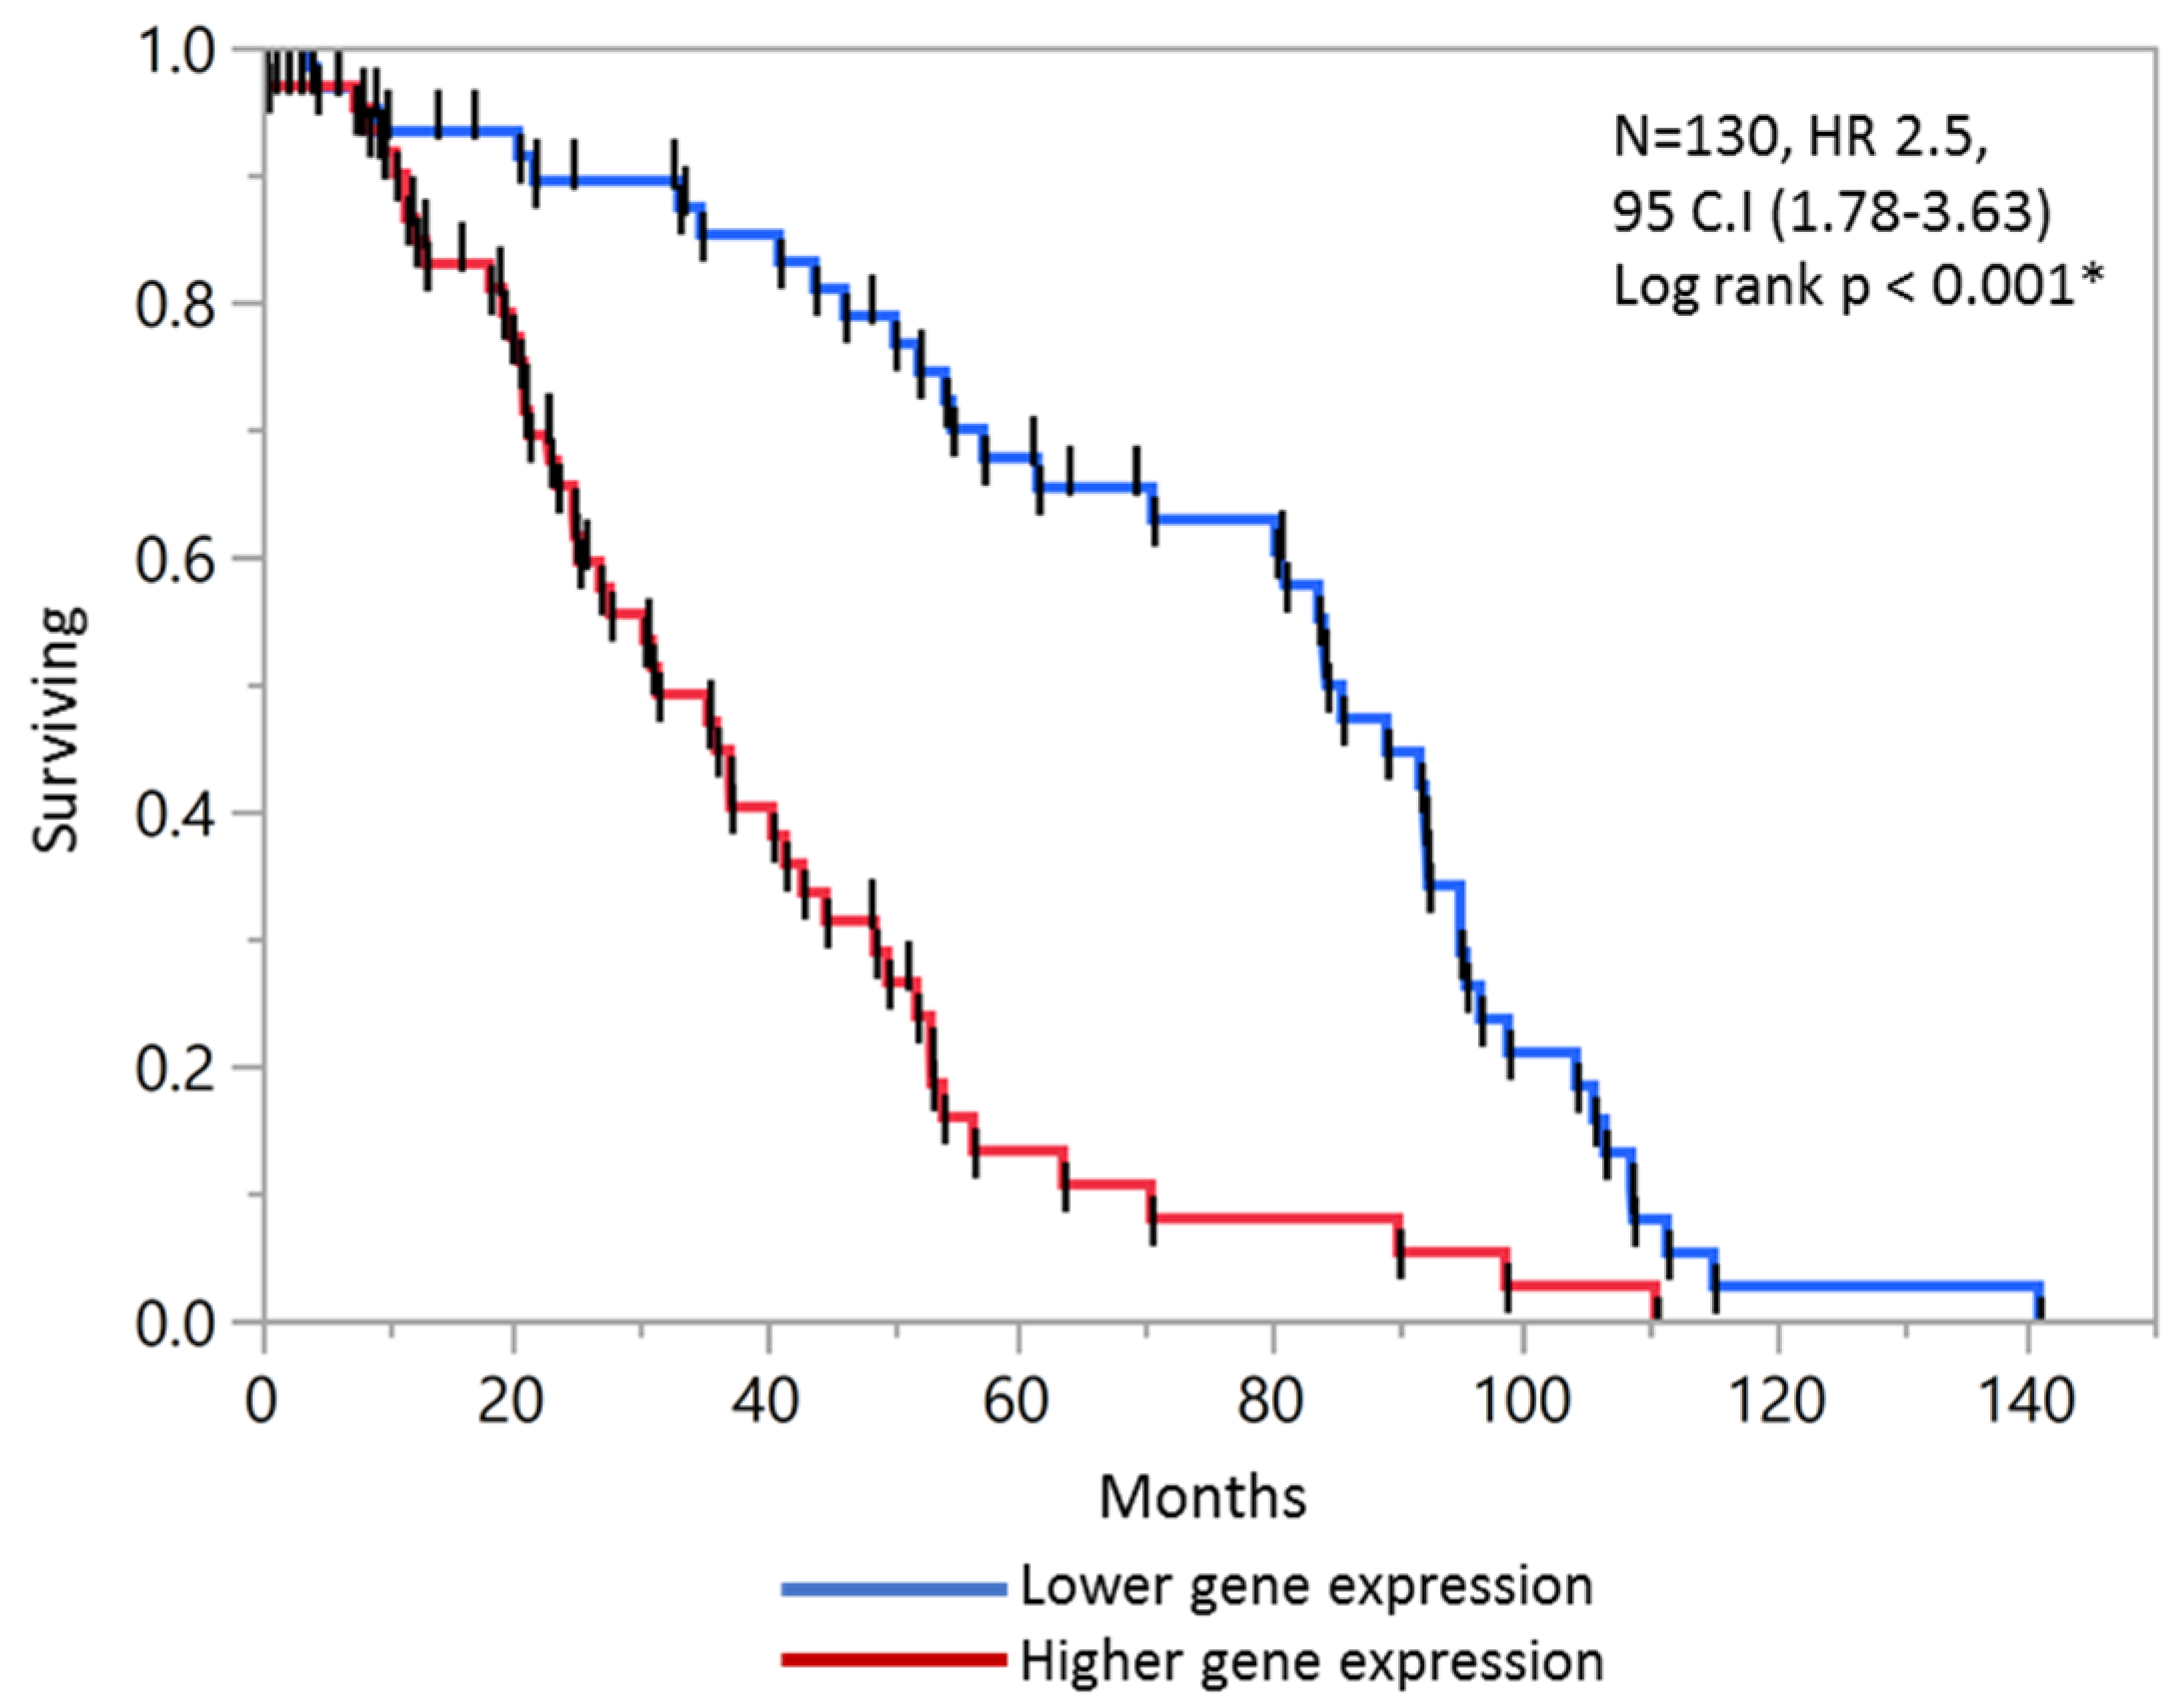
2.6. Validation of Prognostic Score in Combined Stage II and Stage III Patients

The combined analysis of stage II and stage III patients maintained the prognostic validity of the score. High score was found to be significant predictor of OS (HR 2.5, 95 CI: 1.78–3.63, p = 0.001 *). The KM analysis revealed median survival of a high prognostic score to be significantly less than that of a low prognostic score, 37.6 vs. 75.9 months, respectively (Figure 5).

2.7. Comparison with Normal TCGA Datasets

To further explore the variations observed in our data, the differential gene expression between normal and colon adenocarcinoma dataset was accessed through GEPIA portal. YWHAB, LRRC59 and MCM4 was significantly overexpressed in tumor tissue (p < 0.05) (Figure 6). FBXO46 showed slightly higher expression in cancer tumors but did not reach statistical significance. DPP7/2 was found to be lower in tumor tissue.

2.8. Biological Features of Significant Genes Found in This Panel

The functional role of the significant genes in this panel are presented in Table 6. YWHAB plays a role in signal transduction and cell cycle. MCM4 plays an essential role in DNA replication. DPP7/2 is associated with apoptosis. FBXO46 plays a role in cancer biogenesis and LRRC59 promotes angiogenesis and can fuel tumor growth.

2.9. Correlation Cluster of Expressed Genes

The Correlation cluster analysis was performed on Nanostring expression data acquired from clinical FFPE tissue blocks. All the 17 genes from the panel were clustered on the basis of spearman correlation (Figure S2). FBXO46 correlated positively with YWHAB (0.95, p < 0.0001) and DPP7/2 (0.90, p < 0.0001). DPP7/2 showed negative correlation with LRRC59 (−0.49, p < 0.0001) and PCMT1 (−0.50, p < 0.0001).

3. Discussion

CRC is the third deadliest cancer in the United States. It is essential to develop and validate new gene expression-based prognostic markers that can predict clinical outcomes more effectively. The present study was conducted with two goals: first, as a single biomarker is not scalable to larger population, we set out to generate a robust composite four gene prognostic score to predict survival status in CRC patients; and second, to further validate some of the massive amount of data has been generated through TCGA and other databases. Additionally, in this study, African-American and Caucasian patient’s sample along with other parameters provided an opportunity to explore variations in gene expression based on various clinic-pathological characteristics. There was an effort to identify new prognostic genes as the African-American population has higher rate of incidence and mortality due to CRC [29]. This study analyzed in silico RNA seq data from TCGA and built on it to develop and experimentally validate a prognostic model through Nanostring analysis. In addition to screening of CRC prognostic genes from The Protein Atlas, genes with prognostic utility in 6 or more cancers were also included. The rationale of this top-down selection was to check the clinical significance of these genes in CRC patients. As these genes are aberrant in multiple cancers, they might be playing an important role in CRC tumorigenesis and could yield promising prognostic information. The four-gene signature, YWHAB, MCM4, FBXO46 and DPP7/2 (HR 5.39, 95% CI: 2.19–15.26, p < 0.001 *), was developed after multivariate Cox proportional hazard regression on the mRNA expression data from Nanostring analysis. In univariate Cox regression analysis, only stage showed prognostic correlation with overall survival (HR 2.9, 95% CI: 1.39–6.36, p < 0.001 *). In multivariate cox regression model, the stage and prognostic score maintained strong correlation with overall survival. Interestingly, alcohol consumption and tobacco consumption showed inverse correlation with overall survival. All the genes in the final prognostic model play a role in cancer growth and progression. Unexpectedly, 3 of the 4 genes are from the gene list with prognostic value in > 6 cancers (YWHAB, MCM4, FBXO46). This hints at the previously unidentified role of these genes in CRC tumorigenesis and prognosis. One of the genes, YWHAB, is included in metastatic-prone 54 gene signature for colorectal cancer [22]. Genetic alterations in YWHAB are observed in large scale integrated genomic analysis in multiple cancers [23]. Further, it has been revealed that B-cell translocation gene (BTG3) knockdown is related to over-expression of multiple genes including YWHAB in colorectal cancer [30]. As YWHAB is involved in multiple signaling pathways inside the cell, it might act downstream of genes like BTG3 in CRC carcinogenesis [30]. In another proteomics study, the differential expression of YWHAB was quantified using a comparative MALTI/TOF analysis in response to anti-tumor response of retinoic acids [31]. Although LRRC59 was not part of the 4 gene prognostic score it showed higher expression in tumor tissue and was found to be associated with stage and overall survival (Table S4). LRRC59 is involved in chromosomal rearrangement in multiple cancers [28]. LRRC59 binds to Fibroblast growth factor 1 (FGF1) and imports it into the nucleus [24]. FGFs are known to promote tumor angiogenesis by their synergistic action with Vascular Endothelial Growth Factor (VEGF) [25]. LRRC59 is associated with a significantly poorer prognosis in breast cancer [32]. Additionally, LRRC59 has been shown to transport CIP2A (cancer inhibitor of PP2A) into the nucleus, disrupting mitotic checkpoints and deregulating the cell cycle in prostate cancer cells [33]. The minichromosomal maintenance (MCM) proteins play an essential role in DNA replication [34]. The dysregulation of MCM proteins has been linked with cancer and has been a promising prognostic marker, especially in esophageal adenocarcinoma and pancreatic lesions [26]. DPP7/2 encodes aminopeptidases which are expressed in both quiescent lymphocytes and fibroblasts, maintaining a G0 state and inhibiting apoptosis. As p53 regulates the DPP7/2 promoter, reduced expression is associated with cell cycle deregulation, as well as induction of c-Myc [35]. Interestingly, the inhibition of DPP7/2 induces apoptosis in resting lymphocytes but not activated lymphocytes. To this end, DPP7/2 driven apoptosis has been shown to be reliable prognostic factor in chronic lymphocytic leukemia (CLL), as CLL B-cells sensitive to DPP7/2 inhibition are in G0, while resistant CLL B-cells are partially activated [27]. FBXO46 has not been as thoroughly characterized as the other prognostic genes, but it has been found to be dysregulated in cancer and plays a role in biogenesis of cancer [36].
Among 17 genes that were included in this panel, the expression of YWHAB, MCM4, LRRC59 and FBXO46 was found to be elevated in tumor tissue compared to normal. Although non-significant, DPP7/2 was expressed at slightly higher levels in normal tissue. This may be due to expression being limited to only a subset of quiescent lymphocytes and fibroblasts. Patients with lower expression of DPP7/2 had poorer overall survival in our study. In correlation analysis, FBXO46 was found to be highly correlated with YWHAB (Pearson χ2 test, p < 0.0001). In combination, they might play a significant role in CRC tumorigenesis. In another significant correlation, DPP7/2 showed negative correlation with LRRC59 (Pearson χ2 test, p < 0.0001) and PCMT1 (Pearson χ2 test, p < 0.0001). As the expression of DPP7/2 is downregulated in CRC tumor tissues, it shows inverse correlation with PCMT1, which has been shown to express at higher amounts in bladder cancer [37].
The prognostic score generated in this study was also evaluated for stage-specific prognostic significance. Identification of low risk patients in stage II and III is critical as several studies have found that only surgery is sufficient to cure most of the patients and chemotherapy was beneficial only for only a subset of patients [38]. If a novel prognostic method is developed, these low risk patients could be spared from toxic effects and numerous sequelae of chemotherapy. Several gene expression signature-based tests are currently being validated in larger cohorts, but multiple new signatures are continuously being reported [39,40,41]. There are several studies which have identified single gene like PDL-1, Layilin and Apolipoprotein E with prognostic significance in colorectal cancer [42,43,44]. There are several multiple gene signatures also that have been reported to divide patients on the basis of overall survival [45,46]. In this study, the utilization of a unique approach to include genes with prognostic significance in > 6 cancers added novelty to the 17 gene panel. These novel genes can assist in a more accurate prognosis of patients, especially stage II and stage III, which might not be as accurately defined through other gene panels. While databases such as Oncomine can be valuable tools, expression values might differ in tumor tissues for this prognostic gene signature, most likely due to the lack of survival data and clinical information. Our study attempts to find a consensus prognostic score after utilizing TPA, cBioportal, Nanostring and GEO datasets. To maximize the clinical impact in a specific stage, a recent study utilized a Random Forest analysis to identify 8 gene-signature for risk stratification in stage I of AJCC [47]. Our prognostic signature significantly differentiated patients based on overall survival and maintained significance for stage II stage III patients, which are prognostically difficult to differentiate. This stage specific risk score generation lends specificity to prognostic scores, increasing accuracy in the clinical setting. Future validation of these genes in larger cohorts including colorectal cancer specific functional and regulatory roles remains to be elucidated.

4. Materials and Methods

4.1. Data Source and Generation of 17-Gene Panel

The exploratory TCGA cohort consisted of 597 CRC patients. The extraction of 595 candidate genes for CRC was performed through The Human Protein Atlas (TPA) (https://www.proteinatlas.org) (Figure 7 and Figure 8). The gene list was downloaded in .tsv format and was stratified on the basis of the individual gene’s significance in OS prognosis of CRC. Next, these genes were screened for their combined prognostic significance in cBioportal (http://www.cbioportal.org) (Tables S1 and S2). The cBioportal is an online database with mRNA expression data derived on the Agilent microarray platform with a colon adenocarcinoma cohort of 222 samples. Genes were queried with an mRNA expression z-score threshold value of ± 2.0. Genes not reaching significant variable expression from the 595 candidate genes were removed through backward deletion, leaving 7 significantly altered genes in cBioportal (PI4K2B, PBXIP1, CHEK1, DLAT, FAM50A, KDM4B, DPP7/2) (p < 0.0001). In combination, the expression of these genes significantly differentiated CRC patients on the basis of overall survival (Figure 8). As Multiple platforms like TPA and cBiportal helps in discovery and screening of potential candidate prognostic gene before it’s validation on clinical samples. To expand the gene panel and to discover new prognostic genes, a novel strategy was utilized to include genes with aberrant expression in multiple cancers. For this a total of > 10,000 genes with prognostic significance in 17 cancers were downloaded from TPA database. Of these twenty-nine genes showed significant variable expression in 6 or more diverse types of cancer. These genes were queried in cBioportal for their significance in CRC, and the top 10 altered genes on the basis of percent altered samples, were added to the panel (YWHAB, DSG2, PCMT1, MCM4, AGFG1, E2F1, LRRC59, SLAMF6, FBXO46, ITGA5) (Tables S2 and S3). In the initial screening of aforementioned 7 genes and 10 genes, it was made sure that individual gene was altered in >5% of cBioportal screening dataset. The role of these genes in CRC prognosis was tested using clinical and external dataset. For external validation, human expression profile dataset of an independent CRC study (GSE38832, n = 122) was downloaded from Gene Expression Omnibus (GEO) database (https://0-www-ncbi-nlm-nih-gov.brum.beds.ac.uk/geo). The GSE38832 study was performed using an Affymetrix Human Genome U133 Plus 2.0 Array. The downloaded data was further curated for all the relevant clinical and follow-up data features. The flowchart of the entire study is depicted in (Figure 9).

4.2. Patient Characteristics

For internal validation, Formalin Fixed Paraffin Embedded (FFPE) blocks were accessed from pathology archives at the Medical College of Georgia at Augusta University, Augusta, GA 30912, USA. Under an IRB approved protocol (HAC # 611298), CRC patients with 5 years’ follow-up were included in this study. A total of 88 patients from all the 4 stages fit in our inclusion criteria on the basis of survival duration after diagnosis. A total of 26 patients were administered chemotherapy after surgery and 62 patients did not receive any chemotherapy. No Informed consent from the patients was required as this was a retrospective study on de-identified FFPE samples. The patients were stratified on the basis of overall survival in two groups, with higher (patient that survived >3 years) and lower survival (patient that survived <1 year) along with American Joint Committee on Cancer (AJCC) staging system (I to IV), grade, gender, age, distant metastasis, location and vital status. Only histologically confirmed cancer patients were included in this study. The samples with insufficient documentation, lack of tumor tissue in blocks, failure of RNA isolation or highly degraded RNA were not included in this study.

4.3. FFPE Tissue Sectioning and H&E Staining

FFPE blocks were used to produce fine sections for further microscopic analysis and RNA isolation. For tissues that had rich cancerous region, only five 5 μm sections were cut and for small tissues twenty sections were cut. H&E staining was performed using standard protocol and was examined for tumor-rich regions by a board-certified pathologist.

4.4. RNA Isolation

Total RNA was isolated through miRNEasy FFPE kit (Qiagen, Hilden, Germany) using standard protocol. The eluted RNA was quantified using Nanodrop spectrophotometer (NanoDrop ND-1000, NanoDrop Technologies, Wilmington, NC, USA).

4.5. Quantification of mRNA Molecules Using Nanostring Platform

To quantify mRNA expression of 17 genes, we employed multiplex, high-throughput digital quantification instrument by Nanostring (NanoString Technologies Inc., Seattle, WA, USA). Additionally, 6 control genes were also quantified for normalization of gene expression. A total of 300 ng of total RNA was used as an input for this analysis. Nanostring and its nCounter PlexSet technology is a digital quantification system, which quantifies RNA molecules using a target specific oligonucleotide probe pairs in a highly specific manner. PlexSet contains uniquely coded fluorescent barcodes that are linked to reporter tags and a biotinylated universal capture tag. The reporter tags emit a unique signature fluorescence that is individually resolved and counted during data capture and analysis. On the other hand, the universal capture tag anchors specific RNA molecules to streptavidin-coated lane on the nCounter instrument [48]. The Nanostring assay was performed as per the manufacturer’s instructions. The data collection that involves detection, resolution and quantification of individual florescent barcodes was performed later on a separate instrument, nCounter Digital Analyzer (DA). The fields of view (FOV) setting for DA was set at 280 FOV, as previously noted [49].

4.6. mRNA Expression Data Normalization

The raw gene expression counts were processed and normalized according to the manufacturer’s recommendations (NanoString Technologies Inc., Seattle, WA, USA). The geometric mean of the negative and positive control was used to normalize the data. The second normalization was later performed using 6 internal control genes (ABCF1, GUSB, HPRT1, LDHA, POLR1B, RPLO). The normalizations were performed using the nCounter software (NanoString Technologies Inc., Seattle, WA, USA).

4.7. Correlation Analysis and Gene Expression Comparison with Normal Tissue

For correlation among the genes, cluster analysis of 17 genes was performed on the basis of Spearman correlation coefficient. For normal and tumor tissue expression comparison, Gene Expression Profiling Integrative Analysis (GEPIA) database (http://gepia.cancer-pku.cn) was utilized. In GEPIA, the COAD tumor (n = 275) dataset was compared against combined gene expression data of normal tissues from TCGA and Genotype-Tissue Expression (GTEx) data (n = 349). In GEPIA, standard parameters with Log2FC cutoff was set at 1 and p-value cut-off at 0.01 were used.

4.8. Construction and Validation of a 4 Gene Prognostic Model

The prognostic score was generated using the Cox proportion regression coefficient for each gene. For every patient the prognostic score was calculated by multiplying the expression value of a gene with its corresponding Cox proportion regression coefficient (Prognostic score = Σ Cox regression coefficient of Genei * expression value of gene Genei). Separate coefficients were calculated for both internal and external datasets. The resulting prognostic score based on these coefficients was used to divide patients into categorical variables, i.e., high score and low score groups based on median cut-off threshold. This categorical variables were utilized to differentiate patients in stage II and stage III from the internal and external datasets. The KM Analysis was performed to assess the utility of this model to differentiate these groups.

4.9. Statistical Analysis

The continuous variables in this study including Nanostring expression counts are shown as the mean ± SE. The median of the normalized counts was taken to divide patients into two groups—individuals with higher expression and with lower expression. The relationship between gene expression of these groups were compared with the categorical clinic-pathological parameters using Pearson χ2 test. The univariate and multivariate analysis of different genes was performed using Cox proportion hazard regression method. The Hazard ratio and 95% confidence interval values were also derived from Cox proportion hazard model. Kaplan-Meier method was used to analyze survival and log-rank test was used to calculate the differences in their distribution. The calculations of p-values were two-sided, and p < 0.05 was defined as statistically significant. Additionally, ROC (Receiver operating characteristic) analysis was performed for 4 gene signature on both external and clinical datasets. The statistical analyses were conducted using JMP-Pro (version 14.0.0, SAS Institute, Cary, USA) and GraphPad Prism (version 8 GraphPad Software, La Jolla California USA).

5. Conclusions

In summary, our study developed a novel four gene prognostic model which has been used to predict clinical outcomes in CRC patients. Our approach to first identify risk genes from TCGA datasets and validate experimentally can be equally insightful in other cancers. There is additional research required to assess the functional role of these genes in colorectal tumors. We are in the process of validating this study on a larger cohort and independent datasets. The efforts to develop similar gene signatures promises to equip clinicians with better information to adopt novel personalized interventions for higher risk patients.

Supplementary Materials

Author Contributions

P.A. and R.K. conceived, designed and wrote the manuscript. S.H., A.K.M., P.A., C.B., S.A. and K.J. performed the experiments. P.A., G.K.G., V.K. and R.K. analyzed the data. S.F., A.K.M. and A.R. helped with manuscript and data review. All authors read and approved the final manuscript.

Funding

This study was funded by the start-up grant awarded to R.K. by Medical College of Georgia by Augusta University.

Conflicts of Interest

The authors declare no conflict of interest.

References

  1. Siegel, R.L.; Miller, K.D.; Fedewa, S.A.; Ahnen, D.J.; Meester, R.G.S.; Barzi, A.; Jemal, A. Colorectal cancer statistics, 2017. CA Cancer J. Clin. 2017, 67, 177–193. [Google Scholar] [CrossRef] [PubMed]
  2. Siegel, R.L.; Miller, K.D.; Jemal, A. Cancer statistics, 2019. CA Cancer J. Clin. 2019, 69, 7–34. [Google Scholar] [CrossRef] [PubMed]
  3. Marcker Espersen, M.L.; Linnemann, D.; Christensen, I.J.; Alamili, M.; Troelsen, J.T.; Hogdall, E. SOX9 expression predicts relapse of stage II colon cancer patients. Hum. Pathol 2016, 52, 38–46. [Google Scholar] [CrossRef] [PubMed] [Green Version]
  4. Zuo, S.; Dai, G.; Ren, X. Identification of a 6-gene signature predicting prognosis for colorectal cancer. Cancer Cell Int. 2019, 19, 6. [Google Scholar] [CrossRef] [PubMed]
  5. Lee, U.; Frankenberger, C.; Yun, J.; Bevilacqua, E.; Caldas, C.; Chin, S.F.; Rueda, O.M.; Reinitz, J.; Rosner, M.R. A prognostic gene signature for metastasis-free survival of triple negative breast cancer patients. PLoS ONE 2013, 8, e82125. [Google Scholar] [CrossRef]
  6. Zhan, X.H.; Jiao, J.W.; Zhang, H.F.; Li, C.Q.; Zhao, J.M.; Liao, L.D.; Wu, J.Y.; Wu, B.L.; Wu, Z.Y.; Wang, S.H.; et al. A three-gene signature from protein-protein interaction network of LOXL2- and actin-related proteins for esophageal squamous cell carcinoma prognosis. Cancer Med. 2017, 6, 1707–1719. [Google Scholar] [CrossRef] [PubMed]
  7. O’Connell, M.J.; Lavery, I.; Yothers, G.; Paik, S.; Clark-Langone, K.M.; Lopatin, M.; Watson, D.; Baehner, F.L.; Shak, S.; Baker, J.; et al. Relationship between tumor gene expression and recurrence in four independent studies of patients with stage II/III colon cancer treated with surgery alone or surgery plus adjuvant fluorouracil plus leucovorin. J. Clin. Oncol. 2010, 28, 3937–3944. [Google Scholar] [CrossRef]
  8. Kennedy, R.D.; Bylesjo, M.; Kerr, P.; Davison, T.; Black, J.M.; Kay, E.W.; Holt, R.J.; Proutski, V.; Ahdesmaki, M.; Farztdinov, V.; et al. Development and independent validation of a prognostic assay for stage II colon cancer using formalin-fixed paraffin-embedded tissue. J. Clin. Oncol. 2011, 29, 4620–4626. [Google Scholar] [CrossRef]
  9. Salazar, R.; Roepman, P.; Capella, G.; Moreno, V.; Simon, I.; Dreezen, C.; Lopez-Doriga, A.; Santos, C.; Marijnen, C.; Westerga, J.; et al. Gene expression signature to improve prognosis prediction of stage II and III colorectal cancer. J. Clin. Oncol. 2011, 29, 17–24. [Google Scholar] [CrossRef]
  10. Chen, H.; Sun, X.; Ge, W.; Qian, Y.; Bai, R.; Zheng, S. A seven-gene signature predicts overall survival of patients with colorectal cancer. Oncotarget 2017, 8, 95054–95065. [Google Scholar] [CrossRef]
  11. Di Narzo, A.F.; Tejpar, S.; Rossi, S.; Yan, P.; Popovici, V.; Wirapati, P.; Budinska, E.; Xie, T.; Estrella, H.; Pavlicek, A.; et al. Test of four colon cancer risk-scores in formalin fixed paraffin embedded microarray gene expression data. J. Natl. Cancer Inst. 2014, 106. [Google Scholar] [CrossRef] [PubMed]
  12. Wang, Z.; Jensen, M.A.; Zenklusen, J.C. A Practical Guide to The Cancer Genome Atlas (TCGA). Methods Mol. Biol. 2016, 1418, 111–141. [Google Scholar] [CrossRef] [PubMed]
  13. Uhlen, M.; Zhang, C.; Lee, S.; Sjostedt, E.; Fagerberg, L.; Bidkhori, G.; Benfeitas, R.; Arif, M.; Liu, Z.; Edfors, F.; et al. A pathology atlas of the human cancer transcriptome. Science 2017, 357. [Google Scholar] [CrossRef] [PubMed]
  14. Gao, J.; Aksoy, B.A.; Dogrusoz, U.; Dresdner, G.; Gross, B.; Sumer, S.O.; Sun, Y.; Jacobsen, A.; Sinha, R.; Larsson, E.; et al. Integrative analysis of complex cancer genomics and clinical profiles using the cBioPortal. Sci. Signal. 2013, 6, pl1. [Google Scholar] [CrossRef] [PubMed]
  15. Anastassiou, D.; Rumjantseva, V.; Cheng, W.; Huang, J.; Canoll, P.D.; Yamashiro, D.J.; Kandel, J.J. Human cancer cells express Slug-based epithelial-mesenchymal transition gene expression signature obtained in vivo. BMC Cancer 2011, 11, 529. [Google Scholar] [CrossRef] [PubMed]
  16. Bandres, E.; Malumbres, R.; Cubedo, E.; Honorato, B.; Zarate, R.; Labarga, A.; Gabisu, U.; Sola, J.J.; Garcia-Foncillas, J. A gene signature of 8 genes could identify the risk of recurrence and progression in Dukes’ B colon cancer patients. Oncol. Rep. 2007, 17, 1089–1094. [Google Scholar] [CrossRef] [PubMed]
  17. Zhu, J.; Deane, N.G.; Lewis, K.B.; Padmanabhan, C.; Washington, M.K.; Ciombor, K.K.; Timmers, C.; Goldberg, R.M.; Beauchamp, R.D.; Chen, X. Evaluation of frozen tissue-derived prognostic gene expression signatures in FFPE colorectal cancer samples. Sci. Rep. 2016, 6, 33273. [Google Scholar] [CrossRef] [PubMed] [Green Version]
  18. Barrier, A.; Roser, F.; Boelle, P.Y.; Franc, B.; Tse, C.; Brault, D.; Lacaine, F.; Houry, S.; Callard, P.; Penna, C.; et al. Prognosis of stage II colon cancer by non-neoplastic mucosa gene expression profiling. Oncogene 2007, 26, 2642–2648. [Google Scholar] [CrossRef]
  19. Merlos-Suarez, A.; Barriga, F.M.; Jung, P.; Iglesias, M.; Cespedes, M.V.; Rossell, D.; Sevillano, M.; Hernando-Momblona, X.; da Silva-Diz, V.; Munoz, P.; et al. The intestinal stem cell signature identifies colorectal cancer stem cells and predicts disease relapse. Cell Stem Cell 2011, 8, 511–524. [Google Scholar] [CrossRef]
  20. Tang, Z.; Li, C.; Kang, B.; Gao, G.; Li, C.; Zhang, Z. GEPIA: A web server for cancer and normal gene expression profiling and interactive analyses. Nucleic Acids Res. 2017, 45, W98–W102. [Google Scholar] [CrossRef]
  21. Consortium, G.T. The Genotype-Tissue Expression (GTEx) project. Nat. Genet. 2013, 45, 580–585. [Google Scholar] [CrossRef]
  22. Hong, Y.; Downey, T.; Eu, K.W.; Koh, P.K.; Cheah, P.Y. A ’metastasis-prone’ signature for early-stage mismatch-repair proficient sporadic colorectal cancer patients and its implications for possible therapeutics. Clin. Exp. Metastasis 2010, 27, 83–90. [Google Scholar] [CrossRef] [PubMed]
  23. Santarius, T.; Shipley, J.; Brewer, D.; Stratton, M.R.; Cooper, C.S. A census of amplified and overexpressed human cancer genes. Nat. Rev. Cancer 2010, 10, 59–64. [Google Scholar] [CrossRef] [PubMed]
  24. Zhen, Y.; Sorensen, V.; Skjerpen, C.S.; Haugsten, E.M.; Jin, Y.; Walchli, S.; Olsnes, S.; Wiedlocha, A. Nuclear import of exogenous FGF1 requires the ER-protein LRRC59 and the importins Kpnalpha1 and Kpnbeta1. Traffic 2012, 13, 650–664. [Google Scholar] [CrossRef] [PubMed]
  25. Korc, M.; Friesel, R.E. The role of fibroblast growth factors in tumor growth. Curr. Cancer Drug Targets 2009, 9, 639–651. [Google Scholar] [CrossRef] [PubMed]
  26. Choy, B.; LaLonde, A.; Que, J.; Wu, T.; Zhou, Z. MCM4 and MCM7, potential novel proliferation markers, significantly correlated with Ki-67, Bmi1, and cyclin E expression in esophageal adenocarcinoma, squamous cell carcinoma, and precancerous lesions. Hum. Pathol. 2016, 57, 126–135. [Google Scholar] [CrossRef] [PubMed] [Green Version]
  27. Danilov, A.V.; Danilova, O.V.; Brown, J.R.; Rabinowitz, A.; Klein, A.K.; Huber, B.T. Dipeptidyl peptidase 2 apoptosis assay determines the B-cell activation stage and predicts prognosis in chronic lymphocytic leukemia. Exp. Hematol. 2010, 38, 1167–1177. [Google Scholar] [CrossRef] [PubMed] [Green Version]
  28. Yu, Y.P.; Liu, P.; Nelson, J.; Hamilton, R.L.; Bhargava, R.; Michalopoulos, G.; Chen, Q.; Zhang, J.; Ma, D.; Pennathur, A.; et al. Identification of recurrent fusion genes across multiple cancer types. Sci. Rep. 2019, 9, 1074. [Google Scholar] [CrossRef]
  29. Xicola, R.M.; Manojlovic, Z.; Augustus, G.J.; Kupfer, S.S.; Emmadi, R.; Alagiozian-Angelova, V.; Triche, T., Jr.; Salhia, B.; Carpten, J.; Llor, X.; et al. Lack of APC somatic mutation is associated with early-onset colorectal cancer in African Americans. Carcinogenesis 2018, 39, 1331–1341. [Google Scholar] [CrossRef]
  30. Lv, C.; Wang, H.; Tong, Y.; Yin, H.; Wang, D.; Yan, Z.; Liang, Y.; Wu, D.; Su, Q. The function of BTG3 in colorectal cancer cells and its possible signaling pathway. J. Cancer Res. Clin. Oncol. 2018, 144, 295–308. [Google Scholar] [CrossRef]
  31. Zhao, J.; Wen, G.; Ding, M.; Pan, J.Y.; Yu, M.L.; Zhao, F.; Weng, X.L.; Du, J.L. Comparative proteomic analysis of colon cancer cell HCT-15 in response to all-trans retinoic acid treatment. Protein Pept. Lett. 2012, 19, 1272–1280. [Google Scholar] [CrossRef]
  32. Toda, H.; Kurozumi, S.; Kijima, Y.; Idichi, T.; Shinden, Y.; Yamada, Y.; Arai, T.; Maemura, K.; Fujii, T.; Horiguchi, J.; et al. Molecular pathogenesis of triple-negative breast cancer based on microRNA expression signatures: Antitumor miR-204-5p targets AP1S3. J. Hum. Genet. 2018, 63, 1197–1210. [Google Scholar] [CrossRef]
  33. Pallai, R.; Bhaskar, A.; Barnett-Bernodat, N.; Gallo-Ebert, C.; Pusey, M.; Nickels, J.T., Jr.; Rice, L.M. Leucine-rich repeat-containing protein 59 mediates nuclear import of cancerous inhibitor of PP2A in prostate cancer cells. Tumour Biol. 2015, 36, 6383–6390. [Google Scholar] [CrossRef]
  34. Frigola, J.; Remus, D.; Mehanna, A.; Diffley, J.F. ATPase-dependent quality control of DNA replication origin licensing. Nature 2013, 495, 339–343. [Google Scholar] [CrossRef] [Green Version]
  35. Mele, D.A.; Bista, P.; Baez, D.V.; Huber, B.T. Dipeptidyl peptidase 2 is an essential survival factor in the regulation of cell quiescence. Cell Cycle 2009, 8, 2425–2434. [Google Scholar] [CrossRef]
  36. Frescas, D.; Pagano, M. Deregulated proteolysis by the F-box proteins SKP2 and beta-TrCP: Tipping the scales of cancer. Nat. Rev. Cancer 2008, 8, 438–449. [Google Scholar] [CrossRef]
  37. Dong, L.; Li, Y.; Xue, D.; Liu, Y. PCMT1 is an unfavorable predictor and functions as an oncogene in bladder cancer. IUBMB Life 2018, 70, 291–299. [Google Scholar] [CrossRef]
  38. Cunningham, D.; Atkin, W.; Lenz, H.J.; Lynch, H.T.; Minsky, B.; Nordlinger, B.; Starling, N. Colorectal cancer. Lancet 2010, 375, 1030–1047. [Google Scholar] [CrossRef]
  39. Tan, I.B.; Tan, P. Genetics: An 18-gene signature (ColoPrint(R)) for colon cancer prognosis. Nat. Rev. Clin. Oncol. 2011, 8, 131–133. [Google Scholar] [CrossRef]
  40. Govindarajan, R.; Posey, J.; Chao, C.Y.; Lu, R.; Jadhav, T.; Javed, A.Y.; Javed, A.; Mahmoud, F.A.; Osarogiagbon, R.U.; Manne, U. A comparison of 12-gene colon cancer assay gene expression in African American and Caucasian patients with stage II colon cancer. BMC Cancer 2016, 16, 368. [Google Scholar] [CrossRef]
  41. Liu, Q.; Deng, J.; Wei, X.; Yuan, W.; Ma, J. Integrated analysis of competing endogenous RNA networks revealing five prognostic biomarkers associated with colorectal cancer. J. Cell Biochem. 2019. [Google Scholar] [CrossRef]
  42. Li, Y.; He, M.; Zhou, Y.; Yang, C.; Wei, S.; Bian, X.; Christopher, O.; Xie, L. The Prognostic and Clinicopathological Roles of PD-L1 Expression in Colorectal Cancer: A Systematic Review and Meta-Analysis. Front. Pharmacol. 2019, 10, 139. [Google Scholar] [CrossRef] [Green Version]
  43. Pan, J.H.; Zhou, H.; Cooper, L.; Huang, J.L.; Zhu, S.B.; Zhao, X.X.; Ding, H.; Pan, Y.L.; Rong, L. LAYN Is a Prognostic Biomarker and Correlated With Immune Infiltrates in Gastric and Colon Cancers. Front. Immunol. 2019, 10, 6. [Google Scholar] [CrossRef] [Green Version]
  44. Zhao, Z.; Zou, S.; Guan, X.; Wang, M.; Jiang, Z.; Liu, Z.; Li, C.; Lin, H.; Liu, X.; Yang, R.; et al. Apolipoprotein E Overexpression Is Associated With Tumor Progression and Poor Survival in Colorectal Cancer. Front. Genet. 2018, 9, 650. [Google Scholar] [CrossRef]
  45. Dong, C.; Cui, D.; Liu, G.; Xu, H.; Peng, X.; Duan, J.; Liu, L. Cancer stem cell associated eight gene-based signature predicts clinical outcomes of colorectal cancer. Oncol. Lett. 2019, 17, 442–449. [Google Scholar] [CrossRef]
  46. Tian, X.; Zhu, X.; Yan, T.; Yu, C.; Shen, C.; Hu, Y.; Hong, J.; Chen, H.; Fang, J.Y. Recurrence-associated gene signature optimizes recurrence-free survival prediction of colorectal cancer. Mol. Oncol. 2017, 11, 1544–1560. [Google Scholar] [CrossRef] [Green Version]
  47. Kandimalla, R.; Ozawa, T.; Gao, F.; Wang, X.; Goel, A.; T1 Colorectal Cancer Study Group. Gene Expression Signature in Surgical Tissues and Endoscopic Biopsies Identifies High-Risk T1 Colorectal Cancers. Gastroenterology 2019, 156, 2338–2341.e3. [Google Scholar] [CrossRef]
  48. Kulkarni, M.M. Digital multiplexed gene expression analysis using the NanoString nCounter system. Curr. Protoc. Mol. Biol. 2011. [Google Scholar] [CrossRef]
  49. Veldman-Jones, M.H.; Brant, R.; Rooney, C.; Geh, C.; Emery, H.; Harbron, C.G.; Wappett, M.; Sharpe, A.; Dymond, M.; Barrett, J.C.; et al. Evaluating Robustness and Sensitivity of the NanoString Technologies nCounter Platform to Enable Multiplexed Gene Expression Analysis of Clinical Samples. Cancer Res. 2015, 75, 2587–2593. [Google Scholar] [CrossRef]
Figure 1. Kaplan-Meier curve of (a) YWHAB, (b) DPP7/2, (c) MCM4, (d) FBXO46 from clinical dataset that were included in generation of prognostic score based on Cox proportion hazard model. The patients were divided into 2 groups, higher and lower based on median gene expression as a cut-off point.
Ijms 20 03818 g001
Figure 2. The composite prognostic score differentiated CRC patients (n = 88) based on OS. The patients with higher score had poor prognosis compared to lower ones.
Ijms 20 03818 g002
Figure 3. Kaplan-Meier curve of (a) YWHAB, (b) DPP7/2, (c) MCM4, (d) FBXO46 from the external dataset. The median gene expression was used as a cut-off point for higher and lower gene expression groups.
Ijms 20 03818 g003
Figure 4. The external validation using independent dataset validated the four gene prognostic score.
Ijms 20 03818 g004
Figure 5. The prognostic score differentiated CRC patients in stage II + III in combined internal and external datasets.
Ijms 20 03818 g005
Figure 6. Differential expression of prognostic genes in cancerous tissue compared to normal. The expression of (a) YWHAB, (b) LRRC59, (c) MCM4, (d) DPP7/2, (e) FBXO46 was assessed using normal tissue expression data from TCGA and GTEx dataset (n = 349) and TCGA CRC tumor dataset (n = 275). Higher expression of these genes except DPP7/2 and FBXO46 were significantly associated with tumors in CRC patients.
Ijms 20 03818 g006
Figure 7. A flowchart depicting gene extraction methodology for generation of 17 gene panel.
Ijms 20 03818 g007
Figure 8. The 595 candidate gene-set was extracted from The Protein Atlas. The gene expression of 7 top-most altered genes (PI4K2B, PBXIP1, CHEK1, DLAT, FAM50A, KDM4B, DPP7/2) significantly differentiated patients on the basis of overall survival in cBioportal, with perturbations in 37% of CRC patients (n = 222).
Ijms 20 03818 g008
Figure 9. A flowchart depicting the process used to identify, generate and validate the prognostic signature in colorectal cancer.
Ijms 20 03818 g009
Table 1. The 17-gene panel included in this study along-with its expression variation in tumor and normal tissues as accessed from GEPIA portal.
S.NoGene SymbolEntrez Gene IDCytobandGene TitleMedian Gene Expression, TPM (Transcripts per million)
Tumor (n = 275)Normal (n = 349)
Genes selected from TPA and cBioportal
1PI4K2B553004p15.2Phosphatidylinositol 4-kinase type 2 beta0.050
2PBXIP1573261q21.3Pre-B-cell leukemia homeobox interacting protein 131.375.75
3CHEK1111111q24.2Checkpoint kinase 118.122.5
4DLAT173711q23.1Dihydrolipoamide S-acetyltransferase23.5115.09
5FAM50A9130Xq28Family with sequence similarity 50, member A66.4562.17
6KDM4B2303019p13.3Lysine (K)-specific demethylase 4B9.3912.39
7DPP7/2299529q34.3Dipeptidyl-peptidase 7100.63113.3
Genes selected from prognostic significance in multiple cancers
8YWHAB752920q13.1Tryptophan 5-monooxygenase activation protein, beta190.4793.05
9DSG2182918q12.1Desmoglein 276.263.67
10PCMT151106q25.1Protein-L-isoaspartate (D-aspartate) O-methyltransferase48.9738.82
11MCM441738q11.2Minichromosome maintenance complex component 453.468.09
12AGFG132672q36.3ArfGAP with FG repeats 145.4624.07
13E2F1186920q11.2E2F transcription factor 113.512.13
14LRRC595537917q21.33Leucine rich repeat containing 59107.0834.6
15SLAMF61148361q23.2SLAM family member 61.380.82
16FBXO462340319q13.3F-box protein 4611.19.98
17ITGA5367812q11-q13Integrin alpha 521.76191.95
Table 2. Demographic and clinical information of colorectal cancer patients included in this study.
Clinical ParametersNo. of PatientsPercentage of Patients (%)
Age
<68 y 2730.68
>68 y 6169.32
Gender
Male 3742.05
Female 5157.95
Stage - AJCC
I1415.91
II 3034.09
III2629.55
IV 1820.45
Grade
I - Well differentiated1820.45
II: Intermediate differentiated 4045.45
III: Poorly differentiated2326.14
IV: Undifferentiated 77.95
Distant Metastasis
Yes3337.5
No5461.36
Vital Status
Dead 5764.77
Alive 3135.23
Ethnicity
Caucasian4753.41
African-American3843.18
Alcohol Use
No Usage 6776.14
Users 2022.73
Tobacco Use
No 5663.64
Yes 3236.36
Chemotherapy after surgery
Administered2629.54
Not administered6270.45
Family History
No 4146.59
Yes 3539.77
Months survival (median)
Dead 11.8 months
Alive 54.1 months
Table 3. Univariate Cox regression analysis of the genes included in this panel.
GeneUnivariate
Hazard Ratio95% CIp-Value
CHEK10.660.31–1.370.26
DLAT0.70.33–1.480.35
DPP7/20.380.14–0.890.02
FAM50A0.50.19–1.450.2
KDMB0.720.31–1.570.41
PBXIP11.140.51–2.660.74
PI4K2B1.090.52–2.380.8
DSG1.30.66–2.930.39
E2F1.770.79–4.050.15
MCM42.691.19–6.350.01
PCMT10.660.30–1.410.28
YWHAB3.761.58–9.660.001
AGFG10.80.39–1.820.65
FBXO461.40.65–2.940.37
ITGA50.710.34–1.480.37
LRRC592.321.09–5.350.02
SLAMF610.50–2.450.81
Table 4. Univariate Cox regression analysis of prognostic score and other clinicopathological variables.
VariableUnivariate
Hazard Ratio95% CIp-Value
Prognostic score (composite DPP7/2, YWHAB, MCM4 and FBXO46)5.392.19–15.26<0.001 *
Age (>68, <68 years)0.780.37–1.660.51
Gender (Male, Female)0.950.45–2.060.89
Stage (III + IV, I + II)2.91.39–6.36<0.001 *
Grade (III, I + II)1.790.73–5.30.2
Ethnicity (African-American, Caucasian)0.90.41–2.070.81
Alcohol consumption (Yes, No)0.60.26–1.550.27
Tobacco smoking (Yes, No)0.580.25–1.230.16
Table 5. Multivariate Cox regression analysis of prognostic score in combination with other clinicopathological variables.
VariableMultivariate
Hazard Ratio95% CIp-Value
Prognostic score (composite DPP7/2, YWHAB, MCM4 and FBXO46)3.421.71–7.94<0.001 *
Age (>68, <68 years)1.050.35–3.190.92
Gender (Male, Female)2.340.62–9.370.20
Stage (III + IV, I + II)4.561.33–19.150.01 *
Grade (III, I + II)0.190.02–1.180.07
Ethnicity (African-American, Caucasian)2.890.69–12.470.14
Alcohol consumption (Yes, No)7.381.58–38.140.01 *
Tobacco smoking (Yes, No)0.080.01–0.310.01 *
Table 6. Functional relevance of genes that were significantly associated with OS in CRC patients.
GeneFunction and Role in CancerReferences
YWHABSignal transduction and cell cycle, genetically altered in multiple cancers[22,23]
MCM4Essential role in DNA replication, dysregulation found in several cancers.[24,25]
DPP7/2Inhibition of DPP7/2 has been linked with apoptosis through c-Myc and p53 related pathways[26]
FBXO46Deregulated cell cycle, cancer biogenesis[27]
LRRC59Essential for nuclear import of Fibroblast growth factor 1, FGF promotes angiogenesis with VEGF [24,28]

