miR526b and miR655 Induce Oxidative Stress in Breast Cancer

 ,
, 
Abstract
:
1. Introduction
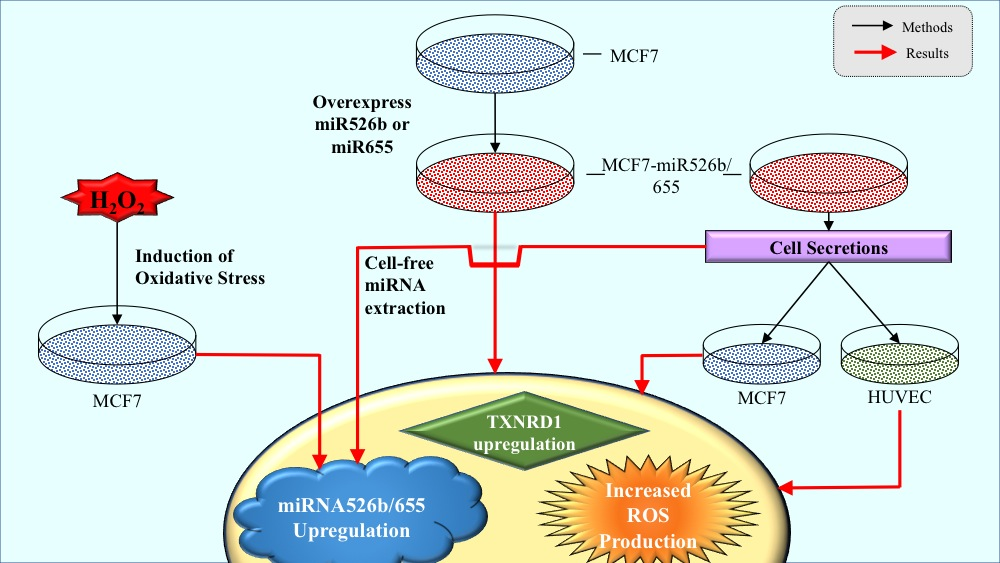
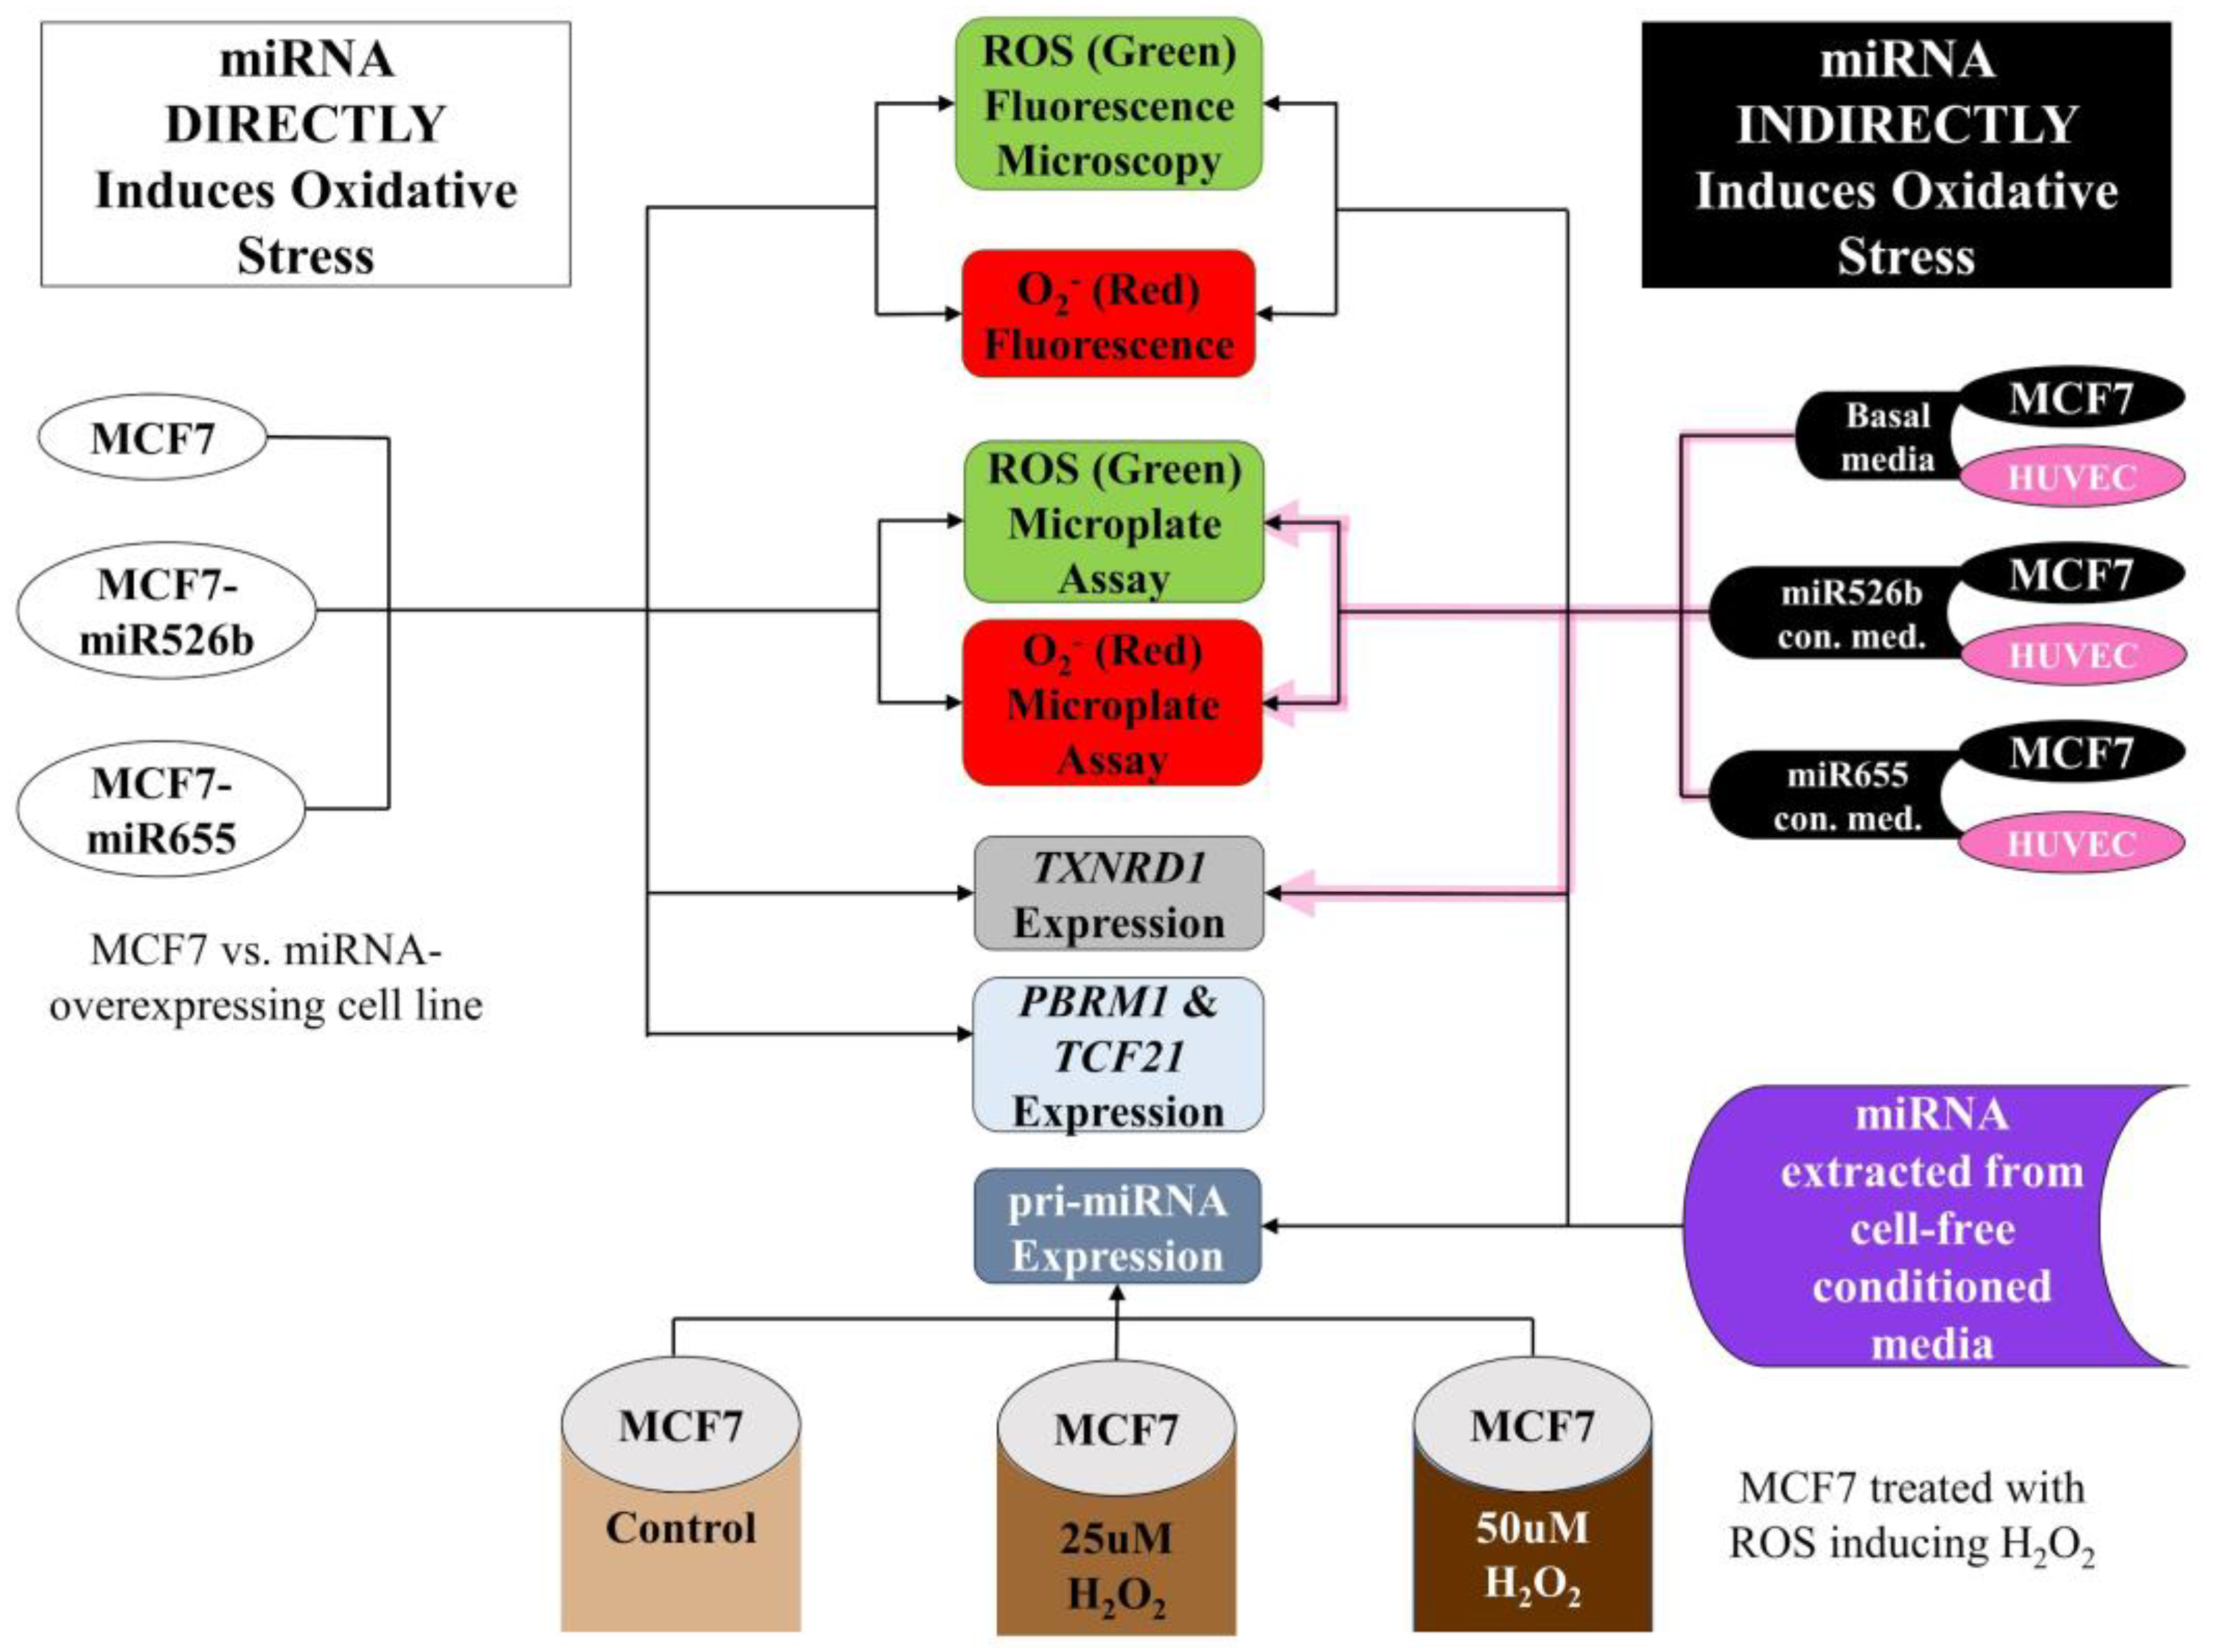
2. Results
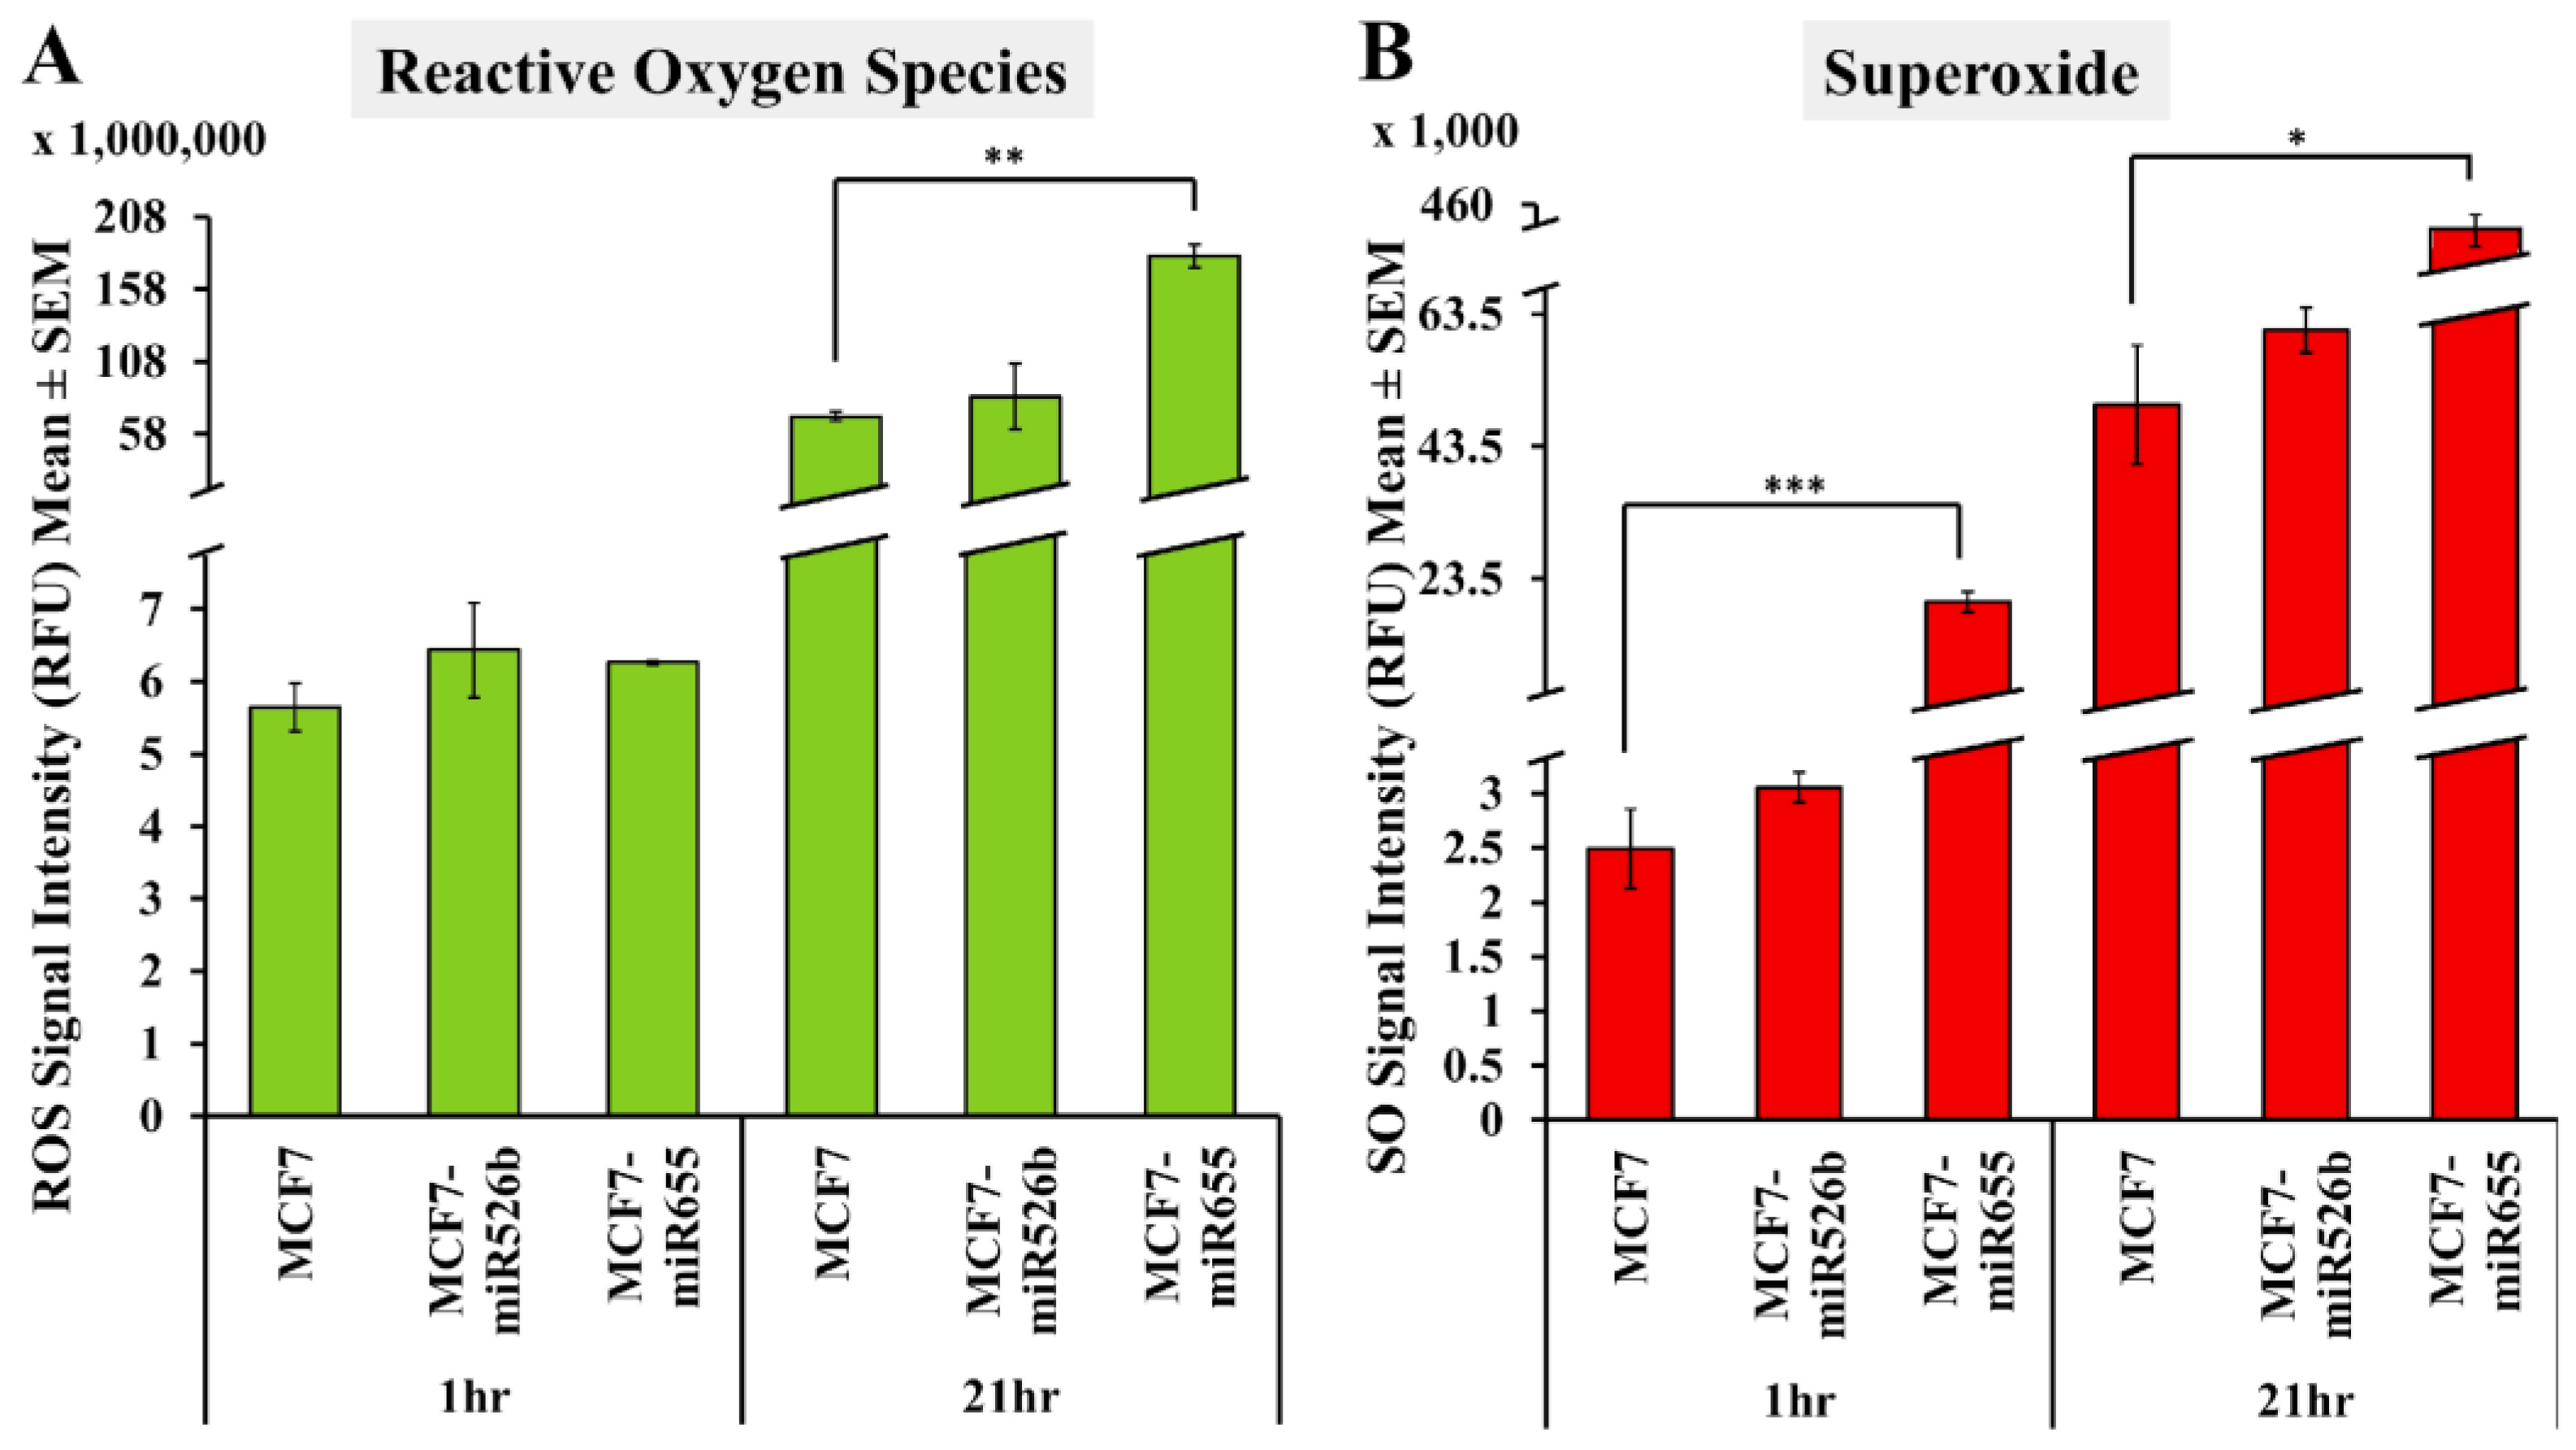
2.1. miR526b and miR655 Directly Induce Oxidative Stress by Overproduction of ROS and SO
2.1.1. Fluorescence Microplate Assay
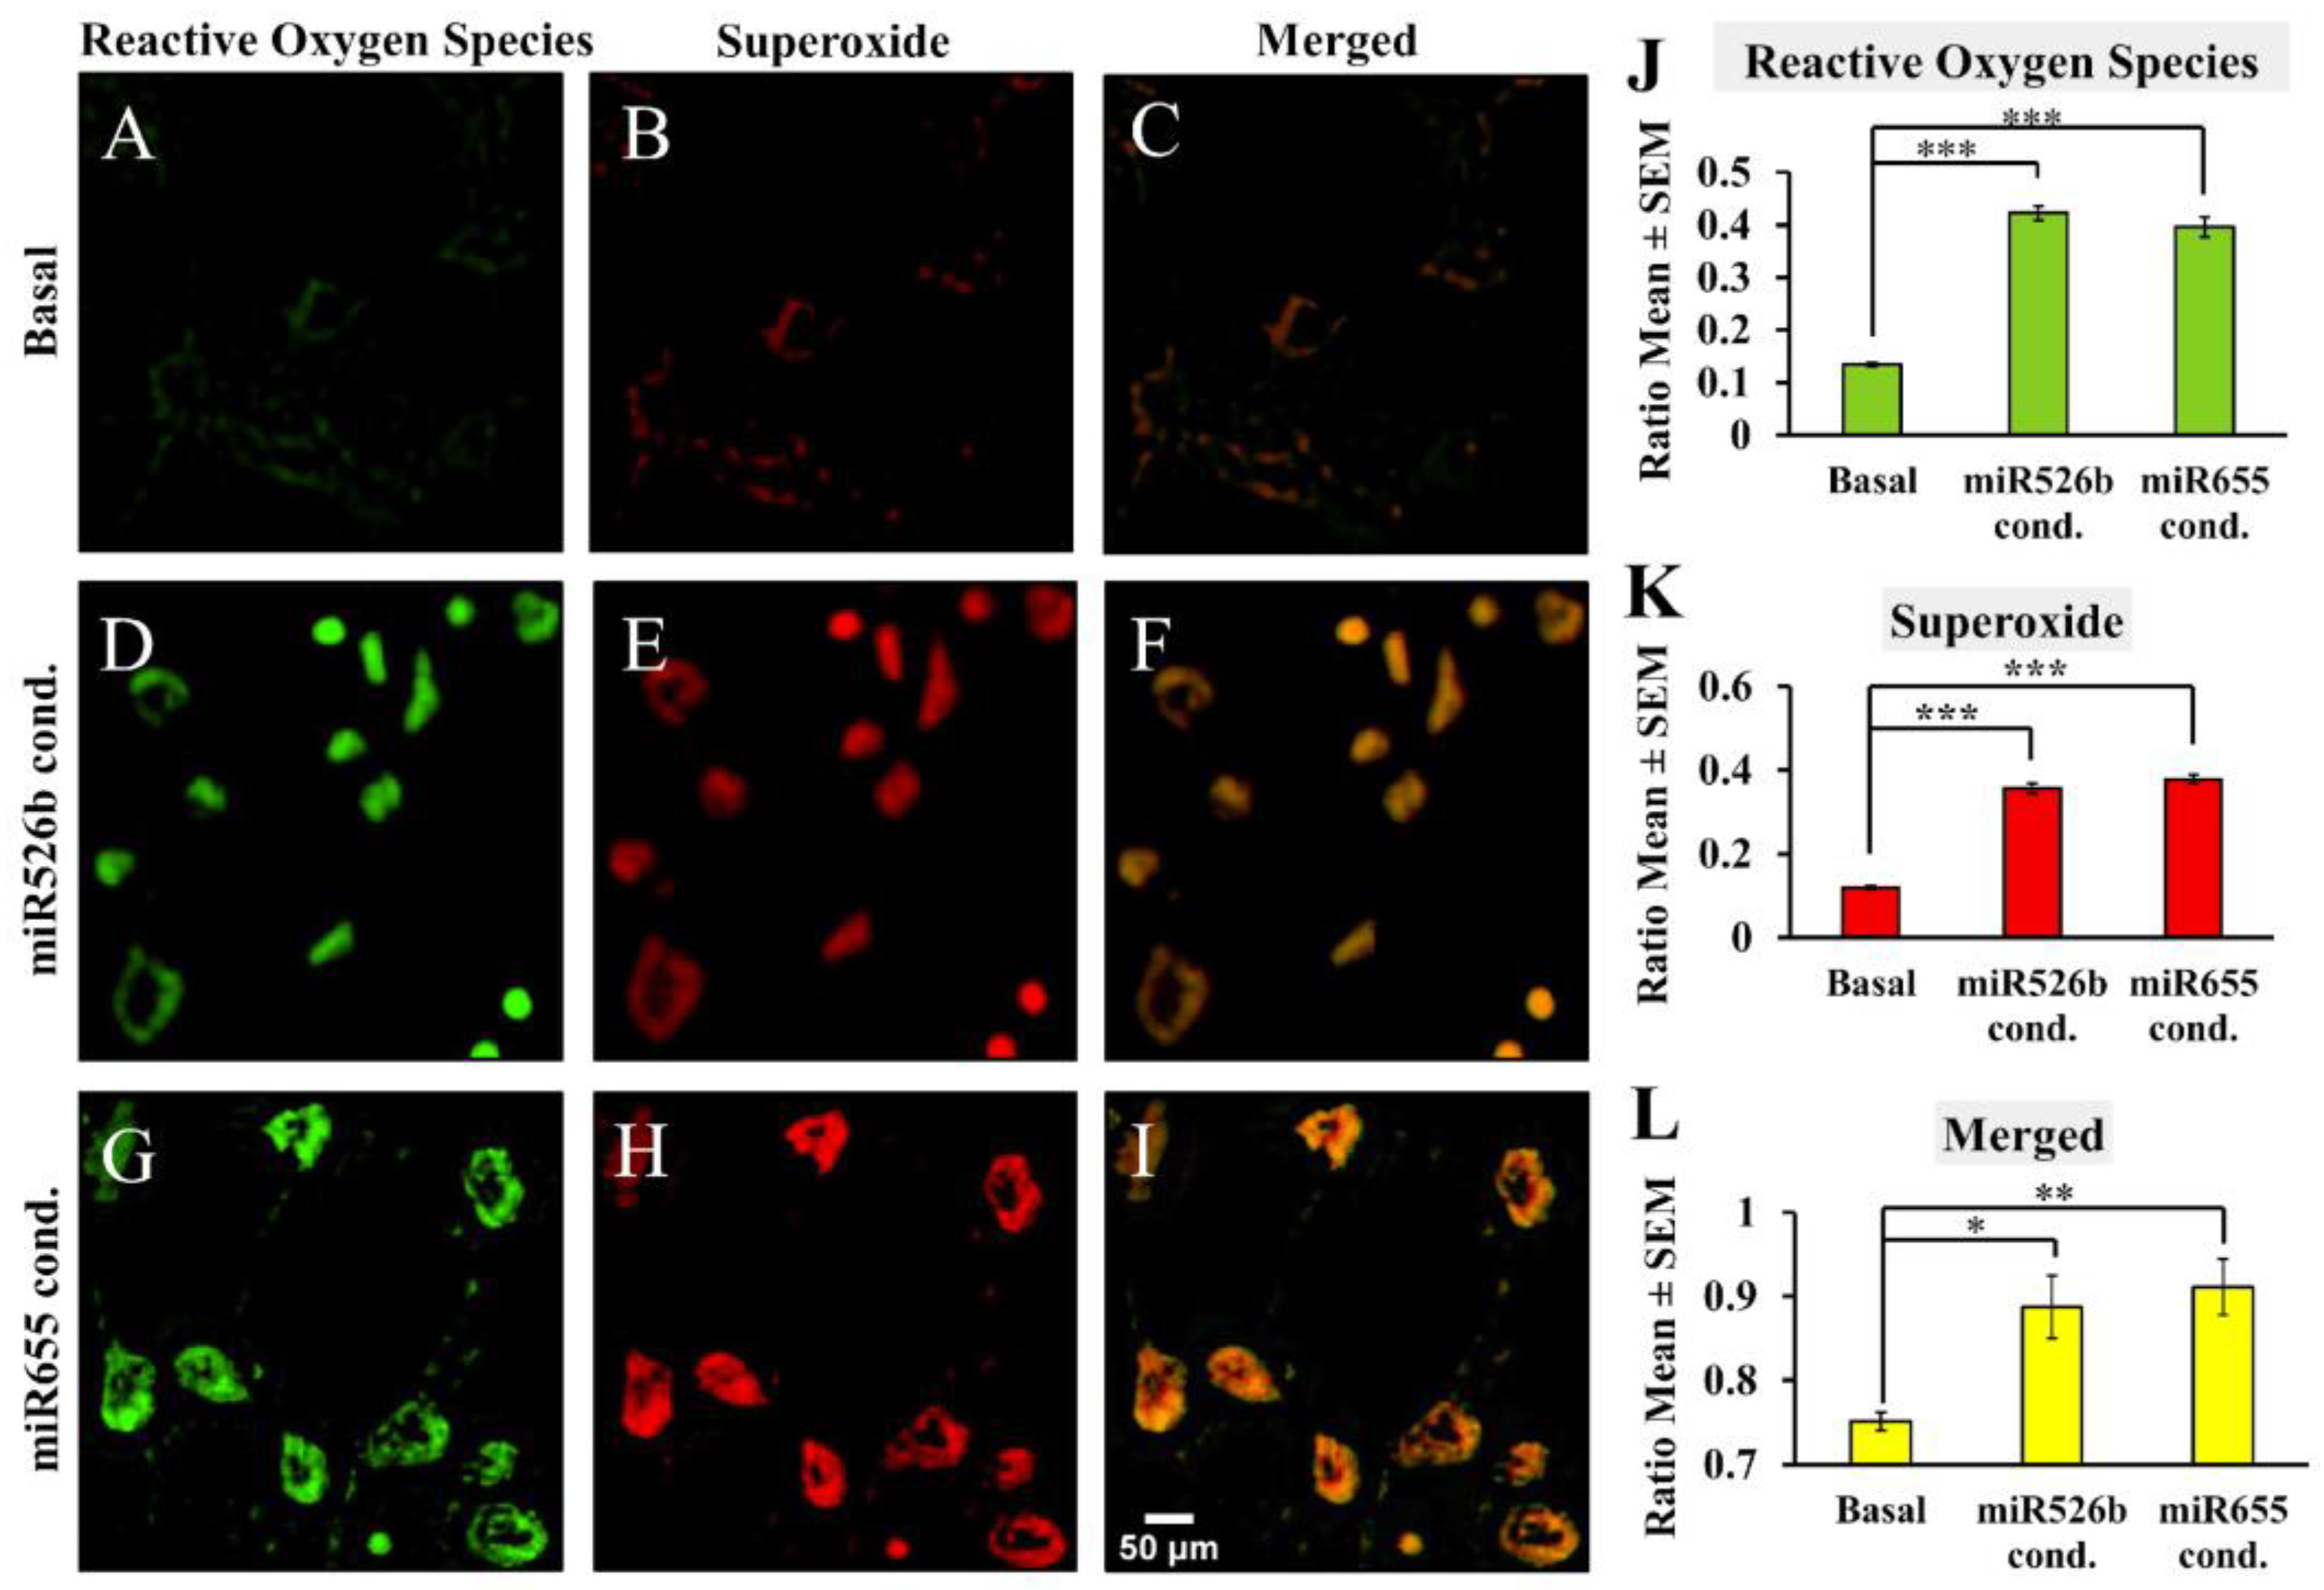
2.1.2. Fluorescence Microscopy Assay
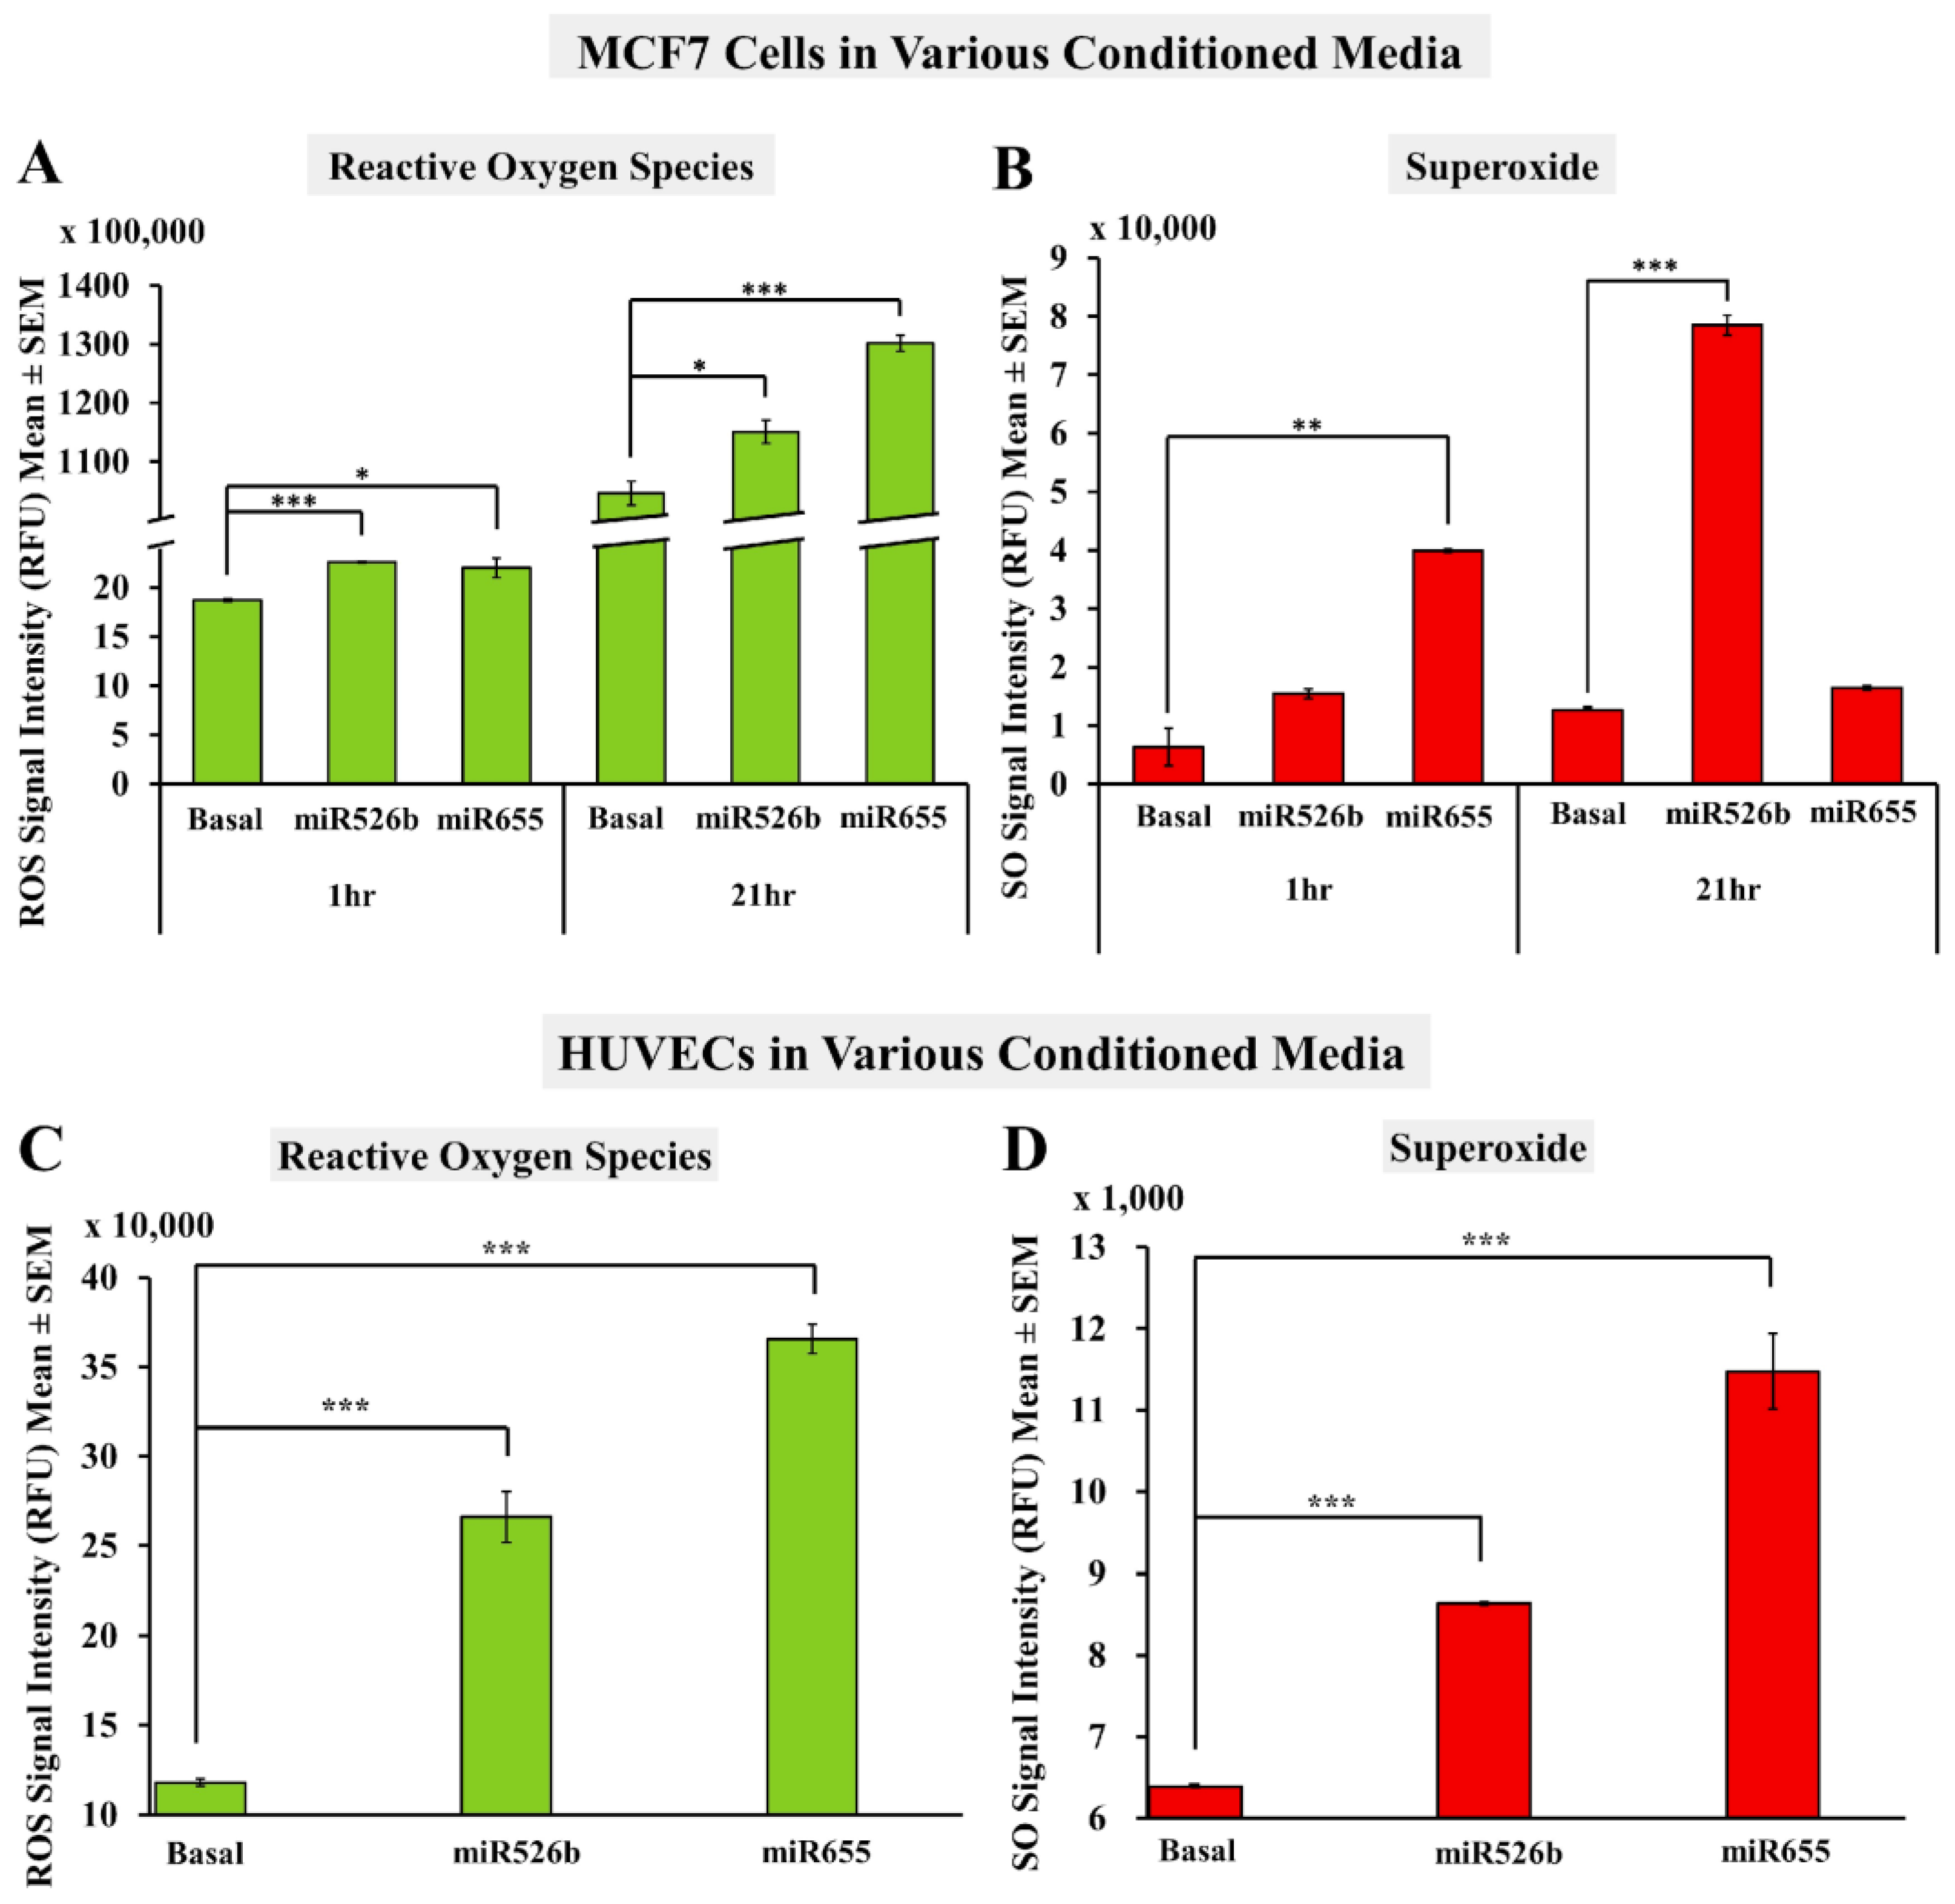
2.2. Cell-Free Conditioned Media from miR526b/miR655-High Cells Indirectly Induce Production of ROS and SO
2.2.1. Fluorescence Microplate Assay with MCF7 Cells
2.2.2. Fluorescence Microplate Assay with HUVECs
2.2.3. Fluorescence Microscopy Assay with MCF7 Cells in miRNA- Conditioned Media
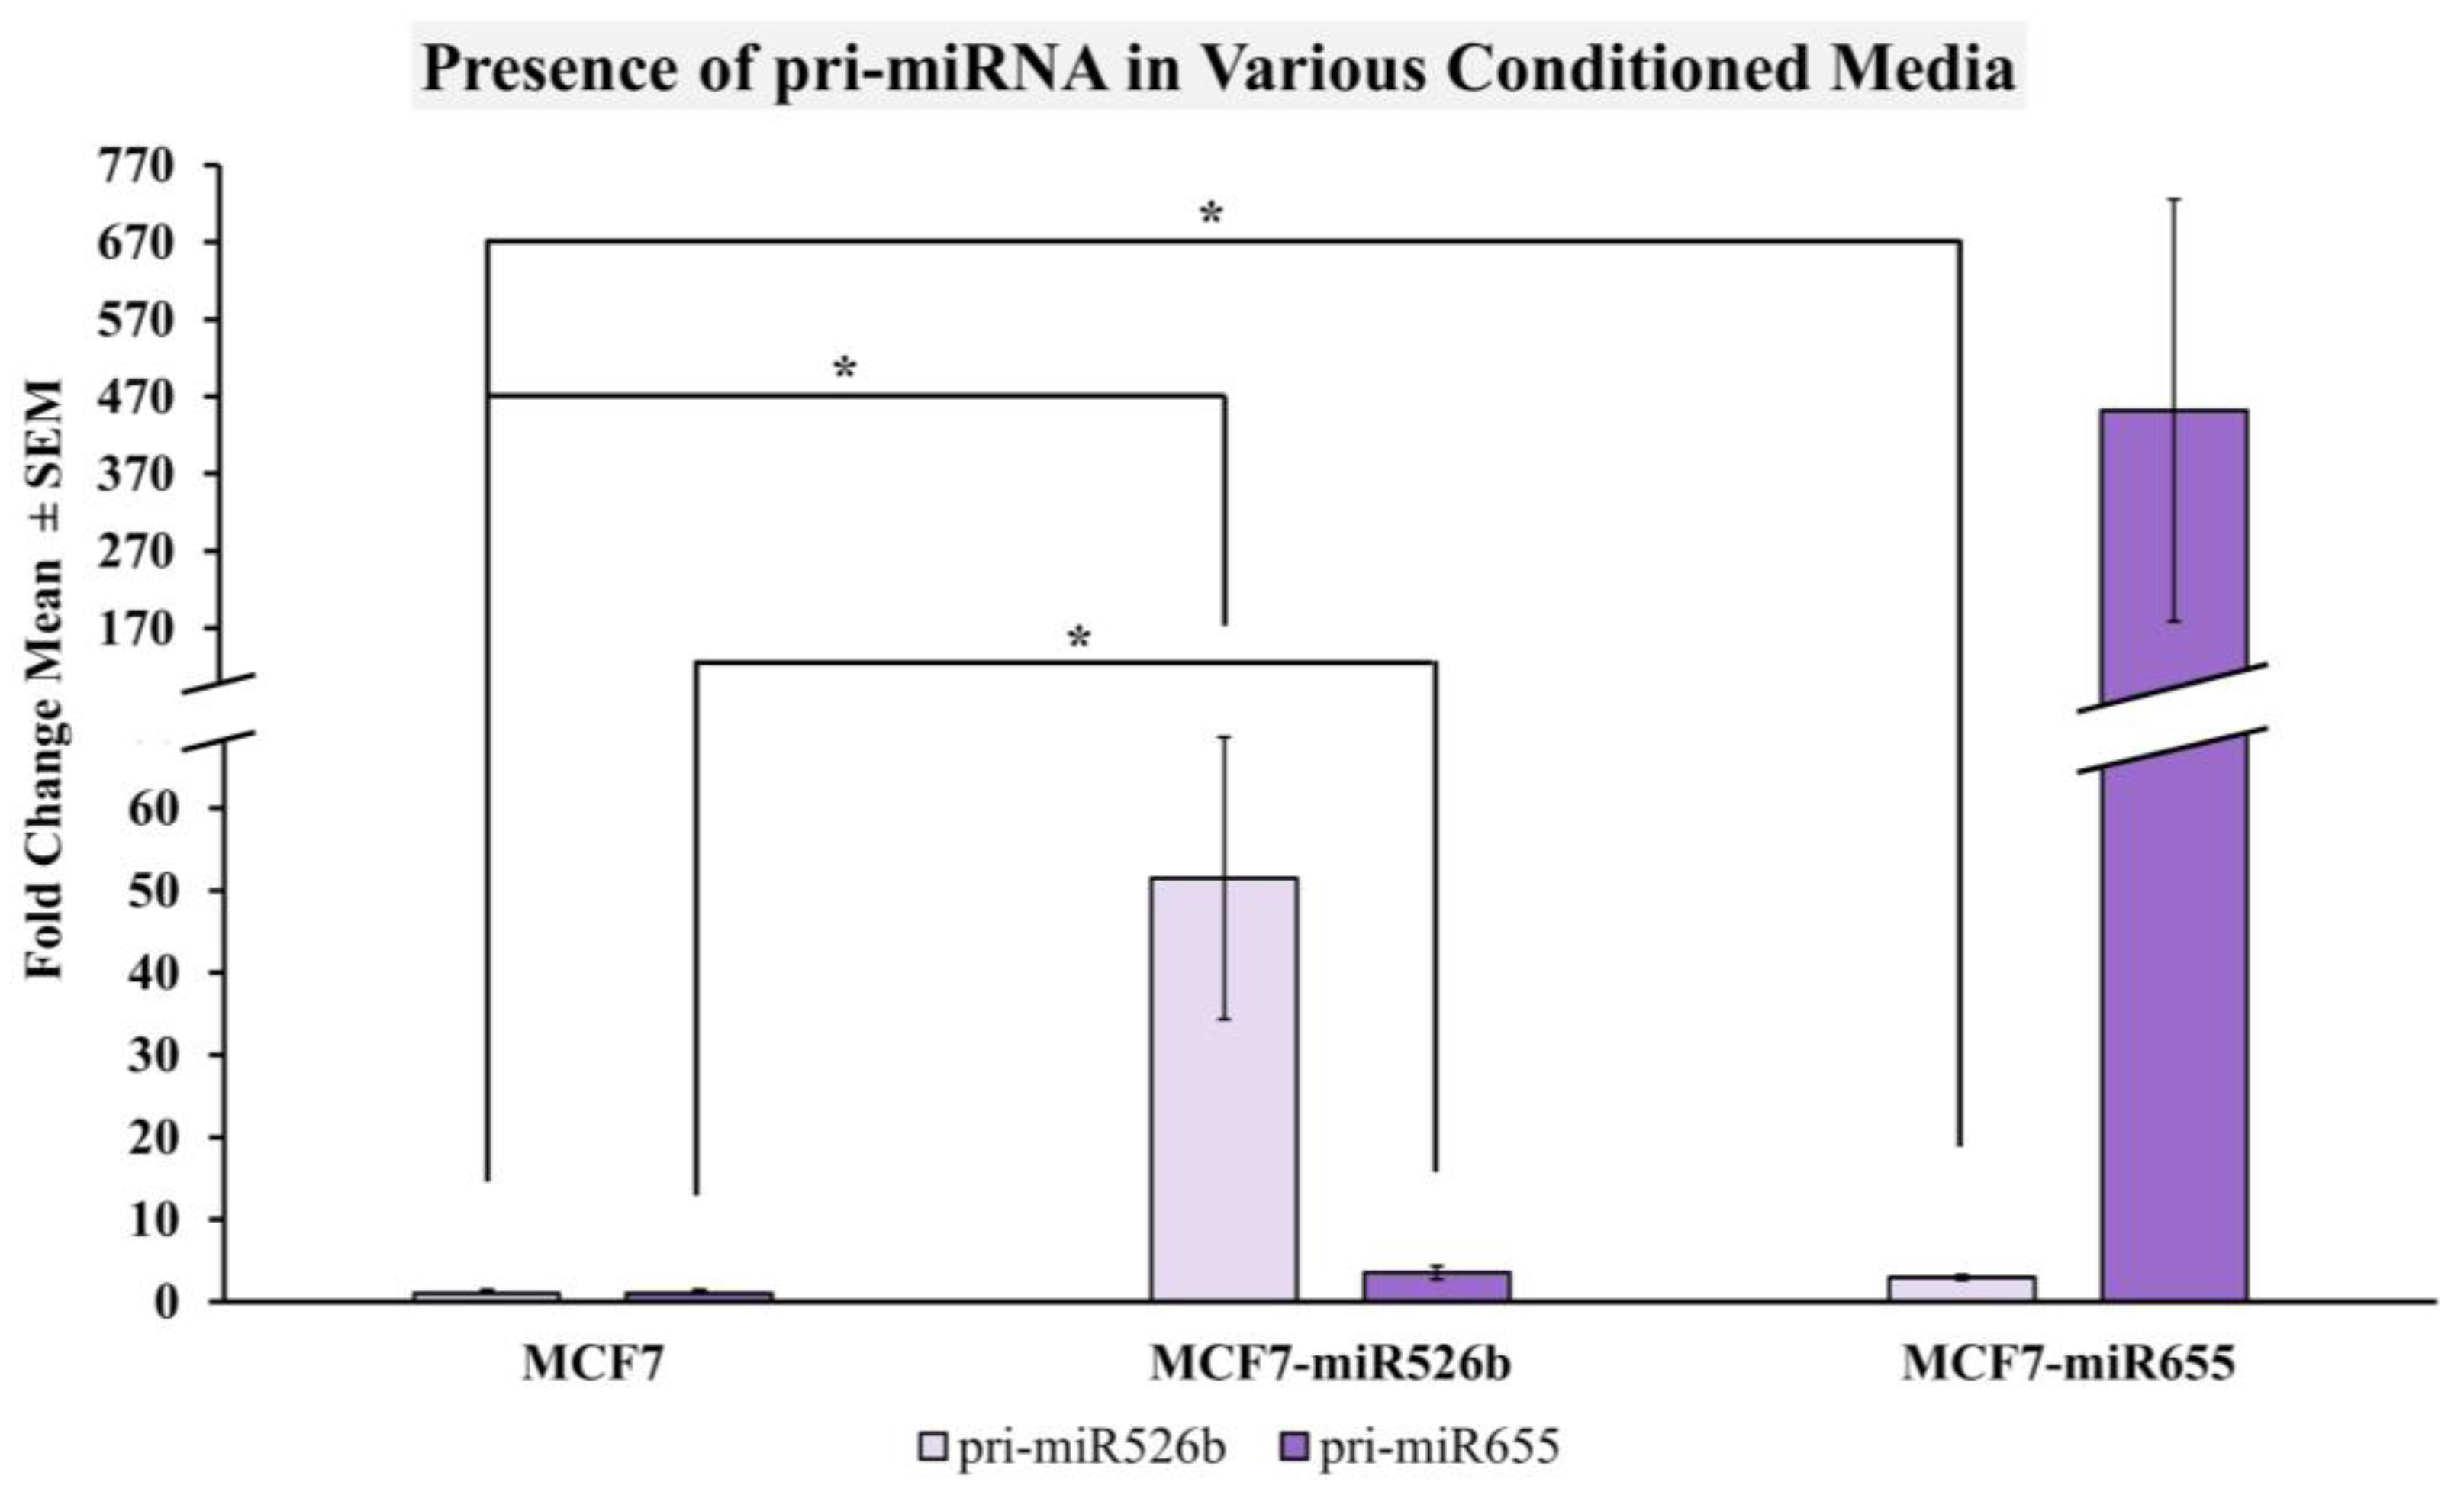
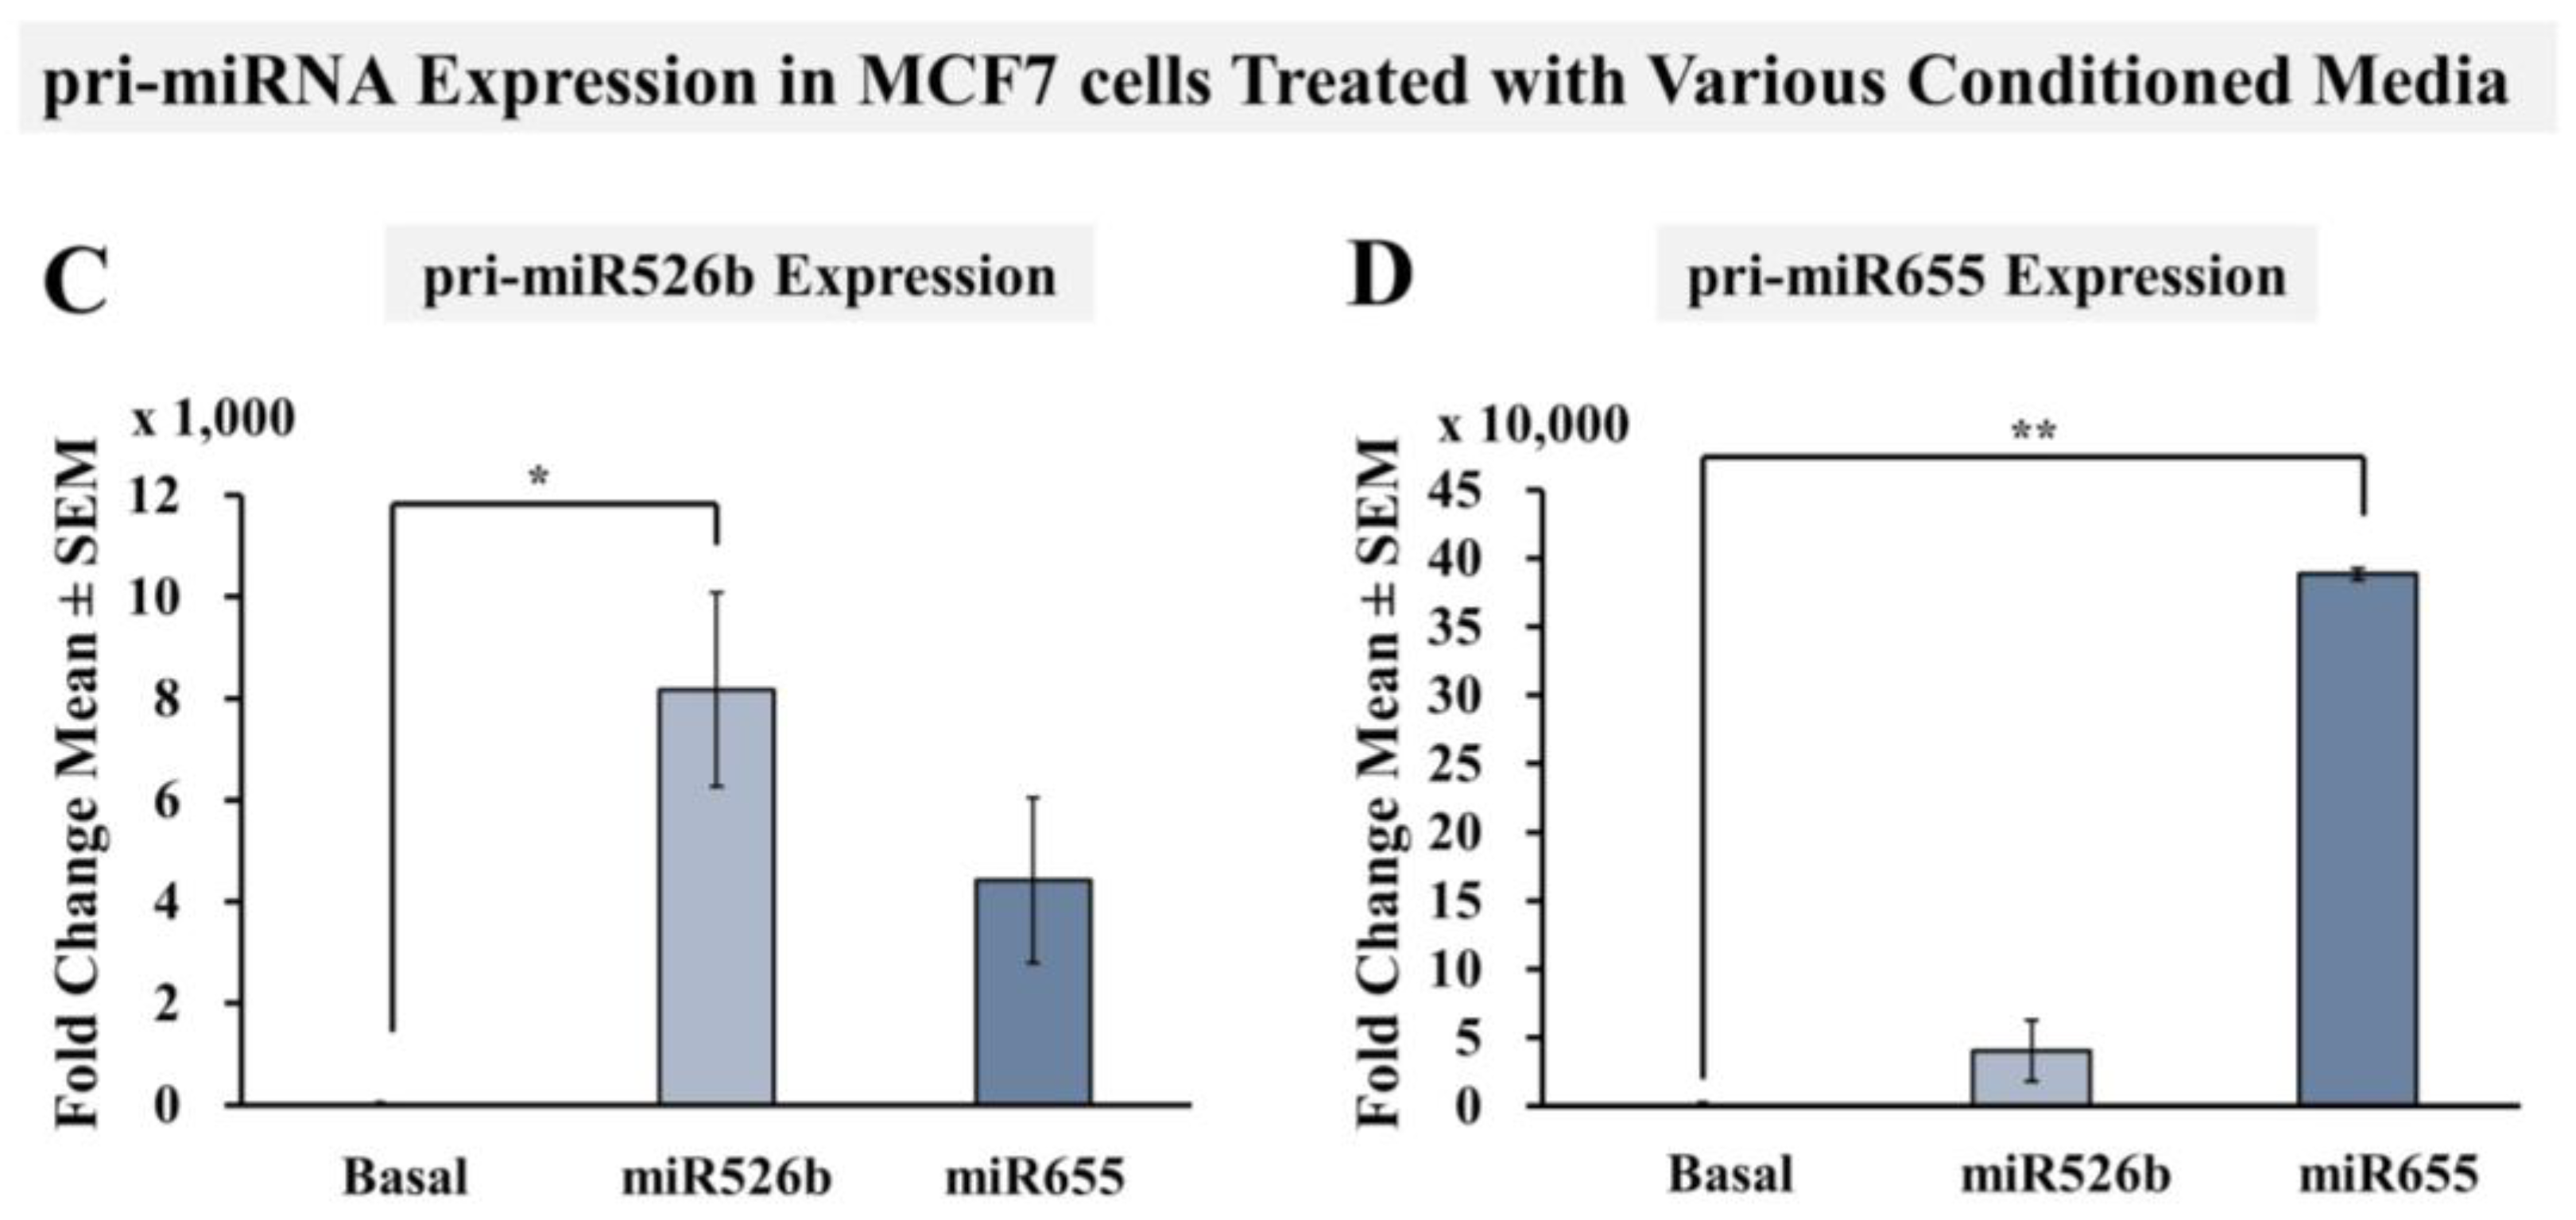
2.2.4. miRNA-High Cells Release miR526b and miR655 in Cell-Free Conditioned Media
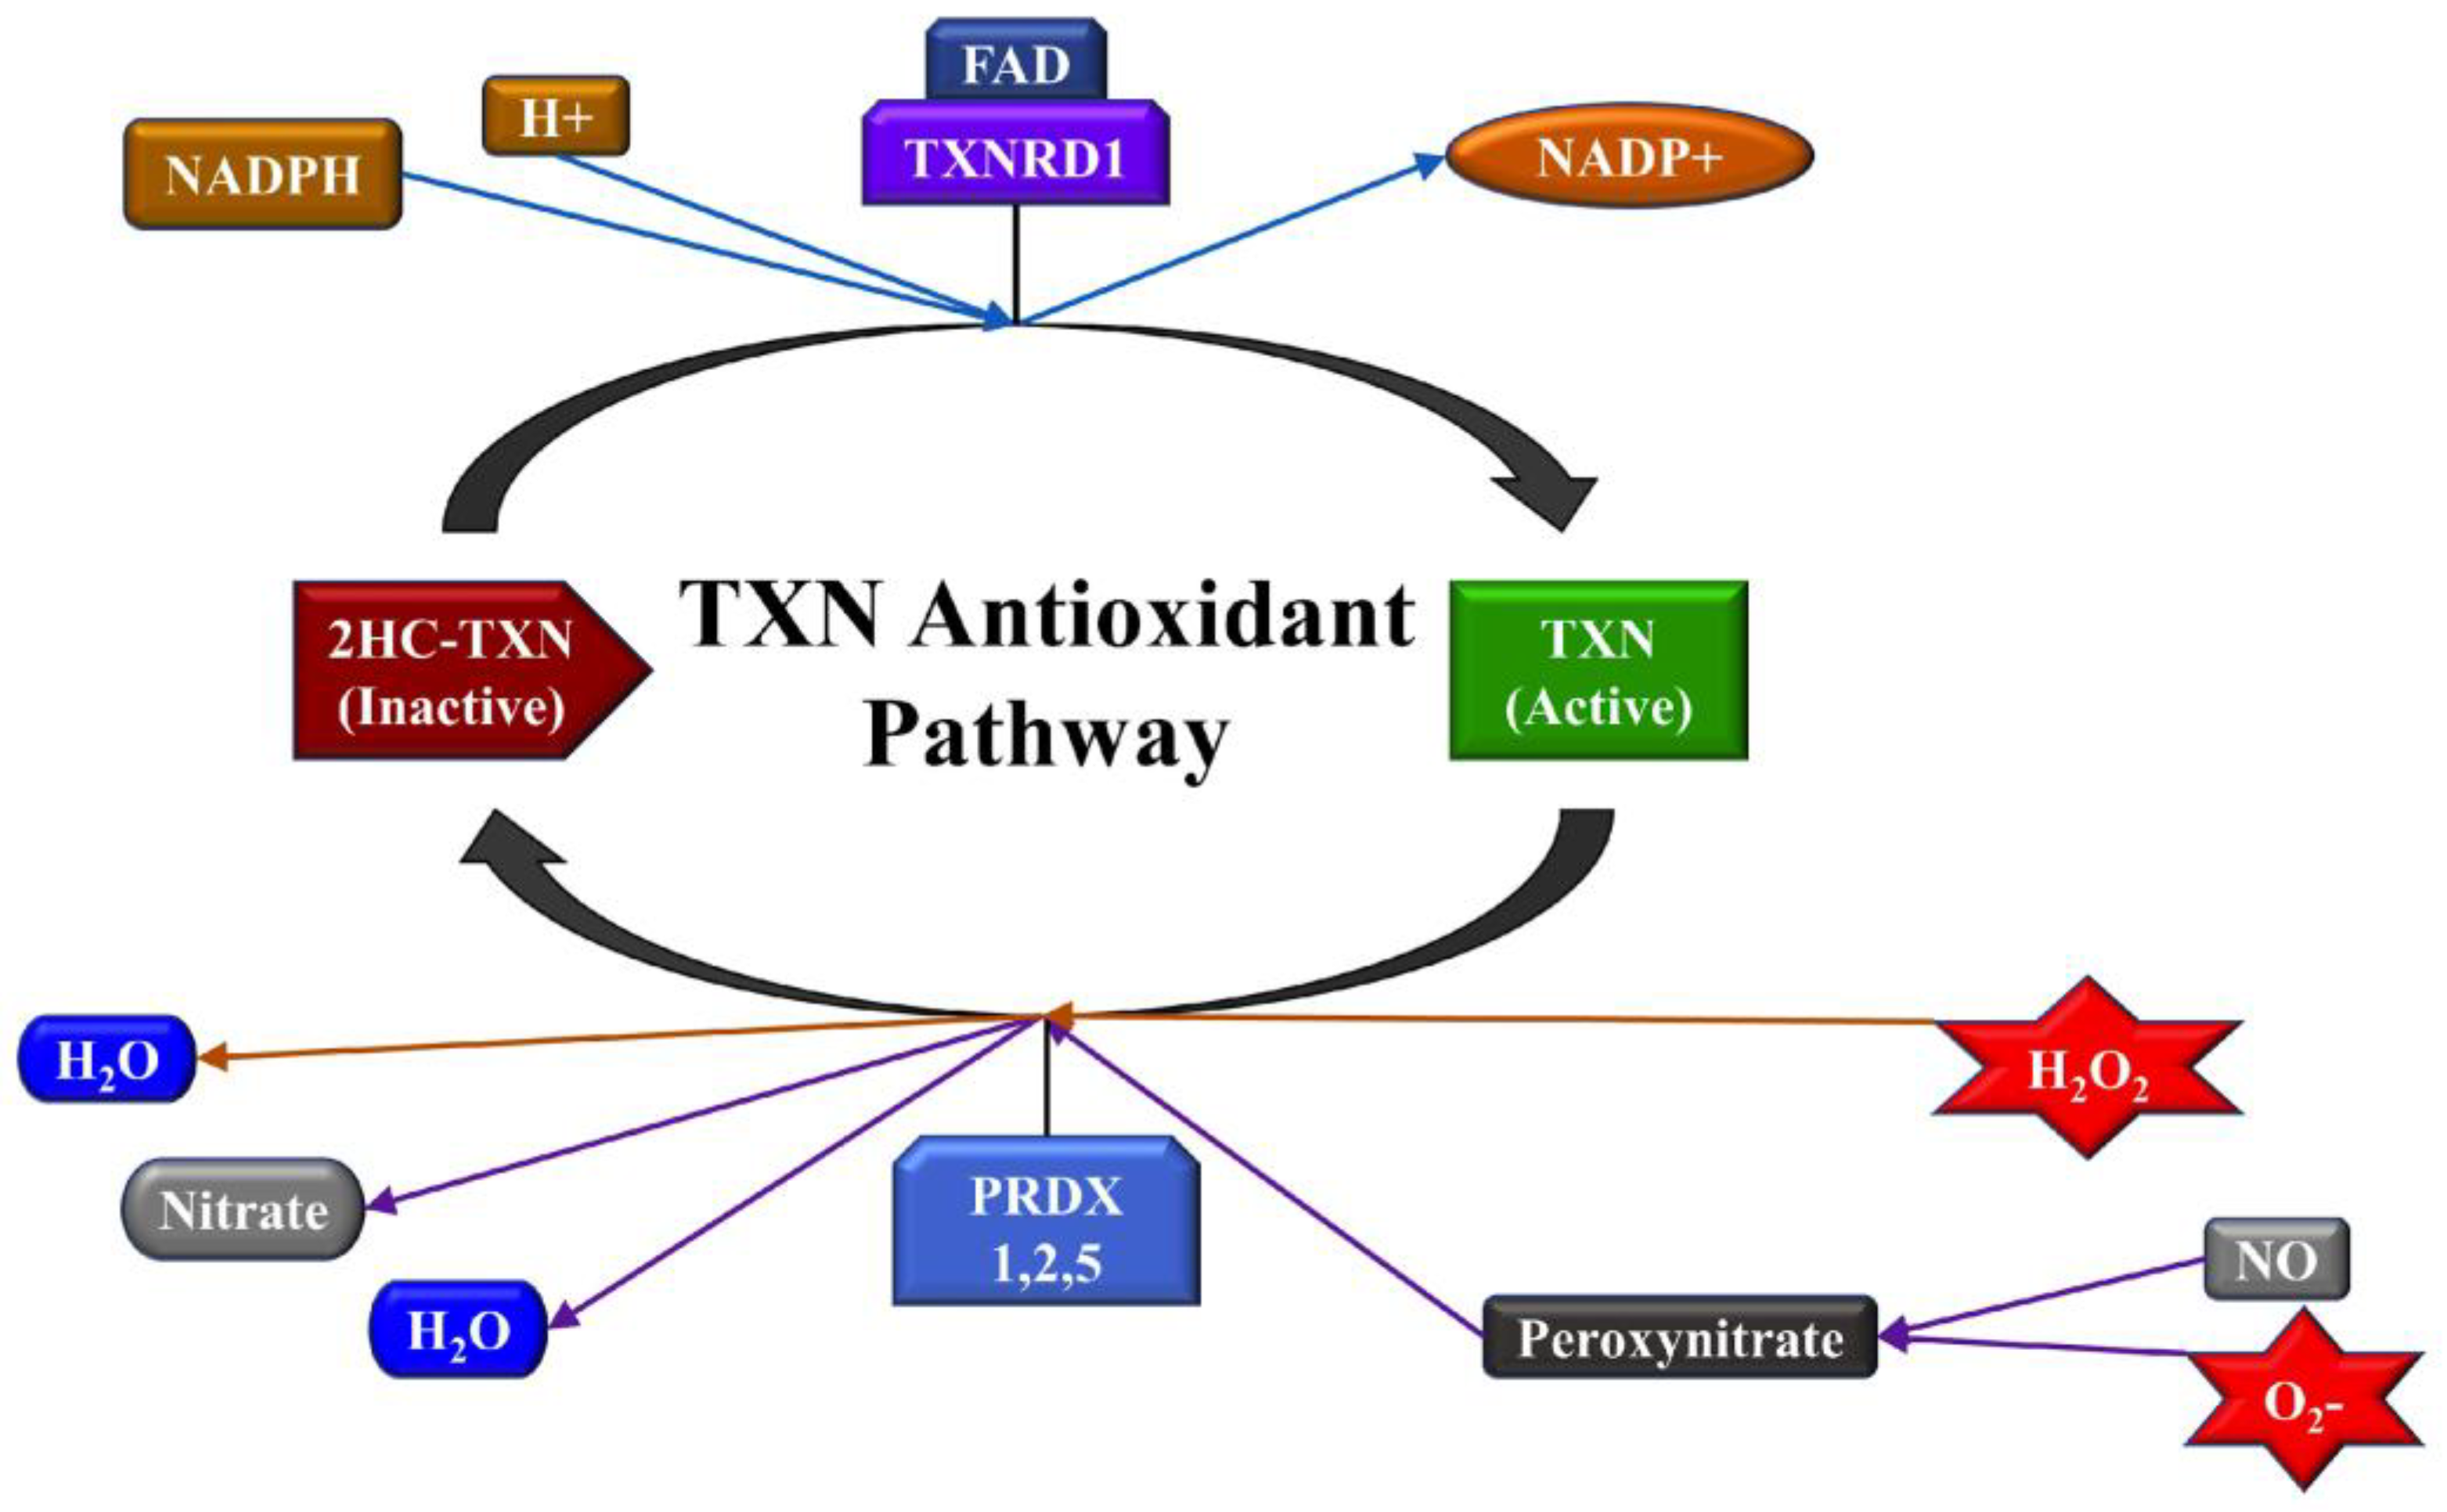
2.3. TXNRD1 is a Marker for Oxidative Stress
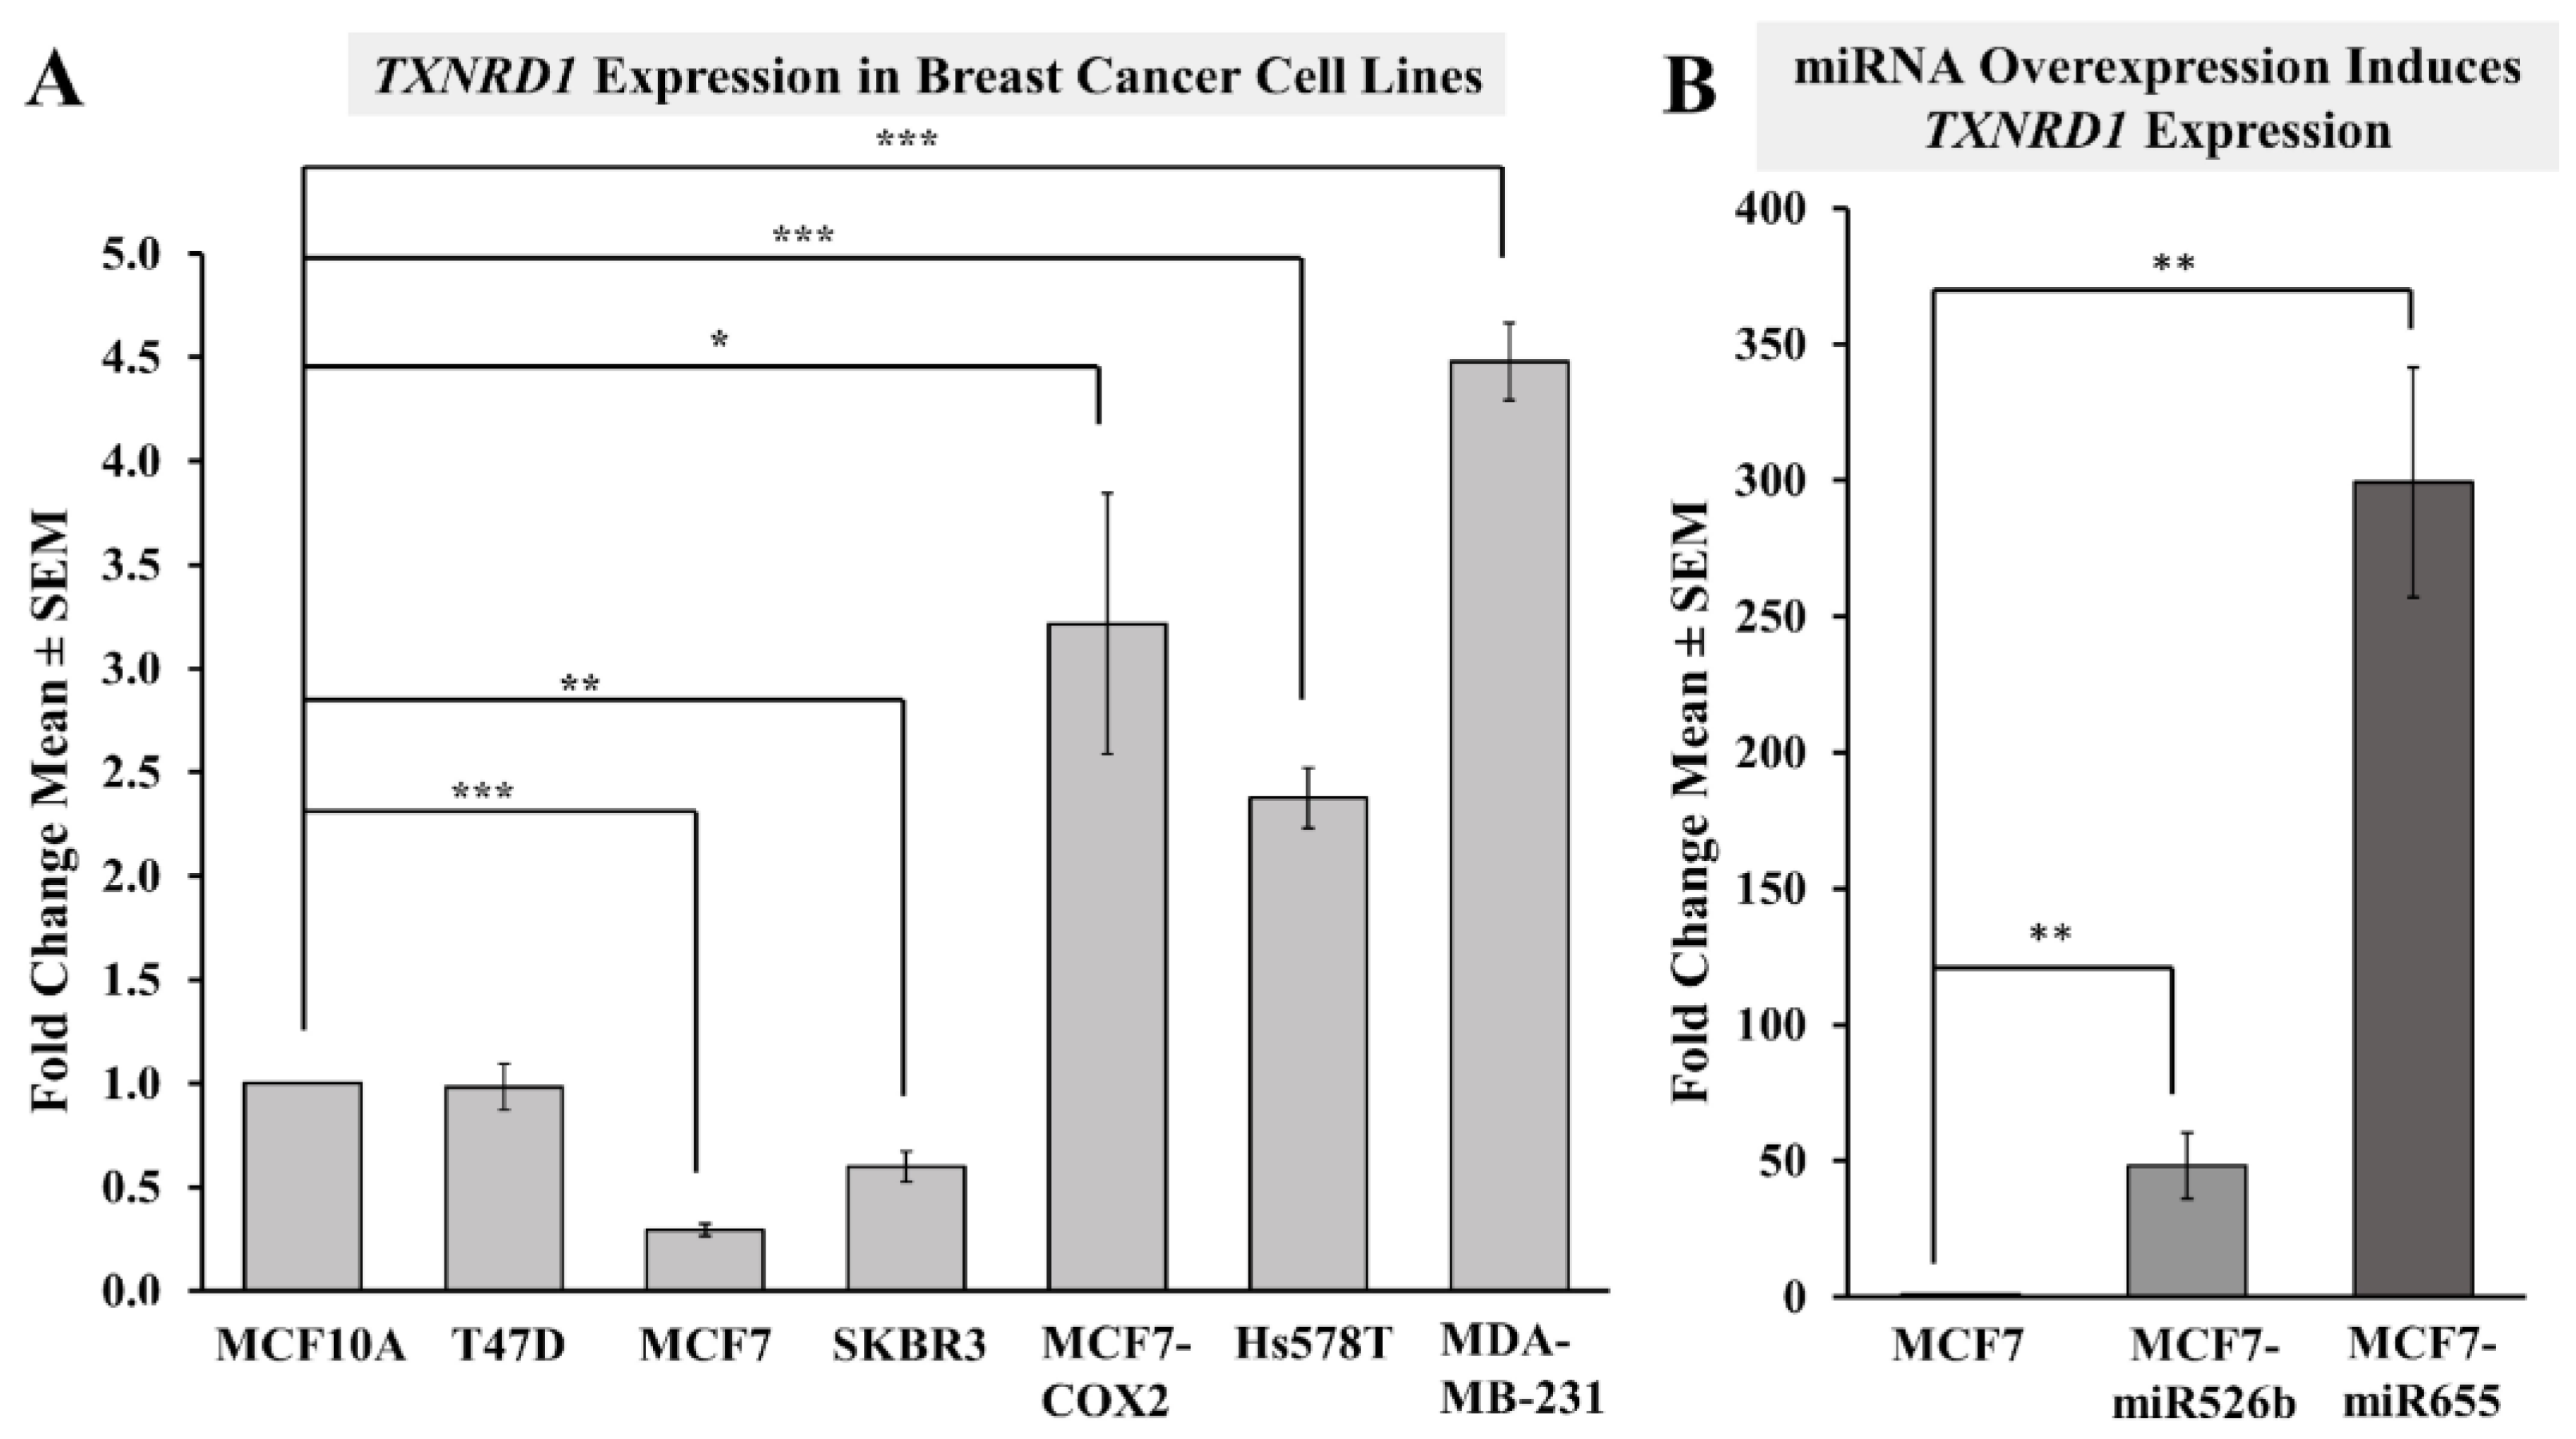
2.3.1. Highly Metastatic Breast Cancer Cell Lines Show Upregulation of TXNRD1
2.3.2. miRNA Overexpression Directly Upregulates TXNRD1 Expression
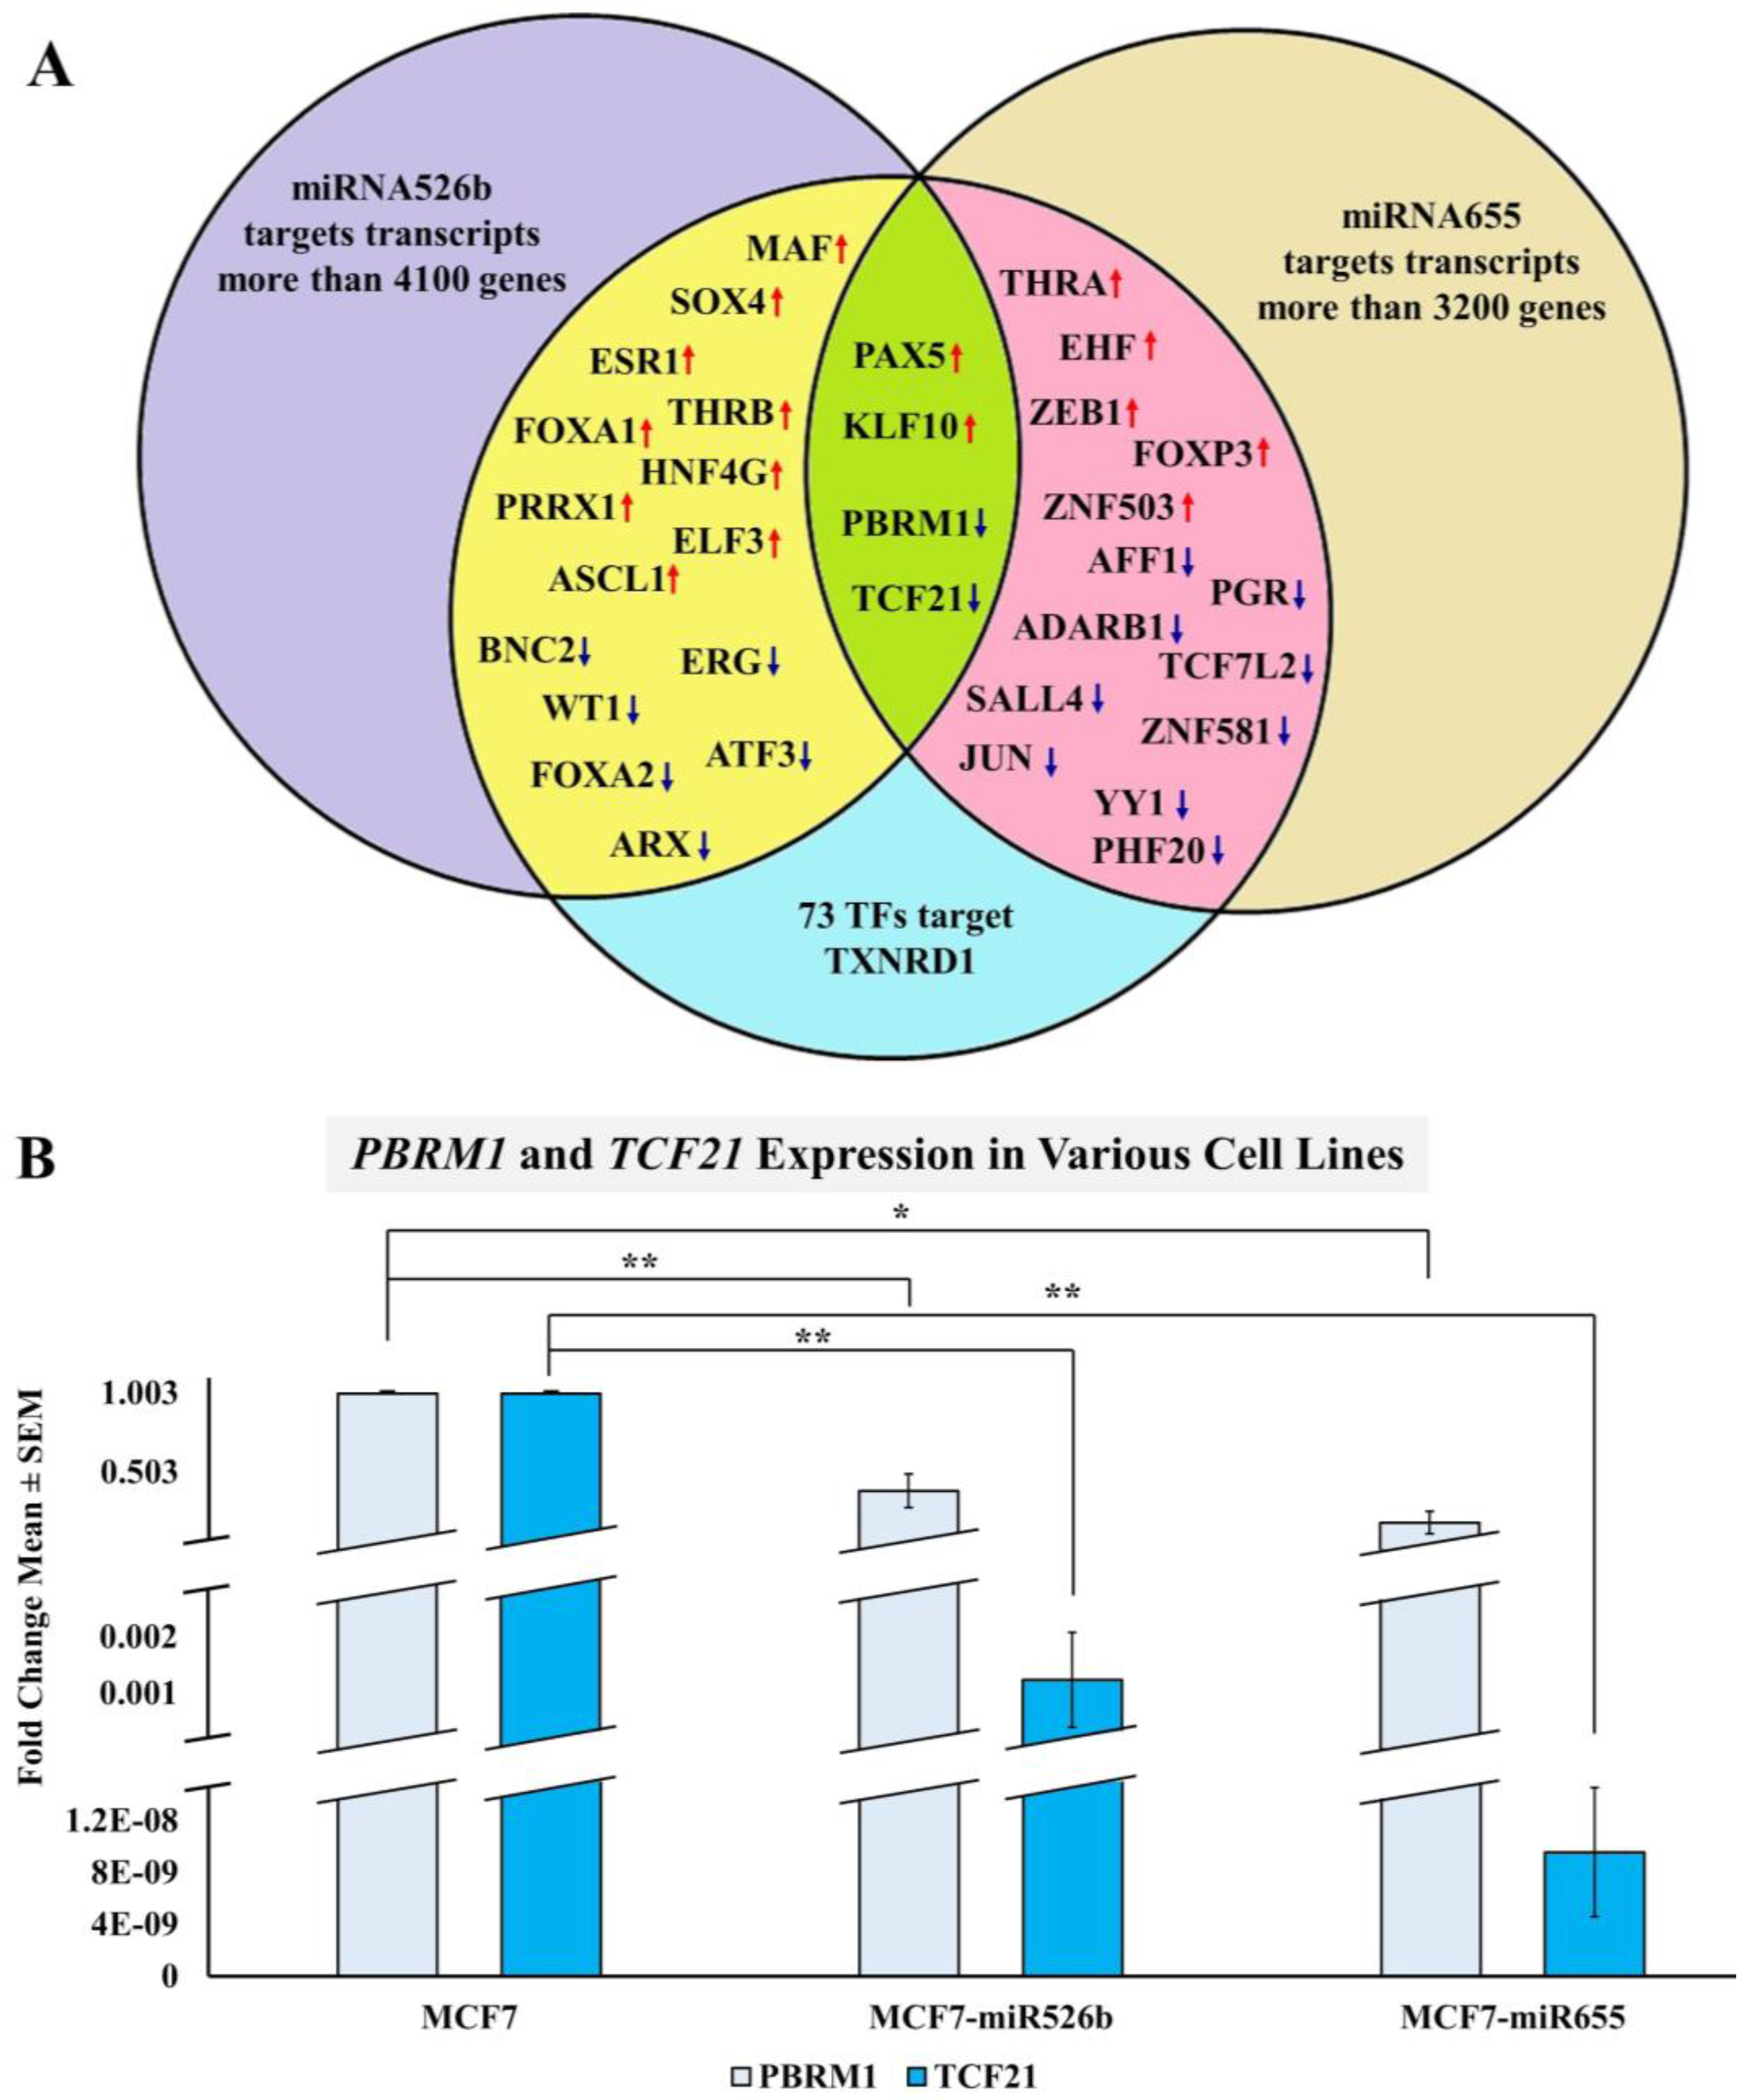
2.3.3. Bioinformatic Analysis to Identify a Link between miRNAs and TXNRD1
2.3.4. miRNA Overexpression Indirectly Upregulates TXNRD1 by Targeting Negative Regulator of the Gene
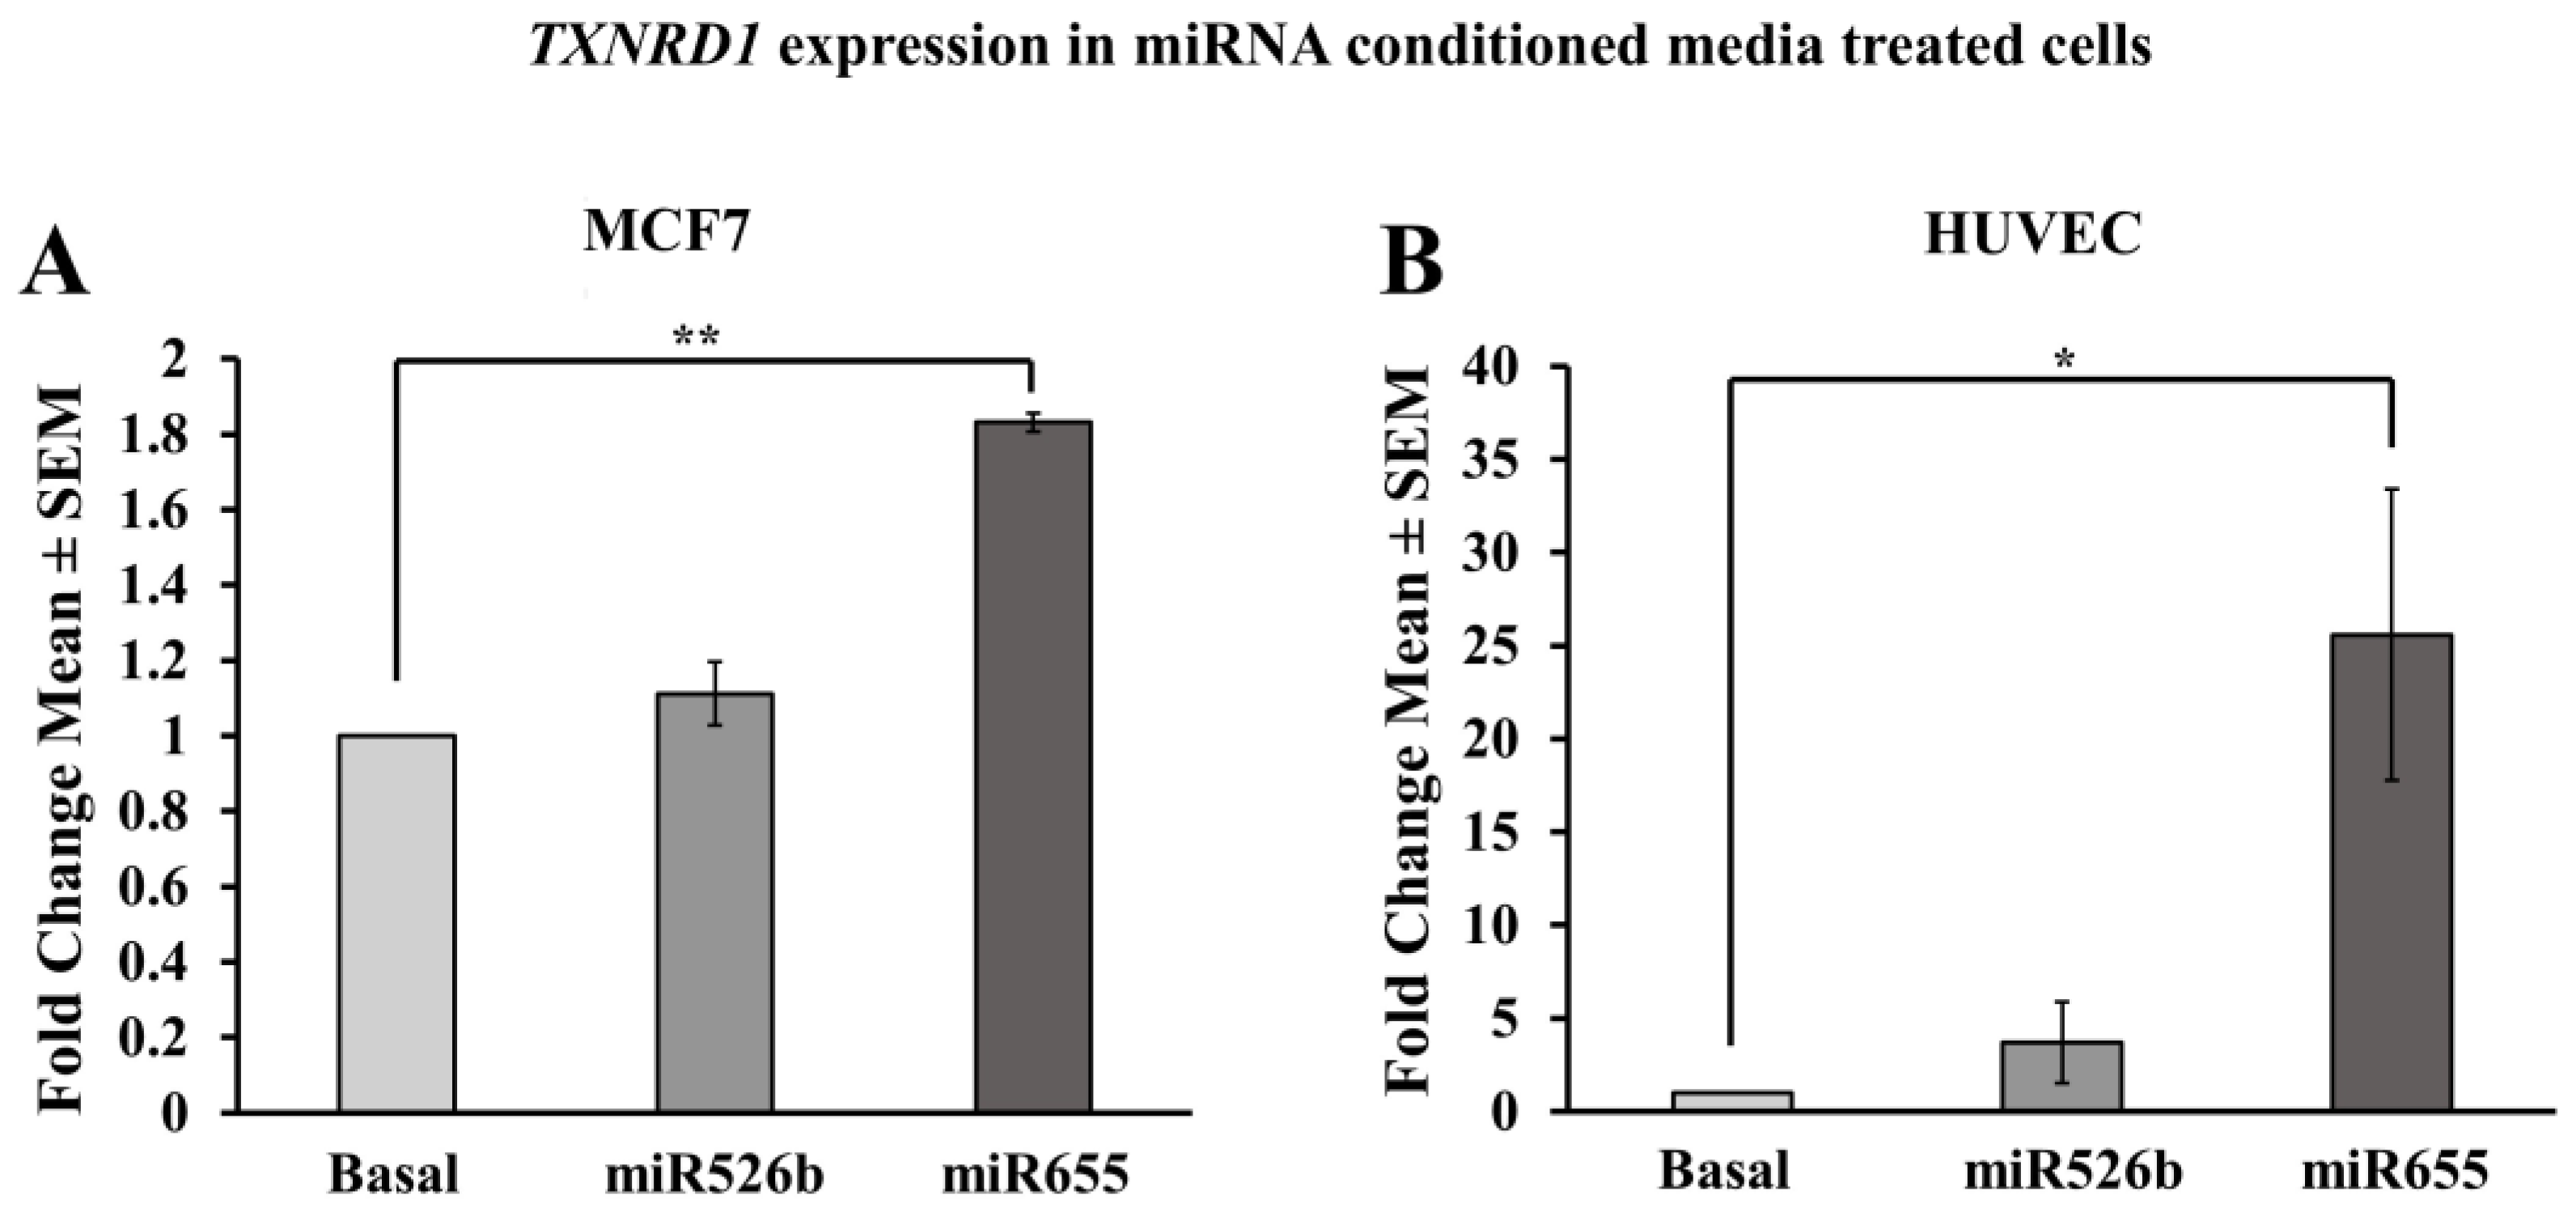
2.3.5. MCF7 Cells Treated with miR526b and miR655-High Cell-Free Conditioned Media Show Upregulation of TXNRD1
2.3.6. HUVECs Treated with Cell-Free miR526b and miR655 Conditioned Media Show Upregulation of TXNRD1
2.4. Cell-Free miRNA Conditioned Media Indirectly Induces miRNA Overexpression in MCF7 Cells
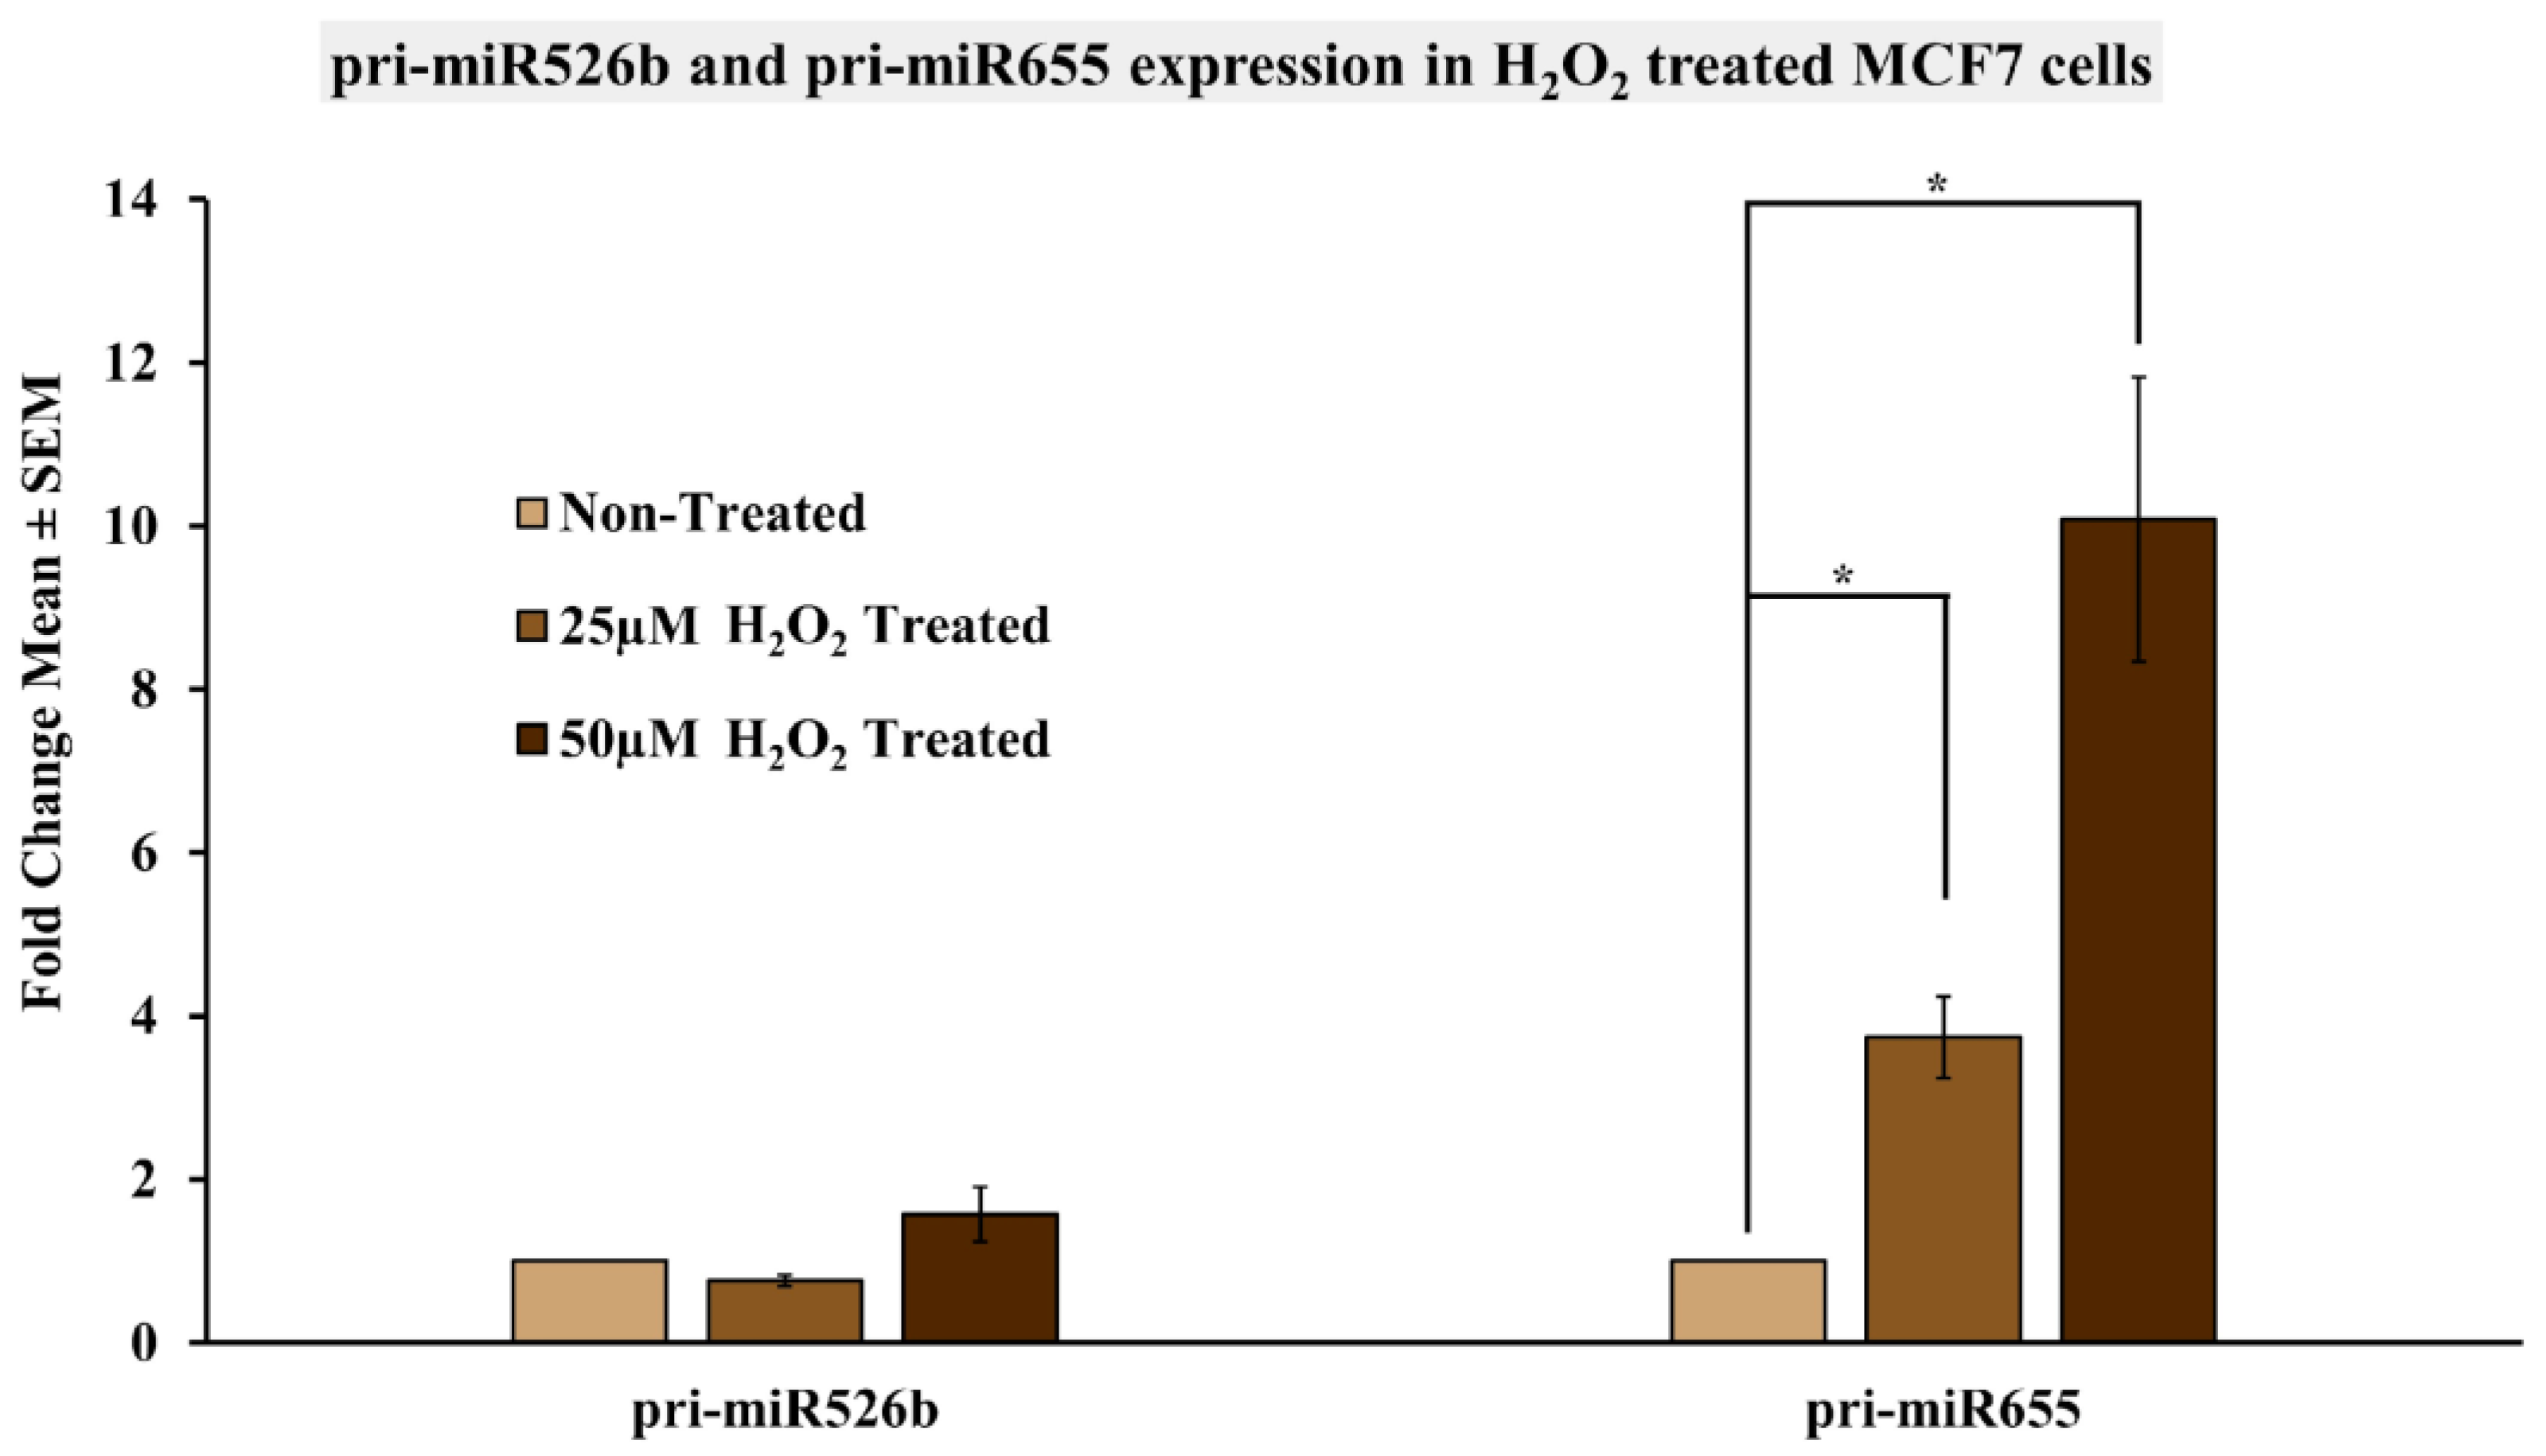
2.5. Induction of Oxidative Stress Upregulates miR526b and miR655 Expression in MCF7 Cells
3. Discussion
4. Materials and Methods
4.1. Cell Culture
4.2. Collection of Conditioned Media
4.3. RNA Extraction and Quantitative Real-Time PCR
4.4. Fluorescence Microplate Assay
4.5. Fluorescence Microscopy Assay
4.6. Bioinformatics Analysis
4.7. Treatment of MCF7 Cells with H2O2
4.8. Statistical Analysis
Supplementary Materials
Author Contributions
Funding
Acknowledgments
Conflicts of Interest
Abbreviations
| ROS | Reactive Oxygen Species |
| SO | Superoxide |
| miRNA | microRNA |
| TXNRD1 | Thioredoxin Reductase 1 |
| TXN | Thioredoxin |
| TF | Transcription Factor |
| ER | Estrogen Receptor |
References
- Breast Cancer—Early Diagnosis and Screening. Available online: https://www.who.int/cancer/prevention/diagnosis-screening/breast-cancer/en/ (accessed on 19 July 2019).
- Hecht, F.; Pessoa, C.F.; Gentile, L.B.; Rosenthal, D.; Carvalho, D.P.; Fortunato, R.S. The role of oxidative stress on breast cancer development and therapy. Tumor Biol. 2016, 37, 4281–4291. [Google Scholar] [CrossRef] [PubMed]
- Federico, A.; Morgillo, F.; Tuccillo, C.; Ciardiello, F.; Loguercio, C. Chronic inflammation and oxidative stress in human carcinogenesis. Int. J. Cancer 2007, 121, 2381–2386. [Google Scholar] [CrossRef] [PubMed]
- Buetler, T.M.; Krauskopf, A.; Ruegg, U.T. Role of superoxide as a signaling molecule. Physiology 2004, 19, 120–123. [Google Scholar] [CrossRef]
- Calaf, G.M.; Urzua, U.; Termini, L.; Aguayo, F. Oxidative stress in female cancers. Oncotarget 2018, 9, 23824. [Google Scholar] [CrossRef] [PubMed]
- Lobo, V.; Patil, A.; Phatak, A.; Chandra, N. Free radicals, antioxidants and functional foods: Impact on human health. Pharmacogn. Rev. 2010, 4, 118–126. [Google Scholar] [CrossRef]
- Arnér, E.S.; Holmgren, A. Physiological functions of thioredoxin and thioredoxin reductase. Eur. J. Biochem. 2000, 267, 6102–6109. [Google Scholar] [CrossRef] [PubMed]
- Lu, J.; Vlamis-Gardikas, A.; Kandasamy, K.; Zhao, R.; Gustafsson, T.N.; Engstrand, L.; Hoffner, S.; Engman, L.; Holmgren, A. Inhibition of bacterial thioredoxin reductase: An antibiotic mechanism targeting bacteria lacking glutathione. FASEB J. 2013, 7, 1394–1403. [Google Scholar] [CrossRef]
- Urig, S.; Lieske, J.; Fritz-Wolf, K.; Irmler, A.; Becker, K. Truncated mutants of human thioredoxin reductase 1 do not exhibit glutathione reductase activity. FEBS Lett. 2006, 580, 3595–3600. [Google Scholar] [CrossRef] [Green Version]
- Leone, A.; Roca, M.S.; Ciardiello, C.; Costantini, S.; Budillon, A. Oxidative stress gene expression profile correlates with cancer patient poor prognosis: Identification of crucial pathways might select novel therapeutic approaches. Oxid. Med. Cell. Longevity 2017, 2017. [Google Scholar] [CrossRef]
- Singh, R.P.; Massachi, I.; Manickavel, S.; Singh, S.; Rao, N.P.; Hasan, S.; Mc Curdy, D.K.; Sharma, S.; Wong, D.; Hahn, B.H.; et al. The role of miRNA in inflammation and autoimmunity. Autoimmun. Rev. 2013, 12, 1160–1165. [Google Scholar] [CrossRef]
- Majumder, M.; Landman, E.; Liu, L.; Hess, D.; Lala, P.K. COX-2 elevates oncogenic miR-526b in breast cancer by EP4 activation. Mol. Cancer Res. 2015, 13, 1022–1033. [Google Scholar] [CrossRef]
- Majumder, M.; Dunn, L.; Liu, L.; Hasan, A.; Vincent, K.; Brackstone, M.; Hess, D.; Lala, P.K. COX-2 induces oncogenic microRNA miR655 in human breast cancer. Sci. Rep. 2018, 8, 327. [Google Scholar] [CrossRef]
- Majumder, M.; Nandi, P.; Omar, A.; Ugwuagbo, K.; Lala, P.K. EP4 as a therapeutic target for aggressive human breast cancer. Int. J. Mol. Sci. 2018, 19, 1019. [Google Scholar] [CrossRef]
- Hunter, S.; Nault, B.; Ugwuagbo, K.; Maiti, S.; Majumder, M. Mir526b and Mir655 Promote Tumour Associated Angiogenesis and Lymphangiogenesis in Breast Cancer. Cancers 2019, 11, 938. [Google Scholar] [CrossRef]
- He, J.; Jiang, B.H. Interplay between reactive oxygen species and microRNAs in cancer. Curr. Pharmacol. Rep. 2016, 2, 82–90. [Google Scholar] [CrossRef]
- Longo, A.; Librizzi, M.; Chuckowree, I.; Baltus, C.; Spencer, J.; Luparello, C. Cytotoxicity of the urokinase-plasminogen activator inhibitor carbamimidothioic acid (4-boronophenyl) methyl ester hydrobromide (BC-11) on triple-negative MDA-MB231 breast cancer cells. Molecules 2015, 20, 9879–9889. [Google Scholar] [CrossRef]
- Librizzi, M.; Longo, A.; Chiarelli, R.; Amin, J.; Spencer, J.; Luparello, C. Cytotoxic effects of Jay Amin hydroxamic acid (JAHA), a ferrocene-based class I histone deacetylase inhibitor, on triple-negative MDA-MB231 breast cancer cells. Chem. Res. Toxicol. 2012, 25, 2608–2616. [Google Scholar] [CrossRef]
- Liang, H.H.; Huang, C.Y.; Chou, C.W.; Makondi, P.T.; Huang, M.T.; Wei, P.L.; Chang, Y.J. Heat shock protein 27 influences the anti-cancer effect of curcumin in colon cancer cells through ROS production and autophagy activation. Life Sci. 2018, 209, 43–51. [Google Scholar] [CrossRef]
- Chang, T.C.; Wei, P.L.; Makondi, P.T.; Chen, W.T.; Huang, C.Y.; Chang, Y.J. Bromelain inhibits the ability of colorectal cancer cells to proliferate via activation of ROS production and autophagy. PLoS ONE 2019, 14, e0210274. [Google Scholar] [CrossRef]
- Wei, P.L.; Huang, C.Y.; Chang, Y.J. Propyl gallate inhibits hepatocellular carcinoma cell growth through the induction of ROS and the activation of autophagy. PloS ONE 2019, 14, e0210513. [Google Scholar] [CrossRef]
- TargetScanHuman 7.1—Predicted miRNA targets of miR-526b-5p. Available online: http://www.targetscan.org/cgi-bin/targetscan/vert_71/targetscan.cgi?mirg=hsa-miR-526b-5p (accessed on 19 July 2019).
- TargetScanHuman 7.1—Predicted miRNA targets of miR-655-5p. Available online: http://www.targetscan.org/cgi-bin/targetscan/vert_71/targetscan.cgi?mirg=hsa-miR-655-5p (accessed on 19 July 2019).
- Agarwal, V.; Bell, G.W.; Nam, J.; Bartel, D.P. Predicting effective microRNA target sites in mammalian mRNAs. eLife 2015, 4, e05005. [Google Scholar] [CrossRef]
- miRBase-Release 22.1.—miRNA Entry for MI0003150. Available online: http://www.mirbase.org/cgi-bin/mirna_entry.pl?acc=MI0003150 (accessed on 19 July 2019).
- miRBase-Release 22.1.—miRNA Entry for MI0003677. Available online: http://www.mirbase.org/cgi-bin/mirna_entry.pl?acc=MI0003677 (accessed on 19 July 2019).
- Keenan, A.B.; Torre, D.; Lachmann, A.; Leong, A.K.; Wojciechowicz, M.L.; Utti, V.; Jagodnik, K.M.; Kropiwnicki, E.; Wang, Z.; Ma’ayan, A. ChEA3: Transcription factor enrichment analysis by orthogonal omics integration. Nucleic Acids Res. 2019, 2, 212–224. [Google Scholar] [CrossRef]
- Wang, H.; Qu, Y.; Dai, B.; Zhu, Y.; Shi, G.; Zhu, Y.; Shen, Y.; Zhang, H.; Ye, D. PBRM1 regulates proliferation and the cell cycle in renal cell carcinoma through a chemokine/chemokine receptor interaction pathway. PLoS ONE 2017, 12, e0180862. [Google Scholar] [CrossRef]
- Wang, J.; Gao, X.; Wang, M.; Zhang, J. Clinicopathological significance and biological role of TCF21 mRNA in breast cancer. Tumor Biol. 2015, 36, 8679–8683. [Google Scholar] [CrossRef]
- Nourazarian, A.R.; Kangari, P.; Salmaninejad, A. Roles of oxidative stress in the development and progression of breast cancer. Asian Pac. J. Cancer Prev. 2014, 15, 4745–4751. [Google Scholar] [CrossRef]
- Kanchan, R.K.; Tripathi, C.; Baghel, K.S.; Dwivedi, S.K.; Kumar, B.; Sanyal, S.; Sharma, S.; Mitra, K.; Garg, V.; Singh, K.; et al. Estrogen receptor potentiates mTORC2 signaling in breast cancer cells by upregulating superoxide anions. Free Radical Bio. Med. 2012, 53, 1929–1941. [Google Scholar] [CrossRef]
- Yeh, C.C.; Hou, M.F.; Tsai, S.M.; Lin, S.K.; Hsiao, J.K.; Huang, J.C.; Wang, L.H.; Wu, S.H.; Hou, L.A.; Ma, H.; et al. Superoxide anion radical, lipid peroxides and antioxidant status in the blood of patients with breast cancer. Clin. Chim. Acta. 2005, 361, 104–111. [Google Scholar] [CrossRef]
- Chen, H.; Gao, L.; Yang, M.; Zhang, L.; He, F.L.; Shi, Y.K.; Pan, X.H.; Wang, H. MicroRNA-155 affects oxidative damage through regulating autophagy in endothelial cells. Oncol. Lett. 2019, 17, 2237–2243. [Google Scholar] [CrossRef]
- Cheleschi, S.; de Palma, A.; Pascarelli, N.; Giordano, N.; Galeazzi, M.; Tenti, S.; Fioravanti, A. Could oxidative stress regulate the expression of microRNA-146a and microRNA-34a in human osteoarthritic chondrocyte cultures? Int. J. Mol. Sci. 2017, 18, 2660. [Google Scholar] [CrossRef]
- Zhang, X.; Ng, W.L.; Wang, P.; Tian, L.; Werner, E.; Wang, H.; Doetsch, P.; Wang, Y. MicroRNA-21 modulates the levels of reactive oxygen species by targeting SOD3 and TNFα. Cancer Res. 2012, 72, 4707–4713. [Google Scholar] [CrossRef]
- Huang, W.; Luo, S.; Burgess, R.; Yi, Y.H.; Huang, G.; Huang, R.P. New insights into the tumor microenvironment utilizing protein array technology. Int. J. Mol. Sci. 2018, 19, 559. [Google Scholar] [CrossRef]
- Van den Brande, S.; Gijbels, M.; Wynant, N.; Santos, D.; Mingels, L.; Gansemans, Y.; van Nieuwerburgh, F.; Vanden Broeck, J. The presence of extracellular microRNAs in the media of cultured Drosophila cells. Sci. Rep. 2018, 8, 17312. [Google Scholar] [CrossRef]
- Reuter, S.; Gupta, S.C.; Chaturvedi, M.M.; Aggarwal, B.B. Oxidative stress, inflammation, and cancer: How are they linked? Free Radicals Biol. Med. 2010, 49, 1603–1616. [Google Scholar] [CrossRef] [Green Version]
- Zajchowski, D.A.; Bartholdi, M.F.; Gong, Y.; Webster, L.; Liu, H.L.; Munishkin, A.; Beauheim, C.; Harvey, S.; Ethier, S.P.; Johnson, P.H. Identification of gene expression profiles that predict the aggressive behavior of breast cancer cells. Cancer Res. 2001, 61, 5168–5178. [Google Scholar]
- Mo, D.; Li, C.; Liang, J.; Shi, Q.; Su, N.; Luo, S.; Zeng, T.; Li, X. Low PBRM1 identifies tumor progression and poor prognosis in breast cancer. Int. J. Clin. Exp. Pathol. 2015, 8, 9307–9313. [Google Scholar]
- Yang, Z.; Li, D.M.; Xie, Q.; Dai, D.Q. Protein expression and promoter methylation of the candidate biomarker TCF21 in gastric cancer. J. Cancer Res. Clin. Oncol. 2015, 141, 211–220. [Google Scholar] [CrossRef]
- Dai, Y.; Duan, H.; Duan, C.; Zhu, H.; Zhou, R.; Pei, H.; Shen, L. TCF21 functions as a tumor suppressor in colorectal cancer through inactivation of PI3K/AKT signaling. Onco. Targets Ther. 2017, 10, 1603–1611. [Google Scholar] [CrossRef]
- Smith, L.T.; Lin, M.; Brena, R.M.; Lang, J.C.; Schuller, D.E.; Otterson, G.A.; Morrison, C.D.; Smiraglia, D.J.; Plass, C. Epigenetic regulation of the tumor suppressor gene TCF21 on 6q23-q24 in lung and head and neck cancer. Proc. Natl. Acad. Sci. USA 2006, 103, 982–987. [Google Scholar] [CrossRef]
- Majumder, M.; Xin, X.; Liu, L.; Girish, G.V.; Lala, P.K. Prostaglandin E2 receptor EP4 as the common target on cancer cells and macrophages to abolish angiogenesis, lymphangiogenesis, metastasis and stem-like cell functions. Cancer Sci. 2014, 105, 1142–1151. [Google Scholar] [CrossRef]
- Chua, P.J.; Yip, G.W.C.; Bay, B.H. Cell cycle arrest induced by hydrogen peroxide is associated with modulation of oxidative stress related genes in breast cancer cells. Exp. Biol. Med. 2009, 234, 1086–1094. [Google Scholar] [CrossRef]
- Mahalingaiah, P.K.S.; Ponnusamy, L.; Singh, K.P. Chronic oxidative stress causes estrogen-independent aggressive phenotype, and epigenetic inactivation of estrogen receptor alpha in MCF-7 breast cancer cells. Breast Cancer Res. Treat. 2015, 153, 41–56. [Google Scholar] [CrossRef]
- Majumder, M.; Xin, X.; Liu, L.; Tutunea-Fatan, E.; Rodriguez-Torres, M.; Vincent, K.; Postovit, L.M.; Hess, D.; Lala, P.K. COX-2 induces breast cancer stem cells via EP4/PI3K/AKT/NOTCH/WNT axis. Cancer Stem Cells 2016, 34, 2290–2305. [Google Scholar] [CrossRef]


© 2019 by the authors. Licensee MDPI, Basel, Switzerland. This article is an open access article distributed under the terms and conditions of the Creative Commons Attribution (CC BY) license (http://creativecommons.org/licenses/by/4.0/).
Share and Cite
Shin, B.; Feser, R.; Nault, B.; Hunter, S.; Maiti, S.; Ugwuagbo, K.C.; Majumder, M. miR526b and miR655 Induce Oxidative Stress in Breast Cancer. Int. J. Mol. Sci. 2019, 20, 4039. https://0-doi-org.brum.beds.ac.uk/10.3390/ijms20164039
Shin B, Feser R, Nault B, Hunter S, Maiti S, Ugwuagbo KC, Majumder M. miR526b and miR655 Induce Oxidative Stress in Breast Cancer. International Journal of Molecular Sciences. 2019; 20(16):4039. https://0-doi-org.brum.beds.ac.uk/10.3390/ijms20164039
Chicago/Turabian StyleShin, Bonita, Riley Feser, Braydon Nault, Stephanie Hunter, Sujit Maiti, Kingsley Chukwunonso Ugwuagbo, and Mousumi Majumder. 2019. "miR526b and miR655 Induce Oxidative Stress in Breast Cancer" International Journal of Molecular Sciences 20, no. 16: 4039. https://0-doi-org.brum.beds.ac.uk/10.3390/ijms20164039