Article

E-cadherin Downregulation and microRNAs in Sporadic Intestinal-Type Gastric Cancer

1
Biosciences Laboratory, Istituto Scientifico Romagnolo per lo Studio e la Cura dei Tumori (IRST) IRCCS, 47014 Meldola, Italy
2
Unit of Biostatistics and Clinical Trials, Istituto Scientifico Romagnolo per lo Studio e la Cura dei Tumori (IRST) IRCCS, 47014 Meldola, Italy
3
Department of Biology and Biotechnology, University of Pavia, 27100 Pavia, Italy
4
General and Oncologic Surgery, Department of Surgery, G.B. Morgagni L.Pierantoni General Hospital, AUSL Romagna, 47121 Forlì, Italy
5
Department of Pathology, AUSL Romagna, Morgagni-Pierantoni Hospital, 47121 Forlì, Italy
6
Department of Medical Oncology, Istituto Scientifico Romagnolo per lo Studio e la Cura dei Tumori (IRST) IRCCS, 47014 Meldola, Italy
*
Author to whom correspondence should be addressed.
Int. J. Mol. Sci. 2019, 20(18), 4452; https://0-doi-org.brum.beds.ac.uk/10.3390/ijms20184452
Submission received: 26 August 2019 / Revised: 3 September 2019 / Accepted: 5 September 2019 / Published: 10 September 2019
(This article belongs to the Special Issue Activations of Cadherin Signaling in Cancer)

Abstract

:
CDH1 gene, encoding E-cadherin, is a tumor suppressor gene frequently altered in gastric cancers (GCs) of both diffuse (DGC) and intestinal (IGC) histotypes, albeit through different mechanisms. The study aimed to characterize CDH1 expression in sporadic IGC and to investigate whether microRNAs (miRs) are involved in its transcriptional control. We evaluated CDH1 expression by quantitative real-time PCR (RT-qPCR) in 33 IGC patients and found a significant downregulation in tumor tissues compared to normal counterparts (p-value = 0.025). Moreover, 14 miRs, predicted to be involved in CDH1 regulation in both a direct and indirect manner, were selected and analyzed by RT-qPCR in an independent case series of 17 IGCs and matched normal tissues. miR-101, miR-26b, and miR-200c emerged as significantly downregulated and were confirmed in the case series of 33 patients (p-value < 0.001). Finally, we evaluated EZH2 expression, a target of both miR-101 and miR-26b, which showed significant upregulation in IGCs (p-value = 0.005). A significant inverse correlation was observed between EZH2 overexpression and CDH1, miR-101, and miR-26b levels (p-value < 0.001). Our results reinforce the link between CDH1 and IGC, highlighting the role of miRs in its transcriptional control and improving our understanding of GC subtypes and biomarkers.

1. Introduction

Gastric cancer (GC) is the fifth most common cancer and the third cause of cancer-related death worldwide [1]. Lauren’s classification, firstly reported in 1965, is currently used to distinguish two gastric adenocarcinoma subtypes based on histological and clinical features: intestinal-type gastric cancer (IGC) and diffuse-type gastric cancer (DGC) [2]. It is widely accepted that IGC and DGC represent distinct disease entities with different epidemiology, etiology, carcinogenesis, progression and, to some extent, biological behaviors [3].
CDH1 gene encodes E-cadherin (Epithelial-cadherin), a Ca2+-dependent transmembrane glycoprotein involved in cell−cell adhesion maintenance in epithelia [4,5]. Accordingly, E-cadherin plays a crucial role in epithelium−mesenchymal transition (EMT): its underexpression reduces cell-cell cohesion, making it possible for tumor cells to dissociate from primary tissue, invade surrounding tissues and disseminate to other sites [6,7,8]. Indeed, numerous studies have highlighted E-cadherin as a critical tumor suppressor in several carcinomas, including GC [9,10].
CDH1 is especially altered in hereditary diffuse GC (HDGC), where complete loss of protein expression often occurs due to a germline lesion and to a second hit, following Knudson’s theory of tumor suppressor gene inactivation [11]. With regard to sporadic tumors, which account for 90% of GCs, it has been reported that epigenetic and structural alterations are as frequent in IGC as in DGC, suggesting histotype independence [12]. Nonetheless, CDH1 status in IGC is not as extensively studied as in DGC.
In the last decade, the focus has been placed on alternative mechanisms capable of modifying E-cadherin expression, including epigenetic control exerted by noncoding transcripts. MicroRNAs (miRs) are small non-coding RNAs, which negatively regulate gene expression and orchestrate pathways involved in cell-cycle control, proliferation, apoptosis, angiogenesis, metastasis, and DNA-damage response in cancers, including GC [13,14,15,16,17,18,19]. Of note, by downregulating the expression of target cancer-related genes, several miRs have been shown to be directly involved in carcinogenic processes, including EMT [20,21]. In this scenario, CDH1 transcription is often susceptible to expression control of miRs and long noncoding RNAs [22]. This occurs in both direct and indirect manners due to the number of pathways regulating CDH1 expression through the activity of Snail, Slug, ZEB1/2, EZH2, and Twist transcription factors [23,24].
In this study, we aimed at analyzing the regulation of CDH1 expression in a case series of IGC and matched normal tissue samples, by focusing on the role of miRs that target CDH1 gene, either directly or indirectly.

2. Results

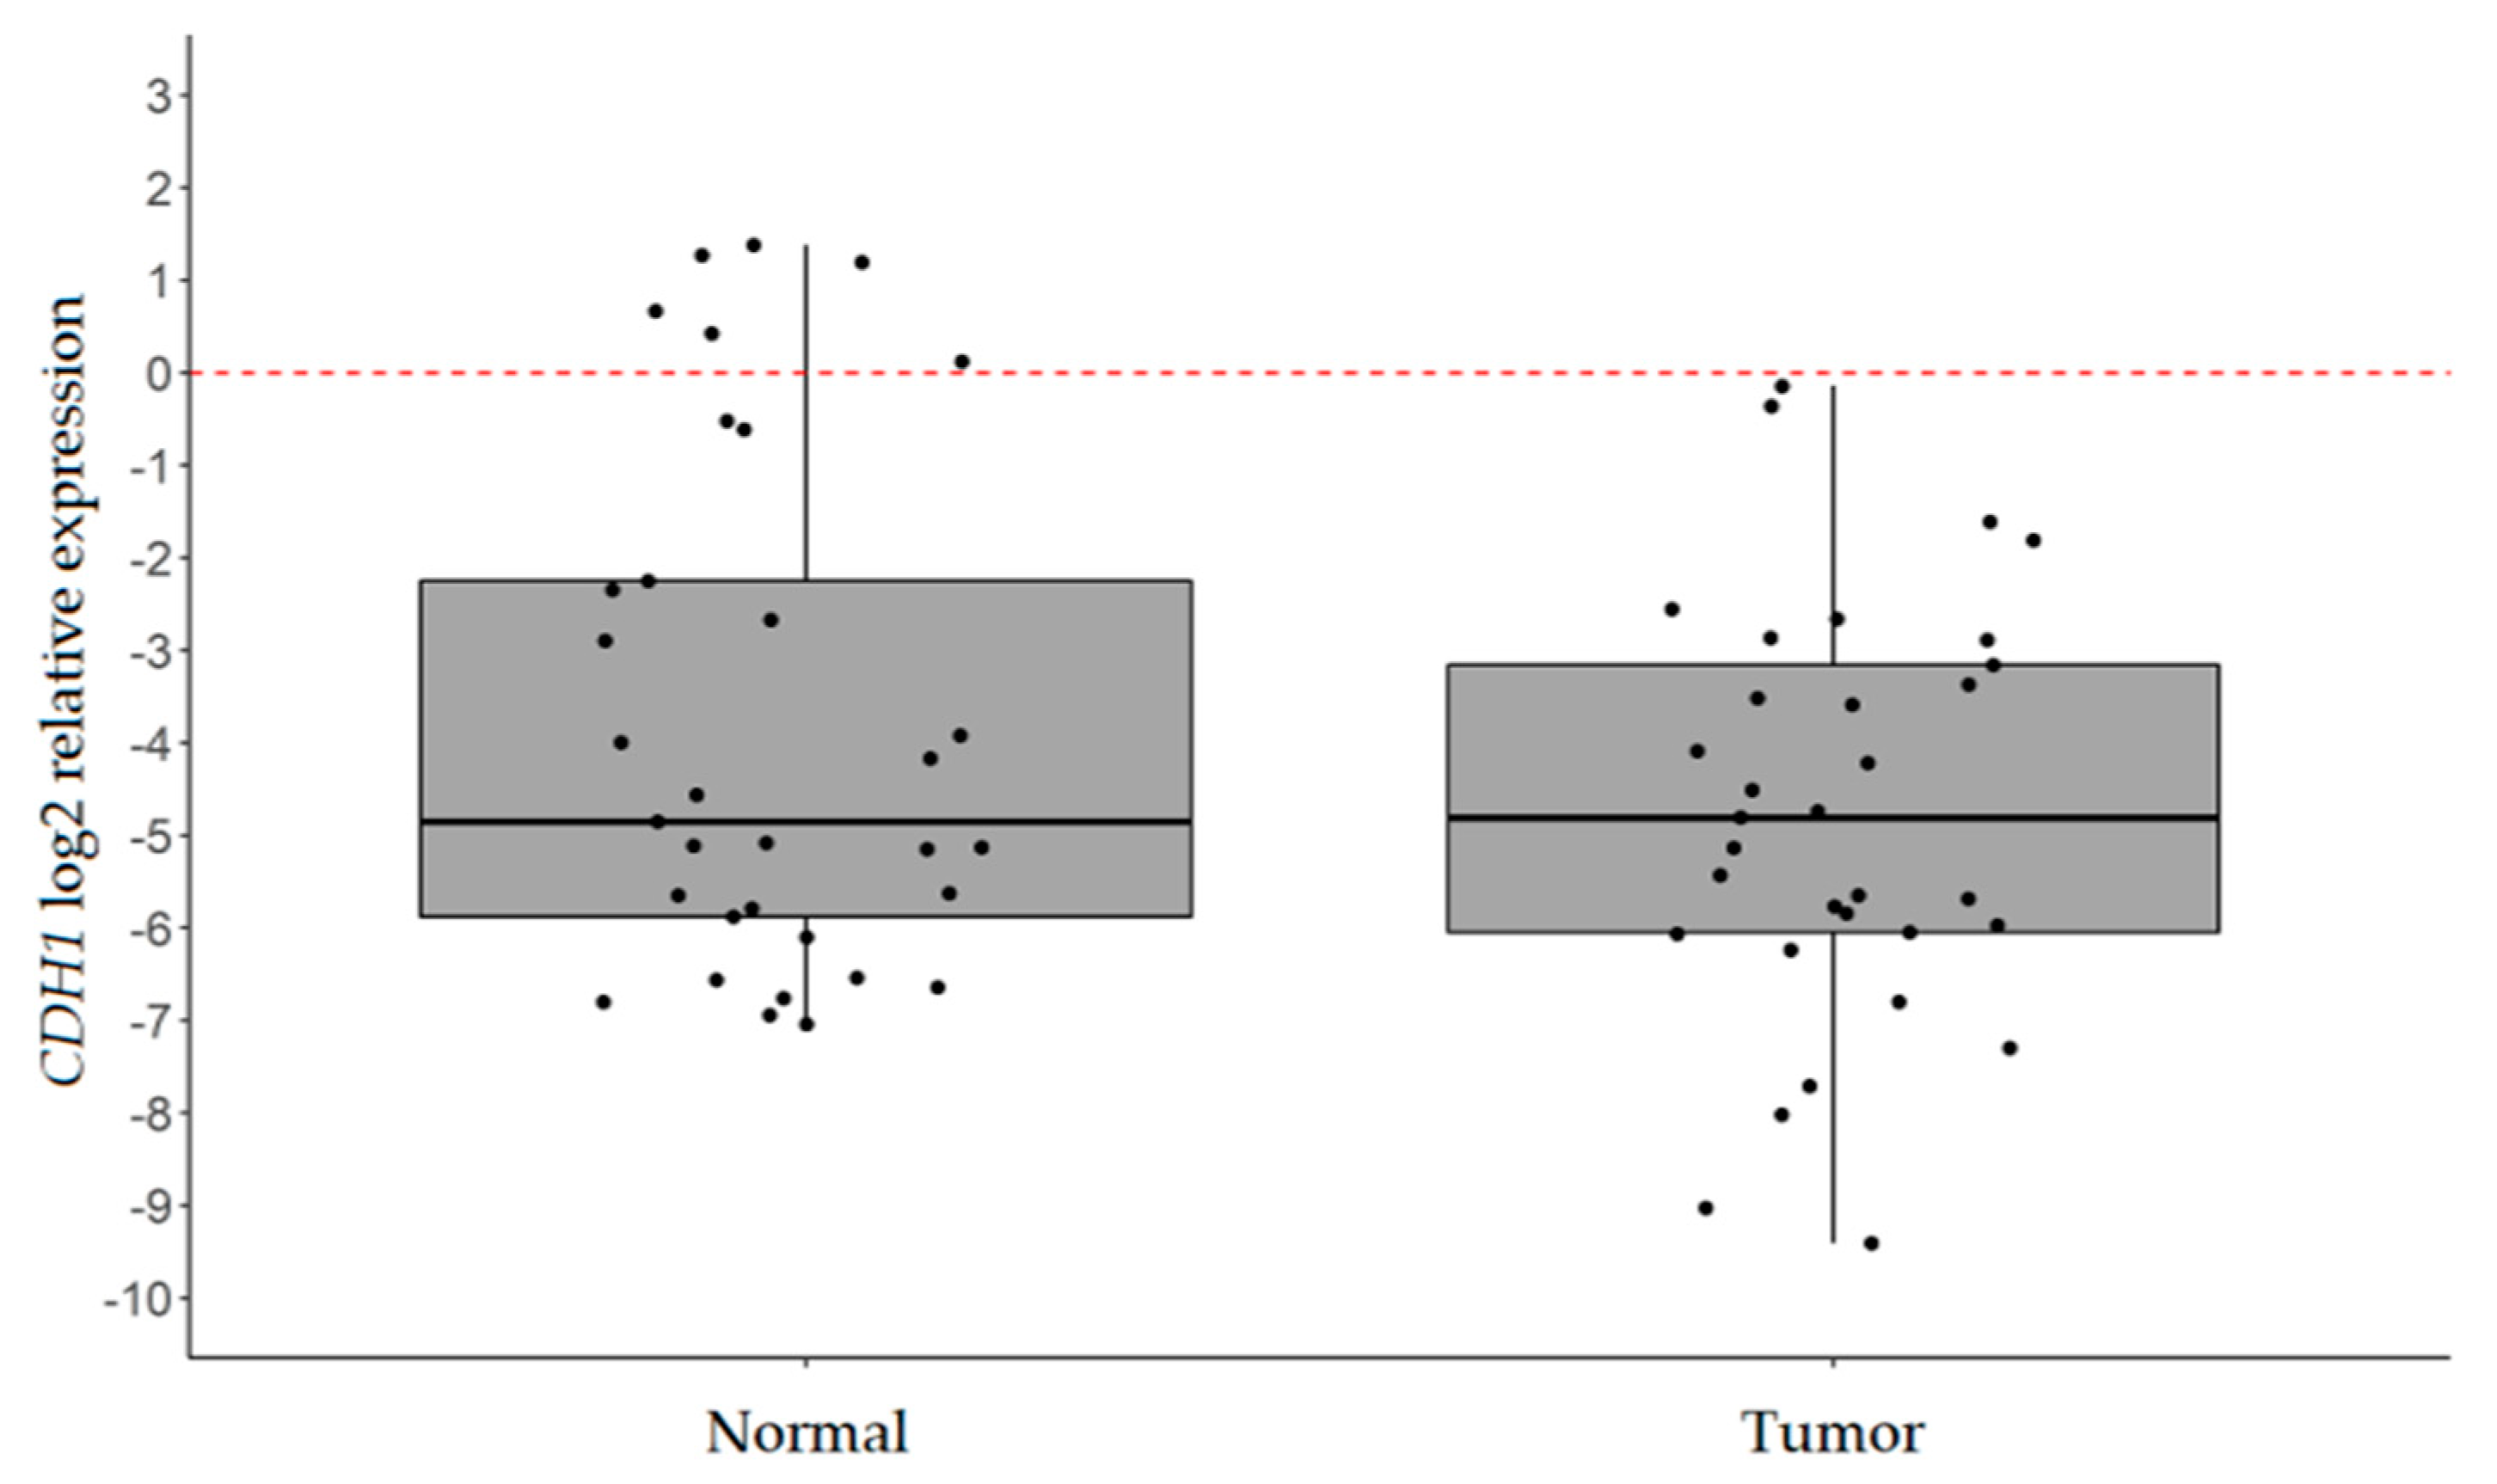
2.1. CDH1 is Significantly Downregulated in IGC

In the present study, a cohort of 33 patients affected by IGC was retrospectively enrolled. Clinicopathological data are summarized in Table 1.
CDH1 transcript levels were analyzed in fresh-frozen neoplastic tissues and normal counterparts by reverse transcription quantitative real-time PCR (RT-qPCR). As shown in Figure 1, we observed a statistically significant decrease in CDH1 mRNA in tumor samples with respect to normal adjacent tissues (log2 mean relative expression −4.76 ± 2.27 vs −3.77 ± 2.79; p-value = 0.025). In particular, CDH1 downregulation was observed in 14 out of 33 samples (42.4%; fold change (FC) ≤ 0.50; Table S2). No significant association between patients’ clinical pathological features and CDH1 expression was observed.

2.2. Explorative Analysis Suggests that the Expression of miR-101, miR-26b, and miR-200c is Altered in IGC

In order to investigate the miR-related transcriptional control of E-cadherin in IGC, we used a combined in silico and literature-based approach to identify miRs known to downregulate CDH1, either directly or indirectly. This approach gave rise to a list of 14 miRs (Table 2). A complete description of miR selection criteria is summarized in the Supplementary Materials.
Due to the limited amount of RNA from 33 IGC patients, an explorative analysis of the expression profiles of the 14 selected miRs was performed on tumor and normal samples from an independent case series of 17 IGCs, in order to identify the miRs that were most differentially expressed in IGC. Eight out of the 14 miRs could be successfully quantified (miR-141, miR-429, miR-200a, miR-200b, miR-200c, miR-101, miR-26b, and miR-23a). In particular, miR-101 (p-value = 0.0023) and miR-26b (p-value = 0.0016) expression levels were significantly lower in tumors than in normal tissues, while miR-200c showed borderline significance (p-value = 0.0537).

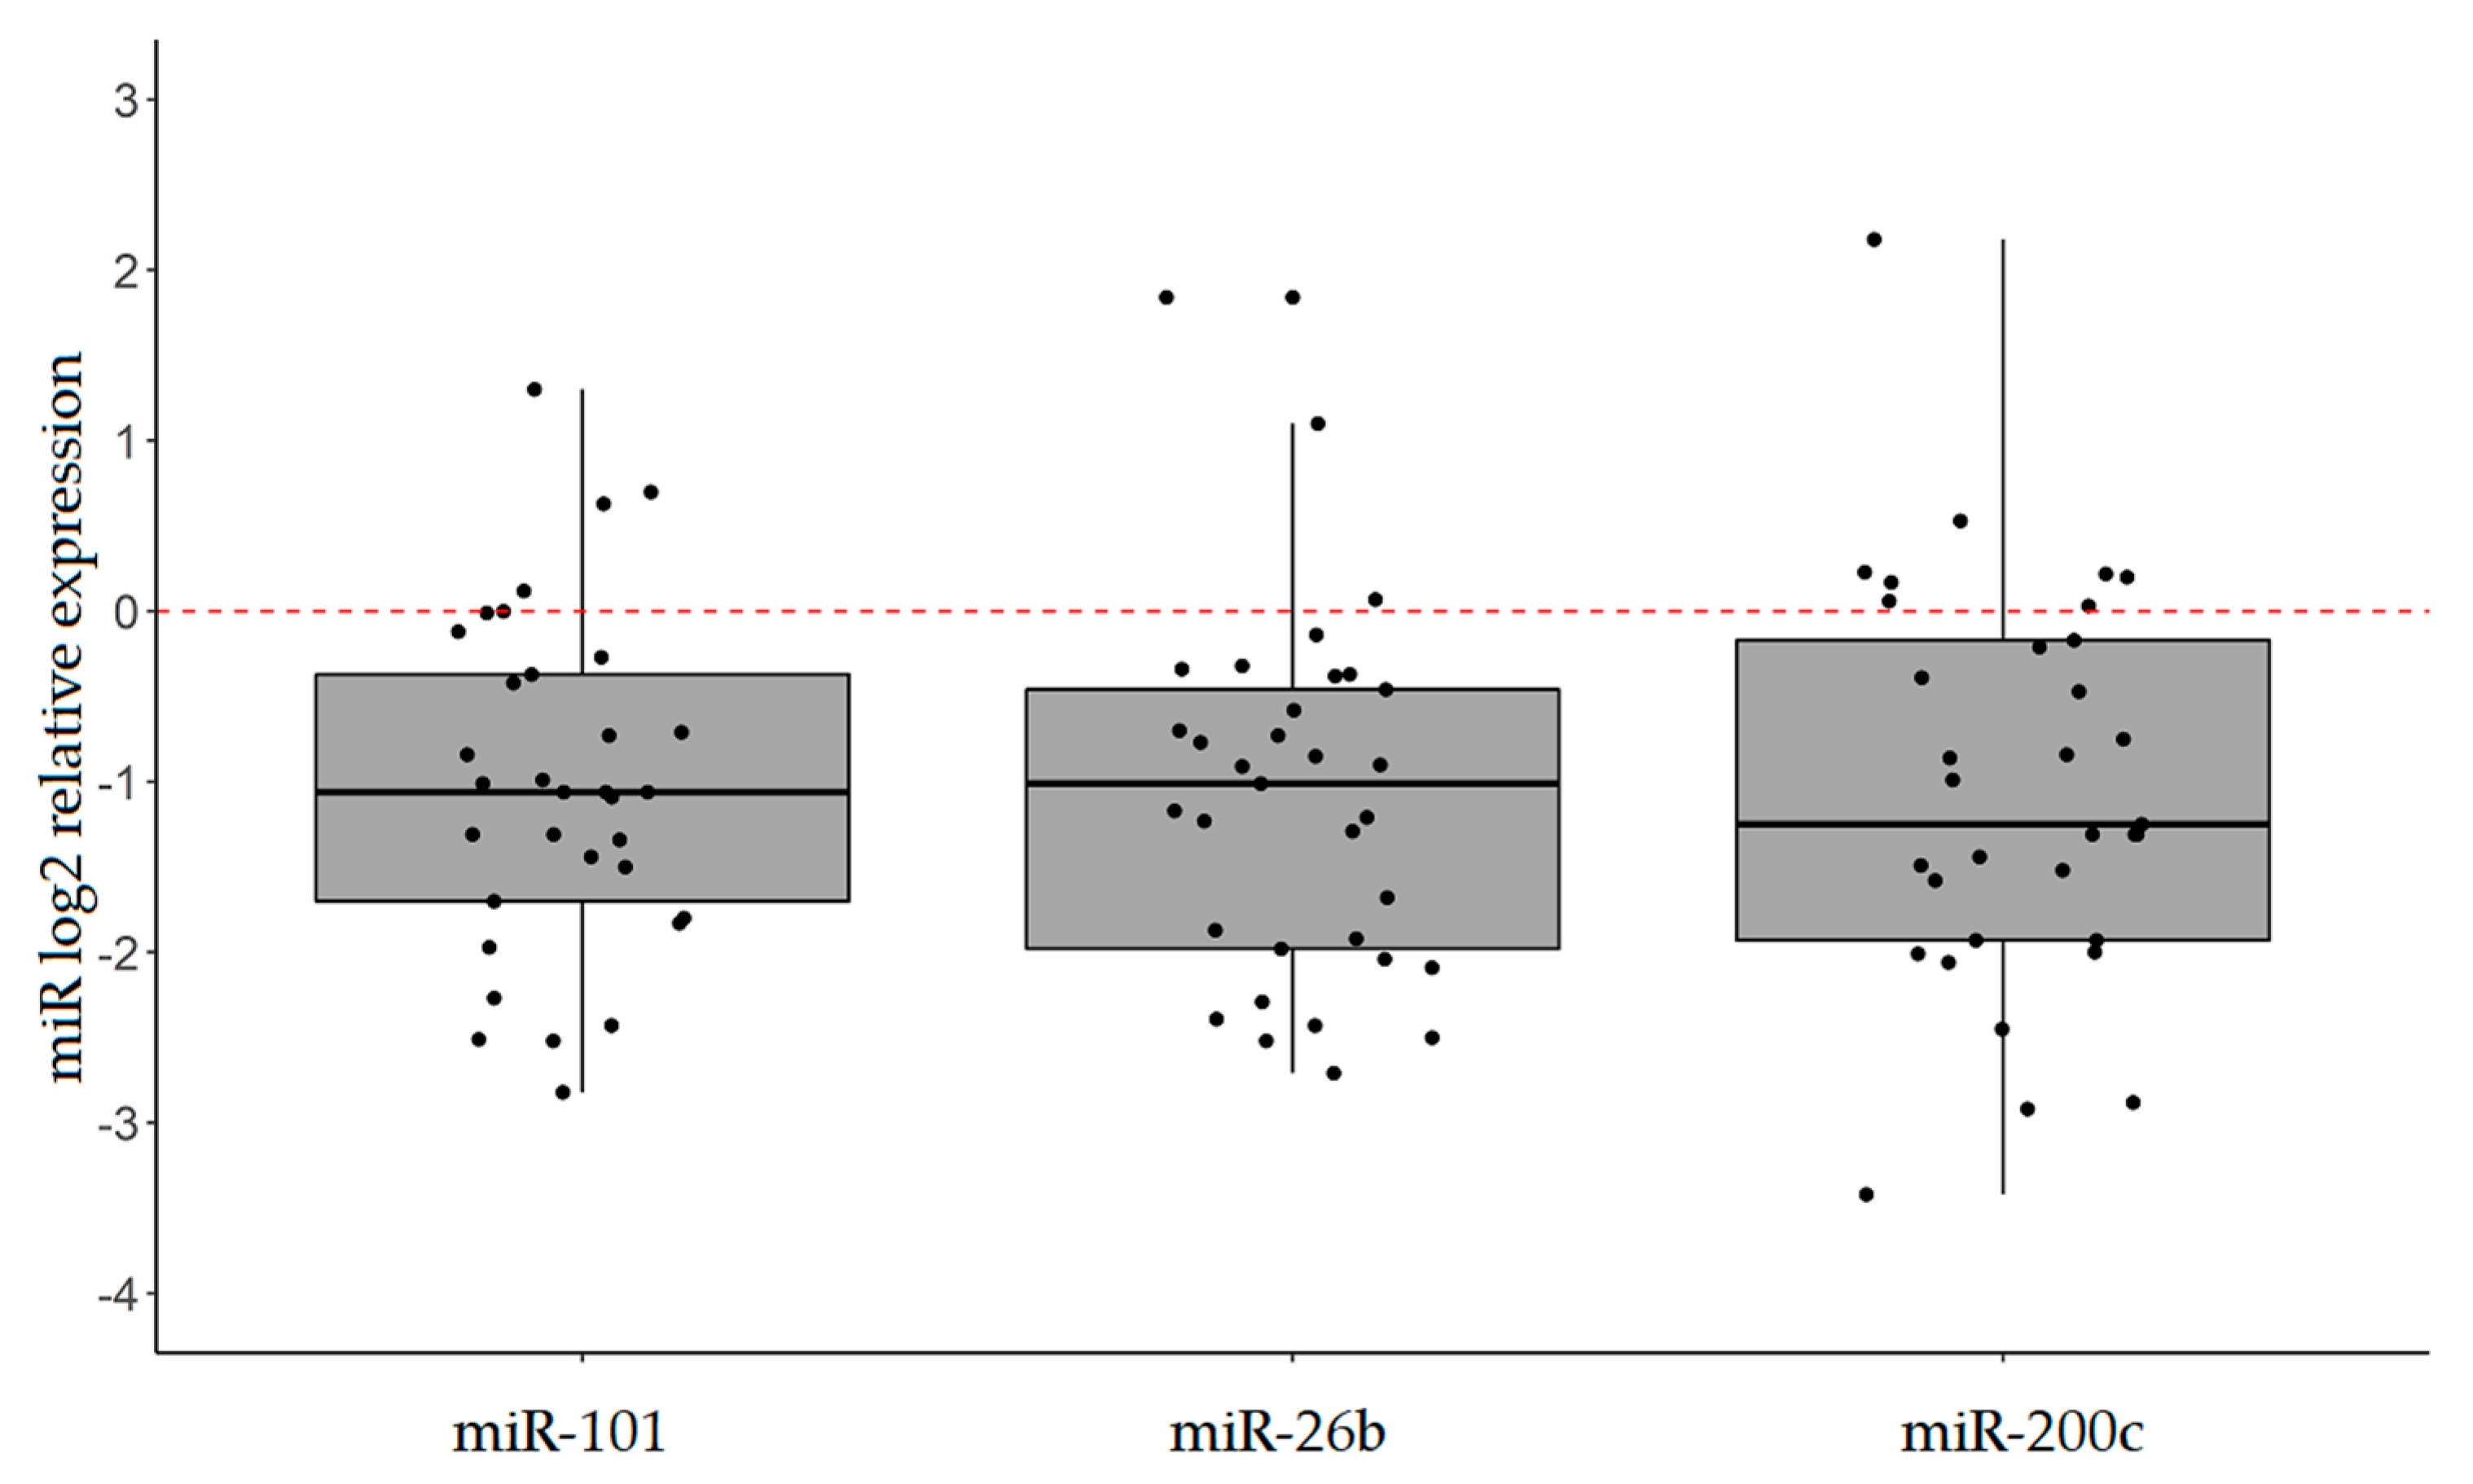
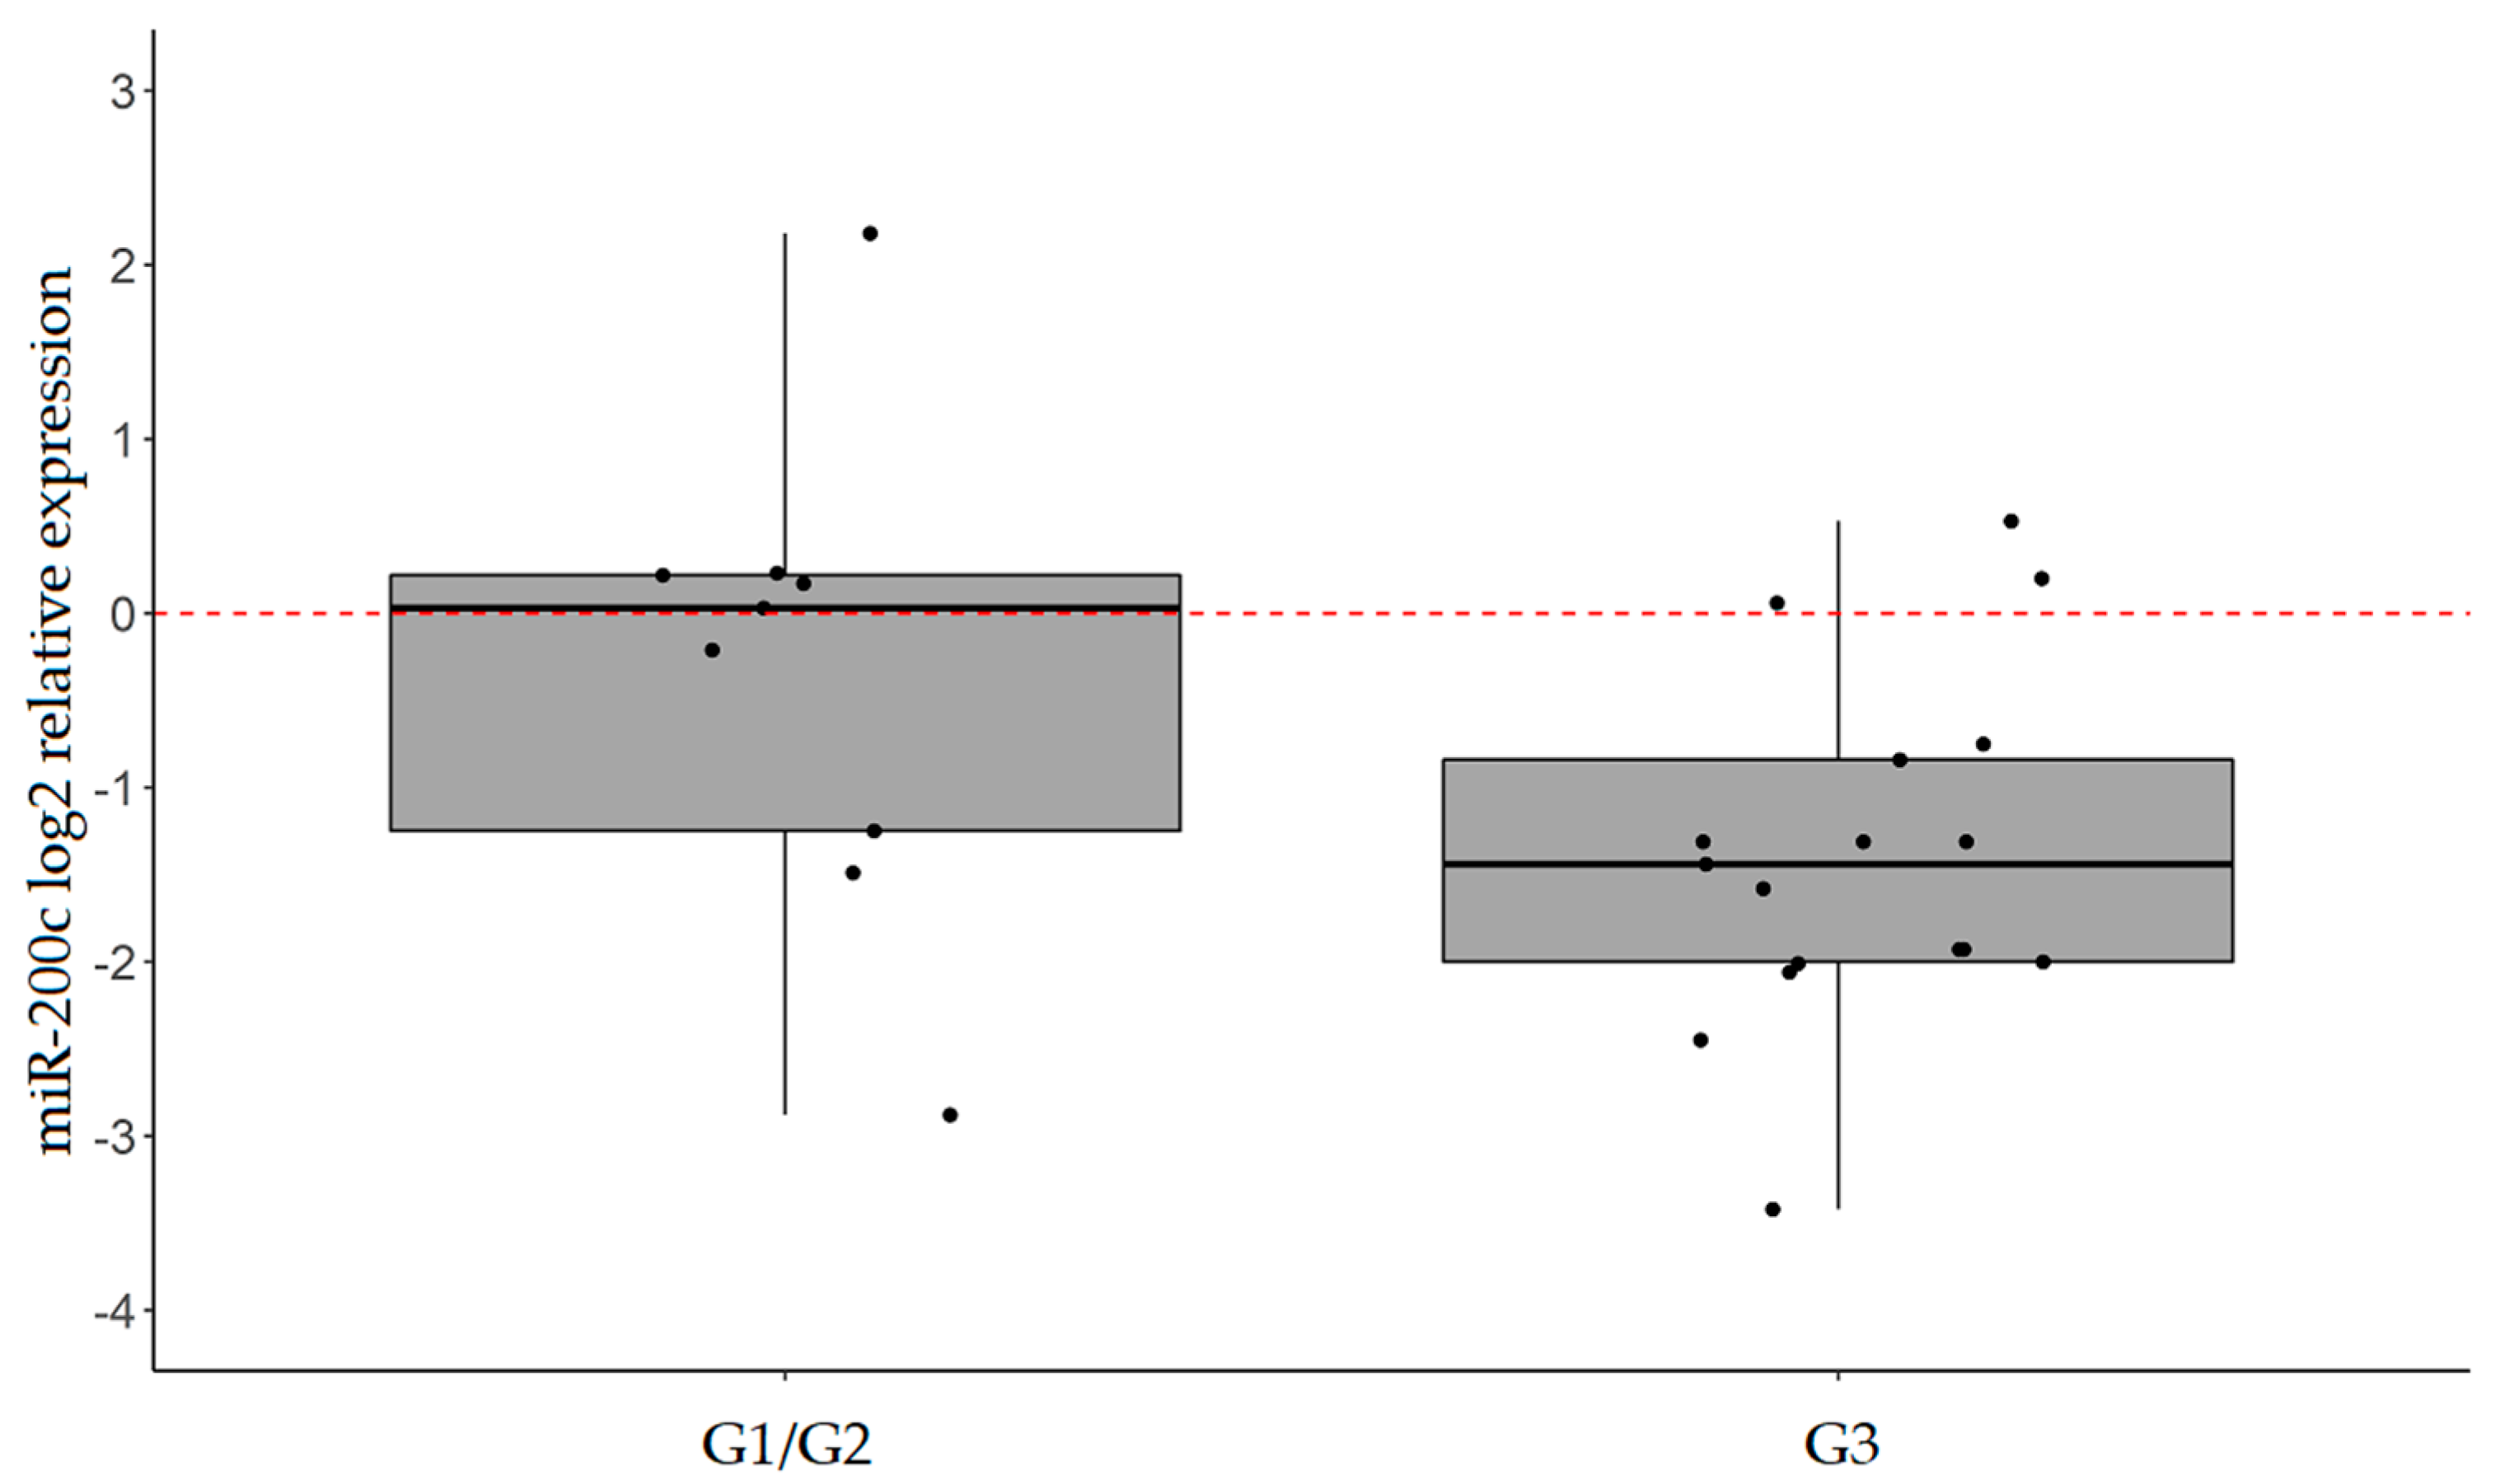
2.3. miR-101, miR-26b, and miR-200c are Confirmed to be Significantly Downregulated in IGC

The levels of the 3 miRs differentially expressed in the exploratory case series were analyzed in the case series of 33 IGC patients by RT-qPCR using specific TaqMan gene expression assays.
As shown in Figure 2, miR-101, miR-26b, and miR-200c proved to be significantly less expressed in tumor tissues with respect to normal counterparts (mean FC = 0.50; p-value < 0.001).
In particular, miR-101, miR-26b, and miR-200c were found to be downregulated in 57.6%, 51.5%, and 51.5% of IGCs, respectively (FC ≤ 0.50). Of note, miR-200c levels were significantly associated with tumor grade, being lower in G3 tumors compared to G1/G2 disease (p-value = 0.049; Figure 3). No significant association was observed between miR-101 or miR-26b expression and clinical pathological characteristics of patients.

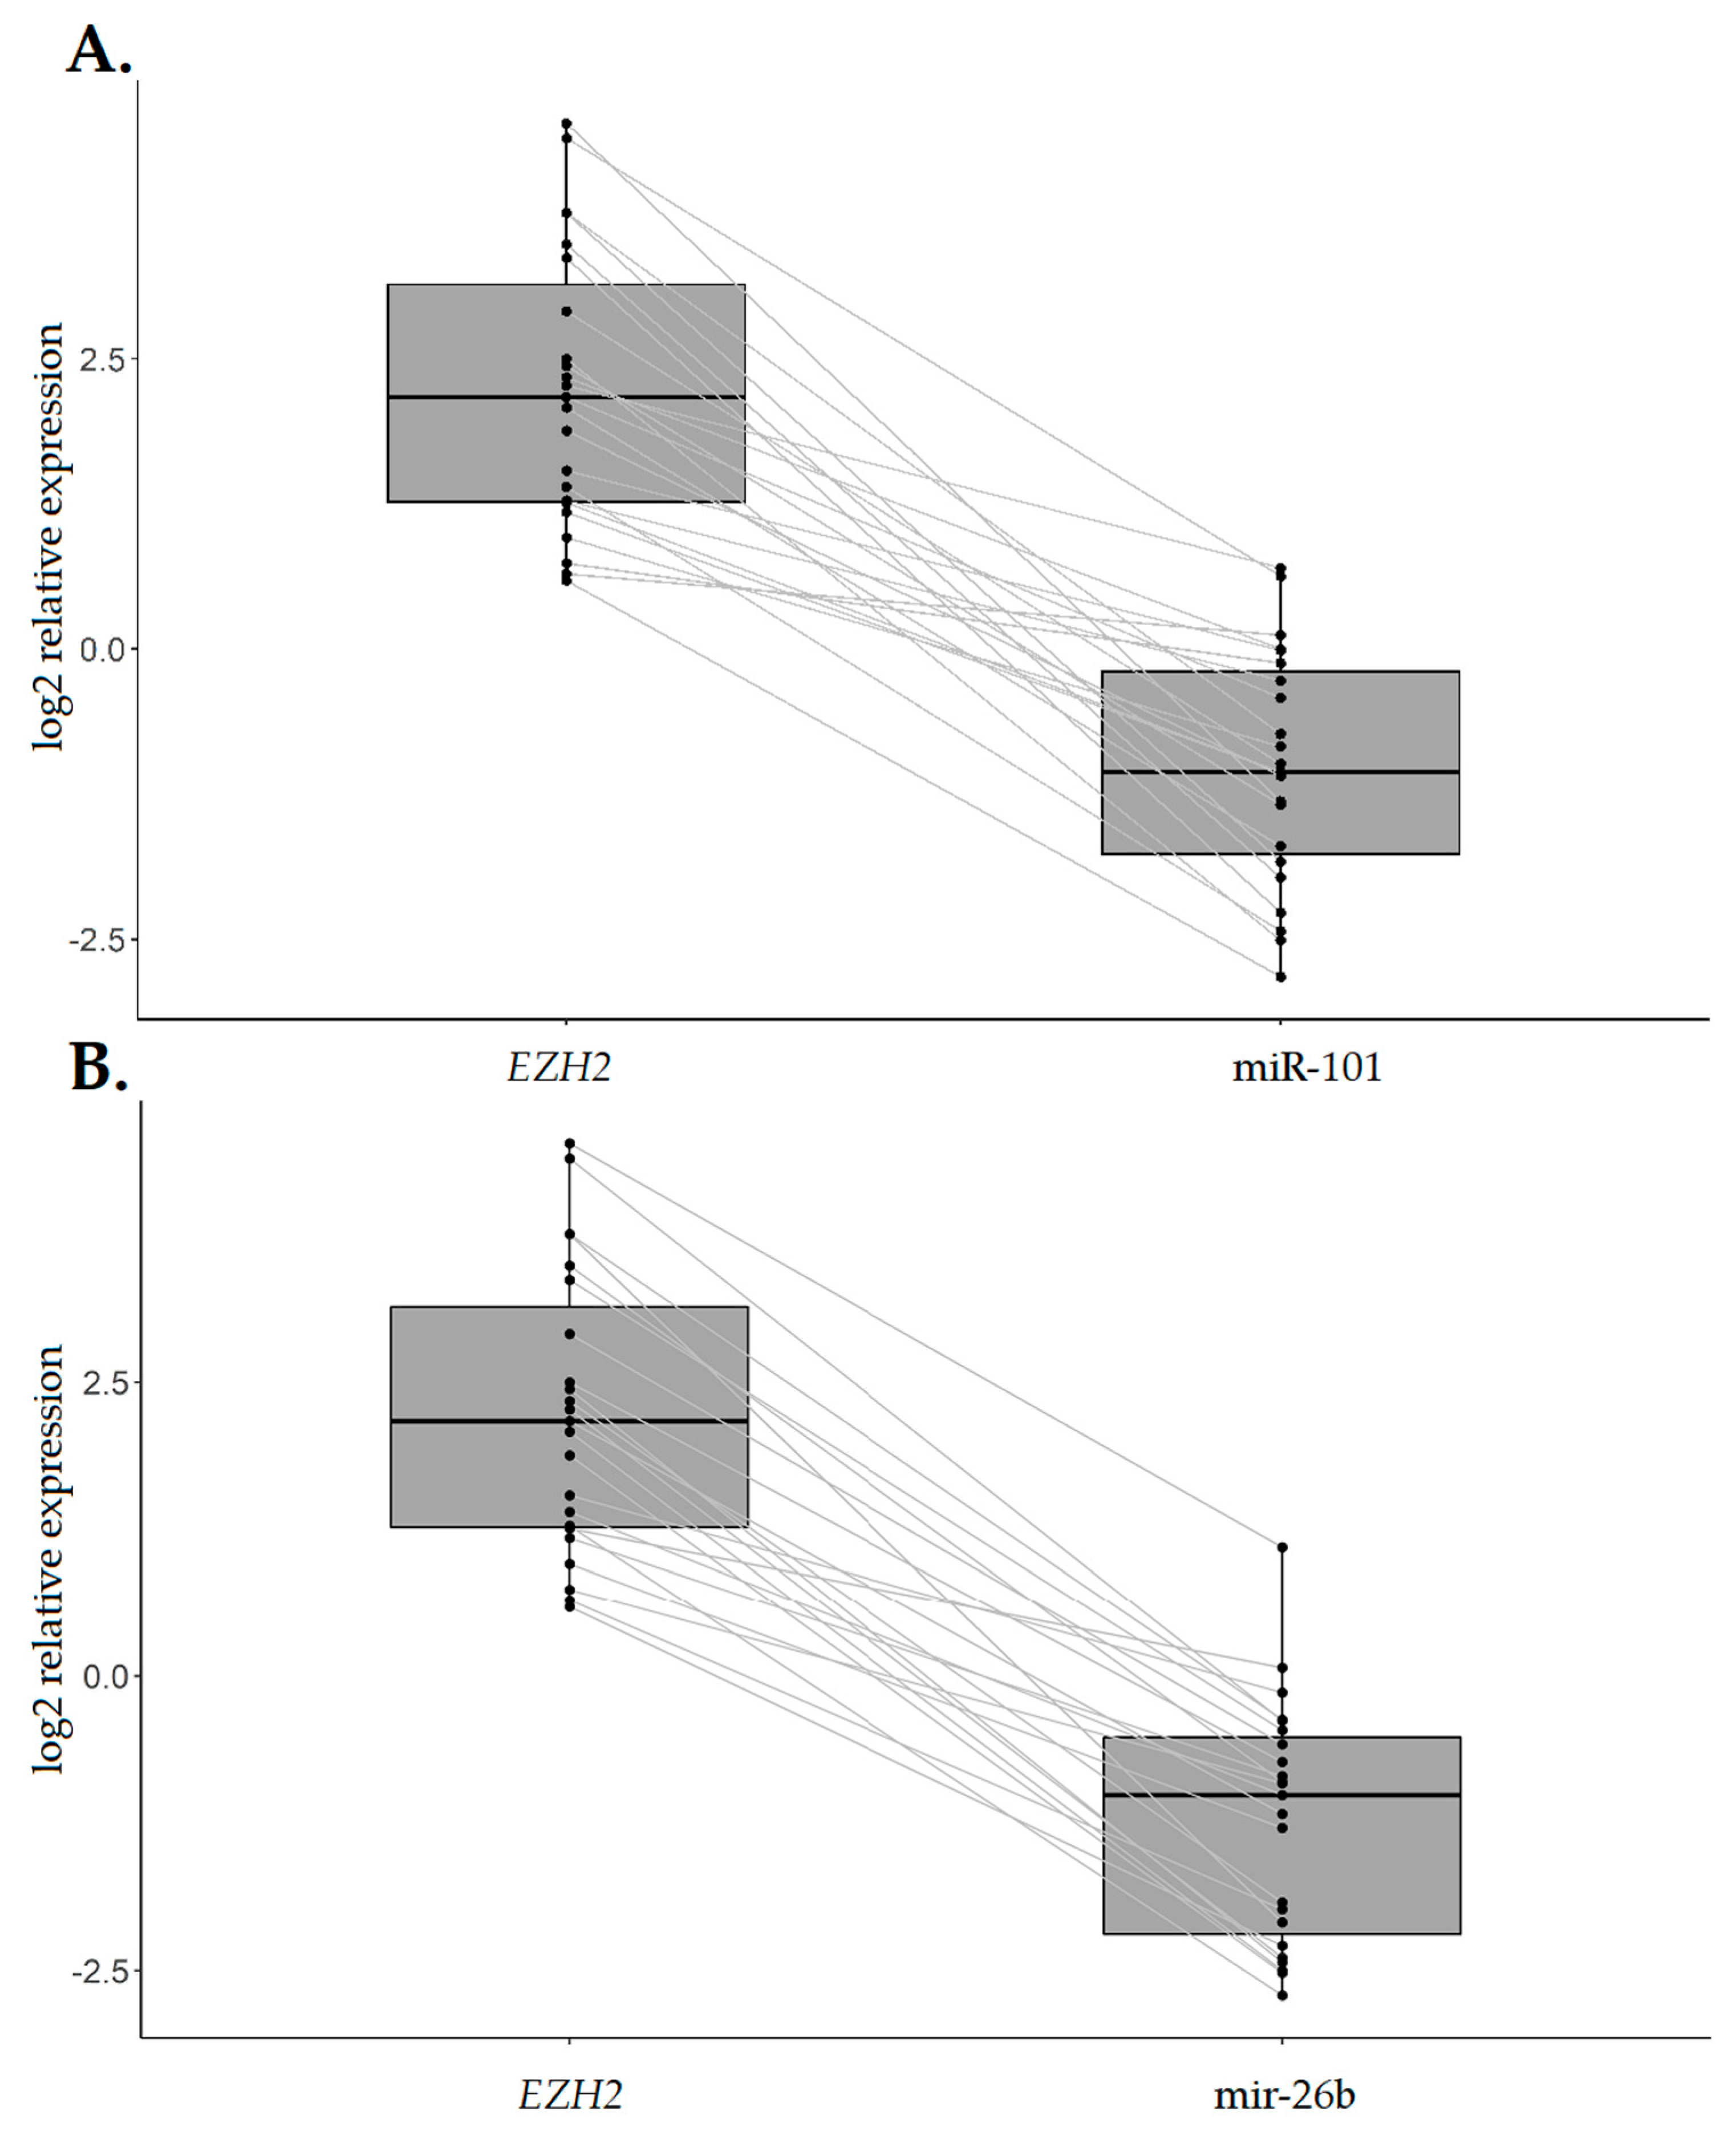
2.4. EZH2 Expression Levels are Increased in IGC Specimens Compared with the Normal Counterpart and Inversely Associated with CDH1 Expression

Given that EZH2 is a target of both miR-101 and miR-26b and an important CDH1 inhibitor, we evaluated EZH2 transcript levels to verify if its upregulation could contribute to CDH1 downregulation in our case series. Despite being expressed at very low levels in both tumor and normal samples, EZH2 was significantly more expressed in IGC tissues compared to normal tissues (log2 mean relative expression −7.84 ± 1.99 vs. −8.94 ± 2.41; p-value = 0.005; Figure 4).
In tumors with EZH2 overexpression (n = 23), a significant association with CDH1 decrease was observed (p-value < 0.001) (Figure 5), whereas the same was not observed for the remaining tumors with EZH2 downregulation or normal expression (p-value = 0.160). Similarly, a statistically significant inverse association was found between EZH2 upregulation and miR-101/miR-26b expression (Figure 6A,B).

3. Discussion

E-cadherin is a transmembrane glycoprotein that plays a pivotal role in maintaining epithelial architecture and cell polarity [5]. In the last few decades, E-cadherin tumor suppressor function has emerged in different epithelial tumors, including GC, and its downregulation has been observed during neoplastic progression and in association with tumor invasion [25,26,27,28] and metastasis [8,29]. In 1998, Karayiannakis et al. described aberrant or absent E-cadherin protein expression in both IGC and DGC [30]. It has been reported that CDH1 alterations, both structural and epigenetic, occur in almost one-third of sporadic GCs, with slightly higher frequencies in DGC than in IGC [12]. More recently, data mining of different repositories indicates that CDH1 is the second gene related to IGC [31], raising the question of the mechanisms that contribute to its expression in this histotype. In recent years, miRs have emerged as promoters and suppressors of carcinogenesis and metastasis in many types of cancers [32]. With regard to GC, a wide range of miRs have been associated with Helicobacter pylori (HP)-related infection, a well-established event in IGC carcinogenesis [33]. Interestingly, E-cadherin downregulation has been described in concomitance with HP infection-derived neutrophil infiltration [34]. Moreover, it has been shown that several miRs are involved in epithelial-mesenchymal transition (EMT), modulating E-cadherin expression by directly targeting CDH1 or acting on one or more of its transcription factors, including EZH2, ZEB1, ZEB2, and Slug [21]. Interestingly, these pathways emerged to have a role also in chemotherapeutic resistance in GC, CDH1 direct or indirect restoration may be a useful way to reduce it in such tumors [35].
In this study, we aimed to characterize the CDH1 expression levels and its transcriptional regulation by investigating the impact of miRs on IGC carcinogenesis. We found that CDH1 is transcriptionally downregulated in 42.4% of IGCs, further confirming the importance of CDH1 downregulation in this gastric cancer histotype [36].
Among the miRs filtered by in silico analysis as direct/indirect regulators of CDH1 expression, miR-34c, miR-506, miR-217, miR-199a, miR-153, and miR-544 were undetectable in both normal and tumor samples from a cohort of 17 IGCs. Conversely, among evaluable miRs, miR-101, miR-26b, and miR-200c proved to be significantly downregulated in IGC compared to control tissue both in this exploratory cohort and in our 33-patient case series.
miR-101 has been reported to act as a tumor suppressor by targeting CDH1 inhibitors, such as ZEB1/ZEB2 and EZH2 in different tumors [37,38], including GC [39,40]. Low levels of miR-101 in plasma have been reported to be associated with GC progression [41] and HP-induced inflammation [42,43]. Our data, in accordance with previous results from our group [36], showed that miR-101 is significantly downregulated in IGC patients. However, likely due to the limited number of patients, no association between miR-101 expression and clinical pathological parameters, including HP infection, emerged from this study.
miR-26b is expressed at low levels in GC, and its downregulation is associated with a higher TNM classification and shorter survival [44]. Several studies have shown that miR-26b, like miR-101, inhibits EZH2 expression leading to CDH1 downregulation in many tissues, including GC [45]. In agreement with these findings, we observed a significant downregulation of miR-26b in tumor specimens compared to the normal counterparts.
miR-200 family members are known as transcriptional repressors of E-cadherin through the regulation of ZEB1 and ZEB2. In gastric cell lines, miR-200 family members are markedly downregulated during EMT with a concomitant decrease in E-cadherin, and their lower expression has been associated with poor prognosis in patients [46,47,48]. There is evidence that miR-200 family members act as tumor suppressors in GC [49,50]. Among these, miR-200c showed a significantly lower expression in neoplastic tissue than normal gastric mucosa in our study. Moreover, in line with previous findings [51], its expression was significantly associated with tumor grade, being lower in poorly differentiated GC (G3) than in more differentiated tumors (G1 and G2). These observations reveal that miR-200c is potentially involved in IGC cell differentiation status.
Overall, although miR-101, miR-26b, and miR-200c were downregulated in more than half of our patients, only half of them showed concomitant CDH1 downregulation, indicating a more complex role in regulatory networks for these miRs.
We also found higher EZH2 expression levels in IGC specimens and we detected a statistically significant CDH1 downregulation in IGC patients showing EZH2 upregulation. In accordance with previous studies suggesting that miRs targeting EZH2 may be associated with the perturbation of E-cadherin expression [39], we observed a statistically significant inverse association between EZH2 and miR-101/26b expression levels.
In conclusion, our results reinforced the emerging link between E-cadherin and intestinal-type GC and confirmed the role of EZH2 as a regulator of CDH1 expression. Furthermore, our findings highlighted the potential of some specific miRs to be exploited as molecular markers of tumorigenesis and aggressiveness in this specific cancer histotype.
However, the small number of patients involved was not sufficient for us to identify any significant correlation between the analyzed markers, making it necessary to perform these studies on larger cohorts in order to further refine the biomarkers selection and to identify new therapeutic targets in IGC.

4. Materials and Methods

4.1. Samples

Thirty-three patients with GC submitted to surgical resection between 2007 and 2017 and classified as IGC by an expert pathologist, according to Lauren’s classification, were included in this study. Patients treated with neoadjuvant therapy were not considered. Surgical samples were immediately cryopreserved after resection. Fresh-frozen tumor tissue and matched normal gastric epithelium samples were stored by the Biological Resources Center (CRB) of Meldola (Italy) until the molecular analyses were performed. All subjects gave written informed consent to the conservation and use of the samples for research purposes. The study was conducted in accordance with the Declaration of Helsinki and the protocol was approved by the Romagna Ethics Committee (CEROM) of Meldola (IRSTB062, approved on 21 February 2018).

4.2. RNA Extraction

Total RNA extraction was performed on tumor and normal samples using TRIzol (Invitrogen, Carlsbad, CA, USA) in accordance with manufacturer’s instructions. Four micrograms of extracted RNA were treated with DNase and purified by using RNeasy MinElute Cleanup kit (Qiagen, Hilden, Germany). All the steps indicated in the protocol were followed, however, to allow recovery of miRs, 950 µL of ethanol 96−100% were used before column filtration. RNA was quantified by Spectrophotometer Nanodrop-ND-1000 (Thermo Fisher Scientific, Waltham, MA, USA).

4.3. Gene Expression Analyses

One microgram of purified RNA was reverse transcribed using an iScript cDNA synthesis kit (Bio-Rad Laboratories, Hercules, CA, USA) according to the manufacturer’s instructions. The reactions were run with the following thermal conditions: 25 °C for 5 min, 42 °C for 30 min, and 85 °C for 5 min. RT-qPCR reactions were carried out to assess the expression levels of CDH1 (Life Technologies, Carlsbad, CA, USA) and EZH2 (Integrated DNA Technologies, Coralville, IA, USA). β2 microglobulin (B2M, Life Technologies) was used as the endogenous control for normalization. The reactions were run in duplicate on 40 ng of cDNA on ABI 7500 RT-qPCR system (Applied Biosystems, Foster City, CA, USA) under the following thermal conditions: 95 °C for 10 min; 40 cycles of 95 °C for 15 s and 60 °C for 60 s. Expression levels of the target genes were obtained by normalizing the results using the endogenous control B2M. Relative expression was quantified using the comparative 2−ΔCt method and FC values in gene expression were calculated using the 2−ΔΔCt method [52,53]. An FC ≤0.50 and ≥1.5 were used as cut off for downregulation and upregulation, respectively.

4.4. miR Analyses

Six hundred nanograms of purified RNA from tumor tissue and the normal counterpart were converted into cDNA by TaqMan microRNA RT kit (Applied Biosystems) following the manufacturer’s protocol. The reverse transcription reaction was performed using a custom-made primer pool of miRs of interest and the following thermal protocol: 16 °C for 30 min, 42 °C for 30 min, and 85 °C for 5 min. miRs expression was assessed using custom TaqMan microRNA 96-well plates (Life Technologies) with lyophilized assays of selected miRs. A single 96-well plate was sufficient for miR profiling of one cancer sample and the normal counterpart in triplicate and RNU6 was used as the endogenous reference. RT-qPCR reactions were run on a ABI 7500 real-time PCR System (Applied Biosystems) applying the following thermal protocol: 95 °C for 10 min, 40 cycles of 95 °C for 15 s, and 60 °C for 60 s. Relative expression and FC were calculated as for mRNA.
RT-qPCR was used to confirm the differentially expressed miRs by single assays and the same experimental conditions as reported previously.

4.5. Statistical Analyses

Data were summarized using mean ± standard deviation for continuous variables and absolute frequency and percentage for categorical variables. A paired student t-test was used to compare expression levels between tumor and normal samples, while the Mann−Whitney tests were used to compare expression levels between patient groups defined by clinical characteristics (p-values < 0.05 were considered statistically significant).

Supplementary Materials

Author Contributions

Conceptualization, T.R., R.A.K., C.M.; formal analysis, E.P. and R.A.K.; investigation, T.R., G.T., and R.A.K.; resources, P.M., L.S., and M.M.; supervision, G.N.R., D.C., and C.M.; writing—original draft, T.R., G.T., and C.M.; writing—review and editing, G.T., G.N.R., D.C., P.U., and C.M.

Funding

This research received no external funding.

Acknowledgments

The authors would like to thank Gráinne Tierney for editorial assistance.

Conflicts of Interest

The authors declare no conflict of interest.

References

  1. Bray, F.; Ferlay, J.; Soerjomataram, I.; Siegel, R.L.; Torre, L.A.; Jemal, A. Global cancer statistics 2018: GLOBOCAN estimates of incidence and mortality worldwide for 36 cancers in 185 countries. CA Cancer J. Clin. 2018, 68, 394–424. [Google Scholar] [CrossRef] [PubMed] [Green Version]
  2. Lauren, P. The two histological main types of gastric carcinoma: Diffuse and so-called intestinal-type carcinoma: An attempt at a histo-clinical classification. Acta Pathol. Microbiol. Scand. 1965, 64, 31–49. [Google Scholar] [CrossRef] [PubMed]
  3. Vauhkonen, M.; Vauhkonen, H.; Sipponen, P. Pathology and molecular biology of gastric cancer. Best Pract. Res. Clin. Gastroenterol. 2006, 20, 651–674. [Google Scholar] [CrossRef] [PubMed]
  4. Takeichi, M. Morphogenetic roles of classic cadherins. Curr. Opin. Cell Biol. 1995, 7, 619–627. [Google Scholar] [CrossRef]
  5. Gumbiner, B.M. Cell adhesion: The molecular basis of tissue architecture and morphogenesis. Cell 1996, 84, 345–357. [Google Scholar] [CrossRef]
  6. Takeichi, M. Cadherins in cancer: Implications for invasion and metastasis. Curr. Opin. Cell Biol. 1993, 5, 806–811. [Google Scholar] [CrossRef]
  7. Cano, A.; Pérez-Moreno, M.A.; Rodrigo, I.; Locascio, A.; Blanco, M.J.; del Barrio, M.G.; Portillo, F.; Nieto, M.A. The transcription factor snail controls epithelial-mesenchymal transitions by repressing E-cadherin expression. Nat. Cell Biol. 2000, 2, 76–83. [Google Scholar] [CrossRef]
  8. Onder, T.T.; Gupta, P.B.; Mani, S.A.; Yang, J.; Lander, E.S.; Weinberg, R.A. Loss of E-Cadherin Promotes Metastasis via Multiple Downstream Transcriptional Pathways. Cancer Res. 2008, 68, 3645–3654. [Google Scholar] [CrossRef]
  9. Birchmeier, W. E-cadherin as a tumor (invasion) suppressor gene. Bioessays 1995, 17, 97–99. [Google Scholar] [CrossRef]
  10. Shimada, S.; Mimata, A.; Sekine, M.; Mogushi, K.; Akiyama, Y.; Fukamachi, H.; Jonkers, J.; Tanaka, H.; Eishi, Y.; Yuasa, Y. Synergistic tumour suppressor activity of E-cadherin and p53 in a conditional mouse model for metastatic diffuse-type gastric cancer. Gut 2012, 61, 344–353. [Google Scholar] [CrossRef]
  11. Carneiro, F.; Oliveira, C.; Suriano, G.; Seruca, R. Molecular pathology of familial gastric cancer, with an emphasis on hereditary diffuse gastric cancer. J. Clin. Pathol. 2008, 61, 25–30. [Google Scholar] [CrossRef] [PubMed]
  12. Corso, G.; Carvalho, J.; Marrelli, D.; Vindigni, C.; Carvalho, B.; Seruca, R.; Roviello, F.; Oliveira, C. Somatic Mutations and Deletions of the E-Cadherin Gene Predict Poor Survival of Patients With Gastric Cancer. J. Clin. Oncol. 2013, 31, 868–875. [Google Scholar] [CrossRef] [PubMed] [Green Version]
  13. He, L.; Hannon, G.J. MicroRNAs: Small RNAs with a big role in gene regulation. Nat. Rev. Genet. 2004, 5, 522–531. [Google Scholar] [CrossRef] [PubMed]
  14. Jansson, M.D.; Lund, A.H. MicroRNA and cancer. Mol. Oncol. 2012, 6, 590–610. [Google Scholar] [CrossRef] [PubMed]
  15. Juzėnas, S.; Saltenienė, V.; Kupcinskas, J.; Link, A.; Kiudelis, G.; Jonaitis, L.; Jarmalaite, S.; Kupcinskas, L.; Malfertheiner, P.; Skieceviciene, J. Analysis of Deregulated microRNAs and Their Target Genes in Gastric Cancer. PLoS ONE 2015, 10, e0132327. [Google Scholar] [CrossRef] [PubMed]
  16. Li, F.Q.; Xu, B.; Wu, Y.J.; Yang, Z.L.; Qian, J.J. Differential microRNA expression in signet-ring cell carcinoma compared with tubular adenocarcinoma of human gastric cancer. Genet. Mol. Res. 2015, 14, 739–747. [Google Scholar] [CrossRef] [PubMed]
  17. Jiang, C.; Chen, X.; Alattar, M.; Wei, J.; Liu, H. MicroRNAs in tumorigenesis, metastasis, diagnosis and prognosis of gastric cancer. Cancer Gene Ther. 2015, 22, 291–301. [Google Scholar] [CrossRef] [PubMed] [Green Version]
  18. Peng, Y.; Croce, C.M. The role of MicroRNAs in human cancer. Signal Transduct. Target. Ther. 2016, 1, 15004. [Google Scholar] [CrossRef] [PubMed] [Green Version]
  19. Hwang, J.; Min, B.H.; Jang, J.; Kang, S.Y.; Bae, H.; Jang, S.S.; Kim, J.I.; Kim, K.M. MicroRNA Expression Profiles in Gastric Carcinogenesis. Sci. Rep. 2018, 8, 14393. [Google Scholar] [CrossRef] [PubMed]
  20. Zhang, J.; Ma, L. MicroRNA control of epithelial-mesenchymal transition and metastasis. Cancer Metastasis Rev. 2012, 31, 653–662. [Google Scholar] [CrossRef]
  21. De Craene, B.; Berx, G. Regulatory networks defining EMT during cancer initiation and progression. Nat. Rev. Cancer 2013, 13, 97–110. [Google Scholar] [CrossRef] [PubMed]
  22. Bure, I.V.; Nemtsova, M.V.; Zaletaev, D.V. Roles of E-cadherin and Noncoding RNAs in the Epithelial–mesenchymal Transition and Progression in Gastric Cancer. Int. J. Mol. Sci. 2019, 20, 2870. [Google Scholar] [CrossRef] [PubMed]
  23. Díaz-López, A.; Moreno-Bueno, G.; Cano, A. Role of microRNA in epithelial to mesenchymal transition and metastasis and clinical perspectives. Cancer Manag. Res. 2014, 6, 205–216. [Google Scholar] [PubMed]
  24. Abba, M.; Patil, N.; Leupold, J.; Allgayer, H. MicroRNA Regulation of Epithelial to Mesenchymal Transition. J. Clin. Med. 2016, 5, 8. [Google Scholar] [CrossRef] [PubMed]
  25. Liu, X.; Chu, K.M. E-Cadherin and Gastric Cancer: Cause, Consequence, and Applications. Biomed Res. Int. 2014, 2014, 1–9. [Google Scholar] [CrossRef] [PubMed] [Green Version]
  26. Gan, W.J.; Wang, J.R.; Zhu, X.L.; He, X.S.; Guo, P.D.; Zhang, S.; Li, X.M.; Li, J.M.; Wu, H. RARγ-induced E-cadherin downregulation promotes hepatocellular carcinoma invasion and metastasis. J. Exp. Clin. Cancer Res. 2016, 35, 164. [Google Scholar] [CrossRef] [PubMed]
  27. Torabizadeh, Z.; Nosrati, A.; Sajadi Saravi, S.N.; Yazdani Charati, J.; Janbabai, G. Evaluation of E-cadherin Expression in Gastric Cancer and Its Correlation with Clinicopathologic Parameters. Int. J. Hematol. Oncol. Stem Cell Res. 2017, 11, 158–164. [Google Scholar] [PubMed]
  28. Ogasawara, N.; Kudo, T.; Sato, M.; Kawasaki, Y.; Yonezawa, S.; Takahashi, S.; Miyagi, Y.; Natori, Y.; Sugiyama, A. Reduction of Membrane Protein CRIM1 Decreases E-Cadherin and Increases Claudin-1 and MMPs, Enhancing the Migration and Invasion of Renal Carcinoma Cells. Biol. Pharm. Bull. 2018, 41, 604–611. [Google Scholar] [CrossRef] [Green Version]
  29. Kim, S.A.; Inamura, K.; Yamauchi, M.; Nishihara, R.; Mima, K.; Sukawa, Y.; Li, T.; Yasunari, M.; Morikawa, T.; Fitzgerald, K.C.; et al. Loss of CDH1 (E-cadherin) expression is associated with infiltrative tumour growth and lymph node metastasis. Br. J. Cancer 2016, 114, 199–206. [Google Scholar] [CrossRef]
  30. Karayiannakis, A.J.; Syrigos, K.N.; Chatzigianni, E.; Papanikolaou, S.; Karatzas, G. E-cadherin expression as a differentiation marker in gastric cancer. Hepatogastroenterology 1998, 45, 2437–2442. [Google Scholar]
  31. Zhang, J.; Liu, X.; Yu, G.; Liu, L.; Wang, J.; Chen, X.; Bian, Y.; Ji, Y.; Zhou, X.; Chen, Y.; et al. UBE2C is a potential biomarker of intestinal-type gastric cancer with chromosomal instability. Front. Pharmacol. 2018, 9, 1–12. [Google Scholar] [CrossRef] [PubMed]
  32. Iorio, M.V.; Croce, C.M. MicroRNA dysregulation in cancer: Diagnostics, monitoring and therapeutics. A comprehensive review. EMBO Mol. Med. 2012, 4, 143–159. [Google Scholar] [CrossRef] [PubMed]
  33. Noto, J.M.; Peek, R.M. The Role of microRNAs in Helicobacter pylori Pathogenesis and Gastric Carcinogenesis. Front. Cell. Infect. Microbiol. 2012, 1, 21. [Google Scholar] [CrossRef] [PubMed] [Green Version]
  34. Fu, H.; Ma, Y.; Yang, M.; Zhang, C.; Huang, H.; Xia, Y.; Lu, L.; Jin, W.; Cui, D. Persisting and increasing neutrophil infiltration associates with gastric carcinogenesis and e-cadherin downregulation. Sci. Rep. 2016, 6, 1–14. [Google Scholar] [CrossRef] [PubMed]
  35. Song, Y.; Ye, M.; Zhou, J.; Wang, Z.; Zhu, X. Targeting E-cadherin expression with small molecules for digestive cancer treatment. Am. J. Transl. Res. 2019, 11, 3932–3944. [Google Scholar] [PubMed]
  36. Abou Khouzam, R.; Molinari, C.; Salvi, S.; Marabelli, M.; Molinaro, V.; Orioli, D.; Saragoni, L.; Morgagni, P.; Calistri, D.; Ranzani, G.N. Digital PCR identifies changes in CDH1 (E-cadherin) transcription pattern in intestinal-type gastric cancer. Oncotarget 2017, 8, 18811–18820. [Google Scholar] [CrossRef]
  37. Varambally, S.; Cao, Q.; Mani, R.S.; Shankar, S.; Wang, X.; Ateeq, B.; Laxman, B.; Cao, X.; Jing, X.; Ramnarayanan, K.; et al. Genomic Loss of microRNA-101 Leads to Overexpression of Histone Methyltransferase EZH2 in Cancer. Science 2008, 322, 1695–1699. [Google Scholar] [CrossRef] [PubMed] [Green Version]
  38. Guo, F.; Cogdell, D.; Hu, L.; Yang, D.; Sood, A.K.; Xue, F.; Zhang, W. miR-101 suppresses the epithelial-to-mesenchymal transition by targeting ZEB1 and ZEB2 in ovarian carcinoma. Oncol. Rep. 2014, 31, 2021–2028. [Google Scholar] [CrossRef]
  39. Carvalho, J.; Van Grieken, N.C.; Pereira, P.M.; Sousa, S.; Tijssen, M.; Buffart, T.E.; Diosdado, B.; Grabsch, H.; Santos, M.A.S.; Meijer, G.; et al. Lack of microRNA-101 causes E-cadherin functional deregulation through EZH2 up-regulation in intestinal gastric cancer. J. Pathol. 2012, 228, 31–44. [Google Scholar] [CrossRef]
  40. Dong, X.; Liu, Y. Expression and significance of miR-24 and miR-101 in patients with advanced gastric cancer. Oncol. Lett. 2018, 16, 5769–5774. [Google Scholar] [CrossRef]
  41. Imamura, T.; Komatsu, S.; Ichikawa, D.; Miyamae, M.; Okajima, W.; Ohashi, T.; Kiuchi, J.; Nishibeppu, K.; Kosuga, T.; Konishi, H.; et al. Low plasma levels of miR-101 are associated with tumor progression in gastric cancer. Oncotarget 2017, 8, 106538. [Google Scholar] [CrossRef] [PubMed]
  42. Matsushima, K.; Isomoto, H.; Inoue, N.; Nakayama, T.; Hayashi, T.; Nakayama, M.; Nakao, K.; Hirayama, T.; Kohno, S. MicroRNA signatures in Helicobacter pylori-infected gastric mucosa. Int. J. Cancer 2011, 128, 361–370. [Google Scholar] [CrossRef] [PubMed]
  43. Zhou, X.; Xia, Y.; Li, L.; Zhang, G. MiR-101 inhibits cell growth and tumorigenesis of Helicobacter pylori related gastric cancer by repression of SOCS2. Cancer Biol. Ther. 2015, 16, 160–169. [Google Scholar] [CrossRef] [PubMed]
  44. Tsai, M.M.; Huang, H.W.; Wang, C.S.; Lee, K.F.; Tsai, C.Y.; Lu, P.H.; Chi, H.C.; Lin, Y.H.; Kuo, L.M.; Lin, K.H. MicroRNA-26b inhibits tumor metastasis by targeting the KPNA2/c-jun pathway in human gastric cancer. Oncotarget 2016, 7, 39511–39526. [Google Scholar] [CrossRef] [PubMed]
  45. Deng, M.; Zhang, R.; He, Z.; Qiu, Q.; Lu, X.; Yin, J.; Liu, H.; Jia, X.; He, Z. TET-Mediated Sequestration of miR-26 Drives EZH2 Expression and Gastric Carcinogenesis. Cancer Res. 2017, 77, 6069–6082. [Google Scholar] [CrossRef] [PubMed]
  46. Ahn, S.M.; Cha, J.Y.; Kim, J.; Kim, D.; Trang, H.T.H.; Kim, Y.M.; Cho, Y.H.; Park, D.; Hong, S. Smad3 regulates E-cadherin via miRNA-200 pathway. Oncogene 2012, 31, 3051–3059. [Google Scholar] [CrossRef] [PubMed]
  47. Tang, H.; Deng, M.; Tang, Y.; Xie, X.; Guo, J.; Kong, Y.; Ye, F.; Su, Q.; Xie, X. miR-200b and miR-200c as Prognostic Factors and Mediators of Gastric Cancer Cell Progression. Clin. Cancer Res. 2013, 19, 5602–5612. [Google Scholar] [CrossRef] [Green Version]
  48. Huang, Z.S.; Guo, X.W.; Zhang, G.; Liang, L.X.; Nong, B. The Diagnostic and Prognostic Value of miR-200c in Gastric Cancer: A Meta-Analysis. Dis. Markers 2019, 2019, 1–9. [Google Scholar] [CrossRef] [PubMed] [Green Version]
  49. Feng, X.; Wang, Z.; Fillmore, R.; Xi, Y. MiR-200, a new star miRNA in human cancer. Cancer Lett. 2014, 344, 166–173. [Google Scholar] [CrossRef]
  50. Chang, L.; Guo, F.; Huo, B.; Lv, Y.; Wang, Y.; Liu, W. Expression and clinical significance of the microRNA-200 family in gastric cancer. Oncol. Lett. 2015, 9, 2317–2324. [Google Scholar] [CrossRef] [Green Version]
  51. Cong, N.; Du, P.; Zhang, A.; Shen, F.; Su, J.; Pu, P.; Wang, T.; Zjang, J.; Kang, C.; Zhang, Q. Downregulated microRNA-200a promotes EMT and tumor growth through the Wnt/β-catenin pathway by targeting the E-cadherin repressors ZEB1/ZEB2 in gastric adenocarcinoma. Oncol. Rep. 2013, 29, 1579–1587. [Google Scholar] [CrossRef] [PubMed]
  52. Livak, K.J.; Schmittgen, T.D. Analysis of Relative Gene Expression Data Using Real-Time Quantitative PCR and the 2−ΔΔCT Method. Methods 2001, 25, 402–408. [Google Scholar] [CrossRef] [PubMed]
  53. Schmittgen, T.D.; Livak, K.J. Analyzing real-time PCR data by the comparative C(T) method. Nat. Protoc. 2008, 3, 1101–1108. [Google Scholar] [CrossRef] [PubMed]
Figure 1. CDH1 expression analysis by real-time (RT)-qPCR. Box plots of the log2 relative expression (2−ΔCt) of CDH1 in neoplastic and matched normal tissues of 33 IGC patients. B2M was used as the internal control. p-value = 0.025 (paired student’s t-test).
Ijms 20 04452 g001
Figure 2. miR expression analysis by RT-qPCR. Box plots of miR-101, miR-26b, and miR-200c expression (log2 FC) in 33 intestinal gastric cancer (IGC) patients. RNU6 was used as the internal control. p-value < 0.001 for all miRs (paired student t-test).
Ijms 20 04452 g002
Figure 3. miR-200c and tumor grade. Box plots of miR-200c expression (log2 FC) in tumors grouped according to grade. p-value = 0.049 (Mann−Whitney test).
Ijms 20 04452 g003
Figure 4. EZH2 expression analysis by RT-qPCR. Box plots of the log2 relative expression (2−ΔCt) of EZH2 in neoplastic and matched normal tissues of 33 IGC patients. B2M was used as the internal control. p-value = 0.005 (paired student’s t-test).
Ijms 20 04452 g004
Figure 5. EZH2 upregulation and its association with CDH1 expression. Box plots of CDH1 expression in relation to EZH2 expression in 23 IGC patients with EZH2 upregulation. Relative expression is measured as log2 FC. p-value < 0.001 (Mann−Whitney test).
Ijms 20 04452 g005
Figure 6. EZH2 overexpression and its association with miR-101 and miR-26b expression. Box plots of miR-101 (A) and miR-26b (B) expression in relation to EZH2 expression in 23 IGC patients with EZH2 upregulation. Relative expression is measured as log2 FC. p-value < 0.001 (Mann−Whitney test).
Ijms 20 04452 g006
Table 1. Clinical pathological characteristics of patients. Tumor staging was done based on the tumor (T), lymph node (N), and metastasis (M) system. N/A: not available.
ParameterTotal
n = 33%
Sex
  F1339.4
  M2060.6
Age, years
  <771545.5
  ≥771854.5
T
  126.1
  21236.4
  31133.3
  4618.2
  N/A26.1
N
  01339.4
  +1854.5
  N/A26.1
M
  01133.3
  126.1
  X721.2
  N/A1339.4
Grade
  113.0
  2824.2
  31751.5
  N/A721.2
Tumor site
  Cardia39.1
  Fundus13.0
  Body824.2
  Antrum1030.3
  N/A1133.3
Tumor size (cm)
  <51648.9
  ≥51751.1
Helicobacter pylori
  Positive1648.5
  Negative1442.4
  N/A39.1
Table 2. Selected miRs, target genes, and rationale of selection.
miRIn Silico PredictionExperimental Evidence
Target GenemiRTarBasemiRDBTargetScanmiR-Target Interaction (+) or miR
Expression Deregulation [ref.] in GC
miR-506SNAI2++++
miR-141ZEB1++++
ZEB2++++
miR-217EZH2++++
miR-429EZH2++++
miR-199aCDH1++++
miR-200aZEB1++++
ZEB2++++
miR-200bZEB1++++
ZEB2++++
miR-200cZEB1++++
ZEB2++++
SUZ12++++
miR-101EZH2++++
ZEB1++++
miR-153SNAI1++++
miR-26bEZH2+++[15,16]
miR-23aCDH1++++
miR-544CDH1++++
miR-34cSNAI1+++[17]

