Article

Unravelling the Metabolic and Hormonal Machinery During Key Steps of Somatic Embryogenesis: A Case Study in Coffee

by
Rayan Awada
1,2,3,*,
Claudine Campa
3,4,
Estelle Gibault
1,
Eveline Déchamp
2,3,
Frédéric Georget
2,3,
Maud Lepelley
1,
Cécile Abdallah
3,4,
Alexander Erban
5,
Federico Martinez-Seidel
5,
Joachim Kopka
5,
Laurent Legendre
6,
Sophie Léran
2,3,
Geneviève Conéjéro
7,
Jean-Luc Verdeil
7,
Dominique Crouzillat
1,
David Breton
1,
Benoît Bertrand
2,3 and
Hervé Etienne
2,3
1
Nestlé Research—Plant Science Unit, 101 avenue Gustave Eiffel, F-37097 Tours CEDEX 2, France
2
CIRAD (Centre de coopération internationale en recherche agronomique pour le développement), UMR IPME, F-34398 Montpellier, France
3
UMR IPME (Interactions Plantes Microorganismes Environnement), University of Montpellier, CIRAD, IRD, F-34398 Montpellier, France
4
IRD (Institut de recherche pour le développement), UMR IPME, F-34398 Montpellier, France
5
Max Planck Institute for Molecular Plant Physiology, Am Muehlenberg 1, D-14476 Golm, Germany
6
Université de Lyon (Université Lyon 1, CNRS, UMR5557, Ecologie Microbienne, INRA, UMR1418), F-69622 Lyon, France
7
Histocytology and Plant Cell Imaging platform PHIV, UMR AGAP (CIRAD, INRA, SupAgro)-UMR B&PMP (INRA, CNRS, SupAgro, University of Montpellier), F-34095 Montpellier, France
*
Author to whom correspondence should be addressed.
Int. J. Mol. Sci. 2019, 20(19), 4665; https://0-doi-org.brum.beds.ac.uk/10.3390/ijms20194665
Submission received: 20 August 2019 / Revised: 17 September 2019 / Accepted: 18 September 2019 / Published: 20 September 2019
(This article belongs to the Special Issue Plant Cell and Organism Development)

Abstract

:
Somatic embryogenesis (SE) is one of the most promising processes for large-scale dissemination of elite varieties. However, for many plant species, optimizing SE protocols still relies on a trial-and-error approach. Using coffee as a model plant, we report here the first global analysis of metabolome and hormone dynamics aiming to unravel mechanisms regulating cell fate and totipotency. Sampling from leaf explant dedifferentiation until embryo development covered 15 key stages. An in-depth statistical analysis performed on 104 metabolites revealed that massive re-configuration of metabolic pathways induced SE. During initial dedifferentiation, a sharp decrease in phenolic compounds and caffeine levels was also observed while auxins, cytokinins and ethylene levels were at their highest. Totipotency reached its highest expression during the callus stages when a shut-off in hormonal and metabolic pathways related to sugar and energetic substance hydrolysis was evidenced. Abscisic acid, leucine, maltotriose, myo-inositol, proline, tricarboxylic acid cycle metabolites and zeatin appeared as key metabolic markers of the embryogenic capacity. Combining metabolomics with multiphoton microscopy led to the identification of chlorogenic acids as markers of embryo redifferentiation. The present analysis shows that metabolite fingerprints are signatures of cell fate and represent a starting point for optimizing SE protocols in a rational way.

1. Introduction

Somatic embryogenesis (SE) is a developmental process where a plant somatic cell can dedifferentiate to a totipotent embryogenic stem cell that has the ability to redifferentiate and give rise to an embryo under appropriate conditions [1,2,3]. This new embryo can further develop into a whole plant. Since its first description in carrot by Reinert [4] and Steward et al. [5], this process has been reported in a wide range of plant species, both annual [6,7,8] and perennial [9,10,11,12,13]. SE has demonstrated significant benefits when applied to forest tree species, bringing important advantages including clonal mass propagation, cryostorage of valuable germplasm and genetic transformation [14,15]. SE is particularly important for plants that have a long life cycle (woody species) and are difficult to propagate by conventional methods [16].
The ability of a somatic cell to undergo embryogenesis in vitro is both an inherent and an acquired characteristic that requires the right combination of explant and culture environment [17]. The most efficient treatments used to induce embryogenesis are diverse and range from application of exogenous growth regulators to abiotic stress. Under the appropriate conditions, the explant produces histo-differentiated embryos, either directly from the explant or indirectly from callus [18]. The direct SE is often described as a low yield method and the indirect SE as a high yield method [10]. The morphological and cellular changes that occur during in vitro embryogenesis have been well-described [1,19,20]. Briefly, nine developmental stages have been characterized in the indirect SE of dicots: explant, primary callus, embryogenic callus, embryogenic cell clusters, pro-embryogenic masses, globular-shaped embryos, heart-shaped embryos, torpedo-shaped embryos and cotyledonary embryos, before development into a new plant [1,19,20]. Unlike the detailed knowledge about morphological and histological events, little is known about the underlying mechanisms involved in the acquisition and expression of totipotency occurring during SE.
Although SE has already been widely described in a number of woody species [10,11,12,13] propagating adult woody plants remains a difficult, laborious, intensive and tricky operation. Many authors reported that the lack of knowledge on the mechanisms underlying the reprogramming of somatic cells represents the greatest limitation to the improvement of the SE process [21,22]. Research on SE remains mainly empirical, characterized by a low-throughput trial-and-error approach. A set of drawbacks have been reported especially a strong genotypic effect, a difficulty in obtaining embryogenic callus, a variability in the quality of regenerated embryos, and more generally a lack of efficiency of certain steps [9,23,24] leading to hitherto prohibitive production costs and an overall slow technical progress.
In parallel, the latest omics technologies (genomics, transcriptomics, proteomics, epigenomics, metabolomics and phenomics) are gaining increasing attention. Many authors believe that combining omics technologies with the in vitro process can have a tremendous impact on the knowledge of the molecular mechanisms underlying SE [22,25,26]. Metabolomics data can provide a wealth of information in the description and elucidation of physiological responses to environmental conditions in plants [27]. However, to date, very few authors have carried out a metabolomics approach related to SE. Using gas chromatography–mass spectrometry (GC-MS), metabolomic profiling has been successfully applied to identify metabolic processes regulating SE in five sampled stages in Norway spruce (Picea abies) covering cell line proliferation till embryo maturation [28]. Similarly, Robinson et al. [29] applied a GC-MS approach in loblolly pine (Pinus taeda) as a way to predict a model for embryo regeneration capacity. More recently, Dobrowolska et al. [30] applied GC-MS to compare metabolic profiles of normal and aberrant SE germinants in Norway spruce. In the same species, using liquid chromatography-mass spectrometry (LC-MS), Vondrakova et al. [31] drew endogenous phytohormone profiles in nine sampled stages covering proliferation, maturation, desiccation and germination. Using the same technique, Gautier et al. [32] compared phytohormone profiles between embryogenic calli and non-embryogenic calli in Douglas-fir (Pseudotsuga menziesii). All these authors assumed that clear correlations may exist among the different metabolome or phytohormone profiles and some specific SE stages. Nonetheless, to date, no global analysis, covering leaf explant dedifferentiation till embryo development, of both metabolome and hormone content has been performed on a complete SE process.
Coffee is one of the world’s favorite beverages. It has a great economic impact in many producing countries, especially in South America [33]. Today, SE applied to coffee is one of the most advanced technologies in plant mass vegetative propagation [24]. Thirty years of research on SE by two leading groups—the CIRAD/ECOM alliance and Nestlé—has led to a successful large-scale dissemination of Coffea arabica F1 hybrids and C. canephora cv. Robusta clones for 13 years now. Even though good biological efficiencies characterize the processes established in the two cultivated species, with low genotypic effects [34,35] and controlled somaclonal variation [36,37], SE production cost remains high and still cannot compete with production costs of seedlings or traditional cuttings [38].
Indeed, as for other species, coffee SE research remains mainly empirical, also characterized by overall slow technical progress. For example, the development of culture conditions for the mass redifferentiation into somatic embryos have been very long (10 years) and laborious, carried out only by an empirical approach [24]. The lack of knowledge about the cellular and molecular events taking place during these developmental stages makes these stages real black boxes. While a scale-up is needed to meet increasing market demand—estimated at 50–100 million coffee vitroplants per—current overall production cannot meet this huge demand [24]. However, optimization is possible for different stages if a rational optimization is developed on metabolic knowledge.
In this paper, we describe how we took advantage of the latest omics technologies combined with a reliable, synchronized and efficient large-scale coffee SE process to draw full metabolic profiles and study hormone dynamics over 15 key sampled stages. A solid statistical method was used to identify the metabolic pathway changes associated with the main developmental phases and phase switches. Histological analysis and cell imaging were also required to characterize sampled stages and associate metabolic profiles with cell structure organization. Lastly, comparing Arabica embryogenic and non-embryogenic calli enabled the identification of metabolic markers of the embryogenic capacity.

2. Results

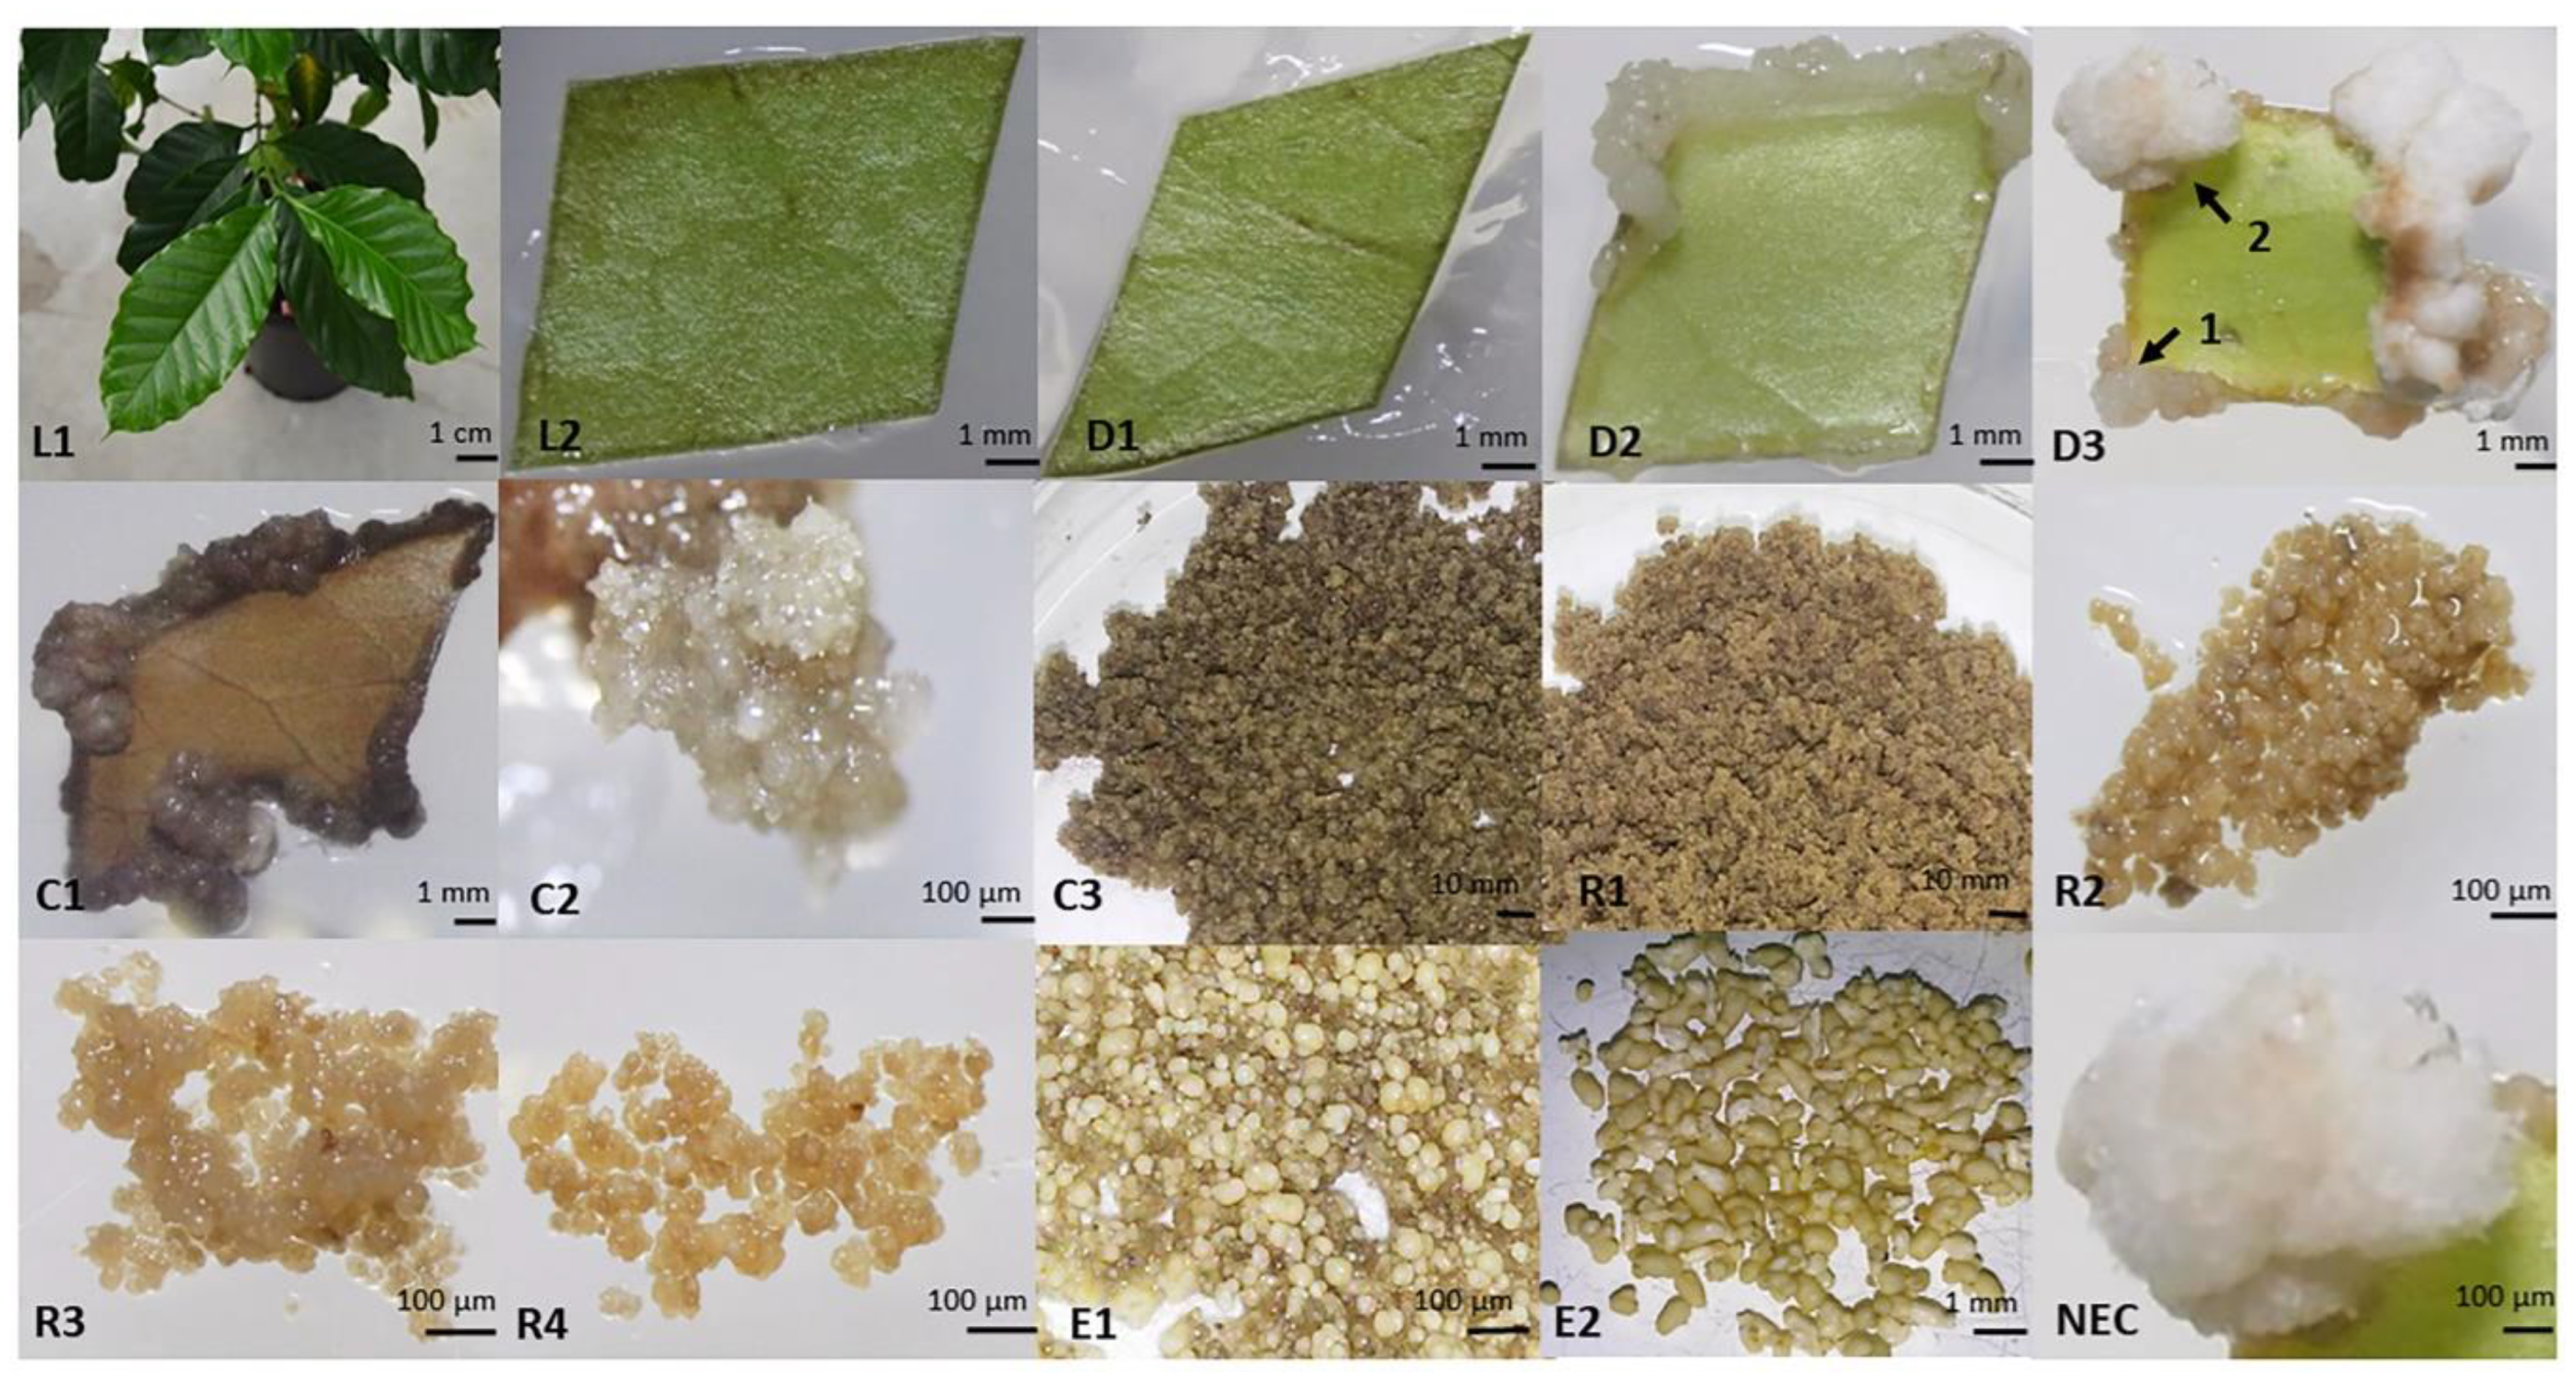
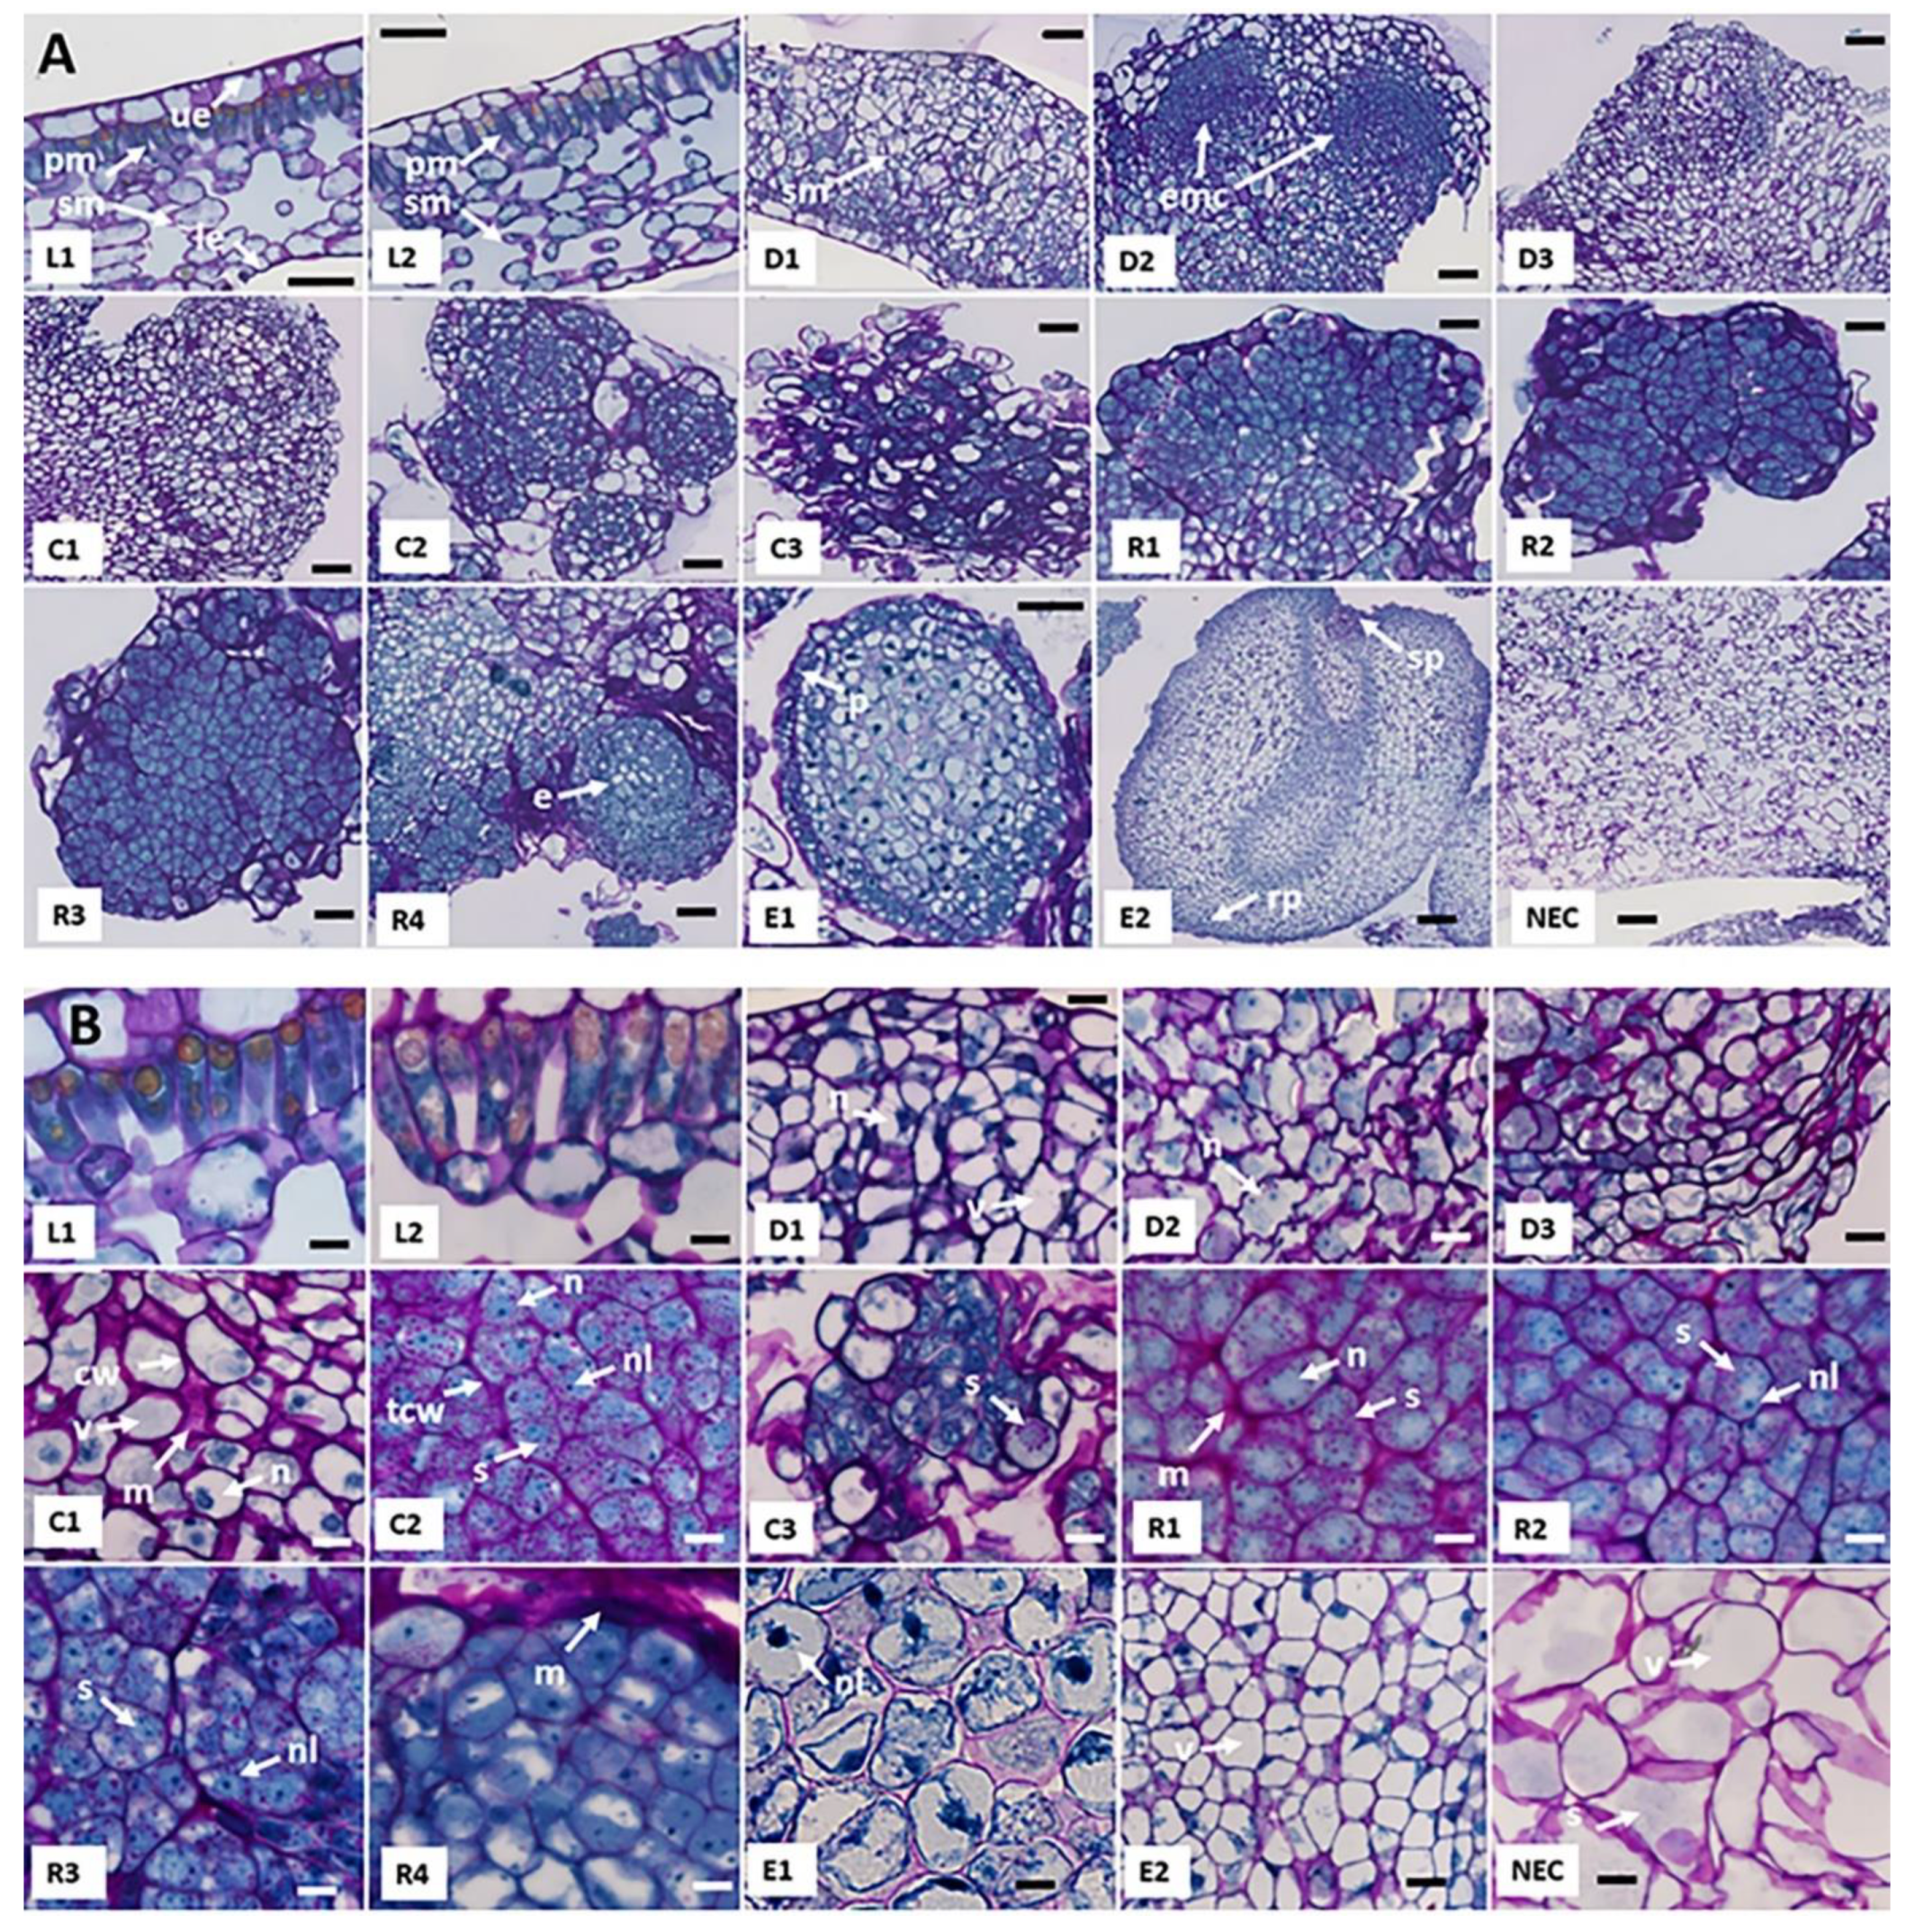
2.1. Morphological and Histological Characterization of Arabica SE Key Sampled Stages

A characterization of the 15 key sampled stages of the Arabica SE process on a morphological level (Figure 1), as well as on a histocytological level is shown in Figure 2 and Table 1. SE was carried out from juvenile leaf explants (Figure 1L2) which could be characterized histologically by a well-structured anatomy i.e., from up to bottom, an upper-epidermis, palisade mesophyll cells, spongy mesophyll cells and a lower-epidermis (Figure 2A L1). Palisade mesophyll cells are elongated and cuboid (width-to-length ratio = 0.33 ± 0.04) (Figure 2B L1, Table 1) with a low nucleocytoplasmic (N/C) ratio (0.17 ± 0.02) and a small nucleus located at the periphery of the cell, pressed against the cell wall (Figure 2B L1). Leaf disinfection (Figure 2B L2) did not have a significant effect on cell morphology. After one week on culture medium, and even though no changes were noticed at a morphological level (Figure 1D1), a high mitotic activity was taking place in cells enduring dedifferentiation and evidenced by the number of cells undergoing cytokinesis (Figure 2B D1). This mitotic activity was particularly observed in perivascular and spongy mesophyll cells of the leaf explant. Cell nuclei appeared intensely stained in blue by Naphthol Blue-Black and took a more or less central position, where they were maintained by spans of cytoplasm between which are found several vacuoles of small sizes. Cells were therefore described as star-shaped. These vacuolated cells had a large size (647 ± 71 µm2) and a high width-to-length ratio (0.67 ± 0.08) (Table 1). After two weeks on culture medium, whitish amorphous callus started to emerge from the wounded edge of leaf explants (Figure 1D2). On a histological level, clusters of actively proliferating meristematic cells appeared to be forming the emerging callus (Figure 2A D2). These cells were remarkably stained with Naphthol Blue Black. Dedifferentiated cells of the constituted callus had an irregular shape, but maintained their large size and high mitotic activity as well as a higher N/C ratio (2.7-fold) (Figure 2B D2, Table 1). After five weeks on culture medium, two types of calli could be observed: a whitish spongy callus which is non-embryogenic and a more compact and organized yellowish callus that emerged on the edge of leaf explants (Figure 1D3). The cells from the yellowish callus were also actively proliferating (numerous mitosis) with a larger size (695 ± 91 µm2) (Figure 2B D3, Table 1). Three months after the in vitro introduction, this callus was well-established and had a dark grey color, and named primary callus (Figure 1C1 and Figure 2A C1). Primary callus cells were square-shaped, had also a large size (784 ± 56 µm2), a large nucleus (114 ± 25.3 µm2), and their vacuole occupied the main cell volume (Figure 2B C1, Table 1). A polysaccharide sugar-containing mucilaginous coating layer was present between cell walls (Figure 2B C1). Less cell divisions were observed in this type of slow proliferating callus. Seven months after explant introduction, embryogenic calli emerged (Figure 1C2 and Figure 2A C2). Embryogenic calli were yellowish and friable, constituted by small cells (214 ± 18 µm2), isodiametric, surrounded by a thickened outer cell wall, arranged in clusters, with a dense cytoplasm (rich protein-staining) and a central nucleus with a prominent nucleolus stained in blue-black (N/C ratio = 0.33 ± 0.02) (Figure 2B C2, Table 1). The nucleus is surrounded by starch granules. These cells display the characteristic cytological features generally found in embryogenic calli [39]. A morphological and histological comparison between embryogenic and non-embryogenic calli (NEC) is described below. Embryogenic cell characteristics were maintained in established embryogenic cell clusters (Figure 2B C3) with a sharp increase in the number of proliferating cells. Indeed, cell clusters were maintained for four months in proliferation medium and became brownish in color (Figure 1C3). All pro-embryogenic masses (PEMs) collected during redifferentiation (Figure 2B R1, R2, R3, R4) shared the same characteristics with embryogenic cell clusters on histological and cellular levels with a higher ratio of square-shaped cells (width-to-length ratio = 0.70 ± 0.07 vs. 0.54 ± 0.06, Table 1). Easily observable, cell cluster dark brown color quickly turned to light brown as soon as the redifferentiation step was induced (Figure 1C3,R1). A sugar-containing mucilaginous coating layer was present between cell walls (Figure 2B R1). The formation of globular embryo structures could be seen from the R4 stage in which a sugar mucilaginous coating layer was backing the newly formed embryoids (Figure 2A R4). While PEMs were characterized by a high N/C ratio, embryonic cells of globular-shaped embryos (Figure 2A E1) were characterized by a small nucleus hence a low N/C ratio (0.10 ± 0.01 vs. 0.31 ± 0.03, Table 1) and a dense nucleus at the edge of the cell with the vacuole occupying the main cell volume (Figure 2B E1). This aspect was more highlighted in embryonic cells of the ground promeristem of torpedo-shaped embryos (Figure 2A E2) where cells were circular and of larger size (943 ± 55 µm2) (Figure 2B E2). Globular and torpedo-shaped embryos were white in color (Figure 1E1,E2). Globular embryos were surrounded by a protodermis (outer layer) (Figure 2A E1). Torpedo-shaped embryos were bipolar structures with easily distinguishable shoot and root poles (Figure 2A E2).

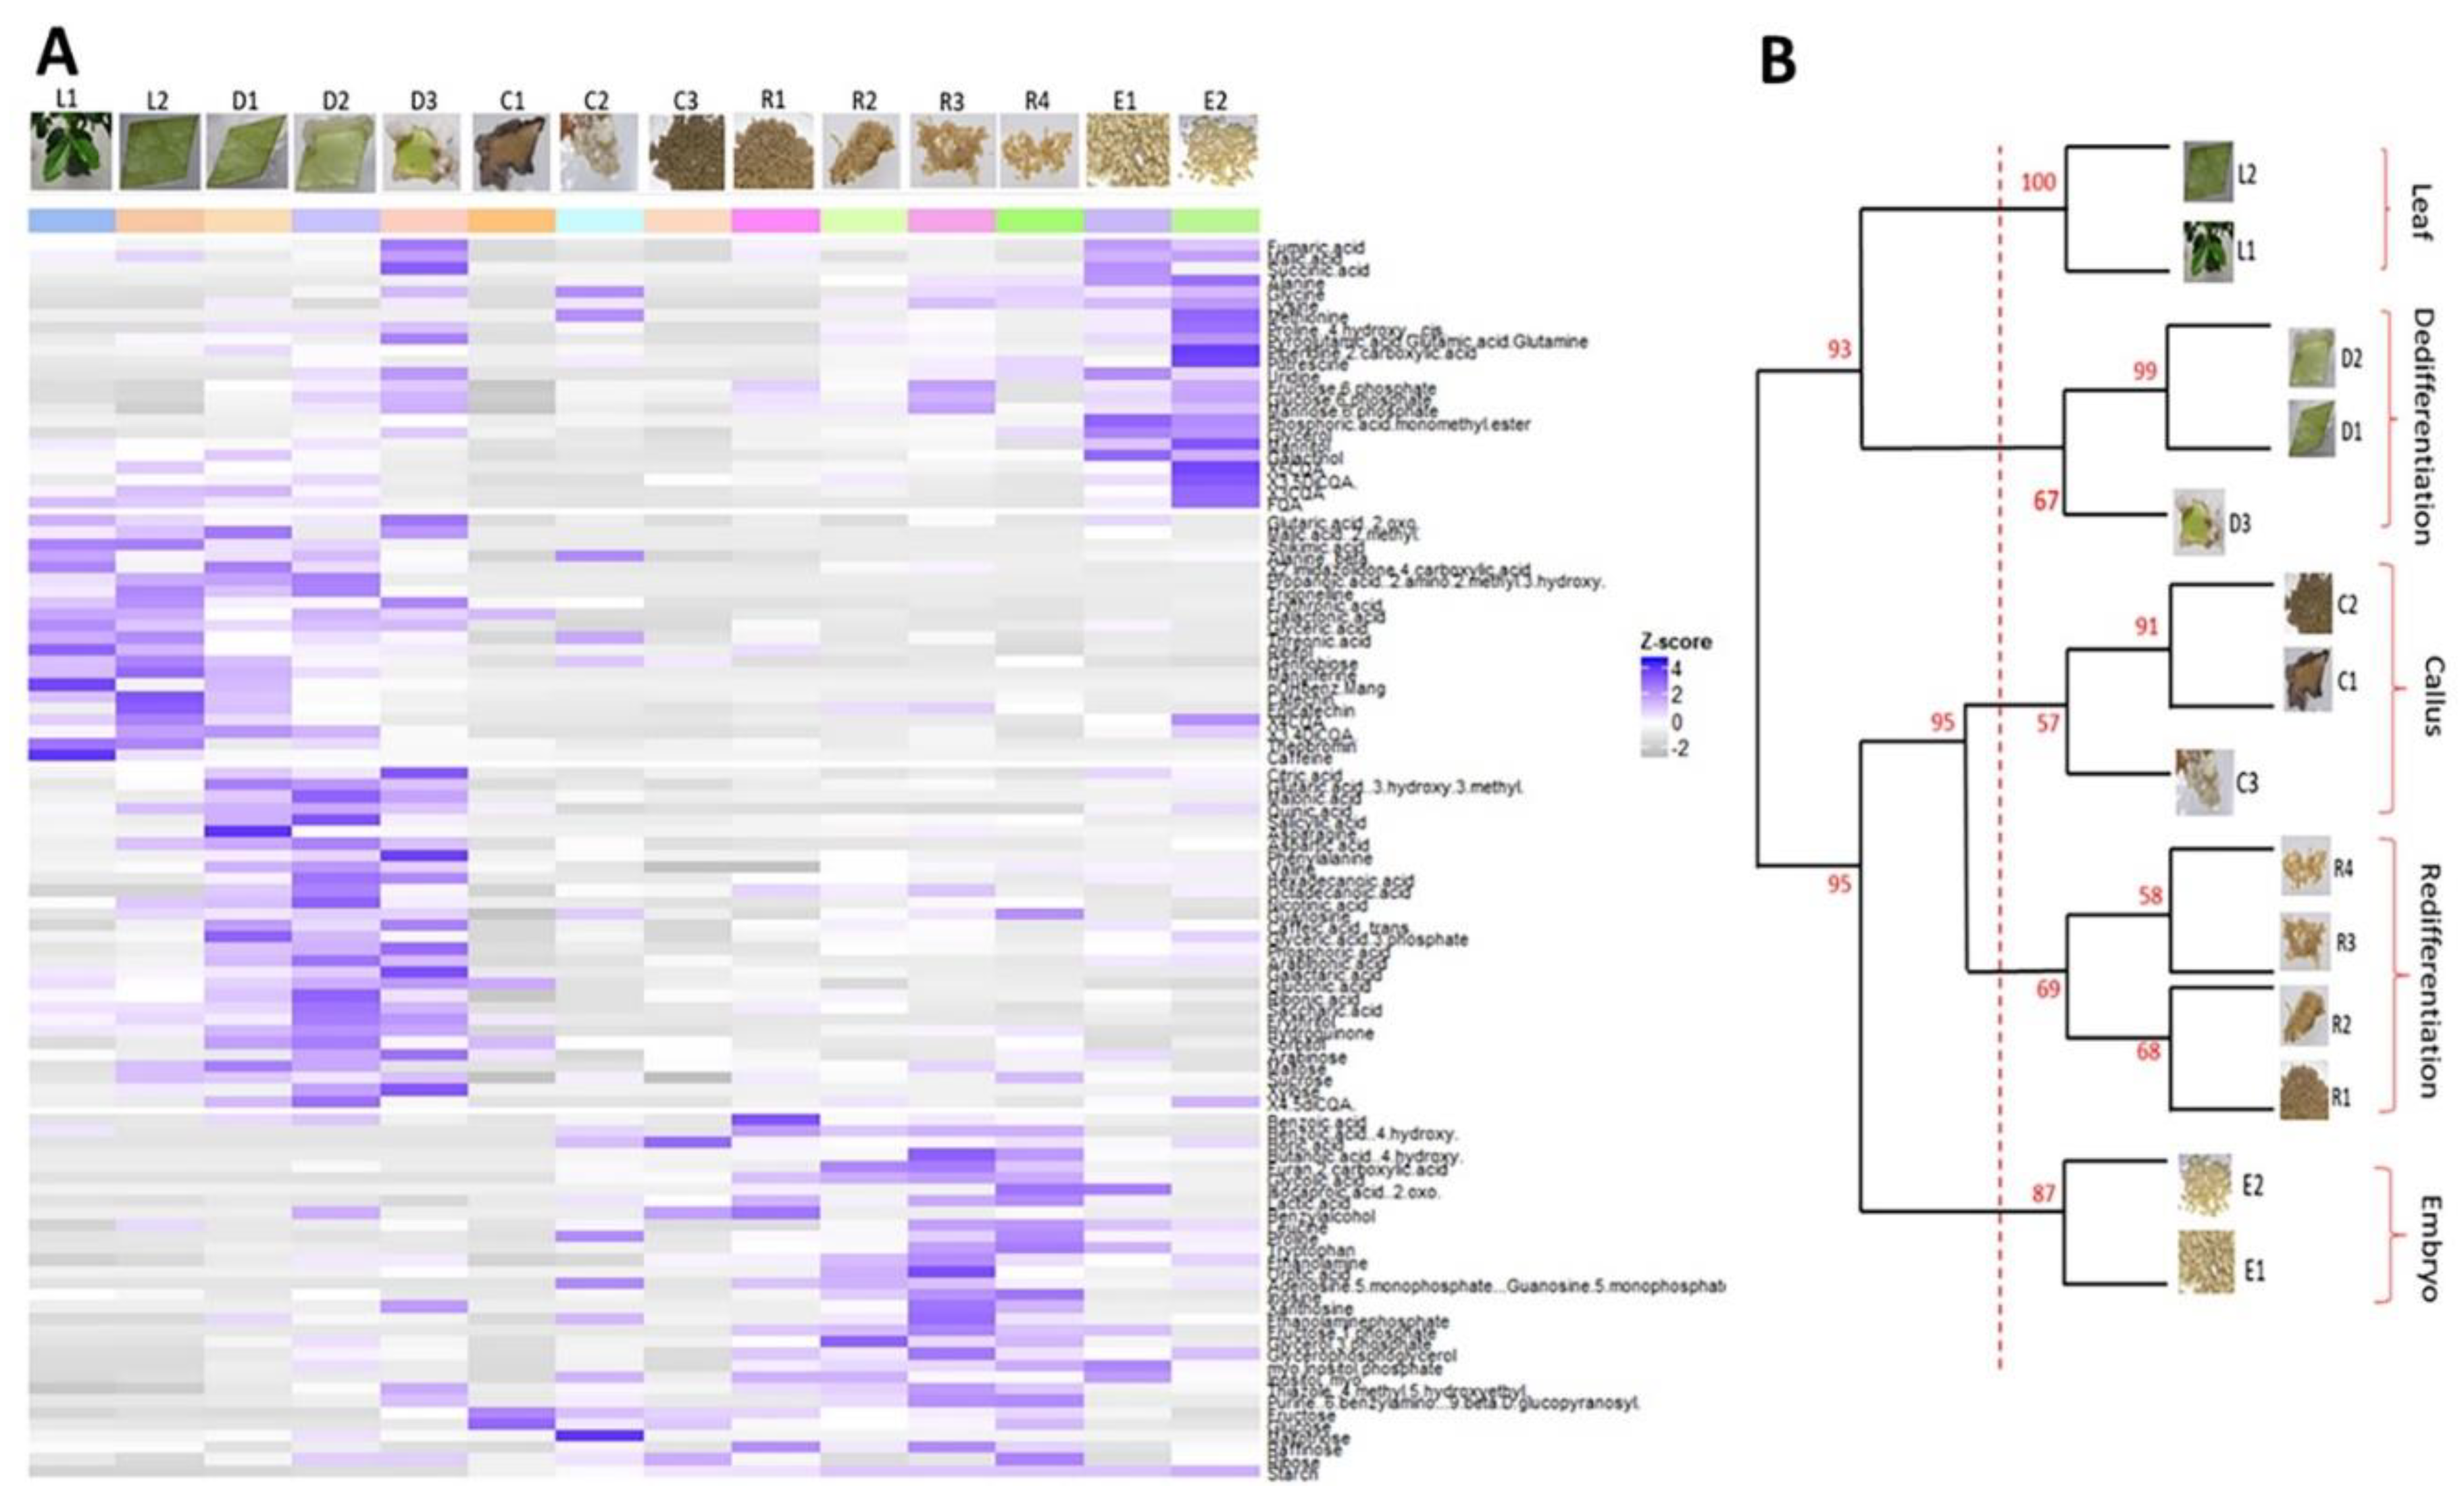
2.2. Clustering Metabolite Profiles Divides the Arabica SE Process into Five Major Phases

A total of 92 primary metabolites and 12 secondary metabolites were detected over the 14 SE sampled stages (Table S1). The heatmap generated from the Z-score values of the total primary and secondary metabolites detected showed similar patterns in some of these stages (Figure 3A). We decided to carry out a hierarchical clustering analysis to highlight stages that shared similar metabolic patterns. Strong correlations between patterns were obtained as the threshold applied (red line, Figure 3B) yielded 5 major nodes: the “Leaf” node where the L1 and L2 stages clustered together (cluster probability = 100%), the “Dedifferentiation” node where the D1, D2 and D3 stages clustered together (cluster probability = 67%), the “Callus” node where the C1, C2 and C3 stages clustered together (cluster probability = 57%), the “Redifferentiation” node where the R1, R2, R3 and R4 stages clustered together (cluster probability = 69%) and the “Embryo” node where the E1 and E2 stages clustered together (cluster probability = 87%). The obtained clusters grouped along the axis of the SE process as the obtained nodes corresponded to successive developmental phases of the SE process, i.e., the leaf phase, the leaf explant dedifferentiation phase, the callus phase, the redifferentiation phase (embryogenic cell clusters to embryoid structures), and the embryo development phase (globular to torpedo-shaped embryos).

2.3. Metabolic Characterization of the Five Phases of the Arabica SE Process

For each developmental phase, primary and secondary metabolites displaying significant increased values from their respective means across the 14 stages (Z-score > 1) are listed in Table 2 and those displaying significant decreased values (Z-score < −1) are listed in Table 3. The “Leaf” phase highlighted an accumulation of two amino acids (beta-alanine, aspartic acid), metabolites implicated in the ascorbate and aldarate metabolism (galactonic and threonic acid) and also primary metabolites involved in the shikimate pathway (shikimic and quinic acid), as well as secondary metabolites production such as alkaloids (trigonelline, theobromine and caffeine) and phenolic compounds (mangiferin, catechin, epicatechin, 3-caffeoylquinic acid (3-CQA), 4-CQA, 3,4-diCQA, feruloylquinic acid (FQA)). The “Leaf” phase is also characterized by a decrease of sugars (fructose, ribose) and phosphorylated sugars (glucose-6-phosphate, fructose-6-phosphate, mannose-6-phosphate), two amino acids (leucine, lysine) and myo-inositol.
The “Dedifferentiation” phase showed an accumulation of metabolites involved in the tricarboxylic acid (TCA) cycle (aconitate, 2-oxoglutarate, succinate, fumarate, malate, citrate) and in the ascorbate and aldarate metabolism (arabinonic acid, galatactaric acid, galactonic acid). It also included an accumulation of sugars (maltose, sucrose), phosphorylated sugars (glucose-6-phosphate, fructose-6-phosphate, mannose-6-phosphate), amino acids (beta-alanine, aspartic acid, asparagine, glycine, glutamine, valine), and fatty acids (hexadecanoic acid, octadecanoic acid, glyceric acid). Primary metabolites involved in secondary metabolism pathways were also accumulated such as phenylalanine, caffeic and quinic acid, nicotinic acid and xanthosine. During this phase, lower levels were obtained for some carbohydrates such as glucose, fructose and starch and one amino acid, lysine.
The “Callus” phase displayed an accumulation of some sugars (maltotriose, ribose, glucose, fructose), amino acids (glycine, methionine, proline), fatty acids (glycerol), and myo-inositol. This phase induced a decrease for metabolites implicated in the TCA cycle and the ascorbate and aldarate metabolisms, as well as for phosphorylated sugars, sucrose and three amino acids (leucine, lysine, valine).
The “Redifferentiation” phase showed an accumulation of phosphorylated sugars, ribose, three amino acids (leucine, lysine, proline), glycerol-3-phosphate, myo-inositol, and aconitate. Primary metabolites involved in secondary metabolism pathways were also accumulated such as tryptophan, caffeic and benzoic acid, guanosine, inosine and xanthosine. Only valine exhibited a significant decrease for this stage.
The “Embryo” phase (globular to torpedo-shaped embryos) included an accumulation of TCA cycle metabolites, phosphorylated sugars, starch, amino acids (alanine, glycine, leucine, lysine, methionine, proline, glutamine, tryptophan), polyols (myo-inositol, mannitol), glycerol, glycerol-3-phosphate and putrescine. Phenolic compounds (3-CQA, 4-CQA, 5-CQA, 3,4-diCQA, 3,5-diCQA, FQA) were accumulated again, as in the “Leaf” phase. Only fructose was decreased.
The presence and accumulation of total chlorogenic acids during embryo redifferentiation was confirmed by multiphoton microscopy combined with emission spectral analysis of total chlorogenic acids in PEMs after 1 day (R2), 3 days (R3), 10 days (R4) and 3 weeks (E1) in redifferentiation medium (Figure 4 and Figure S2). Emission spectral analysis allows to specifically associate emission spectra from cells with defined pure autofluorescent compounds (in this case, total chlorogenic acids) [40]. Absent in embryogenic cell clusters, total chlorogenic acids seemed to accumulate on the edge of PEMs at day 3 at the same location where the embryo structure later emerged (at day 10). Autofluorescence intensity of total chlorogenic acids was strongly associated with the number of globular-shaped embryos obtained after 3 weeks. Taken together, these findings indicate that chlorogenic acids are potent metabolic markers of the embryonic state.

2.4. Cell Hormonal Content Changes throughout the Arabica SE Process

Analysis of cell hormonal content showed variations over the five developmental phases of the SE process (Table 4). When switching from the “Leaf” phase to the “Dedifferentiation” phase, indole-3-acetic acid (IAA), 1-aminocyclopropane-1-carboxylic acid (ACC) and zeatin (cis- and trans-) (Z) levels significantly increased whereas cis-abscisic acid (ABA) levels significantly decreased. Moreover, indole 3-butyric acid (IBA) and isopentenyladenine (iP) levels were only detectable in the “Dedifferentiation” phase. ABA glucose ester (ABAGE) and zeatin riboside (cis- and trans-) (ZR) levels were unaffected.
When switching from the “Dedifferentiation” phase to the “Callus” phase, IAA, ACC and Z levels significantly decreased while ABAGE and ZR levels significantly increased. ABA was maintained at similar levels.
When switching from the “Callus” phase to the “Redifferentiation” phase, IAA levels increased again whereas ZR levels dropped. ABA, ABAGE, ACC and Z were maintained at similar levels.
When switching from the “Redifferentiation” phase to the “Embryo” phase, ABA, ABAGE, Z and ZR levels significantly increased. IAA and ACC levels were unaffected.

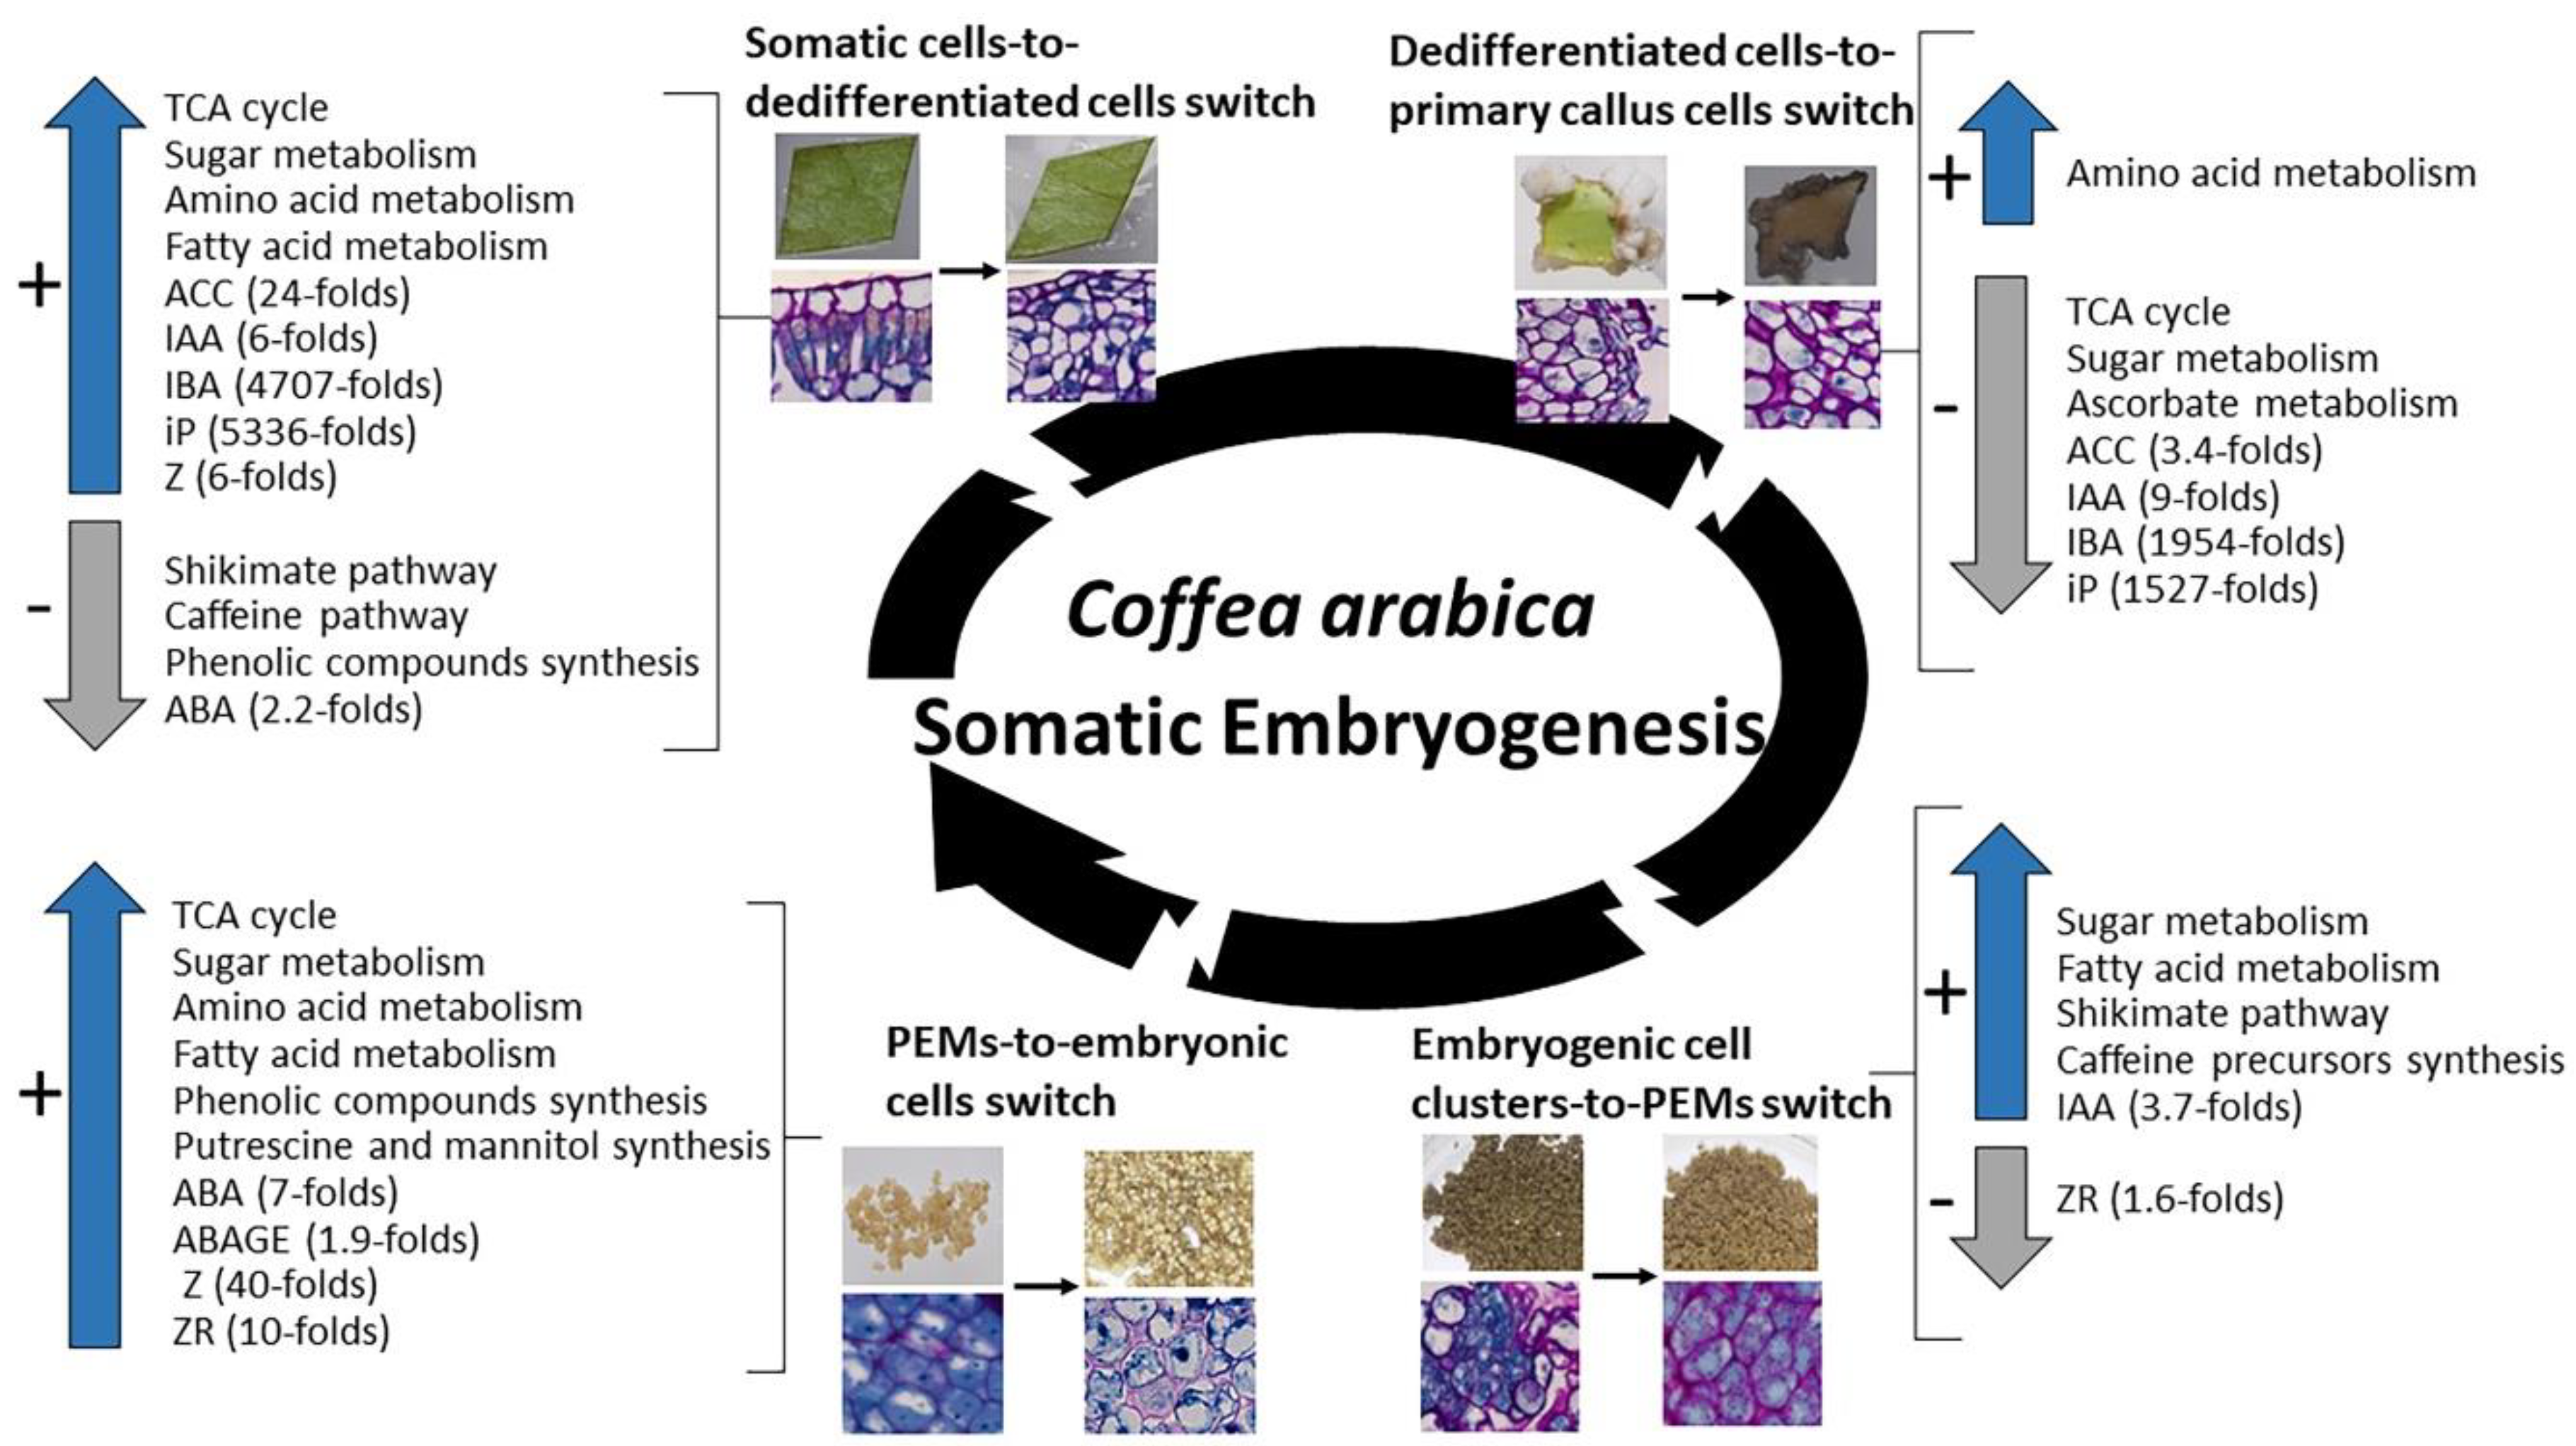
2.5. Most Significant Changes in Metabolic and Hormonal Profiles Occur during Phase Switches

A developmental phase switch corresponds to the transition between the last sampled stage of a developmental phase and the first sampled stage from the following phase. Since five main phases were highlighted (Leaf, Dedifferentiation, Callus, Redifferentiation, Embryo), four phase switches could be identified and summarized in Figure 5:
(i)
The leaf explant-to-dedifferentiated cell switch occurring after one week in induction medium (L2 stage to D1). During this switch, and even though no change could be observed on a morphological basis, huge changes were noticed at a biochemical level. Our results show a drastic increase in levels of metabolites involved in the TCA cycle pathway, in sugar (glucose-6-phosphate, fructose-6-phosphate, mannose-6-phosphate), amino acid and fatty acid metabolisms while shikimate, caffeine and phenolic compounds pathways were poorly present. Hormone levels also sharply increased during this phase switch mainly ACC (24-fold), IAA (6-fold), IBA (4707-fold), iP (5336-fold) and Z (6-fold), except for ABA which levels were decreased (2.2-fold).
(ii)
The dedifferentiated cells-to-established primary callus cells switch occurring three months after induction (D3 stage to C1). This switch was characterized by a sharp decrease in cell basic functions, mainly a decrease in the levels of metabolites involved in the TCA cycle pathway, sugar metabolism (phosphorylated glucose and fructose), and the ascorbate pathway which is related to the cell photosynthetic activity. Only synthesis of some amino acids was maintained (methionine, glycine). Hormone levels also sharply decreased in compact primary callus cells compared to cells in early dedifferentiation mainly IBA (1954-folds), iP (1527-fold), IAA (9-fold) and ACC (3.4-fold).
(iii)
The embryogenic cell clusters-to-PEMs switch occurring after one week in redifferentiation medium (C3 stage to R1). During this switch, a re-activation in cell primary and secondary functions was observed; levels of phosphorylated sugars (glucose-6-phosphate, fructose-6-phosphate, mannose-6-phosphate) and fatty acids (glycerol-3-phosphate) increased as well as precursors of caffeine (inosine, xanthosine) and end-products of the shikimate pathway (caffeic acid, benzoic acid, tryptophan). In parallel, IAA levels also increased in PEMs compared to embryogenic cell clusters (3.7-fold) while levels of ZR sharply decreased (1.6-fold).
(iv)
The PEMs-to-embryonic cells switch occurring after four weeks in redifferentiation medium (R4 stage to E1). During this switch, cell functions are re-established in embryonic cells with increased levels of TCA cycle metabolites, phosphorylated sugars and fatty acids, and the synthesis of a number of amino acids (alanine, glycine, leucine, lysine, methionine, proline, glutamate) and phenolic compounds (5-CQA; 3-CQA; 4-CQA; 3,5-di-CQA; 4,5-diCQA and FQA). A synthesis of putrescine and mannitol was also noticed. Our results also showed a significant increase in ABA levels (7-fold), ABAGE levels (1.9-fold), Z levels (40-fold) and ZR levels (40-fold) in embryonic cells compared to PEMs.
These results clearly show that comparing metabolic profiles between two sampled stages corresponding to a phase switch allowed obtaining a better description of these stages than a morphological or histological comparison as it made possible to distinguish between two sampled stages that are morphologically similar (e.g., leaf explant before and after one week on dedifferentiation medium) or histologically similar (e.g., dedifferentiated cells and established primary callus cells).

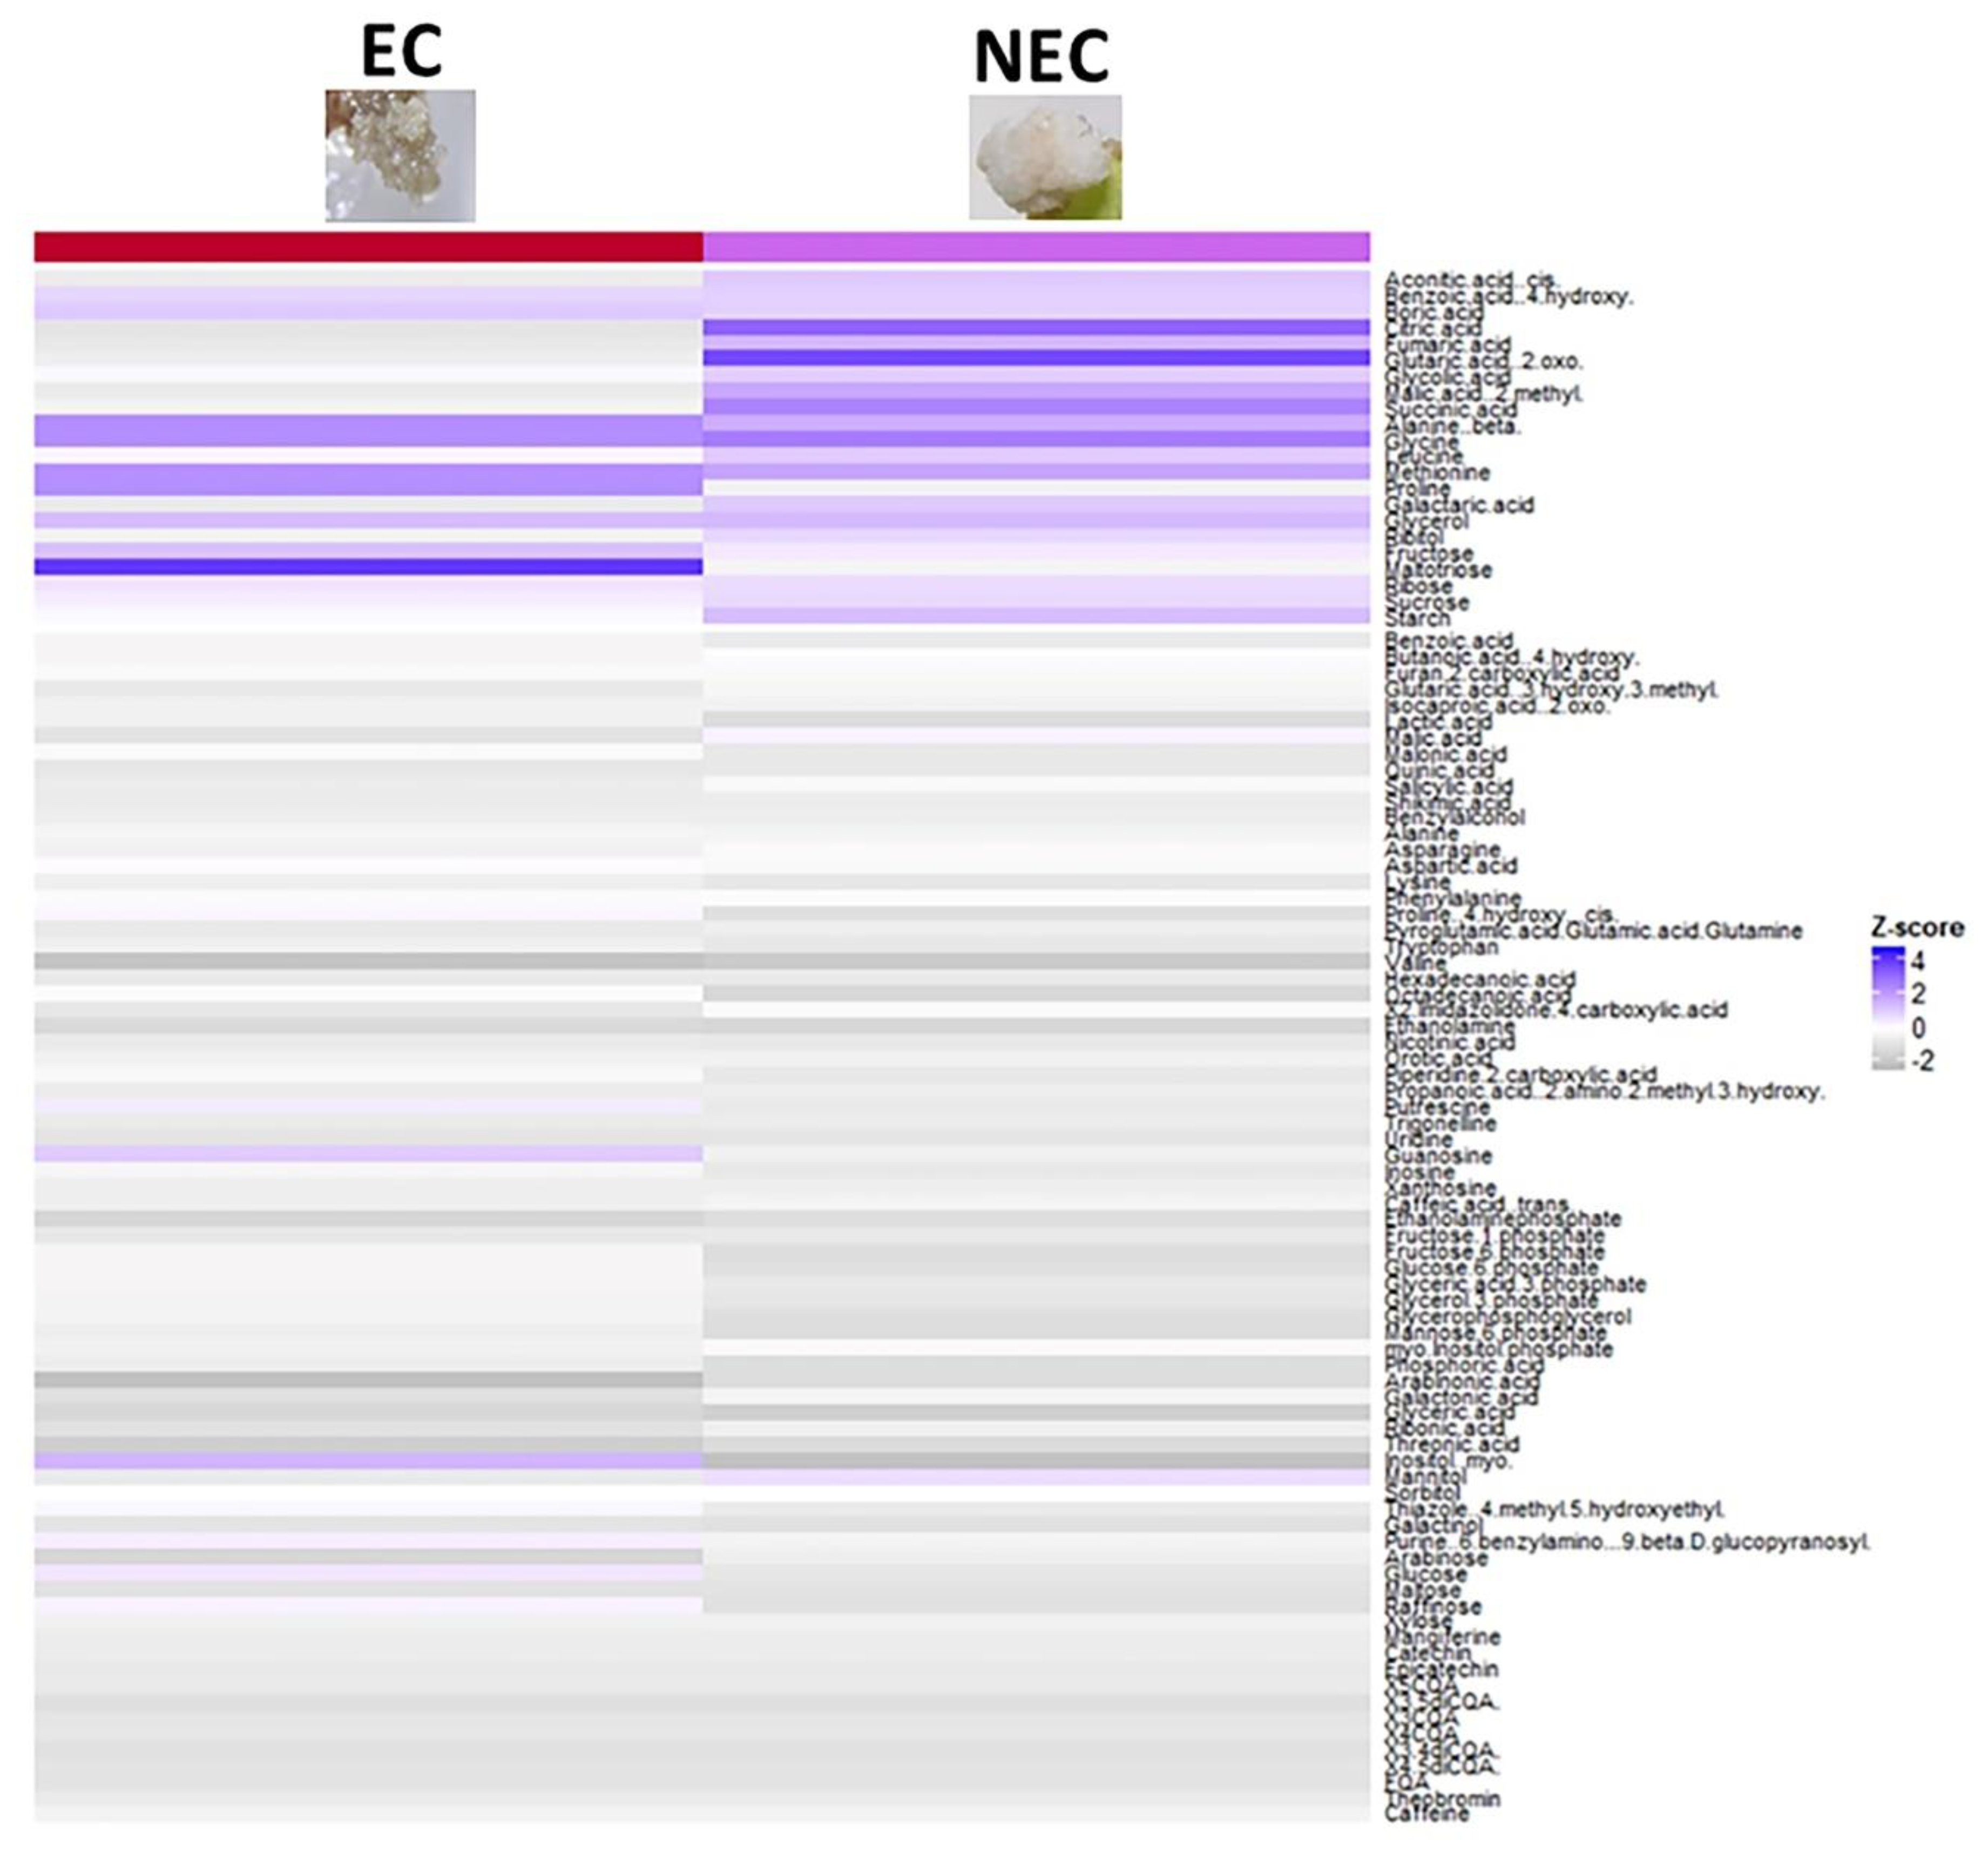
2.6. Embryogenic and Non-embryogenic Calli Differ Morphologically, Metabolically and Hormonally

Embryogenic (EC) and non-embryogenic calli (NEC) can be easily distinguished on the basis of their morphology, color and cellular characteristics (Figure 2A C2, NEC; Table 5). Somatic embryos could not be regenerated from NEC. EC developed from compact primary calli whereas NEC developed from non-compact primary calli. EC were yellowish and friable, constituted by small cells (214 ± 18 µm2), isodiametric, surrounded by a thickened outer cell wall, arranged in clusters, with a dense cytoplasm (rich protein-staining) and a central nucleus with a prominent nucleolus stained in blue-black (N/C ratio = 0.33 ± 0.02) (Figure 1C2 and Figure 2B C2). NEC were spongy and translucent, displaying cells of a much larger size (2081 ± 386 µm2) with the vacuole occupying a big share of the cytoplasm, and an absence of cytoplasmic organelles (Figure 1 NEC and Figure 2B NEC). The nucleocytoplasmic ratio in NEC was significantly lower than in EC (0.17 ± 0.02 vs 0.33 ± 0.02). Protein and sugar staining-surfaces were limited to cell membranes and cell walls. A characteristic attribute of EC in coffee was the abundance of starch granules whereas larger insoluble starch reserves were found in NEC.
At a biochemical level, the heatmap generated from primary and secondary metabolite profiles of both tissues (Figure 6) displayed significantly increased and decreased levels for some metabolites (Z-score > 1 and Z-score < −1, respectively) listed in Table 6. Both EC and NEC accumulated ribose, amino acids (methionine and glycine) and fatty acids (glycerol) (Table 6) and had negative Z-scores for phosphorylated sugars, metabolites related to ascorbate and aldarate pathways and valine. However, while NEC over-accumulated TCA cycle metabolites and two amino acids (β-alanine, lysine) and under-accumulated a polyol (myo-inositol) and an amino acid (proline), EC over-accumulated sugars (glucose, fructose, maltotriose), an amino acid (proline), myo-inositol, and under-accumulated TCA cycle metabolites, an amino acid (leucine) and sucrose.
Concerning hormones, both EC and NEC had similar levels of ACC [2855-3177 ng/g DW] and IAA [19–32 ng/g DW] (Table 7). However, levels of ABA and ABAGE were significantly higher in EC than in NEC (16- and 50-fold, respectively), as well as the levels of ZR (4-fold). Z was only detected in EC (2 ± 1 ng/g DW). IBA and iP were not detected in either tissues.

3. Discussion

3.1. Arabica SE Metabolites as a Signature of Cell Fate

This study reports the first global analysis of SE metabolome and hormone dynamics, conducted on 15 key sampled stages covering the entire SE process, from leaf explant dedifferentiation to embryo development. Two pre-requisites were mandatory for this study: (i) the availability of large-scale protocols for coffee SE, offering high reliability and cell synchronicity in each sampled stage as well as a good efficiency; (ii) the availability of the latest omics technologies allowing to rapidly offer masses of information. This first global analysis applied on a model tree species for SE should serve as a reference for a wide range of plant species as the detailed sampling conducted on 15 stages provided a better field-of-view to the SE process as a whole and enabled to clarify some real black boxes [24]. The statistical approach employed in this study helped to clearly divide the SE process into five phases and four key phase switches that are strategic for the whole biological efficiency of embryo redifferentiation. Many authors recently reported the necessity of a better understanding of the SE process to clarify the current bottlenecks [22,26,41]. The fact that each of the metabolic profiles correlated with a specific cell status—leaf cells, cells in dedifferentiation, callus cells, pro-embryogenic masses, embryonic cells—is extremely relevant. This shows that metabolite fingerprints are a specific signature for each developmental phase and bring rich information on cell status, as some of these stages were undistinguishable by morphological and histological approaches. A number of papers on conifers assumed that clear correlations may exist among the different metabolome or phytohormone profiles and some specific SE stages (cell line proliferation to embryo maturation) [28,29,31]. This global analysis is a proof that metabolites could be good predictors of all cell fate transitions—from leaf explant introduction until embryo development—and could be used to control the SE process key stages. This goes beyond describing cell morphology and color, which was until now the only way to support empirical protocol optimization. Combining this study with transcriptomic approaches could give a much clearer understanding of the molecular mechanisms underlying cell reprogramming [22].

3.2. The Dedifferentiation Episode Is Characterized by Huge Changes in Cell Metabolic Pathways

SE is a process driven by exogenously supplied plant growth regulators. Although most plants require similar physical conditions (temperature, light regime) for the induction of SE, medium composition can have a large impact on SE outcome. According to Sugimoto et al. [42], the prime characteristic of plant regeneration is cell fate reprogramming induced by wounding, stress, and hormones. Auxins and cytokinins are widely known to play essential roles in the induction of embryogenic cultures [31]. The combined addition of natural (IBA and N6-(2-Isopentenyl) adenine (2-iP)) and synthetic (2,4-dichlorophenoxyacetic acid (2,4-D) and 6-benzylaminopurine (6-BA)) as exogenous growth regulators in the medium sharply increased endogenous levels of IAA and Z. The synthesis of endogenous auxins is considered as a crucial early step in the switch to totipotent growth. The results reported by different authors [43,44] account for an important role of auxins in SE induction. The precursor of ethylene, ACC, also showed a sharp increase during cellular dedifferentiation in our study and has been reported to improve somatic embryo induction in Arabidopsis thaliana [45].
Somatic cells within the plant contain all the genetic information necessary to create a complete and functional plant (with the exception of anuclear vascular cells) [6]. During cellular dedifferentiation, the existing developmental information of somatic cells must be switched off or re-configured to make the somatic cells ready for an embryogenic program [46]. Our results showed that secondary metabolites (phenolic compounds and alkaloids) no longer accumulated during this stage, whereas their precursor levels increased (phenylalanine and caffeic acid; nicotinic acid and xanthosine, respectively). Nic-Can et al. [47] have published a demonstration on the effect of caffeine and chlorogenic acid in SE of C. canephora. These authors have provided evidence that those compounds inhibited the embryogenic process by affecting DNA methylation. Since leaf explants are placed in the dark, metabolite routes that are dependent on the photosynthetic activity such as the ascorbate metabolism are slowly replaced by cell respiratory pathways, mainly glycolysis and TCA cycle. Glycolysis is a key and ubiquitous metabolic pathway that allows plant cells to convert carbohydrates into the energetic coin ATP. Our results are in agreement with a number of studies that showed that the glycolytic pathway is used by cells undergoing dedifferentiation [48,49].
Callus induction is a spectacular phenomenon in which important changes in tissue structure take place. Xu et al. [50] showed that genes related to cell wall hydrolysis and lipid metabolism are quickly activated after auxin treatment. Our results revealed an accumulation of amino acids and lipid residues that could originate from the fast degradation of membranes and proteins.

3.3. Identifying Metabolic Markers of the Embryogenic Capacity

To date, many authors have distinguished EC from NEC based on morphological and histological studies [51,52,53]. Biochemical comparison of these tissues showed that carbohydrates, phytohormones and free amino acids differentially accumulated in EC and NEC [32,54,55]. When comparing metabolomic and hormonal profiles of EC and NEC, we were able to identify metabolic markers of the embryogenic state that can be directly used to pilot the optimization of the composition of the culture medium. An over-accumulation of maltotriose, myo-inositol, proline, ABA and Z was characteristic of EC as opposed to NEC. On the contrary, an under-accumulation of leucine and TCA cycle metabolites was found in EC NEC. These metabolites could serve as predictors of the regenerative capacity.
As observed through histological analysis, EC is characterized by the abundance of starch granules, whereas larger insoluble starch reserves were found in NEC. Metabolite profiles in our study showed that NEC accumulated starch reserves, while EC highly accumulated maltotriose, a product of starch hydrolysis. Gautier et al. [32] also observed large structures of starch reserves in NEC of Douglas-fir (P. menziesii) and hypothesized that NEC main fate was survival while EC was a transient state before fate transition. We highlight here for the first time that maltotriose is the preferred way to store sugars in EC for a faster usage during fate transition. Other metabolic markers of the embryogenic state, myo-inositol and proline, that were abundant in EC, were detected at low levels in NEC. High levels of inositol were also found in Norway spruce cell lines competent for SE and are involved in stress responses enabling embryo formation [56]. Guillou et al. [57] reported a better embryo-to-plant conversion in Theobroma cacao with medium supplemented with myo-inositol. Liang et al. [58] pointed out that proline metabolism stimulates cell-signaling pathways through increased formation of reactive oxygen species (ROS) that promote embryo formation. Neves et al. [54] also found an accumulation of free proline in EC cells of sugarcane. Another metabolic marker of the embryogenic state was leucine which levels were severely lower in EC than in NEC. This could be due to the synthesis of leucine-rich repeat (LRR) proteins which are fused to a central nucleotide binding domain and collectively called the NB-ARC domain. The role of NB-ARC domain containing receptor kinases related to SE, e.g., SERK, was reported in several plant species [6].
Furthermore, Magnani et al. [59] reported in Arabidopsis thaliana that EC shut off biochemical pathways related to sugar metabolism and activate the transcriptional machinery. Our results are in agreement with this statement since no TCA cycle activity was present in EC. However, TCA cycle was highly active in NEC. This supports our above hypothesis about NEC battle for survival and makes the absence of TCA metabolites a predictor of the embryogenic state. At the hormonal level, EC had increased concentrations of ABA, ABAGE, Z and ZR compared to NEC. ABA has been previously reported to play an important role in embryo development [60]. Z plays an important role in WUSCHEL mediated maintenance of stem cell niche in the shoot apical meristem [61].

3.4. Metabolic and Hormonal Profiles of the Callus Phase Are Proof of Cell Totipotency

After the groundbreaking discovery that callus can be generated artificially in vitro [62] and that the balance between two plant hormones, auxin and cytokinin, determines the state of differentiation and dedifferentiation [63], the totipotency characteristic of callus cells has been widely used in both basic research and industrial applications [64]. Our results revealed a drastic decrease in endogenous hormone levels (auxins, cytokinins and the ethylene precursor ACC) after callus formation probably reflecting that the totipotency program is now established [65]. Only an increase in ABAGE levels is noted during callus phase and mainly in embryogenic calli. This suggests that cell fate is going towards an embryo expression program because ABA has been previously reported to play an important role in embryo development [60]. However, this program is still repressed since ABA is accumulated in a glucosylated form (ABAGE). Our results also showed that the totipotent state of callus is characterized by a clear shut-off of biochemical pathways related to sugar metabolism and energy production in agreement with Magnani et al. [59] in Arabidopsis, and a shut-off of the photosynthesis-related activity as previously reported by Ladygin et al. [66] in Stevia rebaudiana. The decrease reached a minimum level for phenolic compounds as previously described in ginger (Zingiber officinale) by Ali et al. [67]. These findings bring the first insights on the biochemical pathways involved in the expression of totipotency in callus. Consequently, exogenous hormones play an essential role to maintain the stem cell niche [31]. Only sucrose content showed a sharp decrease followed by an increase in glucose and fructose meaning that cells are getting their energy from the exogenous sucrose as recently showed by Gautier et al. [32] in Douglas-fir (P. menziesii).
In addition to the embryogenic callus, embryogenic cell clusters and well-established compact primary callus clustered together based on their metabolic profiles. Surprisingly, primary callus had more similarities with the embryogenic callus than with the initial stages of dedifferentiation. This means that this stage could already contain, in a repressed way, the program leading to the regeneration of a whole plant. This theory is in agreement with Ge et al. [68] who showed that differential molecular responses are already present in very early stages of EC formation. An observed higher nucleocytoplasmic ratio in primary callus and EC also supports this theory. Primary callus represents a true limiting element that needs improvement of culture conditions to reduce the time needed to obtain a characteristic embryogenic callus (7 months). The reliable and highly efficient redifferentiation potential of cell clusters proves that the exogenous auxin and cell density conditions have been well optimized in coffee SE in order to maintain a proliferating totipotent state without losing embryogenic capacity [37].

3.5. Re-Establishment of Primary and Secondary Metabolims During Redifferentiation Leading to Embryo Development

To trigger the redifferentiation process towards the development of somatic embryos, cell clusters are inoculated at a low density in a fresh medium where the exogenous auxin (2,4-D) is removed. The significant increase in endogenous IAA levels along with the accumulation of tryptophan, a precursor of IAA biosynthesis, was also highlighted by Businge et al. [28] in Norway spruce cell lines during redifferentiation. Even though the medium is highly supplemented with 6-BA during redifferentiation, Z was detected at rather low concentrations in embryos, whereas ZR levels sharply increased. The relationship between auxin and cytokinin contents is evidently decisive for embryonic development [61], as the high auxin/cytokinin ratio at maturation seems to be a prerequisite for proper formation of apical and root meristems, optimal development of root caps, hypocotyls and cotyledons [69]. Endogenous ABA which was not regulated exogenously (no ABA supply), showed significantly increased levels in globular and torpedo-shaped embryos during redifferentiation into embryos. This agrees with previous work showing a marked increase in the endogenous levels of ABA and ABAGE during maturation of larch (Larix kaempferi) somatic embryos [60]. In conifers, high exogenous ABA concentrations (20 μM) are needed throughout the maturation process whereas the absence, or low amounts, of ABA in the medium may lead to inhibited or aberrant development characterized by numerous malformed embryos [70].
While cell respiratory pathways (glycolysis and TCA cycle) resume their activities to produce enough energy for the formation of new early embryos, an accumulation of starch is noted in developed embryos that has been reported to contribute to the maturation process [71]. Synthesis of a number of amino acids reveals that embryos are ready to produce more complex structures, i.e., storage and polarization-related proteins [72]. Our results showed that a polyamine, putrescine, accumulated. This finding agrees with Pedroso et al. [73] who postulated that putrescine might be related to the formation and development of globular embryos in Camellia japonica. An accumulation of phenolic compounds is also seen during embryo development, mainly chlorogenic acids, as they are key intermediaries for lignin synthesis, in addition to their more general role in reactive oxygen species scavenging and abiotic stress tolerance [74]. Polyamines have also been involved in plant abiotic stress tolerance [75], confirming the fact that somatic embryo formation is a stress-related phenomenon. Precursors of caffeine also accumulated during redifferentiation probably meaning that caffeine would be produced in later stages. Mannitol accumulated, probably to help tolerate the osmotic stress generated by the growth medium after cell density reduction [76].

4. Materials and Methods

4.1. Tissue Culture and Sampling

An intraspecific hybrid (GPFA116) proceeding from Arabica breeding program and selected for its high cup quality, high yield and vigor, was used in this study. Somatic embryogenesis was performed in the Nestlé Research laboratories (Tours, France) based on the large-scale protocols described previously for C. arabica [10], and carried out in five replicates, i.e., five independent leaf introductions in February, April, June, October and December 2016 from distinct 1-year old plants obtained by SE and grown in the Nestlé Research greenhouse. Explants were then cultured in Petri dishes on T1 ‘dedifferentiation 1′ medium, i.e., Murashige and Skoog (MS) half-strength solid medium supplemented with 2.3 µM 2,4-D, 4.9 µM IBA and 9.8 µM 2-iP for 1 month before transfer on T2 ‘dedifferentiation 2′ medium, i.e., MS/2 solid medium supplemented with 4.6 µM 2,4-D and 17.8 µM 6-BA for 6 months until emergence of embryogenic calli. Petri dishes were placed at 25 °C in the dark. Embryogenic calli were then inoculated at a density of 10 g/L in Erlenmeyer flasks containing M ‘proliferation’ liquid nutritive medium, i.e., medium supplemented with 1.4 µM 2,4-D and 4.4 µM 6-BA and cultured for 4 months on shakers (120 rpm) at 25 °C in the dark, until proliferation of cell clusters. To enhance somatic embryo regeneration, cell clusters were transferred to 250-mL Erlenmeyer flasks containing 100 mL of DIF ‘redifferentiation’ liquid medium lacking 2,4-D at a 10 g/L density for 1 week then at a 1 g/L density for 8 weeks until development of torpedo-shaped embryos. Erlenmeyer flasks were placed on shakers (120 rpm) at 25 °C in the dark.
Fourteen sampled stages were chosen to cover the SE process from leaf explant to torpedo-shaped embryos development as shown in Figure 1: leaves from greenhouse plants (L1), explants during dedifferentiation [0 h (L2), 1 week (D1), 2 weeks (D2), 5 weeks (D3)], compact primary callus obtained 3 months after induction (C1), embryogenic callus obtained 7 months after induction (C2), established cell clusters obtained after 4 months in proliferation medium (C3), early regeneration of embryos from cell clusters [1 week in DIF medium without reducing cell density (R1), 24 h in DIF medium after reducing cell density (R2), 72 h (R3), 10 d (R4)], globular embryos (E1) and torpedo-shaped embryos (E2). Additionally, non-embryogenic callus (NEC) was also sampled at the same time as the embryogenic callus (C2). Approximately 2 g of fresh weight/sample/replicate were collected for metabolome and hormone content analysis. For these experiments, material was kept in liquid nitrogen then freeze-dried. For histological analysis, fresh samples were incubated in a fixative solution (1% glutaraldehyde, 2% paraformaldehyde and 1% caffeine in 0.1 M phosphate buffer pH 7.0) for 24 h at 4 °C.

4.2. Primary Metabolite Analysis

Primary metabolites were extracted according to Dethloff et al. [77]. Briefly, freeze-dried samples were ground in a ball mill (TissueLyser II, Qiagen, Hilden, Germany) and 30 mg of each sample were swiftly mixed with 300 μL methanol, 30 μL nonadecanoic acid methylester (CAS 1731-94-8) (2 mg/mL in chloroform) and 30 μL of 13C6-sorbitol (CAS 121067-66-1) (0.2 mg/mL in methanol). 40 μL from the polar phase were dried in a ScanVac speed vacuum concentrator (Labogene, Allerød, Denmark). Dried samples were mixed with 40 μL of methoxyamine hydrochloride (CAS 593-56-6, 40 mg/mL in pyridine (CAS 110-86-1)) and incubated for 90 min at 30 °C. Then, 70 μL of N,O-bis(trimethylsilyl)trifluoroacetamide (BSTFA, CAS 25561-30-2) and 10 μL of a C10, C12, C15, C18, C19, C22, C28, C32, and C36 n-alkane mixture were added for retention index calibration [78]. The mixture was subsequently incubated for additional 30 min at 37 °C to complete the reaction. Sample aliquots of 1 μL were injected in splitless and split 1/30 mode using an Agilent 6890 injector system set to 250 °C (Santa Clara, CA, USA). Initial oven temperature was maintained at 70 °C for 1 min, then raised to 350 °C at 9 °C/min and kept at 350 °C for 5 min. Helium carrier gas flow was set to 0.6 mL/min. All samples were run on a gas chromatography-electron impact ionization-time of flight/mass spectrometry (GC–EI–TOF/MS) instrument with an Agilent 6890N gas chromatograph and a LECO Pegasus III TOF mass spectrometer using the manufacturer’s ChromaTOF software for acquisition and baseline correction (version 2.32, LECO, St. Joseph, MI, USA). Data processing and peak identity annotation was manually performed using the TagFinder visualization tool for mass spectral matching of time groups and clusters [79]. Mass spectral features were matched to the mass spectra and retention time indices of authenticated reference metabolites from the Golm Metabolome Database [80]. Criteria for manually supervised metabolite annotation were the presence of at least 3 specific mass fragments per compound and a retention index deviation <1.0% [81]. Values obtained were normalized with internal standard (13C6-sorbitol) and DW. This experiment was carried out in 5 replicates. Metabolites showing a coefficient of variation >80% between replicates in at least 3 stages of the SE process were removed.

4.3. Secondary Metabolite Analysis

The freeze dried samples were ground into fine powder in a ball mill (TissueLyser II, Qiagen) and extracted by stirring (225 rpm, Rotamax 120, Heidolph, Schwabach, Germany) 15 mg of each collected sample in 600 µL of methanol (MeOH)/H2O (80:20, v/v) at 4 °C, in the dark, for 3 h. After centrifugation (10 min, 8 °C, 3500 rpm), the methanolic extract was collected and filtered (0.25 µm porosity, Interchim, Montluçon, France) before analysis. Each extraction was carried out in triplicate.
Quantitative analyses were carried out on a high-performance liquid chromatography (HPLC) system (Shimadzu LC-20, Tokyo, Japan) equipped with a binary pump, a photodiode array detector (DAD) and an Eclipse XDB C18 (3.5 µm) column (100 mm × 4.6 mm, Agilent). Extracts (10 µL) were analyzed at a flow rate of 0.6 mL/min using an elution system composed of solvents B (H2O/MeOH/acetic acid, 5:90:5 v/v/v) and A (water/acetic acid, 98:2, v/v) mixed as described in Campa et al. [82]. Parallel analyses were performed in triplicate on pure standard solutions of theobromine, caffeine, mangiferin, 3,4-, 3,5- and 4,5-O-diCQA, 5-CQA and caffeic acid from Sigma-Aldrich (St Quentin Fallavier, France), glycosylated kaempferol and quercetin, rutin, (+)-catechin, (−)-epicatechin and epigallocatechin from Extrasynthese (Lyon, France) at 10, 25, 50, and 75 µg/mL. Quantification of 3-, 4- and 5-CQA, FQA and 3,4-, 3,5- and 4,5-diCQA was undertaken at 320 nm, caffeine and catechin derivatives at 280 nm, and mangiferin, kaempferol and quercetin derivatives at 360 nm. Concentration was expressed in mg/g dry weight by comparison with the standard curves established with respective standards. For 3-CQA, 4-CQA and FQA, content was calculated taking into account the 5-CQA standard curve. Each coffee leaf powder sample was extracted and analyzed twice. Values obtained were normalized with DW.

4.4. Hormone Content Analysis

Quantification of widely reported phytohormones, i.e., ABA and ABA catabolites, auxins, cytokinins, gibberellins and the ethylene precursor ACC, was conducted at the National Research Council of Canada (Saskatoon, SK, Canada) by ultra-performance liquid chromatography-electrospray tandem mass spectrometry (UPLC-ESI–MS/MS) [83] using deuterium labeled internal standards. The procedure for the hormone profiling analysis was previously described in detail [84,85]. This experiment was carried out in triplicate. Results were expressed as ng/g DW. Hormones showing a coefficient of variation >80% between replicates in at least 3 of the 14 stages of the SE process were removed.

4.5. Starch Content Assay

The starch content of 20 mg of freeze-dried powder was determined using the total starch kit GOPOD (d-glucose, k-Gluc, Megazyme International, Wicklow, Ireland). After elimination of soluble sugars and of the soluble products of starch degradation, the residue was successively hydrolysed into glucose units with α-amylase and amyloglucosidase. The resulting d-glucose was then degraded with glucose oxidase and the resulting hydrogen peroxide quantified by spectrophotometry at 510 nm after a last enzymatic reaction. Values obtained were normalized with DW.

4.6. Histological Analysis and Cell Imaging

Fixated samples were dehydrated by successive immersions of 1 h-duration each in graded solvent series of ethanol, from 50% to 100%. Samples were then embedded in Technovit 7100 resin (Kulzer, Werheim, Germany) according to the manufacturer’s instructions. The cross-sections (3.5 μm), obtained with a Leica RM2255 microtome (Leica Microsystems, Wetzlar, Germany), were oxidized in 1% periodic acid (5 min), washed with distilled water and stained in the dark for 10 min with Schiff reagent (ref. 3952016, Sigma Aldrich). After washing, sections were stained with Naphthol Blue Black [1 g in 7% (v/v) (ref. 1.01167, Sigma Aldrich)] for 5 min at 60 °C, treated with 7% acetic acid and finally dried for 15 min at 60 °C. A total of 9 sections per time point were analysed. Images were obtained under a Nikon Eclipse Ni-E microscope (Nikon Instruments Inc., Melville, NY, USA) with two objectives, 20× and 40×, after acquisition using NIS software (Nikon Instruments Inc.). Images were analyzed using Image J 1.47v software.
Chlorogenic acid localization in living cells was carried out according to Talamond et al. [40]. Fresh samples were mounted on a glass slide in a drop of water and observed using a Zeiss LSM880 multiphoton microscope (Zeiss, Jena, Germany), equipped with a Chameleon Ultra II laser (Coherent, Santa Clara, CA, USA) and with an 20x Plan Apo 1.0 NA objective. Excitation wavelength was set to 720 nm and emission was observed with a band-pass filter, 386-502 nm (blue). Image acquisition was performed using Zen software (Zeiss). The presence and accumulation of total chlorogenic acids during embryo redifferentiation was confirmed by multiphoton microscopy combined with emission spectral analysis of total chlorogenic acids (Figure S2). After obtaining the spectral acquisitions, the LinearUnmixing function (Zen software) was executed to separate, pixel by pixel, the mixed signals of defined pure autofluorescent compounds (chlorogenic acids and chlorophyll), using the entire emission spectrum of each compound, plus a residual channel. In the residual channel, the intensity values represented the difference between the acquired spectral data and the fitted linear combination of the reference spectra.

4.7. Statistical Analysis

All analyses were carried out with R [86] using the default functions. First, a Principal Component Analysis (PCA) was carried out to verify homogeneity of replicates using the prcomp function (package stats) (Figure S1). For each primary or secondary metabolite, normalized values obtained at each stage were transformed to Z-scores by subtracting the mean of the values obtained at all collected stages and dividing it by the standard deviation. The Z-score transformation provides a way of standardizing data across a wide range of experiments [87]. A Z-score equal to 1 is one standard deviation above the mean. Heatmaps of Z-scores were generated using the ComplexHeatmap package [88]. The same data were used for the analysis of hierarchical clustering. Hierarchical clustering was performed with the pvclust package [89] using Pearson’s correlation coefficient [90]. Cluster probabilities were calculated via a multiscale bootstrap with a total of 1000 iterations. A cluster probability is a percentage which indicates how strong the cluster is supported by data. One-way ANOVA was used to calculate any significant differences (at P = 0.05) in cell measurements between the 14 sampled stages of the SE process, followed by a Tukey test as post-hoc. Similarly, a Student t-test was used to compare cell measurements in embryogenic (EC) and non-embryogenic calli (NEC). Normality of distribution and equality of variance were verified prior to these tests. Concerning hormone content, first, the mean of values of the different sampled stages was calculated for each developmental phase then a Kruskal-Wallis test was used to calculate any significant differences (at P = 0.05) in mean hormone levels between phases, followed by a Dunn test as a post-hoc (dunn.test package). A non-parametric two-by-two Wilcoxon mean comparison test was used to assess significant differences (at P = 0.05) in hormone content between the four phase switches and between EC and NEC. Highlighted metabolic pathways over the four switches were identified based on an enrichment analysis using Metaboanalyst [91] in significantly over-accumulated and under-accumulated metabolites (Z-score >1 or <−1).

5. Conclusions

This first global analysis of SE metabolomics, applied on coffee, one of themodel tree species, showed that metabolomics provides a powerful approach to investigate global metabolite patterns during the SE process. This approach helped to clearly divide the 14 sampled stages of the SE process into five important phases (Leaf, Dedifferentiation, Callus, Redifferentiation and Embryo) leading to the identification of four key developmental phase switches, which are strategic for the whole biological efficiency of embryo regeneration. This global analysis showed that metabolites provide a specific signature for each developmental phase and bring us rich information on cell fate, as some of the sampled stages were undistinguishable by conventional morphological and histological studies (e.g., the first dedifferentiation and redifferentiation events). A number of metabolic markers of the embryogenic state were identified and can be directly used as targets to pilot the optimization of the composition of the culture media. This global metabolomics analysis brings first insights to unravel the metabolic and hormonal mechanisms taking place during SE and will be combined with a transcriptomic approach we are carrying on the same sampled stages in order to give a much clearer understanding of the intimate mechanisms governing totipotency and embryogenesis. This study represents a starting point for optimizing coffee SE protocols in a rational way, putting an end to thirty years of empirical research. These findings should be informative and useful to a wide range of plant species, offering unprecedented perspectives in plant micropropagation.

Supplementary Materials

Author Contributions

H.E., B.B. and D.C. designed the research. D.B., F.G. and R.A. established tissue culture protocols. M.L., C.C., E.G. and R.A. contributed to material sampling strategy. J.K., A.E., L.L., F.M.-S. and R.A. contributed to primary metabolite analysis. C.C., C.A. and R.A. contributed to starch and secondary metabolite analysis. J.-L.V., G.C., S.L., E.D. and R.A. contributed to cell imaging and histological analysis. R.A and B.B. performed the statistical analysis. R.A. and H.E. wrote the draft of the manuscript and all authors revised it.

Funding

R.A. benefits from a Ph.D. grant and funding from Nestlé and CIRAD.

Acknowledgments

We thank the imaging facility MRI, which is part of the UMS BioCampus Montpellier and a member of the national infrastructure France-BioImaging, supported by the French National Research Agency (ANR-10-INBS-04).

Conflicts of Interest

The authors declare no conflict of interest.

Abbreviations

2,4-D2,4-Dichlorophenoxyacetic acid
2-iPN6-(2-Isopentenyl) adenine
6-BA 6-Benzylaminopurine
ABAcis-Abscisic acid
ABAGEABA glucose ester
ACC1-Aminocyclopropane-1-carboxylic acid
BSTFAN,O-Bis(trimethylsilyl)trifluoroacetamide
CQACaffeoylquinic acid
DADPhotodiode array detector
DWDry weight
ECEmbryogenic callus
FQAFeruloylquinic acid
GC–EI–TOF/MSGas chromatography-electron impact ionization-time of flight/mass spectrometry
GC-MSGas chromatography–mass spectrometry
HPLCHigh-performance liquid chromatography
IAAIndole-3-acetic acid
IBAIndole 3-butyric acid
iPIsopentenyladenine
KEGGKyoto Encyclopedia of Genes and Genomes
LC-MSLiquid chromatography–mass spectrometry
MeOHMethanol
MSMurashige and Skoog
N/C ratioNucleocytoplasmic ratio
NECNon-embryogenic callus
PCAPrincipal Component Analysis
PEMsPro-embryogenic masses
SESomatic embryogenesis
TCATricarboxylic acid
UPLC-ESI–MS/MSUltra-performance liquid chromatography-electrospray tandem mass spectrometry
W/L ratioWidth-to-length ratio
ZZeatin (cis- and trans-)
ZRZeatin riboside (cis- and trans-)

References

  1. Verdeil, J.-L.; Alemanno, L.; Niemenak, N.; Tranbarger, T.J. Pluripotent versus totipotent plant stem cells: Dependence versus autonomy? Trends Plant Sci. 2007, 12, 245–252. [Google Scholar] [CrossRef]
  2. Ikeuchi, M.; Iwase, A.; Rymen, B.; Harashima, H.; Shibata, M.; Ohnuma, M.; Breuer, C.; Morao, A.K.; de Lucas, M.; De Veylder, L.; et al. PRC2 represses dedifferentiation of mature somatic cells in Arabidopsis. Nat. Plants 2015, 1, 15089. [Google Scholar] [CrossRef]
  3. Zeng, F.; Zhang, X.; Jin, S.; Cheng, L.; Liang, S.; Hu, L.; Guo, X.; Nie, Y.; Cao, J. Chromatin reorganization and endogenous auxin/cytokinin dynamic activity during somatic embryogenesis of cultured cotton cell. Plant Cell Tissue Organ Cult. 2007, 90, 63–70. [Google Scholar] [CrossRef]
  4. Reinert, J. Morphogenese und ihre Kontrolle an Gewebekulturen aus Carotten. Naturwissenschaften 1958, 45, 344–345. [Google Scholar] [CrossRef]
  5. Steward, F.C.; Mapes, M.O.; Mears, K. Growth and Organized Development of Cultured Cells. II. Organization in Cultures Grown from Freely Suspended Cells. Am. J. Bot. 1958, 45, 705–708. [Google Scholar] [CrossRef]
  6. Yang, X.; Zhang, X.; Yuan, D.; Jin, F.; Zhang, Y.; Xu, J. Transcript profiling reveals complex auxin signalling pathway and transcription regulation involved in dedifferentiation and redifferentiation during somatic embryogenesis in cotton. BMC Plant Biol. 2012, 12, 110. [Google Scholar] [CrossRef]
  7. Indoliya, Y.; Tiwari, P.; Chauhan, A.S.; Goel, R.; Shri, M.; Bag, S.K.; Chakrabarty, D. Decoding regulatory landscape of somatic embryogenesis reveals differential regulatory networks between japonica and indica rice subspecies. Sci. Rep. 2016, 6, 23050. [Google Scholar] [CrossRef]
  8. Gaj, M.D.; Zhang, S.; Harada, J.J.; Lemaux, P.G. Leafy cotyledon genes are essential for induction of somatic embryogenesis of Arabidopsis. Planta 2005, 222, 977–988. [Google Scholar] [CrossRef]
  9. Lelu-Walter, M.-A.; Thompson, D.; Harvengt, L.; Sanchez, L.; Toribio, M.; Pâques, L.E. Somatic embryogenesis in forestry with a focus on Europe: State-of-the-art, benefits, challenges and future direction. Tree Genet. Genomes 2013, 9, 883–899. [Google Scholar] [CrossRef]
  10. Etienne, H. Somatic embryogenesis protocol: Coffee (Coffea arabica L. and C. canephora P.). In Protocols for Somatic Embryogenesis in Woody Plants; Jain, S.M., Gupta, P.K., Eds.; Springer: Dordrecht, The Netherlands, 2005; pp. 167–179. [Google Scholar]
  11. Maximova, S.N.; Alemanno, L.; Young, A.; Ferriere, N.; Traore, A.; Guiltinan, M.J. Efficiency, genotypic variability, and cellular origin of primary and secondary somatic embryogenesis of Theobroma cacao L. In Vitro Cell. Dev. Biol. Plant 2002, 38, 252–259. [Google Scholar] [CrossRef]
  12. Montalbán, I.A.; De Diego, N.; Moncaleán, P. Enhancing initiation and proliferation in radiata pine (Pinus radiata D. Don) somatic embryogenesis through seed family screening, zygotic embryo staging and media adjustments. Acta Physiol. Plant. 2012, 34, 451–460. [Google Scholar] [CrossRef]
  13. Corredoira, E.; Ballester, A.; Ibarra, M.; Vieitez, A.M. Induction of somatic embryogenesis in explants of shoot cultures established from adult Eucalyptus globulus and E. saligna × E. maidenii trees. Tree Physiol. 2015, 35, 678–690. [Google Scholar] [CrossRef]
  14. Corredoira, E.; Valladares, S.; Vieitez, A.M. Morphohistological analysis of the origin and development of somatic embryos from leaves of mature Quercus robur. In Vitro Cell. Dev. Biol. Plant 2006, 42, 525–533. [Google Scholar] [CrossRef]
  15. Ribas, A.F.; Dechamp, E.; Champion, A.; Bertrand, B.; Combes, M.-C.; Verdeil, J.-L.; Lapeyre, F.; Lashermes, P.; Etienne, H. Agrobacterium-mediated genetic transformation of Coffea arabica (L.) is greatly enhanced by using established embryogenic callus cultures. BMC Plant Biol. 2011, 11, 92. [Google Scholar] [CrossRef]
  16. Ikeuchi, M.; Ogawa, Y.; Iwase, A.; Sugimoto, K. Plant regeneration: Cellular origins and molecular mechanisms. Development 2016, 143, 1442–1451. [Google Scholar] [CrossRef]
  17. Boutilier, K.; Angenent, G.C.; Castan, M.S.; Hui, L. Haploid Embryogenesis. Patent US20160212956A1, 28 July 2016. [Google Scholar]
  18. Yang, X.; Zhang, X. Regulation of Somatic Embryogenesis in Higher Plants. Crit. Rev. Plant Sci. 2010, 29, 36–57. [Google Scholar] [CrossRef]
  19. Jayasankar, S.; Bondada, B.R.; Li, Z.; Gray, D.J. Comparative Anatomy and Morphology of Vitis vinifera (Vitaceae) Somatic Embryos from Solid- and Liquid-Culture-Derived Proembryogenic Masses. Am. J. Bot. 2003, 90, 973–979. [Google Scholar] [CrossRef]
  20. Raghavan, V. Role of 2,4-dichlorophenoxyacetic acid (2,4-D) in somatic embryogenesis on cultured zygotic embryos of Arabidopsis: Cell expansion, cell cycling, and morphogenesis during continuous exposure of embryos to 2,4-D. Am. J. Bot. 2004, 91, 1743–1756. [Google Scholar] [CrossRef]
  21. Florez, S.L.; Erwin, R.L.; Maximova, S.N.; Guiltinan, M.J.; Curtis, W.R. Enhanced somatic embryogenesis in Theobroma cacao using the homologous BABY BOOM transcription factor. BMC Plant Biol. 2015, 15, 121. [Google Scholar] [CrossRef]
  22. Campos, N.A.; Panis, B.; Carpentier, S.C. Somatic Embryogenesis in Coffee: The Evolution of Biotechnology and the Integration of Omics Technologies Offer Great Opportunities. Front. Plant Sci. 2017, 8, 1460. [Google Scholar] [CrossRef] [Green Version]
  23. Bonga, J.M.; Klimaszewska, K.K.; von Aderkas, P. Recalcitrance in clonal propagation, in particular of conifers. Plant Cell Tissue Organ Cult. 2010, 100, 241–254. [Google Scholar] [CrossRef]
  24. Etienne, H.; Breton, D.; Breitler, J.-C.; Bertrand, B.; Déchamp, E.; Awada, R.; Marraccini, P.; Léran, S.; Alpizar, E.; Campa, C.; et al. Coffee Somatic Embryogenesis: How Did Research, Experience Gained and Innovations Promote the Commercial Propagation of Elite Clones from the Two Cultivated Species? Front. Plant Sci. 2018, 9, 1630. [Google Scholar] [CrossRef]
  25. Aguilar-Hernández, V.; Loyola-Vargas, V.M. Advanced Proteomic Approaches to Elucidate Somatic Embryogenesis. Front. Plant Sci. 2018, 9, 1658. [Google Scholar] [CrossRef] [Green Version]
  26. Pais, M.S. Somatic Embryogenesis Induction in Woody Species: The Future After OMICs Data Assessment. Front. Plant Sci. 2019, 10, 240. [Google Scholar] [CrossRef] [Green Version]
  27. Fiehn, O.; Kopka, J.; Dörmann, P.; Altmann, T.; Trethewey, R.N.; Willmitzer, L. Metabolite profiling for plant functional genomics. Nat. Biotechnol. 2000, 18, 1157–1161. [Google Scholar] [CrossRef]
  28. Businge, E.; Brackmann, K.; Moritz, T.; Egertsdotter, U. Metabolite profiling reveals clear metabolic changes during somatic embryo development of Norway spruce (Picea abies). Tree Physiol. 2012, 32, 232–244. [Google Scholar] [CrossRef] [Green Version]
  29. Robinson, A.R.; Dauwe, R.; Ukrainetz, N.K.; Cullis, I.F.; White, R.; Mansfield, S.D. Predicting the regenerative capacity of conifer somatic embryogenic cultures by metabolomics. Plant Biotechnol. J. 2009, 7, 952–963. [Google Scholar] [CrossRef]
  30. Dobrowolska, I.; Businge, E.; Abreu, I.N.; Moritz, T.; Egertsdotter, U. Metabolome and transcriptome profiling reveal new insights into somatic embryo germination in Norway spruce (Picea abies). Tree Physiol. 2017, 37, 1752–1766. [Google Scholar] [CrossRef]
  31. Vondrakova, Z.; Dobrev, P.I.; Pesek, B.; Fischerova, L.; Vagner, M.; Motyka, V. Profiles of Endogenous Phytohormones Over the Course of Norway Spruce Somatic Embryogenesis. Front. Plant Sci. 2018, 9, 1283. [Google Scholar] [CrossRef]
  32. Gautier, F.; Label, P.; Eliášová, K.; Leplé, J.-C.; Motyka, V.; Boizot, N.; Vondráková, Z.; Malbeck, J.; Trávníčková, A.; Le Metté, C.; et al. Cytological, Biochemical and Molecular Events of the Embryogenic State in Douglas-fir (Pseudotsuga menziesii [Mirb.]). Front. Plant Sci. 2019, 10, 118. [Google Scholar] [CrossRef] [Green Version]
  33. Bertrand, B.; Montagnon, C.; Georget, F.; Charmetant, P.; Etienne, H. Création et diffusion de variétés de caféiers Arabica: Quelles innovations variétales? Cah. Agric. 2012, 21, 77–88. [Google Scholar]
  34. Ducos, J.P.; Labbe, G.; Lambot, C.; Pétiard, V. Pilot scale process for the production of pre-germinated somatic embryos of selected robusta (Coffea canephora) clones. In Vitro Cell. Dev. Biol. Plant 2007, 43, 652–659. [Google Scholar] [CrossRef]
  35. Etienne, H.; Bertrand, B.; Montagnon, C.; Bodadilla Landey, R.; Dechamp, E.; Jourdan, I.; Alpizar, E.; Malo, E.; Georget, F. Un exemple de transfert de technologie réussi dans le domaine de la micropropagation: La multiplication de Coffea arabica par embryogenèse somatique. Cah. Agric. 2012, 21, 115–124. [Google Scholar]
  36. Ducos, J.P.; Alenton, R.; Reano, J.F.; Kanchanomai, C.; Deshayes, A.; Pétiard, V. Agronomic performance of Coffea canephora P. trees derived from large-scale somatic embryo production in liquid medium. Euphytica 2003, 131, 215–223. [Google Scholar] [CrossRef]
  37. Landey, R.B.; Cenci, A.; Georget, F.; Bertrand, B.; Camayo, G.; Dechamp, E.; Herrera, J.C.; Santoni, S.; Lashermes, P.; Simpson, J.; et al. High Genetic and Epigenetic Stability in Coffea arabica Plants Derived from Embryogenic Suspensions and Secondary Embryogenesis as Revealed by AFLP, MSAP and the Phenotypic Variation Rate. PLoS ONE 2013, 8, e56372. [Google Scholar]
  38. Georget, F.; Courtel, P.; Garcia, E.M.; Hidalgo, M.; Alpizar, E.; Breitler, J.-C.; Bertrand, B.; Etienne, H. Somatic embryogenesis-derived coffee plantlets can be efficiently propagated by horticultural rooted mini-cuttings: A boost for somatic embryogenesis. Sci. Hortic. 2017, 216, 177–185. [Google Scholar] [CrossRef] [Green Version]
  39. Verdeil, J.-L.; Hocher, V.; Huet, C.; Grosdemange, F.; Escoute, J.; Ferrière, N.; Nicole, M. Ultrastructural changes in coconut calli associated with the acquisition of embryogenic competence. Ann. Bot. 2001, 88, 9–18. [Google Scholar] [CrossRef]
  40. Talamond, P.; Verdeil, J.-L.; Conéjéro, G. Secondary metabolite localization by autofluorescence in living plant cells. Molecules 2015, 20, 5024–5037. [Google Scholar] [CrossRef]
  41. Díaz-Sala, C. Molecular Dissection of the Regenerative Capacity of Forest Tree Species: Special Focus on Conifers. Front. Plant Sci. 2019, 9, 1943. [Google Scholar] [CrossRef] [Green Version]
  42. Sugimoto, K.; Xu, L.; Paszkowski, U.; Hayashi, M. Multifaceted Cellular Reprogramming at the Crossroads Between Plant Development and Biotic Interactions. Plant Cell Physiol. 2018, 59, 651–655. [Google Scholar] [CrossRef] [Green Version]
  43. Tao, L.; Zhao, Y.; Wu, Y.; Wang, Q.; Yuan, H.; Zhao, L.; Guo, W.; You, X. Transcriptome profiling and digital gene expression by deep sequencing in early somatic embryogenesis of endangered medicinal Eleutherococcus senticosus Maxim. Gene 2016, 578, 17–24. [Google Scholar] [CrossRef] [PubMed]
  44. Trontin, J.-F.; Klimaszewska, K.; Morel, A.; Hargreaves, C.; Lelu-Walter, M.-A. Molecular Aspects of Conifer Zygotic and Somatic Embryo Development: A Review of Genome-Wide Approaches and Recent Insights. Methods Mol. Biol. 2016, 1359, 167–207. [Google Scholar] [PubMed]
  45. Nowak, K.; Wójcikowska, B.; Gaj, M.D. ERF022 impacts the induction of somatic embryogenesis in Arabidopsis through the ethylene-related pathway. Planta 2015, 241, 967–985. [Google Scholar] [CrossRef] [PubMed]
  46. Zavattieri, M.A.; Frederico, A.M.; Lima, M.; Sabino, R.; Arnholdt-Schmitt, B. Induction of somatic embryogenesis as an example of stress-related plant reactions. Electro. J. Biotech. 2010, 13, 12–13. [Google Scholar] [CrossRef]
  47. Nic-Can, G.I.; Galaz-Ávalos, R.M.; De-la-Peña, C.; Alcazar-Magaña, A.; Wrobel, K.; Loyola-Vargas, V.M. Somatic Embryogenesis: Identified Factors that Lead to Embryogenic Repression. A Case of Species of the Same Genus. PLoS ONE 2015, 10, e0126414. [Google Scholar] [CrossRef] [PubMed]
  48. Gomez-Garay, A.; Lopez, J.A.; Camafeita, E.; Bueno, M.A.; Pintos, B. Proteomic perspective of Quercus suber somatic embryogenesis. J. Proteom. 2013, 93, 314–325. [Google Scholar] [CrossRef] [PubMed]
  49. De Carvalho Silva, R.; Carmo, L.S.T.; Luis, Z.G.; Silva, L.P.; Scherwinski-Pereira, J.E.; Mehta, A. Proteomic identification of differentially expressed proteins during the acquisition of somatic embryogenesis in oil palm (Elaeis guineensis Jacq.). J. Proteom. 2014, 104, 112–127. [Google Scholar] [CrossRef]
  50. Xu, C.; Cao, H.; Xu, E.; Zhang, S.; Hu, Y. Genome-Wide Identification of Arabidopsis LBD29 Target Genes Reveals the Molecular Events behind Auxin-Induced Cell Reprogramming during Callus Formation. Plant Cell Physiol. 2018, 59, 744–755. [Google Scholar] [CrossRef]
  51. Gatica-Arias, A.M.; Arrieta-Espinoza, G.; Espinoza Esquivel, A.M. Plant regeneration via indirect somatic embryogenesis and optimisation of genetic transformation in Coffea arabica L. cvs. Caturra and Catuaí. Electron. J. Biotechnol. 2008, 11, 1–12. [Google Scholar] [CrossRef]
  52. Pádua, M.S.; Paiva, L.V.; Silva, L.C.D.; Livramento, K.G.D.; Alves, E.; Castro, A.H.F. Morphological characteristics and cell viability of coffee plants calli. Ciênc. Rural 2014, 44, 660–665. [Google Scholar] [CrossRef] [Green Version]
  53. Silva, A.T.; Barduche, D.; do Livramento, K.G.; Ligterink, W.; Paiva, L.V. Characterization of a Putative Serk-Like Ortholog in Embryogenic Cell Suspension Cultures of Coffea arabica L. Plant Mol. Biol. Rep. 2014, 32, 176–184. [Google Scholar] [CrossRef]
  54. Neves, N.; Segura-Nieto, M.; Blanco, M.A.; Sánchez, M.; González, A.; González, J.L.; Castillo, R. Biochemical characterization of embryogenic and non-embryogenic calluses of sugarcane. In Vitro Cell. Dev. Biol. Plant 2003, 39, 343–345. [Google Scholar] [CrossRef]
  55. Jeyaseelan, M.; Rao, M.V. Biochemical studies of embryogenic and non-embryogenic callus of Cardiospermum halicacabum L. Indian J. Exp. Biol. 2005, 43, 555–560. [Google Scholar]
  56. Vestman, D.; Larsson, E.; Uddenberg, D.; Cairney, J.; Clapham, D.; Sundberg, E.; von Arnold, S. Important processes during differentiation and early development of somatic embryos of Norway spruce as revealed by changes in global gene expression. BMC Proc. 2011, 5, P78. [Google Scholar] [CrossRef]
  57. Guillou, C.; Fillodeau, A.; Brulard, E.; Breton, D.; De Faria Maraschin, S.; Verdier, D.; Simon, M.; Ducos, J.-P. Indirect somatic embryogenesis of Theobroma cacao L. in liquid medium and improvement of embryo-to-plantlet conversion rate. In Vitro Cell. Dev. Biol. Plant 2018, 54, 377–391. [Google Scholar] [CrossRef] [PubMed]
  58. Liang, X.; Zhang, L.; Natarajan, S.K.; Becker, D.F. Proline mechanisms of stress survival. Antioxid. Redox Signal. 2013, 19, 998–1011. [Google Scholar] [CrossRef] [PubMed]
  59. Magnani, E.; Jiménez-Gómez, J.M.; Soubigou-Taconnat, L.; Lepiniec, L.; Fiume, E. Profiling the onset of somatic embryogenesis in Arabidopsis. BMC Genom. 2017, 18, 998. [Google Scholar] [CrossRef]
  60. Von Aderkas, P.; Lelu, M.-A.; Label, P. Plant growth regulator levels during maturation of larch somatic embryos. Plant Physiol. Biochem. 2001, 39, 495–502. [Google Scholar] [CrossRef]
  61. Su, Y.-H.; Liu, Y.-B.; Zhang, X.-S. Auxin–Cytokinin Interaction Regulates Meristem Development. Mol. Plant 2011, 4, 616–625. [Google Scholar] [CrossRef]
  62. White, P.R. Potentially Unlimited Growth of Excised Plant Callus in an Artificial Nutrient. Am. J. Bot. 1939, 26, 59–64. [Google Scholar] [CrossRef]
  63. Skoog, F.; Miller, C.O. Chemical regulation of growth and organ formation in plant tissues cultured in vitro. Symp. Soc. Exp. Biol. 1957, 11, 118–130. [Google Scholar] [PubMed]
  64. Bourgaud, F.; Gravot, A.; Milesi, S.; Gontier, E. Production of plant secondary metabolites: A historical perspective. Plant Sci. 2001, 161, 839–851. [Google Scholar] [CrossRef]
  65. Guan, Y.; Li, S.-G.; Fan, X.-F.; Su, Z.-H. Application of Somatic Embryogenesis in Woody Plants. Front. Plant Sci. 2016, 7, 938. [Google Scholar] [CrossRef] [PubMed]
  66. Ladygin, V.G.; Bondarev, N.I.; Semenova, G.A.; Smolov, A.A.; Reshetnyak, O.V.; Nosov, A.M. Chloroplast ultrastructure, photosynthetic apparatus activities and production of steviol glycosides in Stevia rebaudiana in vivo and in vitro. Biol. Plant. 2008, 52, 9–16. [Google Scholar] [CrossRef]
  67. Ali, A.M.A.; El-Nour, M.E.M.; Yagi, S.M. Total phenolic and flavonoid contents and antioxidant activity of ginger (Zingiber officinale Rosc.) rhizome, callus and callus treated with some elicitors. J. Genet. Eng. Biotechnol. 2018, 16, 677–682. [Google Scholar] [CrossRef] [PubMed]
  68. Ge, F.; Hu, H.; Huang, X.; Zhang, Y.; Wang, Y.; Li, Z.; Zou, C.; Peng, H.; Li, L.; Gao, S.; et al. Metabolomic and Proteomic Analysis of Maize Embryonic Callus induced from immature embryo. Sci. Rep. 2017, 7, 1004. [Google Scholar] [CrossRef]
  69. Svobodová, H.; Albrechtová, J.; Kumstýřová, L.; Lipavská, H.; Vágner, M.; Vondráková, Z. Somatic embryogenesis in Norway spruce: Anatomical study of embryo development and influence of polyethylene glycol on maturation process. Plant Physiol. Bioch. 1999, 37, 209–221. [Google Scholar] [CrossRef]
  70. Fischerova, L.; Fischer, L.; Vondrakova, Z.; Vagner, M. Expression of the gene encoding transcription factor PaVP1 differs in Picea abies embryogenic lines depending on their ability to develop somatic embryos. Plant Cell Rep. 2008, 27, 435–441. [Google Scholar] [CrossRef]
  71. Iraqi, D.; Tremblay, F.M. Analysis of carbohydrate metabolism enzymes and cellular contents of sugars and proteins during spruce somatic embryogenesis suggests a regulatory role of exogenous sucrose in embryo development. J. Exp. Bot. 2001, 52, 2301–2311. [Google Scholar] [CrossRef] [Green Version]
  72. Dodeman, V.L.; Ducreux, G.; Kreis, M. Zygotic embryogenesis versus somatic embryogenesis. J. Exp. Bot. 1997, 48, 1493–1509. [Google Scholar]
  73. Pedroso, M.C.; Primikirios, N.; Roubelakis-Angelakis, K.A.; Pais, M.S. Free and conjugated polyamines in embryogenic and non-embryogenic leaf regions of camellia leaves before and during direct somatic embryogenesis. Physiol. Plant. 1997, 101, 213–219. [Google Scholar] [CrossRef]
  74. Grace, S.C.; Logan, B.A. Energy dissipation and radical scavenging by the plant phenylpropanoid pathway. Philos. Trans. R. Soc. Lond. B Biol. Sci. 2000, 355, 1499–1510. [Google Scholar] [CrossRef] [Green Version]
  75. Gill, S.S.; Tuteja, N. Reactive oxygen species and antioxidant machinery in abiotic stress tolerance in crop plants. Plant Physiol. Biochem. 2010, 48, 909–930. [Google Scholar] [CrossRef] [PubMed]
  76. Ikeda-Iwai, M.; Umehara, M.; Satoh, S.; Kamada, H. Stress-induced somatic embryogenesis in vegetative tissues of Arabidopsis thaliana. Plant J. 2003, 34, 107–114. [Google Scholar] [CrossRef] [PubMed]
  77. Dethloff, F.; Erban, A.; Orf, I.; Alpers, J.; Fehrle, I.; Beine-Golovchuk, O.; Schmidt, S.; Schwachtje, J.; Kopka, J. Profiling methods to identify cold-regulated primary metabolites using gas chromatography coupled to mass spectrometry. Methods Mol. Biol. 2014, 1166, 171–197. [Google Scholar]
  78. Erban, A.; Schauer, N.; Fernie, A.R.; Kopka, J. Nonsupervised construction and application of mass spectral and retention time index libraries from time-of-flight gas chromatography-mass spectrometry metabolite profiles. Methods Mol. Biol. 2007, 358, 19–38. [Google Scholar] [PubMed]
  79. Luedemann, A.; Strassburg, K.; Erban, A.; Kopka, J. TagFinder for the quantitative analysis of gas chromatography—Mass spectrometry (GC-MS)-based metabolite profiling experiments. Bioinformatics 2008, 24, 732–737. [Google Scholar] [CrossRef]
  80. Kopka, J.; Schauer, N.; Krueger, S.; Birkemeyer, C.; Usadel, B.; Bergmüller, E.; Dörmann, P.; Weckwerth, W.; Gibon, Y.; Stitt, M.; et al. [email protected]: The Golm Metabolome Database. Bioinformatics 2005, 21, 1635–1638. [Google Scholar] [CrossRef]
  81. Strehmel, N.; Hummel, J.; Erban, A.; Strassburg, K.; Kopka, J. Retention index thresholds for compound matching in GC–MS metabolite profiling. J. Chromatogr. B 2008, 871, 182–190. [Google Scholar] [CrossRef]
  82. Campa, C.; Urban, L.; Mondolot, L.; Fabre, D.; Roques, S.; Lizzi, Y.; Aarrouf, J.; Doulbeau, S.; Breitler, J.-C.; Letrez, C.; et al. Juvenile Coffee Leaves Acclimated to Low Light Are Unable to Cope with a Moderate Light Increase. Front. Plant Sci. 2017, 8, 1126. [Google Scholar] [CrossRef]
  83. N.R.C. Canada. Plant Hormone Profiling. Available online: https://nrc.canada.ca/en/research-development/products-services/technical-advisory-services/plant-hormone-profiling (accessed on 20 June 2019).
  84. Lulsdorf, M.M.; Yuan, H.Y.; Slater, S.M.H.; Vandenberg, A.; Han, X.; Zaharia, L.I.; Abrams, S.R. Endogenous hormone profiles during early seed development of C. arietinum and C. anatolicum. Plant Growth Regul. 2013, 71, 191–198. [Google Scholar] [CrossRef]
  85. Chauvaux, N.; Van Dongen, W.; Esmans, E.L.; Van Onckelen, H.A. Quantitative analysis of 1-aminocyclopropane-1-carboxylic acid by liquid chromatography coupled to electrospray tandem mass spectrometry. J. Chromatogr. A 1997, 775, 143–150. [Google Scholar] [CrossRef]
  86. R Core Team. R: A Language and Environment for Statistical Computing; R Foundation for Statistical Computing: Vienna, Austria, 2019. [Google Scholar]
  87. Cheadle, C.; Vawter, M.P.; Freed, W.J.; Becker, K.G. Analysis of Microarray Data Using Z Score Transformation. J. Mol. Diagn. 2003, 5, 73–81. [Google Scholar] [CrossRef] [Green Version]
  88. Gu, Z.; Eils, R.; Schlesner, M. Complex heatmaps reveal patterns and correlations in multidimensional genomic data. Bioinformatics 2016, 32, 2847–2849. [Google Scholar] [CrossRef] [PubMed] [Green Version]
  89. CRAN—Package Pvclust. Available online: https://cran.r-project.org/web/packages/pvclust/index.html (accessed on 20 June 2019).
  90. Suzuki, R.; Shimodaira, H. Pvclust: An R package for assessing the uncertainty in hierarchical clustering. Bioinformatics 2006, 22, 1540–1542. [Google Scholar] [CrossRef] [PubMed]
  91. MetaboAnalyst. Available online: https://www.metaboanalyst.ca/MetaboAnalyst/faces/upload/Enrich UploadView.xhtml (accessed on 19 August 2019).
Figure 1. Collection of samples from leaf explant till embryo development covering 14 key sampled stages of the Arabica SE process: leaves from greenhouse plants (L1), explants during dedifferentiation [0 h (L2), 1 week (D1), 2 weeks (D2), 5 weeks (D3)], compact primary callus obtained 3 months after induction (C1), embryogenic callus obtained 7 months after induction (C2), established cell clusters obtained after 4 months in proliferation medium (C3), early redifferentiation from cell clusters [1 week in DIF medium without reducing cell density (R1), 24 h in DIF medium after reducing cell density (R2), 72 h (R3), 10 d (R4)], globular embryos (E1) and torpedo-shaped embryos (E2). Non-embryogenic callus (NEC) was also sampled at the same time as the embryogenic callus (C2). Images were taken using an Olympus E-5 digital camera mounted on an Olympus SZX7 stereomicroscope. The stereomicroscope was not used for (L1). Two types of calli can be seen in (D3): an organized yellowish callus (1) and a whitish spongy callus (2).
Ijms 20 04665 g001
Figure 2. Characterization of 15 key sampled stages throughout the Arabica SE process at a histological (A) and cellular level (B). Sampled stages correspond to: leaves from greenhouse plants (L1), explants during dedifferentiation [0 h (L2), 1 week (D1), 2 weeks (D2), 5 weeks (D3)], compact primary callus obtained 3 months after induction (C1), embryogenic callus obtained 7 months after induction (C2), established cell clusters obtained after 4 months in liquid proliferation medium (C3), pro-embryogenic masses [1 week in redifferentiation medium after auxin withdrawal (R1), 24 h in redifferentiation medium after reducing cell density (R2), 72 h (R3), 10 days (R4)], globular embryos (E1) and torpedo-shaped embryos (E2). An additional stage, the non-embryogenic callus (NEC), was also sampled at the same time as the embryogenic callus (C2) and obtained in the same culture conditions. Sections were treated with 1% periodic acid and stained with Schiff reagent (colors polysaccharides in purple) and Naphthol Blue Black (colors soluble proteins in blue). Images were taken in bright field. The scale bar is set to 50 µm in (A) and 10 µm in (B). White arrows indicate: cw: cell wall, e: embryoid structure, emc: emerging callus, le: lower epidermis, m: mucilaginous coating, n: nucleus, nl: nucleolus, p: protodermis, pm: palisade mesophyll cells, rp: root pole, s: starch, sm: spongy mesophyll cells, sp: shoot pole, tcw: thickened outer cell wall, ue: upper-epidermis, v: vacuole.
Ijms 20 04665 g002
Figure 3. Profiling primary and secondary metabolites during 14 key sampled stages of the Arabica somatic embryogenesis process. (A) Heatmap generated from the Z-score values of a total of 92 primary metabolites and 12 secondary metabolites detected. Rows correspond to metabolites and columns to the sampled stages. Positive Z-score values are shown in blue and negative values in grey. (B) Hierarchical clustering of the 14 sampled stages according to the similarities in their metabolic profiles. The clustering was performed using Pearson’s correlation coefficient. Cluster probabilities were calculated via a multiscale bootstrap with a total of 1000 iterations. Clustering yielded 5 major nodes: Leaf, Dedifferentiation, Callus, Redifferentiation and Embryo.
Ijms 20 04665 g003
Figure 4. Chlorogenic acid localization in embryogenic cell clusters (C3) and during embryo redifferentiation after 1 day (R2), 3 days (R3), 10 days (R4) and 3 weeks (E1) in redifferentiation medium after cell density reduction. Protuberance of newly generated embryos emerge after 10 days in redifferentiation medium and globular-shaped embryos are obtained after 3 weeks. For chlorogenic acid localization, fresh samples were mounted on a glass slide in a drop of water and observed using a Zeiss LSM880 multiphoton microscope, equipped with a Chameleon Ultra II laser. Excitation wavelength was set to 720 nm and emission was observed with a band-pass filter 386–502 nm (blue). The presence and accumulation of total chlorogenic acids during embryo redifferentiation was confirmed by multiphoton microscopy combined with emission spectral analysis of total chlorogenic acids (Figure S2). The scale bar is set to 100 µm.
Ijms 20 04665 g004
Figure 5. Metabolic pathways and hormone dynamics during the four main developmental phase switches. The four phase switches are: the leaf explant-to-dedifferentiated cell switch occurring after one week in induction medium, the dedifferentiated cells-to-established primary callus cells switch occurring three months after induction, the embryogenic cell clusters-to-pro-embryogenic masses (PEMs) switch occurring after one week in redifferentiation medium, and the PEMs-to-embryonic cells switch occurring after four weeks in redifferentiation medium. Metabolic pathways were identified based on an enrichment in significantly over-accumulated and under-accumulated metabolites, i.e., Z-score > 1 and Z-score < −1, respectively. All presented hormones differ significantly in their levels according to a two-by-two Wilcoxon mean comparison test (P < 0.05). Values represent mean of ratios in hormone levels of independent replicates between a sampled stage and the previous one ± SD.
Ijms 20 04665 g005
Figure 6. Profiling primary and secondary metabolites in embryogenic (EC) and non-embryogenic calli (NEC). Heatmap generated from the Z-score values of a total of 92 primary metabolites and 12 secondary metabolite detected. Rows correspond to metabolites and columns to the type of callus. Positive Z-score values are shown in blue and negative values in grey.
Ijms 20 04665 g006
Table 1. Characteristics of the main represented cell types in each of the 15 key sampled stages of the Arabica SE process.
Cell TypeStageCell Length
(µm)
Cell Width
(µm)
W/L RatioCytoplasm Size
(µm2)
Nucleus Size
(µm2)
N/C RatioCell DivisionStarchProteins
Palisade mesophyll cellsL141.5 ± 1.7 a13.9 ± 2.5 a0.33 ± 0.04 a430 ± 93 a66.5 ± 25 a0.17 ± 0.02 a-++
Palisade mesophyll cellsL238.2 ± 4.1 a13.0 ± 2.0 a0.35 ± 0.01 a440 ± 99 a59.1 ± 17 a0.19 ± 0.03 a-++
Dedifferentiated cellsD133.9 ± 2.5 a22.8 ± 4.0 b0.67 ± 0.08 b647 ± 71 b56.8 ± 7.4 a0.09 ± 0.02 a+++++
Dedifferentiated cellsD232.7 ± 1.8 a22.4 ± 0.7 b0.69 ± 0.02 b681 ± 44 b155 ± 18.3 b0.24 ± 0.04 b+++++
Dedifferentiated cellsD335.8 ± 2.6 a27.2 ± 5.1 b0.76 ± 0.11 b695 ± 91 b55.4 ± 11.3 a0.08 ± 0.03 a++++++
Primary callus cellsC135.9 ± 2.1 a30.6 ± 2.6 b0.85 ± 0.02 b784 ± 56 b114 ± 25.3 b0.19 ± 0.03 a++++
Embryogenic cellsC220.2 ± 1.3 b14.7 ± 0.5 a0.73 ± 0.03 b214 ± 18 c70.7 ± 5.1 a0.33 ± 0.02 b++++++++
Embryogenic cell clustersC323.9 ± 1.0 b12.7 ± 1.1 a0.54 ± 0.06 a223 ± 15 c70.1 ± 10.5 a0.31 ± 0.03 b++++++++++
Pro-embryogenic massesR119.5 ± 2.7 b12.1 ± 0.5 a0.62 ± 0.04 b144 ± 15 c66.3 ± 8.4 a0.45 ± 0.07 b+++++++++
Pro-embryogenic massesR220.2 ± 1.8 b13.9 ± 1.5 a0.69 ± 0.54 b202 ± 23 c65.2 ± 10.8 a0.32 ± 0.02 b+++++++++
Pro-embryogenic massesR318.8 ± 1.3 b12.5 ± 0.3 a0.67 ± 0.03 b165 ± 13 c69.0 ± 15.7 a0.41 ± 0.07 b+++++++++
Pro-embryogenic massesR426.7 ± 1.4 b16.5 ± 1.6 a0.70 ± 0.07 b315 ± 26 c98.7 ± 6.6 a0.31 ± 0.03 b+++++++++
Embryonic cellsE122.5 ± 1.0 b14.5 ± 1.6 a0.64 ± 0.04 b236 ± 24 c24.2 ± 4.2 c0.10 ± 0.01 a+++++++
Embryonic cellsE242.0 ± 1.5 a31.9 ± 0.7 b0.76 ± 0.04 b943 ± 55d88.5 ± 10.3 a0.09 ± 0.01 a++++++
Values represent mean ± SD of 30 cells analyzed for each sampled stage. Stages correspond to: leaves from greenhouse plants (L1), explants during dedifferentiation [0 h (L2), 1 week (D1), 2 weeks (D2), 5 weeks (D3)], compact primary callus obtained 3 months after induction (C1), embryogenic callus obtained 7 months after induction (C2), established cell clusters obtained after 4 months in liquid proliferation medium (C3), pro-embryogenic masses [1 week in redifferentiation medium after auxin withdrawal (R1), 24 h in redifferentiation medium after reducing cell density (R2), 72 h (R3), 10 days (R4)], globular embryos (E1) and torpedo-shaped embryos (E2). W/L ratio corresponds to the mean of ratios between width and length for each cell. N/C ratio corresponds to the mean of ratios between nucleus and cytoplasm for each cell (nucleus-to-cytoplasm ratio). Cell division activity was estimated based on the number of cells in telophase. Starch granules were evidenced by the Schiff reagent and soluble proteins were evidenced by Naphthol Blue Black. Differences between the sampled stages were analysed with a one-way ANOVA test. Data followed by different letters in a same column are significantly different according to the Tukey post-hoc test (P < 0.05).
Table 2. Significantly over-accumulated metabolites in the five developmental phases forming the Arabica SE process.
Metabolic PathwaysDevelopmental Phases of Coffee Somatic Embryogenesis
LeafDedifferentiationCallusRedifferentiationEmbryo
TCA cycle Aconitic acid Aconitic acidFumaric acid
Citric acid Malic acid
Fumaric acid Succinic acid
Glutaric acid, 2-oxo-
Malic acid
Succinic acid
Sugar metabolism Glucose-6-phosphateGlucoseGlucose-6-phosphateGlucose-6-phosphate
Mannose-6-phosphateFructoseFructose-6-phosphateFructose-6-phosphate
MaltoseMaltotrioseMannose-6-phosphateMannose-6-phosphate
SucroseRiboseRiboseStarch
Amino acid metabolismAlanine, beta-Alanine, beta-GlycineLeucineAlanine
Aspartic acidAspartic acidMethionineLysineGlycine
AsparagineProlineProlineLeucine
Glycine Lysine
Glutamine Methionine
Valine Proline
Glutamate
Fatty acid metabolism Hexadecanoic acidGlycerolGlycerol-3-phosphateGlycerol
Octadecanoic acid Glycerol-3-phosphate
Glyceric acid
Polyols Inositol, myo-Inositol, myo-Inositol, myo-
Mannitol
N-compounds Putrescine
Ascorbate and aldarate metabolismGalactonic acidArabinonic acid
Threonic acidGalactaric acid
Galactonic acid
Shikimate pathwayQuinic acidQuinic acid TryptophanTryptophan
Shikimic acidPhenylalanine Caffeic acid
Caffeic acid Benzoic acid
Alkaloid precursors Nicotinic acid Guanosine
Xanthosine Xanthosine
Inosine
AlkaloidsTrigonelline
Theobromine
Caffeine
Phenolic compoundsMangiferin 3-CQA
Catechin 3,5-diCQA
Epicatechin 4-CQA
3-CQA 4,5-diCQA
3,4-diCQA 5-CQA
4-CQA FQA
FQA
All primary and secondary metabolites displaying significant increased values from their respective means across the 14 stages (Z-score > 1) were listed in this table and were classified according to Kyoto Encyclopedia of Genes and Genomes (KEGG) database of metabolic pathways. CQA: caffeoylquinic acid, FQA: feruloylquinic acid, TCA: tricarboxylic acid.
Table 3. Significantly under-accumulated metabolites in the five developmental phases forming the Arabica SE process.
Metabolic PathwaysDevelopmental Phases of Coffee Somatic Embryogenesis
LeafDedifferentiationCallusRedifferentiationEmbryo
TCA cycle Fumaric acid
Glutaric acid, 2-oxo-
Malic acid
Sugar metabolismFructose-6-phosphateGlucoseFructose-6-phosphate Fructose
Glucose-6-phosphateFructoseGlucose-6-phosphate
Mannose-6-phosphateStarchMannose-6-phosphate
Fructose Sucrose
Ribose
Amino acid metabolismLeucineLysineLeucineValine
Lysine Lysine
Valine
Ascorbate and aldarate metabolism Arabinonic acid
Galactonic acid
Threonic acid
PolyolsInositol, myo-
All primary and secondary metabolites displaying significant decreased values from their respective means across the 14 stages (Z-score < −1) were listed in this table and were classified according to KEGG database of metabolic pathways. TCA: tricarboxylic acid.
Table 4. Hormone dynamics during the five main developmental phases of the Arabica SE process.
HormonesDevelopmental Phases of Coffee Somatic Embryogenesis
Leaf >Dedifferentiation >Callus >Redifferentiation >Embryo
ABA583 ± 72 a113 ± 16 b74 ± 12 b70 ± 12 b600 ± 55 a
ABAGE243 ± 45 a121 ± 36 a675 ± 41 b671 ± 77 b1230 ± 103 c
ACC1281 ± 173 a19491 ± 447 b 3063 ± 272 a3179 ± 193 a3065 ± 169 a
IAA34 ± 6 a182 ± 27 b17 ± 7 a60 ± 8 c81 ± 19 c
IBAN.D. a4345 ± 385 bN.D. aN.D. aN.D. a
iPN.D. a4557 ± 441 bN.D. aN.D. aN.D. a
Z2 ± 1 a17 ± 3 b2 ± 1 aN.D. a4 ± 2 b
ZR6 ± 3 a13 ± 3 a22 ± 4 b15 ± 5 a60 ± 6 c
Values represent the mean of hormone levels, expressed in ng/g DW, in the sampled stages forming each of the five phases (Leaf, Dedifferentiation, Callus, Redifferentiation and Embryo) in three independent replicates ± SD. For each hormone, differences in levels between phases were analysed with a Kruskal-Wallis test. Data followed by different letters are significantly different according to Dunn post-hoc test (P < 0.05). Blue color corresponds to an increase in hormone levels between a phase and the previous one (column on the left) while grey color corresponds to a decrease in hormone levels. N.D. stands for not detected. ABA: cis-abscisic acid, ABAGE: ABA glucose ester, IAA: indole-3-acetic acid, IBA: indole 3-butyric acid, iP: isopentenyladenine, Z: zeatin (cis- and trans-), ZR: zeatin riboside (cis- and trans-).
Table 5. Characteristics of the mainly represented cell populations in embryogenic (EC) and non-embryogenic calli (NEC).
Cell TypeStageCell Length
(µm)
Cell Width
(µm)
W/L RatioCytoplasm Size
(µm2)
Nucleus Size
(µm2)
N/C RatioCell DivisionStarchProteins
Embryogenic cellsEC20.2 ± 1.3 a14.7 ± 0.5 a0.73 ± 0.03 a214 ± 18.0 a70.7 ± 5.1 a0.33 ± 0.02 a+++++++
Non-embryogenic cellsNEC69.7 ± 10.7 b41.3 ± 1.6 b0.60 ± 0.08 a2081 ± 386 b364 ± 53 b0.17 ± 0.02 b+++++++
Values represent mean ± SD of 30 cells analyzed for each sampled stage. W/L ratio corresponds to the mean of ratios between each cell width and length. N/C ratio corresponds to the mean of ratios between each cell nucleus and cell size. Cell division activity was estimated on the basis of the number of cells in telophase. Starch reserves and proteins were evidenced by the Schiff reagent and Naphthol Blue Black, respectively. Data followed by different letters are significantly different according to Student t-test (P < 0.05).
Table 6. Over-accumulated and under-accumulated metabolites in embryogenic and non-embryogenic calli.
Metabolic PathwaysOver-Accumulated MetabolitesUnder-Accumulated Metabolites
Embryogenic CallusNon-Embryogenic CallusEmbryogenic CallusNon-Embryogenic Callus
TCA cycle Citric acidFumaric acid
Glutaric acid, 2-oxo-Glutaric acid, 2-oxo-
Malic acidMalic acid
Succinic acid
Sugar metabolismGlucoseStarchFructose-6-phosphateFructose-6-phosphate
FructoseRiboseGlucose-6-phosphateGlucose-6-phosphate
Maltotriose Mannose-6-phosphateMannose-6-phosphate
Ribose
Amino acid metabolismGlycineAlanine, beta-LeucineProline
MethionineGlycineValineValine
ProlineLeucine
Methionine
Fatty acid metabolismGlycerolGlycerol
PolyolsInositol, myo- Inositol, myo-
Ascorbate and aldarate metabolism Arabinonic acidArabinonic acid
Threonic acidThreonic acid
Galactonic acid
All primary and secondary metabolites displaying significant increased values (Z-score > 1) and decreased values (Z-score < −1) between embryogenic callus and non-embryogenic callus, were listed in this table and were classified according to KEGG database of metabolic pathways. TCA: tricarboxylic acid.
Table 7. Hormone levels in embryogenic and non-embryogenic calli.
HormonesEmbryogenic Callus Non-Embryogenic Callus
ABA130 ± 14 a8 ± 2 b
ABAGE1200 ± 84 a24 ± 11 b
ACC3074 ± 96 a3016 ± 161 a
IAA25 ± 6 a29 ± 3 a
IBAN.D. aN.D. a
iPN.D. aN.D. a
Z2 ± 1 aN.D. b
ZR40 ± 5 a10 ± 3 b
Values represent the mean ± SD of 3 independent replicates, expressed in ng/g DW. Non-parametric two-by-two Wilcoxon mean comparison test was used to calculate any significant differences in hormone levels between embryogenic and non-embryogenic calli. Data followed by different letters are significantly different (P < 0.05). Grey color corresponds to a decrease in hormone levels in non-embryogenic calli compared to embryogenic-calli. N.D. stands for not detected. ABA: cis-abscisic acid, ABAGE: ABA glucose ester, IAA: indole-3-acetic acid, IBA: indole 3-butyric acid, iP: isopentenyladenine, Z: zeatin (cis- and trans-), ZR: zeatin riboside (cis- and trans-).

