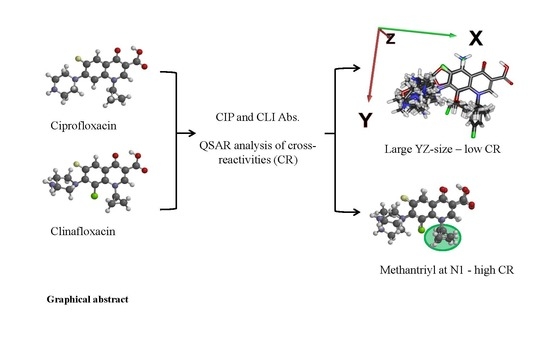
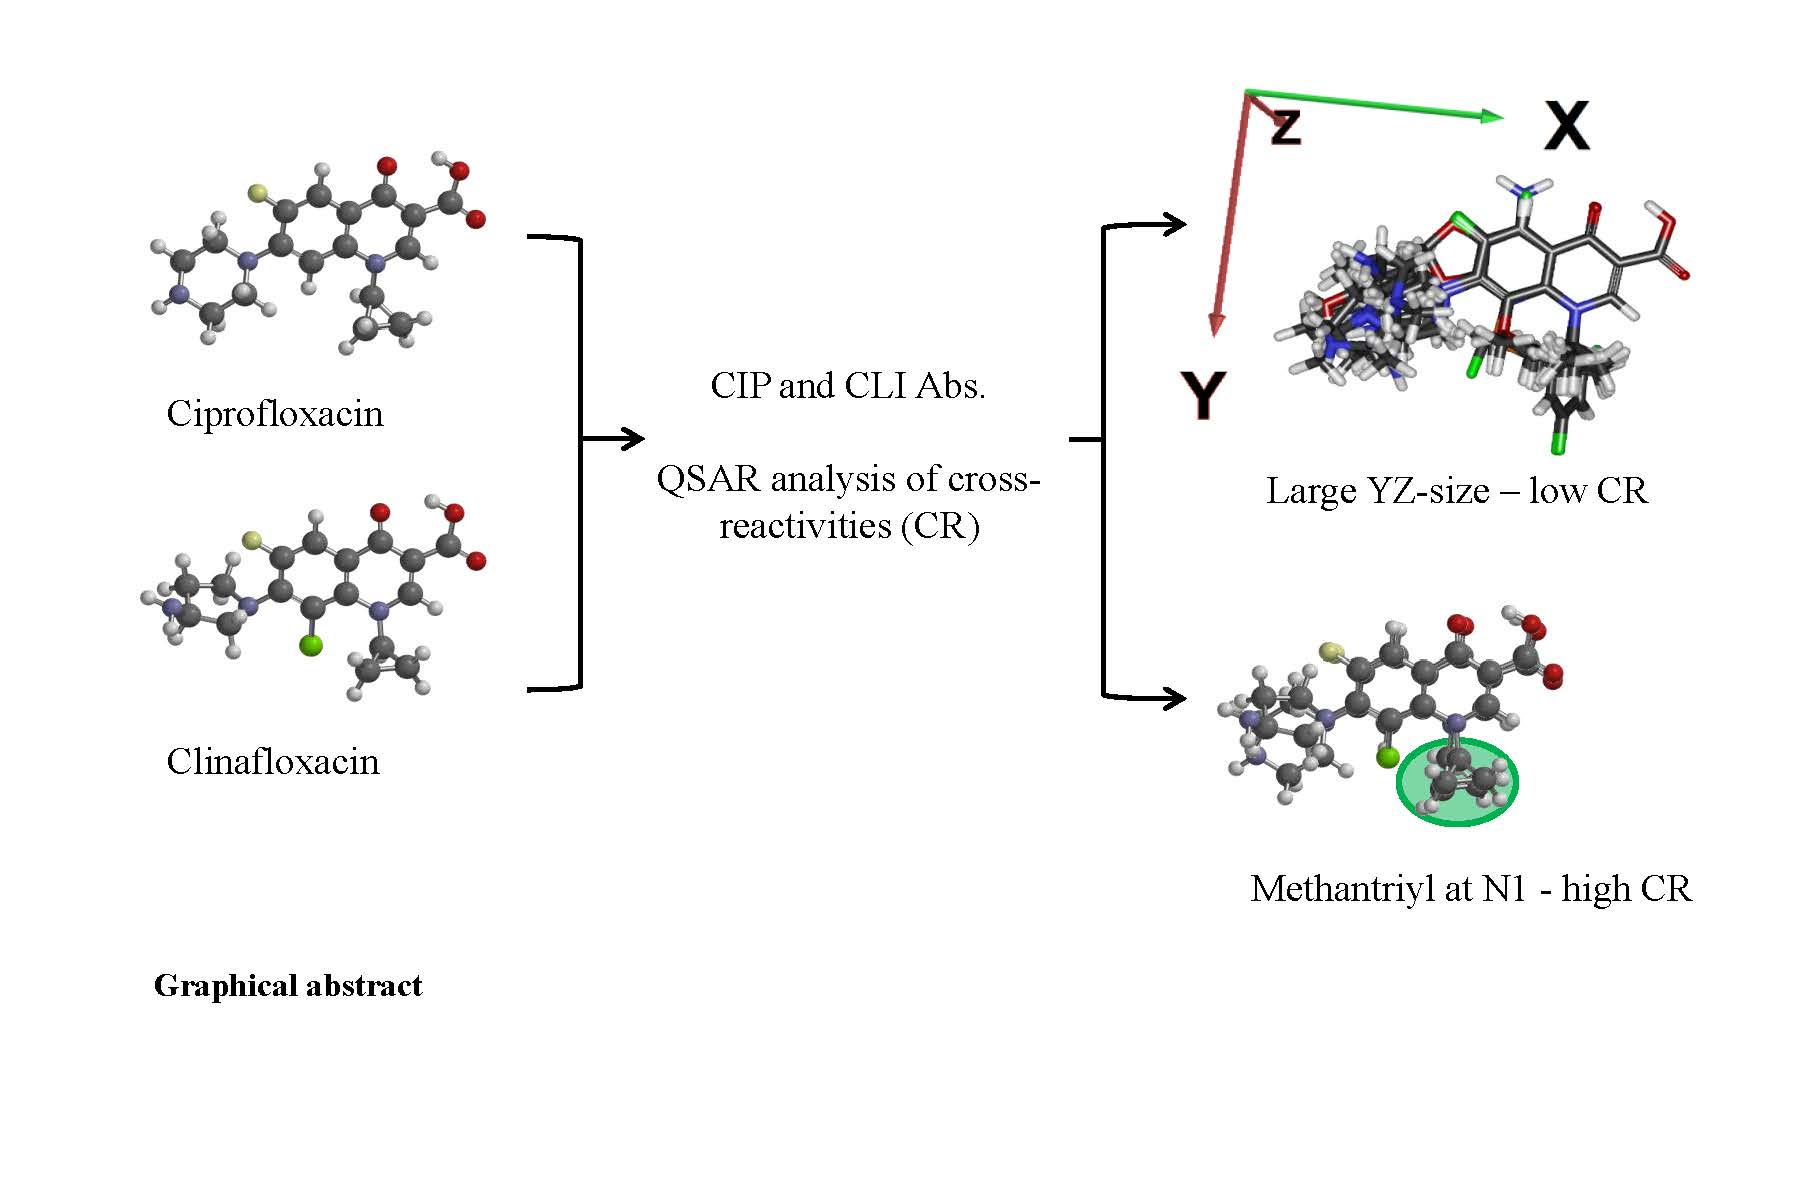
Ciprofloxacin and Clinafloxacin Antibodies for an Immunoassay of Quinolones: Quantitative Structure–Activity Analysis of Cross-Reactivities

 , ,
, ,  and
and
Abstract
:
1. Introduction
2. Results
3. Discussion
4. Materials and Methods
4.1. Chemicals
4.2. Instrumentation
4.3. Experimental
4.3.1. Synthesis of Cationized BSA (cBSA)
4.3.2. Synthesis of Protein Conjugates and Fluorescein Tracer
4.3.3. Preparation of Antibodies and IgG Fraction
4.3.4. Enzyme-Linked Immunosorbent Assay (ELISA)
4.3.5. Fluorescence Polarization Immunoassay (FPIA)
4.3.6. Cross-Reactivity
4.4. QSAR Analysis
4.4.1. Conformational Analysis and Geometry Optimization
4.4.2. Molecular Descriptors
4.4.3. Model Validation
5. Conclusions
Supplementary Materials
Author Contributions
Funding
Conflicts of Interest
Abbreviations
| BSA | Bovine serum albumin |
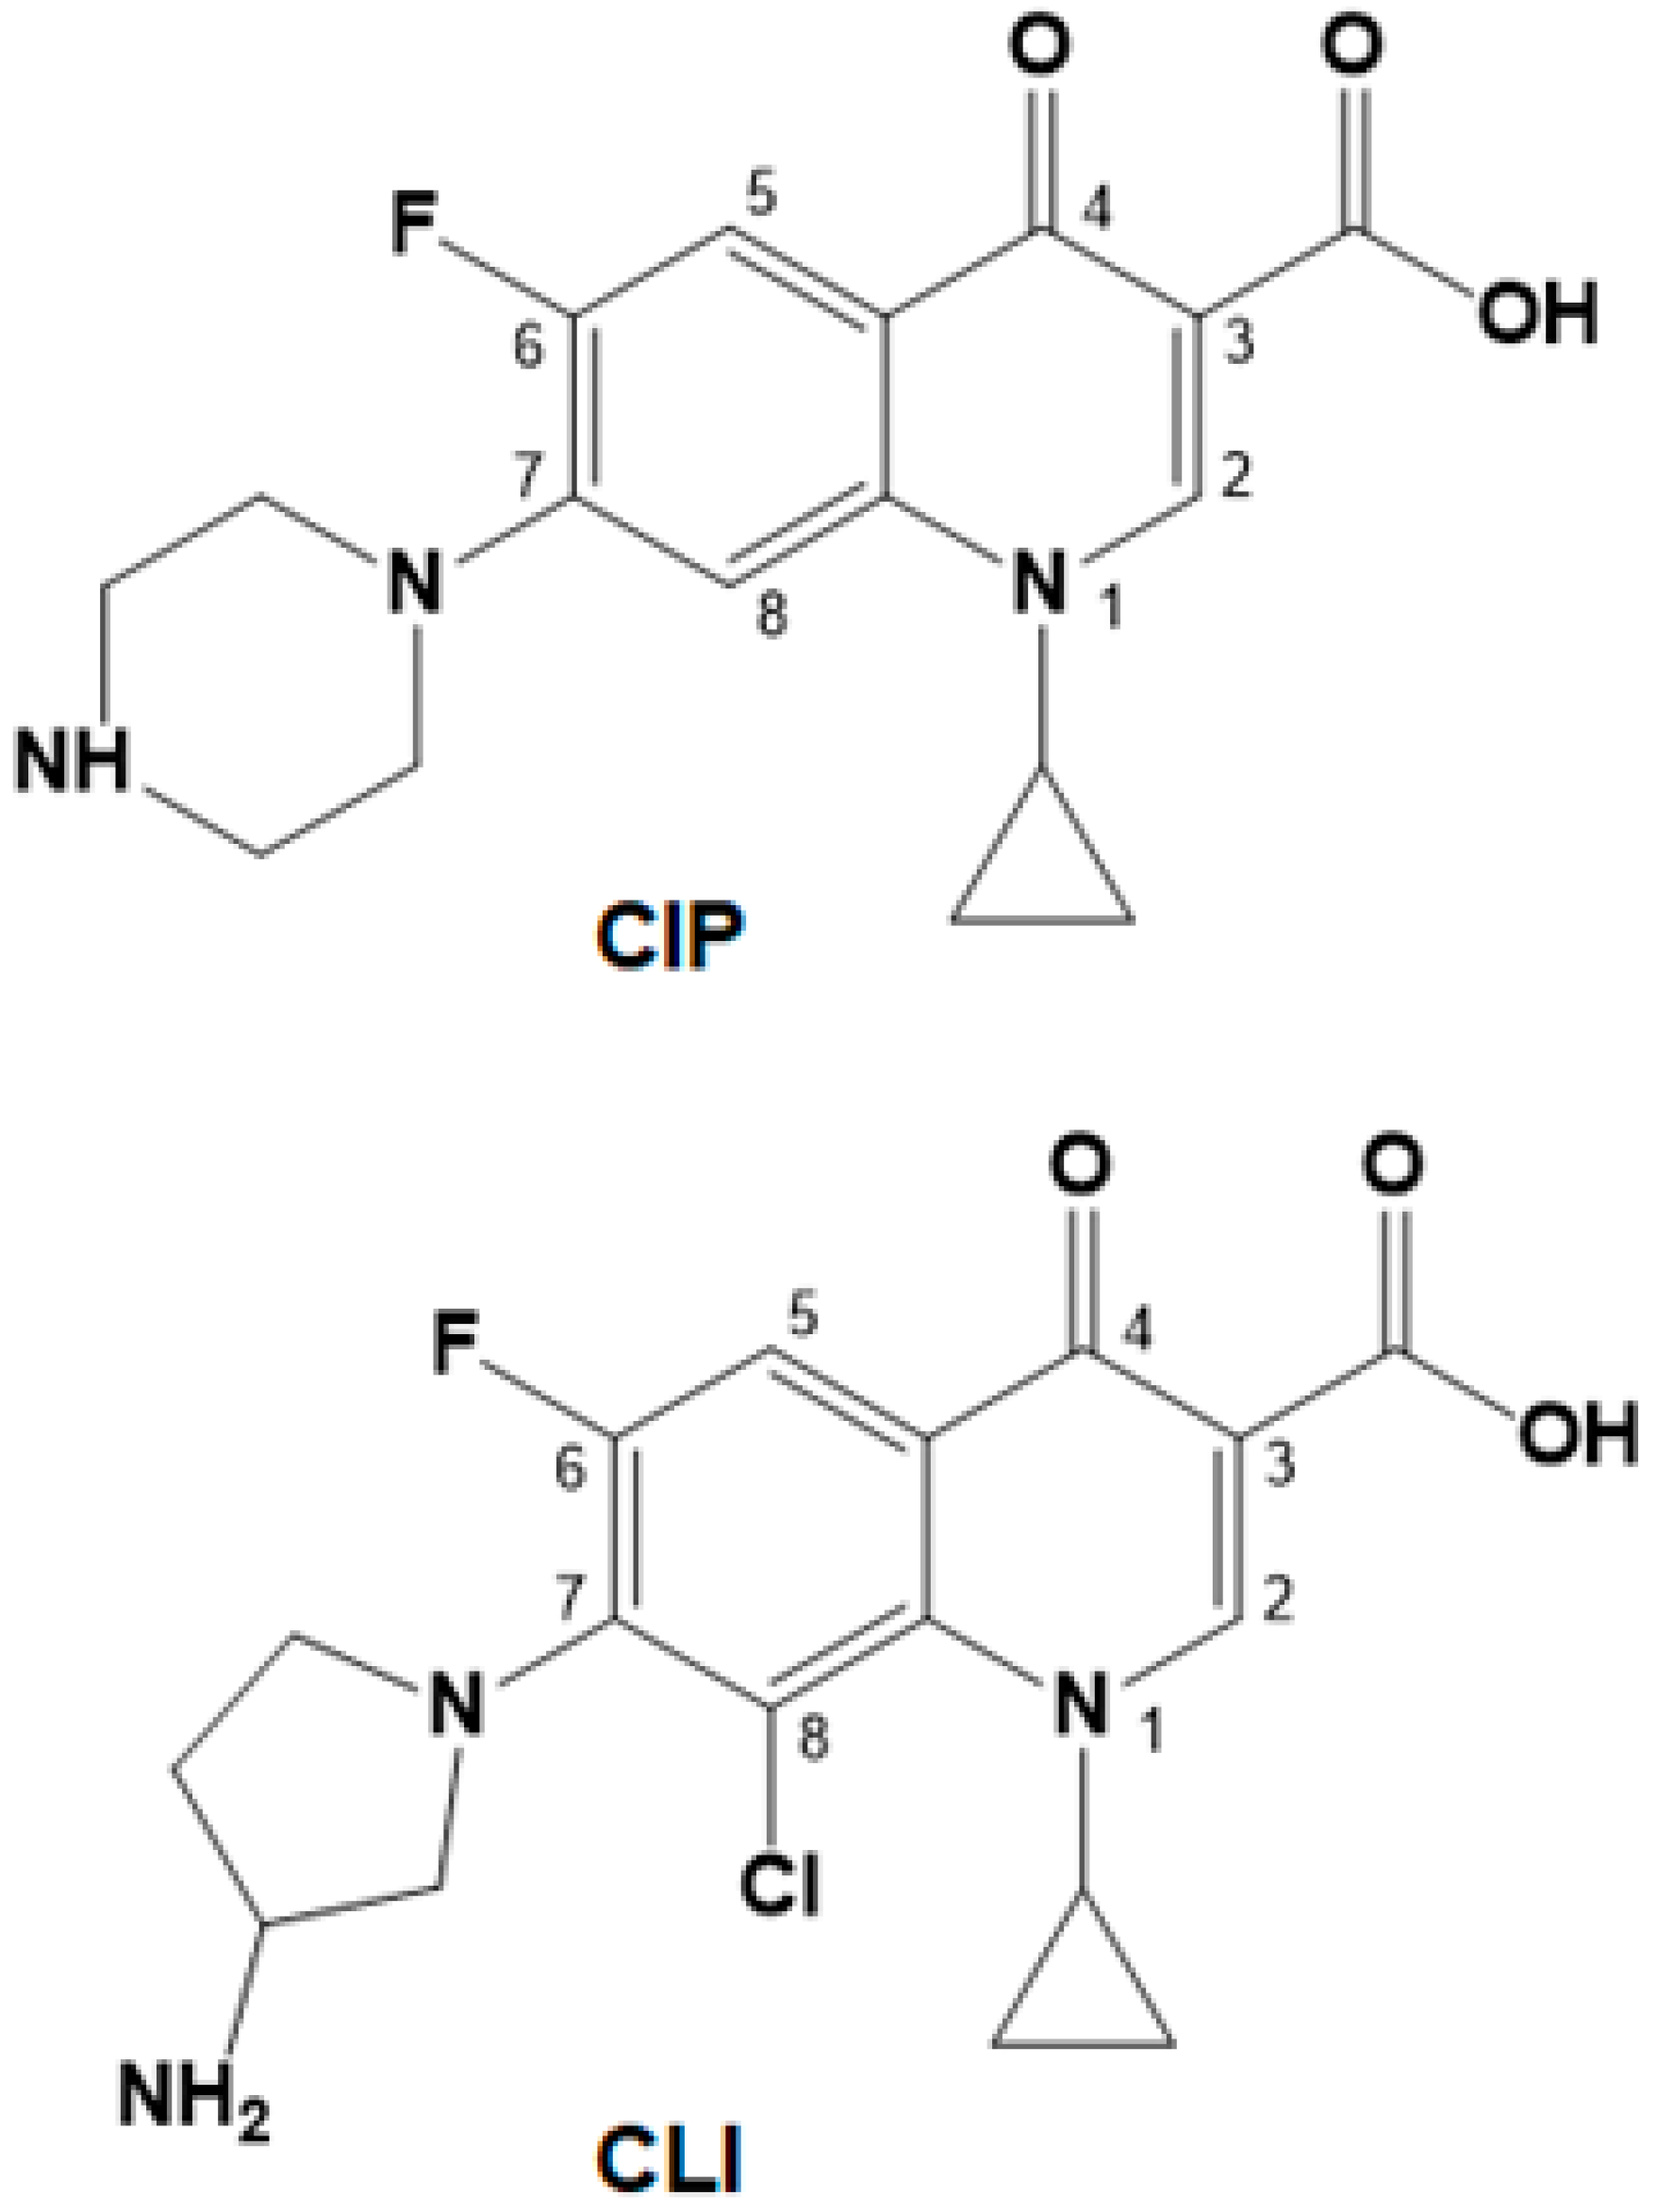
| CIP | Ciprofloxacin |
| CLI | Clinafloxacin |
| CR | Cross-reactivity |
| FQs | Fluoroquinolones |
| OVA | Ovalbumin |
| PAZ | Pazufloxacin |
| QSAR | Quantitative Structure-Activity Relationship |
References
- Jackson, M.A.; Schutze, G.E.; Committee on Infectious Diseases. The Use of Systemic and Topical Fluoroquinolones. Pediatrics 2016, 138, e20162706. [Google Scholar] [CrossRef] [PubMed] [Green Version]
- Giguère, S.; Dowling, P.M. Fluoroquinolones. In Antimicrobial Therapy in Veterinary Medicine, 5th ed.; Giguère, S., Prescott, J.F., Dowling, P.M., Eds.; John Wiley & Sons, Inc.: New York, NY, USA, 2013; pp. 295–314. [Google Scholar]
- Marshall, B.M.; Levy, S.B. Food animals and antimicrobials: Impacts on human health. Clin. Microbiol. Rev. 2011, 24, 718–733. [Google Scholar] [CrossRef] [PubMed]
- Sproston, E.L.; Wimalarathna, H.M.L.; Sheppard, S.K. Trends in fluoroquinolone resistance in Campylobacter. Microb. Genom. 2018, 4, e000198. [Google Scholar] [CrossRef]
- Phillips, I.; Casewell, M.; Cox, T.; De Groot, B.; Friis, C.; Jones, R.; Nightingale, C.; Preston, R.; Waddell, J. Does the use of antibiotics in food animals pose a risk to human health? A critical review of published data. J. Antimicrob. Chemother. 2004, 53, 28–52. [Google Scholar] [CrossRef] [PubMed]
- Collignon, P. Fluoroquinolone use in food animals. Emerg. Infect. Dis. 2005, 11, 1789–1790. [Google Scholar] [CrossRef]
- Wang, H.; Wang, N.; Wang, B.; Zhao, Q.; Fang, H.; Fu, C.; Tang, C.; Jiang, F.; Zhou, Y.; Chen, Y.; et al. Antibiotics in drinking water in Shanghai and their contribution to antibiotic exposure of school children. Environ. Sci. Technol. 2016, 50, 2692–2699. [Google Scholar] [CrossRef] [PubMed]
- Wang, H.; Ren, L.; Yu, X.; Hu, J.; Chen, Y.; He, G.; Jiang, Q. Antibiotic residues in meat, milk and aquatic products in Shanghai and human exposure assessment. Food Control 2017, 80, 217–225. [Google Scholar] [CrossRef]
- Mund, M.D.; Khan, U.H.; Tahir, U.; Mustafa, B.E.; Fayyaz, A. Antimicrobial drug residues in poultry products and implications on public health: A review. Int. J. Food Prop. 2017, 20, 1433–1446. [Google Scholar] [CrossRef]
- Shreiner, A.B.; Kao, J.Y.; Young, V.B. The gut microbiome in health and in disease. Curr. Opin. Gastroenterol. 2015, 31, 69–75. [Google Scholar] [CrossRef] [Green Version]
- Rusu, A.; Hancu, G.; Uivaroşi, V. Fluoroquinolone pollution of food, water and soil, and bacterial resistance. Environ. Chem. Lett. 2015, 13, 21–36. [Google Scholar] [CrossRef]
- Frade, V.M.F.; Dias, M.; Teixeira, A.C.S.C.; Palma, M.S.A. Environmental contamination by fluoroquinolones. Braz. J. Pharm. Sci. 2014, 50, 41–54. [Google Scholar] [CrossRef] [Green Version]
- Sy, S.K.; Zhuang, L.; Derendorf, H. Pharmacokinetics and pharmacodynamics in antibiotic dose optimization. Expert Opin. Drug Metab. Toxicol. 2016, 12, 93–114. [Google Scholar] [CrossRef] [PubMed]
- Schneider, M.J. Methods for the analysis of fluoroquinolones in biological fluids. Bioanalysis 2009, 1, 415–435. [Google Scholar] [CrossRef] [PubMed]
- Rusu, A.; Hancu, G.; Völgyi, G.; Tóth, G.; Noszál, B.; Gyéresi, A. Separation and determination of quinolone antibacterials by capillary electrophoresis. J. Chromatogr. Sci. 2014, 52, 919–925. [Google Scholar] [CrossRef] [PubMed]
- Sousa, J.; Alves, G.; Abrantes, J.; Fortuna, A.; Falcão, A. Analytical methods for determination of new fluoroquinolones in biological matrices and pharmaceutical formulations by liquid chromatography: A review. Anal. Bioanal. Chem. 2012, 403, 93–129. [Google Scholar] [CrossRef]
- Czyrski, A. Analytical methods for determining third and fourth generation fluoroquinolones: A review. Chromatographia 2017, 80, 181–200. [Google Scholar] [CrossRef] [PubMed]
- Li, Y.-F.; Sun, Y.-M.; Beier, R.C.; Lei, H.-T.; Gee, S.; Hammock, B.D.; Wang, H.; Wang, Z.; Sun, X.; Shen, Y.-D.; et al. Immunochemical techniques for multianalyte analysis of chemical residues in food and the environment: A review. TRAC Trends Anal. Chem. 2016, 88, 25–40. [Google Scholar] [CrossRef]
- Lehotay, S.J.; Chen, Y. Hits and misses in research trends to monitor contaminants in foods. Anal. Bioanal. Chem. 2018, 410, 5331–5351. [Google Scholar] [CrossRef]
- Zhang, Z.; Cheng, H. Recent development in sample preparation and analytical techniques for determination of quinolone residues in food products. Crit. Rev. Anal. Chem. 2017, 47, 223–250. [Google Scholar] [CrossRef]
- Dzantiev, B.B.; Byzova, N.A.; Urusov, A.E.; Zherdev, A.V. Immunochromatographic methods in food analysis. TRAC Trends Anal. Chem. 2014, 55, 81–93. [Google Scholar] [CrossRef]
- Tripathi, P.; Upadhyay, N.; Nara, S. Recent advancements in lateral flow immunoassays: A journey for toxin detection in food. Crit. Rev. Food Sci. Nutr. 2018, 58, 1715–1734. [Google Scholar] [CrossRef] [PubMed]
- Wang, Z.; Zhu, Y.; Ding, S.; He, F.; Beier, R.C.; Li, J.; Jiang, H.; Feng, C.; Wan, Y.; Zhang, S.; et al. Development of a monoclonal antibody-based broad-specificity ELISA for fluoroquinolone antibiotics in foods and molecular modeling studies of cross-reactive compounds. Anal. Chem. 2007, 79, 4471–4483. [Google Scholar] [CrossRef] [PubMed]
- Cao, L.; Kong, D.; Sui, J.; Jiang, T.; Li, Z.; Ma, L.; Lin, H. Broad-specific antibodies for a generic immunoassay of quinolone: Development of a molecular model for selection of haptens based on molecular field-overlapping. Anal. Chem. 2009, 81, 3246–3251. [Google Scholar] [CrossRef] [PubMed]
- Leivo, J.; Chappuis, C.; Lamminmäki, U.; Lövgren, T.; Vehniäinen, M. Engineering of a broad-specificity antibody: Detection of eight fluoroquinolone antibiotics simultaneously. Anal. Biochem. 2011, 409, 14–21. [Google Scholar] [CrossRef]
- Zeng, H.; Chen, J.; Zhang, C.; Huang, X.A.; Sun, Y.; Xu, Z.; Lei, H. Broad-specific chemiluminescence enzyme immunoassay for (fluoro)quinolones: Hapten design and molecular modeling study of antibody recognition. Anal. Chem. 2016, 88, 3909–3916. [Google Scholar] [CrossRef] [PubMed]
- Li, Y.; Ji, B.; Chen, W.; Liu, L.; Xu, C.; Peng, C.; Wang, L. Production of new class-specific polyclonal antibody for determination of fluoroquinolones antibiotics by indirect competitive ELISA. Food. Agric. Immunol. 2008, 19, 251–264. [Google Scholar] [CrossRef]
- Wen, K.; Nölke, G.; Schillberg, S.; Wang, Z.; Zhang, S.; Wu, C.; Jiang, H.; Meng, H.; Shen, J. Improved fluoroquinolone detection in ELISA through engineering of a broad-specific single-chain variable fragment binding simultaneously to 20 fluoroquinolones. Anal. Bioanal. Chem. 2012, 403, 2771–2783. [Google Scholar] [CrossRef]
- Liu, Y.Z.; Zhao, G.X.; Wang, P.; Liu, J.; Zhang, H.C.; Wang, J.P. Production of the broad specific monoclonal antibody against sarafloxacin for rapid immunoscreening of 12 fluoroquinolones in meat. J. Environ. Sci. Health B 2013, 48, 139–146. [Google Scholar] [CrossRef]
- Peng, J.; Liu, L.; Xu, L.; Song, S.; Kuang, H.; Cui, G.; Xu, C. Gold nanoparticle-based paper sensor for ultrasensitive and multiple detection of 32 (fluoro)quinolones by one monoclonal antibody. Nano Res. 2017, 10, 108–120. [Google Scholar] [CrossRef]
- Sheng, W.; Li, S.; Liu, Y.; Wang, J.; Zhang, Y.; Wang, S. Visual and rapid lateral flow immunochromatographic assay for enrofloxacin using dyed polymer microspheres and quantum dots. Microchim. Acta 2017, 184, 4313–4321. [Google Scholar] [CrossRef]
- Wang, Z.; Zhang, H.; Ni, H.; Zhang, S.; Shen, J. Development of a highly sensitive and specific immunoassay for enrofloxacin based on heterologous coating haptens. Anal. Chim. Acta 2014, 820, 152–158. [Google Scholar] [CrossRef]
- Tochi, B.N.; Khaemba, G.; Isanga, J.; Mukunzi, D.; Liu, L.; Peng, J.; Kuang, H.; Xu, C. Monoclonal antibody for the development of specific immunoassays to detect enrofloxacin in foods of animal origin. Food Agric. Immunol. 2016, 27, 435–448. [Google Scholar] [CrossRef]
- Tochi, B.N.; Peng, J.; Song, S.; Liu, L.; Kuang, H.; Xu, C. Determination of sarafloxacin and its analogues in milk using an enzyme-linked immunosorbent assay based on a monoclonal antibody. Anal. Methods 2016, 8, 1626–1636. [Google Scholar] [CrossRef]
- Kim, N.G.; Kim, M.A.; Park, Y.I.; Jung, T.S.; Son, S.W.; So, B.; Kang, H.G. Magnetic nanoparticle based purification and enzyme-linked immunosorbent assay using monoclonal antibody against enrofloxacin. J. Vet. Sci. 2015, 16, 431–437. [Google Scholar] [CrossRef]
- Chen, J.; Lv, S.; Wang, Q.; Xu, Z.; Yang, J.; Shen, Y.; Wang, H.; Sun, Y.; Lei, H. A Specific and high-throughput fluorescence polarization immunoassay for surveillance screening of clinafloxacin in milk. Food Anal. Methods 2015, 8, 1468–1476. [Google Scholar] [CrossRef]
- Chen, J.; Lu, N.; Shen, X.; Tang, Q.; Zhang, C.; Xu, J.; Sun, Y.; Huang, X.A.; Xu, Z.; Lei, H. Investigation of an immunoassay with broad specificity to quinolone drugs by genetic algorithm with linear assignment of hypermolecular alignment of data sets and Advanced quantitative structure-activity relationship analysis. J. Agric. Food Chem. 2016, 64, 2772–2779. [Google Scholar] [CrossRef]
- Chen, J.; Shanin, I.A.; Lv, S.; Wang, Q.; Mao, C.; Xu, Z.; Sun, Y.; Wu, Q.; Eremin, S.A.; Lei, H. Heterologous strategy enhancing the sensitivity of the fluorescence polarization immunoassay of clinafloxacin in goat milk. J. Sci. Food Agric. 2016, 96, 1341–1346. [Google Scholar] [CrossRef]
- Nieto, M.J.; Alovero, F.L.; Manzo, R.H.; Mazzieri, M.R. Benzenesulfonamide analogs of fluoroquinolones. Antibacterial activity and QSAR studies. Eur. J. Med. Chem. 2005, 40, 361–369. [Google Scholar] [CrossRef]
- Abdel-Aziz, A.A.; Asiri, Y.A.; Al-Agamy, M.H. Design, synthesis and antibacterial activity of fluoroquinolones containing bulky arenesulfonyl fragment: 2D-QSAR and docking study. Eur. J. Med. Chem. 2011, 46, 5487–5497. [Google Scholar] [CrossRef]
- Mu, H.; Lei, H.; Wang, B.; Xu, Z.; Zhang, C.; Ling, L.; Tian, Y.; Hu, J.; Sun, Y. Molecular modeling application on hapten epitope prediction: An enantioselective immunoassay for ofloxacin optical isomers. J. Agric. Food Chem. 2014, 62, 7804–7812. [Google Scholar] [CrossRef]
- Mu, H.; Wang, B.; Xu, Z.; Sun, Y.; Huang, X.; Shen, Y.; Eremin, S.A.; Zherdev, A.V.; Dzantiev, B.B.; Lei, H. Stereospecific recognition and quantitative structure-activity relationship between antibodies and enantiomers: Ofloxacin as a model hapten. Analyst 2015, 140, 1037–1045. [Google Scholar] [CrossRef]
- Kier, L.B.; Hall, L.H. An Electrotopological state index for atoms in molecules. Pharm. Res. 1990, 7, 801–807. [Google Scholar] [CrossRef]
- Chen, J.; Wang, L.; Lu, L.; Shen, X.; Huang, X.A.; Liu, Y.; Sun, X.; Wang, Z.; Eremin, S.A.; Sun, Y.; et al. Four specific hapten conformations dominating antibody specificity: Quantitative structure-activity relationship analysis for quinolone immunoassay. Anal. Chem. 2017, 89, 6740–6748. [Google Scholar] [CrossRef]
- Shanin, I.A.; Zvereva, E.A.; Zherdev, A.V.; Eremin, S.A.; Dzantiev, B.B. Development of fluorescence polarisation and enzyme-linked immunosorbent assays for danofloxacin detection in milk. Int. J. Chem. Sci. 2016, 14, 283–298. [Google Scholar]
- Rogers, D.; Hopfinger, A. Application of genetic function approximation to quantitative structure−activity relationships and quantitative structure−property relationships. J. Chem. Inf. Model. 1994, 34, 854–866. [Google Scholar] [CrossRef]
- Ambure, P.; Aher, R.B.; Gajewicz, A.; Puzyn, T.; Roy, K. “NanoBRIDGES” software: Open access tools to perform QSAR and nano-QSAR modeling. Chemom. Intell. Lab. 2015, 147, 1–13. [Google Scholar] [CrossRef]
- Spartan’14; Wavefunction Inc.: Irvine, CA, USA, 2014; Available online: https://www.wavefun.com (accessed on 18 November 2018).
- Halgren, T.A. Merck molecular force field. I. Basis, form, scope, parameterization, and performance of MMFF94. J. Comput. Chem. 1996, 17, 490–519. [Google Scholar] [CrossRef]
- Dewar, M.J.S.; Zoebisch, E.G.; Healy, E.F.; Stewart, J.J.P. Development and use of quantum mechanical molecular models. 76. AM1: A new general purpose quantum mechanical molecular model. J. Am. Chem. Soc. 1985, 107, 3902–3909. [Google Scholar] [CrossRef]
- Tetko, I.V.; Gasteiger, J.; Todeschini, R.; Mauri, A.; Livingstone, D.; Ertl, P.; Palyulin, V.A.; Radchenko, E.V.; Zefirov, N.S.; Makarenko, A.S.; et al. Virtual computational chemistry laboratory—Design and description. J. Comput. Aided Mol. Des. 2005, 19, 453–463. [Google Scholar] [CrossRef]
- Friedman, J.H. Multivariate adaptive regression splines. Ann. Stat. 1991, 19, 1–67. [Google Scholar] [CrossRef]


| Immunogen | CIP-BSA | CLI-cBSA | |
|---|---|---|---|
| System | CIP-113/PAZ-FITC | CLI-132/CLI-С5-OVA, ELISA | |
| Fluoroquinolone | |||
| Ciprofloxacin (CIP) | 100 | 73 | |
| Clinafloxacin (CLI) | 52 | 100 | |
| Danofloxacin (DAN) | 76 | 63 | |
| Difloxacin (DIF) | 1 | <1 | |
| Enoxacin (ENO) | 39 | 5 | |
| Enrofloxacin (ENR) | 57 | 33 | |
| Flumequine (FLU) | 72 | <1 | |
| Garenoxacin (GAR) | 56 | 92 | |
| Gatifloxacin (GAT) | 52 | 15 | |
| Levofloxacin (LEV) | - | <1 | |
| Lomefloxacin (LOM) | 25 | <1 | |
| Marbofloxacin (MAR) | 19 | <1 | |
| Moxifloxacin (MOX) | 25 | 8 | |
| Nadifloxacin (NAD) | 49 | 90 | |
| Nalidixic acid (NAL) | 77 | <1 | |
| Norfloxacin (NOR) | 28 | <1 | |
| Orbifloxacin (ORB) | 58 | 10 | |
| Oxolinic acid (OXO) | 36 | <1 | |
| Pazufloxacin (PAZ) | 24 | <1 | |
| Pefloxacin (PEF) | 26 | <1 | |
| Pipemidic_acid (PIP) | 44 | <1 | |
| R-Ofloxacin (R-OFL) | - | <1 | |
| Rufloxacin (RUF) | 13 | <1 | |
| Sarafloxacin (SAR) | 1 | <1 | |
| Sparfloxacin (SPA) | 43 | 10 | |
| Tosufloxacin (TOZ) | 6 | <1 | |
| № | Name | N(>CH-) | S(>CH-) | N(Stereo) | Shadow-YZ |
|---|---|---|---|---|---|
| 1 | Ciprofloxacin (CIP) | 1 | 0.187 | 0 | 40.61 |
| 2 | Clinafloxacin (CLI) | 2 | 0.031 | 1 | 45.23 |
| 3 | Danofloxacin (DAN) | 3 | 0.918 | 2 | 48.22 |
| 4 | Difloxacin (DIF) | 0 | 0 | 0 | 55.14 |
| 5 | Enoxacin (ENO) | 0 | 0 | 0 | 38.28 |
| 6 | Enrofloxacin (ENR) | 1 | 0.186 | 0 | 42.55 |
| 7 | Flumequine (FLU) | 1 | 0.096 | 1 | 35.64 |
| 8 | Garenoxacin (GAR) | 3 | −2.935 | 1 | 48.49 |
| 9 | Gatifloxacin (GAT) | 2 | 0.29 | 1 | 47.77 |
| 10 | Levofloxacin (LEV) | 1 | −0.158 | 1 | 42.71 |
| 11 | Lomefloxacin (LOM) | 1 | 0.074 | 1 | 43.80 |
| 12 | Marbofloxacin (MAR) | 0 | 0 | 0 | 42.93 |
| 13 | Moxifloxacin (MOX) | 3 | 0.887 | 2 | 47.48 |
| 14 | Nadifloxacin (NAD) | 2 | −0.327 | 1 | 44.99 |
| 15 | Nalidixic acid (NAL) | 0 | 0 | 0 | 32.42 |
| 16 | Norfloxacin (NOR) | 0 | 0 | 0 | 38.77 |
| 17 | Orbifloxacin (ORB) | 3 | −0.379 | 2 | 46.85 |
| 18 | Oxolinic acid (OXO) | 0 | 0 | 0 | 32.34 |
| 19 | Pazufloxacin (PAZ) | 1 | −0.172 | 1 | 42.21 |
| 20 | Pefloxacin (PEF) | 0 | 0 | 0 | 39.69 |
| 21 | Pipemidic_acid (PIP) | 0 | 0 | 0 | 36.79 |
| 22 | R-Ofloxacin (R-OFL) | 1 | −0.158 | 1 | 42.79 |
| 23 | Rufloxacin (RUF) | 0 | 0 | 0 | 41.23 |
| 24 | Sarafloxacin (SAR) | 0 | 0 | 0 | 54.61 |
| 25 | Sparfloxacin (SPA) | 3 | −0.104 | 2 | 47.87 |
| 26 | Tosufloxacin (TOZ) | 1 | −0.169 | 1 | 53.28 |
| № | Statistical Parameters | CIP-113/PAZ-FITC (Model 1) | CLI-132/CLI-С5-OVA, ELISA (Model 2) |
|---|---|---|---|
| 1 | N | 19 | 20 |
| 2 | rtr2 | 0.803 | 0.934 |
| 3 | r2adj | 0.778 | 0.921 |
| 4 | q2 | 0.613 | 0.864 |
| 5 | LMO-q2 | 0.602 | 0.815 |
| 6 | pred_r2 | 0.944 | 0.640 |
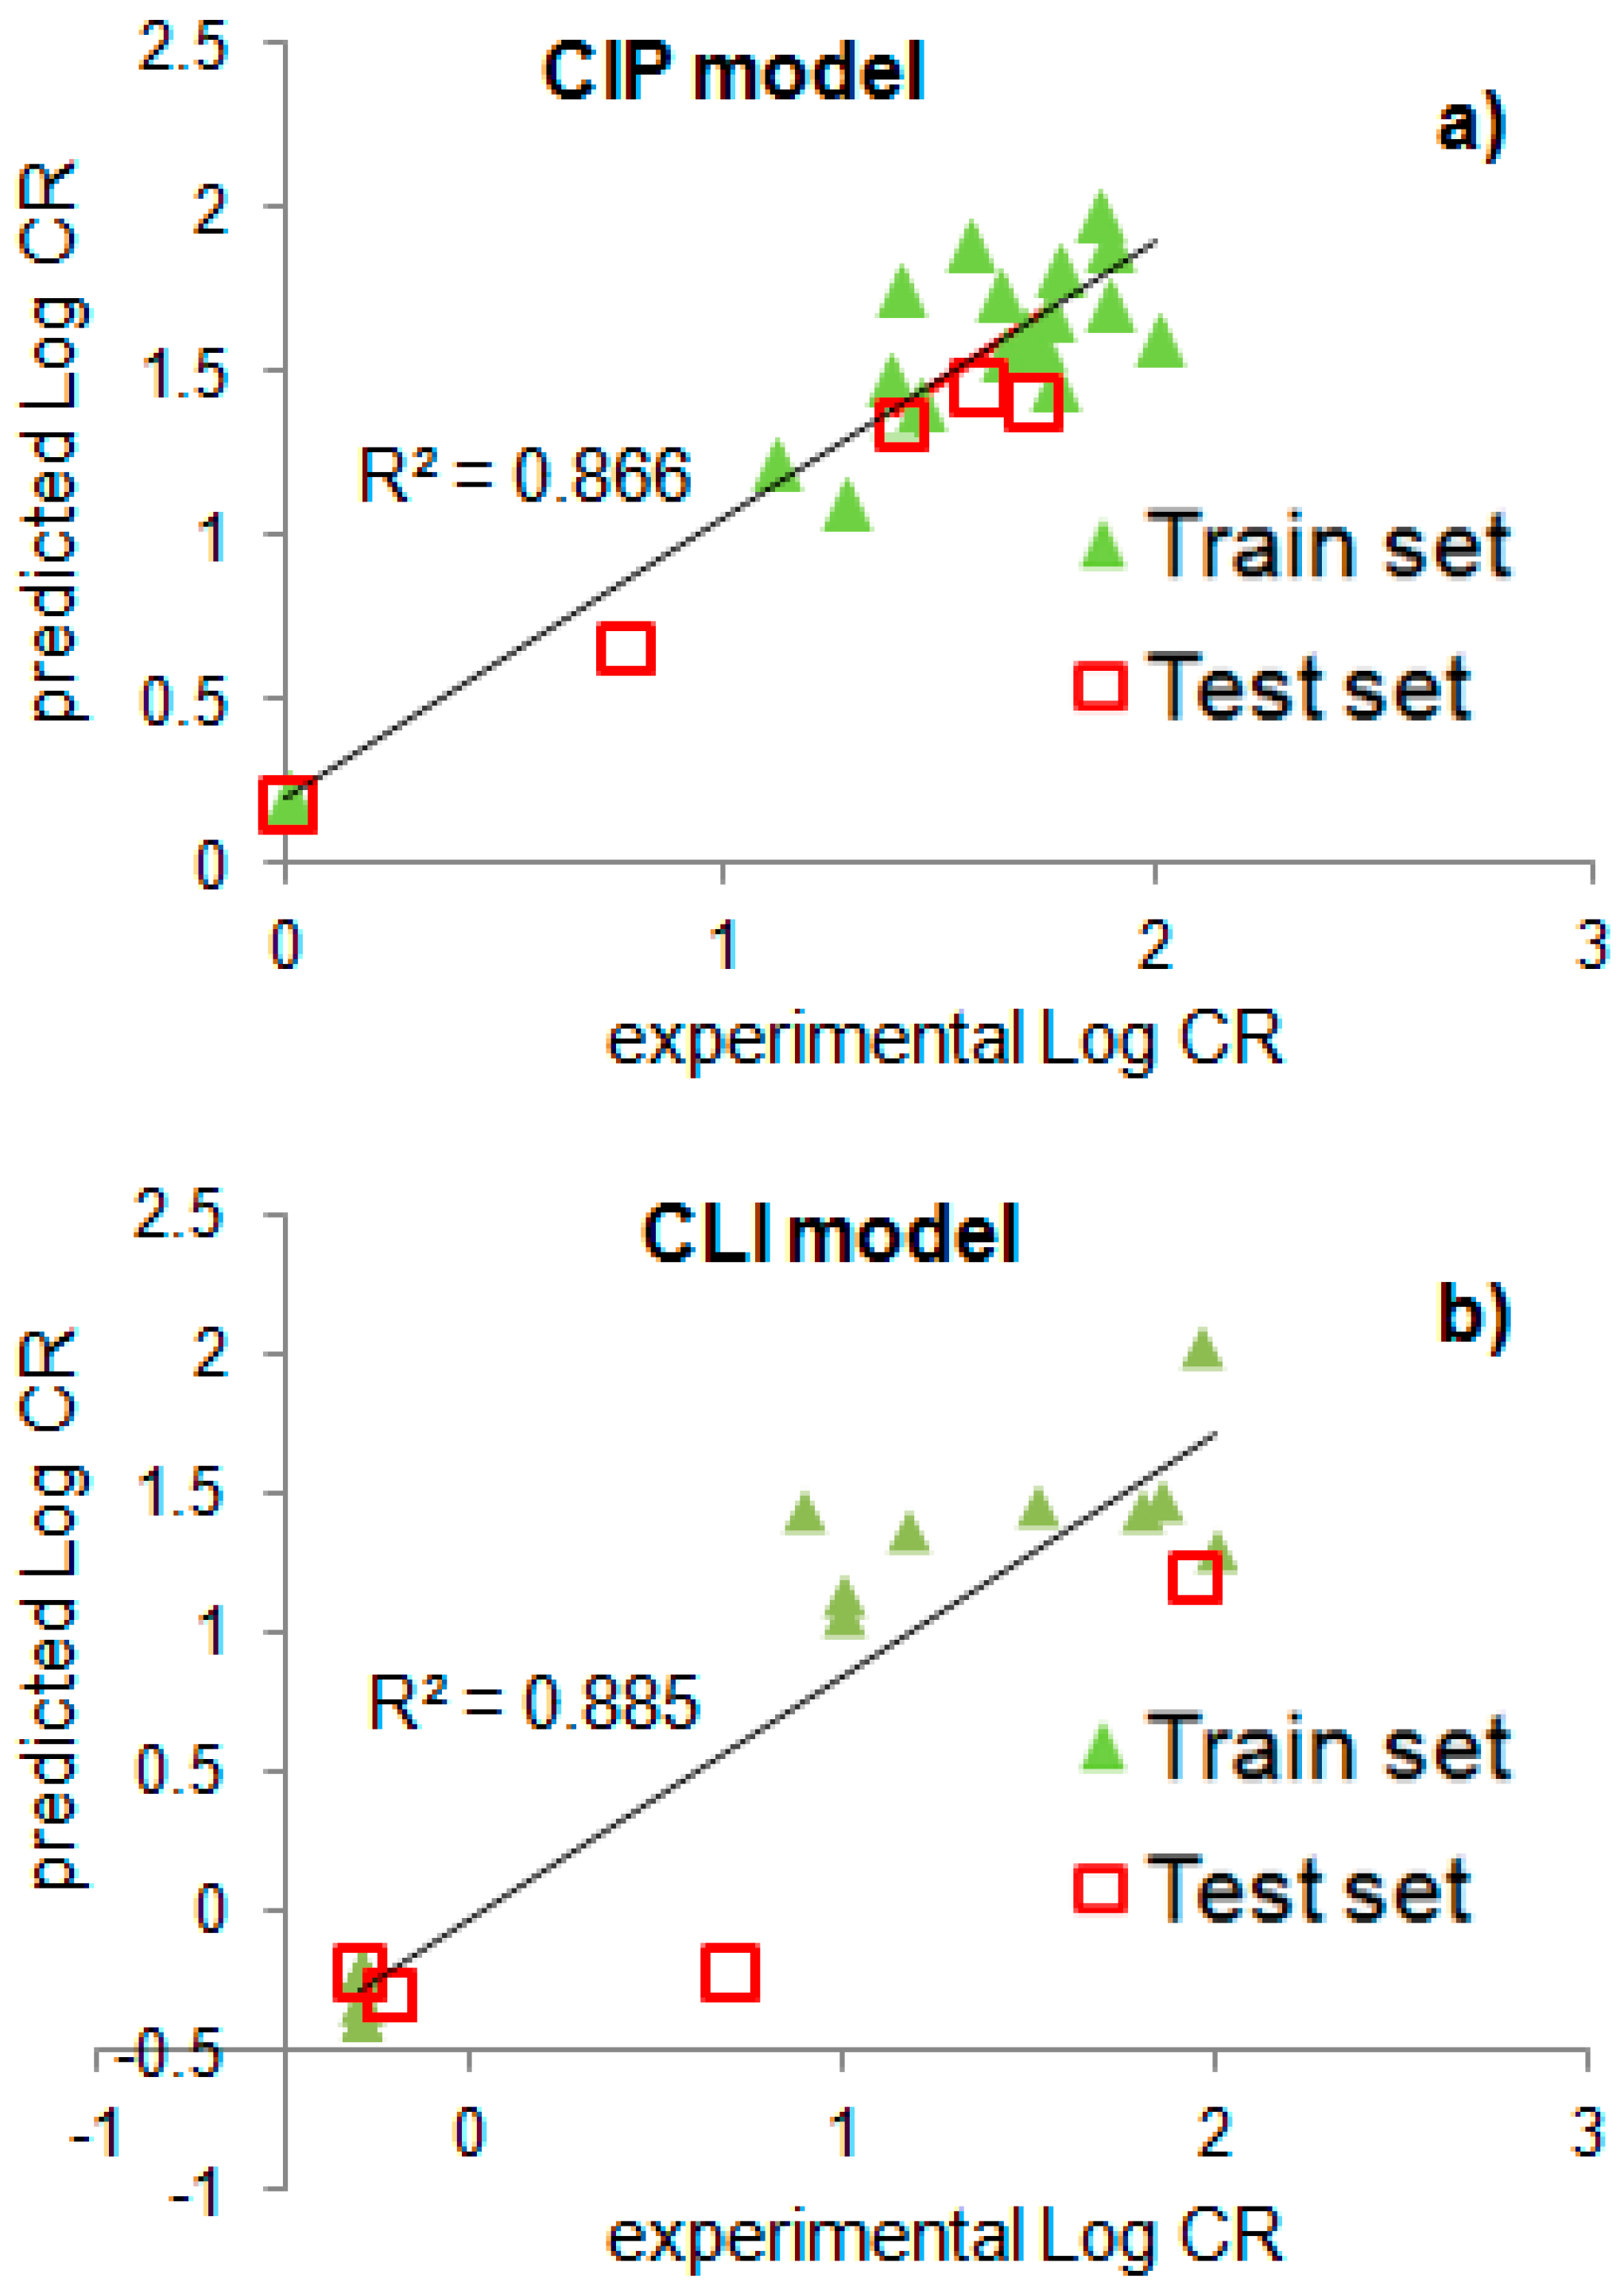
| 7 | R2 | 0.866 | 0.885 |
| 8 | RMS error | 0.207 | 0.255 |
| 9 | LOF | 0.094 | 0.281 |
© 2019 by the authors. Licensee MDPI, Basel, Switzerland. This article is an open access article distributed under the terms and conditions of the Creative Commons Attribution (CC BY) license (http://creativecommons.org/licenses/by/4.0/).
Share and Cite
Buglak, A.A.; Shanin, I.A.; Eremin, S.A.; Lei, H.-T.; Li, X.; Zherdev, A.V.; Dzantiev, B.B. Ciprofloxacin and Clinafloxacin Antibodies for an Immunoassay of Quinolones: Quantitative Structure–Activity Analysis of Cross-Reactivities. Int. J. Mol. Sci. 2019, 20, 265. https://0-doi-org.brum.beds.ac.uk/10.3390/ijms20020265
Buglak AA, Shanin IA, Eremin SA, Lei H-T, Li X, Zherdev AV, Dzantiev BB. Ciprofloxacin and Clinafloxacin Antibodies for an Immunoassay of Quinolones: Quantitative Structure–Activity Analysis of Cross-Reactivities. International Journal of Molecular Sciences. 2019; 20(2):265. https://0-doi-org.brum.beds.ac.uk/10.3390/ijms20020265
Chicago/Turabian StyleBuglak, Andrey A., Ilya A. Shanin, Sergei A. Eremin, Hong-Tao Lei, Xiangmei Li, Anatoly V. Zherdev, and Boris B. Dzantiev. 2019. "Ciprofloxacin and Clinafloxacin Antibodies for an Immunoassay of Quinolones: Quantitative Structure–Activity Analysis of Cross-Reactivities" International Journal of Molecular Sciences 20, no. 2: 265. https://0-doi-org.brum.beds.ac.uk/10.3390/ijms20020265