Brain-Derived Neurotrophin and TrkB in Head and Neck Squamous Cell Carcinoma

 , , , and
Abstract
:
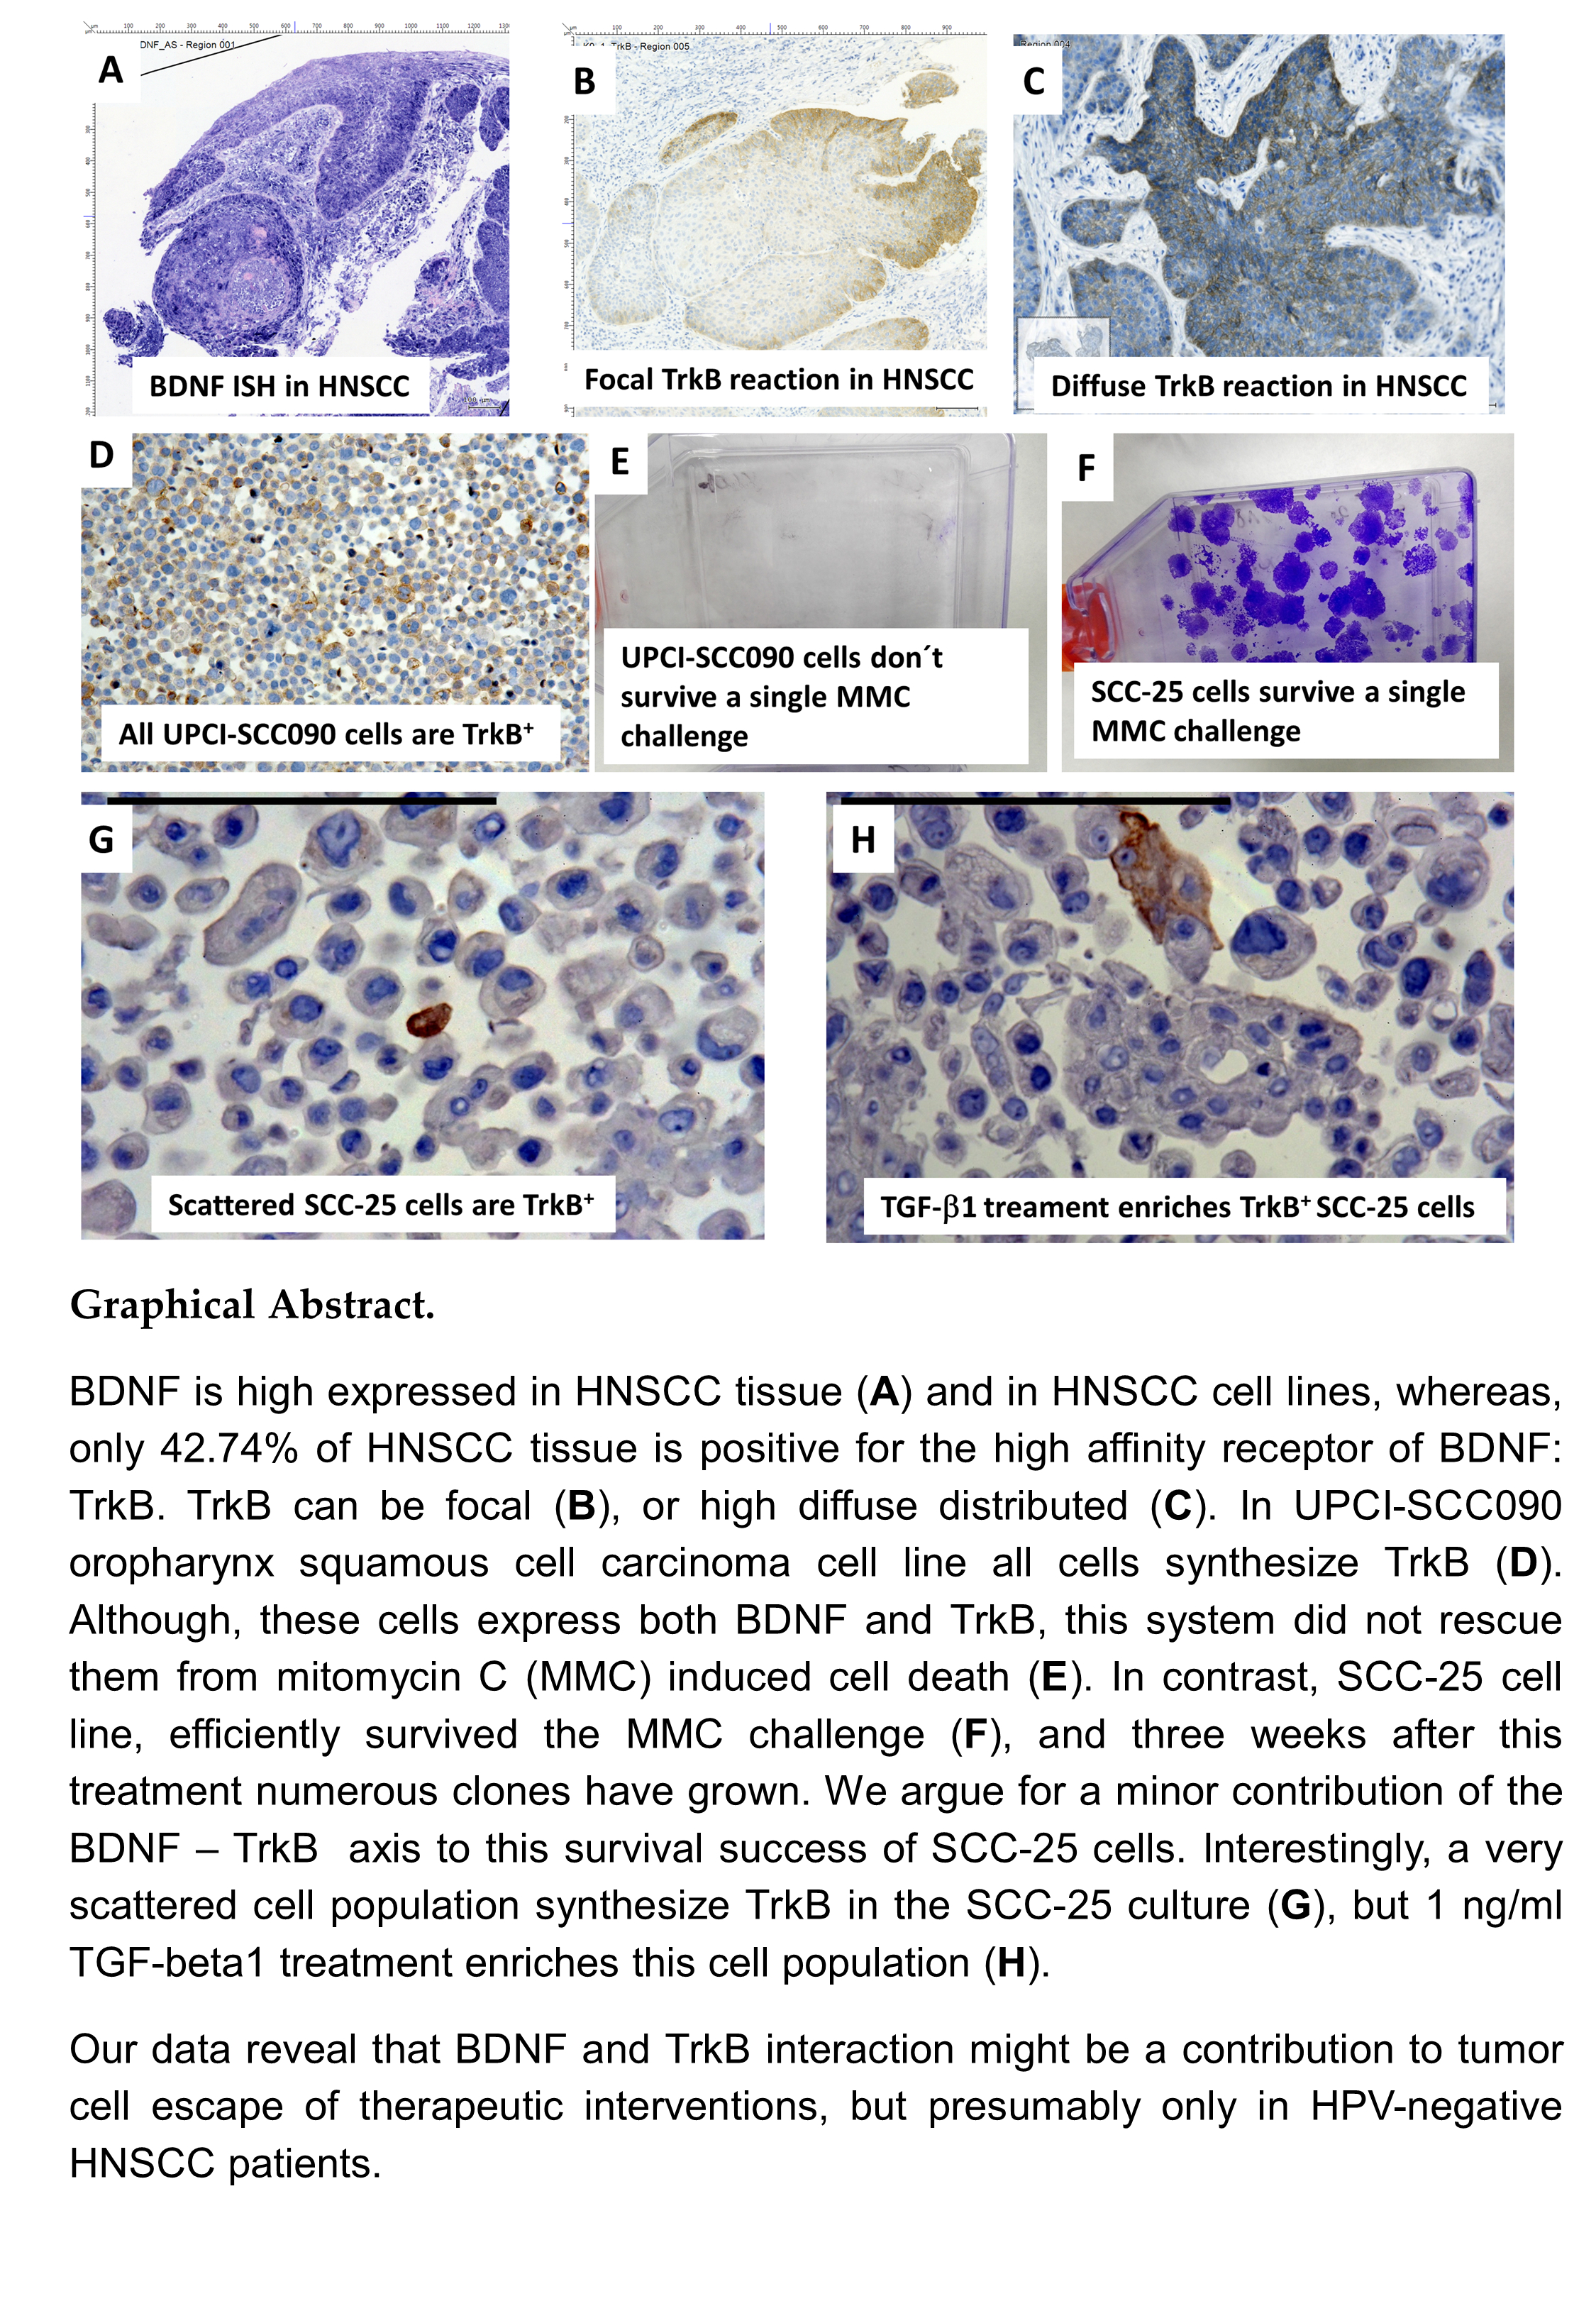
1. Introduction
2. Results
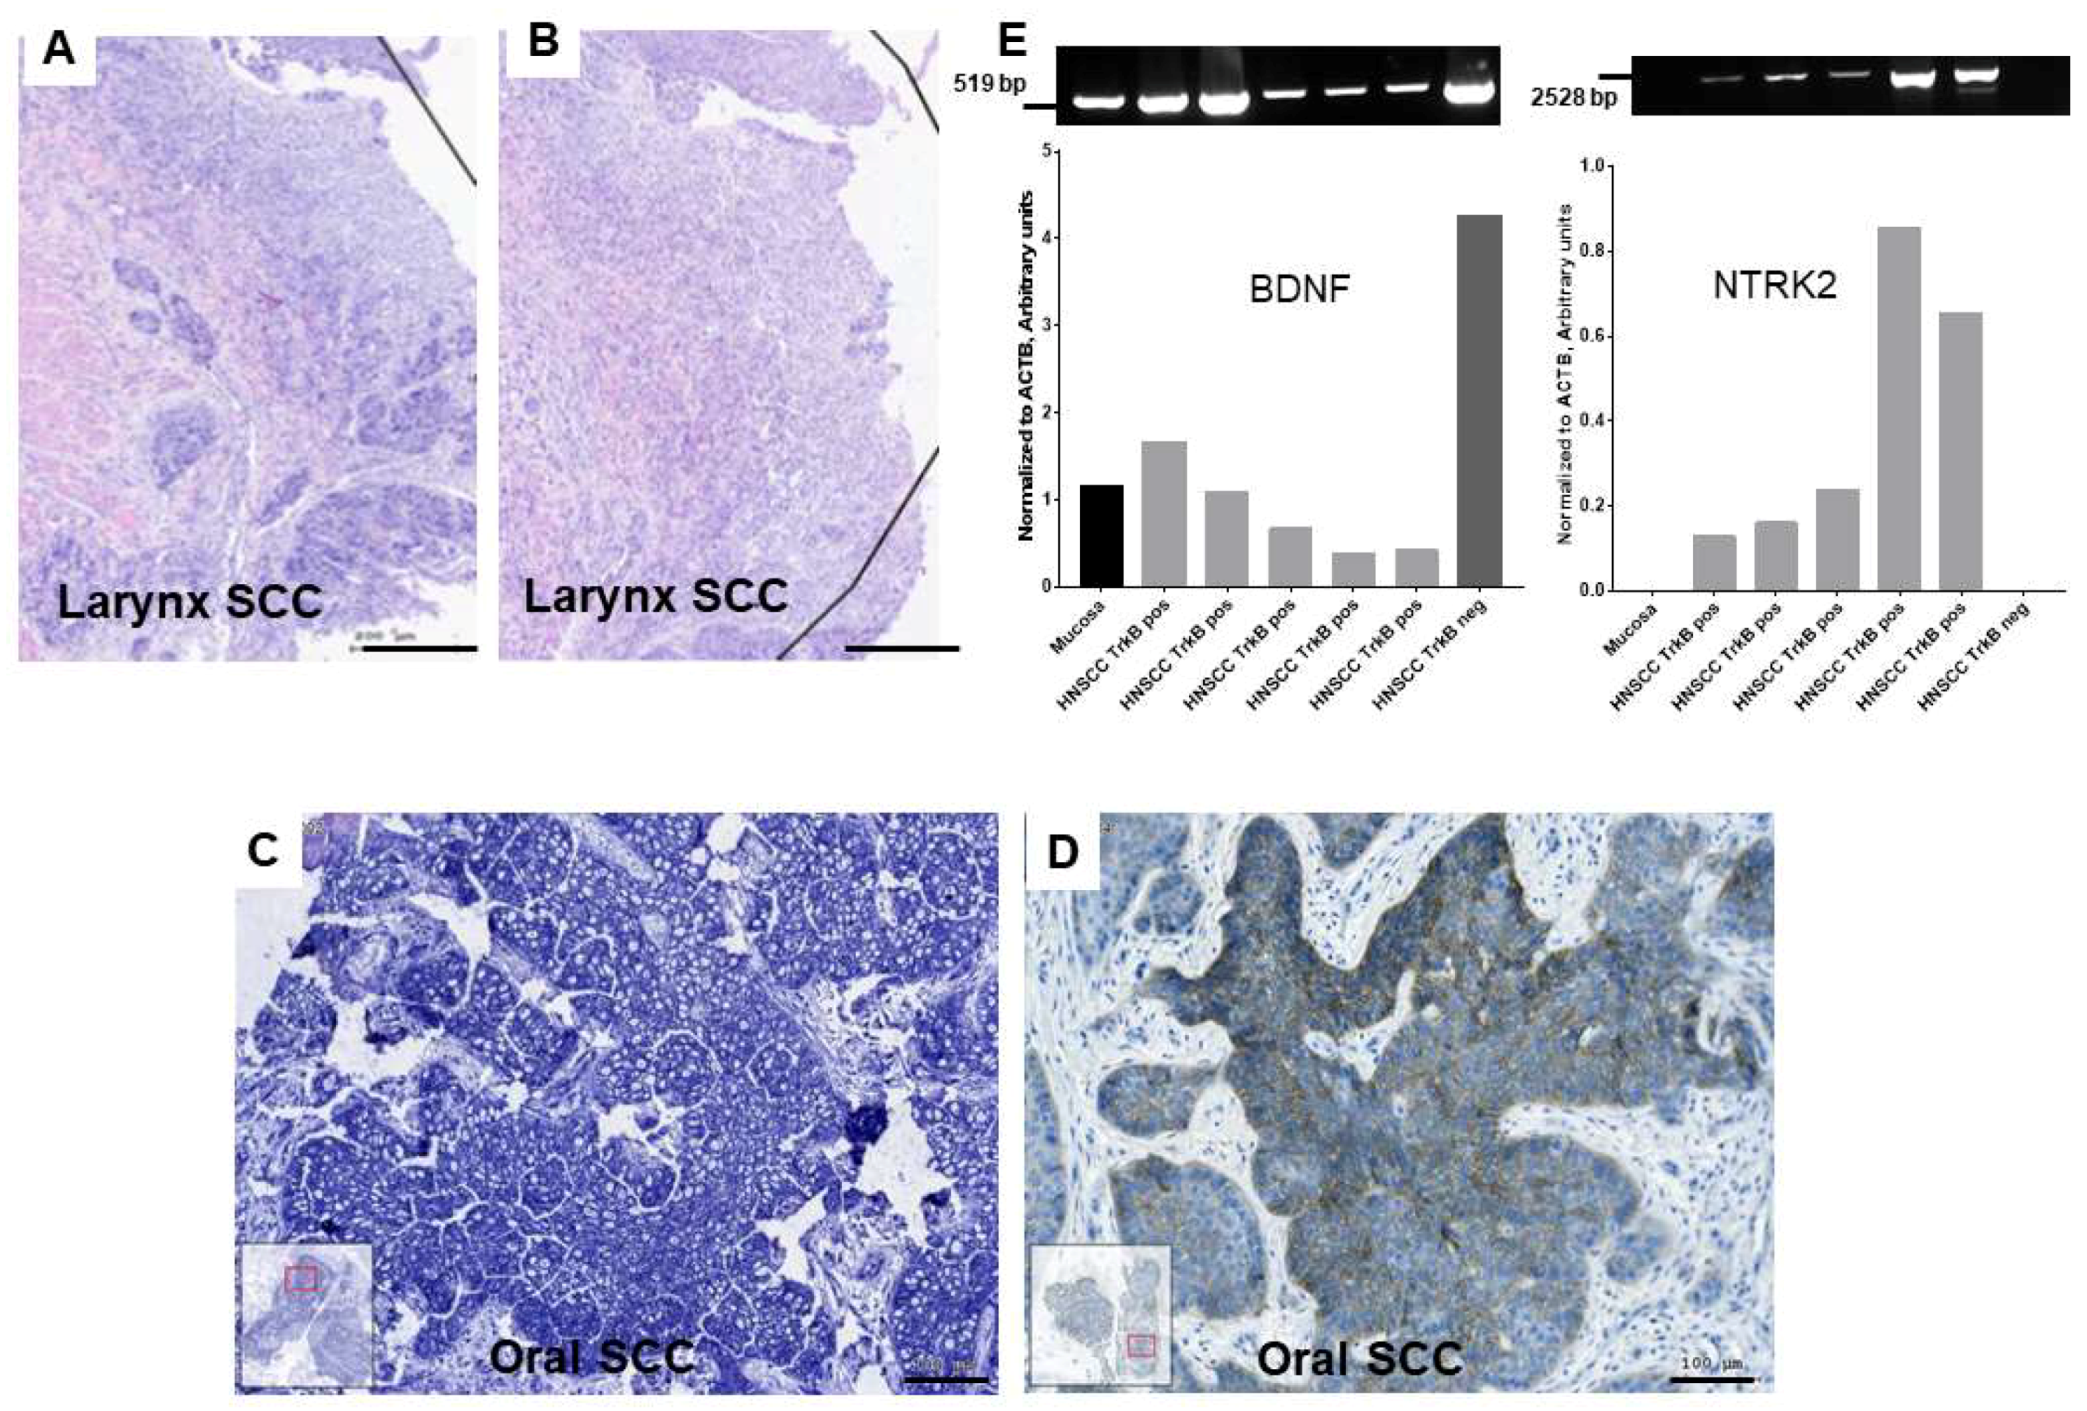
2.1. Gene Expression of BDNF and NTRK2 and Protein Synthesis of NTRK2 in Oral Mucosa and in HNSCC Tumor Tissue
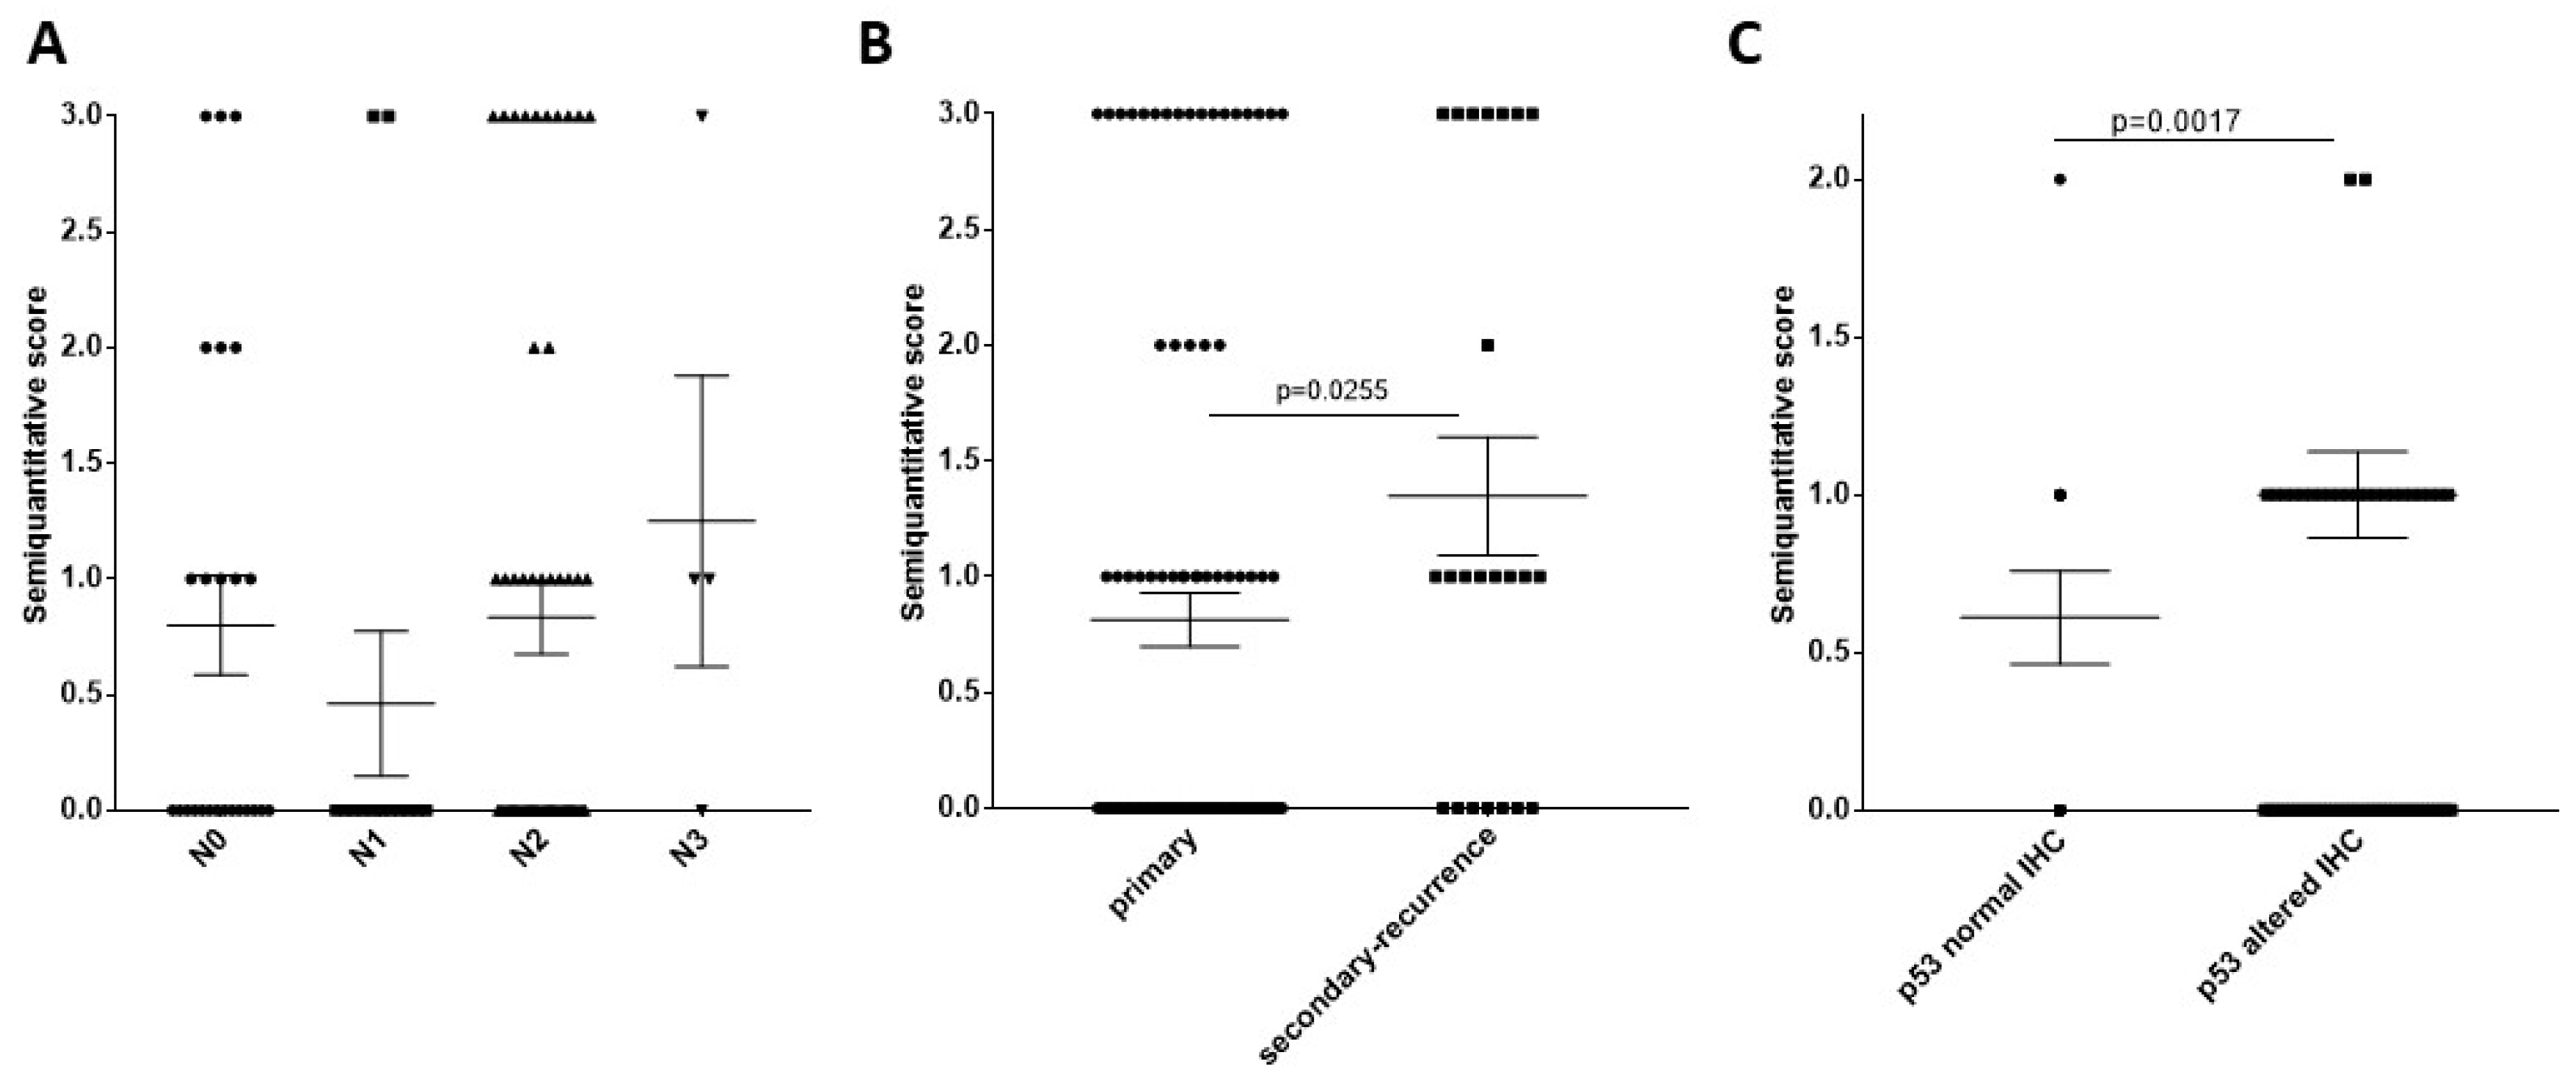
2.2. HPV Carcinogenesis Effect on Patient Survival, TrkB Staining Pattern Relation to HPV Carcinogenesis, Relation of TrkB Staining with HNSCC Clinical Properties
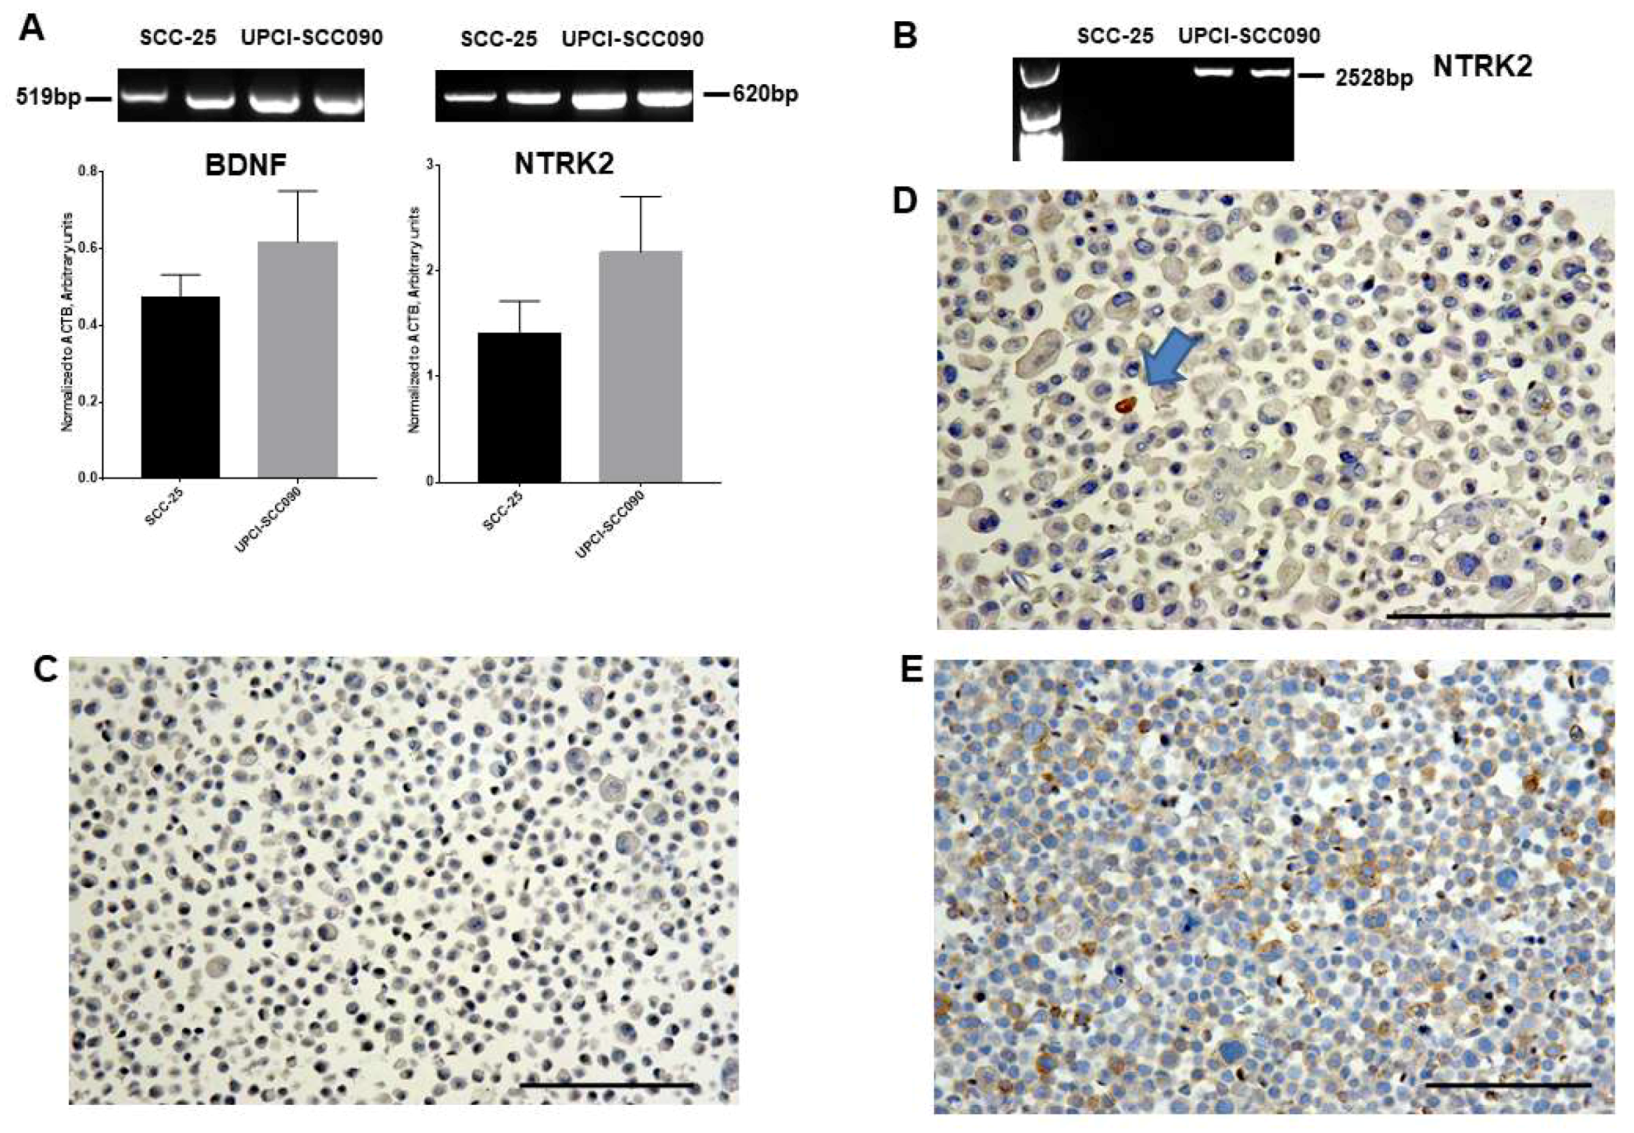
2.3. Gene Expression of BDNF and NTRK2, and Protein Synthesis of TrkB in SCC-25, Detroit 562, and UPCI-SCC090 Cells
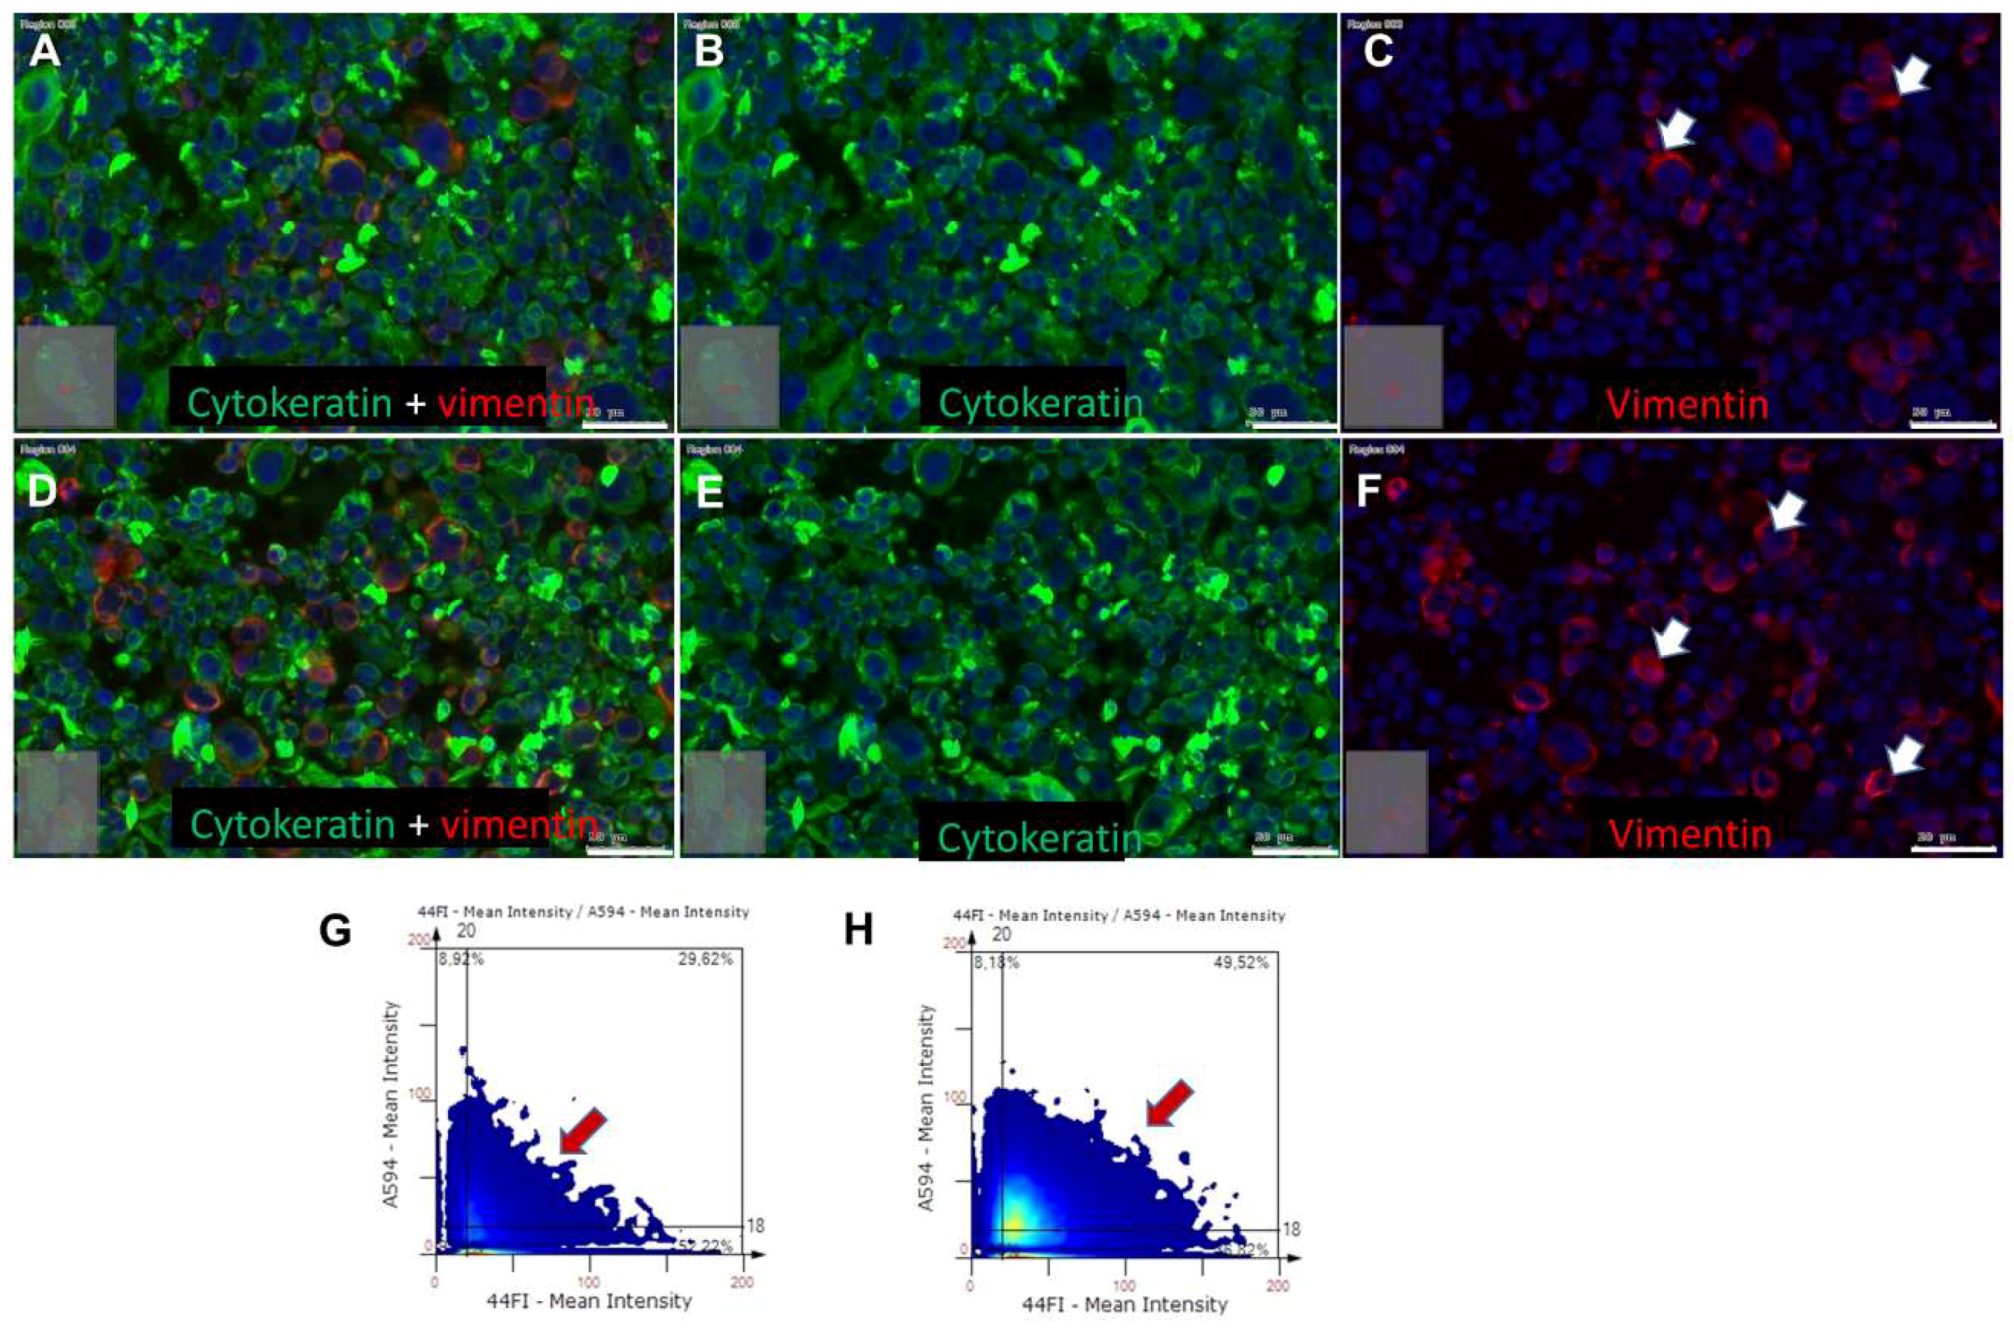
2.4. Effects of BDNF Treatments in UPCI-SCC090 Cells
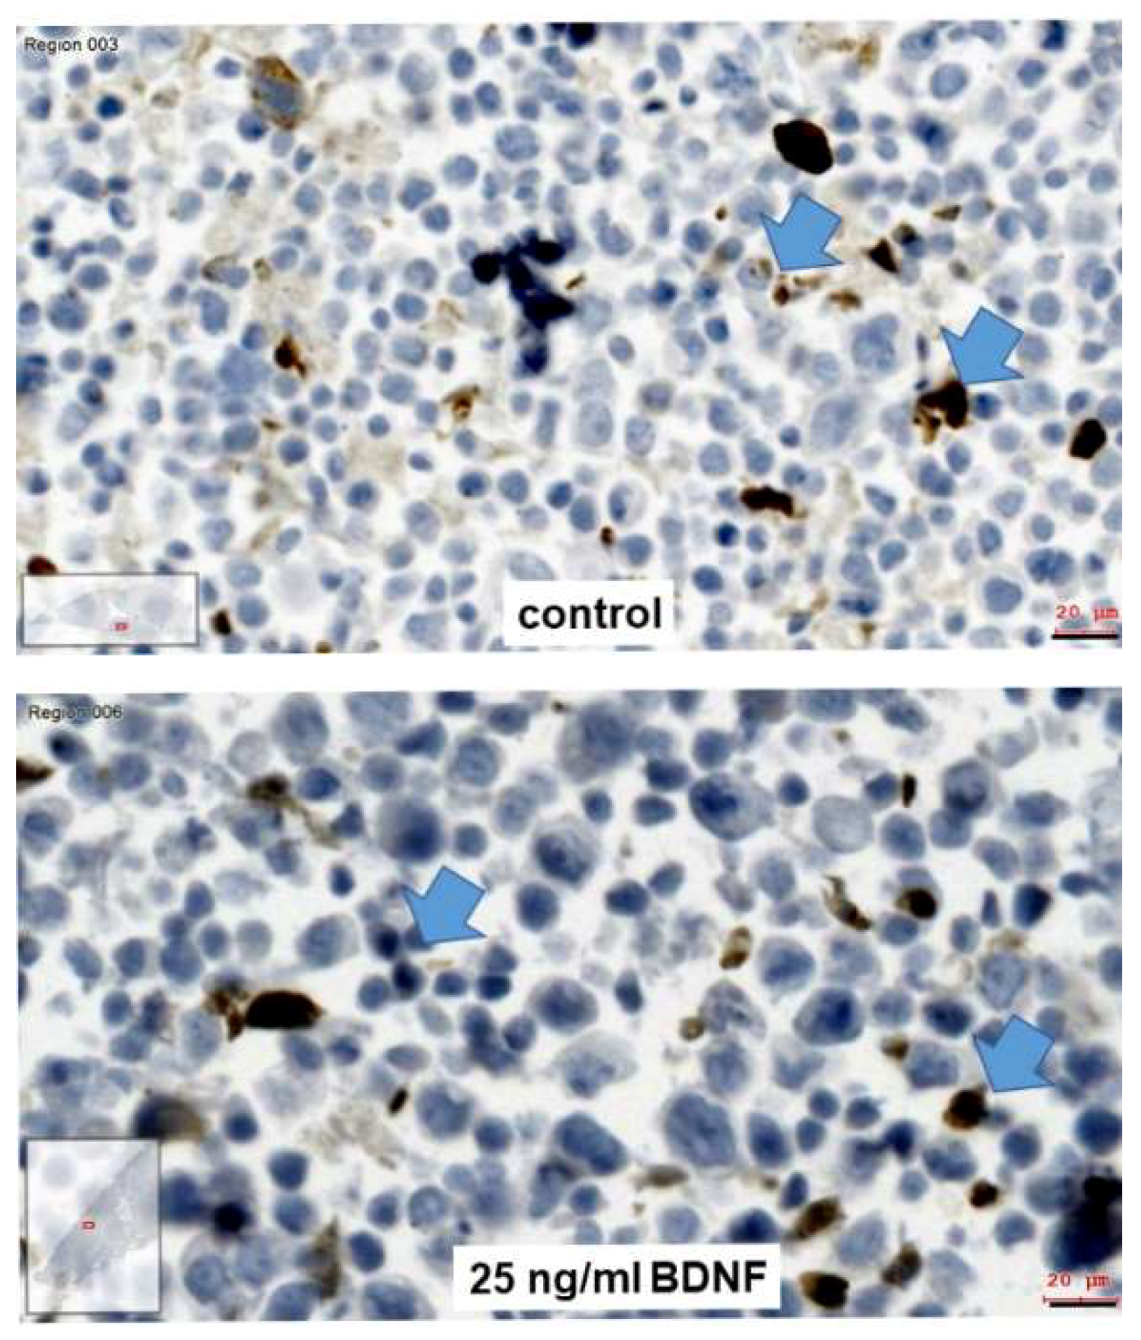
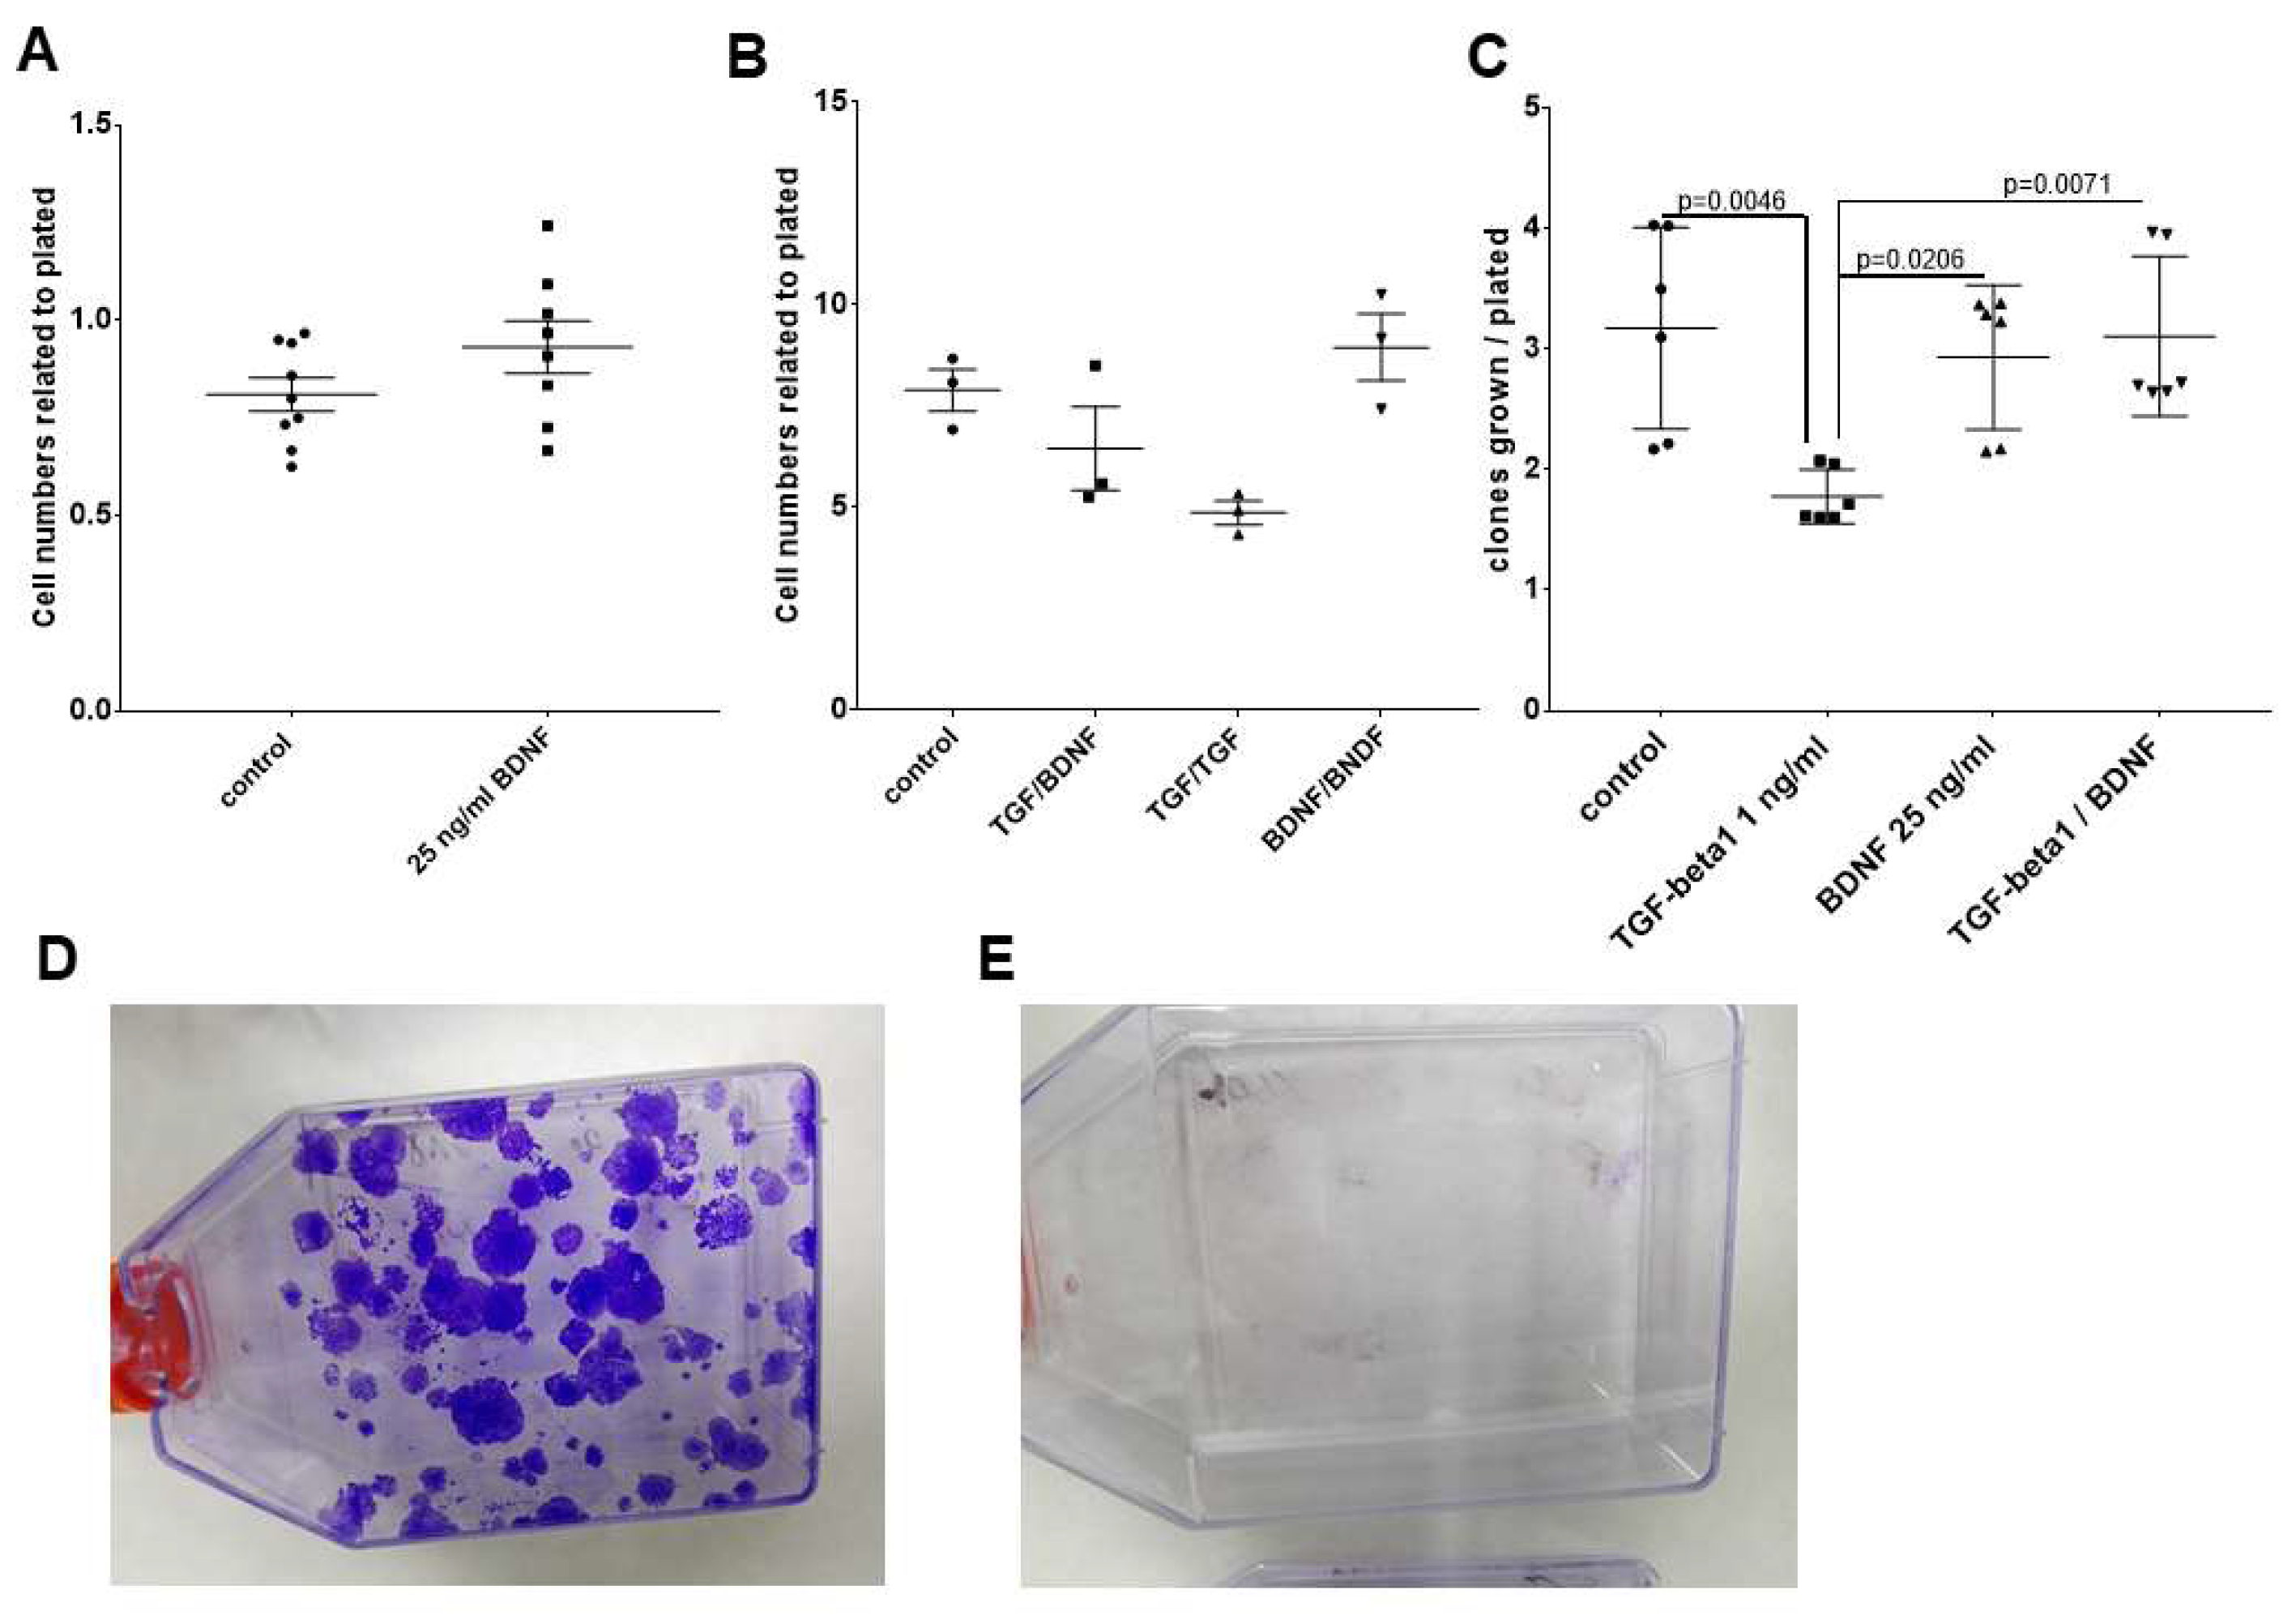
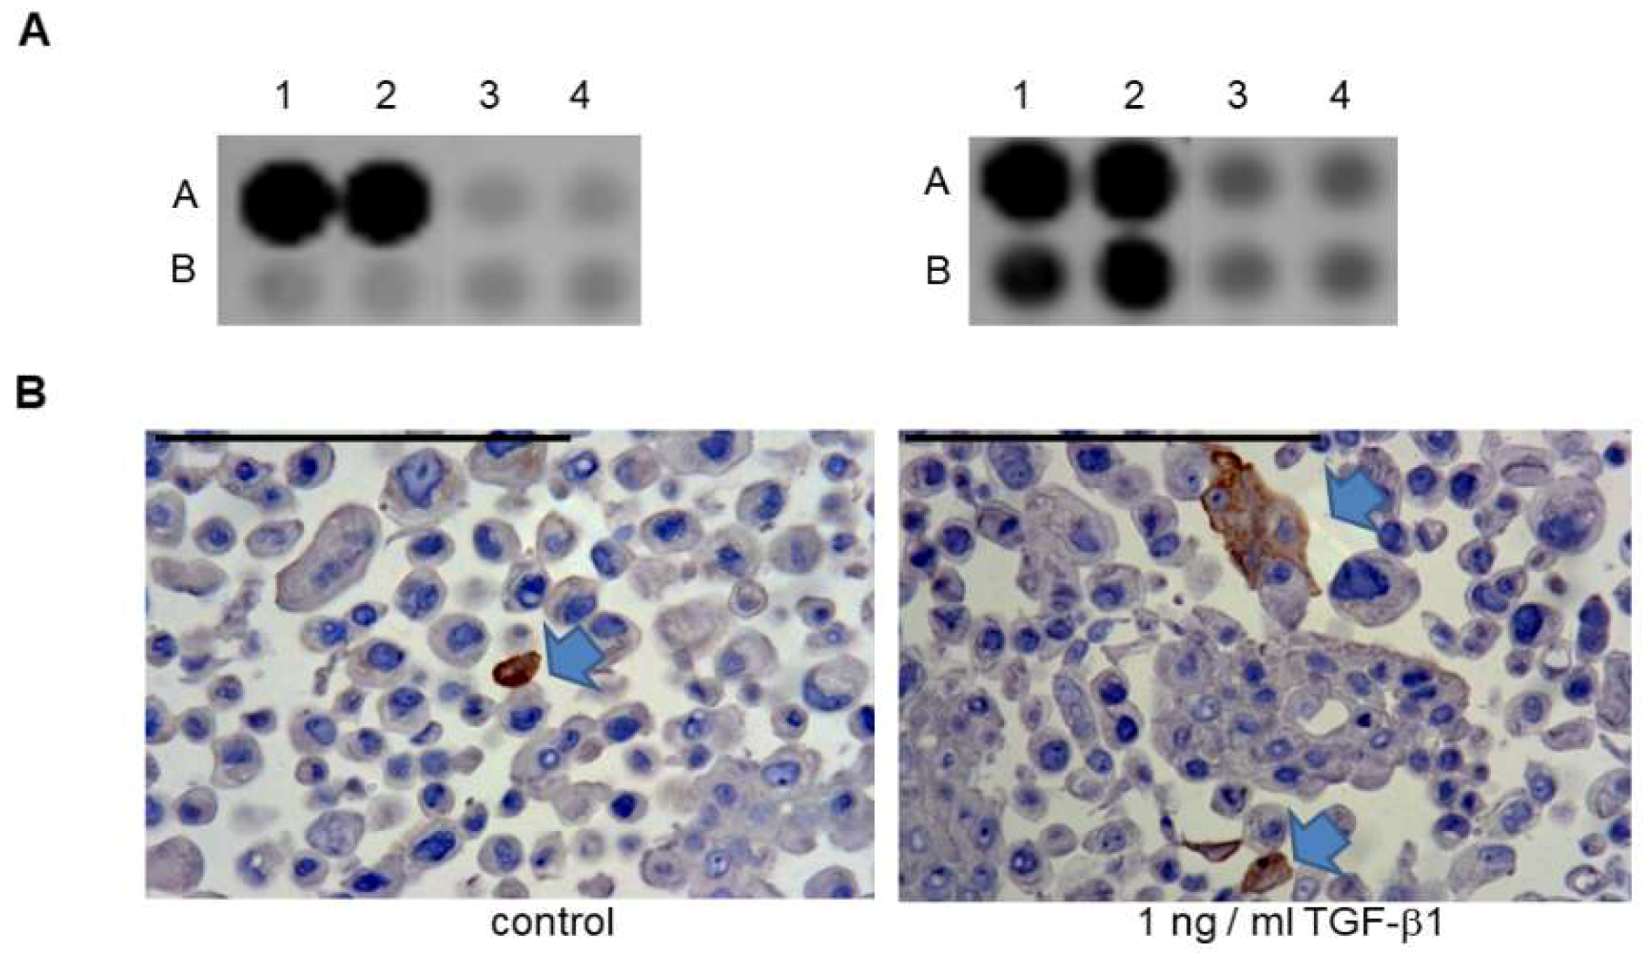
2.5. Effects of BDNF Treatments in SCC-25 Cells
3. Discussion
4. Materials and Methods
4.1. Patient Samples, Immunohistochemistry
4.2. In Situ Hybridization and Immunohistochemistry
4.3. Image Analysis of Immunohistochemistry and In Situ Hybridization
4.4. Cell Lines
4.5. Paraffin Embedding of Cultured Cells
4.6. Cell Treatments
4.7. RNA Isolation, PCR, and Sequencing
4.8. Protein Analysis in Cell Signaling Array
4.9. Statistical Analysis
Supplementary Materials
Author Contributions
Funding
Conflicts of Interest
Abbreviations
| ACTB | beta-actin gene |
| BDNF | brain-derived neurotrophic factor |
| DAPI | 4′,6-Diamidin-2-phenylindol |
| DIG | digoxigenin |
| EDTA | ethylene diamine tetra acetate |
| EMT | epithelial–mesenchymal transition |
| HNSCC | head and neck squamous cell carcinoma |
| HPV | human papilloma virus |
| MMC | mitomycin C |
| NGF | nerve growth factor |
| NTRK | neurotrophic receptor tyrosine kinase |
| OSCC | oral squamous cell carcinoma |
| P75NTR | p75 neurotrophin receptor |
| PBS | phosphate buffered saline |
| PCR | polymerase chain reaction |
| SCID | severe combined immunodeficiency |
| SEM | standard error of measurement |
| Trk | tropomyosin-related kinase |
| UPPP | uvulopalatopharyngoplasty |
References
- Akil, H.; Perraud, A.; Melin, C.; Jauberteau, M.O.; Mathonnet, M. Fine-tuning roles of endogenous brain-derived neurotrophic factor, TrkB and sortilin in colorectal cancer cell survival. PLoS ONE 2011, 6, e25097. [Google Scholar] [CrossRef] [PubMed]
- Pritz, C.O.; Bitsche, M.; Salvenmoser, W.; Dudas, J.; Schrott-Fischer, A.; Glueckert, R. Endocytic trafficking of silica nanoparticles in a cell line derived from the organ of Corti. Nanomedicine (Lond.) 2013, 8, 239–252. [Google Scholar] [CrossRef] [PubMed]
- Hempstead, B.L.; Schleifer, L.S.; Chao, M.V. Expression of functional nerve growth factor receptors after gene transfer. Science 1989, 243, 373–375. [Google Scholar] [CrossRef] [PubMed]
- Rodriguez-Tebar, A.; Dechant, G.; Barde, Y.A. Binding of brain-derived neurotrophic factor to the nerve growth factor receptor. Neuron 1990, 4, 487–492. [Google Scholar] [CrossRef]
- Squinto, S.P.; Stitt, T.N.; Aldrich, T.H.; Davis, S.; Bianco, S.M.; Radziejewski, C.; Glass, D.J.; Masiakowski, P.; Furth, M.E.; Valenzuela, D.M.; et al. trkB encodes a functional receptor for brain-derived neurotrophic factor and neurotrophin-3 but not nerve growth factor. Cell 1991, 65, 885–893. [Google Scholar] [CrossRef]
- Glueckert, R.; Pritz, C.O.; Roy, S.; Dudas, J.; Schrott-Fischer, A. Nanoparticle mediated drug delivery of rolipram to tyrosine kinase B positive cells in the inner ear with targeting peptides and agonistic antibodies. Front. Aging Neurosci. 2015, 7, 71. [Google Scholar] [CrossRef] [PubMed]
- Johnson Chacko, L.; Pechriggl, E.J.; Fritsch, H.; Rask-Andersen, H.; Blumer, M.J.; Schrott-Fischer, A.; Glueckert, R. Neurosensory Differentiation and Innervation Patterning in the Human Fetal Vestibular End Organs between the Gestational Weeks 8-12. Front. Neuroanat. 2016, 10, 111. [Google Scholar] [CrossRef] [PubMed]
- Liu, W.; Glueckert, R.; Kinnefors, A.; Schrott-Fischer, A.; Bitsche, M.; Rask-Andersen, H. Distribution of P75 neurotrophin receptor in adult human cochlea—An immunohistochemical study. Cell Tissue Res. 2012, 348, 407–415. [Google Scholar] [CrossRef] [PubMed]
- Ranjan, S.; Sood, R.; Dudas, J.; Glueckert, R.; Schrott-Fischer, A.; Roy, S.; Pyykko, I.; Kinnunen, P.K. Peptide-mediated targeting of liposomes to TrkB receptor-expressing cells. Int. J. Nanomed. 2012, 7, 3475–3485. [Google Scholar] [Green Version]
- Soumen, R.; Johnston, A.H.; Moin, S.T.; Dudas, J.; Newman, T.A.; Hausott, B.; Schrott-Fischer, A.; Glueckert, R. Activation of TrkB receptors by NGFbeta mimetic peptide conjugated polymersome nanoparticles. Nanomedicine 2012, 8, 271–274. [Google Scholar] [CrossRef]
- Ernfors, P.; Merlio, J.P.; Persson, H. Cells Expressing mRNA for Neurotrophins and their Receptors During Embryonic Rat Development. Eur. J. Neurosci. 1992, 4, 1140–1158. [Google Scholar] [CrossRef] [PubMed]
- de Moraes, J.K.; Wagner, V.P.; Fonseca, F.P.; Vargas, P.A.; de Farias, C.B.; Roesler, R.; Martins, M.D. Uncovering the role of brain-derived neurotrophic factor/tyrosine kinase receptor B signaling in head and neck malignancies. J. Oral Pathol. Med. 2018, 47, 221–227. [Google Scholar] [CrossRef] [PubMed]
- Lee, J.; Jiffar, T.; Kupferman, M.E. A novel role for BDNF-TrkB in the regulation of chemotherapy resistance in head and neck squamous cell carcinoma. PLoS ONE 2012, 7, e30246. [Google Scholar] [CrossRef] [PubMed]
- Kermani, P.; Hempstead, B. Brain-derived neurotrophic factor: A newly described mediator of angiogenesis. Trends Cardiovasc. Med. 2007, 17, 140–143. [Google Scholar] [CrossRef] [PubMed]
- Xu, H.; Czerwinski, P.; Xia, N.; Forstermann, U.; Li, H. Downregulation of BDNF Expression by PKC and by TNF-alpha in Human Endothelial Cells. Pharmacology 2015, 96, 1–10. [Google Scholar] [CrossRef] [PubMed]
- Kupferman, M.E.; Jiffar, T.; El-Naggar, A.; Yilmaz, T.; Zhou, G.; Xie, T.; Feng, L.; Wang, J.; Holsinger, F.C.; Yu, D.; et al. TrkB induces EMT and has a key role in invasion of head and neck squamous cell carcinoma. Oncogene 2010, 29, 2047–2059. [Google Scholar] [CrossRef] [Green Version]
- Zhu, L.; Werner, J.A.; Mandic, R. Implications of tropomyosin-related kinase B (TrkB) in head and neck cancer. Anticancer Res. 2007, 27, 3121–3126. [Google Scholar]
- Dudas, J.; Bitsche, M.; Schartinger, V.; Falkeis, C.; Sprinzl, G.M.; Riechelmann, H. Fibroblasts produce brain-derived neurotrophic factor and induce mesenchymal transition of oral tumor cells. Oral Oncol. 2011, 47, 98–103. [Google Scholar] [CrossRef] [Green Version]
- Dudas, J.; Fullar, A.; Bitsche, M.; Schartinger, V.; Kovalszky, I.; Sprinzl, G.M.; Riechelmann, H. Tumor-produced, active interleukin-1beta regulates gene expression in carcinoma-associated fibroblasts. Exp. Cell Res. 2011, 317, 2222–2229. [Google Scholar] [CrossRef]
- Metzler, V.M.; Pritz, C.; Riml, A.; Romani, A.; Tuertscher, R.; Steinbichler, T.; Dejaco, D.; Riechelmann, H.; Dudas, J. Separation of cell survival, growth, migration, and mesenchymal transdifferentiation effects of fibroblast secretome on tumor cells of head and neck squamous cell carcinoma. Tumour Biol. 2017, 39, 1010428317705507. [Google Scholar] [CrossRef]
- Bitsche, M.; Dudas, J.; Roy, S.; Potrusil, T.; Schmutzhard, J.; Schrott-Fischer, A. Neurotrophic receptors as potential therapy targets in postnatal development, in adult, and in hearing loss-affected inner ear. Otol. Neurotol. 2011, 32, 761–773. [Google Scholar] [CrossRef] [PubMed]
- Jiffar, T.; Yilmaz, T.; Lee, J.; Miller, Y.; Feng, L.; El-Naggar, A.; Kupferman, M.E. Brain derived neutrophic factor (BDNF) coordinates lympho-vascular metastasis through a fibroblast-governed paracrine axis in the tumor microenvironment. Cancer Cell Microenviron. 2017, 4, e1566. [Google Scholar] [PubMed]
- Stransky, N.; Cerami, E.; Schalm, S.; Kim, J.L.; Lengauer, C. The landscape of kinase fusions in cancer. Nat. Commun. 2014, 5, 4846. [Google Scholar] [CrossRef] [PubMed]
- Saleh, K.; Eid, R.; Haddad, F.G.; Khalife-Saleh, N.; Kourie, H.R. New developments in the management of head and neck cancer—Impact of pembrolizumab. Ther. Clin. Risk Manag. 2018, 14, 295–303. [Google Scholar] [CrossRef] [PubMed]
- Gottgens, E.L.; Ostheimer, C.; Bussink, J.; Span, P.N.; Hammond, E. HPV, hypoxia and radiation response in head and neck cancer. Br. J. Radiol. 2018, 20180047. [Google Scholar] [CrossRef]
- Salazar, C.R.; Smith, R.V.; Garg, M.K.; Haigentz, M., Jr.; Schiff, B.A.; Kawachi, N.; Anayannis, N.; Belbin, T.J.; Prystowsky, M.B.; Burk, R.D.; et al. Human papillomavirus-associated head and neck squamous cell carcinoma survival: A comparison by tumor site and initial treatment. Head Neck Pathol. 2014, 8, 77–87. [Google Scholar] [CrossRef]
- Rudzinski, E.R.; Lockwood, C.M.; Stohr, B.A.; Vargas, S.O.; Sheridan, R.; Black, J.O.; Rajaram, V.; Laetsch, T.W.; Davis, J.L. Pan-Trk Immunohistochemistry Identifies NTRK Rearrangements in Pediatric Mesenchymal Tumors. Am. J. Surg. Pathol. 2018, 42, 927–935. [Google Scholar] [CrossRef]
- Dudas, J.; Dietl, W.; Romani, A.; Reinold, S.; Glueckert, R.; Schrott-Fischer, A.; Dejaco, D.; Johnson Chacko, L.; Tuertscher, R.; Schartinger, V.H.; et al. Nerve Growth Factor (NGF)-Receptor Survival Axis in Head and Neck Squamous Cell Carcinoma. Int. J. Mol. Sci. 2018, 19, 1771. [Google Scholar] [CrossRef]
- Kofler, B.; Borena, W.; Manzl, C.; Dudas, J.; Wegscheider, A.S.; Jansen-Durr, P.; Schartinger, V.; Riechelmann, H. Sensitivity of tumor surface brushings to detect human papilloma virus DNA in head and neck cancer. Oral Oncol. 2017, 67, 103–108. [Google Scholar] [CrossRef]
- Bouchalova, P.; Nenutil, R.; Muller, P.; Hrstka, R.; Appleyard, M.V.; Murray, K.; Jordan, L.B.; Purdie, C.A.; Quinlan, P.; Thompson, A.M.; et al. Mutant p53 accumulation in human breast cancer is not an intrinsic property or dependent on structural or functional disruption but is regulated by exogenous stress and receptor status. J. Pathol. 2014, 233, 238–246. [Google Scholar] [CrossRef]
- Rheinwald, J.G.; Beckett, M.A. Tumorigenic keratinocyte lines requiring anchorage and fibroblast support cultured from human squamous cell carcinomas. Cancer Res. 1981, 41, 1657–1663. [Google Scholar] [PubMed]
- Chen, Y.W.; Lin, G.J.; Chia, W.T.; Lin, C.K.; Chuang, Y.P.; Sytwu, H.K. Triptolide exerts anti-tumor effect on oral cancer and KB cells in vitro and in vivo. Oral Oncol. 2009, 45, 562–568. [Google Scholar] [CrossRef] [PubMed]
- Sinha, U.K.; Schorn, V.J.; Hochstim, C.; Chinn, S.B.; Zhu, S.; Masood, R. Increased radiation sensitivity of head and neck squamous cell carcinoma with sphingosine kinase 1 inhibition. Head Neck 2011, 33, 178–188. [Google Scholar] [CrossRef] [PubMed]
- Steinbichler, T.B.; Metzler, V.; Pritz, C.; Riechelmann, H.; Dudas, J. Tumor-associated fibroblast-conditioned medium induces CDDP resistance in HNSCC cells. Oncotarget 2016, 7, 2508–2518. [Google Scholar] [CrossRef] [PubMed]
- Steinbichler, T.B.; Alshaimaa, A.; Maria, M.V.; Daniel, D.; Herbert, R.; Jozsef, D.; Ira-Ida, S. Epithelial-mesenchymal crosstalk induces radioresistance in HNSCC cells. Oncotarget 2018, 9, 3641–3652. [Google Scholar] [CrossRef] [PubMed]
- Sano, D.; Xie, T.X.; Ow, T.J.; Zhao, M.; Pickering, C.R.; Zhou, G.; Sandulache, V.C.; Wheeler, D.A.; Gibbs, R.A.; Caulin, C.; et al. Disruptive TP53 mutation is associated with aggressive disease characteristics in an orthotopic murine model of oral tongue cancer. Clin. Cancer Res. 2011, 17, 6658–6670. [Google Scholar] [CrossRef]
- Peterson, W.D., Jr.; Stulberg, C.S.; Simpson, W.F. A permanent heteroploid human cell line with type B glucose-6-phosphate dehydrogenase. Proc. Soc. Exp. Biol. Med. 1971, 136, 1187–1191. [Google Scholar] [CrossRef] [PubMed]
- Peterson, W.D., Jr.; Stulberg, C.S.; Swanborg, N.K.; Robinson, A.R. Glucose-6-phosphate dehydrogenase isoenzymes in human cell cultures determined by sucrose-agar gel and cellulose acetate zymograms. Proc. Soc. Exp. Biol. Med. 1968, 128, 772–776. [Google Scholar] [CrossRef] [PubMed]
- Ferris, R.L.; Martinez, I.; Sirianni, N.; Wang, J.; Lopez-Albaitero, A.; Gollin, S.M.; Johnson, J.T.; Khan, S. Human papillomavirus-16 associated squamous cell carcinoma of the head and neck (SCCHN): A natural disease model provides insights into viral carcinogenesis. Eur. J. Cancer 2005, 41, 807–815. [Google Scholar] [CrossRef] [PubMed]
- Draper, B.K.; Komurasaki, T.; Davidson, M.K.; Nanney, L.B. Epiregulin is more potent than EGF or TGFalpha in promoting in vitro wound closure due to enhanced ERK/MAPK activation. J. Cell. Biochem. 2003, 89, 1126–1137. [Google Scholar] [CrossRef]
- Vishnoi, K.; Mahata, S.; Tyagi, A.; Pandey, A.; Verma, G.; Jadli, M.; Singh, T.; Singh, S.M.; Bharti, A.C. Human papillomavirus oncoproteins differentially modulate epithelial-mesenchymal transition in 5-FU-resistant cervical cancer cells. Tumour Biol. 2016, 37, 13137–13154. [Google Scholar] [CrossRef] [PubMed]
- Thomas, R.J.; Oleinik, N.; Panneer Selvam, S.; Vaena, S.G.; Dany, M.; Nganga, R.N.; Depalma, R.; Baron, K.D.; Kim, J.; Szulc, Z.M.; et al. HPV/E7 induces chemotherapy-mediated tumor suppression by ceramide-dependent mitophagy. EMBO Mol. Med. 2017, 9, 1030–1051. [Google Scholar] [CrossRef]
- Chen, W.; Zhong, X.; Wei, Y.; Liu, Y.; Yi, Q.; Zhang, G.; He, L.; Chen, F.; Liu, Y.; Luo, J. TGF-beta Regulates Survivin to Affect Cell Cycle and the Expression of EGFR and MMP9 in Glioblastoma. Mol. Neurobiol. 2016, 53, 1648–1653. [Google Scholar] [CrossRef] [PubMed]
- Harada, C.; Harada, T.; Nakamura, K.; Sakai, Y.; Tanaka, K.; Parada, L.F. Effect of p75NTR on the regulation of naturally occurring cell death and retinal ganglion cell number in the mouse eye. Dev. Biol. 2006, 290, 57–65. [Google Scholar] [CrossRef] [PubMed] [Green Version]
- Kraemer, B.R.; Yoon, S.O.; Carter, B.D. The biological functions and signaling mechanisms of the p75 neurotrophin receptor. Handb. Exp. Pharmacol. 2014, 220, 121–164. [Google Scholar] [PubMed]
- Oshimori, N.; Oristian, D.; Fuchs, E. TGF-beta promotes heterogeneity and drug resistance in squamous cell carcinoma. Cell 2015, 160, 963–976. [Google Scholar] [CrossRef] [PubMed]
- Westra, W.H.; Taube, J.M.; Poeta, M.L.; Begum, S.; Sidransky, D.; Koch, W.M. Inverse relationship between human papillomavirus-16 infection and disruptive p53 gene mutations in squamous cell carcinoma of the head and neck. Clin. Cancer Res. 2008, 14, 366–369. [Google Scholar] [CrossRef] [PubMed]
- Marur, S.; D’Souza, G.; Westra, W.H.; Forastiere, A.A. HPV-associated head and neck cancer: A virus-related cancer epidemic. Lancet Oncol. 2010, 11, 781–789. [Google Scholar] [CrossRef]
- Johnson Chacko, L.; Blumer, M.J.F.; Pechriggl, E.; Rask-Andersen, H.; Dietl, W.; Haim, A.; Fritsch, H.; Glueckert, R.; Dudas, J.; Schrott-Fischer, A. Role of BDNF and neurotrophic receptors in human inner ear development. Cell Tissue Res. 2017, 370, 347–363. [Google Scholar] [CrossRef] [Green Version]
- Schartinger, V.H.; Falkeis, C.; Laimer, K.; Sprinzl, G.M.; Riechelmann, H.; Rasse, M.; Virgolini, I.; Dudas, J. Neuroendocrine differentiation in head and neck squamous cell carcinoma. J. Laryngol. Otol. 2012, 126, 1261–1270. [Google Scholar] [CrossRef]
- Schmidt, A.; Steinritz, D.; Rothmiller, S.; Thiermann, H.; Scherer, A.M. Effects of sulfur mustard on mesenchymal stem cells. Toxicol. Lett. 2018, 293, 98–104. [Google Scholar] [CrossRef] [PubMed]
- La Spada, A.; Baronchelli, S.; Ottoboni, L.; Ruffini, F.; Martino, G.; Convertino, N.; Ntai, A.; Steiner, T.; Biunno, I.; De Blasio, A. Cell Line Macroarray: An Alternative High-Throughput Platform to Analyze hiPSC Lines. J. Histochem. Cytochem. 2016, 64, 739–751. [Google Scholar] [CrossRef] [PubMed]
- Dudás, J.; Fullár, A.; Romani, A.; Pritz, C.; Kovalszky, I.; Hans Schartinger, V.; Mathias Sprinzl, G.; Riechelmann, H. Curcumin targets fibroblast-tumor cell interactions in oral squamous cell carcinoma. Exp. Cell Res. 2013, 319, 800–809. [Google Scholar] [CrossRef] [PubMed]
- Fullár, A.; Kovalszky, I.; Bitsche, M.; Romani, A.; Schartinger, V.H.; Sprinzl, G.M.; Riechelmann, H.; Dudás, J. Tumor cell and carcinoma-associated fibroblast interaction regulates matrix metalloproteinases and their inhibitors in oral squamous cell carcinoma. Exp. Cell Res. 2012, 318, 1517–1527. [Google Scholar] [CrossRef] [PubMed] [Green Version]
- Vetterlein, D.; Young, P.L.; Bell, T.E.; Roblin, R. Immunological characterization of multiple weight forms of human cell plasminogen activators. J. Biol. Chem. 1979, 254, 575–578. [Google Scholar] [PubMed]
- Choi, S.J.; Choi, Y.I.; Kim, L.; Park, I.S.; Han, J.Y.; Kim, J.M.; Chu, Y.C. Preparation of compact agarose cell blocks from the residues of liquid-based cytology samples. Korean J. Pathol. 2014, 48, 351–360. [Google Scholar] [CrossRef] [PubMed]
- Kofler, B.; Romani, A.; Pritz, C.; Steinbichler, T.B.; Schartinger, V.H.; Riechelmann, H.; Dudas, J. Photodynamic Effect of Methylene Blue and Low Level Laser Radiation in Head and Neck Squamous Cell Carcinoma Cell Lines. Int. J. Mol. Sci. 2018, 19, 1107. [Google Scholar] [CrossRef]


| Tissue Type | Negative | Focal Staining Pattern | Diffuse Staining Pattern | Total |
|---|---|---|---|---|
| HNSCC | 75 | 30 | 26 | 131 |
| Normal tissue | 11 | 1 | 0 | 12 |
| Total | 87 | 31 | 26 | 144 |
| Tissue Type | Number of Cases | Percent/% |
|---|---|---|
| HNSCC | 131 | 91.0 |
| UPPP epithelium | 12 | 9.0 |
| Tumor Localization | Number of Cases | Percent/% |
| oral | 15 | 11.5 |
| nasopharynx | 3 | 2.3 |
| oropharynx | 72 | 55 |
| larynx | 23 | 17.6 |
| hypopharynx | 15 | 11.5 |
| other | 3 | 2.2 |
| Total | 131 | 100.0 |
| Gender | Frequency | Percent/% |
| Male | 102 | 77.9 |
| Female | 29 | 22.1 |
| Total | 105 | 100.0 |
| HPV | Frequency | Percent/% |
| Positive | 33 | 25.2 |
| Negative | 98 | 74.8 |
| Total | 131 | 100.0 |
© 2019 by the authors. Licensee MDPI, Basel, Switzerland. This article is an open access article distributed under the terms and conditions of the Creative Commons Attribution (CC BY) license (http://creativecommons.org/licenses/by/4.0/).
Share and Cite
Dudás, J.; Riml, A.; Tuertscher, R.; Pritz, C.; Steinbichler, T.B.; Schartinger, V.H.; Sprung, S.; Glueckert, R.; Schrott-Fischer, A.; Johnson Chacko, L.; et al. Brain-Derived Neurotrophin and TrkB in Head and Neck Squamous Cell Carcinoma. Int. J. Mol. Sci. 2019, 20, 272. https://0-doi-org.brum.beds.ac.uk/10.3390/ijms20020272
Dudás J, Riml A, Tuertscher R, Pritz C, Steinbichler TB, Schartinger VH, Sprung S, Glueckert R, Schrott-Fischer A, Johnson Chacko L, et al. Brain-Derived Neurotrophin and TrkB in Head and Neck Squamous Cell Carcinoma. International Journal of Molecular Sciences. 2019; 20(2):272. https://0-doi-org.brum.beds.ac.uk/10.3390/ijms20020272
Chicago/Turabian StyleDudás, József, Anna Riml, Raphaela Tuertscher, Christian Pritz, Teresa Bernadette Steinbichler, Volker Hans Schartinger, Susanne Sprung, Rudolf Glueckert, Anneliese Schrott-Fischer, Lejo Johnson Chacko, and et al. 2019. "Brain-Derived Neurotrophin and TrkB in Head and Neck Squamous Cell Carcinoma" International Journal of Molecular Sciences 20, no. 2: 272. https://0-doi-org.brum.beds.ac.uk/10.3390/ijms20020272