Article

Lipophilicity Determination of Quaternary (Fluoro)Quinolones by Chromatographic and Theoretical Approaches

by
Krzesimir Ciura
1,*,
Joanna Fedorowicz
2,
Filip Andrić
3,
Katarzyna Ewa Greber
1,
Alina Gurgielewicz
1,
Wiesław Sawicki
1 and
Jarosław Sączewski
4
1
Department of Physical Chemistry, Faculty of Pharmacy, Medical University of Gdańsk, Al. Gen. J. Hallera 107, 80-416 Gdańsk, Poland
2
Department of Chemical Technology of Drugs, Faculty of Pharmacy, Medical University of Gdańsk, Al. Gen. J. Hallera 107, 80-416 Gdańsk, Poland
3
Department for Analytical Chemistry, University of Belgrade-Faculty of Chemistry, Studentski trg 12–16, 11000 Belgrade, Serbia
4
Department of Organic Chemistry, Faculty of Pharmacy, Medical University of Gdańsk, Al. Gen. J. Hallera 107, 80-416 Gdańsk, Poland
*
Author to whom correspondence should be addressed.
Int. J. Mol. Sci. 2019, 20(21), 5288; https://0-doi-org.brum.beds.ac.uk/10.3390/ijms20215288
Submission received: 24 September 2019 / Revised: 22 October 2019 / Accepted: 22 October 2019 / Published: 24 October 2019

Abstract

:
Lipophilicity is a vital physicochemical parameter of a molecule, which affects several biological processes such as absorption, tissue distribution, and pharmacokinetic properties. In this study, evaluation of lipophilicities of a series of novel fluoroquinolone-Safirinium dye hybrids using chromatographic and computational methods is presented. Fluoroquinolone-Safirinium dye hybrids have been synthesized as new dual-acting hydrophilic antibacterial agents. Reversed phase thin-layer chromatography and micellar electrokinetic chromatography experiments were carried out. Furthermore, logP values of the target structures were predicted by means of different software platforms and algorithms. In order to assess similarities and dissimilarities of the obtained lipophilicity indexes, cluster analysis and sum of ranking differences were performed. The significant differences of calculated logP values (α = 0.05, p < 0.001) indicated that an experimental approach is necessary for lipophilicity prediction of this class of antibiotics. Chromatographic data indicated that the newly synthesized hybrid (fluoro)quinolone-based quaternary ammonium derivatives show less lipophilic character than the parent (fluoro)quinolones. Additionally, the chromatographically obtained lipophilicity indexes were evaluated for possible application in quantitative retention–activity relationships. The established lipophilicity models have the potential to predict antimicrobial activities of a series of quaternary (fluoro)quinolones against Bacillus subtilis, Escherichia coli, and Proteus vulgaris.

1. Introduction

Lipophilicity is one of the most frequently examined physicochemical properties of drug candidates. Typically, it is determined in order to support quantitative structure-activity relationships (QSAR), including prediction of biological process such as absorption, tissue distribution, and others pharmacokinetic properties [1,2]. Moreover, lipophilicity is also taken into account in lipophilic ligand efficiency assessments (LLE) [1,3].
Lipophilicity is characterized by solute distribution in biphasic liquid-liquid or solid-liquid systems. The traditional method proposed by Hansch and co-workers involves a shake-flask procedure where partition coefficient of the target compound between n-octanol and water (logP) is assessed. Although this method is practically not applied nowadays, the logP universal scale is generally used to represent lipophilic character of a molecule [4].
Currently, three methods for lipophilicity assessment are recommended by the Organization of Economic Co-operation and Development: shake-flask, high-performance liquid chromatography (HPLC), and slow-stirring [4].
Among these methods chromatographic approaches are very widespread, since such indirect methods demonstrate significant advantages compared to a shake-flask procedure. The chromatographic approach is inexpensive, rapid, and requires a small amount of substances that do not need to be very pure, as their impurities are readily separated during the chromatographic analysis [5]. What is more, the chromatographic methods are repeatable and robust. It should be emphasized that the methods based on the solid-liquid partitioning are very convenient in early steps of drug development when a high-throughput is required instead of a high accuracy.
Other indirect methods based on electrokinetic chromatography (EKC) have been proposed as alternatives for lipophilicity estimation, including micellar electrokinetic chromatography (MEKC) and microemulsion electrokinetic chromatography (MEEKC).
Furthermore, the in silico approach has been proposed for lipophilicity assessment. Recently, several software programs for logP calculation have been developed. Nevertheless, it should be emphasized that experimental data are still preferred. Hence, significant differences between the calculated logP values for the same chemical structures using various theoretical approaches can be regarded as one of the major limitations of the computational methods. These discrepancies can be explained by the fact that newly synthesized drug candidates may contain substructures or heterocyclic systems that are not covered by the software development training set [2]. Other limitations may include misclassification of some potentially active compounds in terms of their logP value based on the Lipinski’s rule of 5 [3,6].
A series of novel fluoroquinolone-Safirinium dye hybrids have been synthesized as new dual-acting hydrophilic antibacterial agents [7]. These conjugates cause perturbation of the lipid bilayer of the bacterial cytoplasmic membrane and the outer membrane of gram-negative bacteria due to the presence of quaternary ammonium group, and inhibition of DNA gyrase/bacterial topoisomerase IV elicited by fluoroquinolone portion.
The main goal of this study was to evaluate the lipophilicities of a series of fluoroquinolone-Safirinium dye hybrids and their parent fluoroquinolones using typical reversed phase thin layer chromatography (RP-TLC) approach, MEKC, and computational methods. In order to compare logP values calculated by various algorithms, cluster analysis (HCA) was performed. The obtained lipophilicity parameters were correspondingly grouped by the nonparametric method, based on sum of ranking differences protocol. Furthermore, the chromatographically obtained lipophilicity indexes were evaluated for possible application in quantitative retention–activity relationships (QRAR). The proposed QRAR equations can be used for prediction of antimicrobial activities of this chemical group of antibiotics.

2. Results and Discussion

2.1. Computationally Estimated Lipophilicity Parameters

The computational approaches for lipophilicity determination have several advantages over the experimental methods, including short calculation time. Another benefit is the fact that calculated logP parameters can be obtained prior to synthesis. Consequently, the first selection of structures with desired lipophilicity can be done when the drug candidates are designed. Hence, computational methods can save time and chemical reagents. For these reasons, the computational approaches are very attractive from the economic and environmental points of view.
LogP values for all the investigated compounds predicted by means of 10 different software platforms and algorithms are summarized in Table 1.
The algorithms utilized are based on various theoretical methodologies. Briefly, there are three main groups of algorithms used for logP calculations: Atomic approach, fragment contribution technique, and properties-dependent methods. Classification of the investigated software based on algorithm type is presented in Table 2. HCA was performed in order to show similarities and dissimilarities between the logP values calculated with various programs. Among the agglomerative clustering methods, Ward’s method was selected because of its unique properties. It is based on a classical sum-of-squares criterion, producing groups that minimize within-group dispersion at each binary fusion [8]. Results of CA analysis are presented as a tree diagram in Figure 1.
The simplest theoretical models are established on pure atomic approaches, which presuppose that each atom contributes to the logP parameter (AClogP). More complex algorithms are implemented into XlogP2 since this atom-based method is corrected by factors integrated within the program. In case of XlogP3, calculations start from similar reference structures with known logP, which are corrected with the atomic approach. The results obtained with approaches that use the atomic-based methods are predominantly grouped in the second cluster (B). One would expect that software which utilizes the fragment contribution should give more accurate results. The advantage of this calculation method compared with the atomic approach is the fact that this method includes information of electronic or intramolecular interactions. However, HCA found that ChemDraw and miLog are outliers. Among the tested programs, AlogP and MlogP employ property-dependent algorithms. AlogP is found in cluster A together with KOWWINlogP, which utilizes hybrid algorithm combining both an atom-based approach and fragmental contribution method. Although MlogP applies topological indexes, it is found in the cluster B, together with AClogP, XlogP3, and average logP. AlogPs use a self-learning method based on associative neuronal networks from molecular structures. It is grouped with the AClogP, XlogP3, and average logP in the cluster B.
The calculated logP values for the newly synthesized quinolone derivatives (whose structures are presented in Table S1) reveal huge differences. For example, miLogP approach results in −5.08 for compound 1, while XlogP3 scheme provides a notably contradictory value of 3.57. These differences can be to some extent explained by the presence of quaternary ammonium cation in structures of the newly synthesized quinolone derivatives. Hence, these hybrids are permanently charged, which can cause difficulties in lipophilicity calculation.
Nevertheless, a similar situation takes place when comparing logP values calculated for parent (fluoro)quinolone antibiotics (FQs), for example ciprofloxacin (milogP −3.57 vs XlogP2 1.46). The same structures could be hydrophilic or lipophilic depending on the software applied. The estimated logP values with atom-based methods are higher compared to other methods, except for AlogP parameter. Similar observations have been noticed by Kłosińska-Szmurło and co-workers for FQs antibiotics [9]. These findings confirm the thesis that correction of the calculated logP values is necessary. Steric and electronic interactions can significantly influence lipophilicity of this class of compounds. Summing up, the observed huge differences among the calculated logP values clearly demonstrate that the experimental approach is still necessary for lipophilicity assessment of particular classes of drugs, such as investigated (fluoro)quinolone derivatives. The amphiphilic character of FQs makes assessments of lipophilicity very difficult for theoretical approaches. Most FQs exist in charged form within the physiological pH region. For this reason, their lipophilicity is considerably lower than many neutral and/or basic drugs. This phenomenon was extensively studied by Völgyi and co-workers [10].

2.2. Analysis of Chromatographic Data and Chromatographically Derived Lipophilicity Indexes

Several reports indicated that RP-TLC can be considered as an efficient tool for prediction of lipophilicity [11,12,13,14,15]. For this reason, two main RP-TLC stationary phases, C8 and C18-bonded silica gels were investigated during this study. Preliminary chromatographic analyses with buffered mobile phases (phosphoric buffer at pH 7.4.) showed very weak changes of retention compared to unbuffered systems. Similar results have been reported by Hubicka and co-workers for non-buffered TLC lipophilicity determination of FQs [16]. As proposed by Komsta, who examined the impact of several organic modifiers of mobile phase in terms of logP predictions [17], methanol was chosen as mobile phase organic component. Various chromatographic lipophilicity indexes, such as RM0, mean values of RM (mRM), hydrophobic constants b, and parameter C0 with likened hydrophobic and lipophilic information, were calculated based on TLC data. Furthermore, principal component analysis (PCA) analysis was implemented by means of a protocol proposed by Sarbu and co-workers [18]. This method allowed obtaining the first principal component, PC1, as another lipophilicity index.
The obtained retention factors, RM were listed in Table S2. All RP-TLC chromatographic lipophilicity parameters are listed in Table 3, whereas statistical details related to Soczewińki–Wachtmeister’s equation are summarized in Table S3.
In case of the target compounds, for both newly synthesized hybrids and parent quinolone antibiotics, the Soczewiński–Wachtmeister’s equation showed linear relationships between the RM values and the concentration of the organic modifier in the mobile phase. These findings were confirmed with high coefficients of correlation (R) and determination (R2), as well as high values of the F statistics. Conversely, small standard deviations or standard estimation errors indicated that all the obtained equations were highly significant. Similar observations for commercially available FQs were reported by Hubicka and co-workers for different RP-TLC chromatographic setups [17]. These results indicated that Soczewiński–Wachtmeister’s equation can be effectively applied for description of chromatographic properties of (fluoro)quinolones derivatives in RP-TLC.
In order to evaluate the hypothesis that the analytes can be regarded as a group of structurally similar compounds from the chromatographic point of view, linear correlation between slope and intercept of Soczewiński–Wachtmeister’s equation were examined.
RM0(C18) = −0.643 (±0.080)b + 0.865 (±0.185)
R = 0.869, R2= 0.754, F = 64.48, p < 0.0001, s = 0.273, N = 23
RM0(C8) = −0.553 (±0.075)b + 0.980 (±0.146)
R = 0.849, R2= 0.721, F = 54.344, p < 0.0001, s = 0.227, n = 23
Since these parameters were significantly intercorrelated, the investigated structures can be considered as a congeneric class of (fluoro)quinolone derivatives.
Interestingly, not all TLC chromatographic parameters are highly correlated with each other. The corresponding correlation matrix is presented in Table S4. This observation suggests that several TLC data processing schemes should be considered during the lipophilicity assessment, because each of the parameters may contain diverse information. Taking into account the chromatographic lipophilic parameters, the newly synthesized structures have more hydrophilic character than the parent quinolones.
Another tested method for lipophilicity assessment was MEKC. The aqueous micelle solution fills the capillary in MEKC and forms the pseudo-stationary phase. Mechanism of migration of analyses in MEKC is determined by lipophilicity of analytes. The more lipophilic the molecules are the stronger they interact with micelles and migrate toward the cathode with lower velocity [3,6]. The advantage of MEKC, compared to reversed-phase liquid chromatography, is elimination of the stationary phase since intercolumn variability can increase measurement errors [6]. Other benefits are shorter time analysis and significantly smaller consumption of organic solvents. For this reason, MEKC was used for lipophilicity assessment of the target compounds [7].
The lipophilicity measurement by MEKC was performed under physiological pH 7.4. The obtained logk parameters are summarized in Table 3. Satisfactory correlations between mRM, PC1, and logk (R < 0.835) were found. The newly synthesized hybrid (fluoro)quinolone-based quaternary ammonium derivatives show less lipophilic character than the parent (fluoro)quinolones. Significantly lower logk was noticed in case of pipemidic acid (logk = −0.1697) in comparison to other tested (fluoro)quinolone antibiotics. Among the tested (fluoro)quinolone antibiotics, only pipemidic acid belongs to the first generation of quinolone antibiotics which do not incorporate fluorine atom in the structure. Hence, other investigated antibiotics are classified as fluoroquinolones (FQs). Two newly synthesized pipemidic acid derivatives (6 and 10) displayed the most hydrophilic character among all tested structures. On the other hand, the most lipophilic compound in the examined group was enoxacin (logk = 0.1564). Among the tested hybrids, sparfloxacin derivative 3 incorporating two fluorine atoms proved the most lipophilic character (logk = −0.070).

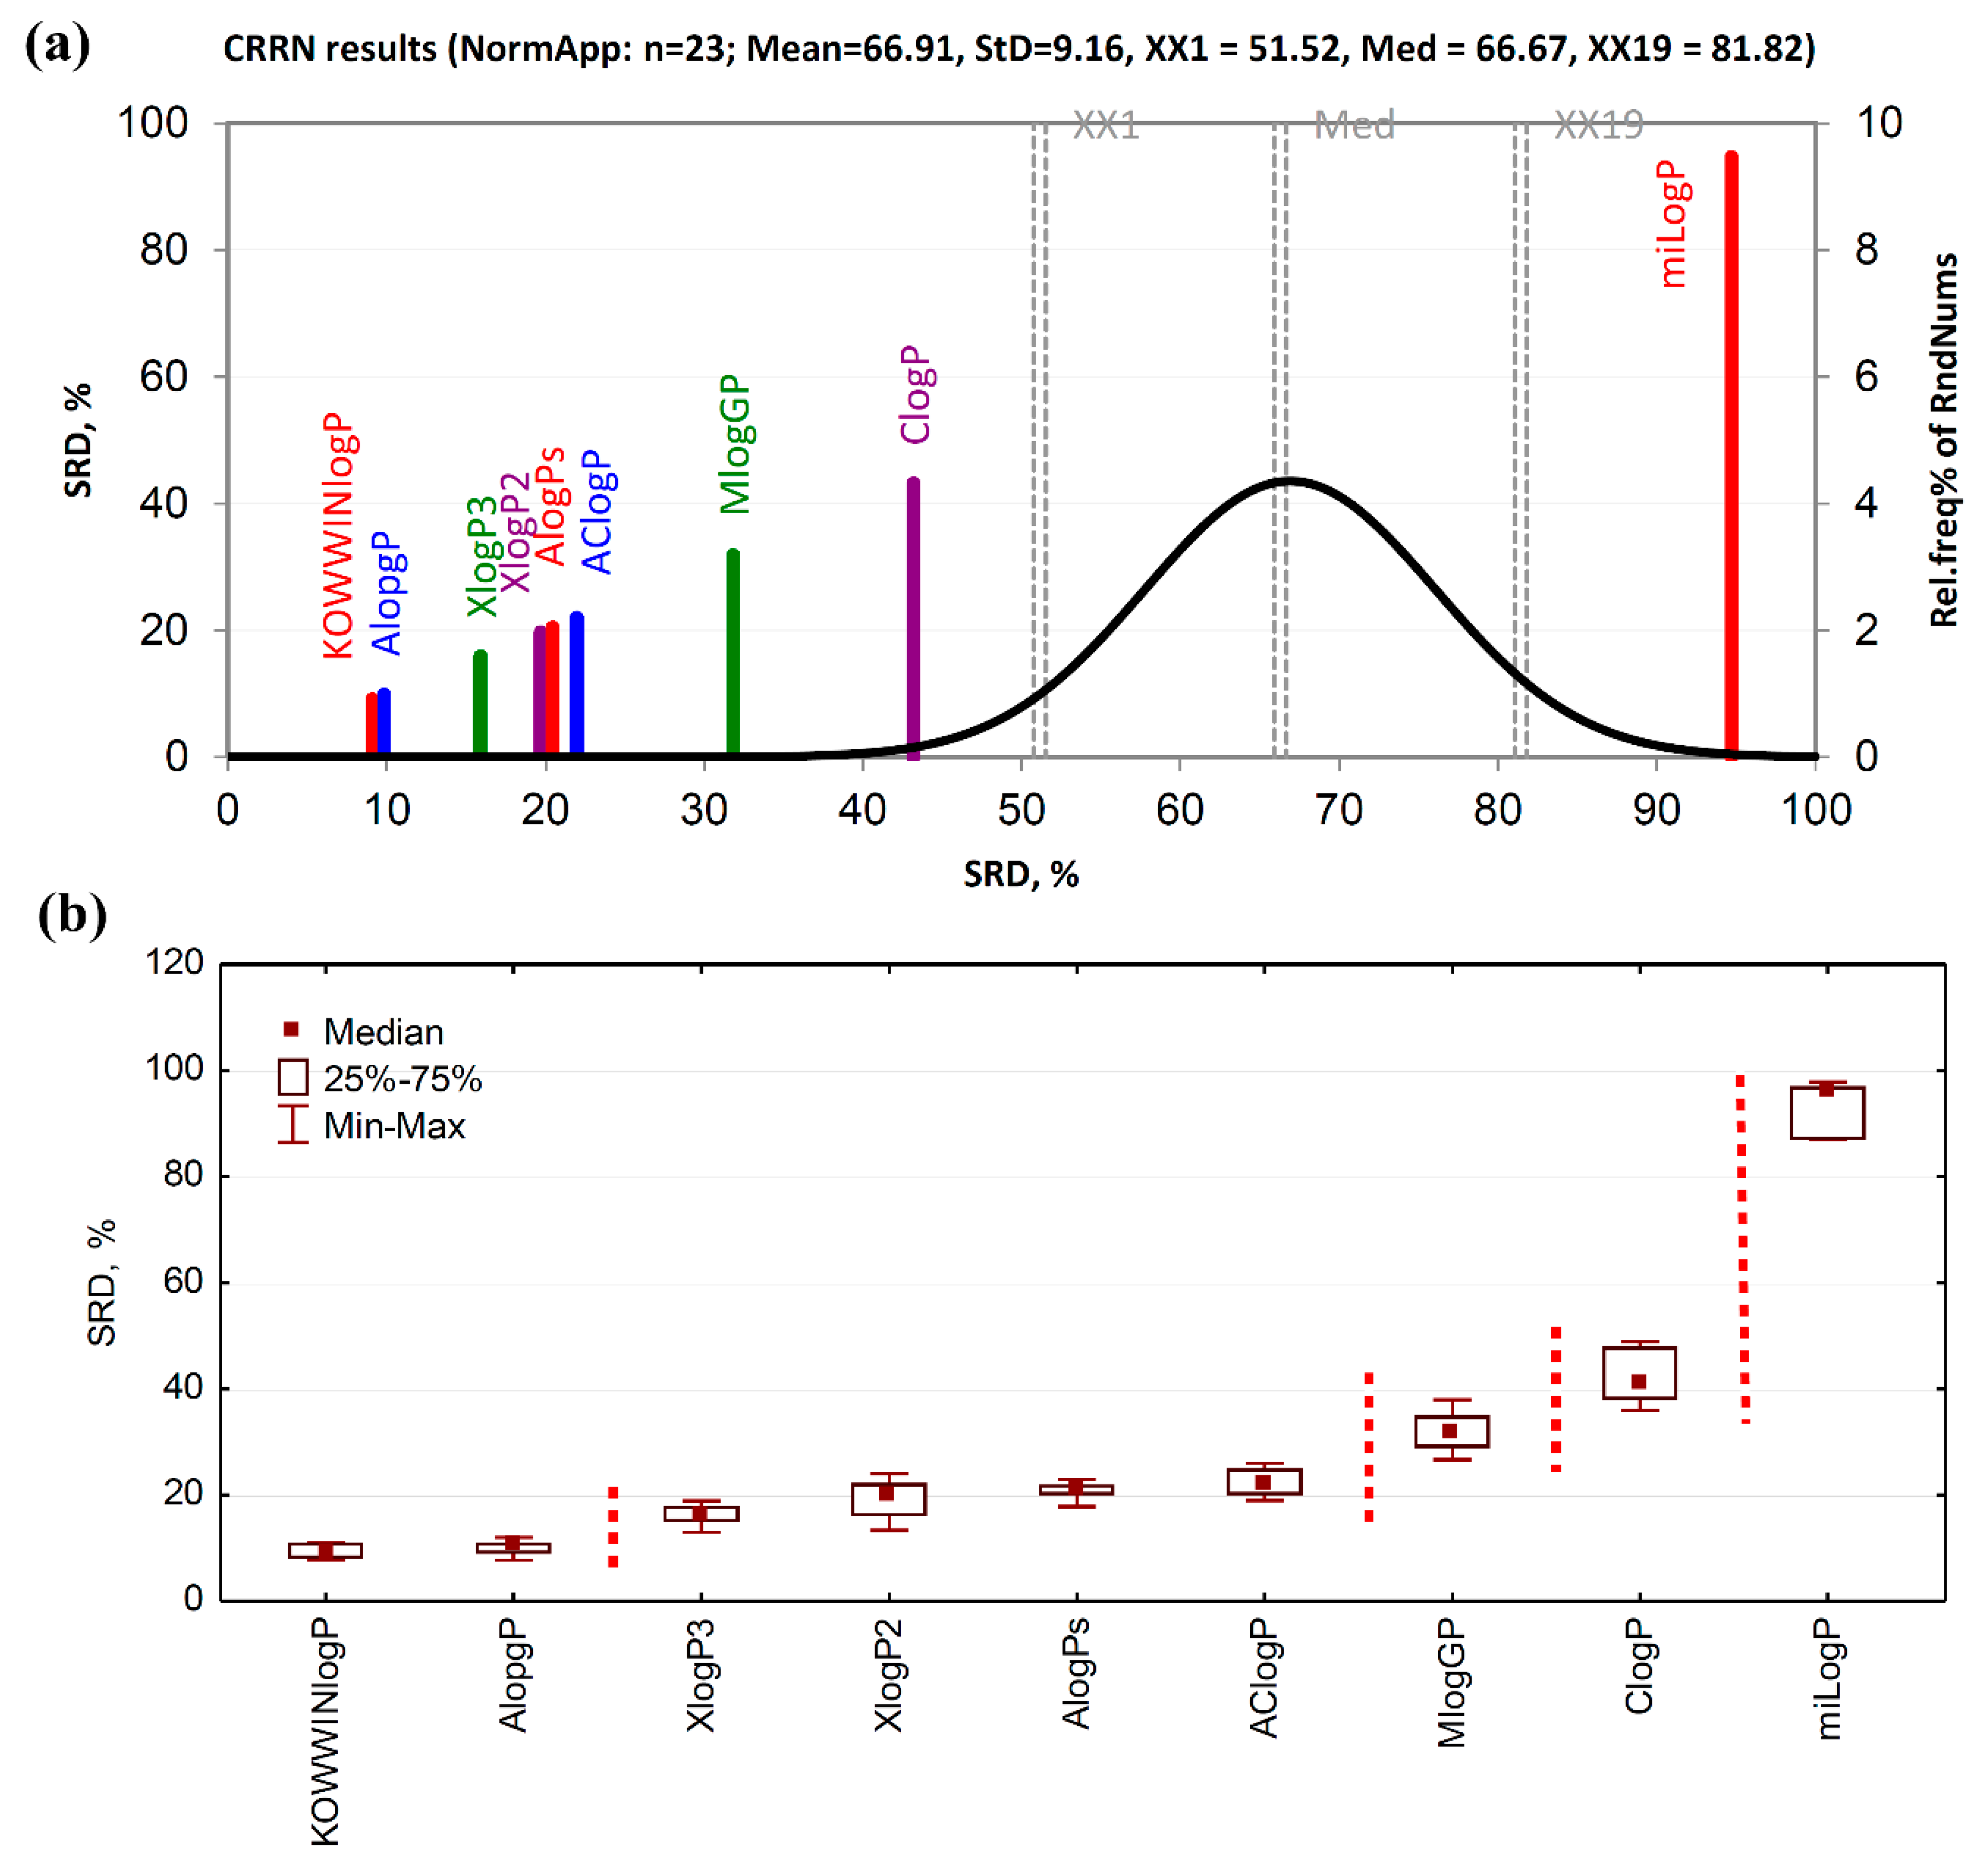
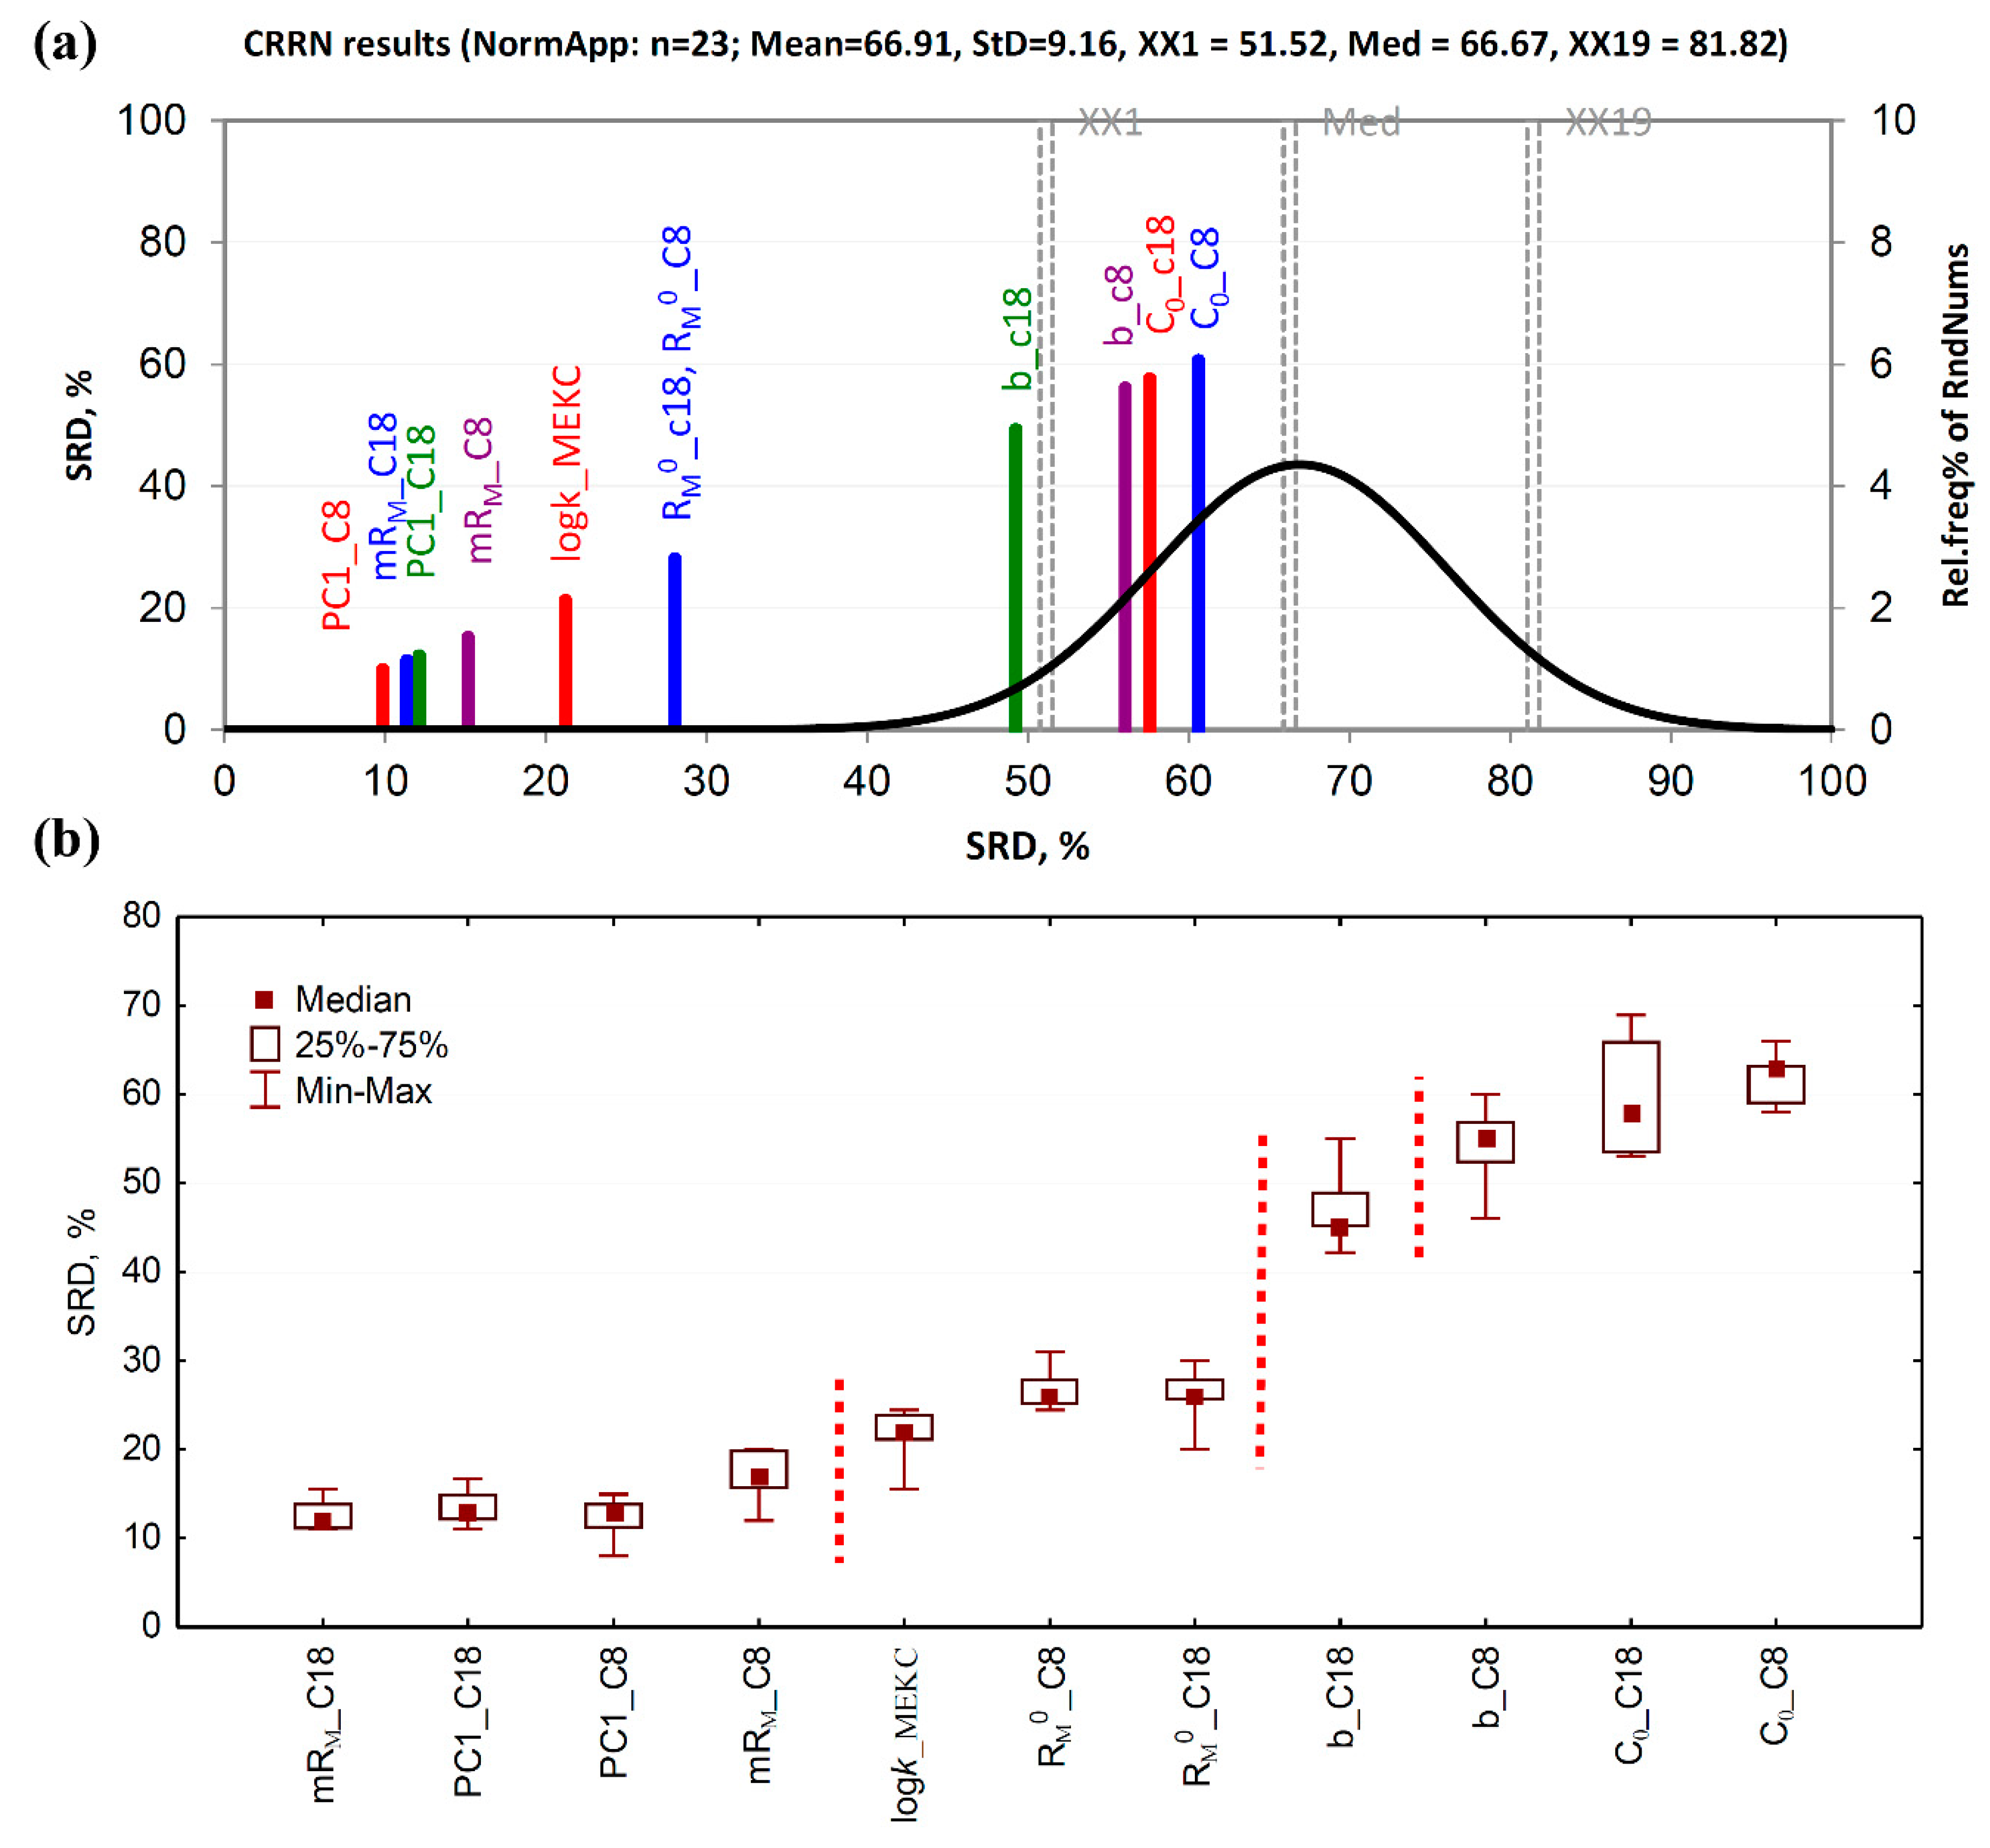
2.3. Sum of Ranking Differences of Computationally and Chromatographically Derived Lipophilicity Indexes

Although chemometric tools such as HCA and PCA, as well as inspection of a simple correlation matrix, can reveal some similarities and dissimilarities among lipophilicity descriptors [19,20,21]; these methods show considerable limitations. Both CA and PCA do not provide any information regarding the statistical significance of such similarities. Furthermore, these chemometric tools do not indicate or select the most suitable methods for lipophilicity estimation. Such problems can be solved by robust, nonparametric ranking methods, such as the sum of ranking differences (SRD). The usefulness of the SRD analysis for comparison of chromatographically determined lipophilicity parameters and those calculated in silico have been demonstrated by Héberger and Andrić [22,23,24].
The SRD workflow is simple. The data are arranged in a matrix. Methods to be compared are placed in columns, and objects (e.g., chemical compounds) in rows. Then, a benchmark, or reference column, is added. In a case of consensus comparison, it is a vector of arithmetic means. Then, column-wise ranking is performed, and the rank values associated with each particular method are subtracted from the reference ranks. In that way, rank differences are obtained. These differences are then summed up into the SRD values, which are associated with each method. The lower the SRD value, the closer the method to the reference is. In order for results of different SRD analyses to be compared, the normalized SRD value is calculated according to the equation:
S R D ( % ) = S R D S R D m a x × 100
Such a ranking can be validated in two ways. The first one is comparison of SRDs with theoretical random distribution of SRD values or by a simulation of random numbers. This is so-called comparison with random numbers (SRD-CRRN). The other way is a so-called sevenfold-cross validation. During the cross-validation process, one of seven objects is omitted and the SRD is performed on a truncated data matrix. Such procedure is repeated seven times. The result is seven SRD values associated with each method. Methods are then arranged in ascending order of the median SRD values and the results are depicted in the form of a box and whisker plot. Because the cross-validation extracts the variability of SRDs, it is possible to perform pairwise significance testing of each pair of methods. If no statistically significant difference among the methods is observed, they are grouped together. Otherwise, they are separated into different groups or sections.
The SRD-CRRN analysis of computational lipophilicity estimation approaches revealed that both, KOWWINlogP and AlogP, had the smallest SRD values, hence they are closest to the consensus and can be regarded as the best logP estimates (Figure 2a). They are closely followed by XlogP3, XlogP2, AlogPs, and AClogP. Although MlogP and ClogP are located a bit lower on the SRD scale, all the mentioned methods are on the left side of the plot, far from the random distribution curve, meaning that all of them are statistically significantly ranked. However, miLogP is located at the opposite side of the plot, also significantly distant from the random distribution curve which indicates statistically significant but opposite relation to the consensus and all other methods. Such a different behavior of miLogP was already explained in Section 3.1. Sevenfold cross-validation followed by the ordering of the SRD values medians and the pairwise significance testing of each of the studied lipophilicity estimation methods revealed that the first two methods (KOWWINlogP and AlogP) cannot be statistically significantly distinguished from each other at the significance level of p = 0.05, based on both the sign test as well as the Wilcoxon’s matched pairs test. They are placed together in the first section (Figure 2b). This is in accordance with the HCA analysis. Similarly, XlogP3, XlogP2, AlogPs, and AClogP are grouped together in the second section, while MlogP, ClogP, and miLogP are all separated from each other. Similar SRD results were observed using interval scaled as well as rank transformed logP data (Figures S1 and S2). The ordering of methods and composition of sections may slightly vary depending on data transformation.
The SRD analysis of chromatographic lipophilicity assessments revealed that PC1 scores, as well as mRM values, obtained on both stationary phases are among the best lipophilicity measures, closely followed by the extrapolated RM0 values and the logk values obtained from the MEKC experiments (Figure 3a). All of them are positioned on the left side of the plot, far from the random distribution curve, which indicates statistically significant ranking of fluoroquinolone derivatives according to their lipophilic character measured by these descriptors. However, the slope obtained on C8-modified silica, as well as C0 values, obtained on both sorbents, falls under the random distribution of SRDs, i.e., these chromatographic descriptors are not capable of distinguishing fluoroquinolone compounds according to the lipophilic character better than a chance. Therefore, such descriptors can be considered as the worst chromatographic lipophilicity measures. Sevenfold cross-validation, followed by nonparametric significance testing of SRD values, by both the Wilcoxon’s matched paired test and sign test, revealed that PC1 scores, as well as mRM values obtained on both sorbents, belong to the first and the best group of chromatographic descriptors, demonstrating no statistically significant difference among them. They are followed by the second group, consisting of logkMEKC and RM0 values obtained on both stationary phases. This confirms that retention of fluoroquinolone derivatives measured by micellar electrokinetic chromatography is equally suitable as extrapolated retention parameters obtained on C8- and C18-modified silica. However, the ability of interpolation parameters, such as PC1 and mRM, supersedes extrapolated parameters in describing lipophilic character. This is additionally confirmed by the fact that the slope obtained on C8-modified silica differed from the slope obtained on C18-modified sorbent which is, together with C0 values obtained on both stationary phases, in the last and the worst group of chromatographic descriptors. Similar findings were obtained using interval scaled and ranked data, with slight deviations in ordering and grouping of lipophilicity indexes depending on the data pretreatment, e.g., PC1_C8 becomes the first ranked in the case of interval scaled and rank transformed data. Also, logkMEKC may appear as a separate section (Figures S3 and S4).

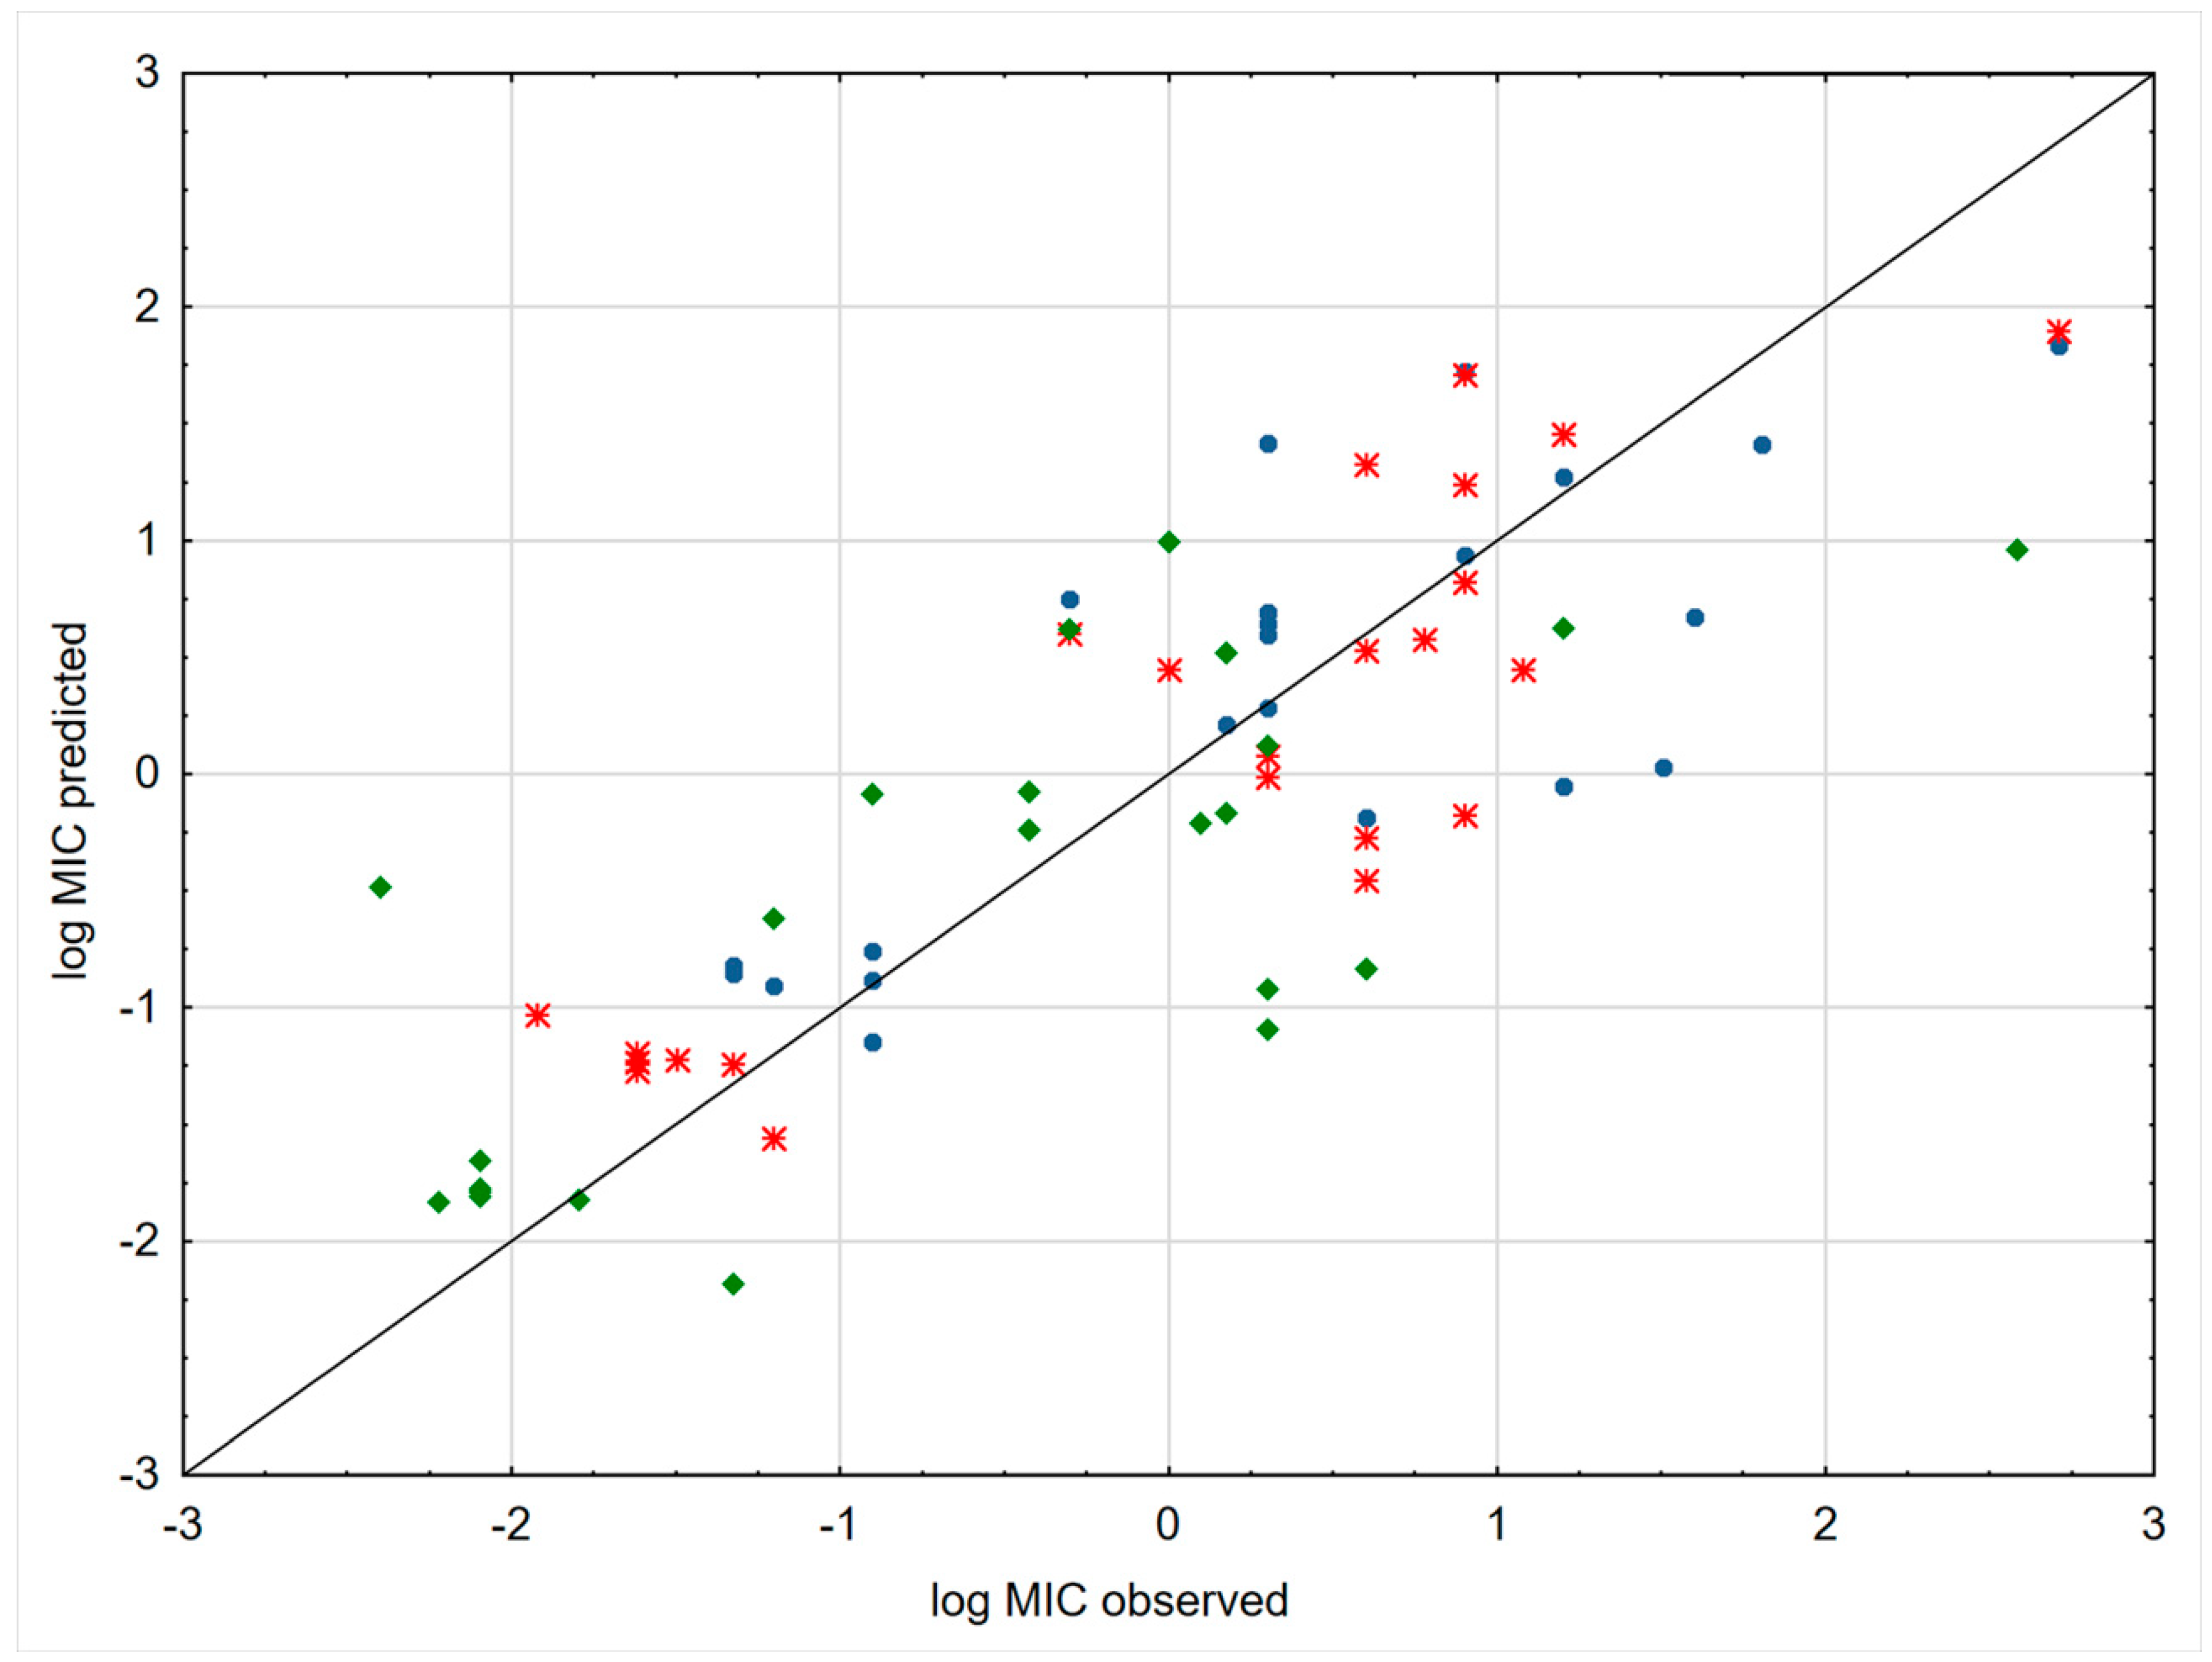
2.4. Quantitative Structure Retention/Activity Relationships QSRAR

Another aspect of the study involved suitability assessment of MEKC derived lipophilicity parameters for prediction of antimicrobial properties of the target (fluoro)quinolone derivatives. MEKC can be considered as a good biomimetic model since Sodium dodecyl sulfate (SDS) micelles have a similar anionic surfactant structure to natural phospholipids [25]. Generally, lipophilicity is a well-recognized physicochemical parameter, which influences antibacterial properties of different classes of antibiotics, including FQs [10,26]. Bilinear structure–activity relationships between distribution coefficient (logD at pH 7.4) and antibacterial properties were reported for 4′N-alkylciprofloxacin analogs [26]. Another study showed relationship between minimum inhibitory concentration (MIC) of two gram-positive bacteria species (Streptococcus pneumoniae and methicillin-susceptible Staphylococcus aureus) and the true partition coefficient of the selected FQs [10]. The above method is limited by complicated protocol for true partition coefficient assessment, as it requires determination of protonation microconstants and logD at the isoelectric point. The proposed MEKC method has significant advantages because it is simple, highly efficient, offers short time of analysis, and requires small amounts of samples and chemical reagents. Based on the microbiological data previously reported [7], an acceptable correlation was found between the logk and logMIC for three bacterial species as listed below.
logMIC(Bacillus subtilis) = − 4.286(±0.632)logk − 0.444(±0.170)
R = 0.823, R2 = 0.677, Q2 = 0.643, F = 46.385, p < 0.001, s = 0.650, n = 23
logMIC (Escherichia coli) = − 4.900(±0.553)logk − 0.745(±0.150)
R = 0.888, R2 = 0.789, Q2 = 0.750, F = 78.405, p < 0.001, s = 0.571, n = 23
logMIC (Proteus vulgaris) = − 1.346(±0.632)logk − 4.596(±0.794)
R = 0.784, R2 = 0.615, Q2 = 0.541, F = 33.5115, p < 0.001, s = 0.650, n = 23
The obtained models met the Tropsha et al. criteria (R2 > 0.6 and Q2 > 0.5) [27]. Figure 4 presented plots of predicted and experimental values of MIC. As might be expected, the obtained models do not explain completely antibacterial properties of (fluoro)quinolone derivatives. The retention data give information only about lipophilicity. MEKC experiment can mimic drug–t membranes interactions. FQs have a typical drug–receptor mechanism of action, i.e., they inhibit the action of type II topoisomerases, DNA gyrase, and DNA topoisomerase IV [28]. The steric and electrostatic interactions between FQs and enzymes strongly affect antibacterial properties. Nevertheless, the obtained results indicated that lipophilicity is one of the vital parameters which considerably influences antibacterial properties. The plot showing the relation between the observed and predicted values of logMIC is presented in Figure 4. Our QRAR models confirm the observation reported by Völgyi [10] that lipophilicity increase within a series of (fluoro)quinolone derivatives can be associated with an improved antibacterial profile. These results clearly suggest that there is a correlation between lipophilicity and antibacterial properties of FQs. Presumably more lipophilic structures diffuse more easily into bacterial cells [29].

3. Materials and Methods

3.1. Reagents

Sodium dodecyl sulfate (SDS), 4-(2-hydroxyethyl)piperazine-1-ethanesulfonic acid (HEPES), and tris(hydroxymethyl)aminomethane (TRIS) were supplied by Sigma-Aldrich (Steinheim, Germany). Dimethyl sulfoxide (DMSO) was purchased from POCH (Gliwice, Poland). Methanol and acetone analytical grade for liquid chromatography was purchased from Sigma-Aldrich (Steinheim, Germany). Ultrapure water purified by Millipore Direct-Q 3 UV Water Purification System (Millipore Corporation, Bedford, MA, USA) was used for mobile phase preparation.

3.2. Analytes

The analytical standards of pipemidic acid, enoxacin, and gatifloxacin were provided by Alfa Aesar (Haverhill, MA, USA); norfloxacin, lomefloxacin, ciprofloxacin, sparfloxacin, and moxifloxacin were purchased from Sigma-Aldrich (Steinheim, Germany). Synthesis and purification of the hybrid quinolone-based quaternary ammonium derivatives were described previously [7]. The structures of the investigated hydrides are presented in Table S1. All target compounds were dissolved in DMSO to obtain a concentration of 1 mg mL−1 and stored at 2–8 °C prior to analyses.

3.3. TLC Analysis

The ready-to-use TLC glass plates covered by octadecyl(C18)- and octyl(C8)-modified TLC silica layers were purchased from Merck (Darmstadt, Germany). Stock solutions (5 µL) of the analytes were spotted manually on the plates with the use of a micropipette from Brand (Wertheim, Germany). The mobile phases were prepared by mixing appropriate volumes of pure organic solvents and water (in step gradient by 10% (v/v)), in the following proportions: (a) methanol–water ranging from 30 to 70% (v/v), in the case of C8-bonded silica gel stationary phase; and (b) methanol–water ranging from 40 to 70% (v/v), in the case of C18-bonded silica gel stationary phase.
Before analysis, the chromatographic chamber (Twin Trough Chambers from CAMAG Philadelphia, USA) was saturated for 20 min. All TLC experiments were performed at room temperature (22 ± 2 °C). Chromatograms were developed using the ascending technique to a distance of 8 cm. The investigated substances were visualized under UV light at λ = 366 nm by CAMAG UV Lamp 4 and the Viewing Box 4 (Philadelphia, USA). The target compounds were visible as blue spots. The obtained retardation factors (RF) were collected in the Supplementary data sheets. The retention parameter, RM, was calculated for each compound according to the Bate-Smith and Westall formula:
R M = l o g ( 1 R F 1 )
and listed in Table S2. Next, the Soczewiński–Wachtmeister’s [30] equation:
RM = RM0 + bC
was used in order to determine the basic lipophilic RP-TLC parameter RM0 as well as commonly used hydrophobic constants m. Soczewiński–Wachtmeister’s equation presented a linear relationship between concentration of the organic solvent in mobile phase (C) and RM value. Moreover, mean value of RM was used for lipophilicity assessments.
Furthermore, C0 RP-TLC lipophilicity parameter, introduced by Bieganowska [31], has been calculated according to the formula:
C 0 = R M 0 b .
The C0 parameter corresponds to the parameter φ0, previously proposed for the HPLC. This parameter relates to the concentration of the organic component in the mobile phase for which the distribution of the analyzed substance between the mobile and stationary phase is equal (1:1) [31].
Also, the principal component analysis (PCA) was applied in order to extract information regarding the lipophilicity of solutes and formulate them as the first principal component (PC1). Calculation data matrixes included RM values of solutes for each modifier concentration in the mobile phase. The obtained TLC lipophilicity constants RM0, m, mRM, C0, and PC1 are listed in Table 2.

3.4. MEKC Analysis

All MEKC experiments were carried out with a P/ACE MDQ plus system (Sciex, Framingham, MA, USA) equipped with photodiode array detector (PDA) and controlled by 32 Karat software (version 10.2). The uncoated fused silica capillaries (50 µm i.d., Polymicro Technologies, West Yorkshire, UK) of 60 cm total length and 50.2 cm effective length were used. Prior to analysis, the capillary was rinsed with 0.1 M NaOH for 30 min, ultrapure water for 10 min, and background electrolyte (BGE) for 30 min. After each analysis, the capillary was conditioned with BGE for 2 min. The applied pressure for all rinsing operations was 345 kPa. The analytes were dissolved in BGE at concentration of 100 µg/mL with addition of quinine (micelles marker). As electroosmotic flow (EOF) marker, DMSO was used. The samples were hydrodynamically injected at 35 kPa for 5 s. The separations were performed by applying voltage of 20 kV with positive polarity and constant temperatures at 25 ± 0.1 °C. The BGE consisted of aqueous solution of 50 mM SDS and 120 mM HEPES /100 mM TRIS buffer of pH 7.4. The BGE was prepared each working day by dilution of stock solution. Detection was carried out at 200 and 280 nm with 8 Hz probing frequency. The logarithm of retention factor logk was calculated according to the equation introduced by Terabe and co-workers:
l o g k M E K C = l o g ( t R t E O F t E O F ( 1 t R / t M C ) )
The established logk parameters are summarized in Table 2.

3.5. Computational Estimation of logP Values

The logP values were calculated using several software platforms. Six different logP values (AlogPs, AClogP, AlogP, MLOGP, XlogP2, and XlogP3) and their average (AvglogP) were estimated using the Virtual Computational Chemistry Laboratory (VCCLAB, http://www.vcclab.org/), accessed on 11 September 2019. ClogP parameter was obtained with ChemDraw (Waltham, MA, USA), while miLogP values were calculated using Molinspiration algorithm (http://www.molinspiration.com/), accessed on 11 September 2019. The KOWWINlogPs were calculated using the KOWWIN software v. 1.68 (EPI Suite package v.4.1, U.S. EPA).

3.6. Data Analysis

The chromatographic parameters (RM, mean value of RM, C0, and logk) were calculated from retention data using Microsoft Excel 2007 (Microsoft Redmond, WA, USA). All presented linear regressions were calculated using STATISTICA 9.1 (Stat-Soft, Tulsa, OK, USA). The coefficients of correlation (R) and determination (R2), F-test value, standard deviation (σ), and standard estimation error (s) were used as the basis for testing the quality of obtained linear regression models. All presented linearities were performed at a significance level less than 0.05 whereas the critical F-values for performed F-tests was < 2.
Cluster analysis (HCA) was carried out using STATISTICA 9.1 based on the calculated lipophilicity indexes. Before performing the HCA, lipophilicity data were standardized, i.e., the average was subtracted from each value and the difference was divided by the standard deviation. In that way, differently scaled variables were placed on the same, so-called unit standard deviation scale. Euclidean distance was used to measure distance between objects while Ward’s amalgamation method was applied to build up clusters.
The sum of ranking differences (SRD) was performed using Microsoft Excel visual basic macros freely available from http://aki.ttk.mta.hu/srd/. Before the analysis, the data were organized in a matrix with compounds arranged in rows and lipophilicity measures in columns. The SRD analysis was performed separately on computationally estimated logPs and chromatographic lipophilicity measures. Since the SRD analysis requires a benchmark vector for methods to be compared with, the average of all methods (consensus vector) was selected as the benchmark (reference). Comparison of methods to consensus has two major advantages. First, the average has the maximum likelihood of being the true value. Second, all the errors associated with each method, either systematic or random ones, cancel each other out by averaging. In order for consensus to be calculated all the data must be expressed on the same scale. As the result of SRD, analysis may slightly vary depending on the data transformation; three data pretreatment methods were tested: Standardization (as previously described), interval scaling between 0 and 1 (in ascending order), and rank transformation (taking average rank values for ties). STATISTICA 9.1 was used for statistical significance testing of the SRD values obtained by the sevenfold cross-validation and plotting of box and whisker diagrams.

4. Conclusions

Lipophilicity of a series of fluoroquinolone-Safirinium dye hybrids, synthesized as new dual-acting hydrophilic antibacterial agents, have been assessed based on chromatographic and computational approaches. Vast differences between calculated logP parameters indicated that experimental procedures are still required for lipophilicity determination of this chemical group. Soczewiński–Wachtmeister’s equation well presented the chromatographic behavior of the studied compounds in RP-TLC. The SRD analysis of chromatographic lipophilicity measures revealed that PC1 scores as well as mRM values, obtained on both stationary phases, are among the best lipophilicity measures, closely followed by the extrapolated RM0 values and the logk values obtained from the MEKC chromatographic experiments. Furthermore, acceptable correlation was found between the logk parameter and logMIC for three bacterial strains, i.e., Bacillus subtilis, Escherichia coli, and Proteus vulgaris. These results suggested that MEKC can serve as a screening tool for the prediction of antimicrobial activity of fluoroquinolone derivatives.

Supplementary Materials

Supplementary materials can be found at https://0-www-mdpi-com.brum.beds.ac.uk/1422-0067/20/21/5288/s1. Table S1. Chemical names and structural formulas of the studied compounds. Table S2. Retention parameters RM obtained in RP-TLC systems. Table S3. Statistical parameters of fitted Soczewiński–Wachtmeister’s equation for each of the studied compounds. Table S4. Correlation matrix of TLC chromatographic parameters. Figure S1. Ranking of computational methods for lipophilicity estimation. Figure S2. Ranking of chromatographic lipophilicity indexes. Figure S3. Ranking of computational methods for lipophilicity estimation. Figure S4. Ranking of chromatographic lipophilicity indexes.

Author Contributions

K.C. designed the research study, performed MEKC experiments, analyzed the data, and prepared the manuscript. J.F. and J.S. synthesized the compounds, analyzed the data, and provided consultation for conception of the study. F.A. performed SRD analysis and prepared the manuscript. K.E.G. carried out TLC analyses. A.G. calculated logPs. W.S. and J.S. corrected the manuscript.

Funding

This work was supported by the National Science Centre, Poland [research grant number 2016/21/N/NZ7/03464] and by the Polish Ministry of Science and Higher Education Grant for Young Investigators [research grant number 01-0471/08/518].

Conflicts of Interest

The authors declare no conflict of interest. The funders had no role in the design of the study; in the collection, analyses, or interpretation of data; in the writing of the manuscript, or in the decision to publish the results.

References

  1. Goetz, G.H.; Shalaeva, M. Leveraging chromatography based physicochemical properties for efficient drug design. ADMET DMPK 2018, 6, 85. [Google Scholar] [CrossRef]
  2. Di, L.; Kerns, E.H. Drug-Like Properties; Academic Press: New York, NY, USA, 2008. [Google Scholar]
  3. Godyń, J.; Hebda, M.; Więckowska, A.; Więckowski, K.; Malawska, B.; Bajda, M. Lipophilic properties of anti-Alzheimer’s agents determined by micellar electrokinetic chromatography and reversed-phase thin-layer chromatography. Electrophoresis 2017, 38, 1268–1275. [Google Scholar] [CrossRef] [PubMed]
  4. OECD Test Guidelines for the Chemicals. Available online: http://www.oecd.org/env/ehs/testing/oecdguidelinesforthetestingofchemicals.htm (accessed on 11 September 2019).
  5. Kaliszan, R. QSRR: Quantitative Structure-(Chromatographic) Retention Relationships. Chem. Rev. 2007, 107, 3212–3246. [Google Scholar] [CrossRef] [PubMed]
  6. Bajda, M.; Chłoń-Rzepa, G.; Żmudzki, P.; Czopek, A.; Stanisz-Wallis, K.; Łątka, K.; Pawłowski, M.; Zagórska, A. Determination of ligand efficiency indices in a group of 7H-purine-2,6-dione derivatives with psychotropic activity using micellar electrokinetic chromatography. Electrophoresis 2018, 39, 2446–2453. [Google Scholar] [CrossRef] [PubMed]
  7. Fedorowicz, J.; Sączewski, J.; Konopacka, A.; Waleron, K.; Lejnowski, D.; Ciura, K.; Tomašič, T.; Skok, Ž.; Savijoki, K.; Morawska, M.; et al. Synthesis and biological evaluation of hybrid quinolone-based quaternary ammonium antibacterial agents. Eur. J. Med. Chem. 2019, 179, 576–590. [Google Scholar] [CrossRef]
  8. Murtagh, F.; Legendre, P. Ward’s Hierarchical Agglomerative Clustering Method: Which Algorithms Implement Ward’s Criterion? J. Classif. 2014, 31, 274–295. [Google Scholar] [CrossRef]
  9. Kłosińska-Szmurło, E.; Pluciński, F.A.; Grudzień, M.; Betlejewska-Kielak, K.; Biernacka, J.; Mazurek, A.P. Experimental and theoretical studies on the molecular properties of ciprofloxacin, norfloxacin, pefloxacin, sparfloxacin, and gatifloxacin in determining bioavailability. J. Biol. Phys. 2014, 40, 335–345. [Google Scholar] [CrossRef] [Green Version]
  10. Völgyi, G.; Vizserálek, G.; Takács-Novák, K.; Avdeef, A.; Tam, K.Y. Predicting the exposure and antibacterial activity of fluoroquinolones based on physicochemical properties. Eur. J. Pharm. Sci. 2012, 47, 21–27. [Google Scholar] [CrossRef]
  11. Starek, M.; Komsta, Ł.; Krzek, J. Reversed-phase thin-layer chromatography technique for the comparison of the lipophilicity of selected non-steroidal anti-inflammatory drugs. J. Pharm. Biomed. Anal. 2013, 85, 132–137. [Google Scholar] [CrossRef]
  12. Šegan, S.; Opsenica, I.; Zlatović, M.; Milojković-Opsenica, D.; Šolaja, B. Quantitative structure retention/activity relationships of biologically relevant 4-amino-7-chloroquinoline based compounds. J. Chromatogr. B Anal. Technol. Biomed. Life Sci. 2016, 1012–1013, 144–152. [Google Scholar] [CrossRef]
  13. Rageh, A.H.; Atia, N.N.; Abdel-Rahman, H.M. Lipophilicity estimation of statins as a decisive physicochemical parameter for their hepato-selectivity using reversed-phase thin layer chromatography. J. Pharm. Biomed. Anal. 2017, 142, 7–14. [Google Scholar] [CrossRef] [PubMed]
  14. Milošević, N.P.; Dimova, V.B.; Perišić-Janjić, N.U. RP TLC data in correlation studies with in silico pharmacokinetic properties of benzimidazole and benztriazole derivatives. Eur. J. Pharm. Sci. 2013, 49, 10–17. [Google Scholar] [CrossRef] [PubMed]
  15. Šegan, S.; Penjišević, J.; Šukalović, V.; Andrić, D.; Milojković-Opsenica, D.; Kostić-Rajačić, S. Investigation of lipophilicity and pharmacokinetic properties of 2-(methoxy)phenylpiperazine dopamine D2 ligands. J. Chromatogr. B Anal. Technol. Biomed. Life Sci. 2019, 1124, 146–153. [Google Scholar] [CrossRef] [PubMed]
  16. Hubicka, U.; Żuromska-Witek, B.; Komsta, Ł.; Krzek, J. Lipophilicity study of fifteen fluoroquinolones by reversed-phase thin-layer chromatography. Anal. Methods 2015, 7, 3841–3848. [Google Scholar] [CrossRef]
  17. Komsta, Ł.; Skibiński, R.; Berecka, A.; Gumieniczek, A.; Radkiewicz, B.; Radoń, M. Revisiting thin-layer chromatography as a lipophilicity determination tool—A comparative study on several techniques with a model solute set. J. Pharm. Biomed. Anal. 2010, 53, 911–918. [Google Scholar] [CrossRef]
  18. Sârbu, C.; Todor, S. Determination of lipophilicity of some non-steroidal anti-inflammatory agents and their relationships by using principal component analysis based on thin-layer chromatographic retention data. J. Chromatogr. A 1998, 822, 263–269. [Google Scholar] [CrossRef]
  19. Ciura, K.; Rutecka, A.; Szewczyk, A.; Kawczak, P.; Bączek, T.; Nowakowska, J. Study of the chromatographic behavior of selected antipsychotic drugs on RP-TLC based on quantitative structure--retention relationships. J. Iran. Chem. Soc. 2019, 16, 1019–1027. [Google Scholar] [CrossRef]
  20. Dąbrowska, M.; Starek, M.; Komsta, Ł.; Szafrański, P.; Stasiewicz-Urban, A.; Opoka, W. Assessment of the chromatographic lipophilicity of eight cephalosporins on different stationary phases. Eur. J. Pharm. Sci. 2017, 101, 115–124. [Google Scholar] [CrossRef]
  21. Šegan, S.; Božinović, N.; Opsenica, I.; Andrić, F. Consensus-based comparison of chromatographic and computationally estimated lipophilicity of benzothiepino[3,2-c]pyridine derivatives as potential antifungal drugs. J. Sep. Sci. 2017, 40, 2089–2096. [Google Scholar] [CrossRef]
  22. Andrić, F.; Héberger, K. Towards better understanding of lipophilicity: Assessment of in silico and chromatographic logP measures for pharmaceutically important compounds by nonparametric rankings. J. Pharm. Biomed. Anal. 2015, 115, 183–191. [Google Scholar] [CrossRef]
  23. Andrić, F.; Héberger, K. Chromatographic and computational assessment of lipophilicity using sum of ranking differences and generalized pair-correlation. J. Chromatogr. A 2015, 1380, 130–138. [Google Scholar] [CrossRef] [PubMed] [Green Version]
  24. Andrić, F.; Bajusz, D.; Rácz, A.; Šegan, S.; Héberger, K. Multivariate assessment of lipophilicity scales—computational and reversed phase thin-layer chromatographic indices. J. Pharm. Biomed. Anal. 2016, 127, 81–93. [Google Scholar] [CrossRef] [PubMed]
  25. Herbert, B.J.; Dorsey, J.G. n-Octanol-Water Partition Coefficient Estimation by Micellar Electrokinetic Capillary Chromatography. Anal. Chem. 1995, 67, 744–749. [Google Scholar] [CrossRef]
  26. Taléns-Visconti, R.; Garrigues, T.M.; Cantón, E.; Freixas, J.; Martín-Villodre, A.; Plá-Delfina, J.M. Activity–Bioavailability balance in Oral Drug Development for a Selected Group of 6-Fluoroquinolones. J. Pharm. Sci. 2002, 91, 2452–2464. [Google Scholar] [CrossRef] [PubMed]
  27. Tropsha, A.; Gramatica, P.; Gombar, V. The Importance of Being Earnest: Validation is the Absolute Essential for Successful Application and Interpretation of QSPR Models. QSAR Comb. Sci. 2003, 22, 69–77. [Google Scholar] [CrossRef]
  28. Drlica, K. Mechanism of fluoroquinolone action. Curr. Opin. Microbiol. 1999, 2, 504–508. [Google Scholar] [CrossRef]
  29. Asadipour, A.; Moshafi, M.H.; Khosravani, L.; Moghimi, S.; Amou, E.; Firoozpour, L.; Ilbeigi, G.; Beiki, K.; Soleimani, E.; Foroumadi, A. N-substituted piperazinyl sarafloxacin derivatives: Synthesis and in vitro antibacterial evaluation. DARU J. Pharm. Sci. 2018, 26, 199–207. [Google Scholar] [CrossRef]
  30. Soczewiński, E.; Wachtmeister, C.A. The relation between the composition of certain ternary two-phase solvent systems and RM values. J. Chromatogr. A 1962, 7, 311–320. [Google Scholar] [CrossRef]
  31. Bieganowska, M.L.; Doraczynska-Szopa, A.; Petruczynik, A. The retention behavior of some sulfonamides on different TLC plates. 2. Comparison of the selectivity of the systems and quantitative determination of hydrophobicity parameters. J. Planar Chromatogr.-Mod. TLC 1995, 8, 122–128. [Google Scholar]
Figure 1. Results of cluster analysis (HCA) analysis of in silico estimated logP values. At eight distance units two clusters of interest can be observed (A and B), and one outlier (miLogP).
Ijms 20 05288 g001
Figure 2. Ranking of computational methods for lipophilicity estimation. (a) sum of ranking differences-comparison of ranks by random numbers (SRD-CRRN) of standardized logP values; the SRD values are depicted on x and y axes, n = 23, random distribution Mean = 66.91, StD = 9.16, XX1 = 51.52, Med = 66.67, XX2 = 81.82. The smaller the SRD value, the better, i.e., closer to the consensus, the computational method is. (b) Box and whisker plot of normalized SRD values obtained by the sevenfold cross-validation. Statistically significantly different methods (p = 0.05, tested by both the sign test and the Wilcoxon’s matched pairs test), are separated by dashed lines.
Ijms 20 05288 g002
Figure 3. Consensus-based ranking of chromatographic lipophilicity indexes. (a) SRD-CRRN of standardized lipophilicity measures; the SRD values are depicted on x and y axes, n = 23, random distribution Mean = 66.91, StD = 9.16, XX1 = 51.52, Med = 66.67, XX19 = 81.82. (b) Box and whisker plot of normalized SRD values obtained by the sevenfold cross-validation. Indexes for which the median SRD values are statistically significantly different at the predefined significance level of p = 0.05 (tested by both the sign test and the Wilcoxon’s matched pairs test) are separated by dashed lines.
Ijms 20 05288 g003
Figure 4. The performance comparison of the obtained QSAR models for each of the bacterial strains. Scatter plots comparing observed log MIC for Proteus vulgaris (green diamonds), Bacillus subtilis (blue circle), and Escherichia coli (red points) value with predicted value.
Ijms 20 05288 g004
Table 1. Calculated logP values for investigated compounds.
Compound No.ClogPmiLogPKOWWINlogPAlogPsAClogPAlopgPMlogPXlogP2XlogP3AvglogP
1−3.10−5.081.342.351.920.60−0.042.273.571.78
2−2.55−4.962.142.832.291.10−0.182.774.162.16
3−2.89−3.921.763.202.020.950.432.664.042.22
4−3.51−5.210.832.292.140.02−0.091.632.011.33
5−2.43−4.921.962.852.261.180.262.894.102.26
6−5.06−4.67−0.061.481.14−0.330.051.272.421.01
7−4.10−4.971.442.131.800.520.672.483.171.79
8−3.05−5.091.652.362.110.740.162.393.761.92
9−2.89−5.071.142.852.290.470.012.133.291.83
10−5.52−4.86−0.871.681.17−1.04−0.320.510.940.51
11−4.56−5.120.622.191.82−0.190.401.712.891.47
12−3.56−5.210.522.331.94−0.12−0.291.512.061.24
13−3.01−5.111.332.752.320.38−0.422.003.321.73
14−3.35−4.280.953.052.050.240.191.893.201.77
15−4.07−4.802.262.802.561.300.203.804.542.41
16−4.03−2.830.800.820.580.07−1.862.150.610.39
17−2.57−3.110.160.990.28−0.06−0.891.96−0.800.08
18−3.25−3.56−0.460.57−0.06−0.64−2.251.34−1.03−0.35
19−5.21−2.56−1.86−0.84−0.84−1.56−2.630.34−2.15−1.28
20−3.04−1.53−0.040.790.04−0.28−1.681.730.110.12
21−2.70−3.220.340.880.31−0.14−2.311.84−0.240.06
22−3.19−3.57−0.150.200.13−0.50−2.011.46−1.08−0.30
23−4.24−3.25−0.360.21−0.18−0.71−1.631.55−0.20−0.16
Table 2. Information about algorithms and suppliers of investigated software.
No.logP ScaleAlgorithmsSupplier
1ClogPfragment contributionwww.biobyte.com
(ChemDraw)
2milogPfragment contributionwww.molinspiration.com
3KOWWINlogPhybrid algorithm
(atom-based approach and fragmental contribution)
www.epa.gov
4AlogPsproperties dependent methods
(topological descriptors)
www.vcclab.org
5AClogPatom-based methodwww.acdlabs.com
6AlopgPfragment contributionwww.vcclab.org
7MlogPproperties dependent methods
(topological descriptors)
http://www.talete.mi.it/
8XlogPatom-based methodhttp://www.compchemcons.com
9XlogP3atom-based methodhttp://www.compchemcons.com
Table 3. Chromatographically determined lipophilicity parameters.
Compound No.RP-TLC
Stationary Phase: Silica Gel C18
RP-TLC
Stationary Phase: Silica Gel C8
MEKC
RM0bC0mRMPC1 *RM0bC0mRMPC1 **logkσ logk
11.65−1.361.210.960.721.99−1.921.041.03−2.23−0.1040.0057
22.78−3.310.840.950.812.31−2.610.891.01−2.22−0.1250.0036
32.75−3.130.881.020.342.74−3.170.861.15−3.48−0.0700.0041
41.74−1.850.940.722.361.79−1.900.940.84−0.58−0.3210.0117
52.29−2.450.930.940.881.90−1.831.040.98−1.69−0.2650.0020
61.78−1.451.230.980.531.32−0.562.351.04−1.73−0.4430.0003
71.87−1.601.170.990.481.76−1.431.231.05−2.01−0.2390.0009
81.83−1.711.070.891.181.71−1.561.090.93−1.26−0.1530.0007
91.86−1.910.980.811.751.62−1.660.970.79−0.11−0.4790.0039
101.27−1.041.220.702.531.16−0.911.280.710.79−0.5730.0021
111.72−1.591.080.841.511.59−1.501.060.84−0.54−0.3980.0027
121.75−1.751.000.781.971.63−1.631.000.82−0.38−0.2720.0012
132.18−2.470.880.821.741.82−1.970.920.83−0.64−0.4080.0175
142.45−2.840.860.881.322.29−2.660.860.96−1.79−0.2610.0070
153.56−4.210.841.24−1.122.63−2.880.911.19−3.52−0.2500.0036
162.62−2.431.081.30−1.591.99−1.491.331.24−3.610.1080.0001
172.33−2.031.151.22−1.082.06−1.541.341.29−4.090.0770.0003
182.54−2.061.241.40−2.342.43−1.901.271.47−5.560.1030.0049
192.39−1.781.351.24−1.241.87−1.131.651.30−3.91−0.1700.0044
202.85−2.880.991.28−1.402.27−2.131.071.21−3.810.1160.0005
212.69−2.551.061.31−1.632.68−2.830.951.26−4.290.1010.0012
222.79−2.151.301.62−3.882.04−1.271.611.41−5.040.1040.0011
232.70−1.981.371.62−3.862.45−2.001.231.45−5.380.1560.0070
* contains 86.92% of information included in the retention data. ** contains 83.57% of information included in the retention data.

