EPO and TMBIM3/GRINA Promote the Activation of the Adaptive Arm and Counteract the Terminal Arm of the Unfolded Protein Response after Murine Transient Cerebral Ischemia

 , ,
, ,
Abstract
: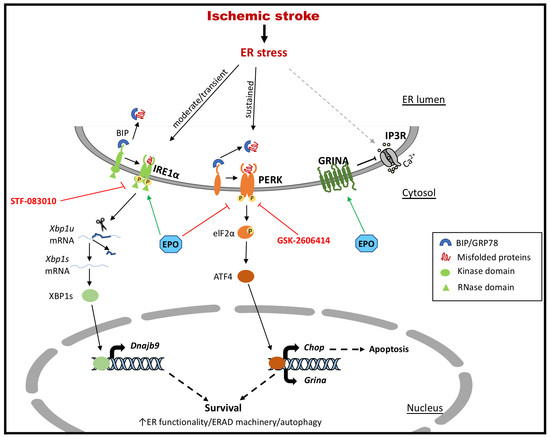
1. Introduction
2. Results
2.1. GRINA-deficiency Leads to Early Infarct Demarcation And Larger Infarct Sizes Compared to Wildtype Littermates
2.2. Loss of GRINA Worsens Neurological Outcome And Abolishes EPO-mediated Neuroprotection after Ischemic Stroke
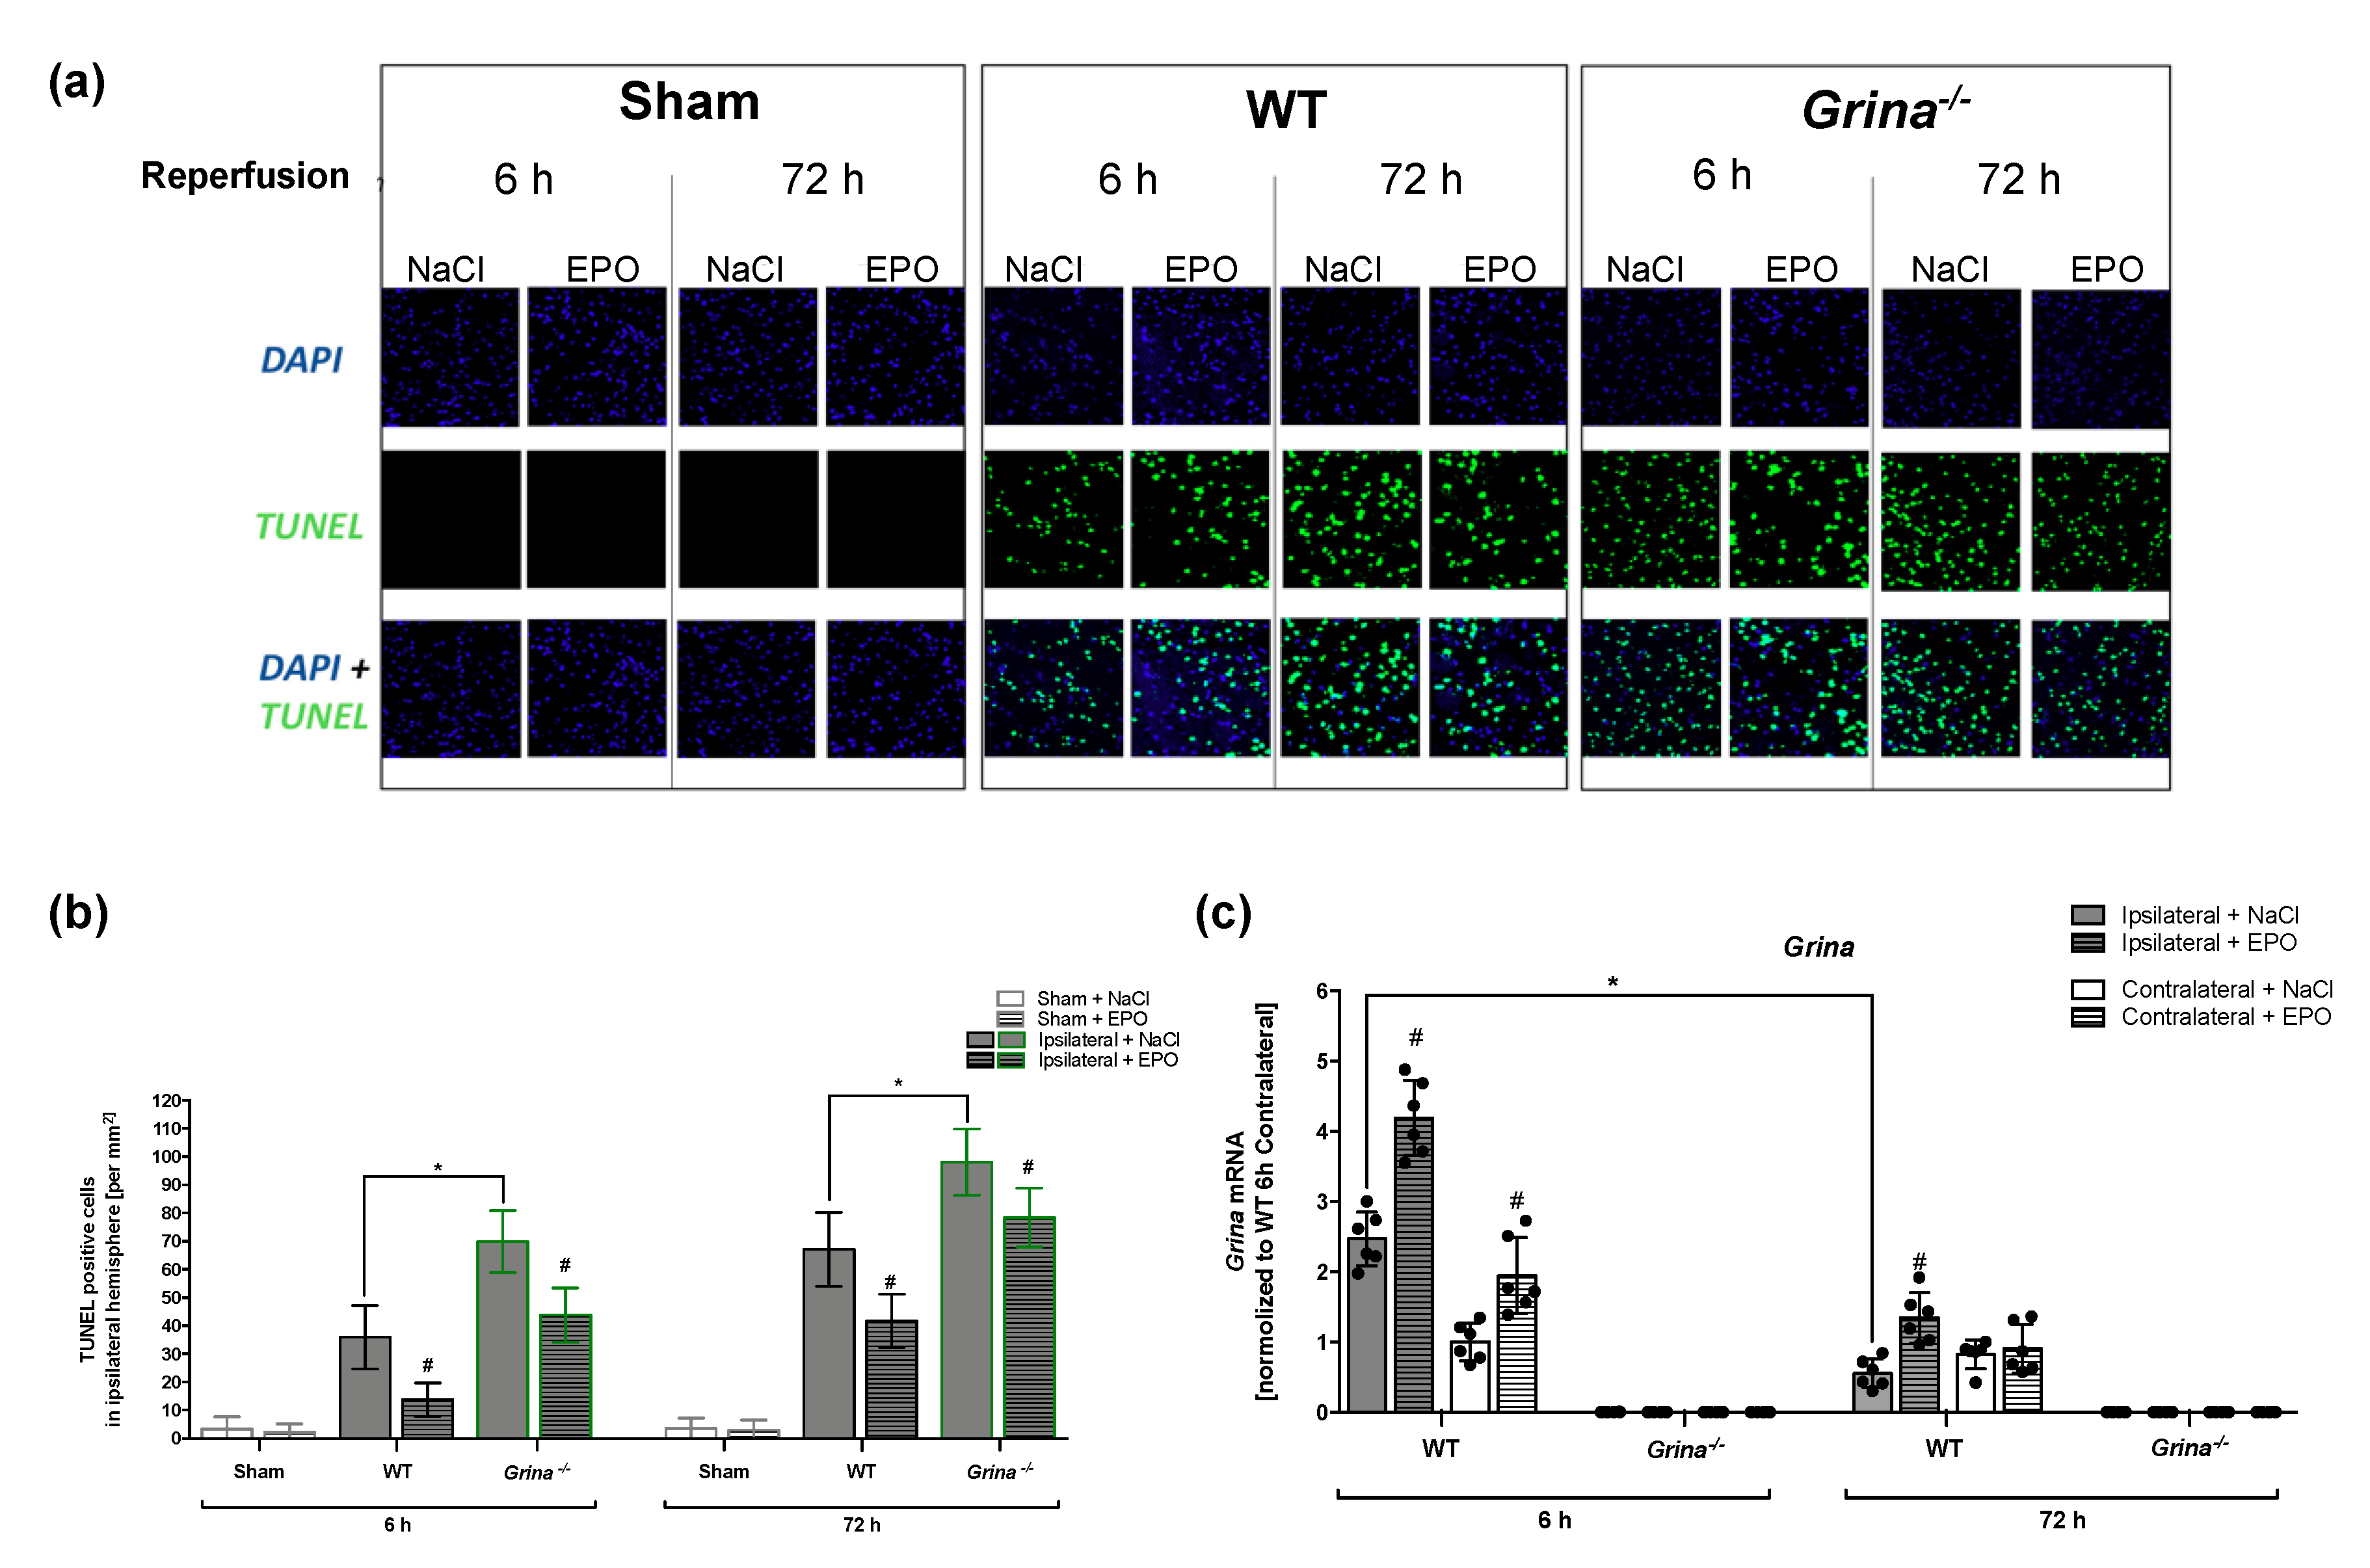
2.3. EPO Treatment Abrogated Stroke-induced Apoptosis in Both Genotypes after 6 and 72 h of Reperfusion
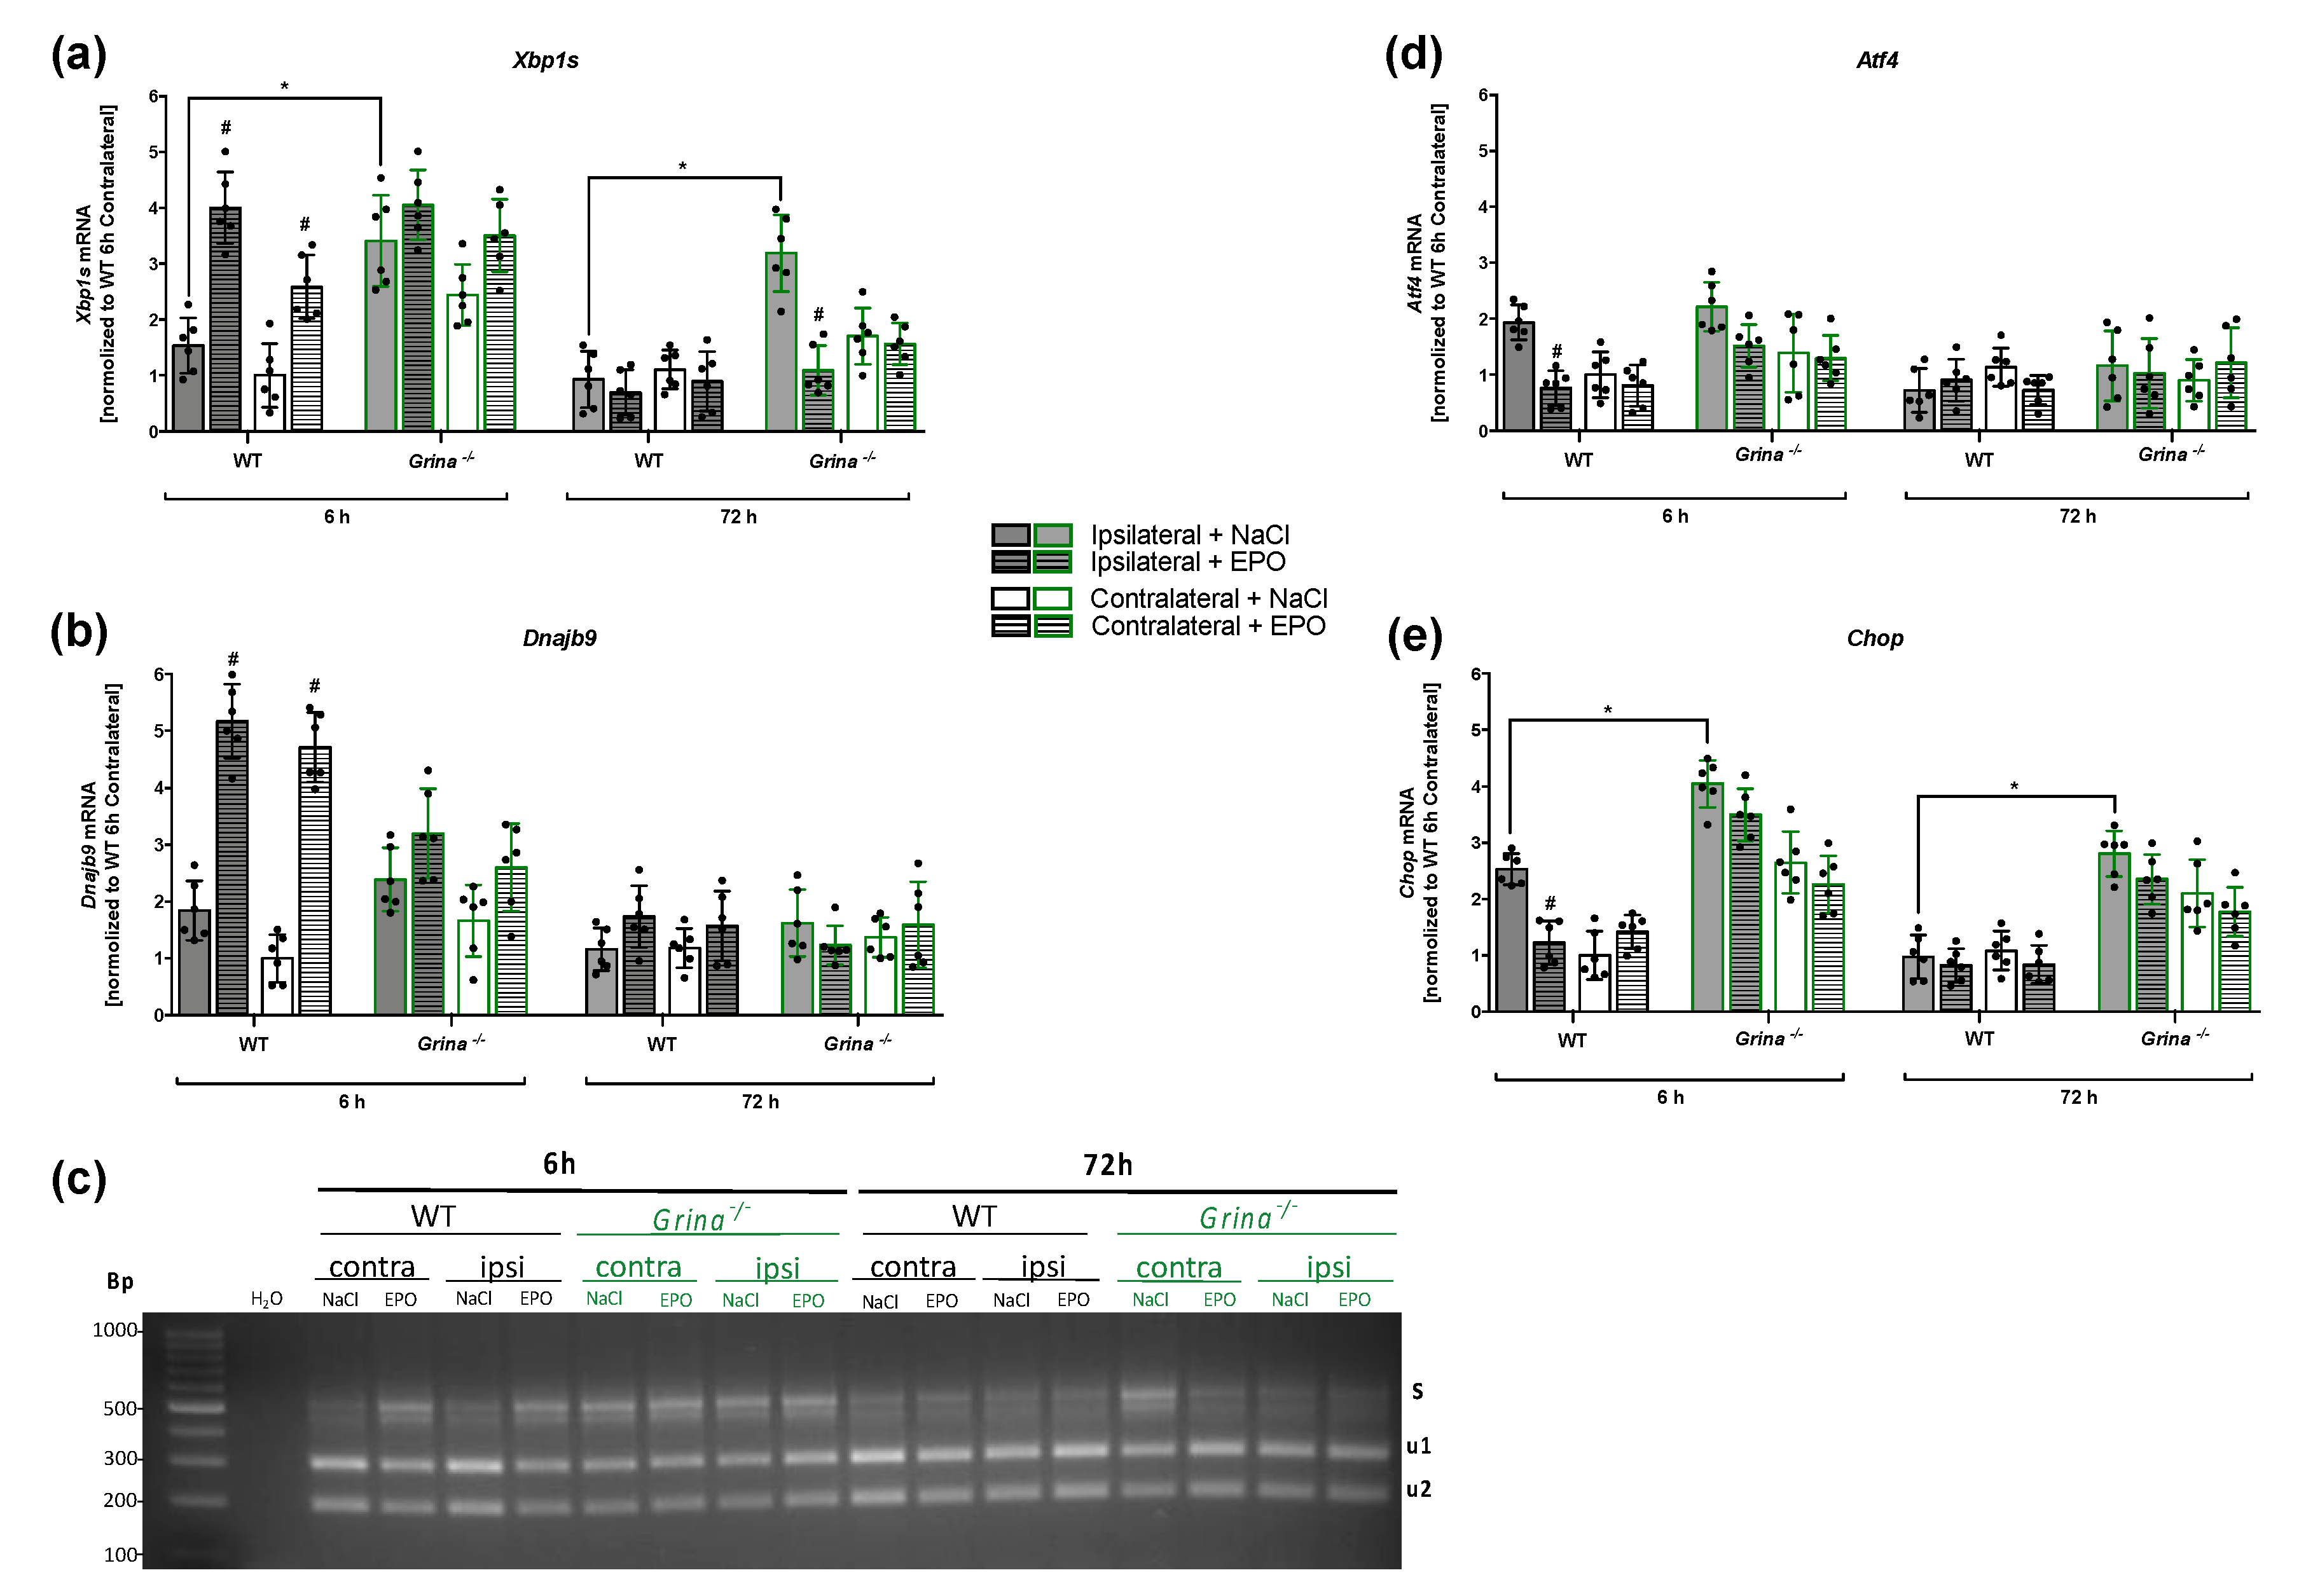
2.4. EPO Enhances the Activation of the Pro-survival IRE1α Branch And Counteracts the Pro-apoptotic PERK Branch of UPR in the Early Phase after Ischemia/Reperfusion Injury
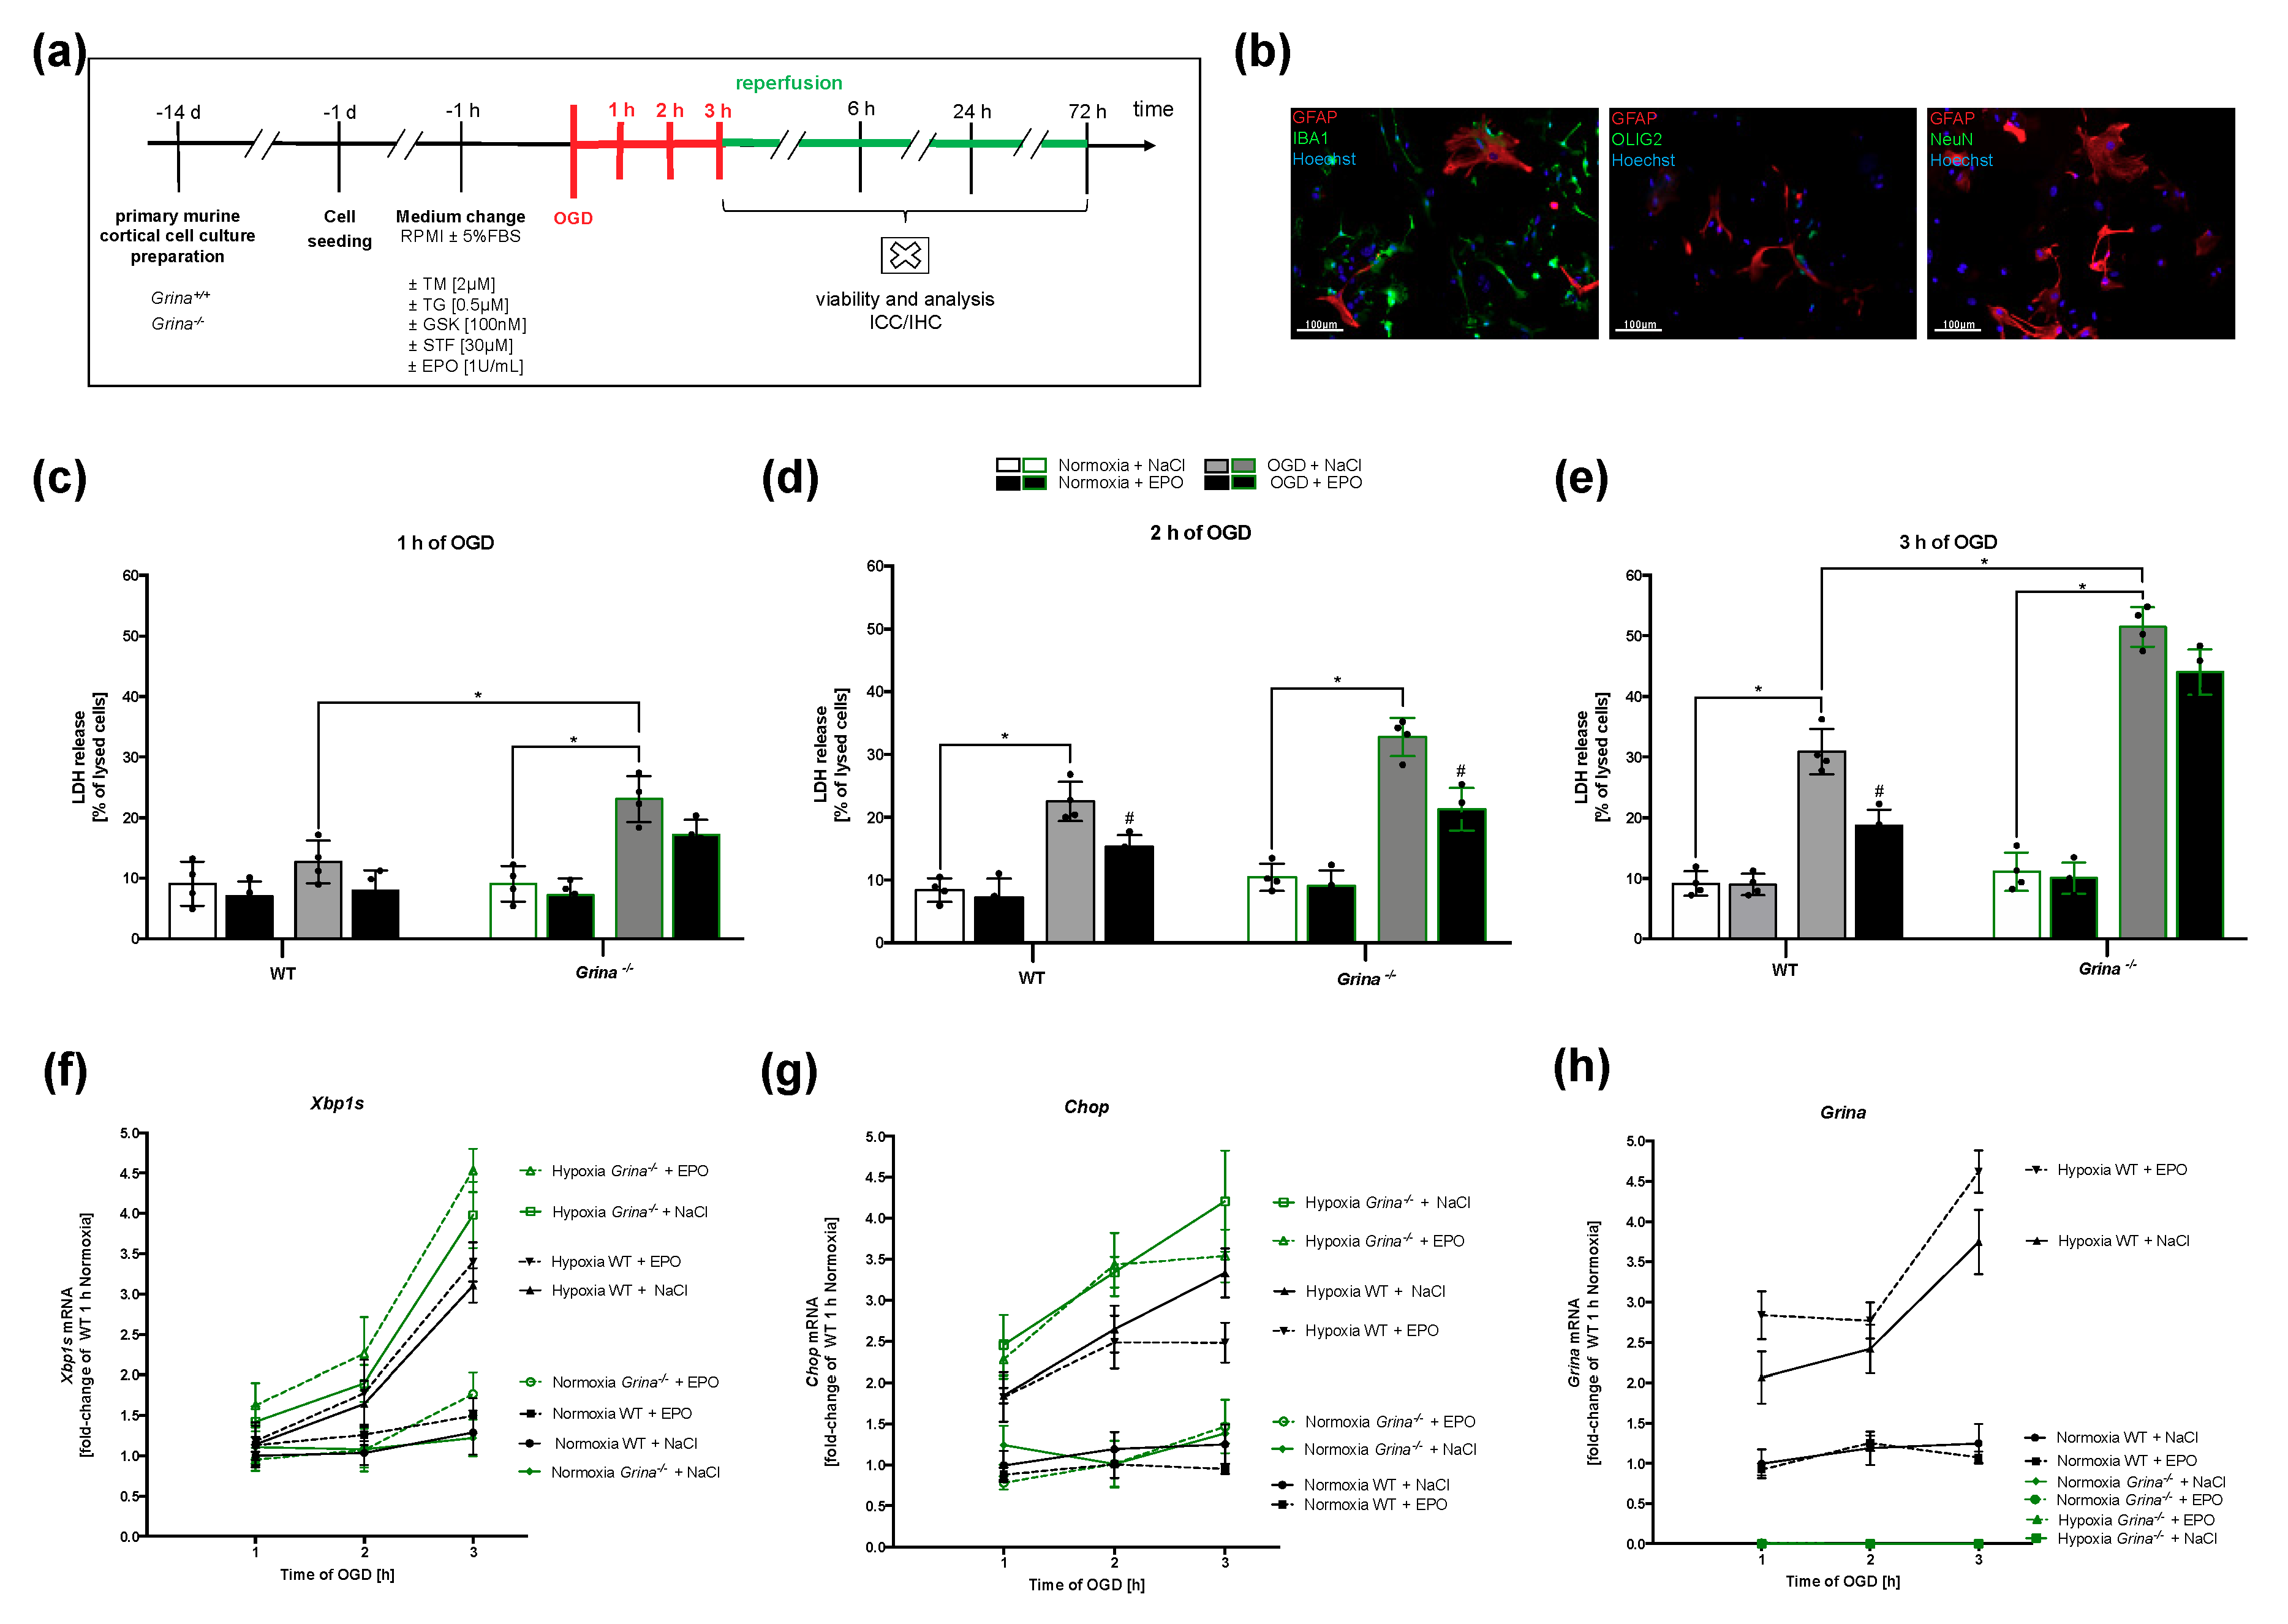
2.5. GRINA-deficiency Leads to Increased Apoptosis And Activation of the IRE1α And PERK Arm of UPR in Primary Murine Cortical Cells after OGD
2.6. OGD Activates the IRE1α And PERK Arms of the UPR with a Similar Tendency as Pharmacological Treatment with Tunicamycin (TM) and Thapsigargin (TG)
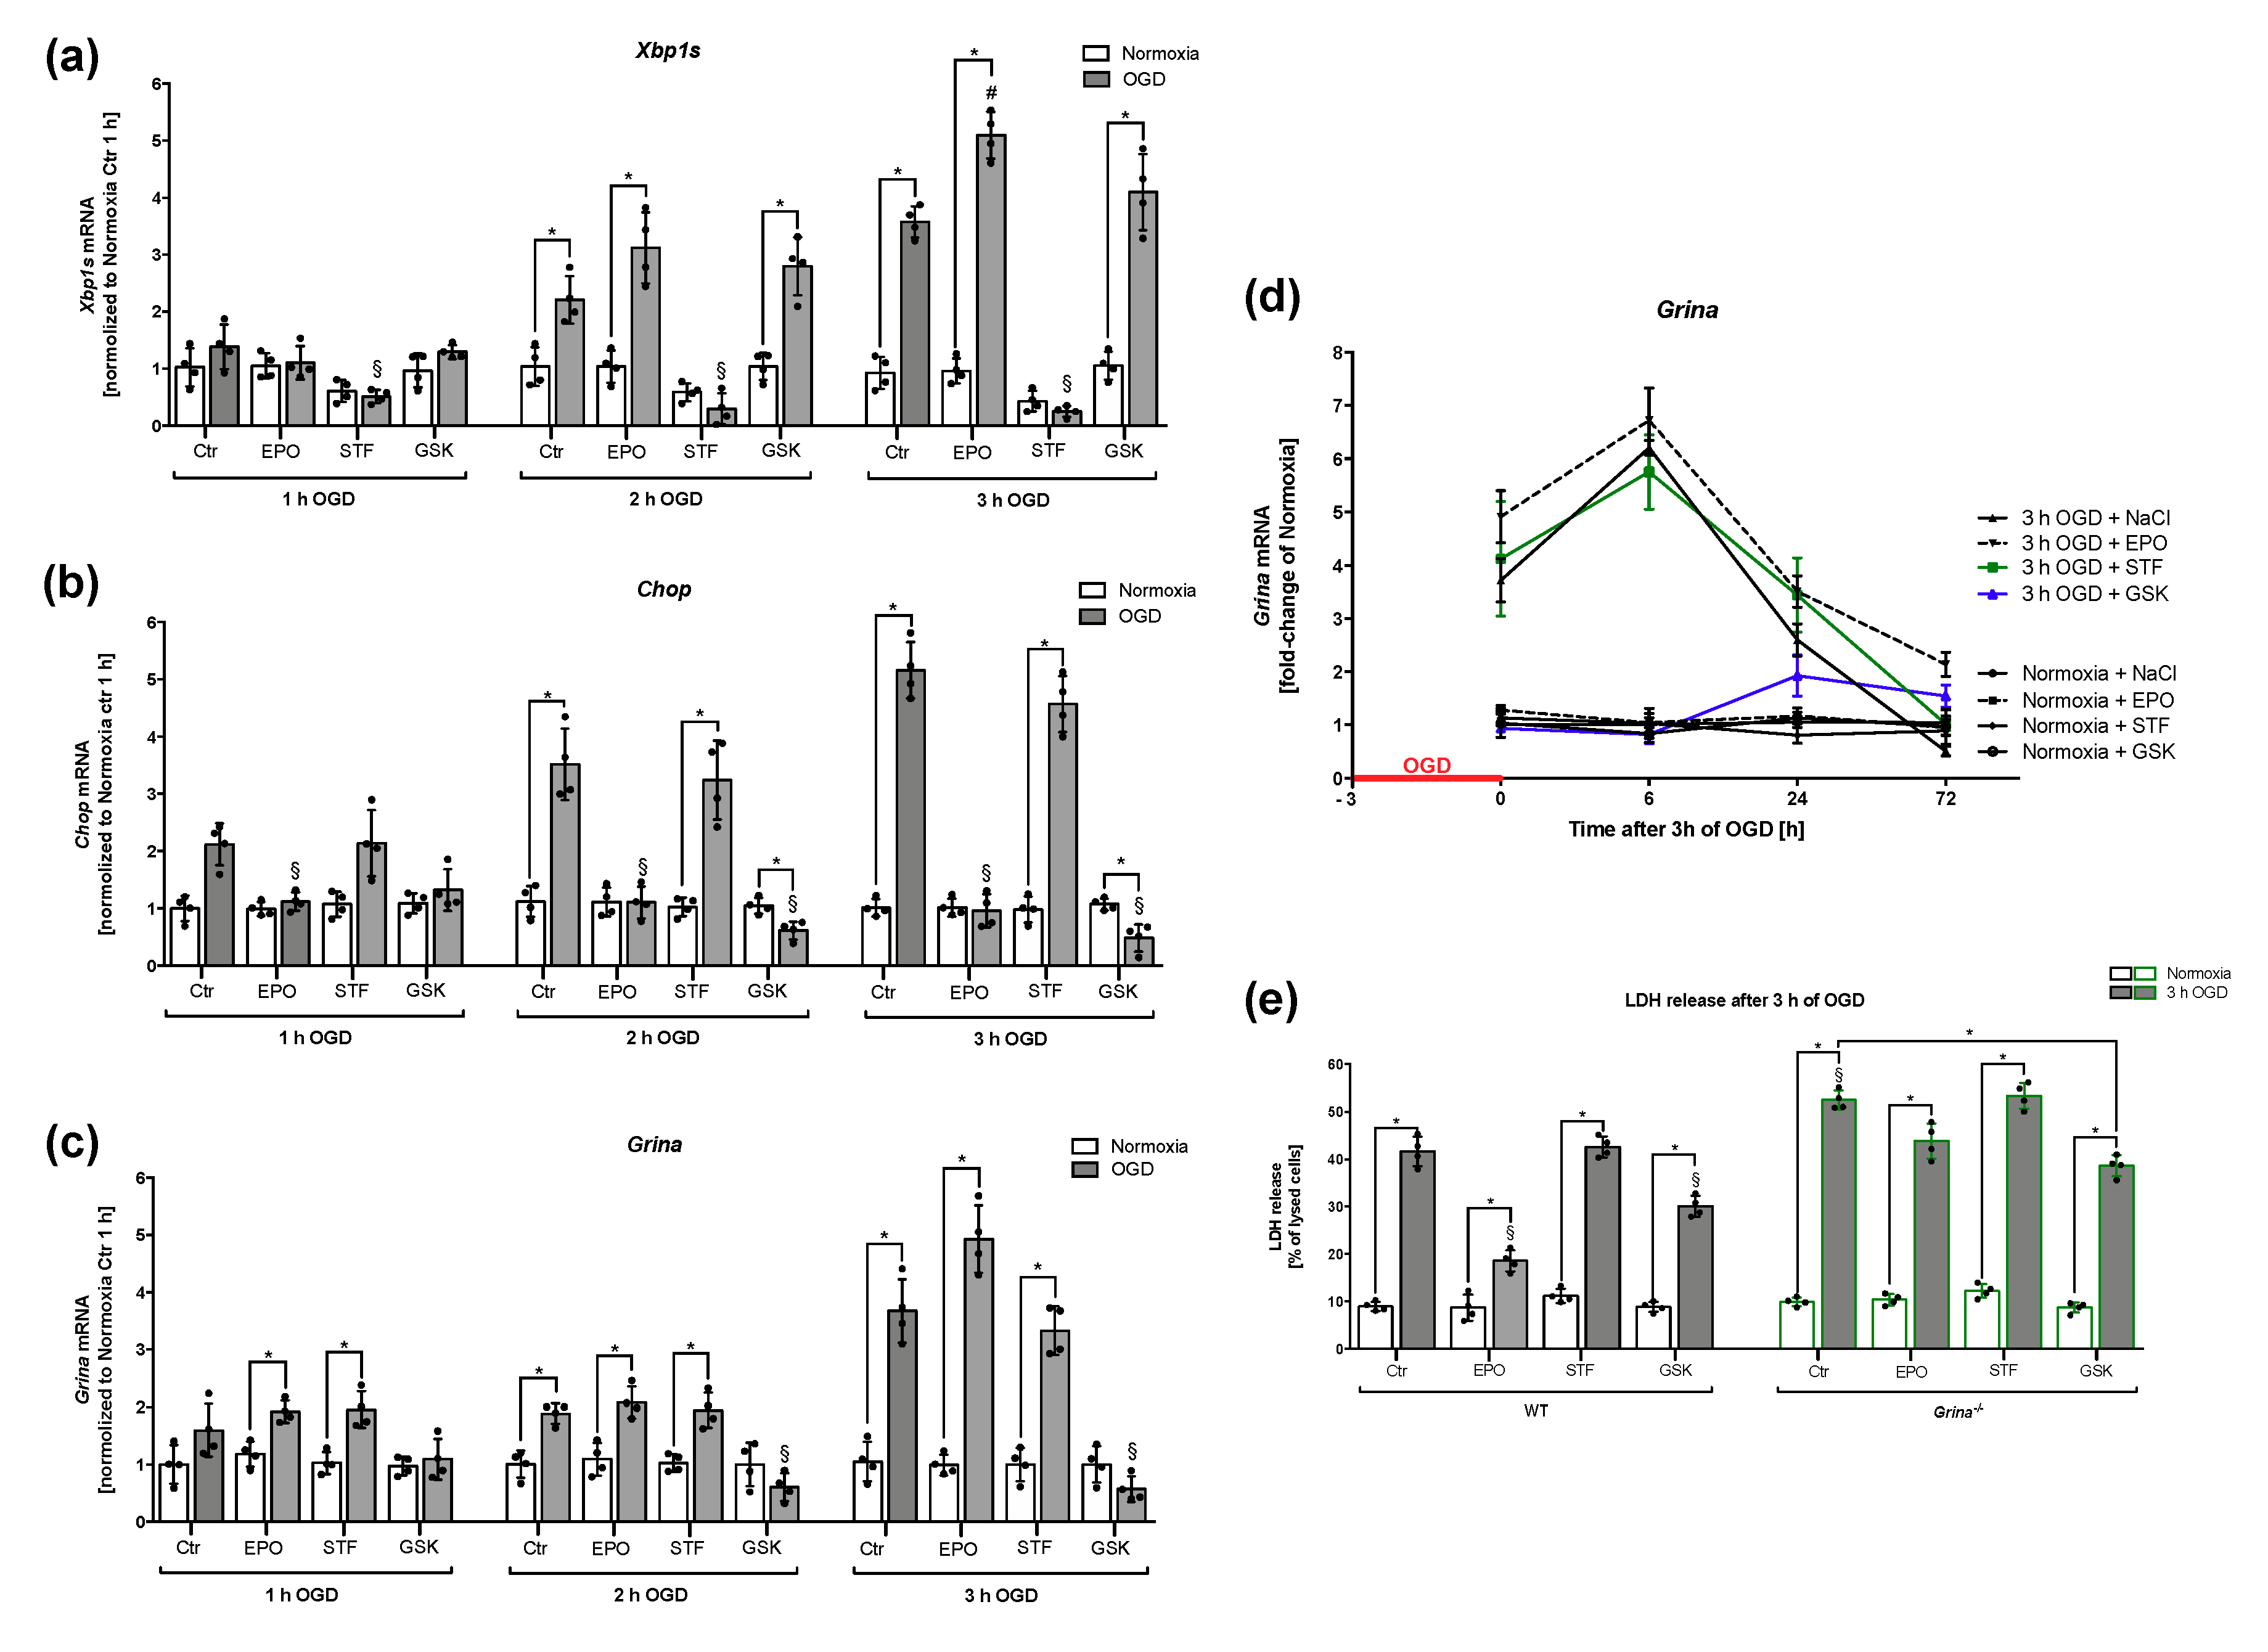
2.7. Both EPO and PERK-inhibitor GSK-2606414 Reduced Cell Death And Regulated Grina mRNA Levels after OGD/Reoxygenation
3. Discussion
4. Materials and Methods
4.1. Mice
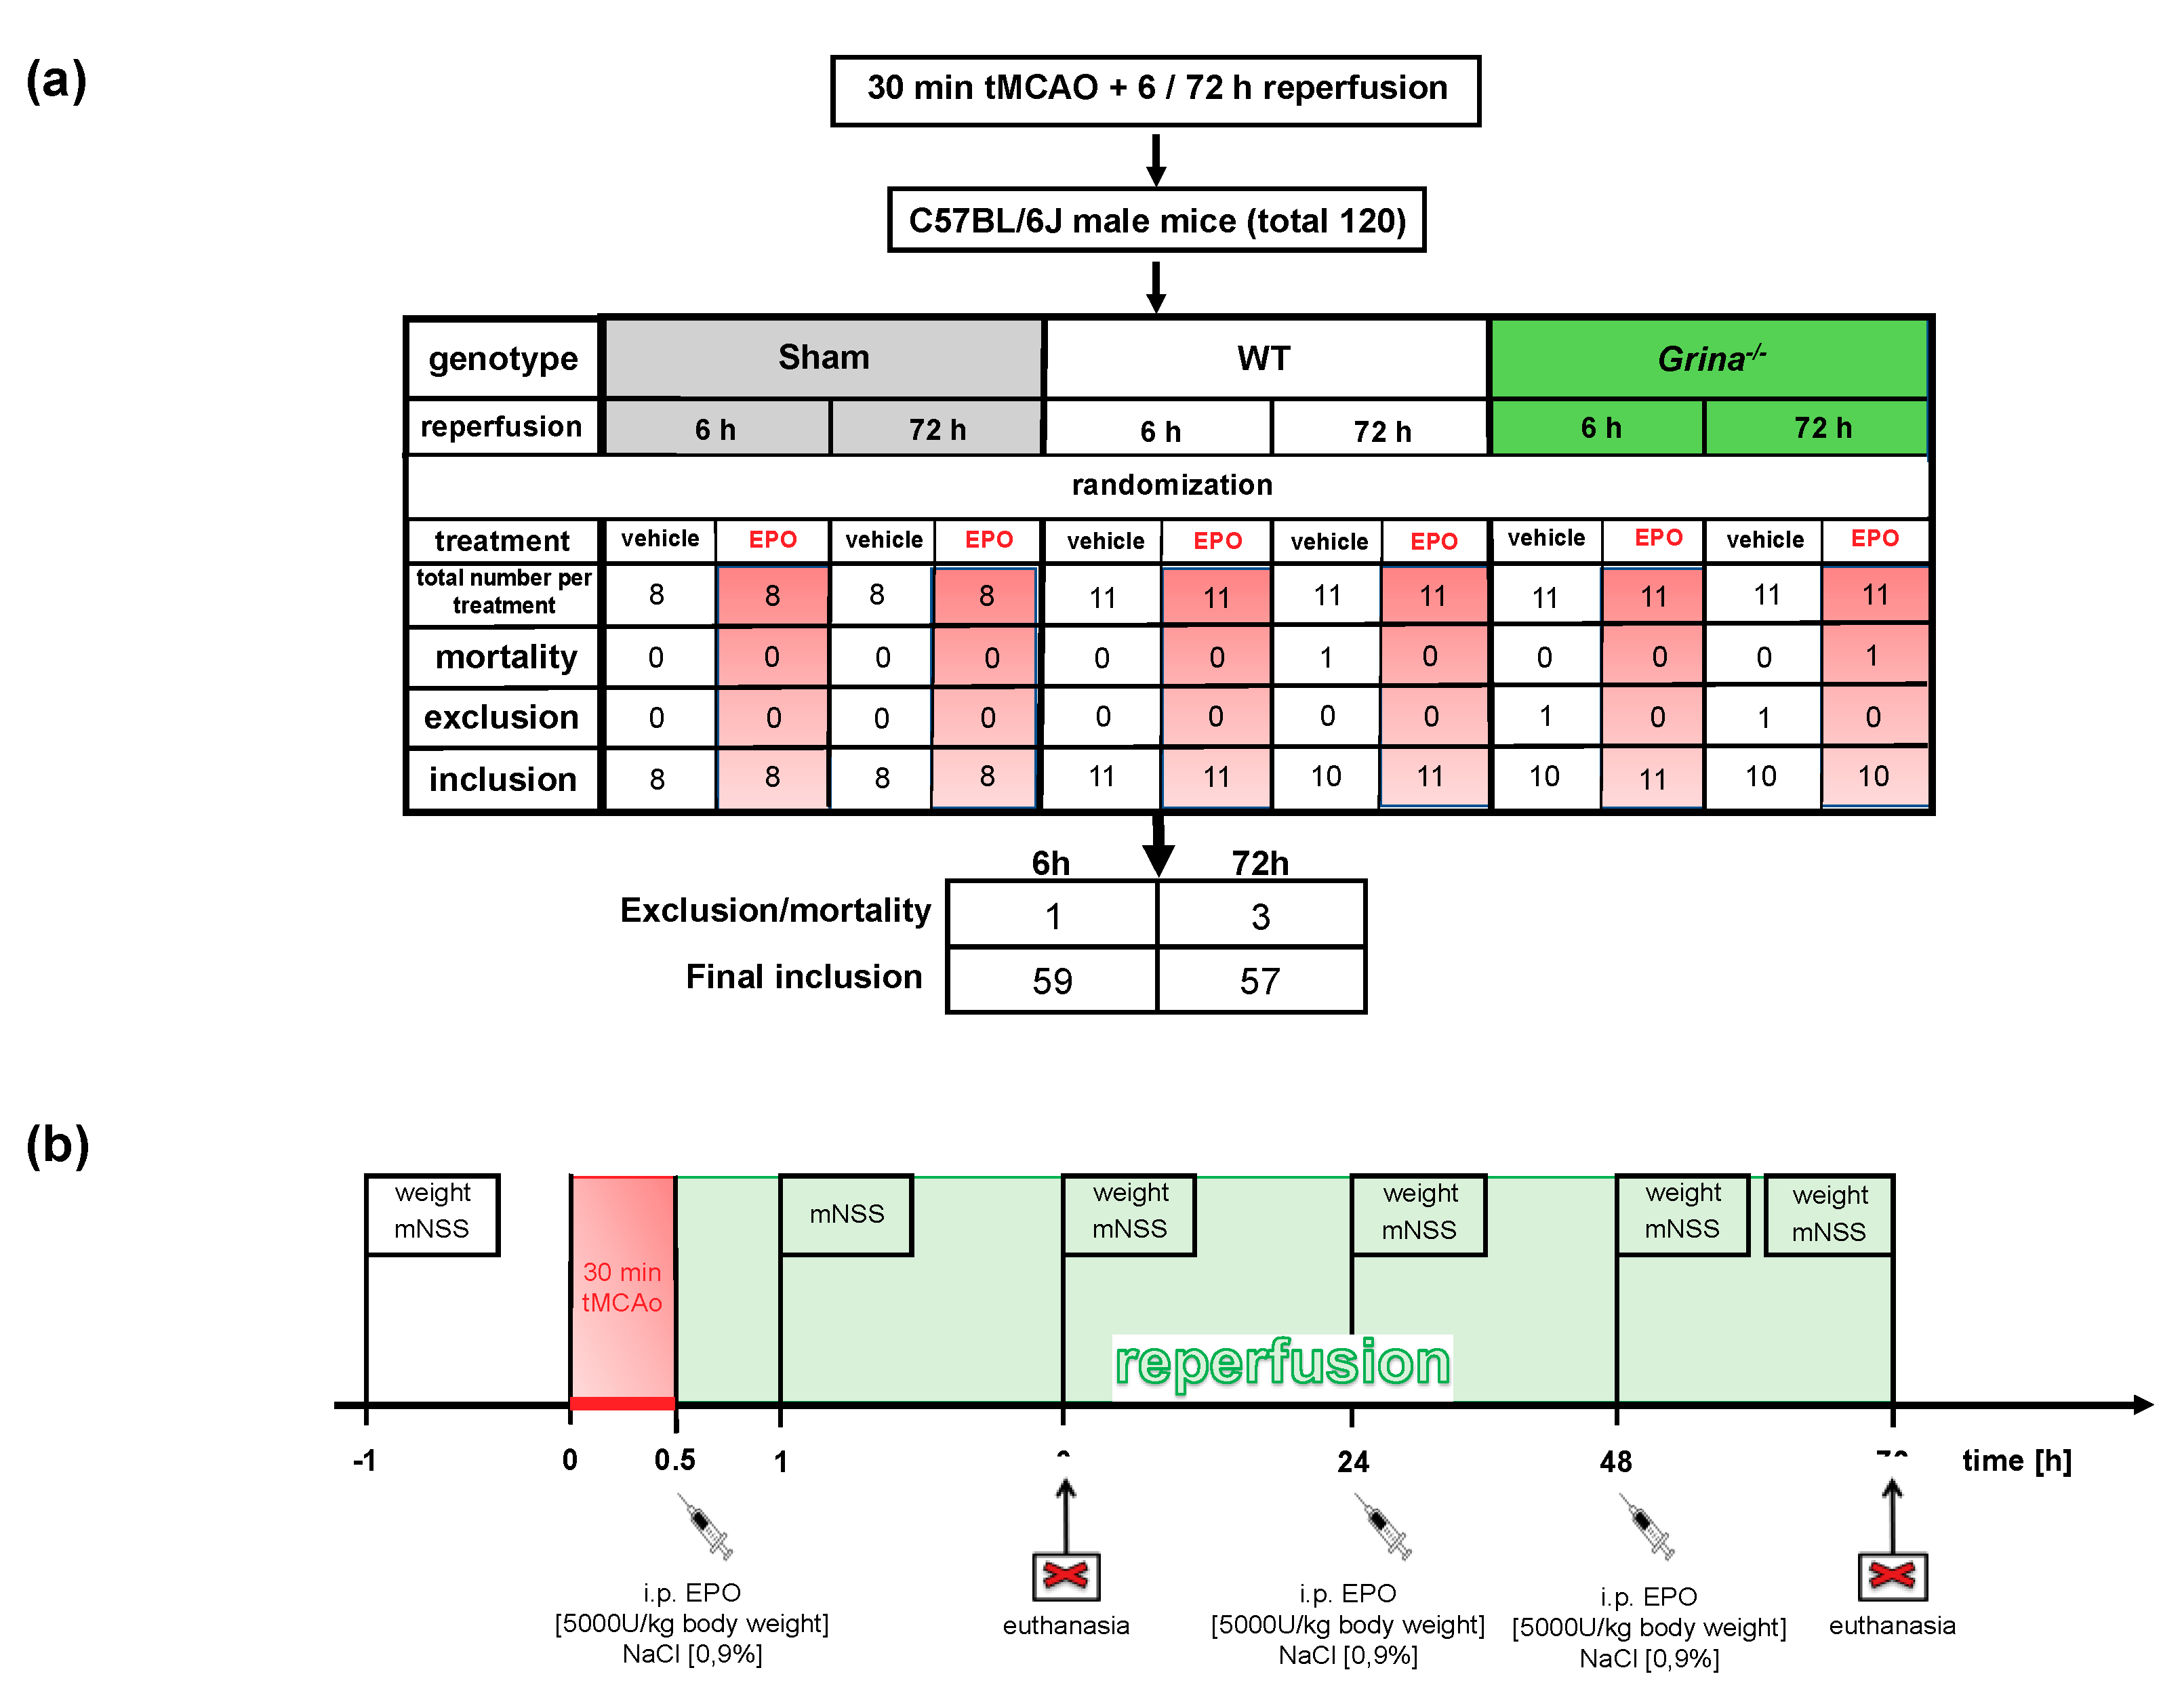
4.2. Transient Middle Cerebral Artery Occlusion (tMCAo) And Study Protocol
4.3. EPO Application And Exclusion Criteria
4.4. Modified Neurologic Severity Score (mNSS)
4.5. Volumetric Evaluation of Infarct Sizes and Hematology
4.6. Terminal Deoxynucleotidyl Transferase dUTP Nick End Labeling (TUNEL)
4.7. Immunocytochemistry
4.8. Reverse-Transcription Quantitative PCR (RT-qPCR)
4.9. Primary Murine Cortical Cell Culture, Oxygen-glucose-deprivation (OGD) And Cell Viability
4.10. Xbp1 mRNA Splicing Assay
4.11. Statistical Analysis
5. Conclusions
Author Contributions
Funding
Acknowledgments
Conflicts of Interest
Abbreviations
| UPR | Unfolded protein response |
| IRE1alpha | Inositol-requiring enzyme 1alpha |
| PERK | Protein kinase RNA-like ER kinase |
| ATF6 | Activating transcription factor 6 |
| GRINA | Ionotropic N-Methyl-D-Aspartate-associated protein |
| EPO | Erythropoietin |
| MCAo | Middle cerebral artery occlusion |
References
- Kim, Y.D.; Cha, M.J.; Kim, J.; Lee, D.H.; Lee, H.S.; Nam, C.M.; Nam, H.S.; Heo, J.H. Long-term mortality in patients with coexisting potential causes of ischemic stroke. Int. J. Stroke 2015, 10, 541–546. [Google Scholar] [CrossRef] [PubMed]
- Feigin, V.L.; Norrving, B.; Mensah, G.A. Global Burden of Stroke. Circ. Res. 2017, 120, 439–448. [Google Scholar] [CrossRef]
- Hacke, W.; Kaste, M.; Bluhmki, E.; Brozman, M.; Davalos, A.; Guidetti, D.; Larrue, V.; Lees, K.R.; Medeghri, Z.; Machnig, T.; et al. Thrombolysis with alteplase 3 to 4.5 h after acute ischemic stroke. N. Engl. J. Med. 2008, 359, 1317–1329. [Google Scholar] [CrossRef] [PubMed]
- Goyal, M.; Demchuk, A.M.; Menon, B.K.; Eesa, M.; Rempel, J.L.; Thornton, J.; Roy, D.; Jovin, T.G.; Willinsky, R.A.; Sapkota, B.L.; et al. Randomized assessment of rapid endovascular treatment of ischemic stroke. N. Engl. J. Med. 2015, 372, 1019–1030. [Google Scholar] [CrossRef] [PubMed]
- Chipurupalli, S.; Kannan, E.; Tergaonkar, V.; D’Andrea, R.; Robinson, N. Hypoxia Induced ER Stress Response as an Adaptive Mechanism in Cancer. Int. J. Mol. Sci. 2019, 20, 749. [Google Scholar] [CrossRef] [PubMed]
- Pereira, E.R.; Frudd, K.; Awad, W.; Hendershot, L.M. Endoplasmic reticulum (ER) stress and hypoxia response pathways interact to potentiate hypoxia-inducible factor 1 (HIF-1) transcriptional activity on targets like vascular endothelial growth factor (VEGF). J. Biol. Chem. 2014, 289, 3352–3364. [Google Scholar] [CrossRef]
- Xu, B.; Qin, Y.; Li, D.; Cai, N.; Wu, J.; Jiang, L.; Jie, L.; Zhou, Z.; Xu, J.; Wang, H. Inhibition of PDE4 protects neurons against oxygen-glucose deprivation-induced endoplasmic reticulum stress through activation of the Nrf-2/HO-1 pathway. Redox Biol. 2019, 28, 101342. [Google Scholar] [CrossRef]
- Doycheva, D.; Xu, N.; Kaur, H.; Malaguit, J.; McBride, D.W.; Tang, J.; Zhang, J.H. Adenoviral-TMBIM6 vector attenuates ER stress - induced apoptosis in a neonatal hypoxic-ischemic rat model. Dis. Model. Mech. 2019. [Google Scholar] [CrossRef]
- Ron, D.; Walter, P. Signal integration in the endoplasmic reticulum unfolded protein response. Nat. Rev. Mol. Cell Biol. 2007, 8, 519–529. [Google Scholar] [CrossRef]
- Wilhelm, T.; Bick, F.; Peters, K.; Mohta, V.; Tirosh, B.; Patterson, J.B.; Kharabi-Masouleh, B.; Huber, M. Infliction of proteotoxic stresses by impairment of the unfolded protein response or proteasomal inhibition as a therapeutic strategy for mast cell leukemia. Oncotarget 2018, 9, 2984–3000. [Google Scholar] [CrossRef]
- Shoulders, M.D.; Ryno, L.M.; Genereux, J.C.; Moresco, J.J.; Tu, P.G.; Wu, C.; Yates, J.R., 3rd; Su, A.I.; Kelly, J.W.; Wiseman, R.L. Stress-independent activation of XBP1s and/or ATF6 reveals three functionally diverse ER proteostasis environments. Cell Rep. 2013, 3, 1279–1292. [Google Scholar] [CrossRef] [PubMed]
- Lee, A.H.; Iwakoshi, N.N.; Glimcher, L.H. XBP-1 regulates a subset of endoplasmic reticulum resident chaperone genes in the unfolded protein response. Mol. Cell Biol. 2003, 23, 7448–7459. [Google Scholar] [CrossRef] [PubMed]
- Feldman, H.C.; Tong, M.; Wang, L.; Meza-Acevedo, R.; Gobillot, T.A.; Lebedev, I.; Gliedt, M.J.; Hari, S.B.; Mitra, A.K.; Backes, B.J.; et al. Structural and Functional Analysis of the Allosteric Inhibition of IRE1alpha with ATP-Competitive Ligands. ACS Chem. Biol. 2016, 11, 2195–2205. [Google Scholar] [CrossRef] [PubMed]
- Ghosh, R.; Wang, L.; Wang, E.S.; Perera, B.G.; Igbaria, A.; Morita, S.; Prado, K.; Thamsen, M.; Caswell, D.; Macias, H.; et al. Allosteric inhibition of the IRE1alpha RNase preserves cell viability and function during endoplasmic reticulum stress. Cell 2014, 158, 534–548. [Google Scholar] [CrossRef] [PubMed]
- Wong, M.Y.; DiChiara, A.S.; Suen, P.H.; Chen, K.; Doan, N.D.; Shoulders, M.D. Adapting Secretory Proteostasis and Function Through the Unfolded Protein Response. Curr. Top. Microbiol. Immunol. 2018, 414, 1–25. [Google Scholar] [PubMed]
- Hetz, C.; Chevet, E.; Oakes, S.A. Proteostasis control by the unfolded protein response. Nat. Cell Biol. 2015, 17, 829–838. [Google Scholar] [CrossRef] [PubMed] [Green Version]
- Harding, H.P.; Zhang, Y.; Bertolotti, A.; Zeng, H.; Ron, D. Perk is essential for translational regulation and cell survival during the unfolded protein response. Mol. Cell 2000, 5, 897–904. [Google Scholar] [CrossRef]
- Hillary, R.F.; FitzGerald, U. A lifetime of stress: ATF6 in development and homeostasis. J. Biomed. Sci. 2018, 25, 48. [Google Scholar] [CrossRef]
- Paschen, W.; Gissel, C.; Linden, T.; Doutheil, J. Erp72 expression activated by transient cerebral ischemia or disturbance of neuronal endoplasmic reticulum calcium stores. Metab. Brain Dis. 1998, 13, 55–68. [Google Scholar] [CrossRef]
- Ito, D.; Tanaka, K.; Suzuki, S.; Dembo, T.; Kosakai, A.; Fukuuchi, Y. Up-regulation of the Ire1-mediated signaling molecule, Bip, in ischemic rat brain. Neuroreport 2001, 12, 4023–4028. [Google Scholar] [CrossRef]
- Rissanen, A.; Sivenius, J.; Jolkkonen, J. Prolonged bihemispheric alterations in unfolded protein response related gene expression after experimental stroke. Brain Res. 2006, 1087, 60–66. [Google Scholar] [CrossRef] [PubMed]
- Kam, K.Y.; Yu, S.J.; Jeong, N.; Hong, J.H.; Jalin, A.M.; Lee, S.; Choi, Y.W.; Lee, C.K.; Kang, S.G. p-Hydroxybenzyl alcohol prevents brain injury and behavioral impairment by activating Nrf2, PDI, and neurotrophic factor genes in a rat model of brain ischemia. Mol. Cells 2011, 31, 209–215. [Google Scholar] [CrossRef] [PubMed]
- Hayashi, T.; Saito, A.; Okuno, S.; Ferrand-Drake, M.; Chan, P.H. Induction of GRP78 by ischemic preconditioning reduces endoplasmic reticulum stress and prevents delayed neuronal cell death. J. Cereb. Blood Flow Metab. 2003, 23, 949–961. [Google Scholar] [CrossRef] [PubMed]
- Tanaka, S.; Uehara, T.; Nomura, Y. Up-regulation of protein-disulfide isomerase in response to hypoxia/brain ischemia and its protective effect against apoptotic cell death. J. Biol. Chem. 2000, 275, 10388–10393. [Google Scholar] [CrossRef] [PubMed]
- Burda, J.; Martin, M.E.; Garcia, A.; Alcazar, A.; Fando, J.L.; Salinas, M. Phosphorylation of the alpha subunit of initiation factor 2 correlates with the inhibition of translation following transient cerebral ischaemia in the rat. Biochem. J. 1994, 302 Pt 2, 335–338. [Google Scholar] [CrossRef]
- Prostko, C.R.; Brostrom, M.A.; Malara, E.M.; Brostrom, C.O. Phosphorylation of eukaryotic initiation factor (eIF) 2 alpha and inhibition of eIF-2B in GH3 pituitary cells by perturbants of early protein processing that induce GRP78. J. Biol. Chem. 1992, 267, 16751–16754. [Google Scholar]
- Doutheil, J.; Gissel, C.; Oschlies, U.; Hossmann, K.A.; Paschen, W. Relation of neuronal endoplasmic reticulum calcium homeostasis to ribosomal aggregation and protein synthesis: Implications for stress-induced suppression of protein synthesis. Brain Res. 1997, 775, 43–51. [Google Scholar] [CrossRef]
- Kumar, R.; Krause, G.S.; Yoshida, H.; Mori, K.; DeGracia, D.J. Dysfunction of the unfolded protein response during global brain ischemia and reperfusion. J. Cereb. Blood Flow Metab. 2003, 23, 462–471. [Google Scholar] [CrossRef]
- Rojas-Rivera, D.; Armisen, R.; Colombo, A.; Martinez, G.; Eguiguren, A.L.; Diaz, A.; Kiviluoto, S.; Rodriguez, D.; Patron, M.; Rizzuto, R.; et al. TMBIM3/GRINA is a novel unfolded protein response (UPR) target gene that controls apoptosis through the modulation of ER calcium homeostasis. Cell Death Differ. 2012, 19, 1013–1026. [Google Scholar] [CrossRef] [Green Version]
- Nielsen, J.A.; Chambers, M.A.; Romm, E.; Lee, L.Y.; Berndt, J.A.; Hudson, L.D. Mouse transmembrane BAX inhibitor motif 3 (Tmbim3) encodes a 38 kDa transmembrane protein expressed in the central nervous system. Mol. Cell Biochem. 2011, 357, 73–81. [Google Scholar] [CrossRef]
- Kumar, K.N.; Tilakaratne, N.; Johnson, P.S.; Allen, A.E.; Michaelis, E.K. Cloning of cDNA for the glutamate-binding subunit of an NMDA receptor complex. Nature 1991, 354, 70–73. [Google Scholar] [CrossRef] [PubMed]
- Aikawa, H.; Tomita, H.; Ishiguro, S.; Nishikawa, S.; Sugano, E.; Tamai, M. Increased expression of glutamate binding protein mRNA in rat retina after ischemia-reperfusion injury. Tohoku J. Exp. Med. 2003, 199, 25–33. [Google Scholar] [CrossRef] [PubMed]
- Habib, P.; Stamm, A.S.; Zeyen, T.; Noristani, R.; Slowik, A.; Beyer, C.; Wilhelm, T.; Huber, M.; Komnig, D.; Schulz, J.B.; et al. EPO regulates neuroprotective Transmembrane BAX Inhibitor-1 Motif-containing (TMBIM) family members GRINA and FAIM2 after cerebral ischemia-reperfusion injury. Exp. Neurol. 2019, 320, 112978. [Google Scholar] [CrossRef] [PubMed]
- Goswami, D.B.; Jernigan, C.S.; Chandran, A.; Iyo, A.H.; May, W.L.; Austin, M.C.; Stockmeier, C.A.; Karolewicz, B. Gene expression analysis of novel genes in the prefrontal cortex of major depressive disorder subjects. Prog. Neuropsychopharmacol. Biol. Psychiatry 2013, 43, 126–133. [Google Scholar] [CrossRef] [PubMed]
- Rojas-Rivera, D.; Hetz, C. TMBIM protein family: Ancestral regulators of cell death. Oncogene 2015, 34, 269–280. [Google Scholar] [CrossRef]
- Chae, H.J.; Kim, H.R.; Xu, C.; Bailly-Maitre, B.; Krajewska, M.; Krajewski, S.; Banares, S.; Cui, J.; Digicaylioglu, M.; Ke, N.; et al. BI-1 regulates an apoptosis pathway linked to endoplasmic reticulum stress. Mol. Cell 2004, 15, 355–366. [Google Scholar] [CrossRef]
- Komnig, D.; Gertz, K.; Habib, P.; Nolte, K.W.; Meyer, T.; Brockmann, M.A.; Endres, M.; Rathkolb, B.; Hrabe de Angelis, M.; Schulz, J.B.; et al. Faim2 contributes to neuroprotection by erythropoietin in transient brain ischemia. J. Neurochem. 2018, 145, 258–270. [Google Scholar] [CrossRef]
- Kanaan, N.M.; Collier, T.J.; Marchionini, D.M.; McGuire, S.O.; Fleming, M.F.; Sortwell, C.E. Exogenous erythropoietin provides neuroprotection of grafted dopamine neurons in a rodent model of Parkinson’s disease. Brain Res. 2006, 1068, 221–229. [Google Scholar] [CrossRef]
- Sattler, M.B.; Merkler, D.; Maier, K.; Stadelmann, C.; Ehrenreich, H.; Bahr, M.; Diem, R. Neuroprotective effects and intracellular signaling pathways of erythropoietin in a rat model of multiple sclerosis. Cell Death Differ. 2004, 11 (Suppl. 2), S181–S192. [Google Scholar] [CrossRef]
- Grasso, G.; Buemi, M.; Alafaci, C.; Sfacteria, A.; Passalacqua, M.; Sturiale, A.; Calapai, G.; De Vico, G.; Piedimonte, G.; Salpietro, F.M.; et al. Beneficial effects of systemic administration of recombinant human erythropoietin in rabbits subjected to subarachnoid hemorrhage. Proc. Natl. Acad. Sci. USA 2002, 99, 5627–5631. [Google Scholar] [CrossRef] [Green Version]
- Lee, S.T.; Chu, K.; Sinn, D.I.; Jung, K.H.; Kim, E.H.; Kim, S.J.; Kim, J.M.; Ko, S.Y.; Kim, M.; Roh, J.K. Erythropoietin reduces perihematomal inflammation and cell death with eNOS and STAT3 activations in experimental intracerebral hemorrhage. J. Neurochem. 2006, 96, 1728–1739. [Google Scholar] [CrossRef] [PubMed]
- Catania, M.A.; Marciano, M.C.; Parisi, A.; Sturiale, A.; Buemi, M.; Grasso, G.; Squadrito, F.; Caputi, A.P.; Calapai, G. Erythropoietin prevents cognition impairment induced by transient brain ischemia in gerbils. Eur. J. Pharmacol. 2002, 437, 147–150. [Google Scholar] [CrossRef]
- Bernaudin, M.; Marti, H.H.; Roussel, S.; Divoux, D.; Nouvelot, A.; MacKenzie, E.T.; Petit, E. A potential role for erythropoietin in focal permanent cerebral ischemia in mice. J. Cereb. Blood Flow Metab. 1999, 19, 643–651. [Google Scholar] [CrossRef] [PubMed]
- Kumral, A.; Baskin, H.; Gokmen, N.; Yilmaz, O.; Genc, K.; Genc, S.; Tatli, M.M.; Duman, N.; Ozer, E.; Ozkan, H. Selective inhibition of nitric oxide in hypoxic-ischemic brain model in newborn rats: Is it an explanation for the protective role of erythropoietin? Biol. Neonate 2004, 85, 51–54. [Google Scholar] [CrossRef] [PubMed]
- Lu, D.; Mahmood, A.; Qu, C.; Goussev, A.; Schallert, T.; Chopp, M. Erythropoietin enhances neurogenesis and restores spatial memory in rats after traumatic brain injury. J. Neurotrauma 2005, 22, 1011–1017. [Google Scholar] [CrossRef]
- Chiang, C.K.; Nangaku, M.; Tanaka, T.; Iwawaki, T.; Inagi, R. Endoplasmic reticulum stress signal impairs erythropoietin production: A role for ATF4. Am. J. Physiol. Cell Physiol. 2013, 304, C342–C353. [Google Scholar] [CrossRef]
- Roussel, B.D.; Kruppa, A.J.; Miranda, E.; Crowther, D.C.; Lomas, D.A.; Marciniak, S.J. Endoplasmic reticulum dysfunction in neurological disease. Lancet Neurol. 2013, 12, 105–118. [Google Scholar] [CrossRef] [Green Version]
- Hetz, C.; Papa, F.R. The Unfolded Protein Response and Cell Fate Control. Mol. Cell 2018, 69, 169–181. [Google Scholar] [CrossRef] [Green Version]
- Walter, P.; Ron, D. The unfolded protein response: From stress pathway to homeostatic regulation. Science 2011, 334, 1081–1086. [Google Scholar] [CrossRef]
- Bertolotti, A.; Zhang, Y.; Hendershot, L.M.; Harding, H.P.; Ron, D. Dynamic interaction of BiP and ER stress transducers in the unfolded-protein response. Nat. Cell Biol. 2000, 2, 326–332. [Google Scholar] [CrossRef]
- Paschen, W.; Aufenberg, C.; Hotop, S.; Mengesdorf, T. Transient cerebral ischemia activates processing of xbp1 messenger RNA indicative of endoplasmic reticulum stress. J. Cereb. Blood Flow Metab. 2003, 23, 449–461. [Google Scholar] [CrossRef] [PubMed]
- Rojas-Rivera, D.; Delvaeye, T.; Roelandt, R.; Nerinckx, W.; Augustyns, K.; Vandenabeele, P.; Bertrand, M.J.M. When PERK inhibitors turn out to be new potent RIPK1 inhibitors: Critical issues on the specificity and use of GSK2606414 and GSK2656157. Cell Death Differ. 2017, 24, 1100–1110. [Google Scholar] [CrossRef] [PubMed]
- Moreno, J.A.; Halliday, M.; Molloy, C.; Radford, H.; Verity, N.; Axten, J.M.; Ortori, C.A.; Willis, A.E.; Fischer, P.M.; Barrett, D.A.; et al. Oral treatment targeting the unfolded protein response prevents neurodegeneration and clinical disease in prion-infected mice. Sci. Transl. Med. 2013, 5, 206ra138. [Google Scholar] [CrossRef] [PubMed]
- Ulbrich, C.; Zendedel, A.; Habib, P.; Kipp, M.; Beyer, C.; Dang, J. Long-term cerebral cortex protection and behavioral stabilization by gonadal steroid hormones after transient focal hypoxia. J. Steroid Biochem. Mol. Biol. 2012, 131, 10–16. [Google Scholar] [CrossRef]
- Habib, P.; Dreymueller, D.; Ludwig, A.; Beyer, C.; Dang, J. Sex steroid hormone-mediated functional regulation of microglia-like BV-2 cells during hypoxia. J. Steroid Biochem. Mol. Biol. 2013, 138, 195–205. [Google Scholar] [CrossRef]
- Habib, P.; Slowik, A.; Zendedel, A.; Johann, S.; Dang, J.; Beyer, C. Regulation of hypoxia-induced inflammatory responses and M1-M2 phenotype switch of primary rat microglia by sex steroids. J. Mol. Neurosci. 2014, 52, 277–285. [Google Scholar] [CrossRef]
- Ebrahimi, T.; Rust, M.; Kaiser, S.N.; Slowik, A.; Beyer, C.; Koczulla, A.R.; Schulz, J.B.; Habib, P.; Bach, J.P. α1-antitrypsin mitigates NLRP3-inflammasome activation in amyloid beta1-42-stimulated murine astrocytes. J. Neuroinflammation 2018, 15, 282. [Google Scholar] [CrossRef]
- Pfaffl, M.W. A new mathematical model for relative quantification in real-time RT-PCR. Nucleic Acids Res. 2001, 29, e45. [Google Scholar] [CrossRef]


| Demographics & Haematology | ||||||||||||
|---|---|---|---|---|---|---|---|---|---|---|---|---|
| Genotype | Sham | WT | Grina−/− | |||||||||
| Treatment [5000 U/kg bodyweight] | Vehicle | EPO | Vehicle | EPO | Vehicle | EPO | ||||||
| Age [weeks] | 11 (±1) | 11 (±1) | 11 (±1) | 11 (±1) | 11 (±1) | 11 (±1) | ||||||
| Sex [female/male] | male | male | male | male | male | male | ||||||
| Reperfusion time after 30 min of tMCAO | 6 h | 72 h | 6 h | 72 h | 6 h | 72 h | 6 h | 72 h | 6 h | 72 h | 6 h | 72 h |
| Bodyweight [g] | 25.8 (±1.9) | 26.7 (±1.0) | 26.6 (±1.5) | 25.3 (±1.8) | 26.5 (±1.9) | 25.2 (±2.1) | 25.3 (±2.4) | 26.4 (±2.0) | 26.2 (±1.7) | 25.7 (±1.5) | 26.4 (±1.7) | 27.9 (±1.1) |
| WBC [103/µl] | 2.9 (±1.0) | 4.0 (±0.9) | 4.4 (±1.5) | 5.4 (±2.6) | 4.1 (±0.6) | 1.3 (±0.6) | 2.8 (±1.3) | 6.3 (±3.5) | 6.3 (±1.5) | 4.5 (±3.8) | 3.9 (±0.4) | 3.0 (±1.9) |
| RBC [106/µl] | 9.1 (±0.2) | 9.3 (±0.1) | 9.3 (±0.4) | 9.0 (±0.2) | 9.2 (±0.6) | 10.7 (±0.6) | 9.2 (±0.5) | 10.4 (±0.4) | 9.5 (±1.0) | 9.6 (±0.7) | 9.2 (±0.3) | 9.6 (±0.6) |
| HGB [g/dl] | 13.7 (±0.3) | 13.6 (±0.1) | 13.7 (±0.8) | 13.6 (±0.2) | 13.8 (±1.1) | 16.1 (±1.1) | 13.6 (±0.7) | 15.7 (±0.3) | 12.9 (±0.7) | 14.1 (±0.8) | 12.8 (±1.2) | 14.2 (±1.0) |
| HCT [%] | 39.2 (±1.0) | 38.8 (±0.7) | 39.8 (±1.7) | 39.6 (±0.1) | 39.6 (±2.7) | 44.0 (±2.8) | 39.1 (±2.0) | 44.7 (±2.0) | 40.8 (±3.0) | 32.2 (±2.9) | 38.8 (±0.9) | 40.3 (±2.7) |
| MVC [fl] | 42.9 (±0.2) | 41.8 (±0.4) | 43.0 (±0.2) | 44.0 (±1.0) | 43.0 (±0.2) | 41.6 (±0.2) | 42.6 (±0.5) | 43.0 (±0.3) | 42.9 (±2.1) | 40.8 (±0.0) | 42.0 (±0.5) | 41.8 (±0.8) |
| MCH [pg] | 15.0 (±0.2) | 14.6 (±0.2) | 14.8 (±0.3) | 15.1 (±0.6) | 15.0 (±0.2) | 14.9 (±0.1) | 14.9 (±0.3) | 15.1 (±0.3) | 13.6 (±0.3) | 14.7 (±0.2) | 13.9 (±1.0) | 14.7 (±0.4) |
| MCHC [g/dl] | 34.9 (±0.6) | 35.0 (±0.9) | 34.5 (±0.6) | 34.5 (±0.7) | 34.8 (±0.4) | 35.9 (±0.2) | 34.9 (±0.4) | 35.1 (±0.9) | 31.6 (±3.3) | 36.0 (±0.5) | 33.0 (±0.9) | 35.2 (±0.9) |
| PLT [10³/µl] | 720 (±275) | 1045 (±61) | 916 (±35) | 819 (±92) | 902 (±113) | 1433 (±16) | 514 (±507) | 966 (±283) | 860 (±143) | 821 (±47) | 1010 (±123) | 1153 (±121) |
© 2019 by the authors. Licensee MDPI, Basel, Switzerland. This article is an open access article distributed under the terms and conditions of the Creative Commons Attribution (CC BY) license (http://creativecommons.org/licenses/by/4.0/).
Share and Cite
Habib, P.; Stamm, A.-S.; Schulz, J.B.; Reich, A.; Slowik, A.; Capellmann, S.; Huber, M.; Wilhelm, T. EPO and TMBIM3/GRINA Promote the Activation of the Adaptive Arm and Counteract the Terminal Arm of the Unfolded Protein Response after Murine Transient Cerebral Ischemia. Int. J. Mol. Sci. 2019, 20, 5421. https://0-doi-org.brum.beds.ac.uk/10.3390/ijms20215421
Habib P, Stamm A-S, Schulz JB, Reich A, Slowik A, Capellmann S, Huber M, Wilhelm T. EPO and TMBIM3/GRINA Promote the Activation of the Adaptive Arm and Counteract the Terminal Arm of the Unfolded Protein Response after Murine Transient Cerebral Ischemia. International Journal of Molecular Sciences. 2019; 20(21):5421. https://0-doi-org.brum.beds.ac.uk/10.3390/ijms20215421
Chicago/Turabian StyleHabib, Pardes, Ann-Sophie Stamm, Joerg B. Schulz, Arno Reich, Alexander Slowik, Sandro Capellmann, Michael Huber, and Thomas Wilhelm. 2019. "EPO and TMBIM3/GRINA Promote the Activation of the Adaptive Arm and Counteract the Terminal Arm of the Unfolded Protein Response after Murine Transient Cerebral Ischemia" International Journal of Molecular Sciences 20, no. 21: 5421. https://0-doi-org.brum.beds.ac.uk/10.3390/ijms20215421