Impact of Paraburkholderia phytofirmans PsJN on Grapevine Phenolic Metabolism

 , , ,
, , ,  , and
, and
Abstract
:1. Introduction
2. Results
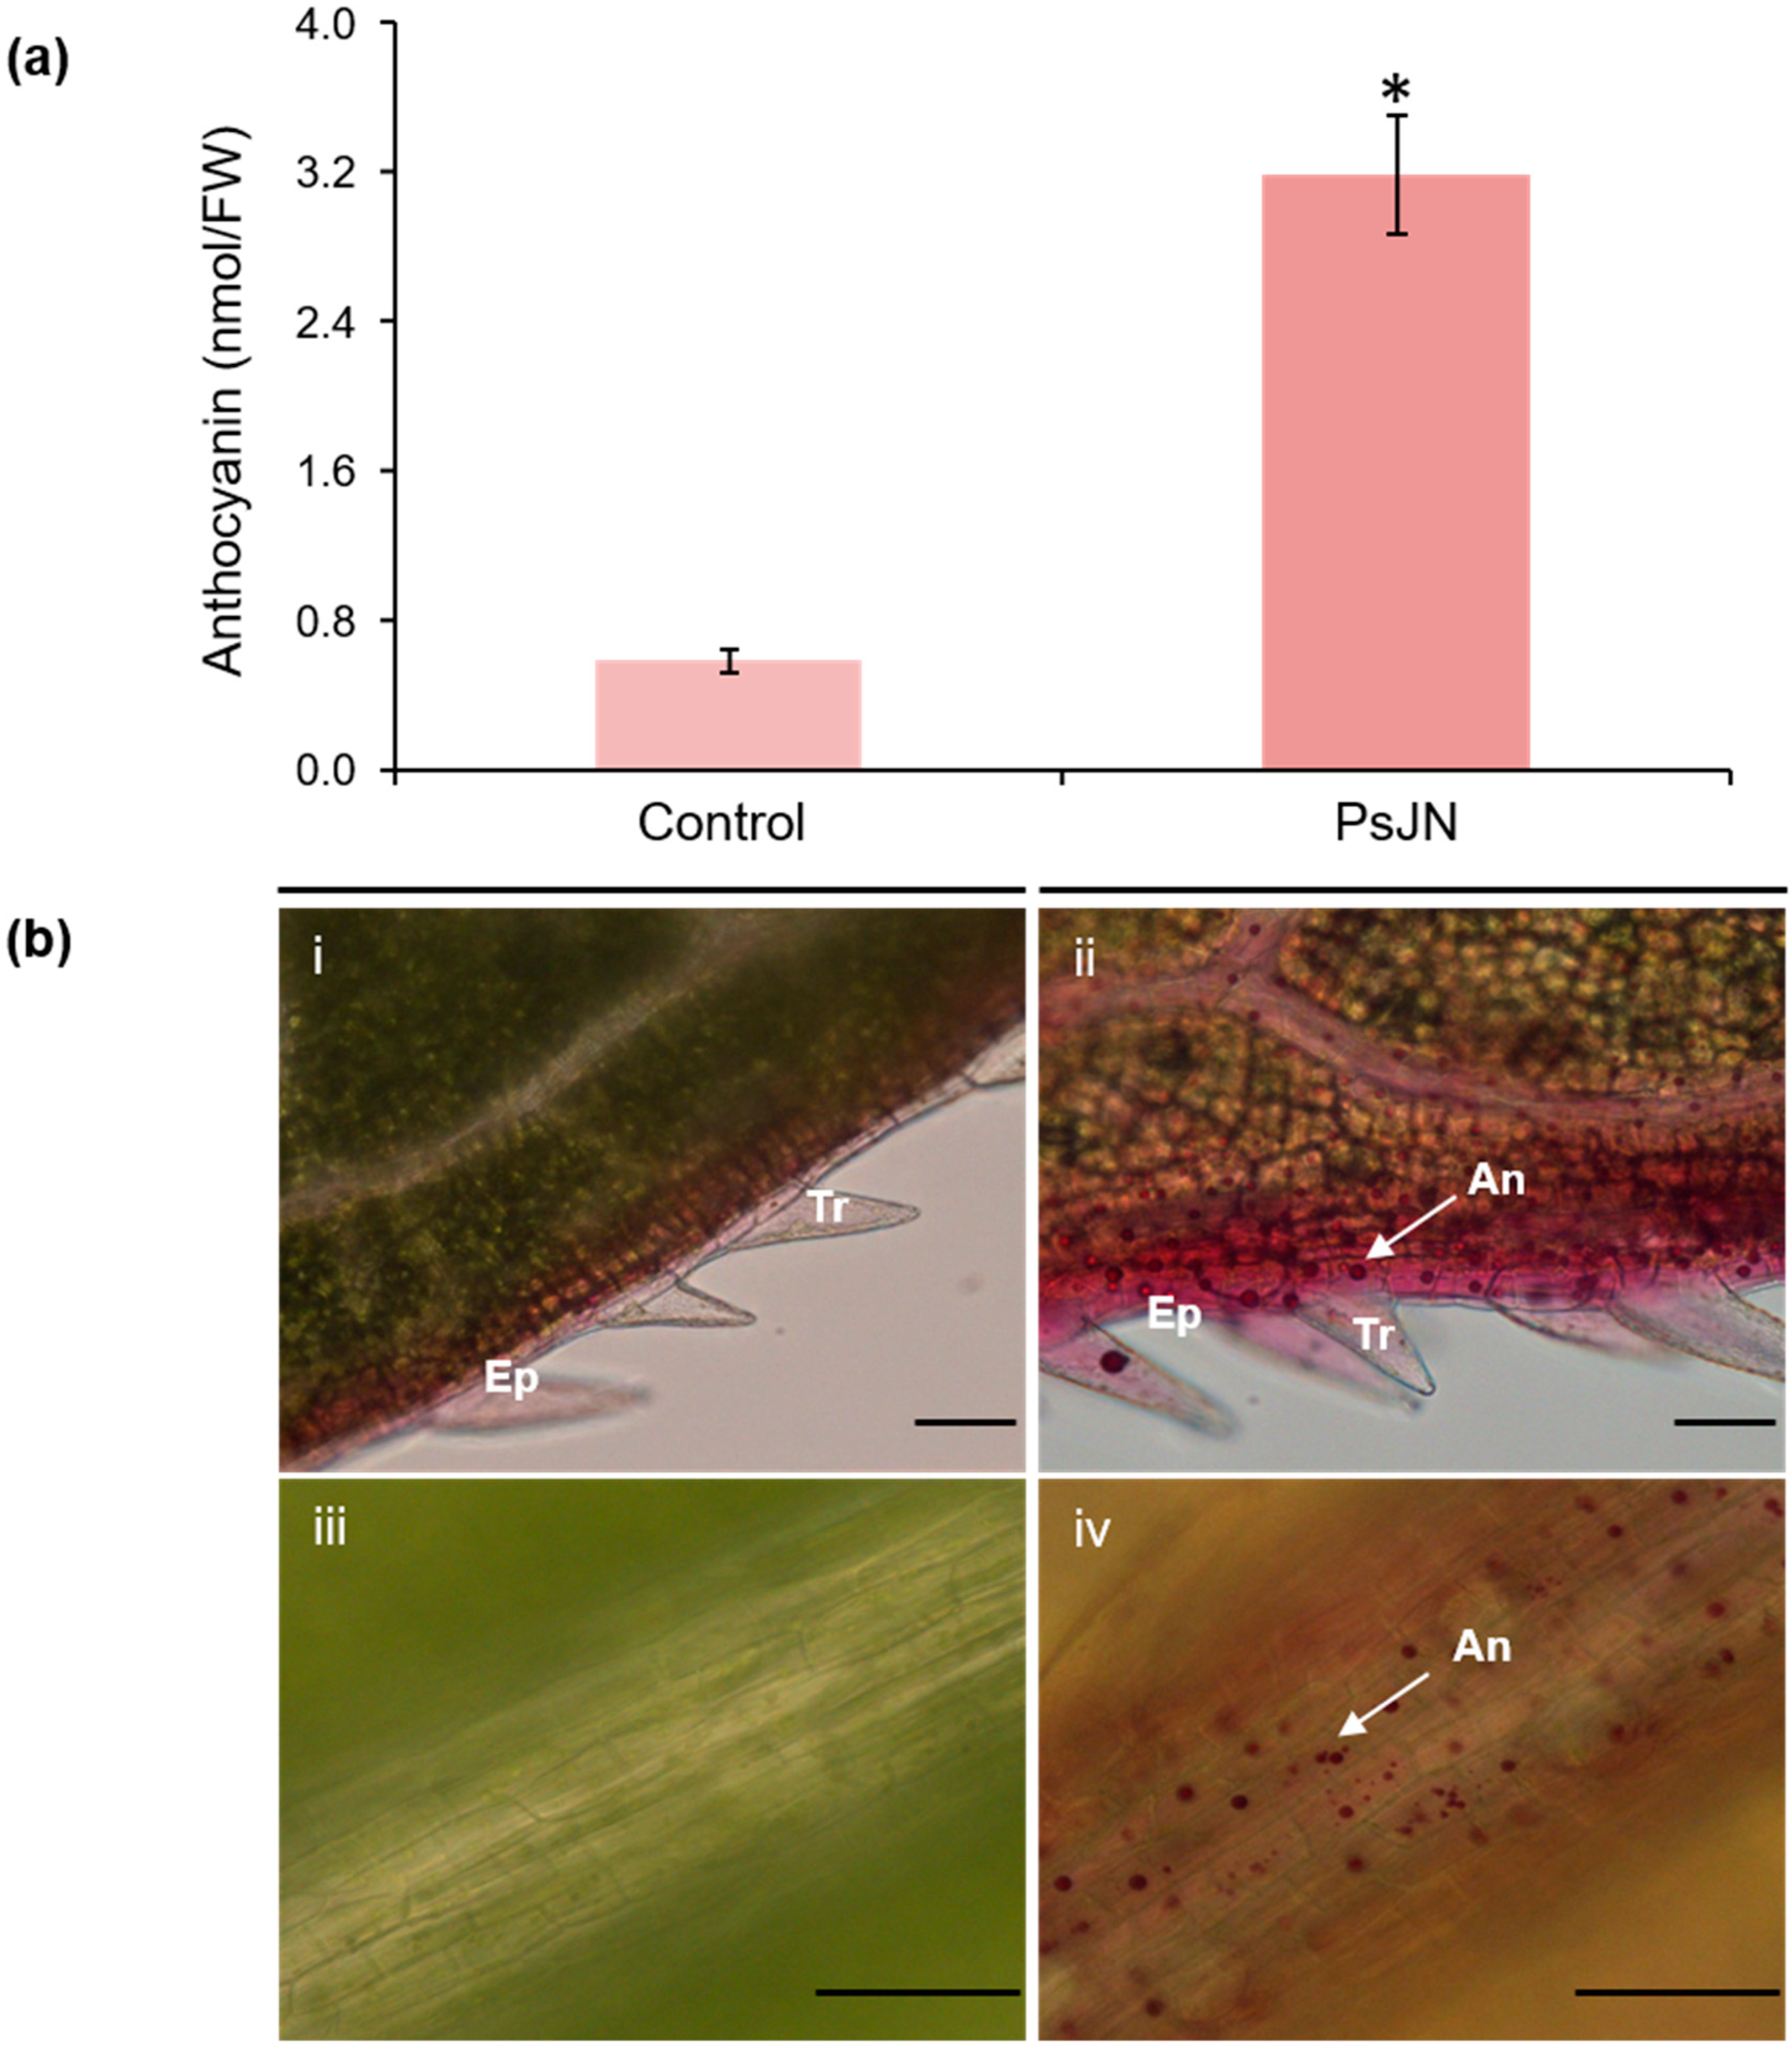
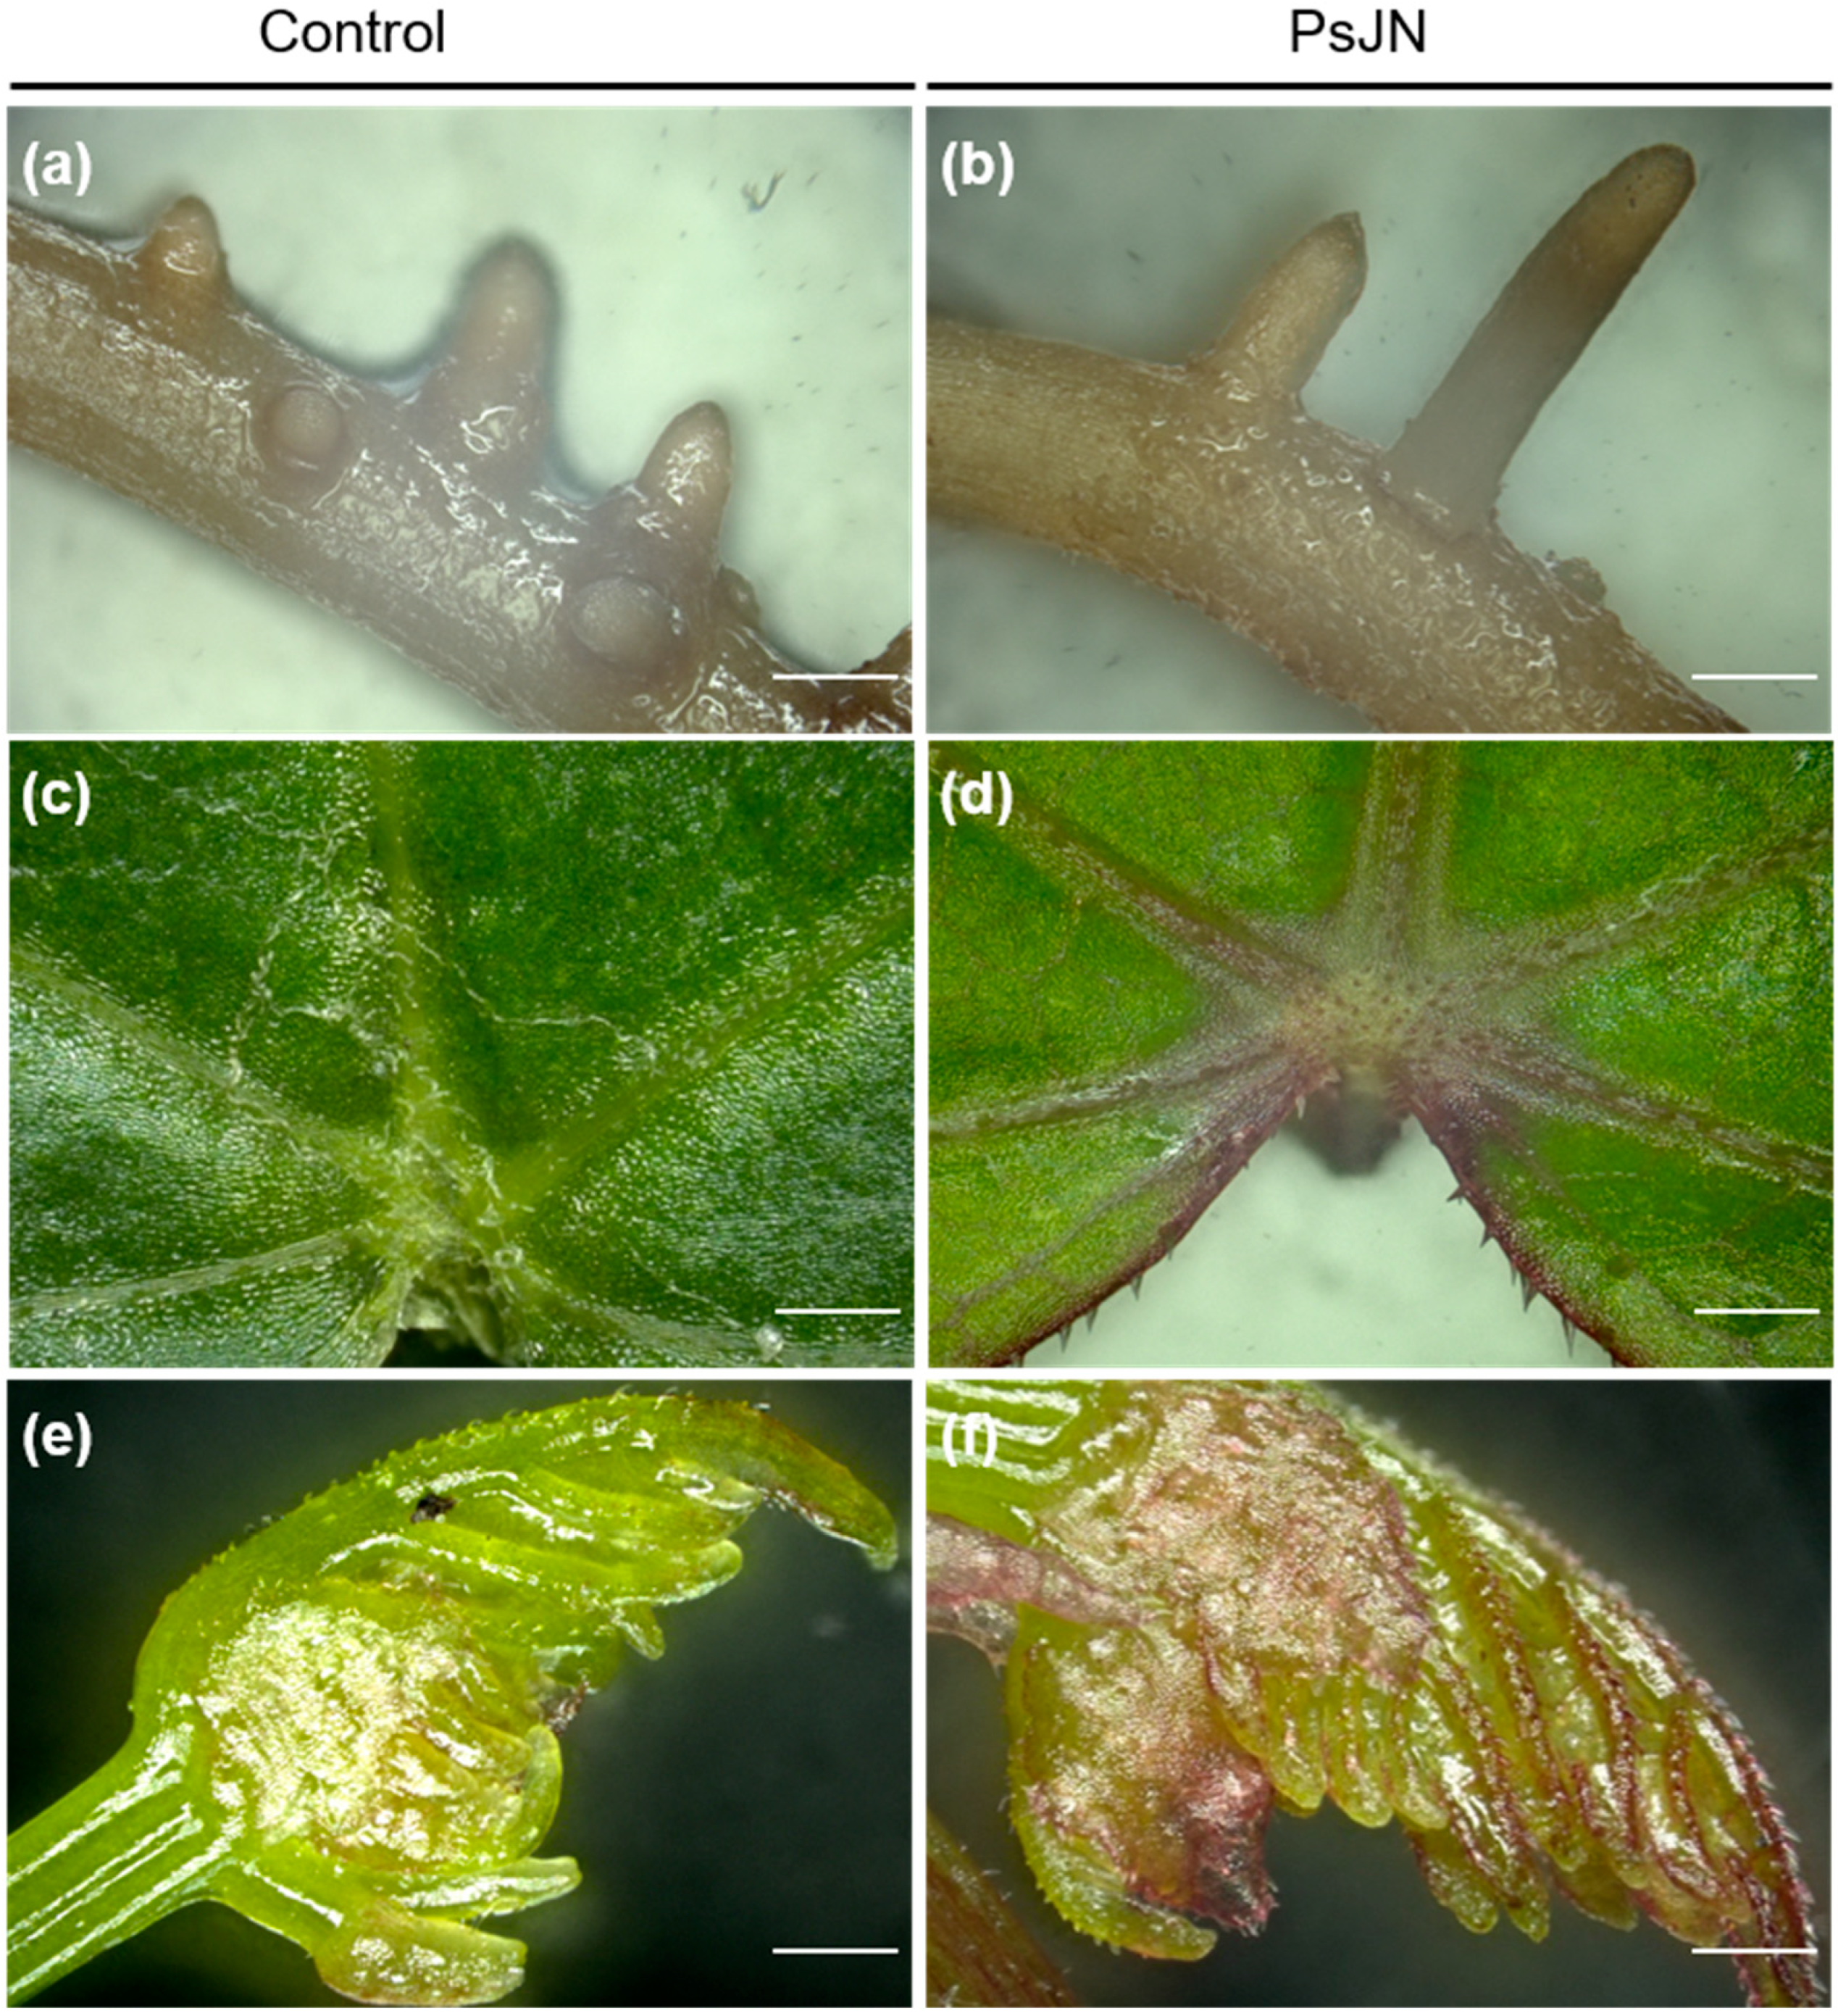
2.1. Phenotypic Changes Induced by PsJN
2.2. Modulation of Phenolics-Related Gene Expression in Roots and Leaves
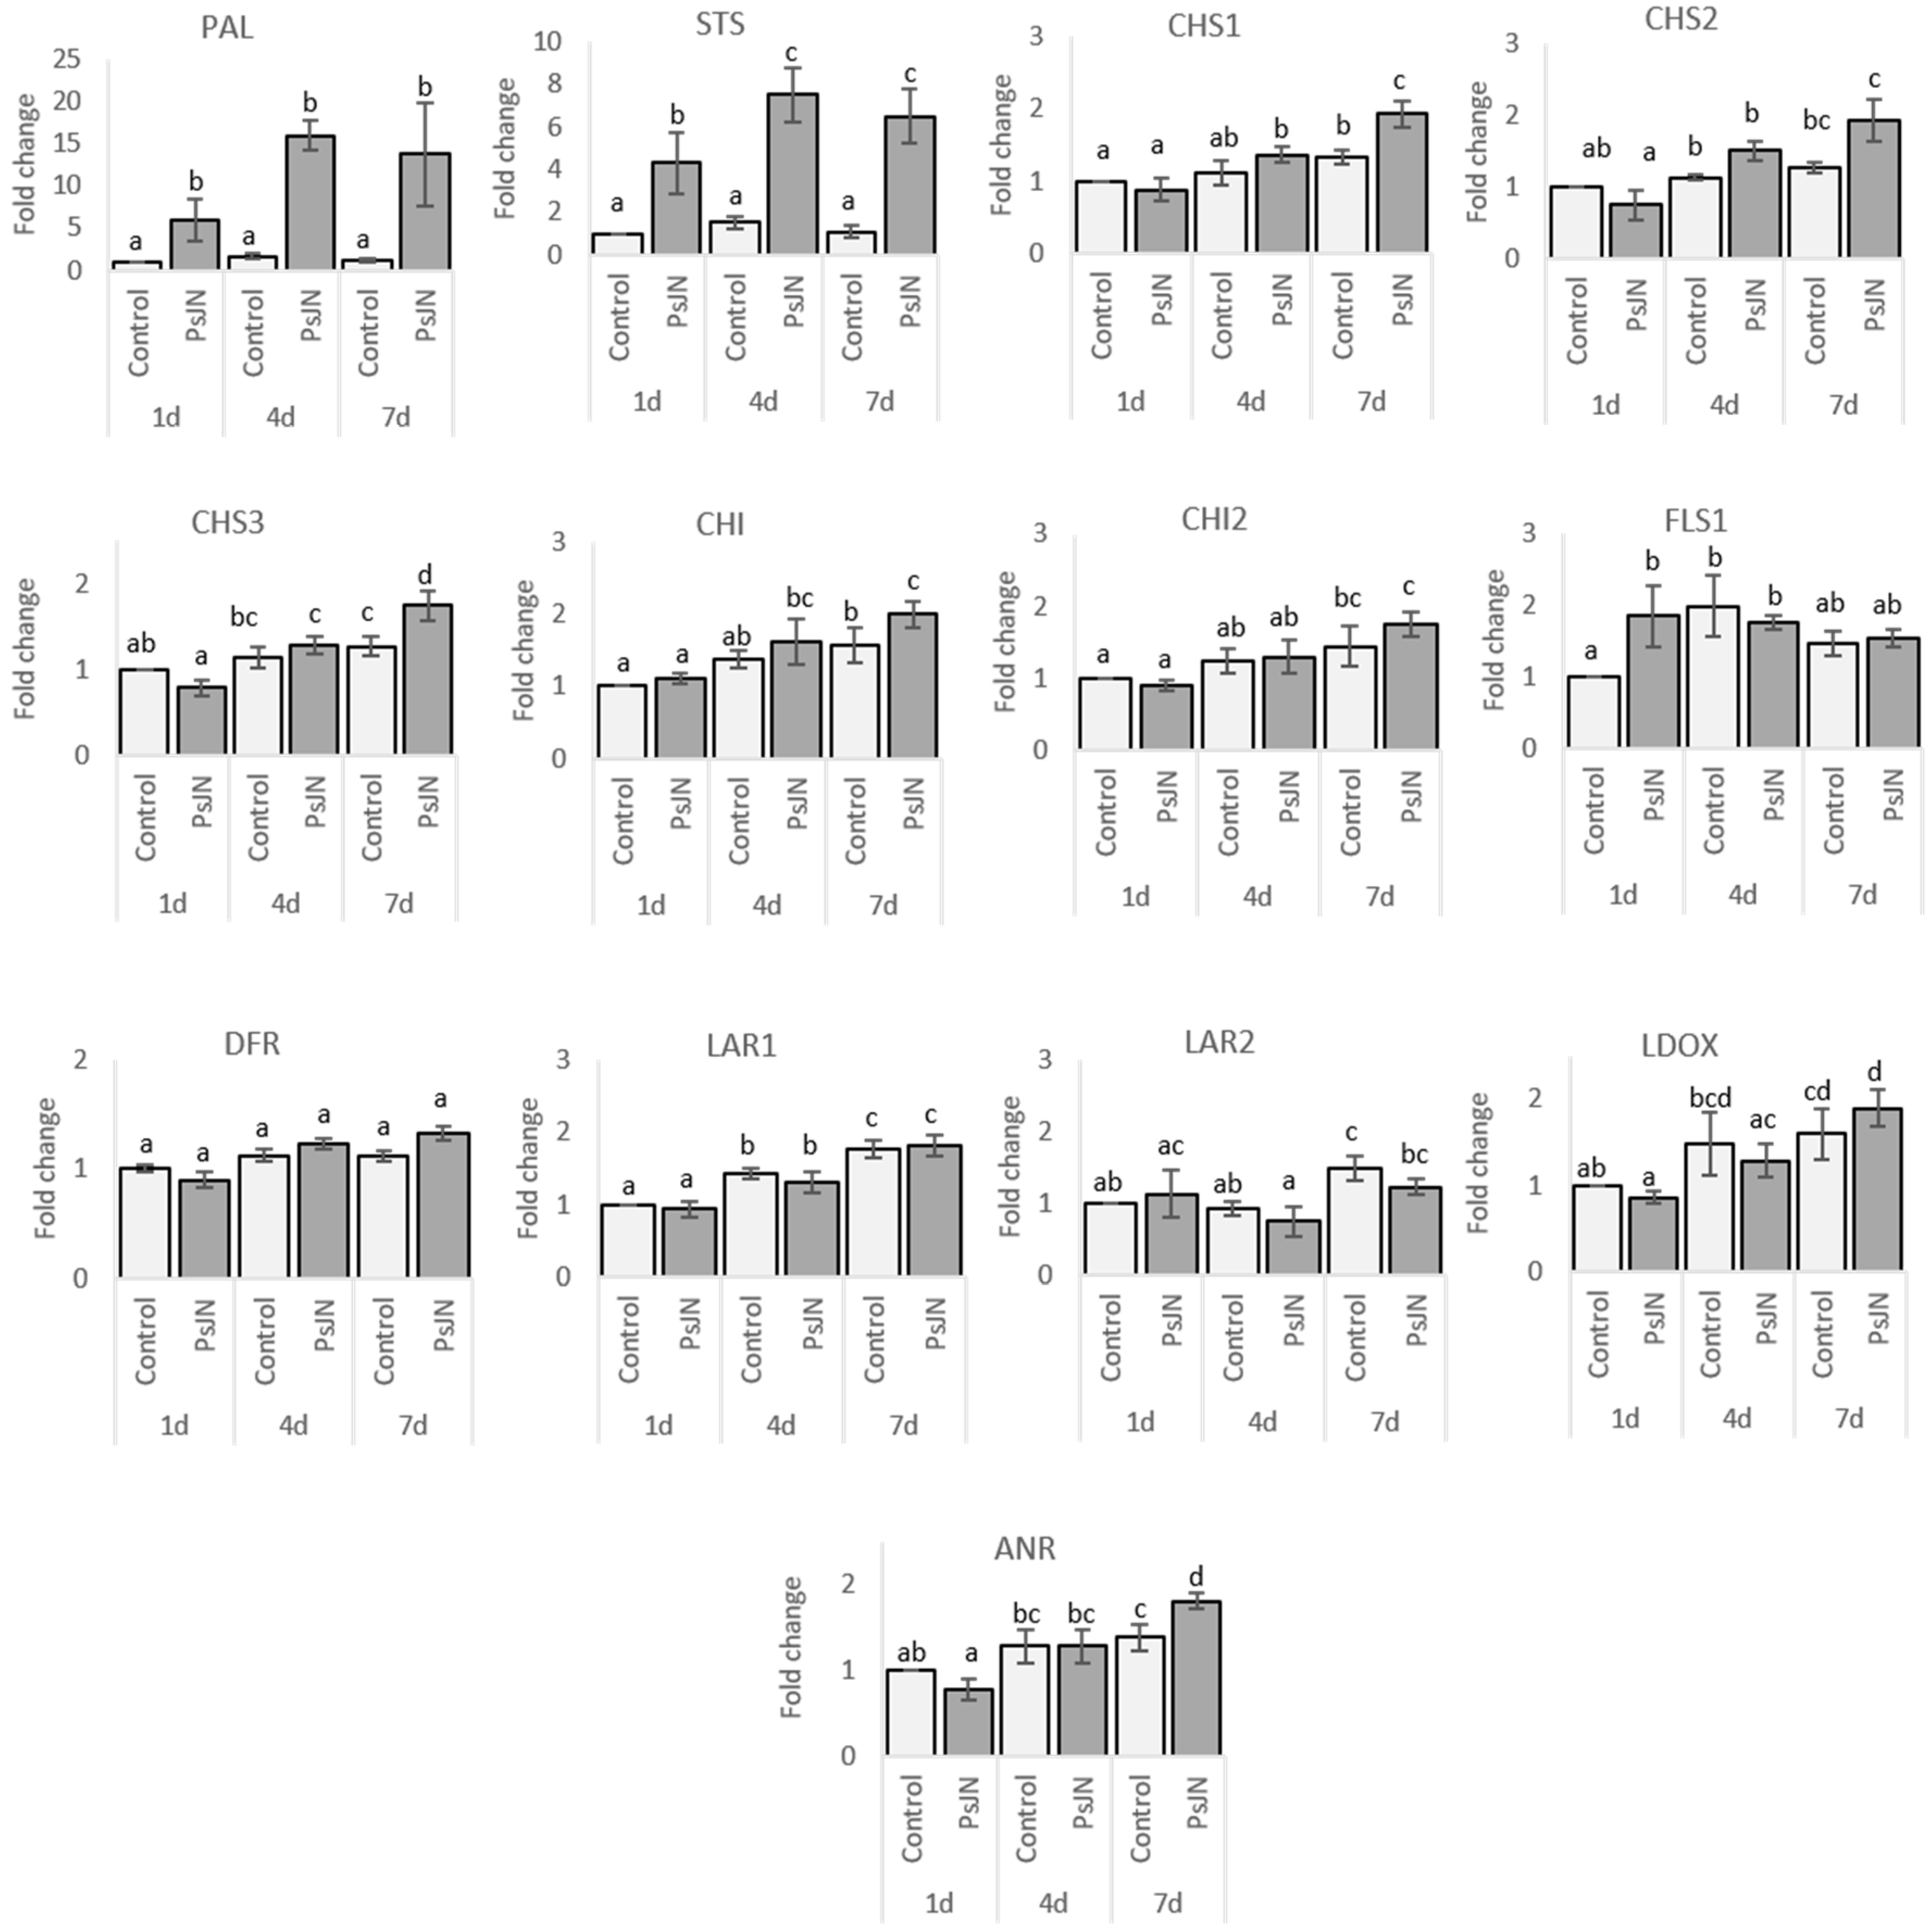
2.2.1. Roots
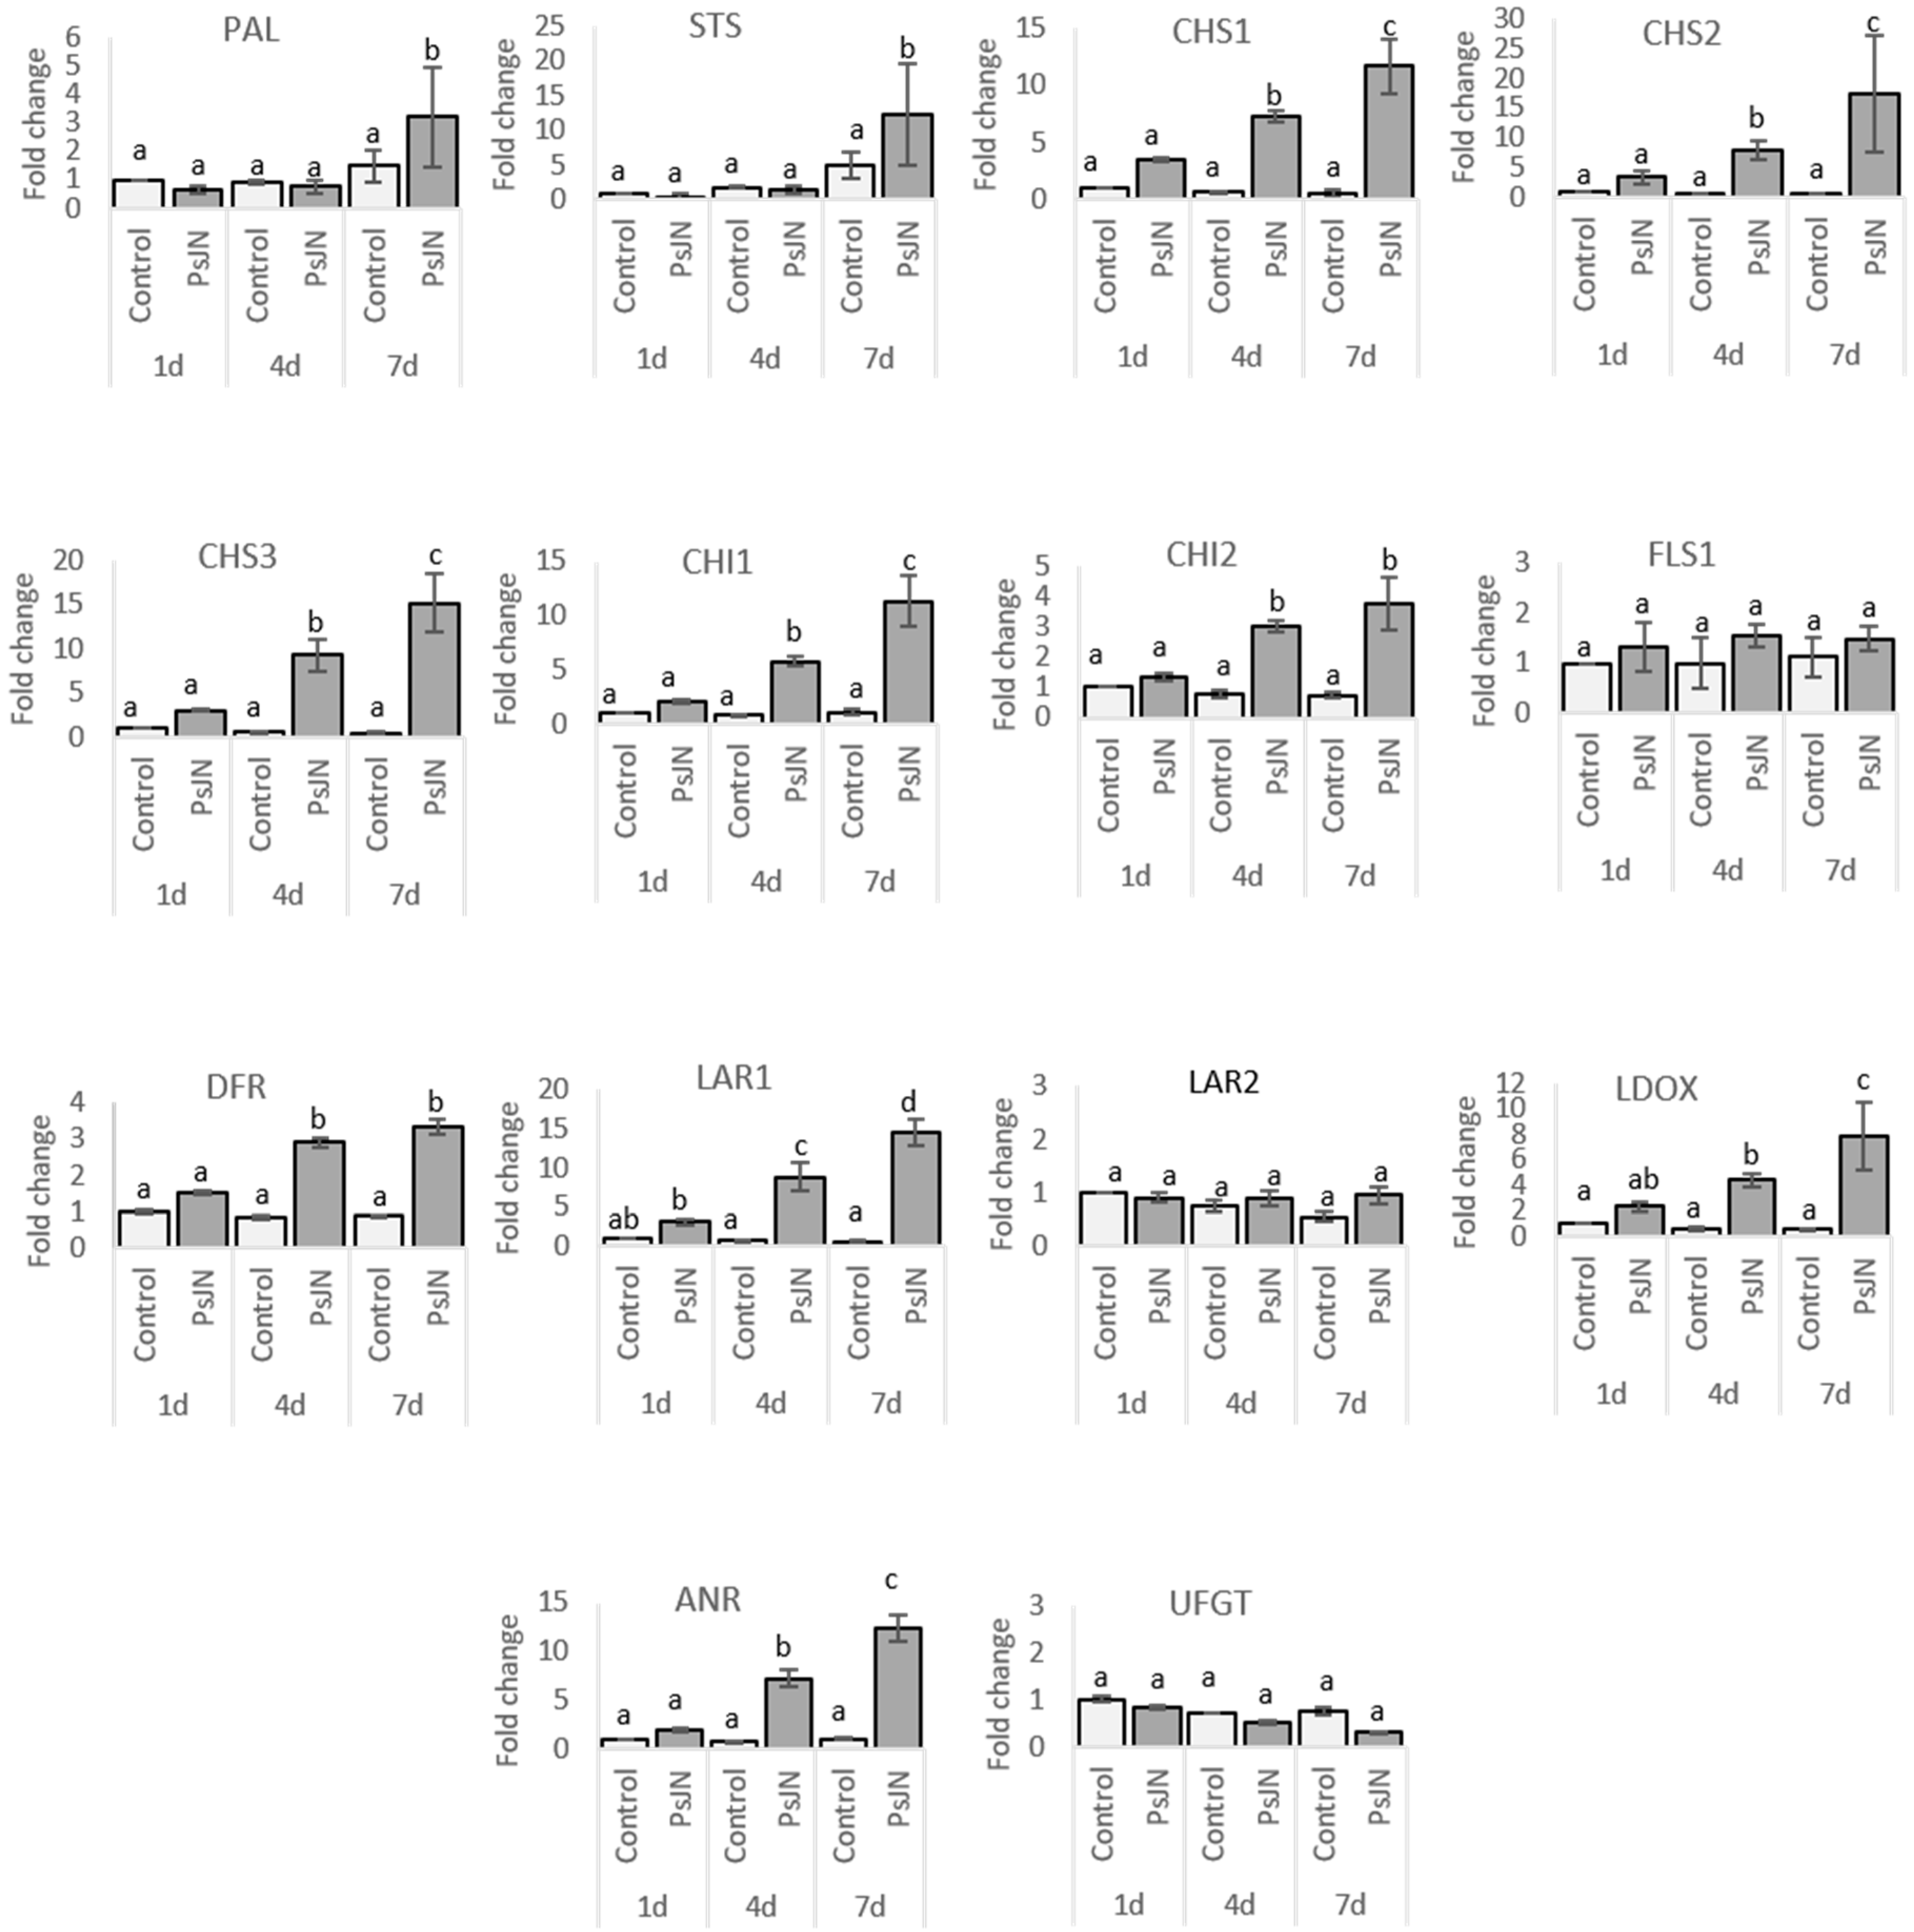
2.2.2. Leaves
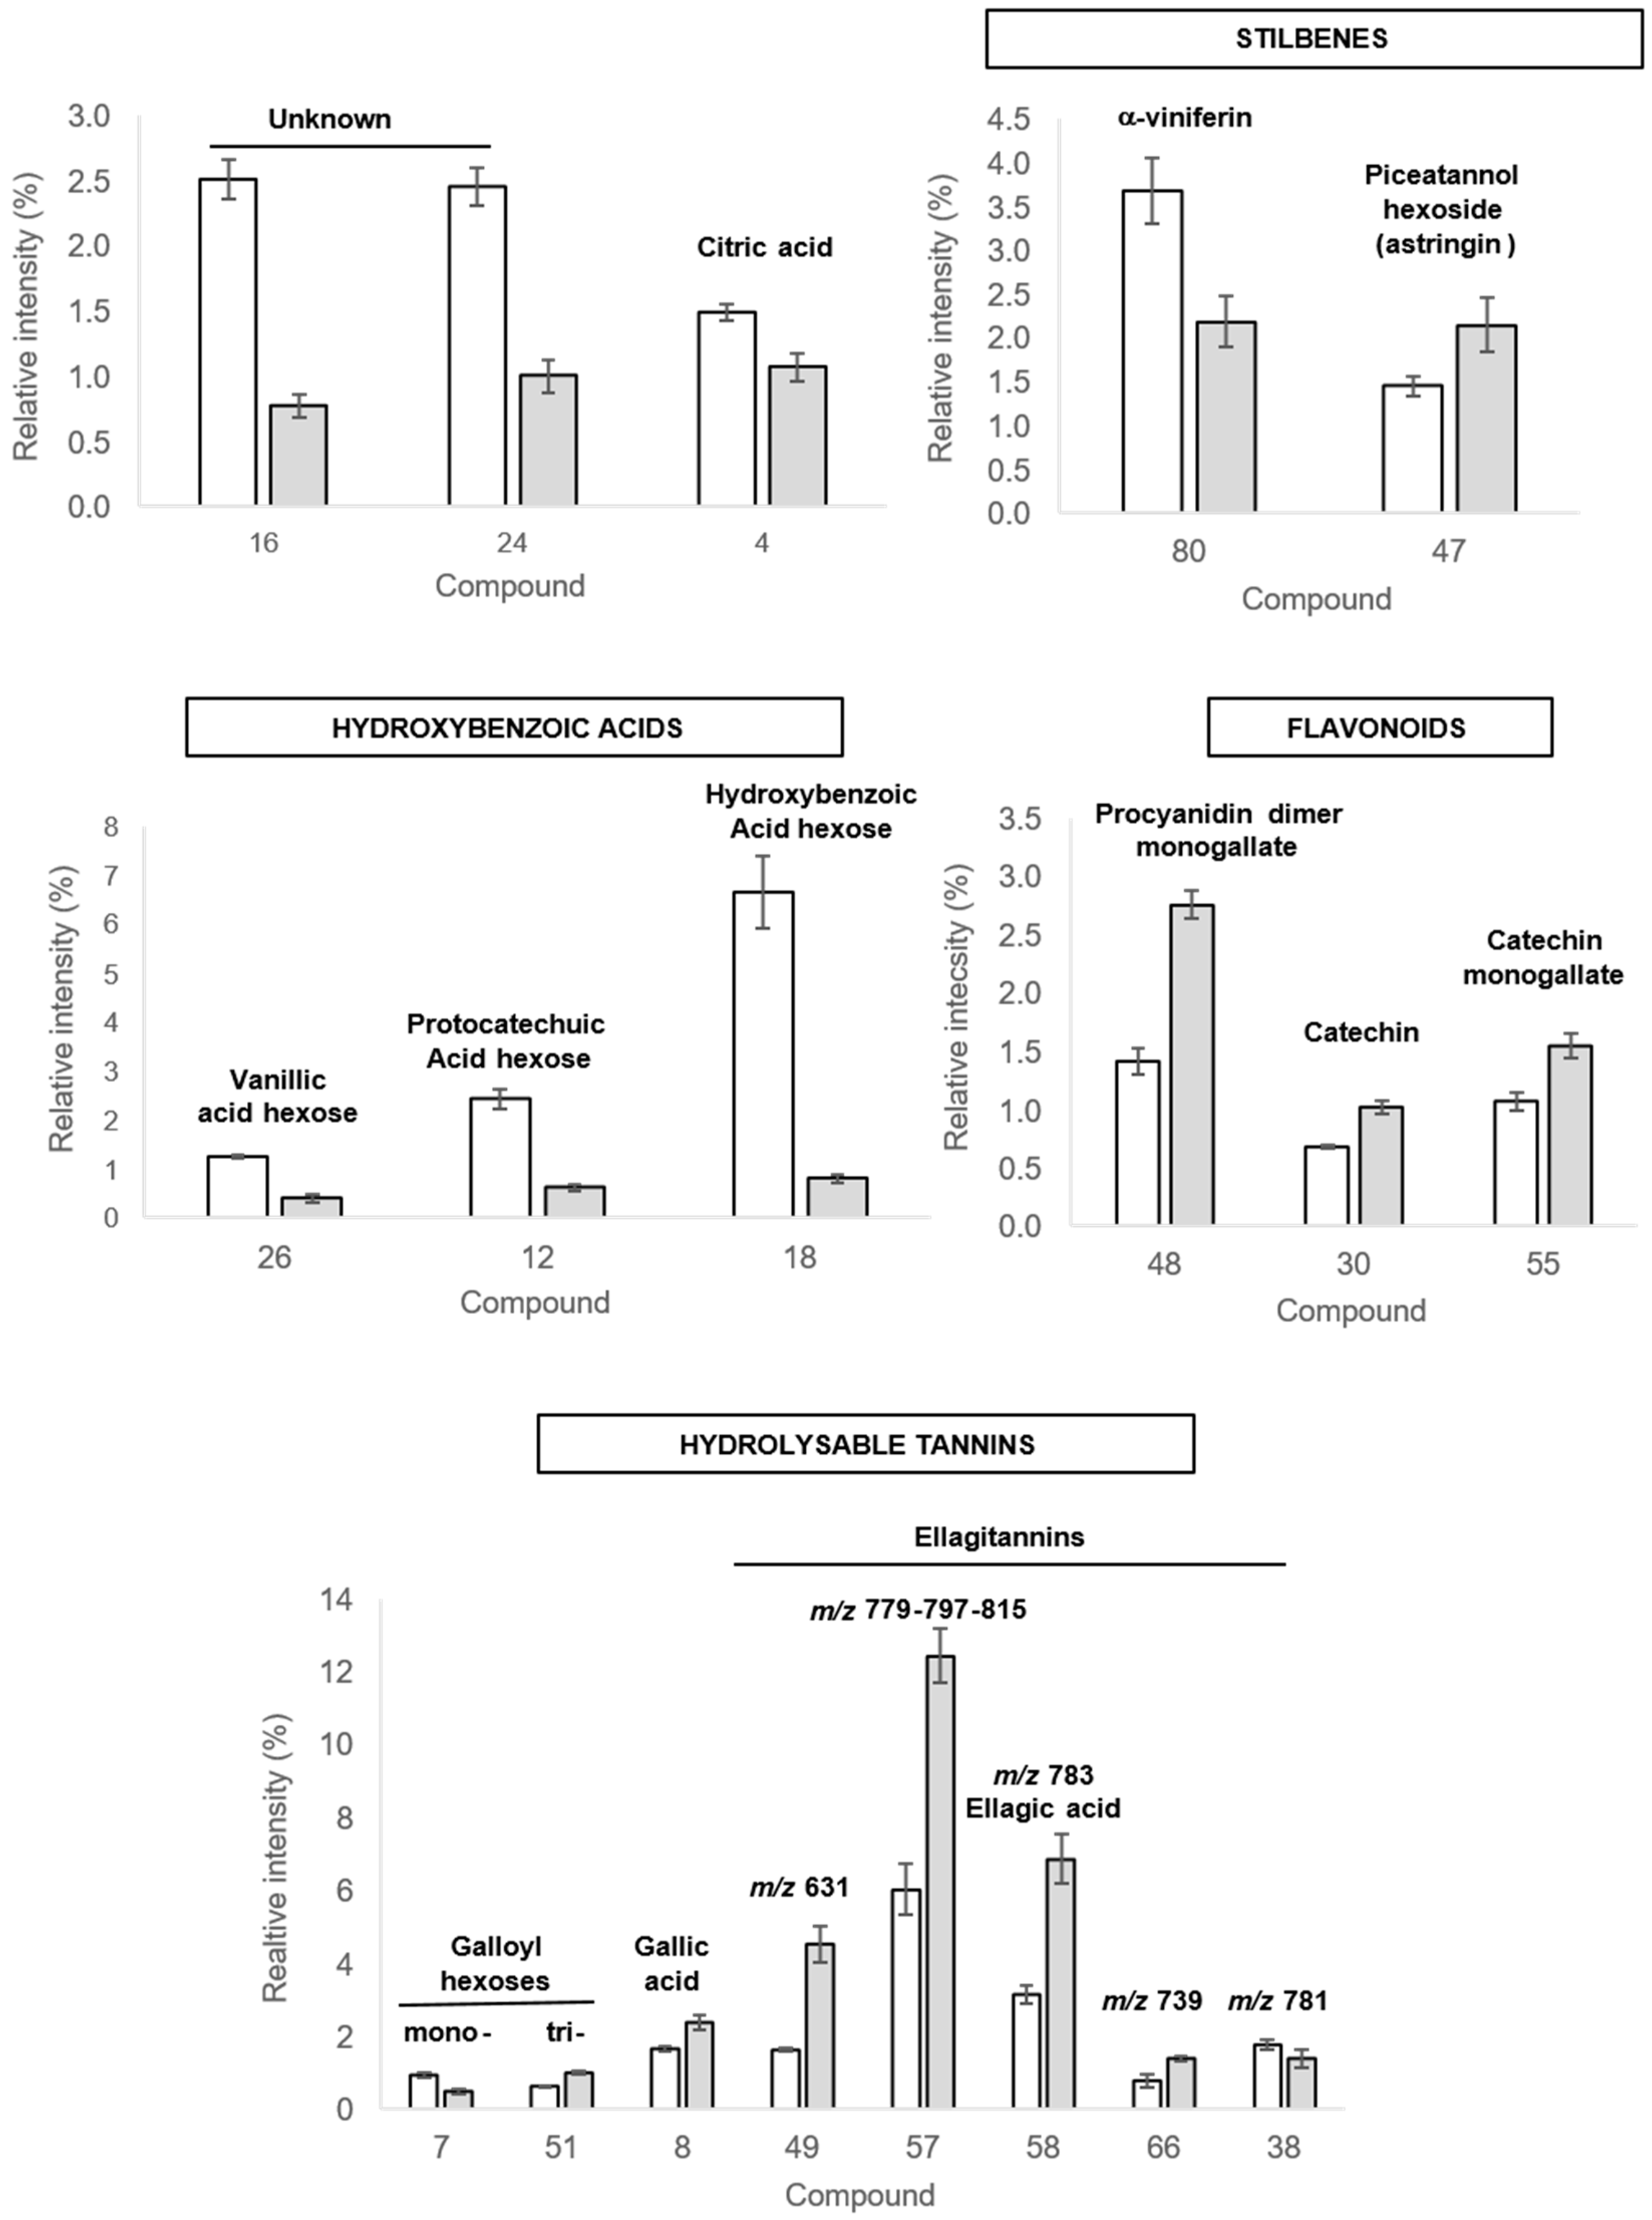
2.3. Phenolics Profiles in Response to P. phytofirmans PsJN
2.3.1. Compounds Identification
2.3.2. Discriminant Compounds in Roots
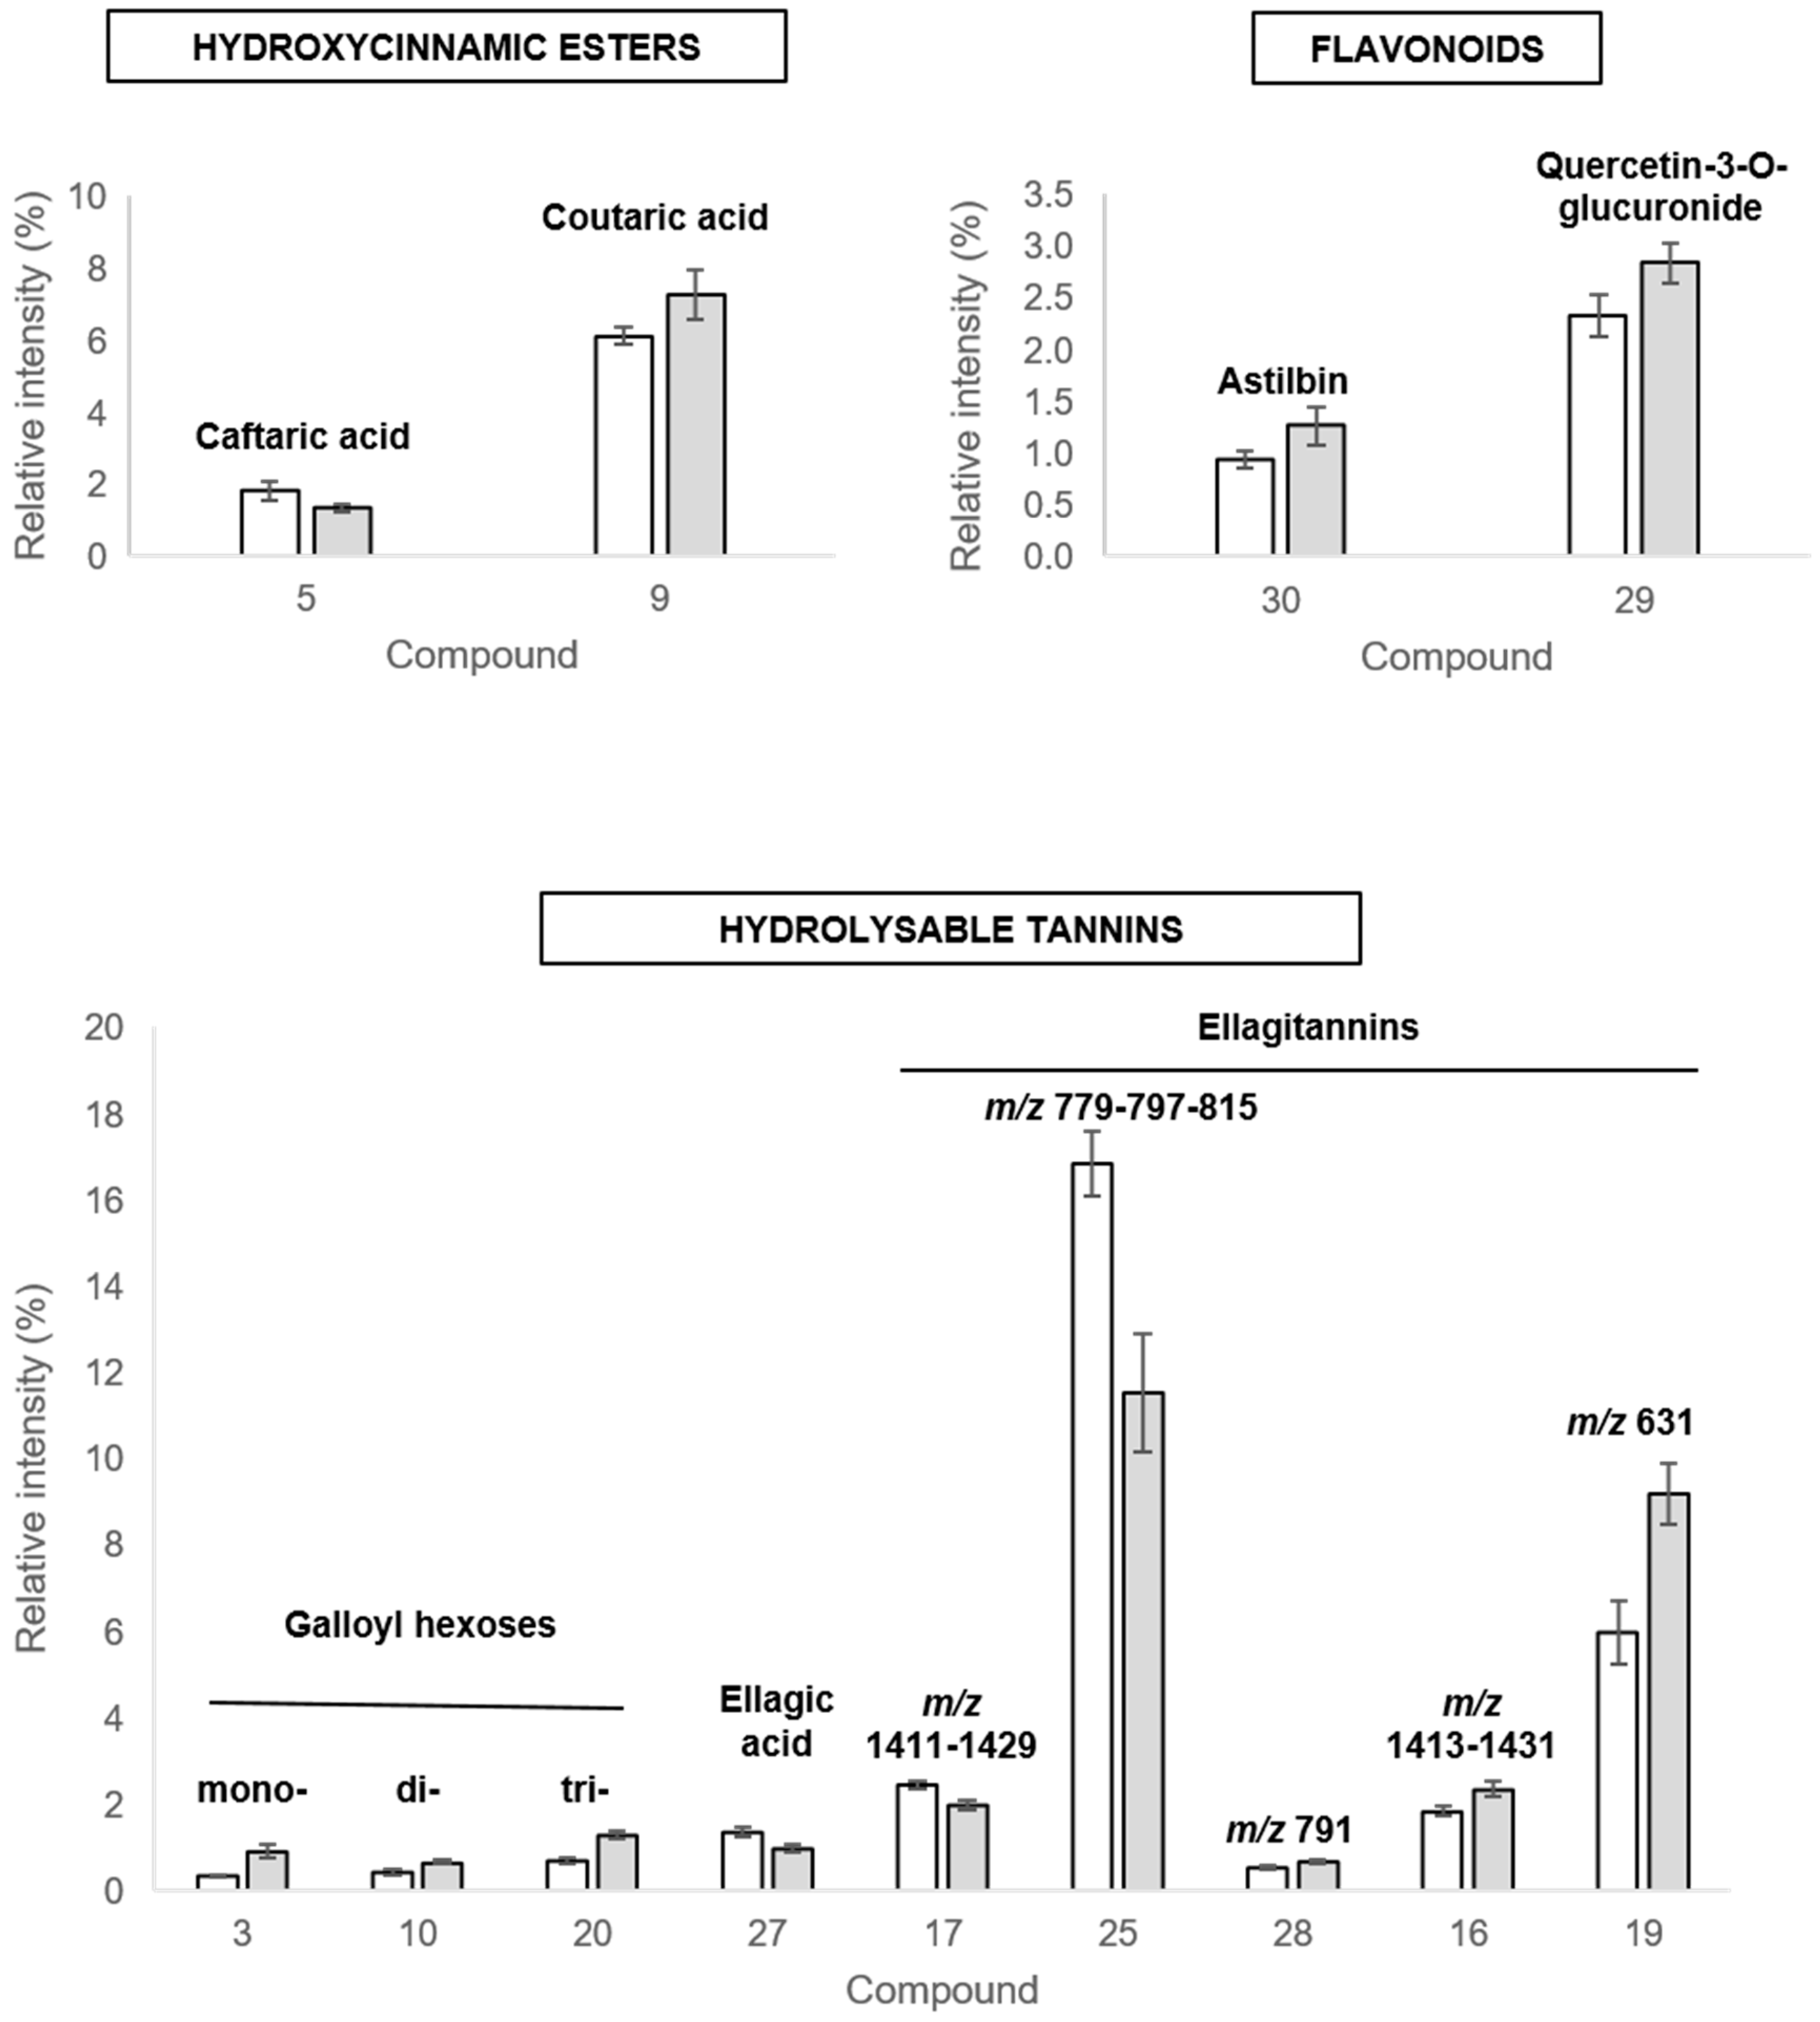
2.3.3. Discriminant Compounds in Leaves
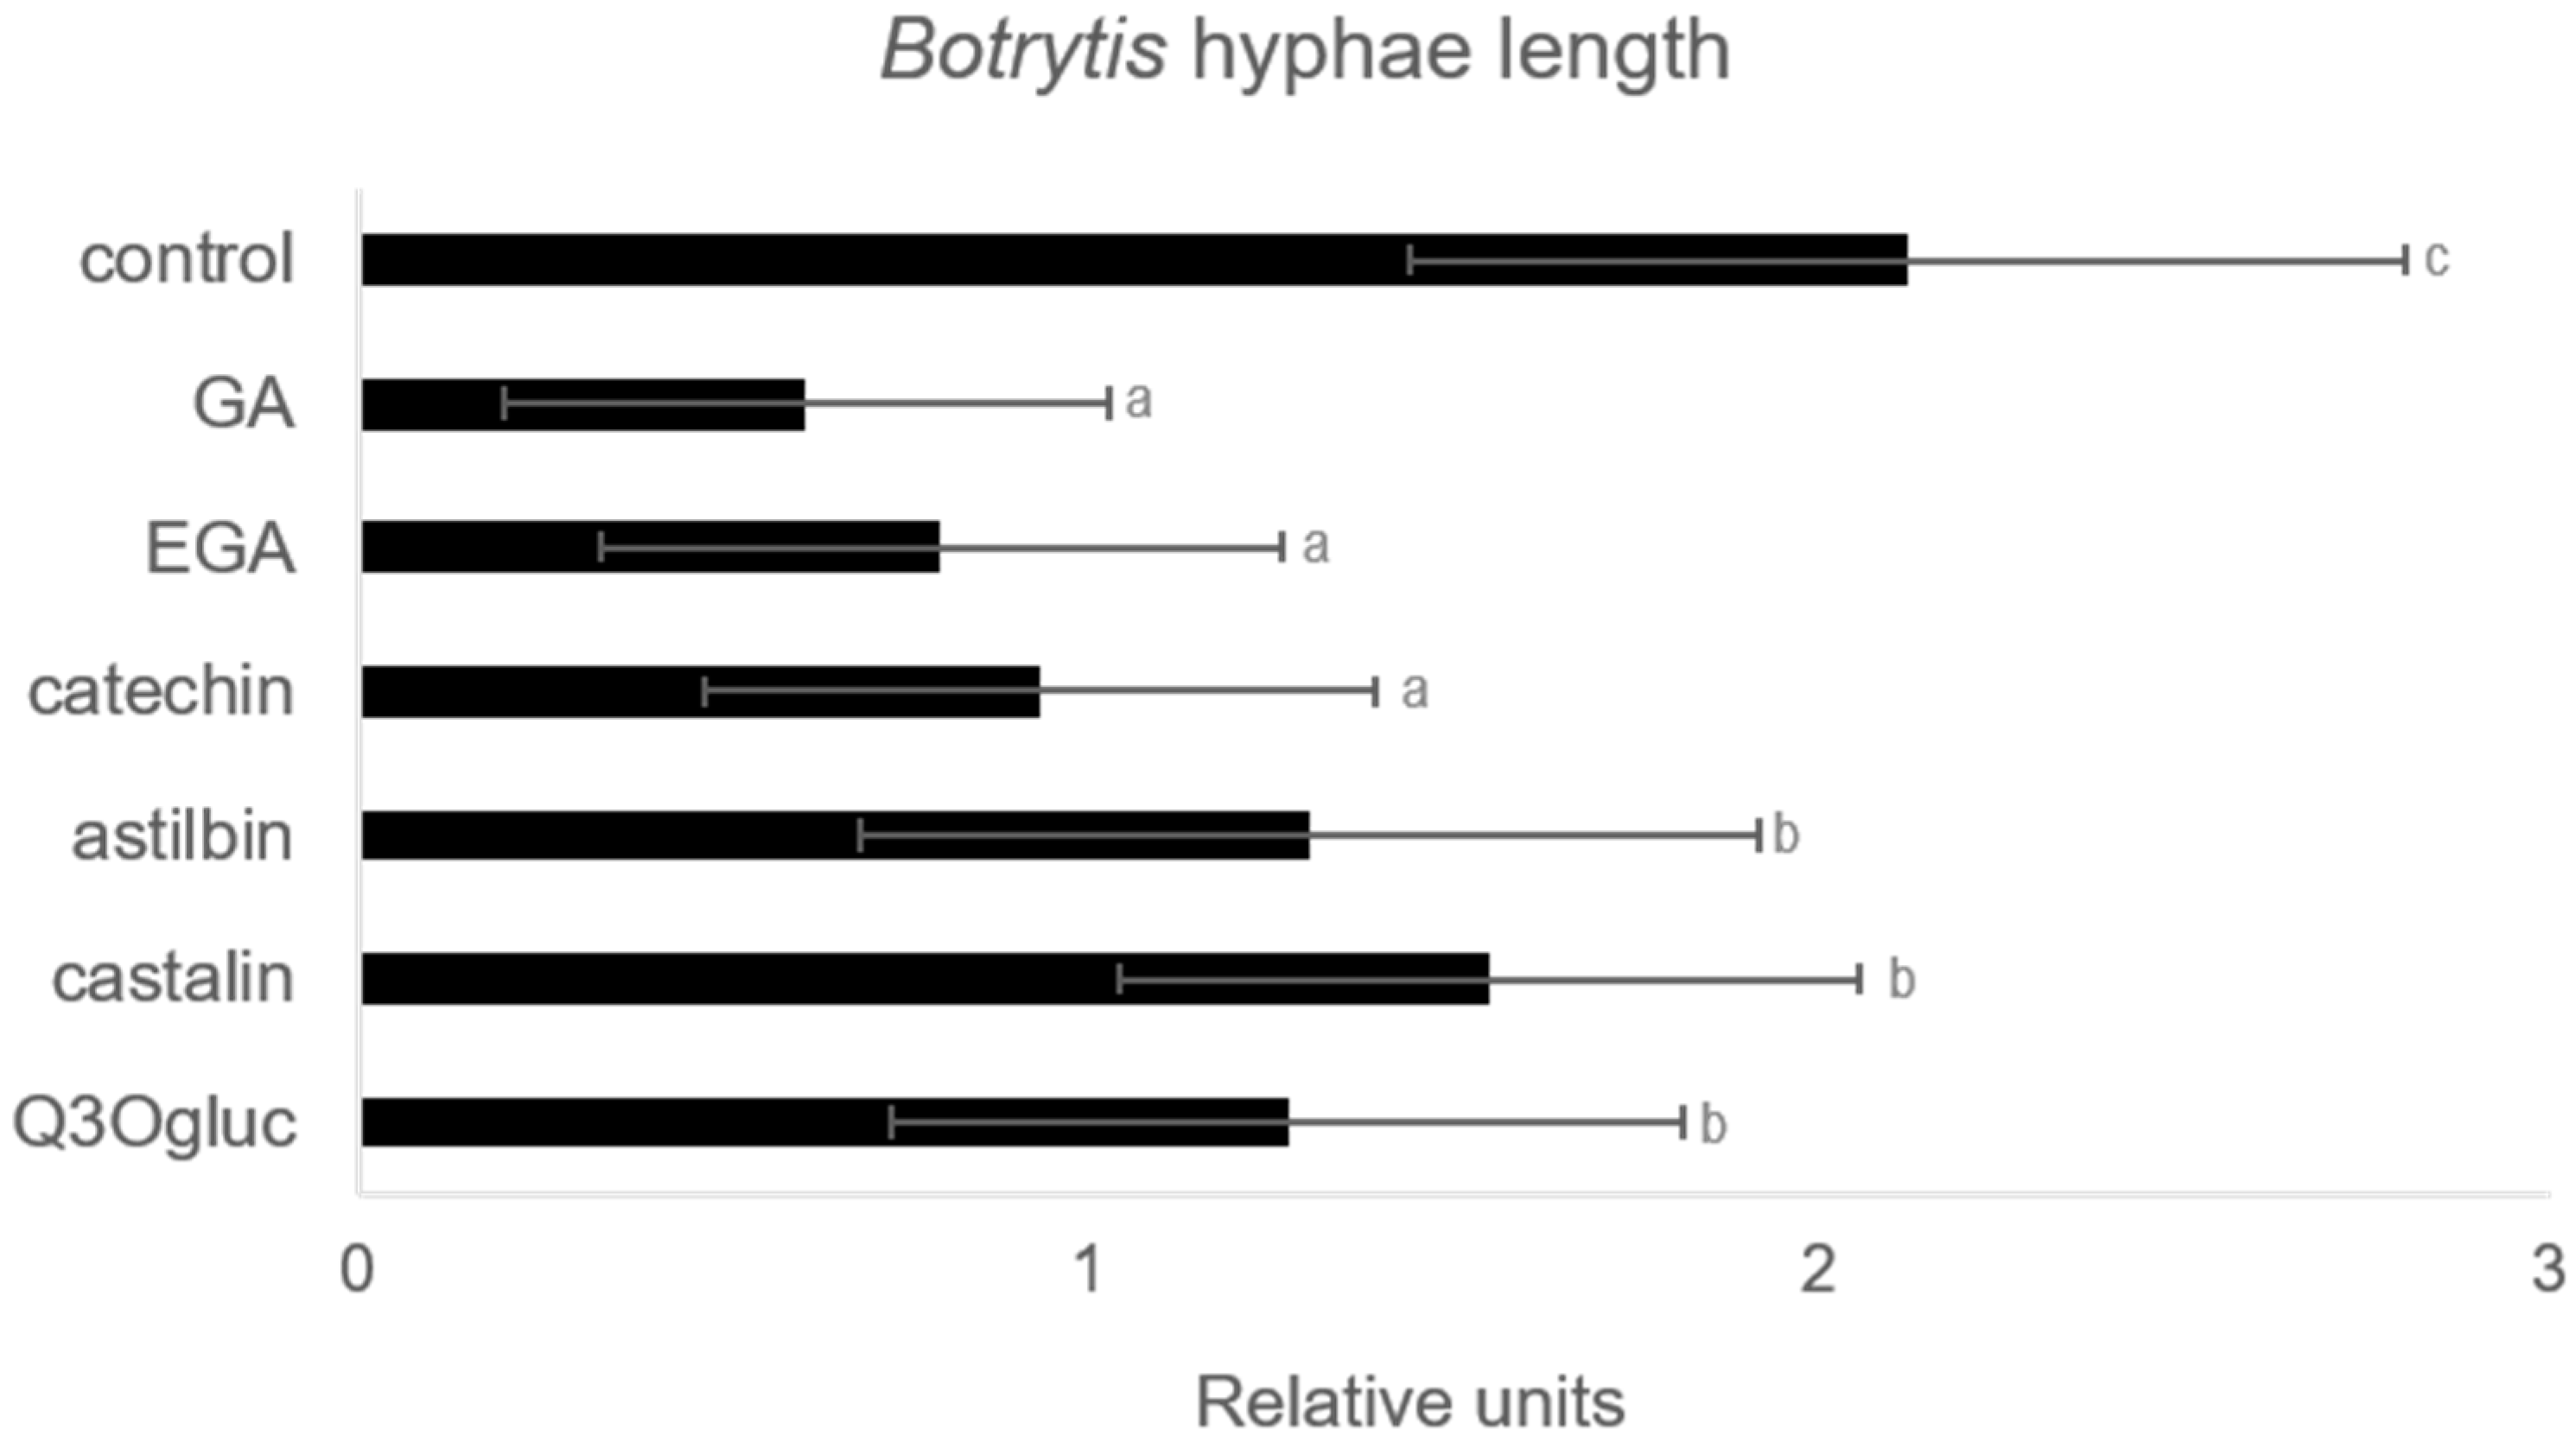
2.4. Effect of Some Accumulated Phenolic Compounds on Botrytis cinerea
3. Discussion
4. Material and Methods
4.1. Chemicals
4.2. Plant Material
4.3. Microorganisms
4.4. Inoculation of Vitroplantlets with P. phytofirmans Strain PsJN
4.5. Rhizoplane and Endophytic Colonization
4.6. RNA Extraction and Real-Time Quantitative RT-PCR
4.7. Extraction of Phenolic Compounds
4.8. Analyses by UHPLC-UV/DAD-MS ESI QTOF
4.9. Spore Germination Assay
4.10. Statistical Analysis
Supplementary Materials
Author Contributions
Acknowledgments
Conflicts of Interest
References
- Harborne, J.B.; Williams, C.A. Advances in flavonoid research since 1992. Phytochemistry 2000, 55, 481–504. [Google Scholar] [CrossRef]
- Bravo, L. Polyphenols: Chemistry, dietary sources, metabolism, and nutritional significance. Nut Rev. 1998, 56, 317–333. [Google Scholar] [CrossRef] [PubMed]
- Mellway, R.D.; Constabel, C.P. Metabolic engineering and potential functions of proanthocyanidins in poplar. Plant. Signal. Behav. 2009, 4, 790–792. [Google Scholar] [CrossRef] [PubMed]
- Latouche, G.; Bellow, S.; Poutaraud, A.; Meyer, S.; Cerovic, Z.G. Influence of constitutive phenolic compounds on the response of grapevine (Vitis vinifera L.) leaves to infection by Plasmopara Viticola. Planta 2013, 237, 351–361. [Google Scholar] [CrossRef]
- Caretto, S.; Linsalata, V.; Colella, G.; Mita, G.; Lattanzio, V. Carbon Fluxes between Primary Metabolism and Phenolic Pathway in Plant Tissues under Stress. Int. J. Mol. Sci. 2015, 16, 26378–26394. [Google Scholar] [CrossRef]
- Barbehenn, R.V.; Peter Constabel, C. Tannins in plant-herbivore interactions. Phytochemistry 2011, 72, 1551–1565. [Google Scholar] [CrossRef]
- Cheynier, V.; Comte, G.; Davies, K.M.; Lattanzio, V.; Martens, S. Plant phenolics: Recent advances on their biosynthesis, genetics, and ecophysiology. Plant. Physiol. Biochem. 2013, 72, 1–20. [Google Scholar] [CrossRef]
- Mandal, S.M.; Chakraborty, D.; Dey, S. Phenolic acids act as signaling molecules in plant-microbe symbioses. Plant. Signal. Behav. 2010, 5, 359–368. [Google Scholar] [CrossRef]
- Teixeira, A.; Eiras-Dias, J.; Castellarin, S.D.; Geros, H. Berry phenolics of grapevine under challenging environments. Int. J. Mol. Sci. 2013, 14, 18711–18739. [Google Scholar] [CrossRef]
- Krol, A.; Amarowicz, R.; Weidner, S. The effects of cold stress on the phenolic compounds and antioxidant capacity of grapevine (Vitis vinifera L.) leaves. J. Plant. Physiol. 2015, 189, 97–104. [Google Scholar] [CrossRef]
- Magnin-Robert, M.; Spagnolo, A.; Boulanger, A.; Joyeux, C.; Clément, C.; Abou-Mansour, E.; Fontaine, F. Changes in Plant Metabolism and Accumulation of Fungal Metabolites in Response to Esca Proper and Apoplexy Expression in the Whole Grapevine. Phytopathology 2016, 106, 541–553. [Google Scholar] [CrossRef] [PubMed]
- Garcia-Seco, D.; Zhang, Y.; Gutierrez-Manero, F.J.; Martin, C.; Ramos-Solano, B. Application of Pseudomonas fluorescens to Blackberry under Field Conditions Improves Fruit Quality by Modifying Flavonoid Metabolism. PLoS ONE 2015, 10, e0142639. [Google Scholar] [CrossRef] [PubMed]
- Singh, U.P.; Sarma, B.K.; Singh, D.P. Effect of plant growth-promoting rhizobacteria and culture filtrate of Sclerotium rolfsii on phenolic and salicylic acid contents in chickpea (Cicer arietinum). Curr. Microbiol. 2003, 46, 131–140. [Google Scholar] [CrossRef] [PubMed]
- Lavania, M.; Chauhan, P.S.; Chauhan, S.V.; Singh, H.B.; Nautiyal, C.S. Induction of plant defense enzymes and phenolics by treatment with plant growth-promoting rhizobacteria Serratia marcescens NBRI1213. Curr. Microbiol. 2006, 52, 363–368. [Google Scholar] [CrossRef] [PubMed]
- Ait Barka, E.; Nowak, J.; Clément, C. Enhancement of chilling resistance of inoculated grapevine plantlets with a plant growth-promoting rhizobacterium, Burkholderia phytofirmans strain PsJN. Appl. Environ. Microbiol. 2006, 72, 7246–7252. [Google Scholar] [CrossRef] [PubMed]
- Portu, J.; Gonzalez-Arenzana, L.; Hermosin-Gutierrez, I.; Santamaria, P.; Garde-Cerdan, T. Phenylalanine and urea foliar applications to grapevine: Effect on wine phenolic content. Food Chem. 2015, 180, 55–63. [Google Scholar] [CrossRef]
- Singh, A.; Jain, A.; Sarma, B.K.; Upadhyay, R.S.; Singh, H.B. Rhizosphere competent microbial consortium mediates rapid changes in phenolic profiles in chickpea during Sclerotium rolfsii infection. Microbiol. Res. 2014, 169, 353–360. [Google Scholar] [CrossRef]
- Vejan, P.; Abdullah, R.; Khadiran, T.; Ismail, S.; Nasrulhaq Boyce, A. Role of Plant Growth Promoting Rhizobacteria in Agricultural Sustainability—A Review. Molecules 2016, 21, 573. [Google Scholar] [CrossRef]
- Martin, C.; Zhang, Y.; Tonelli, C.; Petroni, K. Plants, diet, and health. Annu. Rev. Plant. Biol. 2013, 64, 19–46. [Google Scholar] [CrossRef]
- Girish, N.; Umesha, S. Effect of plant growth promoting rhizobacteria on bacterial canker of tomato. Arch. Phytopathol. Plant. Prot. 2007, 38, 235–243. [Google Scholar] [CrossRef]
- Gutierrez Mañero, F.J.; Ramos, B.; Lucas, J.A.; Probanza, A.; Barrientos, M.L. Systemic induction of terpenic compounds in D. Lanata. J. Plant. Physiol. 2003, 160, 105–130. [Google Scholar] [CrossRef] [PubMed]
- Zhang, S.; Reddy, M.S.; Kloepper, J.W. Tobacco growth enhance-ment and blue mold protection by rhizobacteria: Relationship between plant growth promotion and systemic disease protection by PGPR strain. Plant. Soil 2004, 262, 277–288. [Google Scholar] [CrossRef]
- Theocharis, A.; Bordiec, S.; Fernandez, O.; Paquis, S.; Dhondt-Cordelier, S.; Baillieul, F.; Clément, C.; Barka, E.A. Burkholderia phytofirmans PsJN primes Vitis vinifera L. and confers a better tolerance to low nonfreezing temperatures. Mol. Plant. Microbe 2012, 25, 241–249. [Google Scholar] [CrossRef] [PubMed]
- Fernandez, O.; Theocharis, A.; Bordiec, S.; Feil, R.; Jacquens, L.; Clément, C.; Fontaine, F.; Barka, E.A. Burkholderia phytofirmans PsJN acclimates grapevine to cold by modulating carbohydrate metabolism. Mol. Plant. Microbe 2012, 25, 496–504. [Google Scholar] [CrossRef] [PubMed]
- Miotto-Vilanova, L.; Jacquard, C.; Courteaux, B.; Wortham, L.; Michel, J.; Clément, C.; Ait Barka, E.; Sanchez, L. Burkholderia phytofirmans PsJN confers grapevine resistance against Botrytis cinerea via a direct antimicrobial effect combined with a better resource mobilization. Front. Plant. Sci. 2016, 7, 1236. [Google Scholar] [CrossRef] [PubMed]
- Issa, A.; Esmaeel, Q.; Sanchez, L.; Courteaux, B.; Gibon, Y.; Ballias, P.; Clément, C.; Jacquard, C.; Vaillant-Gaveau, N.; Aït Barka, E. Impact of Paraburkholderia phytofirmans strain PsJN on tomato (Lycopersicon esculentum L.) under high temperature. Front. Plant. Sci. 2018, 9, 1397. [Google Scholar] [CrossRef]
- Su, F.; Gilard, F.; Guérard, F.; Citerne, S.; Clément, C.; Vaillant-Gaveau, N.; Dhondt-Cordelier, S. Spatio-temporal Responses of Arabidopsis Leaves in Photosynthetic Performance and Metabolite Contents to Burkholderia phytofirmans PsJN. Front. Plant. Sci. 2016, 7, 403. [Google Scholar] [CrossRef]
- Fernandez, O.; Vandesteene, L.; Feil, R.; Baillieul, F.; Lunn, J.E.; Clément, C. Trehalose metabolism is activated upon chilling in grapevine and might participate in Burkholderia phytofirmans induced chilling tolerance. Planta 2012, 236, 355–369. [Google Scholar] [CrossRef]
- Valette, M.; Rey, M.; Gerin, F.; Comte, G.; Wisniewski-Dye, F. A common metabolomic signature is observed upon inoculation of rice roots with various rhizobacteria. J. Integr. Plant. Biol. 2019. [Google Scholar] [CrossRef]
- Vannozzi, A.; Dry, I.B.; Fasoli, M.; Zenoni, S.; Lucchin, M. Genome-wide analysis of the grapevine stilbene synthase multigenic family: Genomic organization and expression profiles upon biotic and abiotic stresses. BMC Plant Biol. 2012, 12, 130. [Google Scholar] [CrossRef]
- Nuengchamnong, N.; Ingkaninan, K. On-line characterization of phenolic antioxidants in fruit wines from family myrtaceae by liquid chromatography combined with electrospray ionization tandem mass spectrometry and radical scavenging detection. Food Sci. Technol. 2009, 42, 297–302. [Google Scholar] [CrossRef]
- Silva, F.L.D.N.; Schmidt, E.M.; Messias, C.L.; Eberlin, M.N. Quantitation of organic acids in wine and grapes by direct infusion electrospray ionization mass spectrometry. Anal. Methods UK 2014, 7, 53–62. [Google Scholar] [CrossRef] [Green Version]
- Souquet, J.M.; Labarbe, B.; Le Guerneve, C.; Cheynier, V.; Moutounet, M. Phenolic composition of grape stems. J. Agric. Food Chem. 2000, 48, 1076–1080. [Google Scholar] [CrossRef] [PubMed]
- Flamini, R. Recent applications of mass spectrometry in the study of grape and wine polyphenols. ISRN Spectrosc. 2013. [Google Scholar] [CrossRef]
- Khoza, B.S.; Gbashi, S.; Steenkamp, P.A.; Njobeh, P.B.; Madala, N.E. Identification of hydroxylcinnamoyl tartaric acid esters in Bidens pilosa by UPLC-tandem mass spectrometry. S. Afr. J. Bot. 2016, 103, 95–100. [Google Scholar] [CrossRef]
- Fang, N.; Yu, S.; Prior, R.L. LC/MS/MS characterization of phenolic constituents in dried plums. J. Agric. Food Chem. 2002, 50, 3579–3585. [Google Scholar] [CrossRef]
- Sanz, M.; de Simon, B.F.; Cadahia, E.; Esteruelas, E.; Munoz, A.M.; Hernandez, T.; Estrella, I.; Pinto, E. LC-DAD/ESI-MS/MS study of phenolic compounds in ash (Fraxinus excelsior L. and F. americana L.) heartwood. Effect of toasting intensity at cooperage. J. Mass Spectrom. 2012, 47, 905–918. [Google Scholar] [CrossRef]
- Abu-Reidah, I.M.; Ali-Shtayeh, M.S.; Jamous, R.M.; Arraez-Roman, D.; Segura-Carretero, A. HPLC-DAD-ESI-MS/MS screening of bioactive components from Rhus coriaria L. (Sumac) fruits. Food Chem. 2015, 166, 179–191. [Google Scholar] [CrossRef] [Green Version]
- Mena, P.; Calani, L.; Dall’Asta, C.; Galaverna, G.; Garcia-Viguera, C.; Bruni, R.; Crozier, A.; Del Rio, D. Rapid and comprehensive evaluation of (poly)phenolic compounds in pomegranate (Punica granatum L.) juice by UHPLC-MSn. Molecules 2012, 17, 14821–14840. [Google Scholar] [CrossRef] [Green Version]
- Aaby, K.; Ekeberg, D.; Skrede, G. Characterization of phenolic compounds in strawberry (Fragaria x ananassa) fruits by different HPLC detectors and contribution of individual compounds to total antioxidant capacity. J. Agric. Food Chem. 2007, 55, 4395–4406. [Google Scholar] [CrossRef]
- Zhao, M.; Xu, J.; Qian, D.; Guo, J.; Jiang, S.; Shang, E.X.; Duan, J.A. Identification of astilbin metabolites produced by human intestinal bacteria using UPLC-Q-TOF/MS. Biomed. Chromatogr. 2014, 28, 1024–1029. [Google Scholar] [CrossRef] [PubMed]
- Billet, K.; Houille, B.; Duge de Bernonville, T.; Besseau, S.; Oudin, A.; Courdavault, V.; Delanoue, G.; Guerin, L.; Clastre, M.; Giglioli-Guivarc’h, N.; et al. Field-Based Metabolomics of Vitis vinifera L. Stems Provides New Insights for Genotype Discrimination and Polyphenol Metabolism Structuring. Front. Plant. Sci. 2018, 9, 798. [Google Scholar] [CrossRef] [PubMed]
- Li, X.; Zhang, Y.; Zeng, X.; Yang, L.; Deng, Y. Chemical profiling of bioactive constituents in Sarcandra glabra and its preparations using ultra-high-pressure liquid chromatography coupled with LTQ Orbitrap mass spectrometry. Rapid Commun. Mass Spectrom. 2011, 25, 2439–2447. [Google Scholar] [CrossRef] [PubMed]
- Cantwell, M.I.; Peiser, G.; Mercado-Silva, E. Induction of chilling injury in jicama (Pachyrhizus erosus) roots: Changes in texture, color and phenolics. Postharvest Biol. Technol. 2002, 25, 311–320. [Google Scholar] [CrossRef] [Green Version]
- Rockenbach, I.I.; Jungfer, E.; Ritter, C.; Santiago-Schübel, B.; Thiele, B.; Fett, R.; Galenza, R. Characterization of flavan-3-ols in seeds of grape pomace by CE, HPLC-DAD-MSn and LC-ESI-FTICR-MS. Food Res. Int. 2012, 48, 848–855. [Google Scholar] [CrossRef] [Green Version]
- Sandhu, A.K.; Gu, L. Antioxidant capacity, phenolic content, and profiling of phenolic compounds in the seeds, skin, and pulp of Vitis rotundifolia (Muscadine Grapes) As determined by HPLC-DAD-ESI-MS(n). J. Agric. Food Chem. 2010, 58, 4681–4692. [Google Scholar] [CrossRef] [PubMed]
- Montero, L.; Herrero, M.; Prodanov, M.; Ibanez, E.; Cifuentes, A. Characterization of grape seed procyanidins by comprehensive two-dimensional hydrophilic interaction x reversed phase liquid chromatography coupled to diode array detection and tandem mass spectrometry. Anal. Bioanal. Chem. 2013, 405, 4627–4638. [Google Scholar] [CrossRef] [Green Version]
- Nawrot-Hadzik, I.; Slusarczyk, S.; Granica, S.; Hadzik, J.; Matkowski, A. Phytochemical Diversity in Rhizomes of Three Reynoutria Species and their Antioxidant Activity Correlations Elucidated by LC-ESI-MS/MS Analysis. Molecules 2019, 24, 1136. [Google Scholar] [CrossRef] [Green Version]
- Bavaresco, L.; Fregoni, M.; Trevisan, M.; Mattivi, F.; Vrhovsek, U.; Falchetti, R. The occurrence of the stilbene piceatannol in grapes. Vitis 2002, 41, 133–136. [Google Scholar]
- Rodriguez-Cabo, T.; Rodriguez, I.; Lopez, P.; Ramil, M.; Cela, R. Investigation of liquid chromatography quadrupole time-of-flight mass spectrometry performance for identification and determination of hydroxylated stilbene antioxidants in wine. J. Chromatogr. 2014, 1337, 162–170. [Google Scholar] [CrossRef]
- Flamini, R.; Zanzotto, A.; de Rosso, M.; Lucchetta, G.; Vedova, A.D.; Bavaresco, L. Stilbene oligomer phytoalexins in grape as a response to Aspergillus carbonarius infection. Physiol. Mol. Plant. Pathol. 2016, 93, 112–118. [Google Scholar] [CrossRef]
- Tavares, I.M.C.; Silva Lago-Vanzela, E.; Portugal Gomes Rebello, L.; Mota Ramos, A.; Gómez-Alonso, S.; García-Romero, E.; Da-Silva, R.; Hermosín-Gutiérrez, I. Comprehensive study of the phenolic composition of the edible parts of jambolan fruit (Syzygium cumini (L.) Skeels). Food Res. Int. 2016, 82, 1–13. [Google Scholar] [CrossRef] [Green Version]
- Romani, A.; Campo, M.; Pinelli, P. HPLC/DAD/ESI-MS analyses and anti-radical activity of hydrolyzable tannins from different vegetal species. Food Chem. 2012, 130, 214–221. [Google Scholar] [CrossRef]
- Dorta, E.; González, M.; Lobo, M.G.; Sánchez-Moreno, C.; de Ancos, B. Screening of phenolic compounds in by-product extracts from mangoes (Mangifera indica L.) by HPLC-ESI-QTOF-MS and multivariate analysis for use as a food ingredient. Food Res. Int. 2014, 57, 51–60. [Google Scholar] [CrossRef] [Green Version]
- Gu, D.; Yang, Y.; Bakri, M.; Chen, Q.; Xin, X.; Aisa, H.A. A LC/QTOF-MS/MS application to investigate chemical compositions in a fraction with protein tyrosine phosphatase 1B inhibitory activity from Rosa rugosa flowers. Phytochem. Anal. 2013, 24, 661–670. [Google Scholar] [CrossRef] [PubMed]
- Chamam, A.; Sanguin, H.; Bellvert, F.; Meiffren, G.; Comte, G.; Wisniewski-Dye, F.; Bertrand, C.; Prigent-Combaret, C. Plant secondary metabolite profiling evidences strain-dependent effect in the Azospirillum-Oryza sativa association. Phytochemistry 2013, 87, 65–77. [Google Scholar] [CrossRef] [PubMed]
- Gupta, R.; Tiwari, S.; Saikia, S.K.; Shukla, V.; Singh, R.; Singh, S.P.; Kumar, P.V.; Pandey, R. Exploitation of microbes for enhancing bacoside content and reduction of Meloidogyne incognita infestation in bacopa monnieri L. Protoplasma 2015, 252, 53–61. [Google Scholar] [CrossRef]
- Le Roy, J.; Huss, B.; Creach, A.; Hawkins, S.; Neutelings, G. Glycosylation Is a Major Regulator of Phenylpropanoid Availability and Biological Activity in Plants. Front. Plant. Sci. 2016, 7, 735. [Google Scholar] [CrossRef] [Green Version]
- Sanchez-Maldonado, A.F.; Schieber, A.; Ganzle, M.G. Structure-function relationships of the antibacterial activity of phenolic acids and their metabolism by lactic acid bacteria. J. Appl. Microbiol. 2011, 111, 1176–1184. [Google Scholar] [CrossRef]
- Bernal-Mercado, A.T.; Vazquez-Armenta, F.J.; Tapia-Rodriguez, M.R.; Islas-Osuna, M.A.; Mata-Haro, V.; Gonzalez-Aguilar, G.A.; Lopez-Zavala, A.A.; Ayala-Zavala, J.F. Comparison of Single and Combined Use of Catechin, Protocatechuic, and Vanillic Acids as Antioxidant and Antibacterial Agents against Uropathogenic Escherichia Coli at Planktonic and Biofilm Levels. Molecules 2018, 23, 2813. [Google Scholar] [CrossRef] [Green Version]
- Landete, J.M. Ellagitannins, ellagic acid and their derived metabolites: A review about source, metabolism, functions and health. Food Res. Int. 2011, 44, 1150–1160. [Google Scholar] [CrossRef]
- Bézier, A.; Lambert, B.; Baillieul, F. Study of defense-related gene expression in grapevine leaves and berries Infected with Botrytis cinerea. Eur. J. Plant. Pathol. 2002, 108, 111–120. [Google Scholar] [CrossRef]
- Mutawila, C.; Stander, C.; Halleen, F.; Vivier, M.A.; Mostert, L. Response of Vitis vinifera cell cultures to Eutypa lata and Trichoderma atroviride culture filtrates: Expression of defence-related genes and phenotypes. Protoplasma 2017, 254, 863–879. [Google Scholar] [CrossRef] [PubMed]
- Dufour, M.C.; Magnin, N.; Dumas, B.; Vergnes, S.; Corio-Costet, M.F. High-throughput gene-expression quantification of grapevine defense responses in the field using microfluidic dynamic arrays. BMC Genom. 2016, 17, 957. [Google Scholar] [CrossRef] [Green Version]
- Nopo-Olazabal, C.; Condori, J.; Nopo-Olazabal, L.; Medina-Bolivar, F. Differential induction of antioxidant stilbenoids in hairy roots of Vitis rotundifolia treated with methyl jasmonate and hydrogen peroxide. Plant Physiol. Biochem. 2014, 74, 50–69. [Google Scholar] [CrossRef]
- Kortekamp, A. Expression analysis of defence-related genes in grapevine leaves after inoculation with a host and a non-host pathogen. Plant Physiol. Biochem. 2006, 44, 58–67. [Google Scholar] [CrossRef]
- Akinwumi, B.C.; Bordun, K.M.; Anderson, H.D. Biological Activities of Stilbenoids. Int. J. Mol. Sci. 2018, 19, 792. [Google Scholar] [CrossRef] [Green Version]
- Murias, M.; Jager, W.; Handler, N.; Erker, T.; Horvath, Z.; Szekeres, T.; Nohl, H.; Gille, L. Antioxidant, prooxidant and cytotoxic activity of hydroxylated resveratrol analogues: Structure-activity relationship. Biochem. Pharm. 2005, 69, 903–912. [Google Scholar] [CrossRef]
- Ovesna, Z.; Kozics, K.; Bader, Y.; Saiko, P.; Handler, N.; Erker, T.; Szekeres, T. Antioxidant activity of resveratrol, piceatannol and 3,3′,4,4′,5,5′-hexahydroxy-trans-stilbene in three leukemia cell lines. Oncol. Rep. 2006, 16, 617–624. [Google Scholar] [CrossRef] [Green Version]
- Temsamani, H.; Krisa, S.; Decossas-Mendoza, M.; Lambert, O.; Merillon, J.M.; Richard, T. Piceatannol and Other Wine Stilbenes: A Pool of Inhibitors against alpha-Synuclein Aggregation and Cytotoxicity. Nutrients 2016, 8, 367. [Google Scholar] [CrossRef] [Green Version]
- Cantos, E.; Espin, J.C.; Tomas-Barbera, F.A. Varietal differences among the polyphenol profiles of seven table grape cultivars studied by LC-DAD-MS-MS. J. Agric. Food Chem. 2002, 50, 5691–5696. [Google Scholar] [CrossRef] [PubMed]
- Xia, E.Q.; Deng, G.F.; Guo, Y.J.; Li, H.B. Biological activities of polyphenols from grapes. Int. J. Mol. Sci. 2010, 11, 622–646. [Google Scholar] [CrossRef] [PubMed]
- Armero, J.; Requejo, R.; Jorrin, J.; Lopez-Valbuena, R.; Tena, M. Release of phytoalexins and related iso-flavonoids from intact chickpea seedlings elicited withreduced glutathione at root level. Plant Physiol. Biochem. 2001, 39, 785–795. [Google Scholar] [CrossRef]
- Weston, L.A.; Mathesius, U. Flavonoids: Their structure, biosynthesis and role in the rhizosphere, including allelopathy. J. Chem. Ecol. 2013, 39, 283–297. [Google Scholar] [CrossRef] [PubMed]
- Hassan, S.; Mathesius, U. The role of flavonoids in root-rhizosphere signalling: Opportunities and challenges for improving plant-microbe interactions. J. Exp. Bot. 2012, 63, 3429–3444. [Google Scholar] [CrossRef] [Green Version]
- Yilmaz, Y.; Toledo, R.T. Major flavonoids in grape seeds and skins: Antioxidant capacity of catechin, epicatechin, and gallic acid. J. Agric. Food Chem. 2004, 52, 255–260. [Google Scholar] [CrossRef]
- Ursini, F.; Rapuzzi, I.; Toniolo, R.; Tubaro, F.; Bontempelli, G. Characterization of antioxidant effect of procyanidins. Methods Enzym. 2001, 335, 338–350. [Google Scholar] [CrossRef]
- Larrosa, M.; Garcia-Conesa, M.T.; Espin, J.C.; Tomas-Barberan, F.A. Ellagitannins, ellagic acid and vascular health. Mol. Asp. Med. 2010, 31, 513–539. [Google Scholar] [CrossRef]
- Braicu, C.; Pilecki, V.; Balacescu, O.; Irimie, A.; Neagoe, I.B. The relationships between biological activities and structure of flavan-3-ols. Int. J. Mol. Sci. 2011, 12, 9342–9353. [Google Scholar] [CrossRef] [Green Version]
- Doshi, P.; Adsule, P.; Banerjee, K. Phenolic composition and antioxidant activity in grapevine parts and berries (Vitis vinifera L.) cv. Kishmish Chornyi (Sharad Seedless) during maturation. Int. J. Food Sci. 2006, 41, 1–9. [Google Scholar] [CrossRef]
- Dietrich, H.; Pour-Nikfardjam, M.S. Influence of Phenolic Compounds and Tannins on Wine-Related Microorganisms. In Biology of Microorganisms on Grapes, in Must and in Wine; König, H., Unden, G., Fröhlich, J., Eds.; Springer: Berlin/Heidelberg, Germany, 2009; pp. 307–347. [Google Scholar]
- Irani, N.G.; Grotewold, E. Light-induced morphological alteration in anthocyanin-accumulating vacuoles of maize cells. BMC Plant Biol. 2005, 5, 7. [Google Scholar] [CrossRef] [PubMed] [Green Version]
- Fontes, N.; Geros, H.; Delrot, S. Grape Berry Vacuole: A Complex and Heterogeneous Membrane System Specialized in the Accumulation of Solutes. Am. J. Enol. Vitic. 2011, 62, 270–278. [Google Scholar] [CrossRef] [Green Version]
- Shih, C.H.; Siu, S.O.; Ng, R.; Wong, E.; Chiu, L.C.; Chu, I.K.; Lo, C. Quantitative analysis of anticancer 3-deoxyanthocyanidins in infected sorghum seedlings. J. Agric. Food Chem. 2007, 55, 254–259. [Google Scholar] [CrossRef] [PubMed]
- Shih, P.H.; Yeh, C.T.; Yen, G.C. Anthocyanins induce the activation of phase II enzymes through the antioxidant response element pathway against oxidative stress-induced apoptosis. J. Agric. Food Chem. 2007, 55, 9427–9435. [Google Scholar] [CrossRef] [PubMed]
- Bassolino, L.; Zhang, Y.; Schoonbeek, H.J.; Kiferle, C.; Perata, P.; Martin, C. Accumulation of anthocyanins in tomato skin extends shelf life. New Phytol. 2013, 200, 650–655. [Google Scholar] [CrossRef] [Green Version]
- Zhang, Y.; Butelli, E.; De Stefano, R.; Schoonbeek, H.J.; Magusin, A.; Pagliarani, C.; Wellner, N.; Hill, L.; Orzaez, D.; Granell, A.; et al. Anthocyanins double the shelf life of tomatoes by delaying overripening and reducing susceptibility to gray mold. Curr. Biol. 2013, 23, 1094–1100. [Google Scholar] [CrossRef] [Green Version]
- Goetz, G.; Fkyerat, A.; Metais, N.; Kunz, M.; Tabacchi, R.; Pezet, R.; Pont, V. Resistance factors to grey mould in grape berries: Identification of some phenolics inhibitors of Botrytis cinerea stilbene oxidase. Phytochemistry 1999, 52, 759–767. [Google Scholar] [CrossRef]
- King, E.O.; Ward, M.K.; Raney, D.E. Two simple media for the demonstration of pyocyanin and fluorescin. J. Lab. Clin. Med. 1954, 44, 301–307. [Google Scholar]


| Peaks | Rt (min) | λmax (nm) | UHPLC-MS QTOF Analysis | UHPLC-MS/MS QTOF Analysis | Compound Annotation | References | ||||||
|---|---|---|---|---|---|---|---|---|---|---|---|---|
| Ionization Mode | Observed Ions (m/z) | Ionic Species | Ion Formula | ∆ppm | Collision Energy (V) | Precursor Ion (m/z) | Main Product Ions m/z (% Base Peak) | |||||
| R4 | 0.96 | / | - | 191.0191 | [M-H]− | C6H7O7 | −3.3 | 10 | 191 | 173(2) 129(5) 111(100) | Citric acid * | [31,32] |
| - | 405.0285 | [2M+Na-2H]− | C12H14O14Na | −0.4 | 20 | 405 | 191(97) 173(9) 129(4) 111(100) | |||||
| R7 | 1.30 | 222 276 | - | 331.0665 | [M-H]− | C13H15O10 | −1.7 | 20 | 331 | 331(23) 271(16) 211(32) 169(100) 151(36) 125 (22) 123(35) | Galloyl-hexose | [38,54] |
| R8 | 1.44 | 222 274 | - | 169.0136 | [M-H]− | C7H5O5 | −3.8 | 20 | 169 | 125(100) | Gallic acid * | [55] |
| R12 | 2.24 | 264 294 | - | 315.0718 | [M-H]− | C13H15O9 | −1.1 | 20 | 315 | 315(5) 255(7) 195(27) 153(100) 109(32) | Protocatechuic acid hexose | [36,38] |
| + | 339.0695 | [M+Na]+ | C13H16O9Na | 2.5 | ||||||||
| R16 | 2.88 | 226 278 | - | 335.0975 | [M-H]− | C13H19O10 | −2.6 | 10 | 335 | 335(44) 289(100) 161(38) | Unknown | |
| R18 | 3.26 | 262 | - | 299.0769 | [M-H]− | C13H15O8 | −1.1 | 20 | 299 | 299(5) 239(9) 179(47) 151(14) 137(100) 119(14) 113(18) 101(21) | Hydroxybenzoic acid hexose | [36,40] |
| + | 323.0743 | [M+Na]+ | C13H16O8Na | 1.7 | 20 | 323 | 323(27) 185(100) 161(19) | |||||
| + | 623.1591 | [2M+Na]+ | C26H32O16Na | 1.4 | 30 | 623 | 323(100) 185(43) 161(6) | |||||
| R24 | 3.83 | 225sh 254 308sh | - | 497.0589 | [M-H]− | C20H17O15 | 3.2 | 10 | 497 | 497(40) 479(74) 453(100) 393(33) 298(25) 291(49) 273(32) 247(95) | Unknown | |
| R26 | 4.46 | 224 266 294 | - | 329.0867 | [M-H]− | C14H17O9 | −3.4 | 30 | 329 | 209(25) 167(57) 152(39) 123(100) 122(49) 108(51) 101(38) | Vanillic acid hexose | [36,37,39] |
| + | 353.0836 | [M+Na]+ | C14H18O9Na | −2.0 | 20 | 353 | 353(32) 193(31) 191(14) 185(100) | |||||
| + | 683.1807 | [2M+Na]+ | C28H36O18Na | 1.9 | 40 | 683 | 353(86) 191(15) 185(100) | |||||
| R30 | 5.11 | 226 276 | - | 289.0716 | [M-H]− | C15H13O6 | −0.6 | 10 | 289 | 289(100) 245(34) 205(11) 203(10) 179(9) 125(10) 109(9) | Catechin * | [44,45] |
| R38 | 6.87 | 224 268 | - | 781.0533 | [M-H]− | C34H22O22 | 0.4 | 30 | 781 | 763(38) 745(64) 735(15) 461(14) 300.99(100) 299(88) 273(29) 229(23) | Ellagitannin m/z 781 | |
| R47 | 8.49 | 224 302 322 | - | 405.1193 | [M-H]− | C20H21O9 | 0.5 | 40 | 405 | 243(100) 241(23) 225(10) 201(52) 199(11) 175(15) 173(14) 159(54) | Piceatannol hexoside (astringin) | [49,50] |
| R48 | 8.62 | 226 273 | - | 729.1455 | [M-H]− | C37H29O16 | −0.8 | 20 | 729 | 729(57) 603(19) 577(29) 451(19) 441(28) 407(100) 289(50) 169(15) 125(23) | Procyanidin dimer monogallate | [45,47] |
| + | 731.1614 | [M+H]+ | C37H31O16 | 1.0 | 20 | 731 | 731(10) 563(16) 443(28) 427(39) 409(79) 301(40) 290(19) 289(64) 287(28) 275(32) 273(40) 271(43) 259(19) 247(56) 163(36) 151(18) 139(23) 127(98) 123(100) | |||||
| - | 705.0508 | [M1-2H]2− | C54H42O45 | 0.5 | 20 | 705 | 705(91) 673(100) 300.99(67) | Ellagitannin m/z 1411 | ||||
| - | 1411.1077 | [M1-H]− | C54H43O45 | −0.3 | 40 | 705 | 300.99(100) | |||||
| - | 714.0512 | [M2−2H]2− | C54H44O46 | −6.4 | 10 | 714 | 705(100) 696(25) 691(47) 613(37) 601(17) 631(14) 300.99(11) | Ellagitannin m/z 1429 | ||||
| - | 1429.1149 | [M2-H]− | C54H45O46 | −2.7 | 30 | 714 | 613(50) 300.99(60) 299(54) 273(79) 261(100) 229(44) 215(55) 167(76) 123(35) | |||||
| R49 | 8.99 | 224 254sh 275 350sh | - | 631.0577 | [M-H]− | C27H19O18 | 0.02 | 30 | 631 | 613(70) 603(18) 577(23) 461(49) 445(100) 443(49) 433(26) 300.99(89) 299(79) 275(27) 273(30) 245(20) 231(31) 229(54) 169(33) 167(21) 123(27) | Ellagitannin m/z 631 (similar to castalin/vescalin) | [37] |
| R51 | 9.37 | 220 278 | - | 635.0881 | [M-H]− | C27H23O18 | −1.4 | 30 | 635 | 635(43) 483(24) 465(71) 423(8) 313(60) 295(10) 211(7) 169(100) 125(13) | Tri-O-galloyl-hexose | [38,55] |
| R55 | 10.22 | 224 276 | - | 441.0825 | [M-H]− | C22H17O10 | −0.5 | 20 | 441 | 289(44) 271(6) 245(10) 169(100) 125(25) | (epi)Catechin monogallate | [45,46] |
| R57 | 10.56 | 226 256 370sh | - | 779.0372 | [M-H]− | C34H19O22 | −0.2 | 20 | 779 | 751(100) 733(37) 449(21) 300.99(78) 299(56) 287(12) 275(12) 273(13) | Ellagitannin m/z 779 | |
| - | 797.0484 | [M-H]− | C34H21O23 | 0.6 | 20 | 797 | 779(18) 751(100) 733(36) 449(18) 316(17) 300.99(92) 299(74) 291(24) 273(57) 271(19) 247(19) | Ellagitannin m/z 797 | ||||
| - | 815.0589 | [M-H]− | C34H23O24 | 0.5 | 20 | 815 | 797(21) 779(27) 751(100) 733(43) 725(20) 709(13) 449(13) 435(16) 317(13) 300.99(87) 299(51) 291(45) 289(15) 273(60) 247(45) | Ellagitannin m/z 815 | ||||
| R58 | 10.67 | 224 278 365sh | - | 783.0689 | [M-H]− | C34H23O22 | 0.3 | 40 | 783 | 765(75) 613(18) 597(33) 445(18) 427(22) 300.99(97) 299(57) 275(98) 273(86) 271(19) 247(26) 229(100) 169(57) 167(39) 123(40) | Ellagitannin m/z 783 | |
| - | 300.9982 | [M-H]− | C14H5O8 | −2.6 | 30 | 301 | 300.99(100) 300(25) 283(26) 257(10) 245(17) 229(32) 201(24) 185(19) 173(21) 145(22) 129(8) | Ellagic acid * | [40,55] | |||
| R66 | 13.82 | 220 274 357sh | - | 739.0786 | [M-H]− | C34H23O20 | −0.3 | 30 | 739 | 721(100) 569(13) 443(12) 300.99(27) 299(13) 273(43) 229(39) 169(11) 166(38) 123(12) | Ellagitannin m/z 739 | |
| R80 | 17.38 | 196 224 284 | - | 677.1816 | [M-H]− | C42H29O9 | −0.2 | 30 | 677 | 571(41) 529(33) 528(19) 501(72) 500(66) 477(21) 463(72) 449(18) 437(100) 436(54) 435(48) 422(21) 407(18) 395(24) 394(20) 331(37) 330(38) | α-viniferin | [51] |
| - | 713.1589 | [M+Cl]− | C42H30O9Cl | 0.7 | ||||||||
| - | 1355.3754 | [2M-H]− | C84H59O18 | 3.5 | ||||||||
| R80 | 17.38 | 196 224 284 | + | 679.196 | [M+H]+ | C42H31O9 | −0.4 | 40 | 679 | 585(41) 491(25) 453(50) 359(100) 345(83) 343(25) 331(42) 227(22) 215(24) 199(62) 121(45) 107(49) | α-viniferin | [51] |
| + | 701.1785 | [M+Na]+ | C42H30O9Na | 0.4 | ||||||||
| Peaks | Rt (min) | λmax (nm) | UHPLC-MS QTOF Analysis | UHPLC-MS/MS QTOF Analysis | Compound Annotation | References | ||||||
|---|---|---|---|---|---|---|---|---|---|---|---|---|
| Ionization Mode | Observed Ions (m/z) | Ionic Species | Ion Formula | ∆ppm | Collision Energy (v) | Precursor Ion (m/z) | Main Product Ions m/z (% Base Peak) | |||||
| L3 | 0.96 | 222 278 | - | 331.0673 | [M-H]− | C13H15O10 | 0.7 | 20 | 331 | 331(55) 271(33) 211(53) 169(100) 151(35) 125(63) 123(36) 101(26) | Galloyl-hexose | [38,54] |
| L5 | 2.55 | 224 250sh 298sh 322 | - | 311.0411 | [M-H]− | C13H11O9 | 0.8 | 20 | 311 | 179(21) 149(100) 135(19) 103(7) | Caffeoyl-tartaric acid (caftaric acid) | [33,34] |
| - | 333.0229 | [M+Na-2H]− | C13H10O9Na | 0.3 | ||||||||
| L9 | 3.64 | 232 295sh 312 | - | 295.0457 | [M-H]− | C13H11O8 | −0.8 | 20 | 295 | 163(100) 149(6) 119(92) 112(8) | Coumaroyl-tartaric acid (coutaric acid) | [33,34] |
| - | 317.0279 | [M+Na-2H]− | C13H10O8Na | 0.05 | ||||||||
| - | 613.0794 | [2M+Na-2H]− | C26H22O16Na | −2.9 | ||||||||
| L10 | 3.92 | 224 278 | - | 483.0788 | [M-H]− | C20H19O14 | 1.6 | 30 | 483 | 331(8) 313(17) 271(100) 241(10) 211(32) 169(97) 125(18) | Di-O-galloyl-hexose | [38,55] |
| L16 | 5.59 | 222 274 | - | 706.0524 | [M1-2H]2− | C54H44O45 | −8.3 | 20 | 706 | 633(38) 631(61) 615(40) 613(100) 611(40) 601(40) 419(41) 300.99(36) 247(39) 245(36) 169(53) | Ellagitannin m/z 1413 | |
| - | 1413.1404 | [M1-H]− | C54H45O45 | 11.7 | 40 | 706 | 300.99(100) 273(49) 246(25) 245(31) 230(63) 229(69) 201(53) 175(33) 169(48) 166(44) 145(25) 123(60) | |||||
| - | 715.0575 | [M2-2H]2− | C54H46O46 | −8.8 | 20 | 715 | 706(100) 705(14) 697(83) 691(37) 651(15) 631(20) 613(26) 601(15) 301(14) 291(14) 169(38) | Ellagitannin m/z 1431 | ||||
| L16 | 5.59 | 222 274 | - | 1431.1285 | [M2-H]− | C54H47O46 | −4.1 | 40 | 715 | 403(32) 300.99(100) 298(41) 286(42) 275(40) 273(67) 260(45) 245(45) 229(93) 219(34) 217(36) 214(45) 191(38) 189(47) 169(42) 123(62) | Ellagitannin m/z 1431 | |
| L17 | 5.70 | 224 265 | - | 705.0447 | [M1-2H]2− | C54H42O45 | −8.2 | 40 | 705 | 300.99(100) 287(47) 275(46) 229(63) 217(47) 214(50) 167(67) 123(48) | Ellagitannin m/z 1411 | |
| - | 1411.0998 | [M1-H]− | C54H43O45 | −5.9 | ||||||||
| - | 714.0498 | [M2-2H]2− | C54H44O46 | −8.3 | 10 | 714 | 705(100) 702(12) 696(24) 691(52) 631(9) 613(22) 601(10) 599(12) 300.99(9) 299(11) 169(10) | Ellagitannin m/z 1429 | ||||
| - | 1429.1111 | [M2-H]− | C54H45O46 | −5.4 | 30 | 714 | 613(57) 601(34) 431(31) 401(30) 300.99(81) 299(43) 275(37) 273(86) 261(100) 247(33) 229(48) 169(55) 167(65) | |||||
| L19 | 6.03 | 224 256 274 350sh | - | 631.0575 | [M-H]− | C27H19O18 | −0.3 | 30 | 631 | 613(55) 465(30) 464(24) 461(23) 445(100) 443(39) 300.99(58) 298(48) 272(48) 166(64) 123(36) 102(21) | Ellagitannin m/z 631(similar to castalin/vescalin) | [37] |
| - | 653.0390 | [M+Na-2H]− | C27H18O18Na | −1.0 | 30 | 653 | 635(33) 625(23) 461(23) 433(34) 322(36) 300.99(100) 299(60) 271(31) 169(14) | |||||
| L20 | 6.25 | 222 278 330sh | - | 635.0882 | [M-H]− | C27H23O18 | −1.2 | 30 | 635 | 635(52) 483(37) 465(99) 423(11) 313(68) 295(15) 169(100) 125(27) | Tri-O-galloyl-hexose | [38,55] |
| L25 | 7.13 | 224 255 370sh | - | 779.0381 | [M-H]− | C34H19O22 | 1.0 | 20 | 779 | 779(11) 761(11) 751(100) 733(37) 449(23) 300.99(84) 299(57) 286(12) 275(13) 273(16) 261(12) 242.9(9) 214.9(9) | Ellagitannin m/z 779 | |
| - | 797.0486 | [M-H]− | C34H21O23 | 0.9 | 20 | 797 | 797(13) 779(22) 773(10) 753(36) 751(100) 735(25) 733(39) 725(11) 449(24) 316(14) 300.99(90) 299(90) 291(35) 288(11) 286(11) 275(28) 273(73) 270(20) 247(23) | Ellagitannin m/z 797 | ||||
| L25 | 7.13 | 224 255 370sh | - | 815.0578 | [M-H]− | C34H23O24 | −0.8 | 20 | 815 | 815(13) 797(27) 779(40) 753(71) 751(100) 735(51) 733(55) 725(18) 709(11) 707(14) 449(18) 435(14) 316(12) 300.99(91) 299(57) 291(45) 275(24) 273(55) 270(14) 261(12) 247(61) 245(20) | Ellagitannin m/z 815 | |
| L27 | 7.33 | 252 292sh 302 354sh 368 | - | 300.9991 | [M-H]− | C14H5O8 | 0.4 | 40 | 301 | 299(36) 283(57) 229(34) 228(28) 217(35) 201(53) 200(51) 185(33) 173(58) 172(34) 161(38) 157(37) 145(100) 133(31) 129(26) 117(50) | Ellagic acid * | [40,55] |
| L28 | 7.69 | 212 222 276 | - | 791.0631 | [M-2H]2− | 30 | 791 | 787(18) 785(26) 781(19) 767(17) 765(100) 753(28) 721(14) 613(15) 601(43) 598(14) 300.99(53) 299(30) 273(22) 249(21) 211(18) 169(20) | Ellagitannin m/z 791 | |||
| L29 | 7.80 | 224 256 265sh 295sh 353 | - | 477.0669 | [M-H]− | C21H17O13 | −1.2 | 20 | 477 | 301(100) 179(5) 151(5) | Quercetin-3-O-glucuronide | [33,40] |
| + | 479.0798 | [M+H]+ | C21H19O13 | −4.6 | 20 | 479 | 303(100) 159(2) 141(1) 113(5) | |||||
| + | 501.0624 | [M+Na]+ | C21H18O13Na | −3.1 | 20 | 501 | 325(100) 199(7) 140(3) | |||||
| L30 | 7.94 | 228 290 335sh | - | 449.1085 | [M-H]− | C21H21O11 | −1.0 | 20 | 449 | 323(4) 303(14) 285(67) 241(4) 179(14) 151(100) 125(16) 107(8) | Astilbin (taxifolin-3-O-rhamnoside) | [33,41,42] |
| + | 473.1041 | [M+Na]+ | C21H22O11Na | −2.8 | ||||||||
© 2019 by the authors. Licensee MDPI, Basel, Switzerland. This article is an open access article distributed under the terms and conditions of the Creative Commons Attribution (CC BY) license (http://creativecommons.org/licenses/by/4.0/).
Share and Cite
Miotto-Vilanova, L.; Courteaux, B.; Padilla, R.; Rabenoelina, F.; Jacquard, C.; Clément, C.; Comte, G.; Lavire, C.; Ait Barka, E.; Kerzaon, I.; et al. Impact of Paraburkholderia phytofirmans PsJN on Grapevine Phenolic Metabolism. Int. J. Mol. Sci. 2019, 20, 5775. https://0-doi-org.brum.beds.ac.uk/10.3390/ijms20225775
Miotto-Vilanova L, Courteaux B, Padilla R, Rabenoelina F, Jacquard C, Clément C, Comte G, Lavire C, Ait Barka E, Kerzaon I, et al. Impact of Paraburkholderia phytofirmans PsJN on Grapevine Phenolic Metabolism. International Journal of Molecular Sciences. 2019; 20(22):5775. https://0-doi-org.brum.beds.ac.uk/10.3390/ijms20225775
Chicago/Turabian StyleMiotto-Vilanova, Lidiane, Barbara Courteaux, Rosa Padilla, Fanja Rabenoelina, Cédric Jacquard, Christophe Clément, Gilles Comte, Céline Lavire, Essaïd Ait Barka, Isabelle Kerzaon, and et al. 2019. "Impact of Paraburkholderia phytofirmans PsJN on Grapevine Phenolic Metabolism" International Journal of Molecular Sciences 20, no. 22: 5775. https://0-doi-org.brum.beds.ac.uk/10.3390/ijms20225775