Article

Cerium Oxide Nanoparticles Protect against Oxidant Injury and Interfere with Oxidative Mediated Kinase Signaling in Human-Derived Hepatocytes

1
Biochemistry and Molecular Genetics Service, Hospital Clínic Universitari, IDIBAPS, CIBERehd, 08036 Barcelona, Spain
2
Department of Biomedicine, University of Barcelona, 08036 Barcelona, Spain
3
School of Biotechnology and Health Sciences, Wuyi University, Jiangmen 529020, China
4
Cell Signalling and Proteomics Group, Centre for Haemato-Oncology, Barts Cancer Institute, Queen Mary University of London, London EC1M 6BQ, UK
5
Institut Català de Recerca i Estudis Avançats, (ICREA), 08010 Barcelona, Spain
6
Vall d’Hebron Insitute of Research (VHIR), 08035 Barcelona, Spain
7
Institut Català de Nanociència i Nanotecnologia (ICN2), 08193 Bellaterra, Spain
*
Author to whom correspondence should be addressed.
Int. J. Mol. Sci. 2019, 20(23), 5959; https://0-doi-org.brum.beds.ac.uk/10.3390/ijms20235959
Submission received: 2 October 2019 / Revised: 18 November 2019 / Accepted: 20 November 2019 / Published: 27 November 2019

Abstract

:
Cerium oxide nanoparticles (CeO2NPs) possess powerful antioxidant properties, thus emerging as a potential therapeutic tool in non-alcoholic fatty liver disease (NAFLD) progression, which is characterized by a high presence of reactive oxygen species (ROS). The aim of this study was to elucidate whether CeO2NPs can prevent or attenuate oxidant injury in the hepatic human cell line HepG2 and to investigate the mechanisms involved in this phenomenon. The effect of CeO2NPs on cell viability and ROS scavenging was determined, the differential expression of pro-inflammatory and oxidative stress-related genes was analyzed, and a proteomic analysis was performed to assess the impact of CeO2NPs on cell phosphorylation in human hepatic cells under oxidative stress conditions. CeO2NPs did not modify HepG2 cell viability in basal conditions but reduced H2O2- and lipopolysaccharide (LPS)-induced cell death and prevented H2O2-induced overexpression of MPO, PTGS1 and iNOS. Phosphoproteomic analysis showed that CeO2NPs reverted the H2O2-mediated increase in the phosphorylation of peptides related to cellular proliferation, stress response, and gene transcription regulation, and interfered with H2O2 effects on mTOR, MAPK/ERK, CK2A1 and PKACA signaling pathways. In conclusion, CeO2NPs protect HepG2 cells from cell-induced oxidative damage, reducing ROS generation and inflammatory gene expression as well as regulation of kinase-driven cell survival pathways.

Graphical Abstract

1. Introduction

During the last few years, it has been suggested that antioxidants such as superoxide dismutase (Mn-SOD), resveratrol, colchicine, eugenol or vitamin E and C exert beneficial effects in chronic liver disease [1,2,3,4,5]. This hypothesis was raised based on the concept that the root of many hepatic disturbances involves an imbalance in reactive oxygen species (ROS) metabolism. Accordingly, any maneuver towards reversing this imbalance should improve liver functionality and diminish injury. In this regard, the therapeutic effects induced by antioxidants (vitamin C and SOD) on portal hypertension have already been shown in patients with liver disease [6] and CCl4-treated rats with portal hypertension [1]. Currently, the European and American guidelines for the management of patients with non-alcoholic fatty liver disease (NAFLD) support the use of vitamin E in nondiabetic adults with biopsy-proven NASH [7,8].
More recently a new player, namely cerium oxide nanoparticles (CeO2NPs), was incorporated to the group of antioxidant substances with therapeutic properties in experimental liver disease. CeO2NPs are a rare element belonging to the lanthanide series, with both Ce3+ and Ce4+ oxidation states that result in an autoregenerative redox cycle between the two states, followed by the capture or release of oxygen [9]. As a consequence, the oxygen storage capacity of CeO2NPs becomes very useful to eliminate free radicals while generated in situations of ROS imbalance [10,11]. Recently, we have demonstrated that CeO2NPs reduce steatosis, portal hypertension and display anti-inflammatory properties in rats with experimental liver fibrosis [12]. Also, we observed an antilipogenic and anti-inflammatory effect in the liver of rats subjected to a methionine and choline deficient diet for six weeks [13]. A major difference between antioxidants such as SOD or vitamin C and CeO2NPs is that the former two are rapidly oxidized or degraded (metabolized) whereas CeO2NPs act as self-renewal catalysts. In addition, CeO2NPs only display biological effects in the case of ROS overproduction; otherwise, they behave as inert inorganic material [14]. For this reason, CeO2NPs are expected to behave as permanent vitamin C or SOD-like effectors and perform better than natural antioxidants, being specifically active in the case of inflammation. This makes CeO2NPs especially helpful to arrest NAFLD progression, which is critically dependent on chronic effects of ROS in the liver. It is therefore important to understand the mechanisms of action of CeO2NPs to ensure safe use in human liver disease.
In this investigation, we address this issue by assessing whether CeO2NPs are able to prevent or attenuate the oxidant-mediated injury induced by H2O2 or lipopolysaccharide (LPS) in HepG2 cells, which is a cell line derived from human hepatocytes that preserve most of the morphological and metabolic characteristics of the original hepatic cells [15,16]. The aim of the study was to further elucidate whether the therapeutic effect of CeO2NPs already observed in experimental liver disease can be translated to human cells and to investigate the molecular mechanisms involved in this beneficial effect.

2. Results

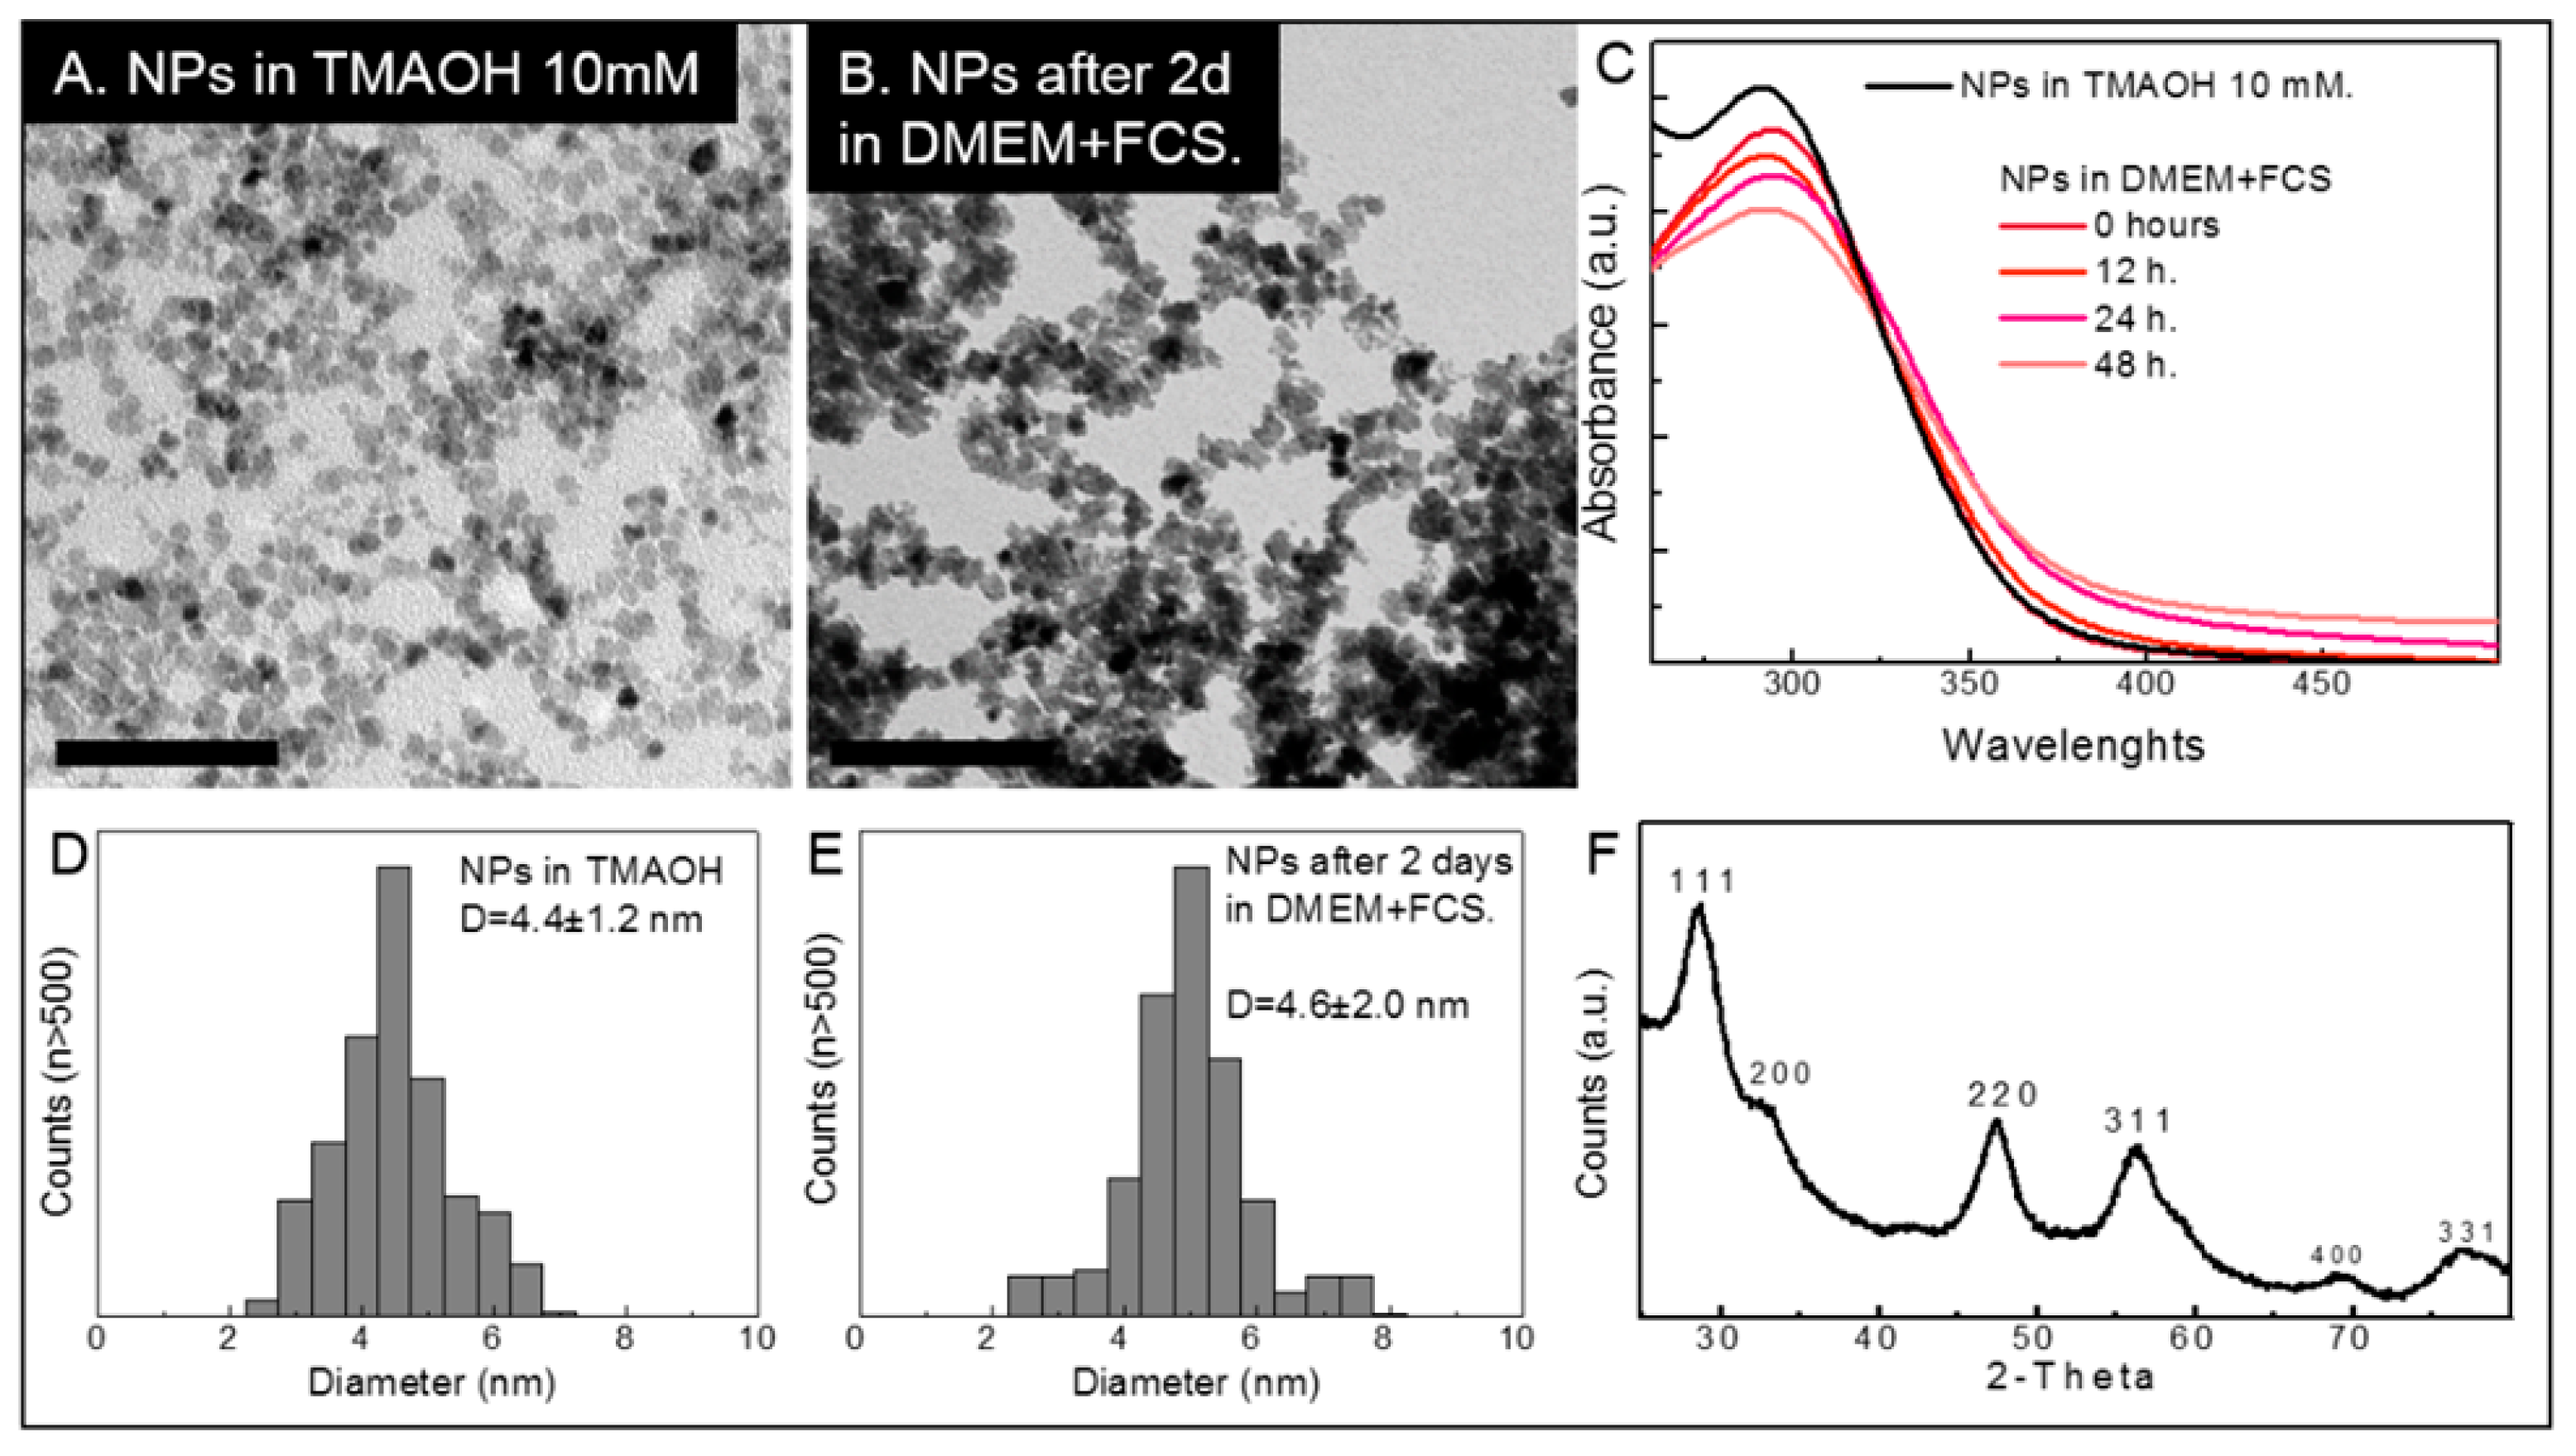
2.1. Cerium Oxide Nanoparticles Characterization

The CeO2NPs used in this work and their evolution in the physiological media have been already described extensively in our previous works [12,17], and the results presented here are similar to the ones already presented, i.e., the nanoparticles (NPs) are stable during their time in the physiological media and a protein corona is made on their surface during that time. This can be observed in Figure 1 and Table 1 as size distribution from Transmission Electron Microscopy (TEM) images is only slightly modified, Z-potential decreases to the value of the fetal calf serum, while the hydrodynamic diameter measured by Dynamic Light Scattering (DLS) increases and Ultraviolet-Visible (UV-VIS) spectra show some modifications (both from the slight modification of the size distribution and the absorption of proteins).

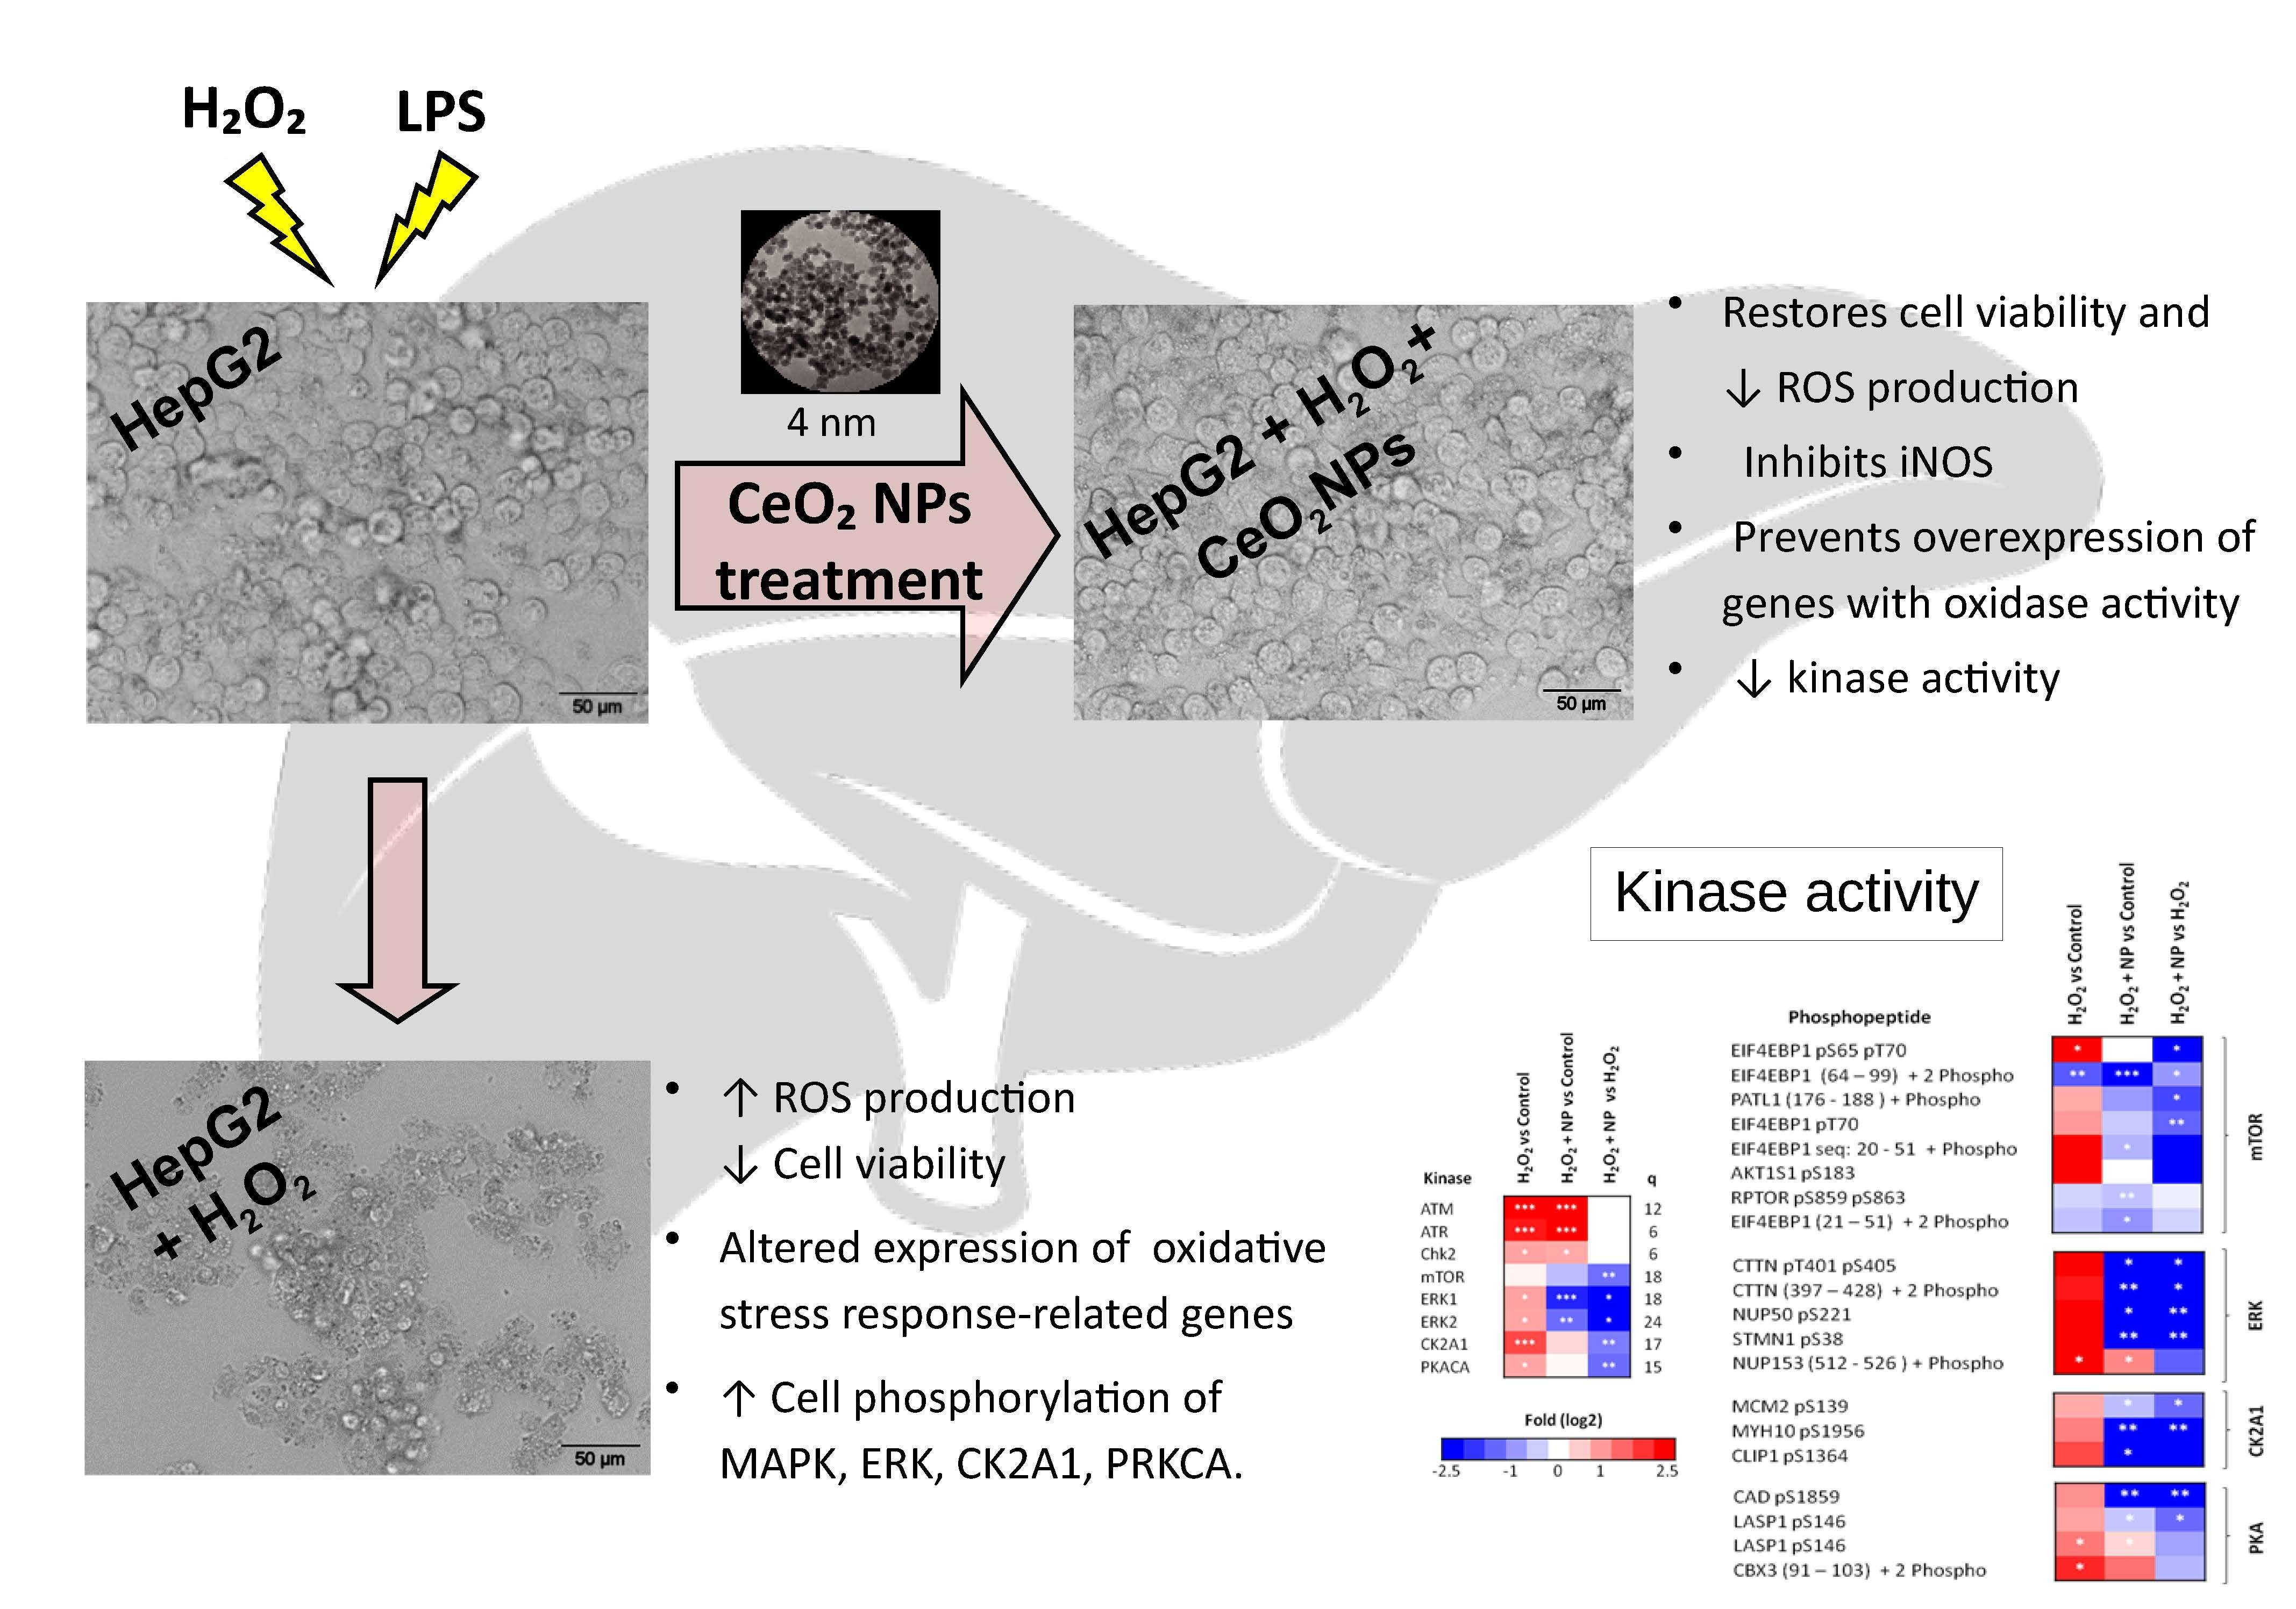
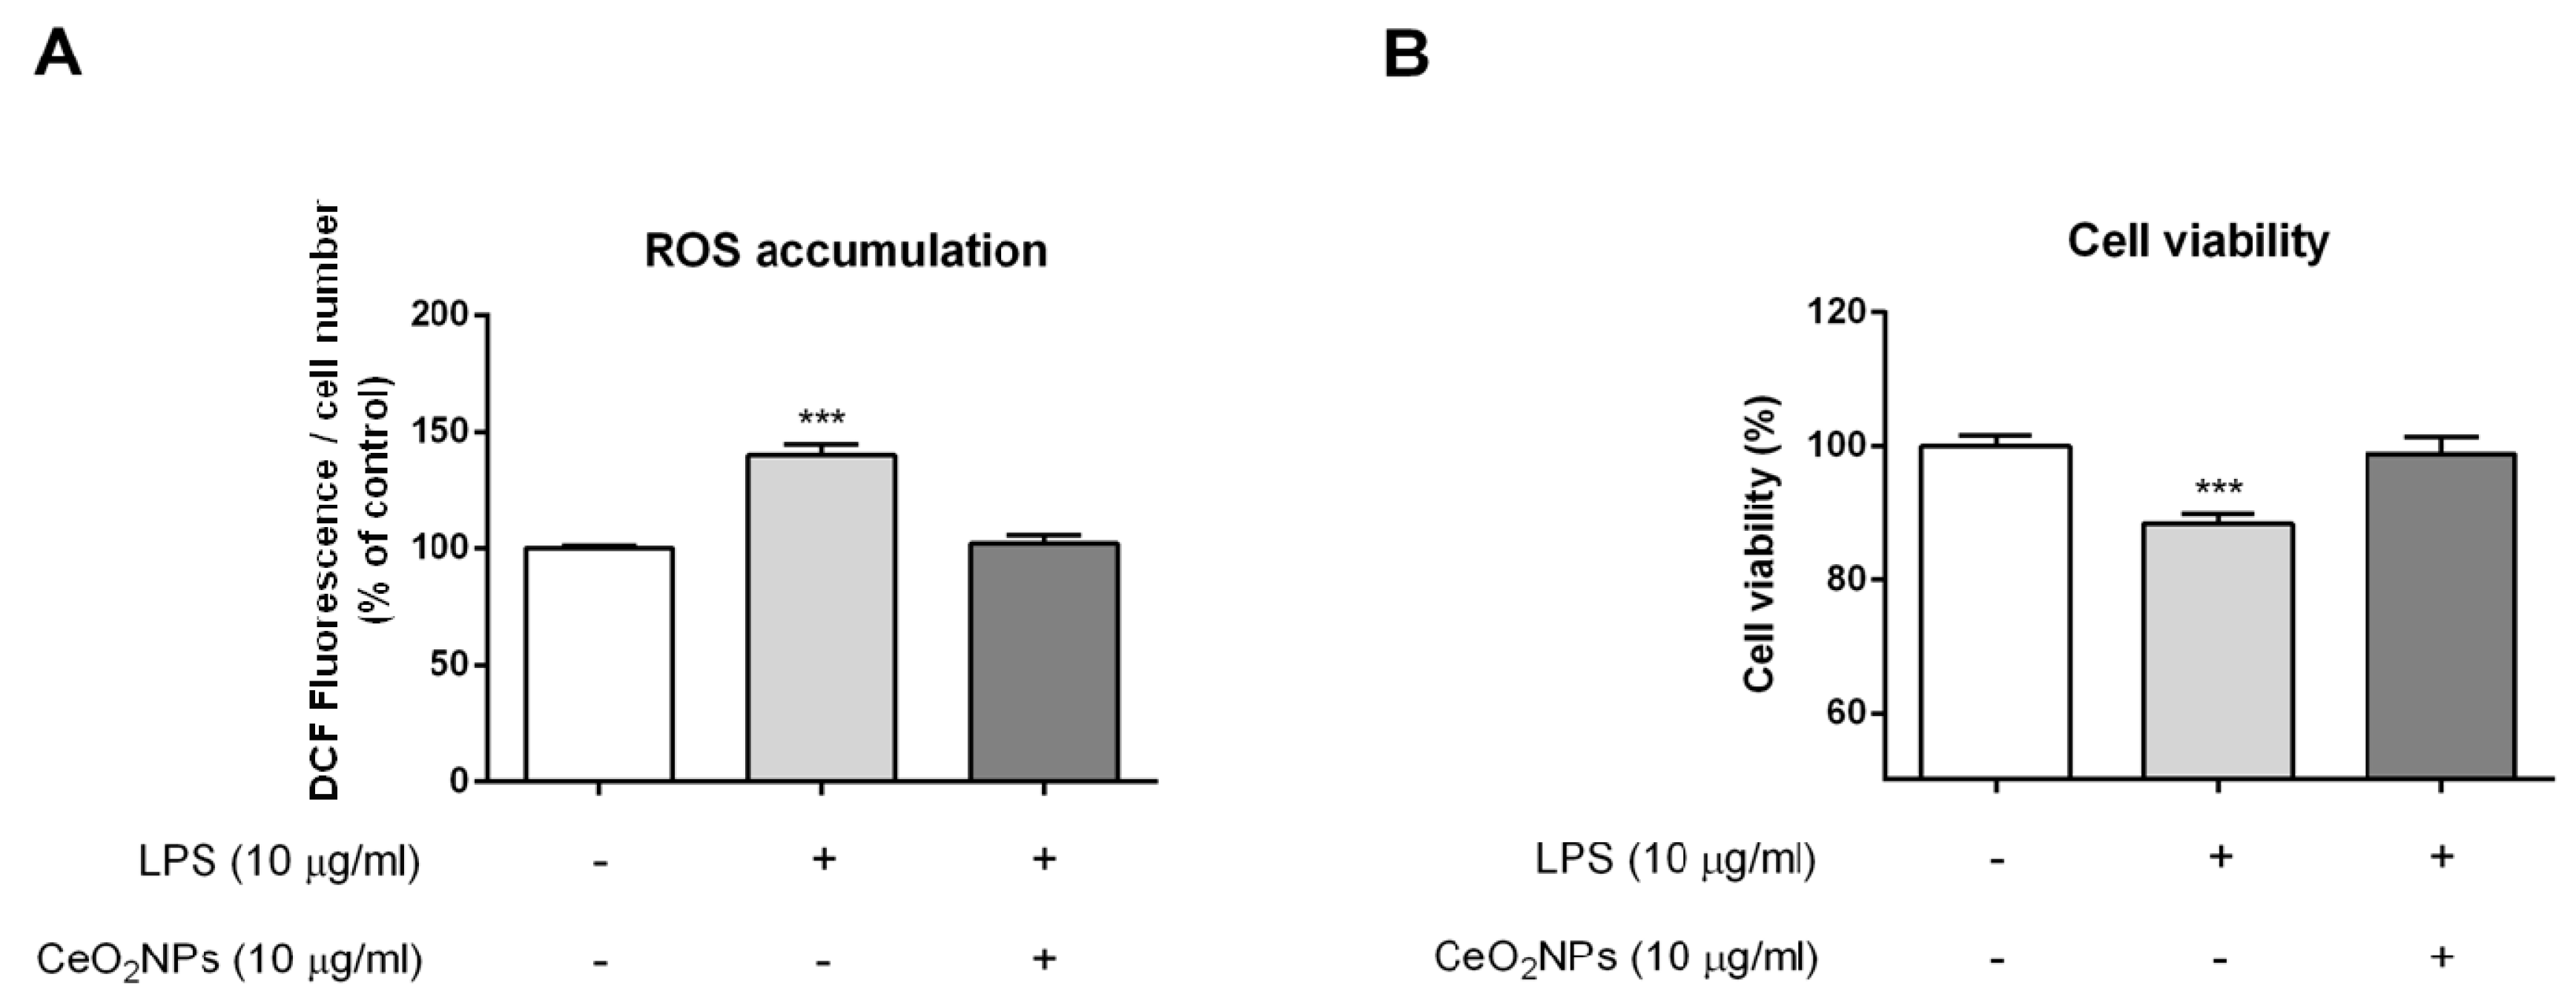
2.2. CeO2NPs Protect HepG2 Cells from H2O2- and LPS-induced Cytotoxicity

To demonstrate that the CeO2NPs employed are non-toxic to HepG2, cells were exposed to CeO2NPs, and cell survival was assessed using the MTS assay. As shown in Figure 2A, we did not find significant differences in cell death between control and CeO2NPs-exposed cells up to concentrations of 10 µg/mL of CeO2NPs. Next, we further certified the ability of CeO2NPs to shield HepG2 cells from oxidative damage. Cells were incubated with H2O2 or LPS to promote oxidative stress and were then treated with different doses of CeO2NPs. Figure 2B,D,E show the effect of CeO2NPs on cell viability and ROS production, respectively. As anticipated, the presence of H2O2 significantly increased the oxidation of dichlorofluorescin diacetate (DCF-DA) in HepG2 cells, in association with a reduction in cell viability. Remarkably, both effects were reverted when HepG2 cells were coincubated with 10 µg/mL of CeO2NPs. Similar results were obtained on measuring glutathione (GSH) concentration. H2O2 treatment reduced GSH concentrations to 37% ± 5% from the basal value, whereas subsequent administration of CeO2NPs recovered these figures to 64% ± 5% (p < 0.01). Furthermore, cellular morphological visualization using light microscopy (Figure 2C) showed that most of the HepG2 cells lost their normal morphology when stimulated with H2O2, whereas this change was absent when cells were treated with CeO2NPs. A similar pattern of response was found when cells were stimulated with LPS. Indeed, LPS increased ROS production and decreased cell viability, and CeO2NPs prevented these effects in HepG2 cells (Figure 3). These results indicate that CeO2NPs treatment reduces ROS accumulation and the associated cell death induced by H2O2 and LPS in HepG2 cells.

2.3. Expression Profile of Genes Related to Oxidative Stress in HepG2 Cells Exposed to H2O2

The relative expression of 84 genes associated with oxidative stress and antioxidant protection in HepG2 cells exposed to H2O2 and treated with CeO2NPs was assessed using a commercially available PCR array. Table 2 depicts the 25 out of the 84 investigated genes showing a 2-fold or superior change in expression between H2O2-exposed and control cells and the expression of genes affected by CeO2NPs treatment compared to non-treated H2O2-exposed cells. Nine genes were significantly upregulated in H2O2-exposed cells. This group included genes encoding peroxidase and reductase enzymes involved in antioxidant metabolism (MPO, PTGS1, TXNRD1 and SRXN1), genes related to ROS metabolism (NCF1), as well as oxidative stress responsive genes, namely DUSP1, GCLC, GCLM, and HSPA1A. On the other hand, 12 genes appeared to be significantly downregulated, including genes encoding antioxidant enzymes (CAT, GPX7 and SOD3), genes controlling ROS production (UCP2 and EPHX2), oxidative stress responsive genes (DCHR24, FOXM1, MBL2, OXR1, SCARA3, and SEPP1), and the oxygen transporter MB.
A 2-fold or greater change in expression with p < 0.05 was considered statistically significant on comparing the untreated vs. the CeO2NPs treated H2O2-exposed cell groups. A volcano plot of the data is presented in Figure 4. CeO2NPs significantly decreased the expression of two genes with peroxidase activity (MPO, PTGS1) and a gene encoding a subunit of NADPH oxidase (NCF2). These changes in mRNA expression induced by CeO2NPs in H2O2-treated cells were confirmed on assessing messenger abundance using real time-PCR (Figure 5).

2.4. CeO2NPs Reduce H2O2-Induced Expression of iNOS in HepG2 cells

Since CeO2NPs are able to reduce H2O2-induced ROS production in HepG2 cells and also modify the expression of oxidative stress-related genes, we investigated whether the expression of key pro-inflammatory genes (TNF-α and iNOS) could be abrogated by CeO2NPs. As anticipated, H2O2 exposure increased mRNA expression of TNF-α and iNOS in HepG2 cells. Moreover, CeO2NPs exerted a specific inhibitory effect on iNOS expression since exposure of H2O2-treated cells to CeO2NPs markedly reduced iNOS but not TNF-α expression in these cells (Figure 6).

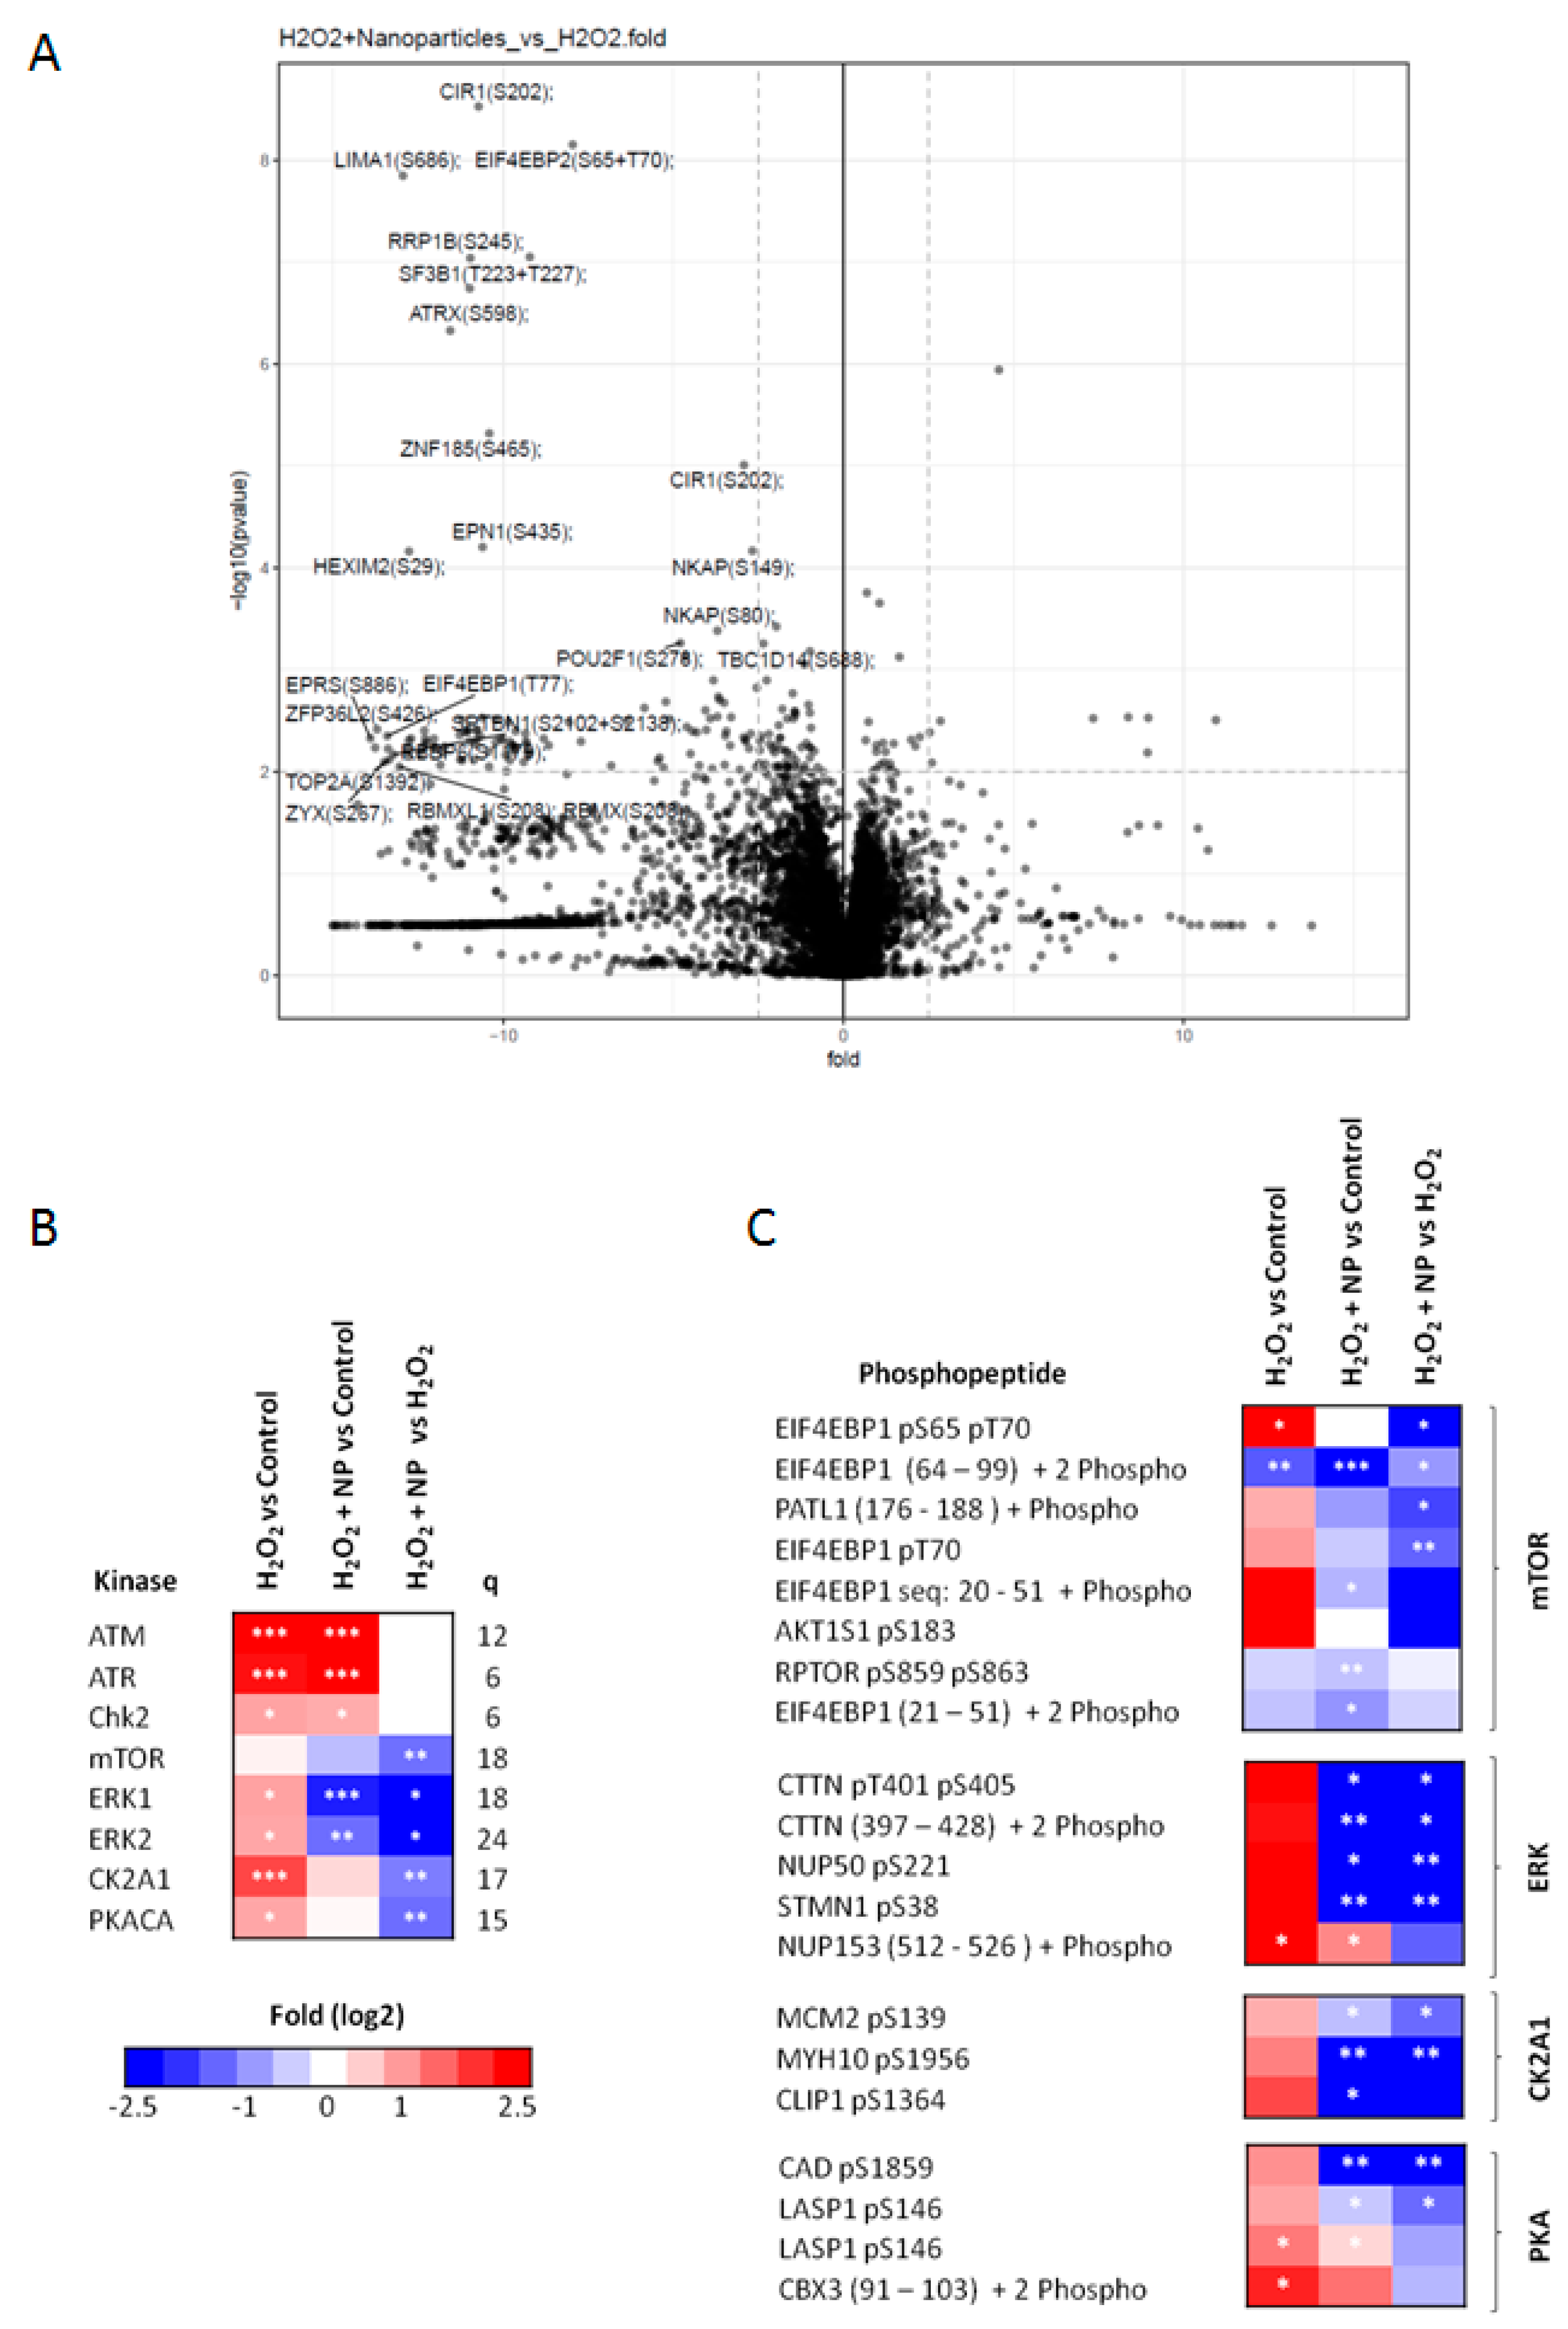
2.5. Identification of Signaling Networks Affected by Oxidative Stress in HepG2. Effect of CeO2NPs

To investigate the effects of CeO2NPs on kinase driven signaling pathways we used mass spectrometry phosphoproteomics. We identified and quantified a total of 10,210 phosphopeptides in four independent biological replicates. As anticipated, a large number were affected by H2O2 treatment. At arbitrary threshold values of ±0.8-fold change (log2) and a p value of < 0.05, data analysis revealed that the phosphorylation of 1503 peptides (1037 increased and 466 decreased) was affected after incubation of HepG2 cells with H2O2 (1.5 mM) for 60 min. Interestingly, the phosphorylation of a substantial number of peptides was affected by CeO2NPs treatment (Figure 7A). Following exposure to CeO2NPs, the intensity of phosphorylation went back toward normal values in 39 out of the 1037 peptides with increased phosphorylation; whereas, none of the 466 peptides in which H2O2 induced a reduction in the intensity of the phosphorylation partially or totally recovered following CeO2NPs incubation (Table 3). A number of phosphorylation sites were observed on proteins linked to cell proliferation, stress response, cytoskeletal signaling and gene transcription regulation. Interestingly and consistently with our gene expression data (Figure 4), TERF2 and ARID1A, which are two of the most frequently altered genes in hepatocellular carcinoma (HCC), were among these peptides (Table 3).
Previous investigations have demonstrated that kinase activity can be estimated by measuring the phosphorylation state of known substrates using kinase substrate enrichment analysis (KSEA) [18,19]. We used this computational approach to elucidate kinases involved in the effects of CeO2NPs. As expected, KSEA showed that H2O2 produced an increase in the estimated activity of ATM, ATR or CHK2, which are kinases involved in DNA damage response (Figure 7B). This analysis also indicated that CeO2NPs interfered with mTOR, MEK/ERK, CK2A1 and PKA signaling (Figure 7B). Thus, CeO2NPs reversed the ability of H2O2 to induce the phosphorylation of mTOR substrates like 4EBP1 and PRAS40 (also known as AKT1S1, Figure 7C). In addition, we observed reduced phosphorylation of proteins involved in the PI3K/mTOR pathway including ACIN1, PRKDC and YAP1 (Table 3). The nanoparticles also inhibit the phosphorylation of multiple ERK substrates including Cortactin, Stahmin and NP50. In addition, NPs block the phosphorylation induced by the H2O2 treatment on NP150, another ERK substrate (Figure 7C).
CK2A1 phosphorylates a wide array of substrates and regulates several cellular processes, including cell cycle progression and transcription. HepG2 exposure to CeO2NPs also resulted in dephosphorylation of several peptides known to be substrates of CK2A1, such as MCM2 at S139, MYH10 at S1956 and CLIP at S1364 (Figure 7C). In addition to the PhosphoSite annotated substrates, other sites linked to CK2A1 like kanadaptin at S466, MCM3 at S711 and T713, CHMP2B at S199, and RBMX at S208 also followed the same trend (Table 3). Following CeO2NPs treatment, we also observed dephosphorylation of POU2F1, a substrate of PKACA, a kinase that phosphorylates a wide variety of substrates in the cytoplasm and the nucleus and regulates trafficking of compartmentalized pools of its regulatory subunits (Figure 7C). In summary, an assessment of the phosphoproteome in cells exposed to oxidative stress indicates that CeO2NPs negatively interfere with the signaling of mTOR, ERK 1/2, CK2A1 and PKACA. Moreover, CeO2NPs also dephosphorylated TERF2 and ARID1A, which are major therapeutic targets in HCC.

3. Discussion

The recent description that nanoceria could be therapeutically useful in pathological conditions characterized by enhanced oxidative stress and inflammation [20], including liver disease, raised the possibility of using this material in patients. However, assessment of the beneficial effects of CeO2NPs in humans should be made with caution. As a first step to address this issue, the current study sought to investigate the effect of CeO2NPs in a human hepatic cell line when challenged with a well characterized pro-oxidant or proinflammatory agent such as H2O2 or LPS. Oxidative stress and inflammation are considered key mechanisms of progression to NASH, fibrosis and/or hepatocellular carcinoma in patients with NAFLD.
In the current investigation, exposure of human HepG2 cells to 10 µg/mL of CeO2NPs did not alter cell viability under normal conditions. This is coincident with previous investigations demonstrating that at the concentration used these nanoparticles are non-toxic to numerous mammalian cells, including endothelial, breast and fibrosarcoma cells [21,22]. This feature seems to be characteristic of CeO2NPs since other metal oxide nanoparticles, such as zinc oxide and titanium (exposed to UV-light), have displayed remarkable toxicity [23].
CeO2NPs have been proposed as a potential treatment for clinical conditions in which increased oxidative stress plays a significant pathogenic role. Actually, CeO2NPs display superoxide dismutase (SOD) and catalase mimetic activities [10,24,25] and present hydroxyl radical scavenging properties, thus resulting in a reduction of ROS [24,25]. This has been further supported by experimental evidence demonstrating the ROS-scavenging potential of CeO2NPs in medicine [26]. Oxidative stress plays a critical role in the development of chronic liver damage and stimulates its progression. It is well established that oxidative stress constitutes the background of viral, alcoholic liver diseases, non-alcoholic steatohepatitis and participates in the fibrogenic response of the liver [27]. Therefore, this investigation was addressed to assess whether CeO2NPs could protect hepatocyte injury induced by a direct prooxidant stimulus such as H2O2. Our results showed that CeO2NPs reduced the cellular cytotoxicity induced by H2O2, which was associated with a decrease in cellular oxidative stress. Next, we further investigated the ability of CeO2NPs to decrease the endogenous production of ROS by stimulating HepG2 cells with LPS. This bacterial wall-derived product is a well-known inducer of ROS production in several cell lines [28,29]. In line with these investigations, we showed that LPS treatment increased ROS production in HepG2 cells (Figure 3A). Furthermore, the presence of CeO2NPs blocked LPS-induced ROS production in these cells. This phenomenon occurred in the absence of significant modifications in cell viability. Altogether, these results show that CeO2NPs also protect HepG2 cells from LPS-induced oxidative stress.
Although the physicochemical properties of CeO2NPs as a ROS scavenger are well described, the mechanisms of their effects on biological systems remain largely unknown. In order to investigate the specific molecular mechanisms by which CeO2NPs exert the protective effects observed in HepG2 cells, we studied the pattern of expression of a wide array of genes involved in oxidative stress and antioxidant defense. As expected, treatment of HepG2 cells with H2O2 significantly altered the biological response to ROS with significant changes in the expression of 30% of the genes studied (25 of 84 genes). Interestingly, CeO2NPs treatment of H2O2-stimulated cells allowed the identification of five specific genes related to the cellular response of CeO2NPs to ROS. These include important oxidative genes such as myeloperoxidase (MPO), prostaglandin-endoperoxide synthase 1 (PTGS1), also known as cyclooxygenase 1 (COX1), neutrophil cytosolic factor 2 (NCF2, also known as P67PHOX), and inducible nitric oxide synthase (iNOS). The MPO enzyme catalyzes the conversion of hydrogen peroxide to hypochlorite and hypochlorous acid, and its activation has been related to the proapoptotic and profibrotic pathway of progression in non-alcoholic fatty liver disease [30,31]. The PTGS1 enzyme catalyzes the conversion of arachidonic acid to prostaglandins and thromboxane, and it is widely known that PTGS1 disruption translates into reduced inflammatory response [32,33]. NCF2 encodes a 67 kDa cytosolic subunit that is required for activation of NADPH oxidase to produce superoxide anions. iNOS is a major enzyme in the synthesis of nitric oxide. Overproduction of nitric oxide by iNOS is a critical mediator of inflammation contributing to tissue injury. It is interesting to note that iNOS transfers electrons from NADPH in the NO synthesis reaction and that iNOS expression requires NADPH oxidase-dependent redox signaling [34,35]. In addition, iNOS can also catalyze the production of superoxide ion. In our experiments, the 5.3- 3.7- and 8.7-fold induction of MPO, PTGS1, and iNOS genes, respectively, caused by H2O2 was almost normalized when HepG2 cells were treated with CeO2NPs. Furthermore, a significant reduction in NCF2 expression was also detected in H2O2-exposed cells when treated with CeO2NPs. Our results therefore suggest that, besides the inherent antioxidant properties of the CeO2NPs chemistry, the cytoprotective effects induced by CeO2NPs are mediated by the reduction in the expression of these oxidative enzymes.
It is noteworthy that increased expression of these genes was also found in the liver of rats with CCl4-induced fibrosis [12]. Moreover, treatment with CeO2NPs significantly reduced the hepatic expression of iNOS and NCF2 in this model of liver disease [12]. The similarity of the biological effects observed after CeO2NPs administration in the injured liver of experimental animals and that observed in the current study in HepG2 cells cultured under pro-oxidant conditions further support the potential therapeutic usefulness of CeO2NPs in human liver disease.
The impact of CeO2NPs on cell phosphorylation in human hepatic cells under oxidative stress conditions has not been systematically investigated using untargeted MS-based proteomics. Therefore, we studied the effect of CeO2NPs in an oxidative stress model that involves exposing cells to H2O2 (1.5 mM). In other words, we investigated how CeO2NPs affect the H2O2-induced phosphoproteome changes in human-derived hepatocytes. We found that 10% of all the peptides assessed were phosphorylated as a result of exposure to H2O2. However, the effect of CeO2NPs was considerably more selective. Actually, a reduction in phosphorylation was significantly observed in 39 out of the 1037 peptides affected by H2O2 exposure. A significant number of proteins dephosphorylated as a result of exposure to CeO2NPs were linked to cell proliferation and gene transcription, including ACIN1, YAP1 and 4E-BP1. The activities of kinases are linked to the wiring of signaling networks [36], thus several tools have been developed to link phosphorylation data to upstream kinases based on phosphorylation motifs [37,38]. In the current investigation we have inferred kinase pathway activation based on values of substrate group enrichment obtained from previous knowledge of the kinase-substrate relationship. As a result, we found that H2O2-exposed cells treated with CeO2NPs had decreased amounts of phosphorylated substrates of mTOR, ERK 1/2 and PKACA, all of which have known roles in promoting cell growth, angiogenesis and carcinogenesis. Moreover, CeO2NPs also dephosphorylated TERF2 and ARID1A, which play crucial roles in the initiation and development of HCC [39,40,41,42].
As a limitation of the study, the toxicity of CeO2NPS was not evaluated in a normal hepatic cell line. However, Gaiser et al. reported no toxicity of CeO2NPs in the C3A human hepatocyte cell line at doses up to 100 times higher than those used in our study [43]. More recently, Singh et al. also did not find toxicity of CeO2NPs in the human hepatic cell line WRL-68 [44]. In addition, although no in vivo or functional experiments were performed to verify the efficacy of CeO2NPs in reducing oxidative damage and inflammatory response, recent results in animal models of liver disease have consistently shown antioxidant and anti-inflammatory effects of CeO2NPs in the liver [12,13,45]. Finally, further studies are necessary to confirm that the specific mechanism of oxidative damage reduction identified in this study can be translated to primary human hepatic cells and in in vivo conditions.

4. Material and Methods

4.1. Synthesis and Characterization of CeO2NPs

CeO2NPs were synthesized by the chemical precipitation of cerium (III) nitrate hexahydrated (Sigma-Aldrich, St. Louis, MO, USA) in a basic aqueous solution [17]. By modifying the pH conditions, different sizes can be obtained. Here, we used 4 nm NPs at a concentration of 1 mg/mL. In a first step, 10 mM of cerium (III) nitrate hexahydrate was dissolved in 100 mL of absolute ethanol at room temperature. The solution was left under stirring for about 30 min. One mL of TMAOH (1.0 ± 0.02 M in H2O) was added to the 100 mL solution at a final concentration of 10 mM, and the mixture was left under stirring. NPs were purified using centrifugation and resuspended in aqueous solution of 10 mM TMAOH, which acts as a stabilizer. The surface charge of the NPs was characterized in a Z-sizer (Malvern, Worcestershire, UK), while the crystal size was characterized using high-resolution TEM (HR-TEM) in a Tecnai G2 F20 at 200 kV (FEI, Hillsboro, Oregon, USA) and XRD (Xpert Pannalytical, Westborough, MA, USA), and the light interaction was characterized using UV-VIS spectroscopy (Shimadzu, Kyoto, Japan). Size distribution was computer analyzed by ImageJ (National Institutes of Health, Bethesda, MD, USA). CeO2NPs were kept at 4 °C until used. CeO2NPs were then diluted with DMEM (Life technologies, Carlsbad, CA, USA) to the final concentration 0.1, 1 or 10 μg/mL.

4.2. Cell Culture and Treatment

All studies were conducted with HepG2 human hepatocytes derived from a liver hepatocellular carcinoma obtained from the American Type Culture Collection (ATCC Cat# HB-8065, RRID: CVCL_0027; Manassas, VA, USA). This immortalized, stable cell line can be repeatedly frozen, thawed and propagated. Cells were grown to confluence for 24 h in DMEM, supplemented with 50 U/mL penicillin, 50 µg/mL streptomycin and 10% FCS, in a humidified atmosphere in 5% CO2 at 37 °C. Thereafter, cells were switched to serum-free medium for 24 h. For cell stimulation and treatment, the old medium was removed and replaced with medium containing 1.5 mM H2O2 (Sigma-Aldrich, St. Louis, MO, USA) and CeO2NPs (10 µg/mL) or vehicle (TMAOH, 0.17 mM), respectively. In preliminary experiments we observed that concentrations of CeO2NPs higher than 20 µg/mL may result in a significant diminution of cell viability. On the other hand, the concentration of H2O2 was selected based on preliminary experiments showing that 60 min after H2O2 loading the 1.5 mM dose resulted in a maximal effect on DCFH concentration without affecting cell survival. Higher concentrations of H2O2, however, resulted in a dramatic decrease in survival. Cells were incubated for the indicated time points and then harvested for biochemical or molecular assays. All experiments were repeated at least three times.
Cell viability analysis: Cell viability was determined using MTS methodology (CellTiter 96; Promega, Madison, WI, USA) according to the manufacturer’s instructions. In brief, cells were seeded (1 × 10⁵ cells/well) in 96-well plates and treated with H2O2 or LPS (10 µg/mL) and CeO2NPs as described above. Cells were washed with Hank’s Balanced Salt Solution (HBSS), and CellTiter reagent was added to each well. After incubation for 3 h at 37 °C to allow cells to bioreduce MTS into formazan, the absorbance of the formazan was measured with a spectrophotometer (FLUOstar OPTIMA; BMG LABTECH, Ortenberg, Germany) at 492 nm. The quantity of formazan is directly proportional to the number of living cells in culture.
ROS measurement: Fluorescence spectrophotometry was used to measure ROS, with 2’,7’-DCF-DA as the probe (Master Probes, Invitrogen Labs, Thermo Fisher Scientific, Waltham, MA, USA). DCF-DA readily diffuses through the membrane and is enzymatically hydrolyzed by intracellular esterases to the nonfluorescent DCFH, which can then be rapidly oxidized to fluorescent DCF in the presence of ROS. Cells incubated alone or treated with H2O2 or LPS in the presence of CeO2NPs or vehicle were washed with HBSS and incubated with 10 μM DCF-DA in DMEM for 40 min at 37 °C in the dark. The cells were trypsinized and diluted followed by staining with 0.02% trypan blue. The number of cells stained with trypan blue was counted under a light microscope. The supernatant was collected to measure ROS production, and the intensity of fluorescence was immediately read in a fluorescence spectrophotometer (FLUOstar OPTIMA; BMG LABTECH, Ortenberg, Germany) at 485 nm for excitation and at 520 nm for emission. Additionally, in these experiments we also measured GSH concentration. GSH was determined using the Abcam Inc. detection assay kit (ab138881) (Abcam, Cambridge, UK) according to the manufacturer’s guidelines. The samples were prepared by lysis of total cell proteins in PBS/0.5% NP-40 lysis buffer followed by a 1:50 dilution. Serial dilutions of GSH standards were prepared along with assay mixtures for the detection of GSH using 100× Thiol green solution, incubated for 30 min and read at 490/520 nm.
mRNA expression of inflammatory genes in cultured cells: HepG2 cells were seeded (8 × 10⁵ cells per well) in 12-well plates and incubated alone or treated with H2O2 in the presence of CeO2NPs (10 μg/mL) or vehicle for 6 and 24 h. Total RNA from cultured cells was extracted using the commercially available kit: TRIZOL (TRI Reagent; Sigma-Aldrich, St. Louis, MO, USA). The RNA concentration was determined using spectrophotometric analysis (ND-100 spectrophotometer; Thermo Fisher Scientific, Waltham, MA, USA). One microgram of total RNA was reverse-transcribed using a cDNA synthesis kit (High-Capacity cDNA Reverse Transcription Kit; Applied Biosystems, Foster City, CA, USA). Primers and probes for human TNFα (left: 5’-CGCTCCCCAAGAAGACAG-3’, right: 5’-CTGCCACGATCAGGAAGG-3’; probe number 73), inducible nitric oxide synthase (iNOS) (left: 5’-TGCATGGATAAGTACAGGCTGA-3, right: 5’-CCATTGCCAAACGTACTGGT-3’; probe number 66), myeloperoxidase (MPO) (left: 5’-CGTCAACTGCGAGACCAG-3’, right: 5’-GTCATTGGGCGGGATCTT-3’; probe number 66), prostaglandin-endoperoxide synthase 1 (PTGS1) (left: 5’-TTCTCTCGCCAGATTGCTG-3’, right: 5’-CCGAGACTCCCTGATGACA-3’; probe number 76) and hypoxanthine-guanine phosphoribosyltransferase (HPRT) used as an endogenous standard (left: 5’-TGACCTTGATTTATTTTGCATACC-3’, right: 5’-CGAGCAAGACGTTCAGTCCT-3’; probe number 73) were designed according to human TNFα, iNOS, MPO, PTGS1 and HPRT sequences (GenBank NM_000594.2, NM_000625.4, NM_000250.1, NM_16931.3, NM_000962.2 and NM_000194.2, respectively) to include intron spanning using the Universal ProbeLibrary Assay Design Center through ProbeFinder version 2.5 software (Roche Diagnostics, Indianapolis, IN, USA; Available online: http://lifescience.roche.com/shop/en/mx/overviews/brand/universal-probe-library). Real-time quantitative polymerase chain reaction was analyzed in duplicate and performed with the LightCycler 480 (Roche Diagnostics, Basel, Switzerland), as previously described [46,47]. A 10-µL total volume reaction of diluted 1:8 cDNA, 200 nM primer dilution, 100 nM prevalidated 9-mer probe (Universal ProbeLibrary) and FastStart TaqMan Probe Master (Roche Diagnostics, Basel, Switzerland) were used in each PCR. A fluorescence signal was captured during each of the 45 cycles (denaturizing for 10 s at 95 °C, annealing for 20 s at 60 °C, and extension for 1 s at 72 °C). Water was used as a negative control. Relative quantification was calculated using the comparative threshold cycle (CT), which is inversely related to the abundance of mRNA transcripts in the initial sample. The mean CT of duplicate measurements was used to calculate ΔCT as the difference in CT for target and reference. The relative quantity of product was expressed as fold induction of the target gene compared with the reference gene according to the formula 2−ΔΔCT, where ΔΔCT represents ΔCT values normalized with the mean ΔCT of control samples.

4.3. Oxidative Stress Gene Expression PCR Array in Cultured Cells

HepG2 cells were seeded (8 × 10⁵ cells per well) in 12-well plates and incubated alone or treated with H2O2 in the presence of CeO2NPs (10 μg/mL) or vehicle for 24 h to assess changes in oxidative stress pathways. Total RNA was extracted using TRIZOL as described above. To remove residual DNA, RNA preparations were treated with RNase-Free DNAse set (Qiagen, Hilden, Germany). First-strand cDNA was synthesized from 1 μg total RNA using an RT2 first-strand kit (Qiagen, Hilden, Germany), and PCR arrays were performed according to the manufacturer’s protocols (SABiosciences, Frederick, MD, USA). Real-time PCR array was performed using the Human Oxidative Stress RT2 Profiler™ PCR array, (SABiosciences, Frederick, MD, USA) according to the manufacturer’s protocol. This PCR array combines the quantitative performance of SYBR Green-based real-time PCR with the multiple gene profiling capabilities of microarray to profile the expression of 84 key genes involved in oxidative stress. PCR array plates were processed in a Light Cycler 480 (Roche Diagnostics, Basel, Switzerland) using automated baseline and threshold cycle detection. Gene expression was normalized to internal controls to determine the fold change in gene expression between test and control samples. The relative quantity of product was expressed as fold-induction of the target gene compared with the reference gene according to the formula 2−ΔΔCT. Data were interpreted using the SABiosciences’ web-based PCR array data analysis tool. Statistical significance was obtained after performing a Student’s t-test analysis compared to control samples (Available online: http://pcrdataanalysis.sabiosciences.com/pcr/ arrayanalysis.php).

4.4. Statistical Analysis

Quantitative data were analyzed using GraphPad Prism 5 (GraphPad Software Inc., San Diego, CA, USA), and statistical analysis of the results was performed using one-way analysis of variance (ANOVA) with the Newman-Keuls post hoc test and the Kruskal-Wallis test with the Dunn post hoc test when appropriate. Results are expressed as mean ± SE and considered significant at a p level less than 0.05. The study was performed according to the criteria of the Investigation and Ethics Committee of the Hospital Clínic Universitari of Barcelona.

4.5. Phosphoproteomic Analysis

Large-scale phosphoproteomics was used to gain further insight on the kinase signaling pathways mainly affected by the CeO2NPs treatment. Thousands of phosphorylation sites were simultaneously quantified to estimate changes in kinase activity induced by CeO2NPs in HepG2 cells under oxidation-induced conditions. HepG2 cells were cultured as described above. Thereafter, the cells were switched to serum free medium for 24 h. Then medium was replaced and the cells were exposed to 1.5 mM H2O2 (Sigma-Aldrich, St. Louis, MO, USA), 1.5 mM H2O2 and 10 µg/mL CeO2NPs or vehicle (TMAOH, 0.17 mM) for 1 h. Confluent cells were washed three times with cold PBS supplemented with 1 mM Na3VO4 and 1 mM NaF and lysed in urea buffer (8 M urea in 20 mM HEPES, pH: 8.0, supplemented with 1 mM Na3VO4, 1 mM NaF, 1 mM Na4P2O7 and 1 mM β-glycerophophate). Five independent biological replicates were collected for each condition and kept at −80 °C. Cell lysates were further homogenized by sonication (30 cycles of 30 s on 30 s off; Diagenode Bioruptor® Plus, Liege, Belgium) and insoluble material was removed by centrifugation. Protein was quantified using BCA (Thermo Fisher Scientific, Waltham, MA, USA). For tryptic digestion, protein extracts (500 μg) were subjected to cysteine alkylation using sequential incubation with 10 mM dithiothreitol (DDT) and 16.6 mM iodoacetamide (IAM) for 1 h and 30 min respectively at 25 °C and agitation. The urea concentration was then reduced to 2 M by the addition of 20 mM HEPES (pH: 8.0). Then, 100μL of equilibrated trypsin beads ((50% slurry of TLCK-trypsin (Thermo-Fisher Scientific; Cat. #20230, Waltham, MA, USA) were added, and samples were incubated overnight at 37 °C. Trypsin beads were equilibrated by 3 washes with 20 mM HEPES (pH: 8.0). Trypsin beads were removed by centrifugation and the resulting peptide solutions were desalted with C-18-Oasis cartridges as indicated by the manufacturer. Briefly, oasis cartridges were conditioned with 1 mL acetonitrile (ACN) and equilibrated with 2.5 mL of wash solution (0.1% trifluoroacetic acid (TFA) and 2% ACN). Peptides were loaded in the cartridges and washed with 1 mL of wash solution. Finally, peptides were eluted with 0.5 mL of glycolic acid buffer 1 (1 M glycolic acid, 5% TFA, 50 % ACN). Enrichment of phosphorylated peptides was performed with TiO2. The eluents were normalized to 1 mL with glycolic acid buffer 2 (1 M glycolic acid, 5% TFA, 80 % ACN) and incubated with 50 µl of TiO2 buffer (a 50% slurry in 1% TFA) for 5 min at room temperature. TiO2 beads were packed by centrifugation in empty spin columns (Gygen Corporation; Cat. TT2EMT) previously equilibrated using glycolic acid, 50% ACN and ammonium bicarbonate buffer (20 mM NH4HCO3 (pH: 6.8) in 50% ACN). For phosphopeptide elution, beads were incubated for 1 min at room temperature with 50 µL of 5% NH4OH in 50% ACN and centrifuged. This step was repeated three times. Finally, samples were snap frozen, dried in a SpeedVac, and the pellets were stored at −80 °C.
Phosphopetide pellets were resuspended in 9 µL of reconstitution buffer (20 fmol/µL enolase in 3% ACN, 0.1% TFA) and 5.0 µL were loaded onto an LC-MS/MS system consisting of a Dionex UltiMate 3000 RSLC directly coupled to an Orbitrap Q-Exactive Plus mass spectrometer (Thermo Fisher Scientific, Waltham, MA, USA). Phosphopeptides were loaded in a μ-pre-column (Acclaim™ PepMap™ 100 C18 LC; Cat 160454, Thermo Fisher Scientific, Waltham, MA, USA) and separated in an analytical column (Acclaim™ PepMap™ 100 C18 LC; Cat. 164569, Thermo Fisher Scientific, Waltham, MA, USA) using a gradient that runs from 3% to 23% B over 120 min. The UPLC system delivered a flow of 2 µL/min (loading) and 300 nL/min (gradient elution). Solvent A consists of 3% ACN: 0.1% FA and solvent B consists of 100% ACN; 0.1% FA. The Q-Exactive Plus acquired full scan survey spectra (m/z 375–1500) with a 70,000 FWHM resolution followed by data-dependent acquisition in which the 20 most intense ions were selected for HCD (higher energy collisional dissociation) and MS/MS scanning (200–2000 m/z) with a resolution of 17,500 FWHM.
Peptide identification was performed by matching of the MS/MS data to the SwissProt database, restricted to human entries with the Mascot search engine [48]. Phosphopeptides with a mascot expectancy of < 0.005 (~2% false discovery rate) were included in a database of sites quantifiable by MS. Pascal software [49,50,51] was then used to obtain peak areas of extracted ions chromatograms of phosphorylated peptides in this database across all the samples compared. The significance of the differences in the log2-transformed data across samples was assessed using the Student’s t-test. Inference of kinase activities from the phosphoproteomic data was performed using kinase substrate enrichment analysis (KSEA), as described previously [18].

5. Conclusions

Our study shows that CeO2NPs directly protect human-derived hepatocytes from oxidative damage, reducing ROS generation and inflammatory gene expression, thus opening new avenues to use CeO2NPs in human liver diseases. Additionally, specific cell kinase driven signaling pathways downregulated by CeO2NPs treatment in cells under oxidative stress have been identified for the first time. Further experiments with appropriate inhibitors are needed to demonstrate a direct cause-effect relationship between CeO2NPs and the modulation of mTOR, ERK and PKACA pathways. Moreover, additional in vivo validations are necessary to determine the potential clinical applications of these findings.

Author Contributions

conceptualization, S.C., D.O., G.C., G.F.-V., M.M.-R., P.C. (Pedro Cutillas)and W.J.; methodology, S.C., M.P., D.O., E.C., J.R., P.M.-L. and P.C. (Pedro Casado); formal analysis, S.C., M.P., D.O. and P.C. (Pedro Casado); data curation, S.C., M.P., D.O. and P.C. (Pedro Casado); writing—original draft preparation, S.C., D.O. and W.J.; writing—review and editing, S.C., G.C., D.O., E.C., P.C. (Pedro Cutillas), G.F.-V., V.P. and W.J.; supervision, G.C. and W.J.; funding acquisition, G.C., V.P and W.J.

Funding

This research was funded by grants to W. Jiménez from Ministerio de Economia y Competitividad [grants, SAF2015-64126-R, RTI2018-094734-B-C21], to M. Morales-Ruiz [grant SAF2016-75358-R] and to G. Casals [grant PI-15/00777]; cofinanced by FEDER, European Union, a way of making Europe, Agència de Gestió d’Ajuts Universitaris i de Recerca [grant SGR 2014/219]; and Fundació La Marató de TV3 [grant Marató 120930]; Wuyi University Funding for Hight Talents Introduction, grant number 2018TP010 and Foundation from Department of Education of Guangdong Province, grant number 2016KCXTD005 and 2017KSYS010, to Eudald Casals The Centro de Investigación Biomédica en Red de Enfermedades Hepáticas y Digestivas (CIBERehd) is funded by the Instituto de Salud Carlos III.

Conflicts of Interest

The authors declare no conflicts of interest.

Abbreviations

2’,7’-DCF-DA2′,7′-dichlorofluorescin diacetate
CeO2NPsCerium Oxide Nanoparticles
DDTDithiothreitol
DMEMDulbecco’s Modified Eagle Medium
FCSFetal Calf Serum
HBSSHank’s Balanced Salt Solution
HCCHepatocellular Carcinoma
HCDHigher Energy Collisional Dissociation
HR-TEMHigh Resolution Transmission Electron Microscopy
KSEAKinase-Substrate Enrichment Analysis
LC-MS/MSLiquid Chromatography Tandem Mass Spectrometry
LPSLipopolysaccharide
MSMass Spectrometry
MS/MSTandem mass spectrometry
NPsNanoparticles
PCRPolymerase Chain Reaction
ROSRadical Oxygen Species
RT-PCRReal Time PCR
SODSuperoxide Dismutase
UPLCUltrahigh Pressure Liquid Chromatography
UV-VISUltraviolet-Visible
XRDX-ray Diffraction

References

  1. Laviña, B.; Gracia-Sancho, J.; Rodríguez-Vilarrupla, A.; Chu, Y.; Heistad, D.D.; Bosch, J.; García-Pagán, J.C. Superoxide dismutase gene transfer reduces portal pressure in CCl4 cirrhotic rats with portal hypertension. Gut 2009, 58, 118–125. [Google Scholar] [CrossRef] [PubMed]
  2. Ma, Z.; Zhang, Y.; Li, Q.; Xu, M.; Bai, J.; Wu, S. Resveratrol improves alcoholic fatty liver disease by downregulating HIF-1α expression and mitochondrial ROS production. PLoS ONE 2017, 12, e0183426. [Google Scholar] [CrossRef] [PubMed]
  3. Rojkind, M.; Kershenobich, D. Effect of colchicine on collagen, albumin and transferrin synthesis by cirrhotic rat liver slices. Biochim. Biophys. Acta 1975, 378, 415–423. [Google Scholar] [CrossRef]
  4. Yogalakshmi, B.; Viswanathan, P.; Anuradha, C.V. Investigation of antioxidant, anti-inflammatory and DNA-protective properties of eugenol in thioacetamide-induced liver injury in rats. Toxicology 2010, 268, 204–212. [Google Scholar] [CrossRef] [PubMed]
  5. Houglum, K.; Venkataramani, A.; Lyche, K.; Chojkier, M. A pilot study of the effects of d-alphatocopherol on hepatic stellate cell activation in chronic hepatitis C. Gastroenterology 1997, 113, 1069–1073. [Google Scholar] [CrossRef]
  6. Singal, A.K.; Jampana, S.C.; Weinman, S.A. Antioxidants as therapeutic agents for liver disease. Liver Int. 2011, 31, 1432–1448. [Google Scholar] [CrossRef]
  7. Chalasani, N.; Younossi, Z.; Lavine, J.E.; Charlton, M.; Cusi, K.; Rinella, M.; Harrison, S.A.; Brunt, E.M.; Sanyal, A.J. The diagnosis and management of nonalcoholic fatty liver disease: Practice guidance from the American Association for the Study of Liver Diseases. Hepatology 2017, 67, 328–357. [Google Scholar] [CrossRef]
  8. European Association for the Study of the Liver (EASL); European Association for the Study of Diabetes (EASD); European Association for the Study of Obesity (EASO). EASL–EASD–EASO Clinical Practice Guidelines for the management of non-alcoholic fatty liver disease. J. Hepatol. 2016, 64, 1388–1402. [Google Scholar] [CrossRef]
  9. Wason, M.S.; Zhao, J. Cerium oxide nanoparticles: Potential applications for cancer and other diseases. Am. J. Transl Res. 2013, 5, 126–131. [Google Scholar]
  10. Heckert, E.G.; Karakoti, A.S.; Seal, S.; Self, W.T. The role of cerium redox state in the SOD mimetic activity of nanoceria. Biomaterials 2008, 29, 2705–2709. [Google Scholar] [CrossRef]
  11. Barkam, S.; Ortiz, J.; Saraf, S.; Eliason, N.; Mccormack, R.; Das, S.; Gupta, A.; Neal, C.; Petrovici, A.O.; Hanson, C.; et al. Modulating the Catalytic Activity of Cerium Oxide Nanoparticles with the Anion of the Precursor Salt. J. Phys. Chem. C 2017, 121, 20039–20050. [Google Scholar] [CrossRef]
  12. Oró, D.; Yudina, T.; Fernández-Varo, G.; Casals, E.; Reichenbach, V.; Casals, G.; de la Presa, B.G.; Sandalinas, S.; Carvajal, S.; Puntes, V.; et al. Cerium oxide nanoparticles reduce steatosis, portal hypertension and display anti-inflammatory properties in rats with liver fibrosis. J. Hepatol. 2016, 64, 691–698. [Google Scholar] [CrossRef]
  13. Carvajal, S.; Perramón, M.; Oró, D.; Casals, E.; Fernández-Varo, G.; Casals, G.; Parra, M.; de la Presa, B.G.; Ribera, J.; Pastor, Ó.; et al. Cerium oxide nanoparticles display antilipogenic effect in rats with non-alcoholic fatty liver disease. Sci. Rep. 2019, 9, 12848. [Google Scholar] [CrossRef] [PubMed]
  14. Xu, C.; Qu, X. Cerium oxide nanoparticle: A remarkably versatile rare earth nanomaterial for biological applications. NPG Asia Mater. 2014, 6, e90. [Google Scholar] [CrossRef]
  15. Raza, H.; John, A.; Benedict, S. Acetylsalicylic acid-induced oxidative stress, cell cycle arrest, apoptosis and mitochondrial dysfunction in human hepatoma HepG2 cells. Eur. J. Pharm. 2011, 668, 15–24. [Google Scholar] [CrossRef]
  16. Melgar-Lesmes, P.; Pauta, M.; Reichenbach, V.; Casals, G.; Ros, J.; Bataller, R.; Morales-Ruiz, M.; Jiménez, W. Hypoxia and proinflammatory factors upregulate apelin receptor expression in human stellate cells and hepatocytes. Gut 2011, 60, 1404–1411. [Google Scholar] [CrossRef]
  17. Casals, E.; Pfaller, T.; Duschl, A.; Oostingh, G.J.; Puntes, V.F. Hardening of the nanoparticle-protein corona in metal (Au, Ag) and oxide (Fe3O4, CoO, and CeO2) nanoparticles. Small 2011, 7, 3479–3486. [Google Scholar] [CrossRef]
  18. Casado, P.; Rodriguez-Prados, J.C.; Cosulich, S.C.; Guichard, S.; Vanhaesebroeck, B.; Joel, S.; Cutillas, P.R. Kinase-Substrate Enrichment Analysis provides insights into the heterogeneity of signaling pathway activation in leukemia cells. Sci. Signal. 2012, 6, 268. [Google Scholar] [CrossRef]
  19. Angulo-Urarte, A.; Casado, P.; Castillo, S.D.; Kobialka, P.; Kotini, M.P.; Figueiredo, A.M.; Castel, P.; Rajeeve, V.; Milà-Guasch, M.; Millan, J.; et al. Endothelial cell rearrangements during vascular patterning require PI3-kinase-mediated inhibition of actomyosin contractility. Nat. Commun. 2018, 9, 4826–4842. [Google Scholar] [CrossRef]
  20. Niu, J.; Wang, K.; Kolattukudy, P.E. Cerium oxide nanoparticles inhibit oxidative stress and nuclear factor-κB activation in H9c2 cardiomyocytes exposed to cigarette smoke extract. J. Pharm. Exp. Ther. 2011, 338, 53–61. [Google Scholar] [CrossRef]
  21. Akhtar, M.J.; Ahamed, M.; Alhadlaq, H.A.; Khan, M.A.; Alrokayan, S.A. Glutathione replenishing potential of CeO2 nanoparticles in human breast and fibrosarcoma cells. J. Colloid Interface Sci. 2015, 453, 21–27. [Google Scholar] [CrossRef] [PubMed]
  22. Chen, S.; Hou, Y.; Cheng, G.; Zhang, C.; Wang, S.; Zhang, J. Cerium oxide nanoparticles protect endothelial cells from apoptosis induced by oxidative stress. Biol. Trace Elem. Res. 2013, 154, 156–166. [Google Scholar] [CrossRef] [PubMed]
  23. Xia, T.; Kovochich, M.; Liong, M.; Mädler, L.; Gilbert, B.; Shi, H.; Yeh, J.I.; Zink, J.I.; Nel, A.E. Comparison of the mechanism of toxicity of zinc oxide and cerium oxide nanoparticles based on dissolution and oxidative stress properties. ACS Nano 2008, 2, 2121–2134. [Google Scholar] [CrossRef] [PubMed]
  24. Korsvik, C.; Patil, S.; Seal, S.; Self, W.T. Superoxide dismutase mimetic properties exhibited by vacancy engineered ceria nanoparticles. Chem. Commun. 2007, 1056–1058. [Google Scholar] [CrossRef] [PubMed]
  25. Pirmohamed, T.; Dowding, J.M.; Singh, S.; Wasserman, B.; Heckert, E.; Karakoti, A.S.; King, J.E.; Seal, S.; Self, W.T. Nanoceria exhibit redox state-dependent catalase mimetic activity. Chem. Commun. 2010, 46, 2736–2738. [Google Scholar] [CrossRef] [PubMed]
  26. Nelson, B.C.; Walker, M.L.; Riley, K.R.; Sims, C.M. Antioxidant Cerium Oxide Nanoparticles in Biology and Medicine. Antioxidants 2016, 5, 15. [Google Scholar] [CrossRef]
  27. Cichoz-Lach, H.; Michalak, A. Oxidative stress as a crucial factor in liver diseases. World J. Gastroenterol. 2014, 20, 8082–8091. [Google Scholar] [CrossRef]
  28. Zhao, G.; Yu, R.; Deng, J.; Zhao, Q.; Li, Y.; Joo, M.; van Breemen, R.B.; Christman, J.W.; Xiol, L. Pivotal role of reactive oxygen species in differential regulation of lipopolysaccharide-induced prostaglandins production in macrophages. Mol. Pharm. 2013, 83, 167–178. [Google Scholar] [CrossRef]
  29. Pflüger, P.; Viau, C.M.; Coelho, V.R.; Berwig, N.A.; Staub, R.B.; Pereira, P.; Saffi, J. Gamma-decanolactone inhibits iNOS and TNF-alpha production by lipopolysaccharide-activated microglia in N9 cells. Eur. J. Pharm. 2016, 780, 38–45. [Google Scholar] [CrossRef]
  30. Pulli, B.; Ali, M.; Iwamoto, Y.; Zeller, M.W.; Schob, S.; Linnoila, J.J.; Chen, J.W. Mieloperoxidase-hepatocyte-stellate cell cross talk promotes hepatocyte injury and fibrosis in experimental nonalcoholic steatohepatitis. Antioxid. Redox Signal. 2015, 23, 1255–1269. [Google Scholar] [CrossRef]
  31. Rensen, S.S.; Slaats, Y.; Nijhuis, J.; Jans, A.; Bieghs, V.; Driessen, A.; Malle, E.; Greve, J.W.; Buurman, W.A. Increased hepatic myeloperoxidase activity in obese subjects with nonalcoholic steatohepatitis. Am. J. Pathol. 2009, 175, 1473–1482. [Google Scholar] [CrossRef] [PubMed]
  32. Langenbach, R.; Morham, S.G.; Tiano, H.F.; Loftin, C.D.; Ghanayem, B.I.; Chulada, P.C.; Mahler, J.F.; Lee, C.A.; Goulding, E.H.; Kluckman, K.D.; et al. Prostaglandin synthase 1 gene disruption in mice reduces arachidonic acid-induced inflammation and indomethacin-induced gastric ulceration. Cell 1995, 83, 483–492. [Google Scholar] [CrossRef] [Green Version]
  33. Choi, H.S.; Bosetti, F. Cyclooxygenase-1 null mice show reduced neuroinflammation in response to β-amyloid. Aging 2009, 1, 234–244. [Google Scholar] [CrossRef] [PubMed]
  34. Förstermann, U.; Sessa, W.C. Nitric oxide synthases: Regulation and function. Eur. Heart J. 2012, 33, 829–837. [Google Scholar] [CrossRef] [PubMed] [Green Version]
  35. Wu, F.; Tyml, K.; Wilson, J.X. iNOS expression requires NADPH oxidase-dependent redox signaling in microvascular endothelial cells. J. Cell Physiol. 2008, 217, 207–214. [Google Scholar] [CrossRef] [PubMed] [Green Version]
  36. Pawson, T.; Linding, R. Network medicine. FEBS Lett. 2008, 582, 1266–1270. [Google Scholar] [CrossRef] [Green Version]
  37. Linding, R.; Jensen, L.J.; Ostheimer, G.J.; Van Vugt, M.A.; Jørgensen, C.; Miron, M.I.; Diella, F.; Colwill, K.; Taylor, L.; Elder, K.; et al. Systematic discovery of in vivo phosphorylation networks. Cell 2007, 129, 1415–1426. [Google Scholar] [CrossRef] [Green Version]
  38. Schwartz, D.; Gygi, S.P. An iterative statistical approach to the identification of protein phosphorylation motifs from large-scale data sets. Nat. Biotechnol. 2005, 23, 1391–1398. [Google Scholar] [CrossRef]
  39. Kim, H.; Yoo, J.E.; Cho, J.Y.; Oh, B.K.; Yoon, Y.S.; Han, H.S.; Lee, H.S.; Jang, J.J.; Jeong, S.H.; Kim, J.W.; et al. Telomere length; TERT and shelterin complex proteins in hepatocellular carcinomas expressing “stemness”-related markers. J. Hepatol. 2013, 59, 746–752. [Google Scholar] [CrossRef]
  40. Oh, B.K.; Kim, Y.J.; Park, C.; Park, Y.N. Up-regulation of telomere-binding proteins; TRF1; TRF2; and TIN2 is related to telomere shortening during human multistep hepatocarcinogenesis. Am. J. Pathol. 2005, 166, 73–80. [Google Scholar] [CrossRef] [Green Version]
  41. Gu, D.L.; Chen, Y.H.; Shih, J.H.; Lin, C.H.; Jou, Y.S.; Chen, C.F. Target genes discovery through copy number alteration analysis in human hepatocellular carcinoma. World J. Gastroenterol. 2013, 19, 8873–8879. [Google Scholar] [CrossRef] [PubMed]
  42. Sun, X.; Wang, S.C.; Wei, Y.; Luo, X.; Jia, Y.; Li, L.; Gopal, P.; Zhu, M.; Nassour, I.; Chuang, J.C.; et al. Arid1a has context-dependent oncogenic and tumor suppressor functions in liver cancer. Cancer Cell 2017, 32, 574–589. [Google Scholar] [CrossRef] [PubMed] [Green Version]
  43. Gaiser, B.K.; Fernandes, T.F.; Jepson, M.A.; Lead, J.R.; Tyler, C.R.; Baalousha, M.; Biswas, A.; Britton, G.J.; Cole, P.A.; Johnston, B.D.; et al. Interspecies comparisons on the uptake and toxicity of silver and cerium dioxide nanoparticles. Environ. Toxicol. Chem. 2012, 31, 144–154. [Google Scholar] [CrossRef] [PubMed]
  44. Singh, R.; Singh, S. Redox-dependent catalase mimetic cerium oxide-based nanozyme protect human hepatic cells from 3-AT induced acatalasemia. Colloids Surf. B Biointerfaces 2019, 175, 625–635. [Google Scholar] [CrossRef] [PubMed]
  45. Ni, D.; Wei, H.; Chen, W.; Bao, Q.; Rosenkrans, Z.T.; Barnhart, T.E.; Ferreira, C.A.; Wang, Y.; Yao, H.; Sun, T.; et al. Ceria Nanoparticles Meet Hepatic Ischemia-Reperfusion Injury: The Perfect Imperfection. Adv. Mater. 2019, 31, e1902956. [Google Scholar] [CrossRef]
  46. Reichenbach, V.; Ros, J.; Fernández-Varo, G.; Casals, G.; Melgar-Lesmes, P.; Campos, T.; Makriyannis, A.; Morales-Ruiz, M.; Jiménez, W. Prevention of fibrosis progression in CCl4-treated rats: Role of the hepatic endocannabinoid and apelin systems. J. Pharm. Exp. Ther. 2012, 340, 629–637. [Google Scholar] [CrossRef] [Green Version]
  47. Melgar-Lesmes, P.; Casals, G.; Pauta, M.; Ros, J.; Reichenbach, V.; Bataller, R.; Morales-Ruiz, M.; Jimenez, W. Apelin mediates the induction of profibrogenic genes in human hepatic stellate cells. Endocrinology 2010, 151, 5306–5314. [Google Scholar] [CrossRef] [Green Version]
  48. Perkins, D.N.; Pappin, D.J.; Creasy, D.M.; Cottrell, J.S. Probability-based protein identification by searching sequence database using mass spectrometry data. Electrophoresis 1999, 20, 3551–3567. [Google Scholar] [CrossRef]
  49. Casado, P.; Cutillas, P.R. A self-validating quantitative mass spectrometry method for assessing the accuracy of high-content phosphoproteomic experiments. Mol. Cell. Proteom. 2011, 10, M110.003079. [Google Scholar] [CrossRef] [Green Version]
  50. Cutillas, P.R.; Venhaesebroeck, B. Quantitative profile of five murine core proteomes using label-free functional proteomics. Mol. Cell. Proteom. 2007, 6, 1560–1573. [Google Scholar] [CrossRef] [Green Version]
  51. Casado, P.; Bilanges, B.; Rajeeve, V.; Vanhaesebroeck, B.; Cutillas, P.R. Environmental stress affects the activity of metabolic and growth factor signaling networks and induces autophagy markers in MCF7 breast cancer cells. Mol. Cell. Proteom. 2014, 13, 836–848. [Google Scholar] [CrossRef] [PubMed] [Green Version]
Figure 1. Characterization of the CeO2NPs used in this work. (A) NPs after purification and resuspension in Tetramethylammonium hydroxide (TMAOH) 10 mM. Scale bar is 50 nm. (B) NPs after 2 days in Cell Culture Medium (CCM), Dulbecco’s Modified Eagle Medium (DMEM) + 10% Fetal Calf Serum (FCS). Scale bar is 50 nm. Although TEM images of the NPs in the CCM are not as clear as in TMAOH, due to the presence of other components of the media, NPs can still be observed and measured. (C) Evolution of the UV-VIS spectra of CeO2NPs in the CCM. NPs are stable throughout the time of the experiments and presence of large agglomerates can be ruled out since those agglomerates would increase the absorbance at larger wavelengths. (D) and (E) Size distribution using ImageJ free software (Available online: https://imagej.nih.gov/ij/) counting more than 500 NPs of different TEM images of the NPs in TMAOH and in CCM. A slight increase can be observed in the size distribution (standard deviation increases from 1.2 to 2.0) probably due to dissolution of NPs in the more aggressive media of the CCM. However, after 2 days, mean size is unaltered. (F) X-ray Diffraction (XRD) spectra of the CeO2NPs in TMAOH 10 mM showing the characteristic peaks of CeO2 crystals.
Ijms 20 05959 g001
Figure 2. CeO2NPs inhibited H2O2-induced cytotoxicity in HepG2 cells. (A) Viability of HepG2 cells after treatment with CeO2NPs (10 µg/mL) determined using the MTS assay (MTS) at indicated time points. Quadruplicates of each group were used in each independent experiment. The results are expressed as percentage of control cells for the times indicated. (B) HepG2 cells were exposed to 1.5 mM H2O2 and treated with 10 µg/mL of CeO2NPs for 1.5 h. Cell viability was detected using MTS and expressed as percentage of control cells. Data are the mean ± S.E. of triplicate experiments. ** p < 0.01 vs. control. + presence; − absence. (C) Representative phase contrast light microscopy images of HepG2 cells at 1.5 h after H2O2 treatment. (D) Reactive oxygen species (ROS) production was determined by fluorescence spectrophotometry using the oxidant-sensitive dye 2’,7’-DCF-HDA. The results were expressed as percentage of control cells for the treatments indicated. *** p < 0.001 vs. control; †† p < 0.01 vs. H2O2. + presence; − absence. (E) Representative microphotographs of DFC fluorescence (DCF, green) and 4’,6-diamidino-2-phenylindole (DAPI, blue) after H2O2 treatment (original magnification, 200×).
Ijms 20 05959 g002
Figure 3. CeO2NPs reduced lipopolysaccharide (LPS)-induced ROS production and cytotoxicity in HepG2 cells. (A) Cells were treated with 10 µg/mL LPS for 2 h in the presence of CeO2NPs (10 µg/mL) or vehicle. Extracellular ROS production was determined by fluorescence spectrophotometry using the oxidant-sensitive dye 2’,7’-DCF-DA. The results were expressed as percentage of control cells for the indicated treatments. Data are mean ± S.E. *** p < 0.001. (B) HepG2 cells were exposed to 10 µg/mL LPS and treated with 10 µg/mL CeO2NPs or vehicle for 24 h. Cell viability was detected using MTS and expressed as percentage of control cells. Data are the mean ± S.E, *** p < 0.001; + presence; − absence.
Ijms 20 05959 g003
Figure 4. A volcano plot representation of the differentially expressed genes in a pair-wise comparison of untreated and CeO2NP-treated H2O2-exposed HepG2 cells. Significance was set to a p value based on a Student’s t-test of 0.05 [−log10 (p-value) ≥ 1.30], the biological cut-off was set to a fold regulation of ± 2 fold [−1 ≥ log2 (FC of H2O2+CeO2NPs/H2O2) ≥ 1]. In accordance with these two criteria, the top seven deferentially expressed genes are labeled with their corresponding gene ID. The different color codes used represent insignificant genes (grey), both biologically and statistically significant down-regulated genes (green) and statistically but not biologically significant down-regulated genes (orange) in CeO2NP treated cells.
Ijms 20 05959 g004
Figure 5. Effect of CeO2NPs on the expression of oxidative stress-related genes in HepG2 cells exposed to H2O2. Cells were stimulated with 1.5 mM H2O2 for 24 h and incubated in the absence or presence of CeO2NPs (10 µg/mL). The messenger RNA expression of MPO and PTGS1 was assessed using real-time PCR. Data are the mean + S.E. of triplicate experiments. * p < 0.05; ** p < 0.01 vs. control; †† p < 0.01 vs. H2O2.
Ijms 20 05959 g005
Figure 6. Effect of CeO2NPs on the expression of pro-inflammatory genes in HepG2 cells exposed to H2O2. Cells were stimulated with 1.5 mM H2O2 for 6 and 24 h and incubated in the absence or presence of CeO2NPs (10 µg/mL). The messenger RNA expression of iNOS and TNF-α was then assessed using real-time PCR. Data are the mean ± S.E. of triplicate experiments. * p < 0.05; ** p < 0.01; *** p < 0.001.
Ijms 20 05959 g006
Figure 7. Effect of CeO2NPs on the modulation of kinase activity in HepG2 cells exposed to H2O2. (A) Volcano plot showing the fold difference between H2O2-exposed HepG2 cells treated or not with CeO2NPs for 1 h. Fold difference in peptide abundance is represented as the log2 (a positive value for the log2 of the fold difference indicates the increased abundance of a phosphorylated peptide after CeO2NPs treatment) and p value as −log10 (a significance −log10 p value > 2 corresponds to a linear p value of < 0.01). (B) Heatmap showing the enrichment of substrate groups for the different kinases calculated by the KSEA algorithm with the PhosphoSite database and the z-score method of calculating enrichment. The extent of enrichment was calculated as the abundance of substrate phosphorylation peptide in HepG2 cells under one condition divided by its abundance in another condition. Specifically, the first column shows the result of KSEA for cells exposed to H2O2 vs. control cells treated with vehicle, the second column shows KSEA of cells exposed to H2O2 and CeO2NPs vs. control treated with vehicle, and the third column shows KSEA of cells exposed to H2O2 and CeO2NPs vs. HepG2 exposed to H2O2. Column “q” indicates the number of phosphopeptides used to estimate the enrichment in kinase activity for the indicate kinase. An arbitrary cut-off value of 6 phosphopeptides has been used. (C) Heatmap showing phosphopeptides significantly affected by exposure of HepG2 cells to H2O2 and H2O2 + CeO2NPs in proteins linked to mTOR, ERK, CK2A1 and PKA signaling pathways. Statistical significant was assessed using t-test in (A,C) or z-test (B). * p < 0.05; ** p < 0.01; *** p < 0.001.
Ijms 20 05959 g007
Table 1. Dynamic light scattering (DLS) and Zeta potential (Z-Pot) values of CeO2NPs purified and resuspended in TMAOH 10 mM and after exposure to DMEM + 10% FCS (CCM). A decrease of the Z-Potential towards the value of the FCS (Z-Pot = −10 mV) and an increase of the hydrodynamic diameter due to the absorption of proteins can be observed. The increase of DLS and maintenance of size distribution observed by TEM images after 2 days in CCM is an indication of the stability of the NPs and the protein corona formation in the CCM.
CeO2NPs (TEM = 4–5 nm)
Table HeaderDLS (Z-average, nm)Z-Pot (mV)
NPs after purification
(in TMAOH 10 mM)
33.0−47.0
0 d in cCCM70−35.4
1 d in cCCM70−36.4
2 d in cCCM72.9−35.0
15 d in cCCM79−16.9
30 d in cCCM100.2−9.6
Table 2. Messenger expression of genes involved in oxidative stress and antioxidant defense in HepG2 cells exposed to H2O2.
GenesH2O2 (n = 5)H2O2 + CeO2NPs (n = 6)
Antioxidants
CAT−2.06 **−2.67 ***
GPX7−2.01 *−2.25 ***
LPO3.541.72
MPO5.32 *1.54 *†
TTN3.131.78
PTGS13.69 *1.07 †
SOD3−3.28 **−6.30 ***
SRNX13.99 **2.91 **
TXNRD13.07 *2.16
Genes involved in ROS metabolism
NCF12.59 *1.38 *
NCF21.11−1.89 †
UCP2−2.30 *−4.04 ***
EPHX2−3.51 ***−4.36 ***
Oxidative stress responsive genes
DCHR24−2.66 **−3.36 ***
DUSP18.30 *9.39 *
FOXM1−3.20 **−3.44 ***
GCLC3.29 ***3.42 ***
GCLM3.86 **2.30 *
HMOX12.683.15
HSPA1A5.28 *2.42
MBL2−3.32 *−2.6 **
OXR1−2.08 ***−2.64 ***
SCARA3−5.11 **−7.08 **
SEPP1−4.19 ***−4.41 ***
Oxygen transporters
MB−5.88 *−5.84 **
CAT: catalase; GPX7: glutathione peroxidase 7; LPO: lactoperoxidase; MPO: myeloperoxidase; TTN: titin; PTGS1: prostaglandin-endoperoxide synthase 1 (prostaglandin G/H synthase and cyclooxygenase); SOD3: superoxide dismutase 3; SRXN1: sulfiredoxin 1 homolog; TXNRD1: thioredoxin reductase 1; NCF1: neutrophil cytosolic factor 1; NCF2: neutrophil cytosolic factor 2; UCP2: uncoupling protein 2 (mitochondrial, proton carrier); EPHX2: epoxide hydrolase 2, cytoplasmic; DCHR24: 24-dehydrocholesterol reductase; DUSP1: dual specificity phosphatase 1; FOXM1: forkhead box M1; GCLC: glutamate-cysteine ligase, catalytic subunit; GCLM: glutamate cysteine ligase, modifier subunit; HMOX1: heme oxygenase (decycling) 1; HSPA1A: heat shock 70kDa protein 1A; MBL2: mannose-binding lectin (protein C) 2, soluble; OXR1: oxidation resistance 1; SCARA3: scavenger receptor class A, member 3; SEPP1: selenoprotein P, plasma, 1; MB: myoglobin. * p < 0.05, ** p < 0.01, *** p < 0.001 vs. control; † p < 0.05 vs. H2O2 + CeO2NPs (unpaired Student’s t-test).
Table 3. Phosphopeptides with significantly decreased phosphorylation with a Log2 fold ≤ −2 after treatment with CeO2NPs in HepG2 cells exposed to H2O2.
ProteinPhosphopeptideH2O2 vs Control. FoldH2O2 + NPs vs H2O2 Fold
AT-rich interactive domain-containing protein 1AARID1A seq: 1182–1202 + Phospho (ST)3.0099 *−2.727 *
Charged multivesicular body protein 2bCHMP2B pS1999.963 *−9.964 *
C-Jun-amino-terminal kinase-interacting protein 4SPAG9 seq: 223–241 + Phospho (ST)10.117 *−10.11 *
Deoxynucleotidyltransferase terminal-interacting protein 2DNTTIP2 pS14110.135 *−10.13 *
DNA replication licensing factor MCM3MCM3 seq: 696–724 + Gln- > pyro-Glu (N-term Q); Phospho (ST)8.390 *−8.391 *
DNA-dependent protein kinase catalytic subunitPRKDC seq: 3197–3232 + Phospho (ST)8.6913 *−8.692 *
Double-stranded RNA-binding protein Staufen homolog 1STAU1 pS3908.9250 *−8.926 *
E3 ubiquitin-protein ligase UBR5UBR5 seq: 636–654 + Phospho (ST)10.128 *−10.12 *
Eukaryotic translation initiation factor 4E-binding protein 1EIF4EBP1 pS65 pT7010.841 *−10.84 *
KanadaptinSLC4A1AP pS4669.2633 *−9.264 *
KanadaptinSLC4A1AP seq: 324–362 + Oxidation (M); Phospho (ST)9.164 *−9.165 *
MKL/myocardin-like protein 2MKL2 seq: 535–562 + Phospho (ST)9.971 *−9.973 *
Pericentriolar material 1 proteinPCM1 seq: 1923–1972 + Phospho (ST); Phospho (Y)10.677 *−10.67 *
Prolyl 3-hydroxylase OGFOD1OGFOD1 seq: 381–427 + Phospho (ST)9.012 *−9.013 *
Protein PRRC2APRRC2A seq: 1103–1128 + Gln- > pyro-Glu (N-term Q); Phospho (ST)9.2358 *−9.236 *
R3H domain-containing protein 1R3HDM1 seq: 295–314 + Phospho (ST)8.592 *−8.593 *
Ras-responsive element-binding protein 1RREB1 seq: 1636–1665 + Phospho (ST)9.296 *−9.297 *
Stress-70 protein. mitochondrialHSPA9 pM370 pM38911.353 *−11.35 *
Telomeric repeat-binding factor 2TERF2 seq: 404–447 + Phospho (ST)8.8833 *−8.884 *
Transcriptional coactivator YAP1YAP1 seq: 162–181 + Gln- > pyro-Glu (N-term Q); Phospho (ST)3.3580 *−5.372 *
Apoptotic chromatin condensation inducer in the nucleusACIN1 seq: 463–506 + 3 Phospho (ST)5.9139 *−11.89 **
PaxillinPXN seq: 298–317 + Phospho (ST)1.8510 *−2.535 **
Poly(rC)-binding protein 1PCBP1 pM186 pS1901.9716 *−2.646 **
Nascent polypeptide-associated complex subunit alphaNACA pS20291.284 *−3.119 **
RNA-binding protein 25RBM25 pS70311.804 *−4.246 **
Phosphoribosyl pyrophosphate synthase-associated protein 1PRPSAP1 seq: 193–220 + Oxidation (M); Phospho (ST)12.440 **−4.758 *
Serine/arginine repetitive matrix protein 2SRRM2 seq: 2275–2301 + Phospho (ST)9.8054 **−9.80 *
Cell division cycle protein 23 homologCDC23 pT5628.7452 **−8.746 **
Centrosomal protein of 131 kDaCEP131 seq: 45–56 + Phospho (ST)9.3197 **−9.320 **
Deoxynucleotidyltransferase terminal-interacting protein 2DNTTIP2 pS3819.412 **−9.41 **
Nuclear receptor coactivator 2NCOA2 pS7712.5932 **−2.630 **
Oxysterol-binding protein 1OSBP seq: 377–395 + 2 Phospho (ST)2.8700 **−2.558 **
RNA-binding motif protein. X chromosomeRBMX pS2089.8237 **−9.824 **
Transcription factor Sp5SP5 seq: 43–68 + Phospho (ST)4.5004 **−10.69 **
Uncharacterized protein C6orf106C6orf106 seq: 264–287 + Phospho (ST)8.2914 **−2.875 **
Epsin-1EPN1 seq: 412–445 + Phospho (ST)13.834 **−4.391 ***
PininPNN pS668.894 ***−4.875 *
Protein LYRICMTDH pS2988.390 ***−8.391 **
POU domain. class 2. transcription factor 1POU2F1 seq: 273–293 + Phospho (ST)8.691 ***−8.69 ***
Statistical significance was assessed using the t-test. *. p < 0.05; **. p < 0.01; ***. p < 0.001.

