Article

Effect of Trichoderma velutinum and Rhizoctonia solani on the Metabolome of Bean Plants (Phaseolus vulgaris L.)

by
Sara Mayo-Prieto
1,*,
Roberta Marra
2,
Francesco Vinale
3,
Álvaro Rodríguez-González
1,
Sheridan L. Woo
3,4,
Matteo Lorito
2,3,
Santiago Gutiérrez
5 and
Pedro A. Casquero
1
1
Grupo Universitario de Investigación en Ingeniería y Agricultura Sostenible (GUIIAS), Instituto de Medio Ambiente, Recursos Naturales y Biodiversidad, Universidad de León, Avenida Portugal 41, 24071 León, Spain
2
Dipartimento di Agraria, Università degli Studi di Napoli Federico II, Via Università 100, 80055 Portici (NA), Italy
3
Istituto per la Protezione Sostenibile delle Piante, Consiglio Nazionale delle Ricerche, Via Università 133, 80055 Portici (NA), Italy
4
Dipartimento di Farmacia, Università degli Studi di Napoli Federico II, Via Domenico Montesano, 49, 80131 Napoli, Italy
5
Grupo Universitario de Investigación en Ingeniería y Agricultura Sostenible (GUIIAS), Área de Microbiología, Escuela de Ingeniería Agraria y Forestal, Universidad de León, Campus de Ponferrada, Avenida Astorga s/n, 24401 Ponferrada, Spain
*
Author to whom correspondence should be addressed.
Int. J. Mol. Sci. 2019, 20(3), 549; https://0-doi-org.brum.beds.ac.uk/10.3390/ijms20030549
Submission received: 20 December 2018 / Revised: 23 January 2019 / Accepted: 24 January 2019 / Published: 28 January 2019
(This article belongs to the Special Issue Pulses 2.0)

Abstract

:
The common bean (Phaseolus vulgaris L.) is one of the most important food legume crops worldwide that is affected by phytopathogenic fungi such as Rhizoctonia solani. Biological control represents an effective alternative method for the use of conventional synthetic chemical pesticides for crop protection. Trichoderma spp. have been successfully used in agriculture both to control fungal diseases and to promote plant growth. The response of the plant to the invasion of fungi activates defensive resistance responses by inducing the expression of genes and producing secondary metabolites. The purpose of this work was to analyze the changes in the bean metabolome that occur during its interaction with pathogenic (R. solani) and antagonistic (T. velutinum) fungi. In this work, 216 compounds were characterized by liquid chromatography mass spectrometry (LC-MS) analysis but only 36 were noted as significantly different in the interaction in comparison to control plants and they were tentatively characterized. These compounds were classified as: two amino acids, three peptides, one carbohydrate, one glycoside, one fatty acid, two lipids, 17 flavonoids, four phenols and four terpenes. This work is the first attempt to determine how the presence of T. velutinum and/or R. solani affect the defense response of bean plants using untargeted metabolomics analysis.

Graphical Abstract

1. Introduction

The common bean (Phaseolus vulgaris L.) is one of the most important food legume crops worldwide. Bean cultivation can be affected by biotic and abiotic stresses, such as phytopathogen attack, drought, and cold [1]. Bean immunity, similarly to other plants, consists of the development of physical and biochemical barriers, plus the induction of defense responses. A passive resistance protection system, involving structural barriers and metabolites, prevents or attenuates invasion by potential attackers [2,3]. In addition, plants employ a number of chemical defenses consisting on secondary metabolites that act as signaling molecules, antimicrobials (i.e., phytoanticipins and phytoalexins), herbivore feeding deterrents and cell wall strengthening precursors [4]. However, certain plant pathogens can manipulate or overcome these chemical defenses, thereby establishing successful infections that would have a negative impact on plant growth and subsequent crop yield. To overcome this, the agricultural industry has relied on the use of agrochemicals such as pesticides and fungicides [3]. However, continuous application of such chemicals has shown negative impacts on the environment, creating a need for new environmentally-friendly strategies that fight against these diseases and pests by boosting the plants immune system [4].
Rhizoctonia solani JG Kühn [Teleomorph: Thanatephorus cucumeris (AB Frank) Donk] is a necrotrophic fungal pathogen, causing root and hypocotyl diseases. Rhizoctonia root rot of bean is common worldwide and it is one of the most devastating diseases of bean in large and small scale plantings [5].
Biological control represents an alternative to synthetic pesticides against phytopathogenic agents. Plant beneficial fungi of the genus Trichoderma (Teleomorph: Hypocrea) have been successfully used worldwide both to control fungal diseases and to promote plant growth. Trichoderma spp. represent a fundamental component of the rhizosphere microbiome because these fungi help plants to overcome numerous environmental constraints by stimulating defense responses and improving fitness and development [6]. These abilities have supported the application of Trichoderma strains as biocontrol agents (BCA) or plant biostimulants in agriculture and forestry.
Trichoderma beneficial strains trigger the activation of plant cascade signals including the secretion of antimicrobial reactive oxygen species (ROS), the production of secondary metabolites such as phytoalexins and pathogenesis-related proteins, and the deposition of callose [7]. Trichoderma has evolved to interact with plants in such a way that it is not perceived as an enemy [6].
After the invasion by a pathogen or a biocontrol agent, the plant responds by inducing the expression of defense genes [8] and producing some bioactive secondary metabolites, [9] ranging from phytoalexins (phenols, isoflavones, terpenes) to substances that can block the invasion and spread of the pathogen, such as lignin and callose [10]. Biosynthesis of phytoalexins by plants in the Fabaceae family is a subject of interest because they are produced in higher or lower amounts depending on whether the plant is interacting with a pathogen or with a biocontrol agent.
Polyphenols, including phytoalexins, are widely distributed in plants and may be classified into three groups: (i) simple phenols, (ii) phenolic acids (hydroxycinnamic- and benzoic-acid derivatives), and (iii) flavonoids (e.g., flavones, flavanones, flavanonols, flavanols, isoflavones and lignans) [11]. Flavonoids and their derivatives comprise a large group of secondary metabolites whose production is specifically induced by symbionts and pathogens [12]. One of the roles of flavonoids inside the root could be the regulation of the defense response and it has been proposed that mycorrhiza invasion triggers a temporary defense response in the root, which involves induction of phytoalexins [13]. Isoflavonoids are a subclass of the flavonoids and they are thought to represent the majority of the phytoalexins produced by legume plants [12].
Other phytoalexins include toxins of terpenic nature, which act as repellents against many plant feeding-insects and -mammals, thus playing important plant defensive roles [14]. These compounds (i.e., triterpenes and saponins) have also been found in legumes and their activity as antimicrobial defense compounds has been reported [15].
In this work, we aimed to evaluate the changes in the bean metabolome that occur during the interaction with pathogenic (R. solani) and antagonistic (T. velutinum) fungi. The production of polyphenols and other metabolites by bean plants was analyzed by LC-MS analysis and differences in single or combined plant interacting metabolomes were investigated.

2. Results

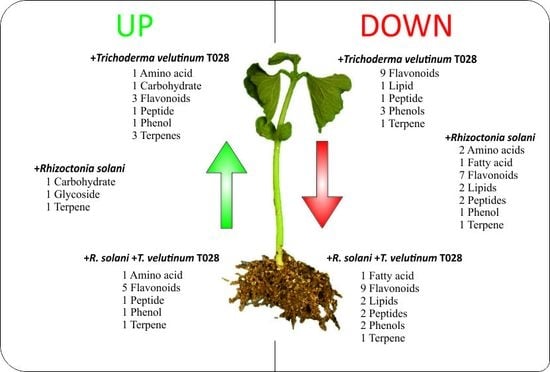
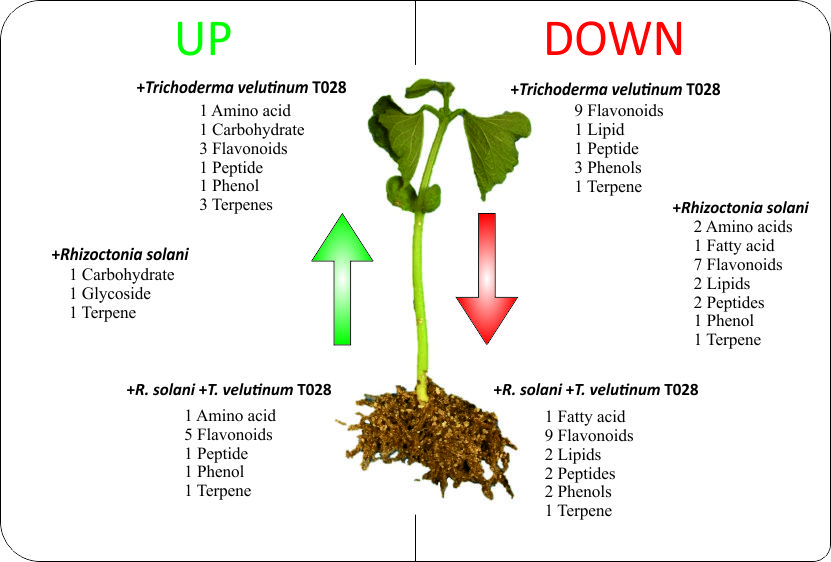
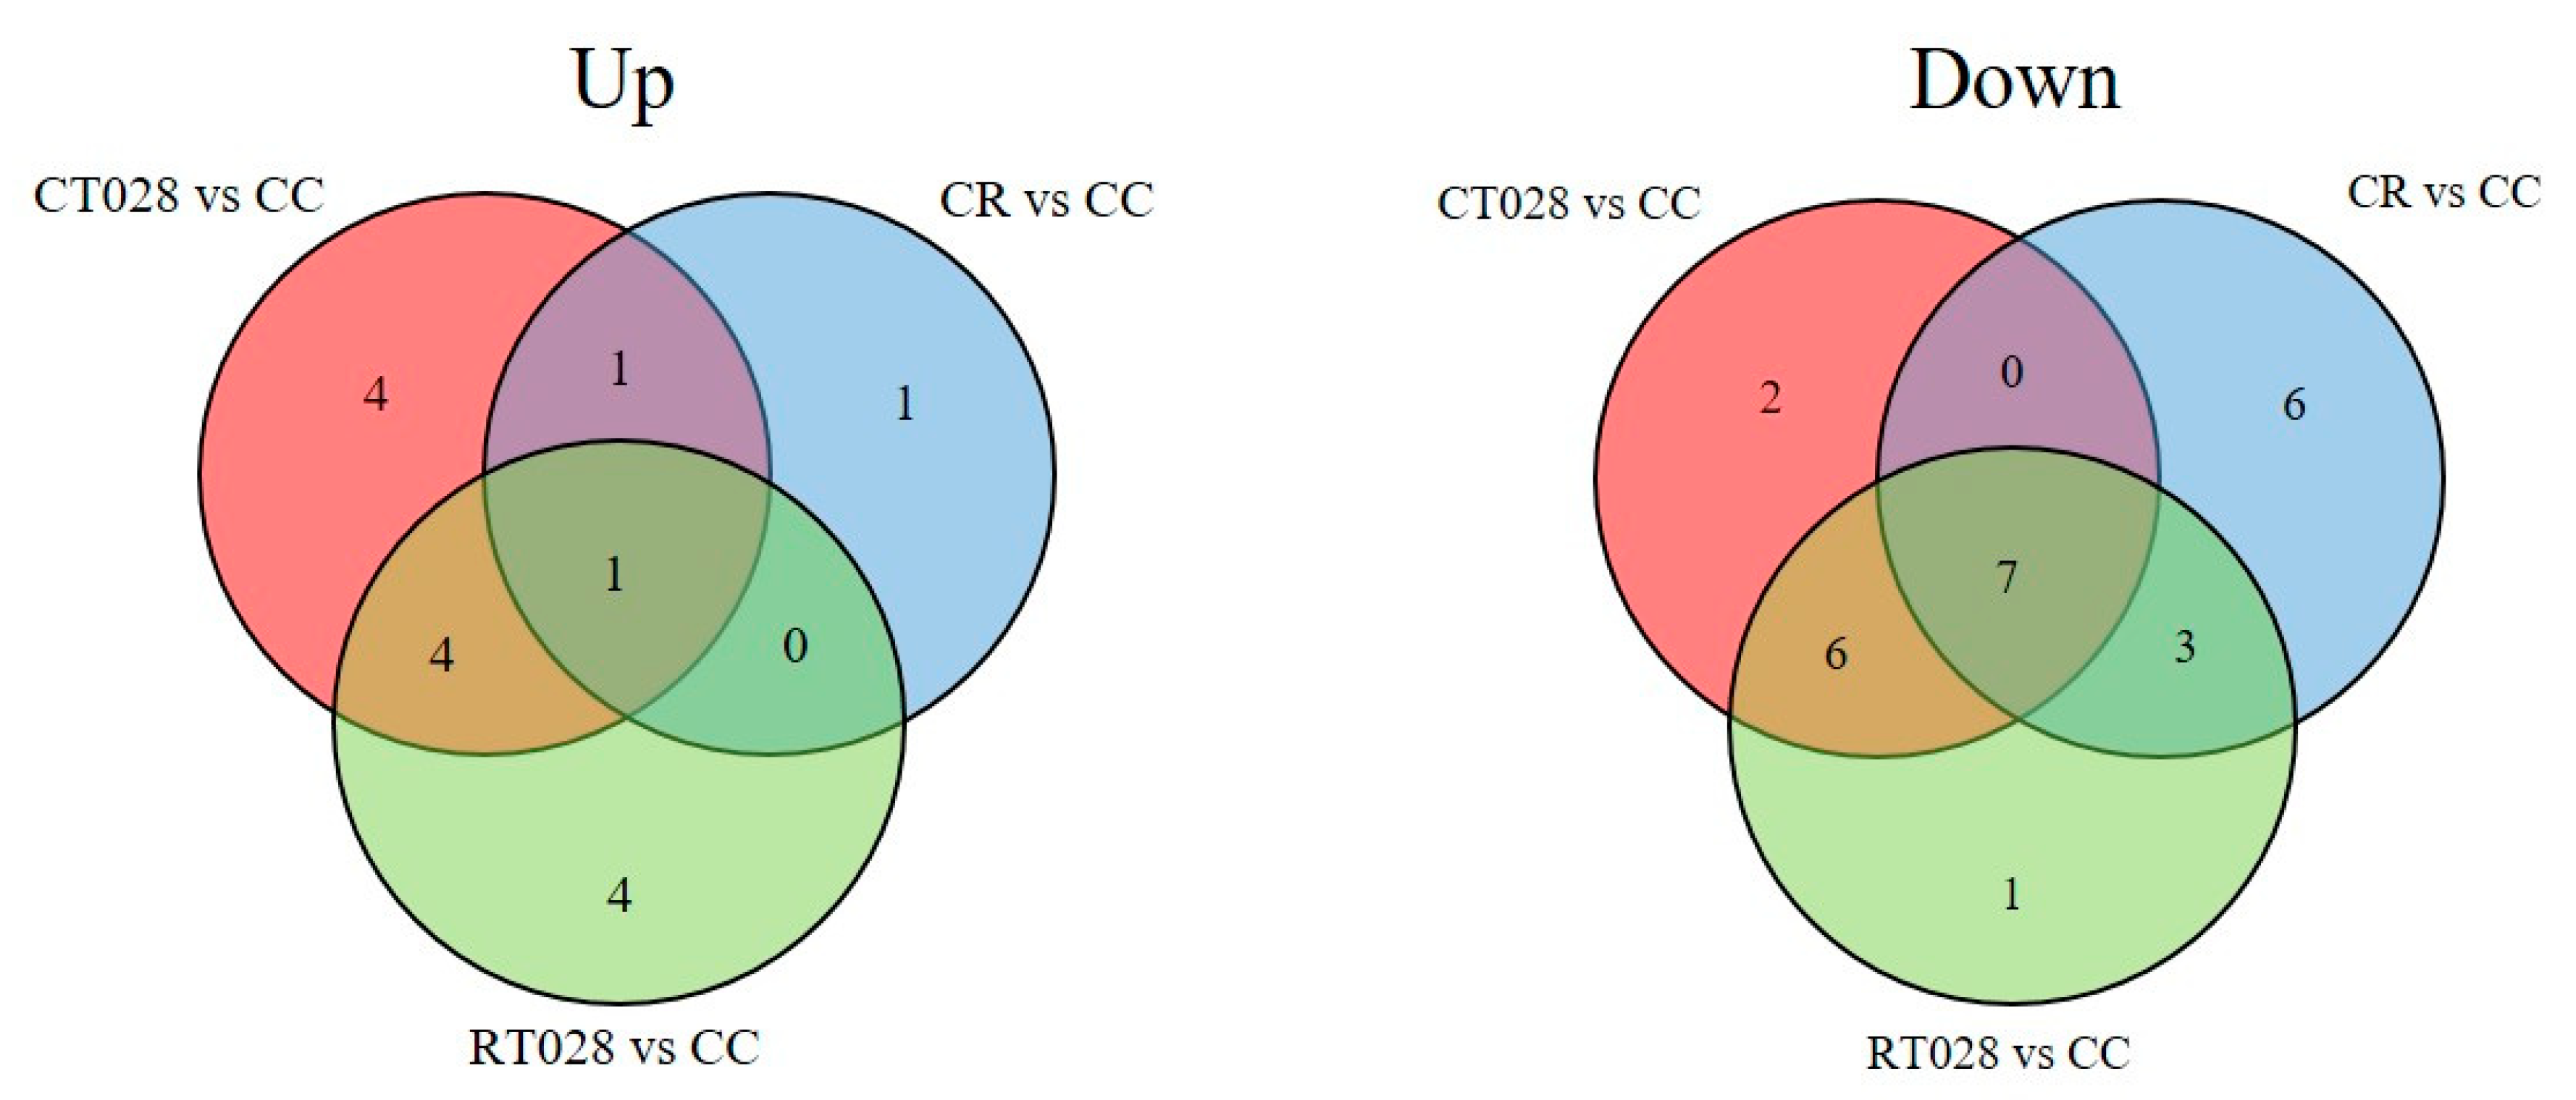
2.1. Analysis of Phaseolus vulgaris Plant Metabolome in Presence of T. velutinum and R. solani

T. velutinum T028 was selected based on its positive effect on bean plants growth. Previously, plants inoculated with this strain had shown a significant increase in dry weight of both the aerial part and root system, even when R. solani was present in the soil [8]. Thus, based on these results, that isolate was used in this study to further investigate its beneficial effect on plant metabolome.
HPLC analysis of bean leaf extracts revealed differences in the accumulation pattern of compounds, according to the interaction performed in vitro (see Figure 1). A total of 216 compounds were extracted from bean leaves and analyzed by LC-MS-qTOF in the samples. The use of optimal gradient elution programs and MS conditions on a negative ionization mode resulted in an ESI-TIC (Total Ion Current) chromatogram for each bean leaf sample (Figure 2). The compounds were tentatively identified by analyzing their mass spectra, determined via TOF-MS, and taking into account the data reported in the literature.
Metabolomic analysis of bean samples revealed up to 36 specific compounds associated with the Fabaceae family that accumulated differentially in the leaves of plants inoculated with the fungal isolates when compared to the controls (Table 1). The compounds from uninoculated bean plants (CC) were used as controls for the comparisons with two-way (CT028-CC and CR-CC) and three-way interactions (RT028-CC) (Figure 1). The compounds were considered as differentially produced when a 2-fold increase (UP) or decrease (DOWN) was observed compared to uninoculated plants (CC). Semi-quantification of each compound was performed by determining the area of their peaks on the chromatogram of each bean leaf extract and normalizing the data by calculating the relative ratio of abundance of metabolites in respect to all other peaks [16].
Several compounds were produced at significantly different levels in fungal-inoculated conditions compared to the control plants. The Venn diagrams reported in Figure 3 show the distribution of differential metabolites (UP or DOWN) accumulated in the plant metabolome during the interactions with Trichoderma alone (CT028), with the pathogen alone (CR) or with both fungi (RT028), compared to control, water-treated, plants (CC). Interestingly, some compounds were up- or down-produced in all the interactions examined (1 and 7, respectively, for UP and DOWN metabolites) but most of the differentially produced metabolites were found to be specifically influenced by the presence of one or both fungi.
In all interactions including T. velutinum, bean leaves UP-produced 10 metabolites and DOWN-produced 15. Among these, four were exclusively UP-produced and two DOWN-produced, in interaction with the beneficial fungus (CT028) in all cases versus the control condition (CC) (Figure 3).
In the interaction with R. solani (CR), 19 compounds were differentially produced. These include three UP- and 16 DOWN-produced metabolites when compared to control plants (Figure 3).
In the three-way interaction, plant-T. velutinum -R. solani (RT028), 26 compounds were produced at significantly different levels compared to control plants. However, most of these metabolites were in common with the two-way interactions where only the beneficial or pathogen fungi was present (Figure 3).

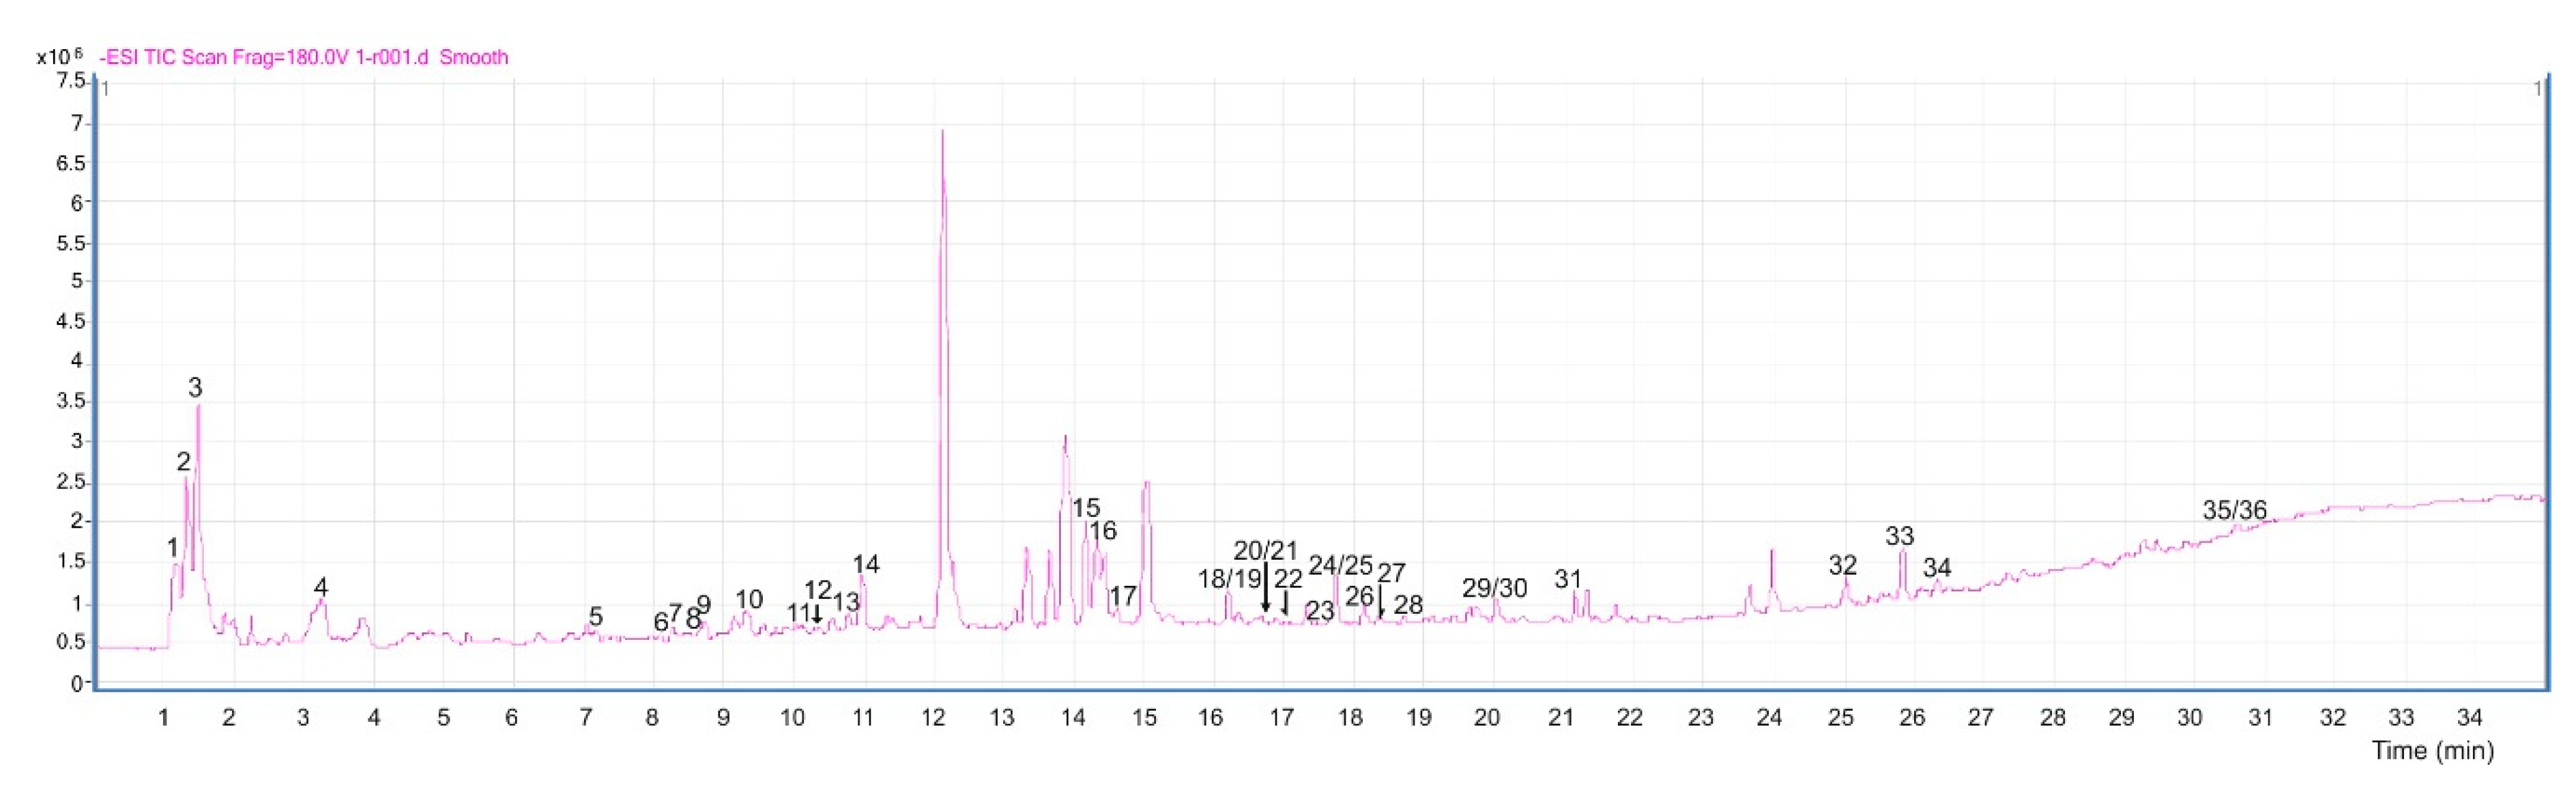
2.2. Characterization of Compounds in Bean Leaf Metabolome

Table 2 includes the metabolites discriminating plant metabolomes obtained during single and combined interactions. These compounds were identified by LC-MS-qTOF analysis (operating in negative ion mode), by comparing the data with previously described compounds, which are present in both public and in-house databases (METLINE, PubChem, ChemSpider, HMDB, CAS, literature) including natural compounds and plant secondary metabolites. Putative metabolite identifications were performed using the “MassHunter Mass Profiler Software” (Agilent Technologies, Santa Clara, CA, USA) and selecting matches with high scores. The selected compounds were grouped in the categories listed below.

2.3. Amino Acids and Peptides

Statistical analysis revealed the different accumulation in the plant metabolome of several compounds that were tentatively identified as two amino acids and three peptides (Table 1). In particular, compound #8 [m/z 203.0826; retention time (RT) = 8.52 min] and compound #15 [(m/z 245.09315, RT 14.20 min], corresponding to the molecular formulas C11H12N2O2 and C13H14N2O3, respectively, were putatively identified as L-tryptophan and N-acetyltryptophan. Both metabolites were DOWN-produced in bean leaves when R. solani was present (CR) compared to the control (CC) (Table 2). However, the presence of T. velutinum increased their production both in two- and three-way interactions (CT028 and RT028) (Table 2).
Furthermore, three peptides (Table 1) were detected: Valyl-leucine [#7, m/z 229.1557, RT 8.42 min, (C11H22N2O3)] accumulated remarkably in presence of T. velutinum (CT028 and RT028) rather than in control plants but at a lower level in the sole presence of R. solani (CR) (Table 2); Ile-Gln-Ile [#11, m/z 371.2298, RT 10.00 min, (C17H32N4O5)], whose production was reduced by the presence of R. solani (CR and RT028); Gln-Gln-Gln [#29, m/z 401.1788, RT 19.94 min, (C15H26N6O7)] whose production decreased in presence of T. velutinum (CT028 and RT028) (Table 2).

2.4. Carbohydrates and Glycosides

The production of sucrose (Table 1) [#2, m/z of 341.1087, RT 1.43 min, (C12H22O11)] was detected in two-way interactions (CT028 and CR) but not when both fungi were together (RT028) (Table 2).
l-Ascorbic acid-2-glucoside (Table 1) was also found, [#4, m/z 337.0775, RT 4.96 min, (C12H18O11)], showing UP-production only in the presence of the pathogen, compared to the plant alone (Table 2).

2.5. Fatty Acids and Lipids

Three compounds belonging to this group were found in bean metabolome (Table 1). These include γ-Linolenic acid [#35, C18H30O2], 13(S)-HOTrE [#34, C18H30O3], and PA(O-16:0/12:0) [#36, C31H63O7P]. Significantly lower amounts of all of them were produced compared to control plants (DOWN-produced) when the pathogen R. solani was present (CR and RT028) (Table 2). Moreover, 3-O-α-l-rhamnopyranosyl-3-hydroxydecanoic acid was also putatively identified [#30, C16H30O7], showing a significantly decreased amount (DOWN-produced) in plants inoculated with Trichoderma (both in CT028 and RT028), compared to control plants (CC) (Table 2).

2.6. Phenols

A huge number of phenolic compounds were detected (Table 1). These include:
(i) Flavones. Compounds #22 and #27, with m/z 373.0926 and 389.0874, corresponding to the formula C19H18O8 and C19H18O9, were homologues to 3′,5-dihydroxy-3,4′,6,7-tetramethoxyflavone [#22] and 5,2′,4′-trihydroxy-3,7,8,5′-tetramethoxyflavone [#27], respectively. Both compounds were UP-produced in plants inoculated with both fungi, either alone or combined (CT028, CR and RT028) (Table 2).
(ii) Flavonols. Quercetin 3-vicianoside [#12], n-octyl-β-d-maltopyranoside [#26] and sitosterol [#21] accumulated differently according to the interaction examined. Compounds #12 and #21 were more abundant in presence of T. velutinum (both in CT028 and in RT028) (Table 2). Conversely, compound #26 decreased in presence of this fungus (CT028).
(iii) Flavonones. Compound #3 showed remarkable homologies with naringin [m/z 579.1773, C27H32O14], a flavonone produced particularly in the sole presence of T. velutinum (CT028) (Table 2).
(iv) Flavonoid glycoconjugates. Numerous putative flavonoids conjugated with different polysaccharides were found in the bean metabolome during the interaction with T. velutinum and R. solani. These include glucopyranosides [#1, #10, #19, #24] and glucosides [#14, #16, #18, #20] (Table 2). The relative abundance of such compounds varied between treatments: Compounds #1 [5-Hydroxy-6,8-dimethoxy-2-oxo-2H-chromen-7-yl β-d-glucopyranoside], #16 [quercetagetin 7-(6″-(E)-caffeoylglucoside]), #18 [isopyrenin 7-O-glucoside], and #19 [12-hydroxy,O-[3,4,5-trihydroxybenzoyl-(06)-β-d-glucopyranoside] reduced their production in presence of one or both fungi. On the other hand, compounds #10 [3,4′,5,7-tetrahydroxyflavanone 3,7-Di-O-β-d-glucopyranoside], #14 [(Z)-resveratrol 3,4′-diglucoside], #20 [luteone 4,7-O-diglucoside], and #24 [(R)-1-O-[β-d-glucopyranosyl-(1-6)-β-d-glucopyranoside]-1,3-octanediol] showed an increased production in the metabolome of beans treated with Trichoderma alone or in combination with the pathogen.
(v) Other polyphenols. Among the differentially accumulated metabolites, homologies were also found with isoflavanoids [#28: 2′-O-methylphaseollinisoflavan], isoflavanones [#25: 2′,4′,5,7-Tetrahydroxy-3′,8-diprenylisoflavanone], and isoflavans [#6: phaseollinisoflavan], which all decreased their production in presence of T. velutinum (CT028 and RT028), except for compound #6, whose production was DOWN-produced only in the three-way interaction (RT028) (Table 2).
(vi) Phenols. Most of the phenolic compounds differentially produced by beans reduced their level in the presence of the beneficial fungus. This decrease was observed for compound #5 [homologous to hydroxytyrosol 1-O-glucoside], #31 [garcimangosone D], and #33 [gambogic acid], while compound #13 [similar to 1-O-sinapoylglucose] accumulated in higher amounts when T028 was present (CT028 and RT028), compared to the water-treated plant (Table 2).

2.7. Terpenes

The presence of T. velutinum and R. solani also affected the production of terpenes in bean leaves (Table 2). Thus, both dihydrophaseic acid 4-O-β-d-glucoside [#9, m/z 443.1923, RT 8.88 min, C21H32O10] and teucrein [#23, m/z 267.1235, at 17.52 min, C16H12O4], were UP-produced when Trichoderma was present alone, compared to the control. On the other hand, the plant metabolome showed an increased production of ethyl 7-epi-12-hydroxyjasmonate glucoside [#17, m/z 415.1971, RT 14.78 min, C20H32O9] in all the interactions examined, while an opposite trend was observed for compound #32, found to be similar to akeboside Ste [m/z 895.5050, RT 24.97 min, C47H76O16].

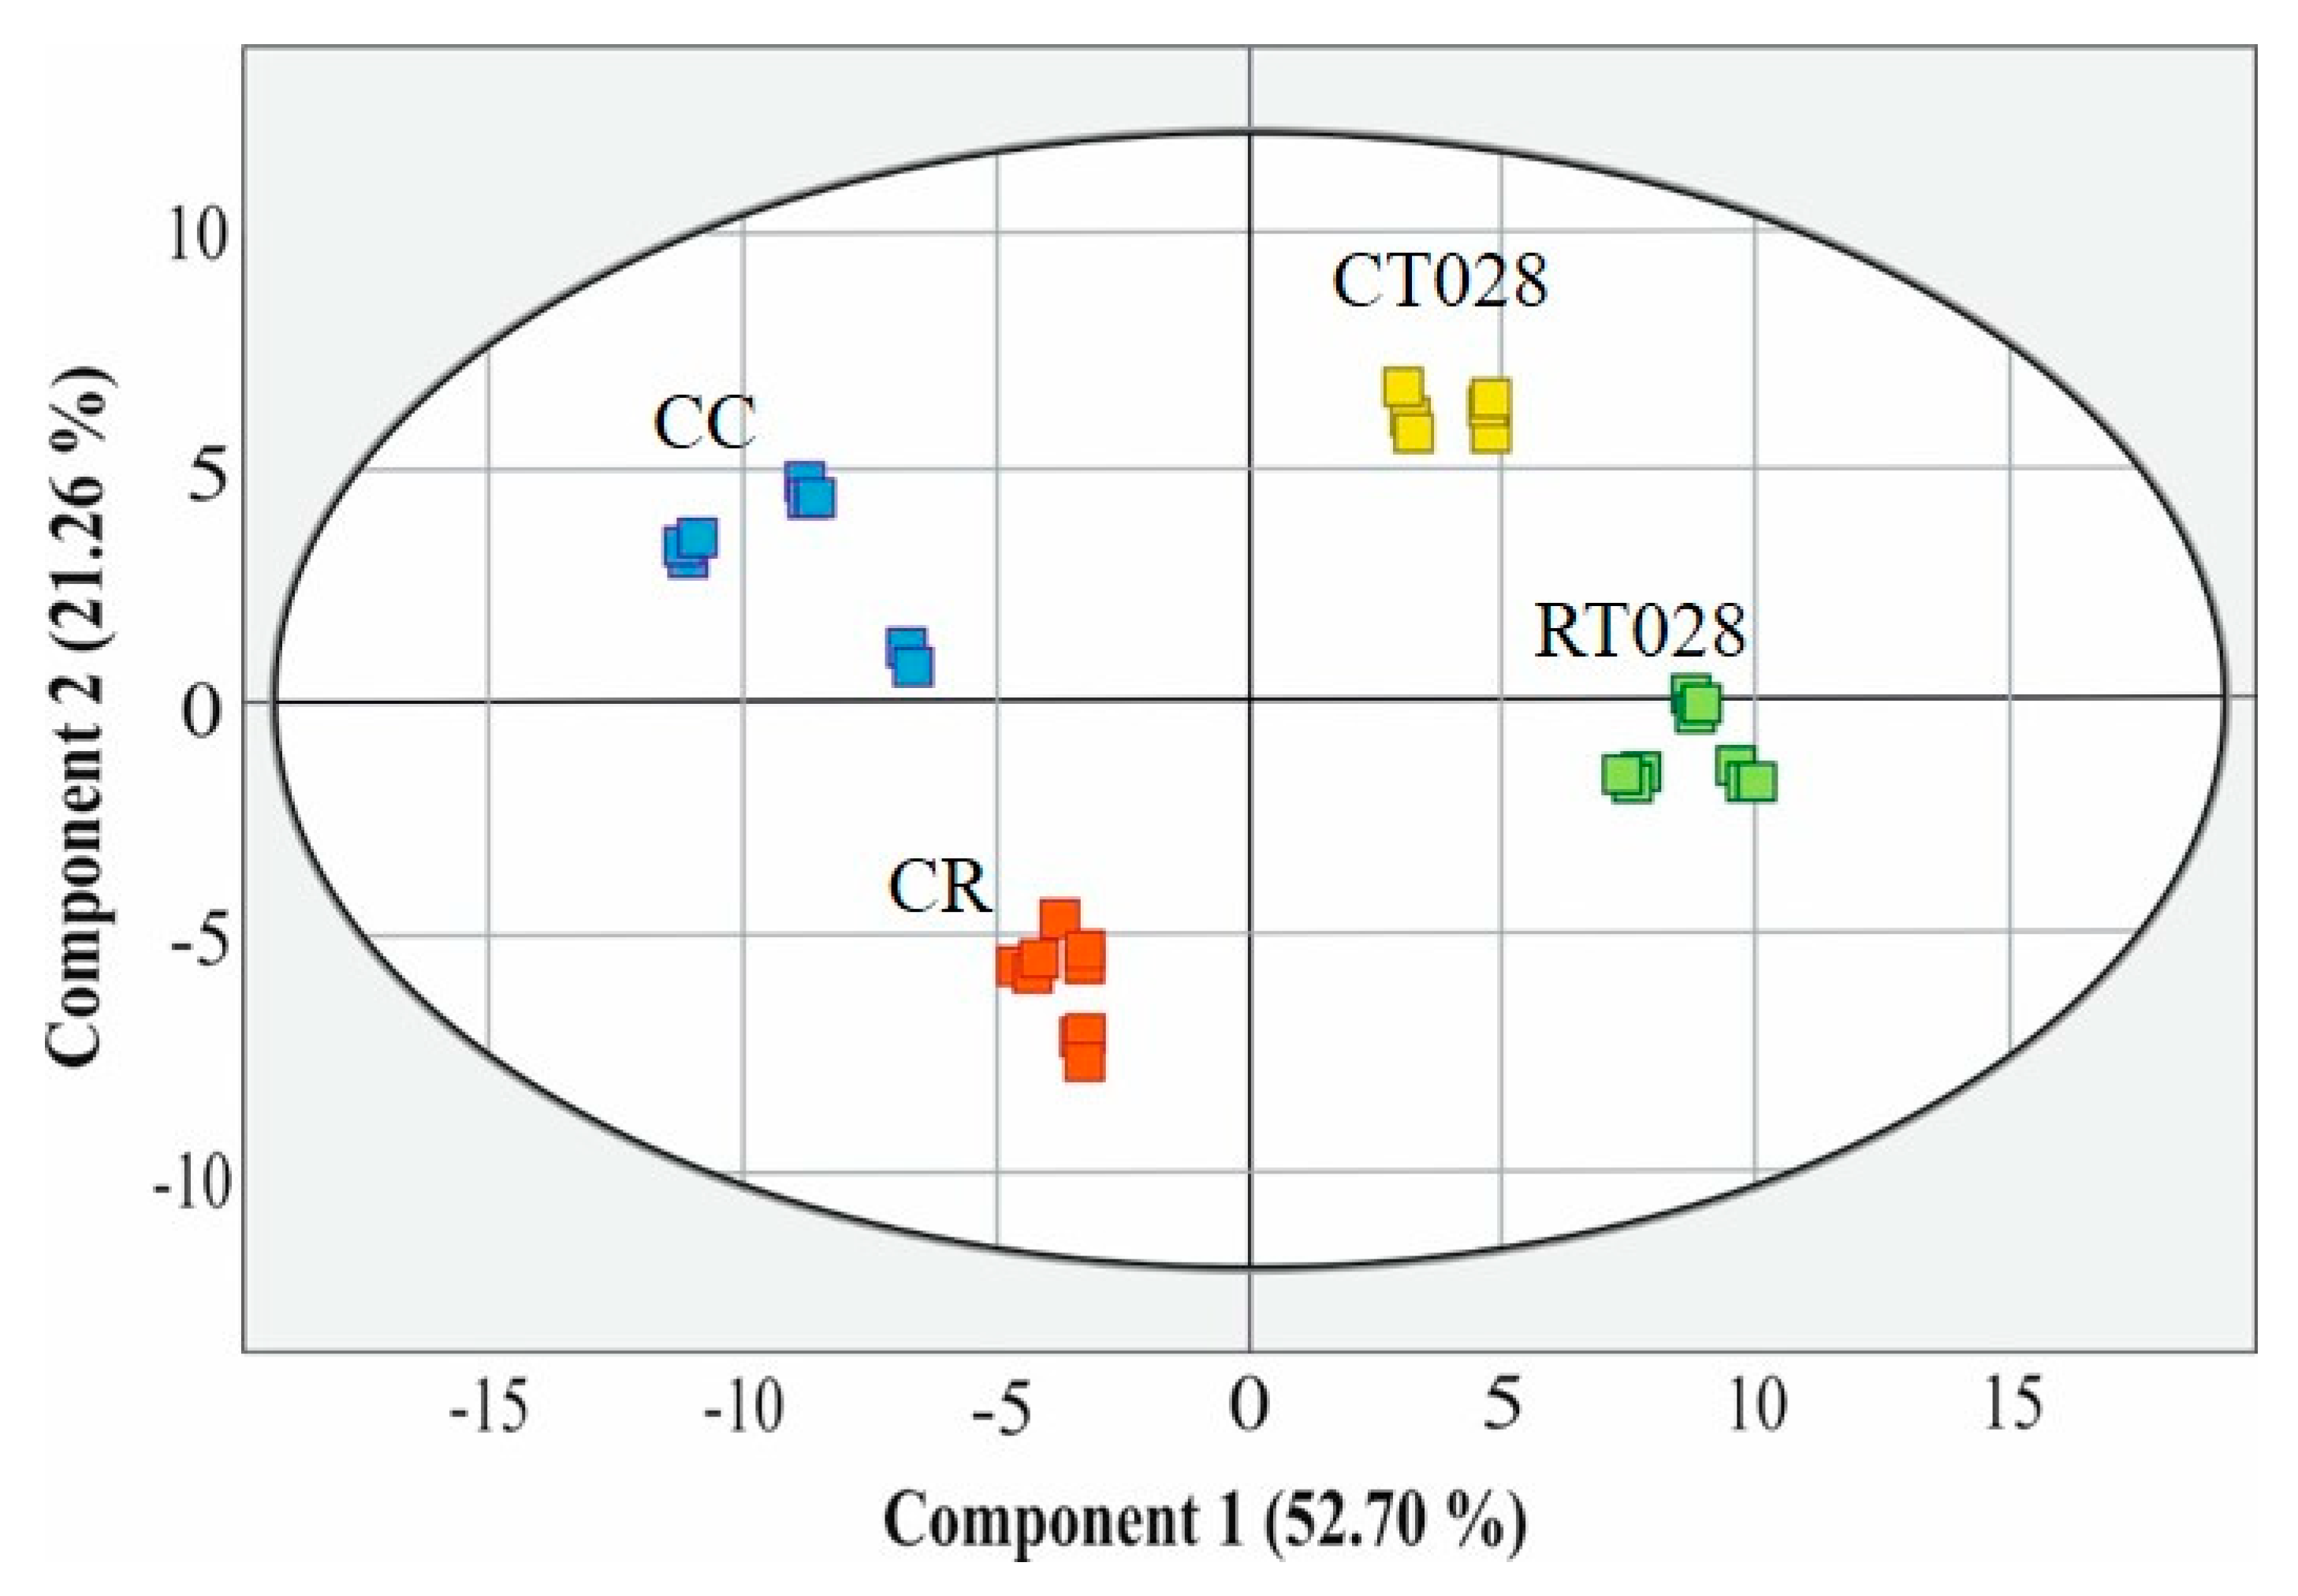
2.8. Principal Component Analysis (PCA)

PCA was used to determine the relationship between the experimental treatments and the accumulation of selected phytochemical compounds in bean leaf metabolome. As shown in Figure 4, the first two components accounted for 73.96% of the total variance. Each metabolomic interaction was clustered separately. In particular, the plants infected with R. solani (CR) lie much closer to the control plants (CC), while the presence of Trichoderma, both alone (CT028) and together with the pathogen (RT028), also form a loose cluster (Figure 4).

3. Discussion

In this work, T. velutinum T028 was selected because of its positive effects on bean growth. Plants inoculated with this fungus showed significant increases in dry weights of both aerial parts and root system, also when the fungal pathogen R. solani was added to the substrate. Furthermore, both T. velutinum T028 and R. solani R43 isolates induced the expression of defense-related genes [8].
Plant-pathogen interactions are complex phenomena and affect the metabolism of each partner differently. Plant defense strategies against their pathogens are diverse, including the induction of expression of defense genes and also the production of antifungal compounds called phytoalexins, that include flavonoids, phenols, glucosinolates, terpenes and alkaloids with a broad spectrum of antimicrobial functions [27,28]. In this work, we have investigated the changes in metabolite profiles of bean plants cultivated for forty-five days in the presence of T. velutinum and/or R. solani. The metabolomic analysis of leaf extracts allowed the characterization of samples from different interaction conditions (plant alone, plant + pathogen, plant + antagonist, plant + pathogen + antagonist). Putative identification of the differentially accumulated metabolites in two- and three-way interactions, compared to control, revealed the increase or decrease in the accumulation of different classes of compounds, including polyphenols, terpenes, amino acids, carbohydrates, fatty acids, lipids, glycosides and peptides.
Many polyphenolic compounds with antibiotic activity act as phytoalexins in plant tissues during their interaction with phytopathogenic agents [29]. Phytoalexins are considered molecular markers of disease resistance [30] since they are synthesized de novo in response to pathogen attack [31]. Several biotic and abiotic factors induced the production of phytoalexins in different plant species of the Solanaceae, Leguminosae and Gramineae families [32]. Inoculation with non-pathogenic microorganisms, such as Trichoderma spp., or with hypovirulent pathogen strains induces systemic resistance in plant, resulting in the accumulation of phytoalexins at the site of infection and the production of antibiotic substances [2,33] e.g., accumulation of camalexin, a phytoalexin in Arabidopsis, in response to the presence of Trichoderma, which would indicate a further level of plant protection by these fungal strains [27,34].
Polyphenols comprise a large number of compounds, like phenols, phenolic acids, and flavonoids [11]. In this work, we found differences in the accumulation of flavonoids in plant leaves depending on the interaction condition (Table 2). Up to 8 different flavonoids (#1, 18, 19, 22, 24, 25, 26, 27) always resulted less abundant when plants were cultivated in presence of one or both fungi, compared to the non-inoculated control. Conversely, the production of 6 other flavonoids (#3, 10, 12, 14, 20, 21) was significantly increased whenever Trichoderma was present, but not in the sole presence or R. solani. Flavonoids protect plants against various biotic and abiotic stresses and exhibit a diverse spectrum of biological functions, playing an important role in the interaction between the plant and the environment [35]. The differences in the pattern of flavonoid accumulation observed in the metabolome of bean leaves could reflect the different metabolic pathways induced by the beneficial fungus rather than by the pathogenic one.
It is unclear whether the accumulation of different but structurally related phytoalexins in the plant (e.g., phaseollin, phaseollidin in the bean) is important for the resistance against pathogens [36]. In a previous study, when bean plants were inoculated with R. solani, a considerable amount of phaseollin accumulated in the lesions within 36 h after the treatment and was detected up to 12 days later [25]. We found a decreased production of two phytoalexin related compounds [#28: 2′-O-methylphaseollinisoflavan and #6: phaseollinisoflavan] in plants treated with T. velutinum.
The plant hormone jasmonic acid (JA) and its derivatives have been recognized as key regulators of defense responses against both biotrophic and necrotrophic pathogens [33]. We observed an over-accumulation of the terpene ethyl 7-epi-12-hydroxyjasmonate glucoside (#17; Table 2) in the presence of T. velutinum and/or R. solani, in comparison to control plants. This compound has been related to the metabolic pathway of JA, and its production was found to be induced when plants detect a microorganism. In this sense, Yogendra et al. [37] demonstrated that this terpene was detected when potato plants were in contact with the pathogen Phytophthora infestans. Similarly, we can hypothesize that both Trichoderma and Rhizoctonia activate the plant signaling cascade induced by this compound. However, other terpenes detected in the bean leaf metabolome showed a different accumulation pattern according to the different plant-microbe interactions analyzed in the present work (Table 2). Thus, compounds #9 (Dihydrophaseic acid 4-O-β-d-glucoside) and #23 (Teucrein) increased their accumulation only in presence of the beneficial fungus, while compound #32 (akeboside Ste) was less abundant in all the treated plants compared to controls. These evidences contribute to support that the presence of different beneficial of detrimental microbes in the rhizosphere may induce different plant metabolic pathways. Similar results were also observed with fatty acids and lipids, like γ-Linolenic acid (#35) and its derivative 13(S)-HOTrE (#34), both of which were produced at lower levels in the presence of the pathogen, compared to control plants. γ-Linolenic acid is the main precursor of jasmonate [38], which is responsible for the induction of a signalling cascade in response to non-pathogenic microorganisms [39]. In this work R. solani causes a reduction in the level of production of these compounds, which would result in a reduction in the ISR response, thereby facilitating plant invasion by the plant pathogen.
Bean plant metabolome also showed differences in peptide and amino acid accumulation. The presence of T. velutinum alone stimulated the production of l-Tryptophan (#8, Table 2), while the simultaneous occurrence of both microbes (RT028 treatment) stimulated the accumulation of its acetylated form (#15, N-acetyltryptophan). Conversely, R. solani-infected plants showed decreased amounts of both metabolites, compared to control. l-tryptophan has been found to stimulate the synthesis of auxins in the rhizosphere and trigger plant growth. The enhancement of plant biomass by promoting the growth of lateral root has been observed in many plant species treated with Trichoderma spp. and this effect has also been related to the production of indole-3-acetic acid (IAA) or auxin analogues [40,41]. In a similar way, the inoculation of Vigna mungo with other biocontrol agents (Rhizobium spp. and Bacillus spp.) increased yield up to 23.36% in presence of this compound [42].
Antifungal peptides derived from common bean demonstrated inhibitory activity against numerous plant pathogens, such as Mycosphaerella arachidicola, R. solani, Verticillium dahliae, Setosphaeria turcica and Fusarium oxysporum [43]. Antifungal activities of common bean peptides include modifications of hyphae morphology, membrane cell disruption, altered membrane permeabilization and induction of chitin accumulation at hyphal tips [43]. In our work, the accumulation of three peptides (Table 2) showed significant differences in plant leaves in presence of T. velutinum and/or R. solani. In particular, compounds #11 and #29 (homologs to the tripeptides Ile-Gln-Ile and Gln-Gln-Gln, respectively) were less abundant in bean plants treated with Trichoderma or Rhizoctonia than in controls. Interestingly, the dipeptide Valyl-Leucine (similar to compound #7) significantly increased after T. velutinum inoculation, and also in the presence of the pathogen. This could represent an example of metabolite production induced by the antagonistic interaction between Trichoderma and R. solani, and involved in the activation of plant defense responses.

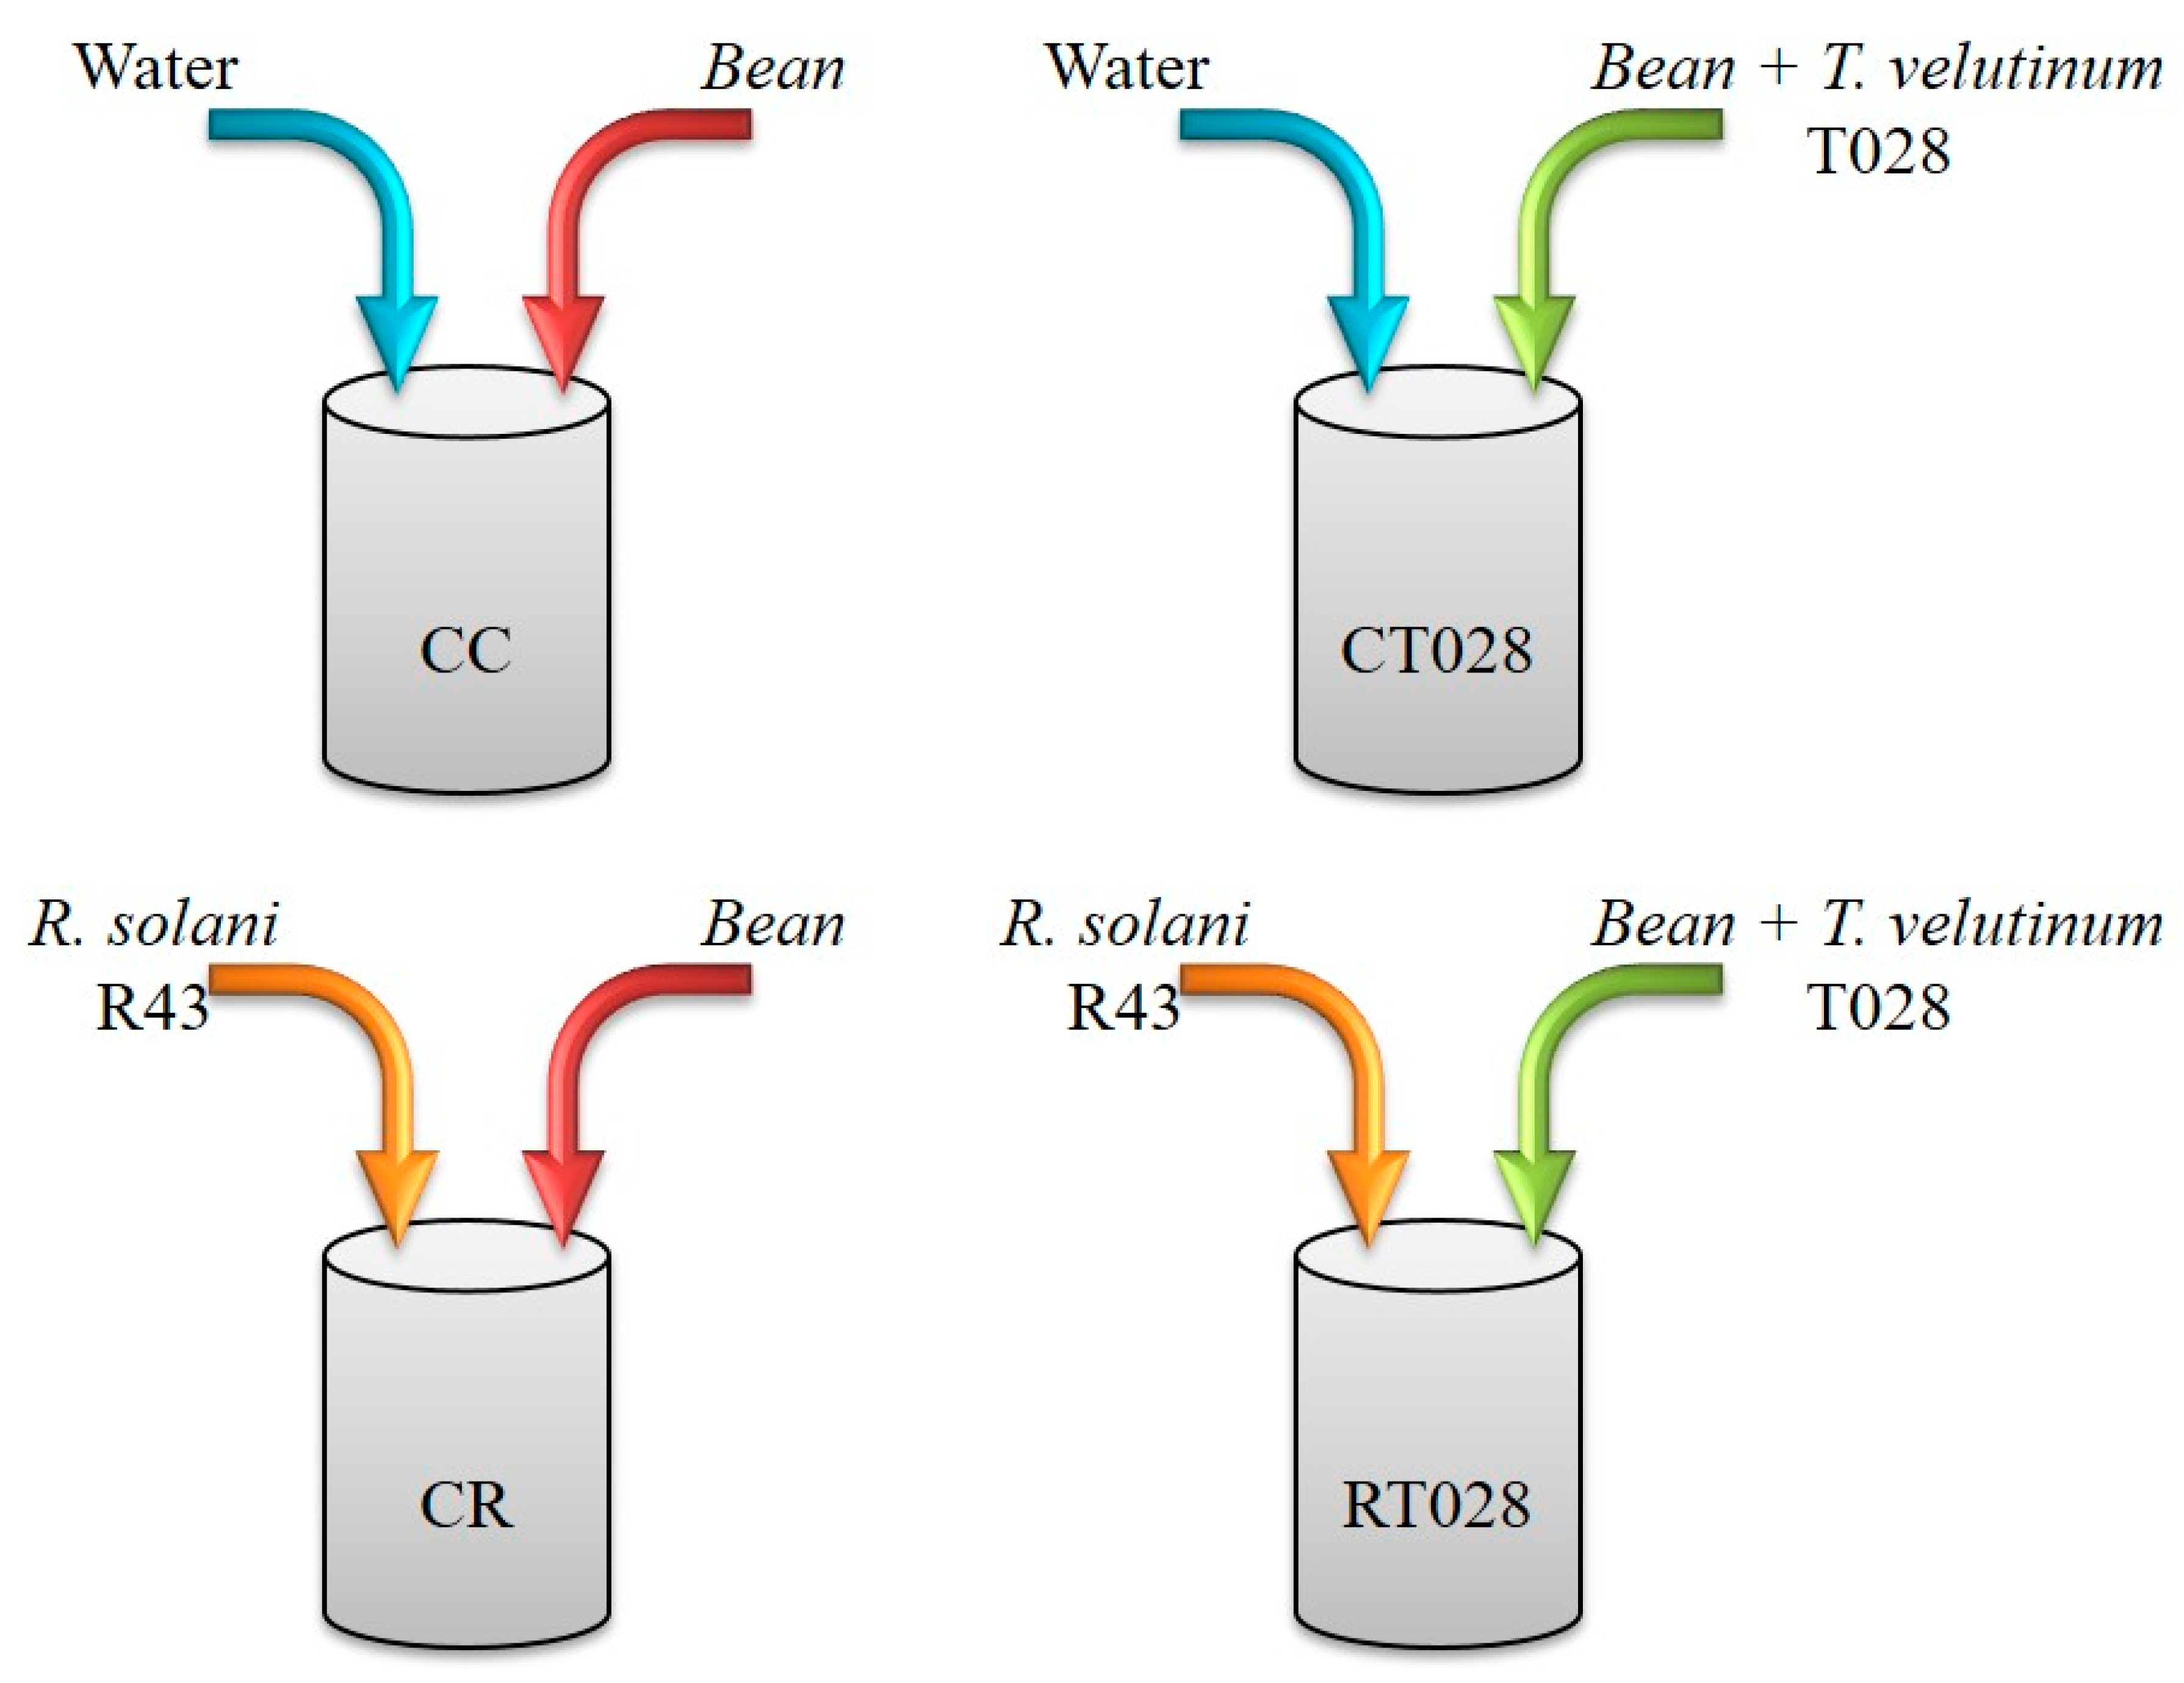
4. Material and Methods

4.1. Fungal Isolates and Culture Conditions

The present study was conducted using strain T. velutinum T028, previously isolated from the Protected Geographical Indication (PGI) called “Alubia La Bañeza—León” (EC Reg. n.256/2010 published on 26 March 2010, OJEU L880/17).
R. solani R43 is a highly virulent strain isolated from plants of the same PGI. This strain was stored in the collection “Pathogens and Antagonists of the Laboratory Diagnosis of Pests and Diseases” (PALDPD) at the University of Leon, Spain.
The fungal isolates were grown on potato-dextrose-agar (PDA, Sigma-Aldrich, St. Louis, MO, USA) in the dark at 25 °C for one week. Trichoderma cultures were then exposed to light for 3–4 days in order to induce spore formation. Spores were collected and maintained at −80 °C in 50% glycerol suspensions.

4.2. Plant Material and Growth Conditions

Bean (P. vulgaris L. cv. Canela) seeds were germinated and cultured in four different conditions: (1) in presence of both T. velutinum (T028) and R. solani (R43) [RT028]; (2) T028 alone (CT028); (3) R. solani alone (CR); and (4) control without fungi (CC) (Figure 1).
Plants were grown in a climatic chamber; thirty pots (1 L capacity) with substrate, bentonite and cornmeal (100:5:2) were used per treatment, with two seeds per pot which were irrigated with 250 mL of water prior inoculation. Biomass of R. solani R43 was scraped from fungal cultures grown on PDA plates (5 plates per liter), homogenized and inoculated into the soil (50 mL per pot). For the control treatment, an uninoculated PDA medium was used. Pots were kept in a growth chamber for 8 days at 25 °C (16 h) and 16 °C (8 h), with 60% relative humidity in the dark.
Bean seeds were surface sterilized (sodium hypochlorite 1% for 3 min and then rinsed with sterile distilled water for 6 min) and coated with a spore suspension (concentration 2 × 10⁷ spores mL−1 in 20 mL water for every 45 seeds) of T. velutinum (T028). Coated seeds were sown 8 days after inoculating the soil with the pathogen (Figure 1). Plants were grown in a climatic chamber under the conditions previously described [44], using a photoperiod of 16 h light/8 h dark, 25 °C/16 °C (day/night), 60% relative humidity and brightness of 3500 lux. The plants were harvested 45 days after sowing and their leaves were collected and lyophilized. In particular, three biological samples (obtained randomly from different pots within the same treatment) were processed per treatment.

4.3. Preparation of Bean Leaf Extracts

Extracts of plant leaves were obtained as described by Talhaoui et al. [45], with some modifications. Freeze-dried leaves (250 mg) were ground to a powder and extracted twice via Ultra-Turrax IKA T18 basic, using 10 mL of MeOH/H2O (80/20 v/v). Afterwards, samples were placed in an ultrasonic liquid processor (Sonics & Materials, Inc., Newtown, CT, USA) for 10 min, and centrifuged at 4000 rpm for 10 min at 4 °C. After solvent evaporation, extracts were reconstituted with 4 mL of MeOH:H2O (50:50 v/v) and filtered through a 0.2 µm membrane (Minisart®, Sartorius Stedim Biotech CA, Goettingen, Germany).

4.4. LC-MS qTOF Conditions

Bean leaf extracts were separated on an Agilent HP 1260 Infinity Series liquid chromatograph coupled to a Q-TOF mass spectrometer, model G6540B (Agilent Technologies, Santa Clara, CA, USA). The chromatographic separations were performed using a Zorbax Eclipse Plus C18 analytical column (4.6 × 100 mm, 3.5 µm particle size) (Agilent Technologies, Santa Clara, CA, USA) as previously described [11] with slight modifications.
The mobile phases were treated with acidified water [H2O plus 0.1% formic acid (FA)] (eluent A) and acetonitrile (ACN) (ACN plus 0.1% FA) (eluent B). The chromatographic method consisted in the following linear gradient with a flow rate of 0.80 mL/min: 0 min, 0% B; 10 min, 20% B; 15 min, 30% B; 20 min, 50% B; 25 min, 75% B; 30 min, 100% B; 35 min, 100% B; 35.10 min, 0% B; and finally a 5 min post-run was used after each analysis. The injection volume was 5.0 µL and the column temperature was maintained at 25 °C.
The mass spectrometer was equipped with the model G6540B Dual ESI (Agilent Technologies, Santa Clara, CA, USA) source operating in negative ion mode. The optimum values of source parameters were: drying-gas temperature, 300 °C; drying-flow, 9 L/min; and nebulising-gas pressure, 45 psig. Two reference mass compounds were used to perform the real-time lock mass correction: purine (C5H4N4 at m/z 121.050873, 10 µmol L−1) and hexakis (1H,1H,3H-tetrafluoropentoxy)-phosphazene (C18H18O6N3P3F24 at m/z 922.009798, 2 µmol L−1). The capillary was maintained at 4000 V, fragmentor voltage at 180 V, cone 1 (skimmer 1) at 45 V, Oct RFV at 750 V. The spectra were recorded in the targeted mode as centroid spectra, with 3 scans per second, within the m/z mass range of 50–1100 amu. Each sample was run in triplicate, with 3 biological replicates per interaction examined.
The MS data were processed through Agilent MassHunter Qualitative Analysis B.06.00 software (Agilent Technologies, Santa Clara, CA, USA), which provides a list of possible elemental formulas by using a molecular formula editor tool (ID Browser program, Agilent MassHunter Mass Profiler Software, Santa Clara, CA, USA). Sample normalization was performed as reported previously [16] by calculating the relative ratio of abundance of metabolites to all other peaks. According to the literature, the phytochemical compounds were tentatively identified based on the accurate mass measurements of the pseudomolecular ion [M-H], and comparing them to different databases containing more than 15.000 natural secondary metabolites (METLINE from Agilent Technologies; PubChem: https://pubchem.ncbi.nlm.nih.gov (access on 18 July 2018); ChemSpider: http://www.chemspider.com (access on 20 June 2018); HMDB: http://www.hmdb.ca (access on 30 May 2018); CAS: https://www.cas.org/cas-home (access on 15 April 2018); in-house plant metabolite database), as well as literature on Fabaceae species.
Statistical analyses were carried out using the Mass Profiler Professional Software 13.0 (G3835AA, Agilent Technologies, Santa Clara, CA, USA). Significant statistical differences among treatments (p < 0.05) were assessed by one-way ANOVA and principal component analysis (PCA). Leaf extracts obtained by each treatment were run in triplicate.

5. Conclusions

The metabolic profiles of bean leaves (P. vulgaris) were investigated by LC-MS analysis. As a result, 216 compounds were detected in the metabolome of bean leaves; among these, 36 metabolites accumulated differently in leaves inoculated with T. velutinum and/or R. solani compared to controls. Such metabolites were tentatively identified and included flavonoids, terpenes, carbohydrates, phenols, amino acids and peptides. T. velutinum treatments increased the accumulation of L- Tryptophan and its acetylated derivative in bean leaf metabolome, which could stimulate the synthesis of auxins in the rhizosphere and thereby stimulate plant growth. A derivative of JA, Ethyl 7-epi-12-hydroxyjasmonate glucoside, was found to increase in presence of T. velutinum and/or R. solani compared to control, thus suggesting the induction of a plant defense response effected by both fungi. However, a precursor of jasmonate (γ-Linolenic acid) found less accumulation in plants upon pathogen challenge, as compared to control. To the best of our knowledge, this work is the first report that investigates the effect of a biocontrol agent and/or a fungal pathogen on the metabolome of bean plants using an LC-MS-based analysis.

Author Contributions

P.A.C.; S.G. conceived the research. S.M.-P.; R.M.; F.V.; S.L.W.; M.L. designed the research. S.M.-P.; R.M.; F.V. conducted the experiments. S.M.-P.; P.A.C.; S.G.; Á.R.-G. analyzed data. S.M.-P.; P.A.C.; S.G.; Á.R.-G. interpreted the data. S.M.-P.; P.A.C.; S.G.; R.M.; F.V.; S.L.W.; M.L. wrote the manuscript. All authors were agreed to be accountable for all aspects of the work in ensuring that questions related to the accuracy or integrity of any part of the work are appropriately investigated and resolved All authors critically revised the manuscript. All authors approved the final version to be published.

Funding

“This research was funded Ministry of Education, Culture and Sport (Spain) according the Resolution of 25 April 2012 (BOE of 10 May), as amended by Resolution of 18 May 2012 (BOE of 22 May), and by Resolution of 31 October 2012 (BOE of 12 November), granted in the Resolution of 20 December 2012 and the Resolution of Mobility for Short Term of 9 December 2014 (BOE of 22 December) to the grant number [FPU12/00677]”. Check carefully that the details given are accurate and use the standard spelling of funding agency names at https://0-search-crossref-org.brum.beds.ac.uk/funding, any errors may affect your future funding.

Acknowledgments

Ministry of Economy and Competitiveness for National project “Farnesol as a self-regulatory molecule in Trichoderma. Tyrosol and farnesol signaling in Trichoderma-bean interaction” (AGL2012-40041-C02-02). Junta de Castilla y León, Consejería de Educación for the project “Effect of terpenes and physiologically related compounds produced by Trichoderma parareesei in the development of common bean (Phaseolus vulgaris L.) and in defensive responses of this plant” (LE228U14) and the other project “Application of Trichoderma strains in sustainable quality bean production (LE251P18).

Conflicts of Interest

The authors declare no conflict of interest.

References

  1. Guerrero-González, M.L.; Rodríguez-Kessler, M.; Rodríguez-Guerra, R.; González-Chavira, M.; Simpson, J.; Sánchez, F.; Jiménez-Bremont, J.F. Differential expression of Phaseolus vulgaris genes induced during the interaction with Rhizoctonia solani. Plant Cell Rep. 2011, 30, 1465–1473. [Google Scholar] [CrossRef] [PubMed]
  2. Pieterse, C.M.J.; Leon-Reyes, A.; Van der Ent, S.; Van Wees, S.C.M. Networking by small-molecule hormones in plant immunity. Nat. Chem. Biol. 2009, 5, 308–316. [Google Scholar] [CrossRef] [PubMed] [Green Version]
  3. Denancé, N.; Sánchez-Vallet, A.; Goffner, D.; Molina, A. Disease resistance or growth: The role of plant hormones in balancing immune responses and fitness costs. Front. Plant Sci. 2013, 4, 155. [Google Scholar] [CrossRef] [PubMed]
  4. Mhlongo, M.I.; Steenkamp, P.A.; Piater, L.A.; Madala, N.E.; Dubery, I.A. Profiling of altered metabolomic states in Nicotiana tabacum cells induced by priming agents. Front. Plant Sci. 2016, 7, 1527. [Google Scholar] [CrossRef] [PubMed]
  5. Hagedorn, D.J. Rhizoctonia Root Rot. In Compendium of Bean Diseases; Hall, R., Ed.; APS, American Phytopathological Society: Saint Paul, MN, USA, 1991; p. 13. [Google Scholar]
  6. Hermosa, R.; Belén Rubio, M.; Cardoza, R.E.; Nicolás, C.; Monte, E.; Gutiérrez, S. The contribution of Trichoderma to balancing the costs of plant growth and defense. Int. Microbiol. 2013, 16, 69–80. [Google Scholar]
  7. Shoresh, M.; Harman, G.E.; Mastouri, F. Induced systemic resistance and plant responses to fungal biocontrol agents. Annu. Rev. Phytopathol. 2010, 48, 21–43. [Google Scholar] [CrossRef] [PubMed]
  8. Mayo, S.; Cominelli, E.; Sparvoli, F.; González-López, O.; Rodríguez-González, A.; Gutiérrez, S.; Casquero, P.A. Development of a qPCR strategy to select bean genes involved in plant defense response and regulated by the Trichoderma velutinum–Rhizoctonia solani interaction. Front. Plant Sci. 2016, 7, 1109. [Google Scholar] [CrossRef] [PubMed]
  9. Heuberger, A.L.; Robison, F.M.; Lyons, S.M.A.; Broeckling, C.D.; Prenni, J.E. Evaluating plant immunity using mass spectrometry-based metabolomics workflows. Front. Plant Sci. 2014, 5, 291. [Google Scholar] [CrossRef] [PubMed]
  10. Chen, X.; Qi, X.; Duan, L.-X. Overview. In Plant Metabolomics; Qi, X., Chen, X., Wang, Y., Eds.; Springer: Dordrecht, The Netherlands, 2015; pp. 1–24. [Google Scholar]
  11. Abu-Reidah, I.M.; Arráez-Román, D.; Lozano-Sánchez, J.; Segura-Carretero, A.; Fernández-Gutiérrez, A. Phytochemical characterisation of green beans (Phaseolus vulgaris L.) by using high-performance liquid chromatography coupled with time-of-flight mass spectrometry. Phytochem. Anal. 2013, 24, 105–116. [Google Scholar] [CrossRef] [PubMed]
  12. Hassan, S.; Mathesius, U. The role of flavonoids in root-rhizosphere signalling: Opportunities and challenges for improving plant-microbe interactions. J. Exp. Bot. 2012, 63, 3429–3444. [Google Scholar] [CrossRef] [PubMed]
  13. Harrison, M.J.; Dixon, R.A. Spatial patterns of expression of flavonoid/isoflavonoid pathway genes during interactions between roots of Medicago truncatula and the mycorrhizal fungus Glomus versiforme. Plant J. 1994, 6, 9–20. [Google Scholar] [CrossRef]
  14. Taiz, L.; Zeiger, E.; Møller, I.M.; Murphy, A.S. Plant Physiology and Development, 6th ed.; Taiz, L., Møller, I.M., Murphy, A., Zeiger, E., Eds.; Sinauer Associates, Incorporated: Sunderland, MA, USA, 2015; ISBN 9781605352558. [Google Scholar]
  15. Wink, M. Evolution of secondary metabolites from an ecological and molecular phylogenetic perspective. Phytochemistry 2003, 64, 3–19. [Google Scholar] [CrossRef]
  16. Wang, W.; Zhou, H.; Lin, H.; Roy, S.; Shaler, T.A.; Hill, L.R.; Norton, S.; Kumar, P.; Anderle, M.; Becker, C.H. Quantification of proteins and metabolites by mass spectrometry without isotopic labeling or spiked standards. Anal. Chem. 2003, 75, 4818–4826. [Google Scholar] [CrossRef] [PubMed]
  17. Lu, Y.; Lam, H.; Pi, E.; Zhan, Q.; Tsai, S.; Wang, C.; Kwan, Y.; Ngai, S. Comparative metabolomics in Glycine max and Glycine soja under salt stress to reveal the phenotypes of their offspring. J. Agric. Food Chem. 2013, 61, 8711–8721. [Google Scholar] [CrossRef] [PubMed]
  18. Brechenmacher, L.; Lei, Z.; Libault, M.; Findley, S.; Sugawara, M.; Sadowsky, M.J.; Sumner, L.W.; Stacey, G. Soybean metabolites regulated in root hairs in response to the symbiotic bacterium Bradyrhizobium japonicum. Plant Physiol. 2010, 153, 1808–1822. [Google Scholar] [CrossRef] [PubMed]
  19. Kanehisa Laboratories KEGG PATHWAY: Alpha-Linolenic Acid Metabolism—Phaseolus Vulgaris (Common Bean). Available online: http://www.kegg.jp/kegg-bin/show_pathway?org_name=pvu&mapno=00592&mapscale=&show_description=hide (accessed on 14 April 2018).
  20. Yannai, S. Dictionary of Food Compounds with CD-ROM, 2nd ed.; Yannai, S., Ed.; CRC Press Taylor & Francis Group: Boca Raton, FL, USA, 2012; ISBN 13:978-1-4200-8352-1. [Google Scholar]
  21. Buckingham, J.; Munasinghe, V.R.N. Dictionary of Flavonoids; Buckingham, J., Munasinghe, V.R.N., Eds.; Taylor & Francis Group: Boca Raton, FL, USA, 2015; ISBN 9781466554344. [Google Scholar]
  22. Wojakowska, A.; Muth, D.; Narożna, D.; Mądrzak, C.; Stobiecki, M.; Kachlicki, P. Changes of phenolic secondary metabolite profiles in the reaction of narrow leaf lupin (Lupinus angustifolius) plants to infections with Colletotrichum lupini fungus or treatment with its toxin. Metabolomics 2013, 9, 575–589. [Google Scholar] [CrossRef] [PubMed]
  23. Wojakowska, A.; Kułak, K.; Jasiński, M.; Kachlicki, P.; Stawiński, S.; Stobiecki, M. Metabolic response of narrow leaf lupine (Lupinus angustifolius) plants to elicitation and infection with Colletotrichum lupini under field conditions. Acta Physiol. Plant. 2015, 37, 152. [Google Scholar] [CrossRef]
  24. Southon, I.W.; Bisby, F.A.; Buckingham, J.; Harborne, J.B.; Zarucchi, J.L. Phytochemical Dictionary of the Leguminosae, 1st ed.; Bisby, F.A., Buckingham, J., Harbome, J.B., Eds.; Springer-Science + Business Media: London, UK, 1994; ISBN 978-0-412-39770-7. [Google Scholar]
  25. Rizk, A.-F.; Wood, G.E.; Salunkhe, D.K. Phytoalexins of leguminous plants. CRC Crit. Rev. Food Sci. Nutr. 1980, 13, 245–295. [Google Scholar] [CrossRef]
  26. Pushpa, D.; Yogendra, K.N.; Gunnaiah, R.; Kushalappa, A.C.; Murphy, A. Identification of late blight resistance-related metabolites and genes in potato through nontargeted metabolomics. Plant Mol. Biol. Rep. 2014, 32, 584–595. [Google Scholar] [CrossRef]
  27. Contreras-Cornejo, H.A.; Macías-Rodríguez, L.; López-Bucio, J.S.; López-Bucio, J. Enhanced plant immunity using Trichoderma. In Biotechnology and Biology of Trichoderma; Gupta, V.G., Schmoll, M., Herrera-Estrella, A., Upadhyay, R.S., Druzhinina, I., Tuohy, M., Eds.; Elsevier: Oxford, UK, 2014; pp. 495–504. ISBN 9780444595768. [Google Scholar]
  28. Robison, F.M.; Turner, M.F.; Jahn, C.E.; Schwartz, H.F.; Prenni, J.E.; Brick, M.A.; Heuberger, A.L. Common bean varieties demonstrate differential physiological and metabolic responses to the pathogenic fungus Sclerotinia sclerotiorum. Plant Cell Environ. 2018, 41, 2141–2154. [Google Scholar] [CrossRef]
  29. VanEtten, H.D.; Mansfield, J.W.; Bailey, J.A.; Farmer, E.E. Two Classes of Plant Antibiotics: Phytoalexins versus “Phytoanticipins”. Plant Cell 1994, 6, 1191–1192. [Google Scholar] [CrossRef] [PubMed]
  30. Ahuja, I.; Kissen, R.; Bones, A.M. Phytoalexins in defense against pathogens. Trends Plant Sci. 2012, 17, 73–90. [Google Scholar] [CrossRef] [PubMed]
  31. Morrissey, J.P.; Osbourn, A.E. Fungal resistance to plant antibiotics as a mechanism of pathogenesis. Microbiol. Mol. Biol. Rev. 1999, 63, 708–724. [Google Scholar] [PubMed]
  32. Hammerschmidt, R.; Becker, J.S. Acquired resistance to disease in plants. In Horticultural Reviews; Janick, J., Ed.; John Wiley & Sons: New York, NY, USA, 1997; Volume 18, pp. 247–280. ISBN 0-471-57334-5. [Google Scholar]
  33. Pieterse, C.M.J.; Van der Does, D.; Zamioudis, C.; Leon-Reyes, A.; Van Wees, S.C.M. Hormonal modulation of plant immunity. Annu. Rev. Cell Dev. Biol. 2012, 28, 489–521. [Google Scholar] [CrossRef] [PubMed]
  34. Glawischnig, E. Camalexin. Phytochemistry 2007, 68, 401–406. [Google Scholar] [CrossRef] [PubMed]
  35. Pourcel, L.; Routaboul, J.; Cheynier, V.; Lepiniec, L.; Debeaujon, I. Flavonoid oxidation in plants: From biochemical properties to physiological functions. Trends Plant Sci. 2007, 12, 29–36. [Google Scholar] [CrossRef] [PubMed]
  36. Kuc, J. Phytoalexins, stress metabolism, and disease resistance in plants. Annu. Rev. Phytopathol. 1991, 33, 275–297. [Google Scholar] [CrossRef]
  37. Yogendra, K.N.; Kushalappa, A.C.; Sarmiento, F.; Rodriguez, E.; Mosquera, T. Metabolomics deciphers quantitative resistance mechanisms in diploid potato clones against late blight. Funct. Plant Biol. 2015, 42, 284–298. [Google Scholar] [CrossRef]
  38. Heitz, T.; Smirnova, E.; Widemann, E.; Aubert, Y.; Pinot, F.; Ménard, R. The rise and fall of jasmonate biological activities. In Lipids in Plant and Algae Development; Springer International Publishing: New York, NY, USA, 2016; pp. 405–426. [Google Scholar]
  39. Druzhinina, I.S.; Seidl-Seiboth, V.; Herrera-Estrella, A.; Horwitz, B.A.; Kenerley, C.M.; Monte, E.; Mukherjee, P.K.; Zeilinger, S.; Grigoriev, I.V.; Kubicek, C.P. Trichoderma: The genomics of opportunistic success. Nat. Rev. Microbiol. 2011, 9, 749–759. [Google Scholar] [CrossRef]
  40. Vinale, F.; Sivasithamparam, K.; Ghisalberti, E.L.; Ruocco, M.; Woo, S.; Lorito, M. Trichoderma secondary metabolites that affect plant metabolism. Nat. Prod. Commun. 2012, 7, 1545–1550. [Google Scholar]
  41. Hoyos-Carvajal, L.; Orduz, S.; Bissett, J. Growth stimulation in bean (Phaseolus vulgaris L.) by Trichoderma. Biol. Control 2009, 51, 409–416. [Google Scholar] [CrossRef]
  42. Qureshi, M.A.; Iqbal, A.; Akhtar, N.; Shakir, M.A.; Khan, A. Co-inoculation of phosphate solubilizing bacteria and rhizobia in the presence of L-tryptophan for the promotion of mash bean (Vigna mungo L.). Soil Environ. 2012, 31, 47–54. [Google Scholar]
  43. Luna-Vital, D.A.; Mojica, L.; González de Mejía, E.; Mendoza, S.; Loarca-Piña, G. Biological potential of protein hydrolysates and peptides from common bean (Phaseolus vulgaris L.): A review. Food Res. Int. 2015, 76, 39–50. [Google Scholar] [CrossRef]
  44. Mayo, S.; Gutierrez, S.; Malmierca, M.G.; Lorenzana, A.; Campelo, M.P.; Hermosa, R.; Casquero, P.A. Influence of Rhizoctonia solani and Trichoderma spp. in growth of bean (Phaseolus vulgaris L.) and in the induction of plant defense-related genes. Front. Plant Sci. 2015, 6, 685. [Google Scholar] [CrossRef] [PubMed]
  45. Talhaoui, N.; Gómez-Caravaca, A.M.; Roldán, C.; León, L.; De la Rosa, R.; Fernández-Gutiérrez, A.; Segura-Carretero, A. Chemometric analysis for the evaluation of phenolic patterns in olive leaves from six cultivars at different growth stages. J. Agric. Food Chem. 2015, 63, 1722–1729. [Google Scholar] [CrossRef]
Figure 1. Scheme of the treatments performed in this work: CC, water control plants without fungal treatments; CT028, seeds coated with T. velutinum grown in uninfected soil; CR, untreated seed grown in R. solani (R43)-infected soil; and RT028, seeds coated with T. velutinum (T028) grown in R. solani (R43)-infected soil.
Ijms 20 00549 g001
Figure 2. ESI-TIC chromatogram of leaf extracts obtained from control plants (CC), separated by LC-MS. See Table 1 for identification of the detected compounds.
Ijms 20 00549 g002
Figure 3. Venn diagram with the compounds with an Up-production and Down-production. See Table 2 for the putatively identified compounds in the interactions.
Ijms 20 00549 g003
Figure 4. Principal components analysis of 36 compounds extracted from bean leaves subjected to different treatments. (Blue) control beans without pathogen and biocontrol agent (CC); (Red) beans that were infected with R. solani (CR); (Yellow) beans inoculated with T. velutinum (CT028); (Green) beans inoculated with R. solani and T. velutinum (RT028).
Ijms 20 00549 g004
Table 1. Phytochemical compounds determined in bean leaves by LC-MS analysis, including experimental mass, m/z, score, retention time (RT), formula, their putative identity and related references. Data refer only to compounds that accumulated differentially in leaves of plants inoculated with the fungal isolates compared to controls.
PeakExperimental Massm/zScoreDiff (ppm)RT (min)FormulaPutative IdentificationReference
Amino acids
8204.0898203.0826 [M − H] 407.1733 [2M − H]49.94−0.098.52C11H12N2O2l-TryptophanPubChem ID number—6305
[17]
15246.1004245.09315 [M − H]99.910.0514.20C13H14N2O3N-acetyltryptophanPubChem ID number—2002
[17]
Peptides
7230.1629229.1557 [M − H]87.050.288.42C11H22N2O3Valyl-LeucinePubChem ID number—107487
11372.2371371.2298 [M − H] 743.4673 [2M − H]99.840.4110.00C17H32N4O5Ile Gln IleNA
29402.1863401.1788 [M − H]98.040.7019.94C15H26N6O7Gln Gln GlnNA
Carbohydrates
2342.1159341.1087 [M − H]99.710.831.43C12H22O11SucrosePubChem ID number—5988
[17]
Glycosides
4338.0848337.0775 [M − H]85.700.874.96C12H18O11l-Ascorbic acid-2-glucosidePubChem ID number—54693473
Fatty acids
35278.22338277.2169 [M − H] 555.4410 [2M − H]84.782.2630.59C18H30O2γ-Linolenic acidPubChem ID number—5280933
[17,18,19]
Lipids
Fatty acyls—Octadecanoids
34294.2195293.2122 [M − H]99.670.7626.29C18H30O313(S)-HOTrEPubChem ID number—47205624
Glycerophosphates
36578.4296577.4226 [M − H]90.870.4330.59C31H63O7PPA(O-16:0/12:0)PubChem number—52929565
Fatty acyls glycoside
30334.1990333.1916 [M − H]89.560.3819.94C16H30O73-O-α-l-rhamnopyranosyl-3-hydroxydecanoic acidPubChem ID number—56936287
[20,21]
Flavonoids
Flavone
22374.0998373.0926 [M − H]99.350.8616.90C19H18O83′,5-Dihydroxy-3,4′,6,7-tetramethoxyflavone[21]
27390.0951389.0874 [M − H]82.881.1018.32C19H18O95,2′,4′-Trihydroxy-3,7,8,5′-tetramethoxyflavonePubChem ID number—85296959
Flavonol
12596.1739595.1666 [M − H]99.670.3310.27C26H28O16Quercetin 3-vicianosidePubChem Id number—44259139
[11]
26454.2409453.2338 [M − H]99.760.2918.05C20H38O11n-Octyl-β-d-maltopyranosideNA
Flavonol
21414.2248413.2177 [M − H]82.590.3716.25C29H50OSitosterolPubChem ID number—86821
[17,21]
Flavonone
3580.1847579.1773 [M − H]99.420.721.47C27H32O14NaringinPubChem ID number—442428
[17]
Flavonoids glycoconjugate
1400.1006399.0930 [M − H]49.900.301.31C17H20O115-Hydroxy-6,8-dimethoxy-2-oxo-2H-chromen-7-yl β-d-glucopyranosideNA
10612.1686611.1613 [M − H]99.030.759.37C27H32O163,4′,5,7-Tetrahydroxyflavanone 3,7-Di-O-β-d-glucopyranosideCAS Number—80212-10-8
[21]
14552.1841551.1762 [M − H]97.551.6011.13C26H32O13(Z)-Resveratrol 3,4′-diglucosidePubChem ID number—22298557
[20]
16642.1193641.1119 [M − H]99.690.0914.34C30H26O16Quercetagetin 7-(6″-(E)-caffeoylglucoside)PubChem Id number—44259848
18654.1769653.1697 [M − H]99.89−0.2016.11C29H34O17Isopyrenin 7-O-glucosideCAS Number—61252-86-6
[21]
19540.1838539.1766 [M − H]99.490.8916.11C25H32O1312-Hydroxy, O-[3,4,5-trihydroxybenzoyl-(06)-β-d-glucopyranoside][20]
20678.2894677.2822 [M − H]85.360.9816.24C32H39O16Luteone 4,7-O-diglucoside[22,23]
24470.2359469.2287 [M − H]98.560.2517.61C20H38O12(R)-1-O-[β-d-Glucopyranosyl-(1-6)-β-d-glucopyranoside]-1,3-octanediolHMDB Id number—32799
Isoflavanoid
28338.1522337.1451[M − H] 319.1298 [M − H2O] 168.0663 [M − 2H]78.850.318.38C21H22O42′-O-MethylphaseollinisoflavanCAS Number—49594-01-6
[19,23,24]
Isoflavanone
25424.2304423.2234 [M − H]98.580.5817.62C25H28O62′,4′,5,7-Tetrahydroxy-3′,8-diprenylisoflavanoneCAS Number—64280-18-8
[24]
Isoflavans
6324.1419323.1346 [M − H] 647.2765 [2M − H]99.890.298.13C20H20O4PhaseollinisoflavanPubChem ID number—4484952
[25]
Phenols
Tyrosols
5316.1153315.1082 [M − H]97.001.577.29C14H20O8Hydroxytyrosol 1-O-glucosidePubChem ID number—13845930
Phenylpropanoids
13386.1201385.1127 [M − H]94.903.1710.71C17H22O101-O-SinapoylglucosePubChem ID number—5280406
Xanthonoid
31392.1102391.1032 [M − H]97.711.0721.10C19H20O9Garcimangosone DPubChem ID number—11003703
[20]
33628.3063627.2991 [M − H]99.440.8325.77C38H44O8Gambogic acidPubChem ID number—5281632
Terpenes
Terpenoid
9444.1995443.1923 [M − H]99.840.068.88C21H32O10Dihydrophaseic acid 4-O-β-d-glucosideChEBI Id number—23758
[26]
Triterpenoid
32896.5127895.5050 [M − H]98.640.4724.97C47H76O16Akeboside StePubChem ID number—46173935
Terpene glycosides
17416.2046415.1971 [M − H]99.530.5214.78C20H32O9Ethyl 7-epi-12-hydroxyjasmonate glucosideHMDB Id number—36340
[17]
Terpene
23268.1308267.1235 [M − H] 535.2548 [2M − H]49.761.0917.52C14H20O5TeucreinChemSpider ID number—28944862
RT: retention time; NA: not available; CAS: https://www.cas.org/cas-home (access on 15 April 2018); ChemSpider: http://www.chemspider.com (access on 20 June 2018); HMDB: http://www.hmdb.ca (access on 30 May 2018); PubChem: https://pubchem.ncbi.nlm.nih.gov (access on 18 July 2018).
Table 2. Homologies of putatively identified compounds in the bean metabolome and changes in their accumulation pattern occurring when different interaction conditions (three-way, two-way and no interaction) were compared.
IdFormulaPutative IdentificationCT028 vs. CC aCR vs. CC aRT028 vs. CC a
Amino acids
8C11H12N2O2l-TryptophanUpDown--
15C13H14N2O3N-acetyltryptophan--DownUp
Peptides
7C11H22N2O3Valyl-LeucineUpDownUp
11C17H32N4O5Ile Gln Ile--DownDown
29C15H26N6O7Gln Gln GlnDown--Down
Carbohydrates
2C12H22O11SucroseUpUp--
Glycosides
4C12H18O11l-Ascorbic acid-2-glucoside--Up--
Fatty acids
35C18H30O2γ-Linolenic acid--DownDown
Lipids
30C16H30O73-O-α-l-rhamnopyranosyl-3-hydroxydecanoic acidDown--Down
34C18H30O313(S)-HOTrE--Down--
36C31H63O7PPA(O-16:0/12:0)--DownDown
Flavonoids
1C17H20O115-Hydroxy-6,8-dimethoxy-2-oxo-2H-chromen-7-yl β-d-glucopyranosideDownDownDown
3C27H32O14NaringinUp----
6C20H20O4Phaseollinisoflavan----Down
10C27H32O163,4’,5,7-Tetrahydroxyflavanone 3,7-Di-O-β-d-glucopyranosideUp--Up
12C26H28O16Quercetin 3-vicianoside----Up
14C26H32O13(Z)-Resveratrol 3,4′-diglucoside----Up
16C30H26O16Quercetagetin 7-(6″-(E)-caffeoylglucoside)--Down--
18C29H34O17Isopyrenin 7-O-glucosideDownDownDown
19C25H32O1312-Hydroxy, O-[3,4,5-trihydroxybenzoyl-(06)-β-d-glucopyranoside]DownDownDown
20C32H39O16Luteone 4,7-O-diglucosideUpDownUp
21C29H50OSitosterol----Up
22C19H18O83′,5-Dihydroxy-3,4′,6,7-tetramethoxyflavoneDownDownDown
24C20H38O12(R)-1-O-[β-d-Glucopyranosyl-(1-6)-β-d-glucopyranoside]-1,3-octanediolDown--Down
25C25H28O62′,4′,5,7-Tetrahydroxy-3′,8-diprenylisoflavanoneDown--Down
26C20H38O11n-Octyl-β-d-maltopyranosideDown----
27C19 H18 O95,2’,4′-Trihydroxy-3,7,8,5′-tetramethoxyflavoneDownDownDown
28C21H22O42′-O-MethylphaseollinisoflavanDown--Down
Phenols
5C14H20O8Hydroxytyrosol 1-O-glucosideDown----
13C17H22O101-O-SinapoylglucoseUp--Up
31C19H20O9Garcimangosone DDownDownDown
33C38H44O8Gambogic acidDown--Down
Terpenes
9C21H32O10Dihydrophaseic acid 4-O-β-d-glucosideUp----
17C20H32O9Ethyl 7-epi-12-hydroxyjasmonate glucosideUpUpUp
23C14H20O5TeucreinUp----
32C47H76O16Akeboside SteDownDownDown
a CC: Plant alone; CR: Plant + R. solani; CT028: Plant + T. velutinum T028; RT028: Plant + T. velutinum T028 + R. solani.

