Next Article in Journal
Accessibility of Cations to the Selectivity Filter of KcsA in the Inactivated State: An Equilibrium Binding Study
Next Article in Special Issue
Response of Tibetan Wild Barley Genotypes to Drought Stress and Identification of Quantitative Trait Loci by Genome-Wide Association Analysis
Previous Article in Journal
Early Pregnancy Human Decidua is Enriched with Activated, Fully Differentiated and Pro-Inflammatory Gamma/Delta T Cells with Diverse TCR Repertoires
Previous Article in Special Issue
Overexpression of TaCOMT Improves Melatonin Production and Enhances Drought Tolerance in Transgenic Arabidopsis
 
 
Correction published on 13 August 2019, see Int. J. Mol. Sci. 2019, 20(16), 3937.
Article

Circadian Regulation of Alternative Splicing of Drought-Associated CIPK Genes in Dendrobium catenatum (Orchidaceae)

Research Institute of Forestry; State Key Laboratory of Tree Genetics and Breeding, Chinese Academy of Forestry, Beijing 100091, China
*
Author to whom correspondence should be addressed.
These authors contributed equally to this work.
Int. J. Mol. Sci. 2019, 20(3), 688; https://0-doi-org.brum.beds.ac.uk/10.3390/ijms20030688
Submission received: 20 January 2019 / Revised: 31 January 2019 / Accepted: 1 February 2019 / Published: 5 February 2019
(This article belongs to the Special Issue Mechanisms of Drought Stress Tolerance in Plants)

Abstract

:
Dendrobium catenatum, an epiphytic and lithophytic species, suffers frequently from perennial shortage of water in the wild. The molecular mechanisms of this orchid’s tolerance to abiotic stress, especially drought, remain largely unknown. It is well-known that CBL-interacting protein kinase (CIPKs) proteins play important roles in plant developmental processes, signal transduction, and responses to abiotic stress. To study the CIPKs’ functions for D. catenatum, we first identified 24 CIPK genes from it. We divided them into three subgroups, with varying intron numbers and protein motifs, based on phylogeny analysis. Expression patterns of CIPK family genes in different tissues and in response to either drought or cold stresses suggested DcaCIPK11 may be associated with signal transduction and energy metabolism. DcaCIPK9, -14, and -16 are predicted to play critical roles during drought treatment specifically. Furthermore, transcript expression abundances of DcaCIPK16 showed polar opposites during day and night. Whether under drought treatment or not, DcaCIPK16 tended to emphatically express transcript1 during the day and transcript3 at night. This implied that expression of the transcripts might be regulated by circadian rhythm. qRT-PCR analysis also indicated that DcaCIPK3, -8, and -20 were strongly influenced by circadian rhythmicity. In contrast with previous studies, for the first time to our knowledge, our study revealed that the major CIPK gene transcript expressed was not always the same and was affected by the biological clock, providing a different perspective on alternative splicing preference.

1. Introduction

Drought stress—a major environmental factor—affects the geographical distribution of plants, restricts crop productivity in agriculture, and causes food security problems [1]. Dendrobium catenatum is an epiphyte that sticks to the surface of other plants or to naked rocks in the natural environment [2,3]. Because of minimal water interception in these habitats, its roots seriously lack available water and nutrients [4]. To survive the tough environment, D. catenatum has evolved succulent pseudobulbs and crassulacean acid metabolism (CAM), a photosynthetic metabolic pathway with high water use efficiency, in response to such a harsh natural environment [2,5,6]. As a highly drought-tolerant species, D. catenatum can serve as a model to study survival strategies of plants coping with drought. Studying the gene spectrum of a highly resistant plant that spans evolutionary timescales is the most direct and effective way to implement stress tolerance gene engineering.
The homologous proteins SnRK in green plants, SNF1 in yeast, and AMPK in mammals belong to the SNF1 protein kinase superfamily. Stress-signaling pathways related to yeast SNF1 and mammalian AMPK indicate that the green plant SnRK evolved from energy sensing [7,8,9,10]. The SnRK-CIPK subfamily, the members of which have a self-inhibitory NAF domain in the C-terminus and a serine/threonine protein kinase domain in the N-terminus, is crucial to the calcium signaling pathway. The large number of identified CBL–CIPK combinations suggests that the module is important for transmission of various abiotic stress signals with calcium as a second messenger [11,12]. For example, under low potassium stress, a cytosolic calcium signal activates AtCIPK23 via AtCBL1 and AtCBL9 to phosphorylate and activate the potassium channel AKT1 [13]. Abscisic acid (ABA) accumulation, which is a general response to drought and salt stress, activates the AtCBL1/9-AtCIPK26 complex to phosphorylate effector proteins such as RbohF [14]. By overexpression of OsCIPK23 and cotton CIPK6, drought tolerance in Arabidopsis and rice can be enhanced, respectively [15,16].
Given its important roles, the CIPK gene family has been widely characterized in many species, including Arabidopsis [17,18], poplar [18], maize [19], rice [20], soybean [21], and canola [22]. D. catenatum, which has a CAM photosynthetic pathway, exhibits high resistance to drought. Yet, its drought resistance strategy is still not clear. To date, a genome-wide analysis of the CIPK gene family in D. catenatum has not been performed. The publication of the draft genome sequence of D. catenatum enables an analysis of the phylogeny, evolution, structure, and expression of the CIPK gene family [2]. In this study, we identified 24 DcaCIPK family members and divided these into intron-poor and intron-rich clades. The gene expression patterns of CIPK genes in different tissues and under drought and cold stress were analyzed using public transcriptome data. Moreover, we examined express patterns for transcripts of CIPK members under drought stress during day and night.

2. Results

2.1. Genome-Wide Identification of CIPK Gene Family Members in D. catenatum

In total, 24 genes containing both a NAF domain and a kinase domain were identified as CIPK gene family members in the orchid. Twenty-two members inferred from the orchid genome annotation [2] and two new CIPK genes (Novl001335 and Novl001612) were newly annotated from novel genetic loci with transcript assembly. The number of amino acid residues of DcaCIPK primary proteins ranged from 401 to 502. The relative molecular weights of these CIPK kinase proteins varied from 45.15 to 57.14 KDa. All the proteins had high isoelectric points (pI > 7.0). Detailed information for these genes is listed in Table 1.

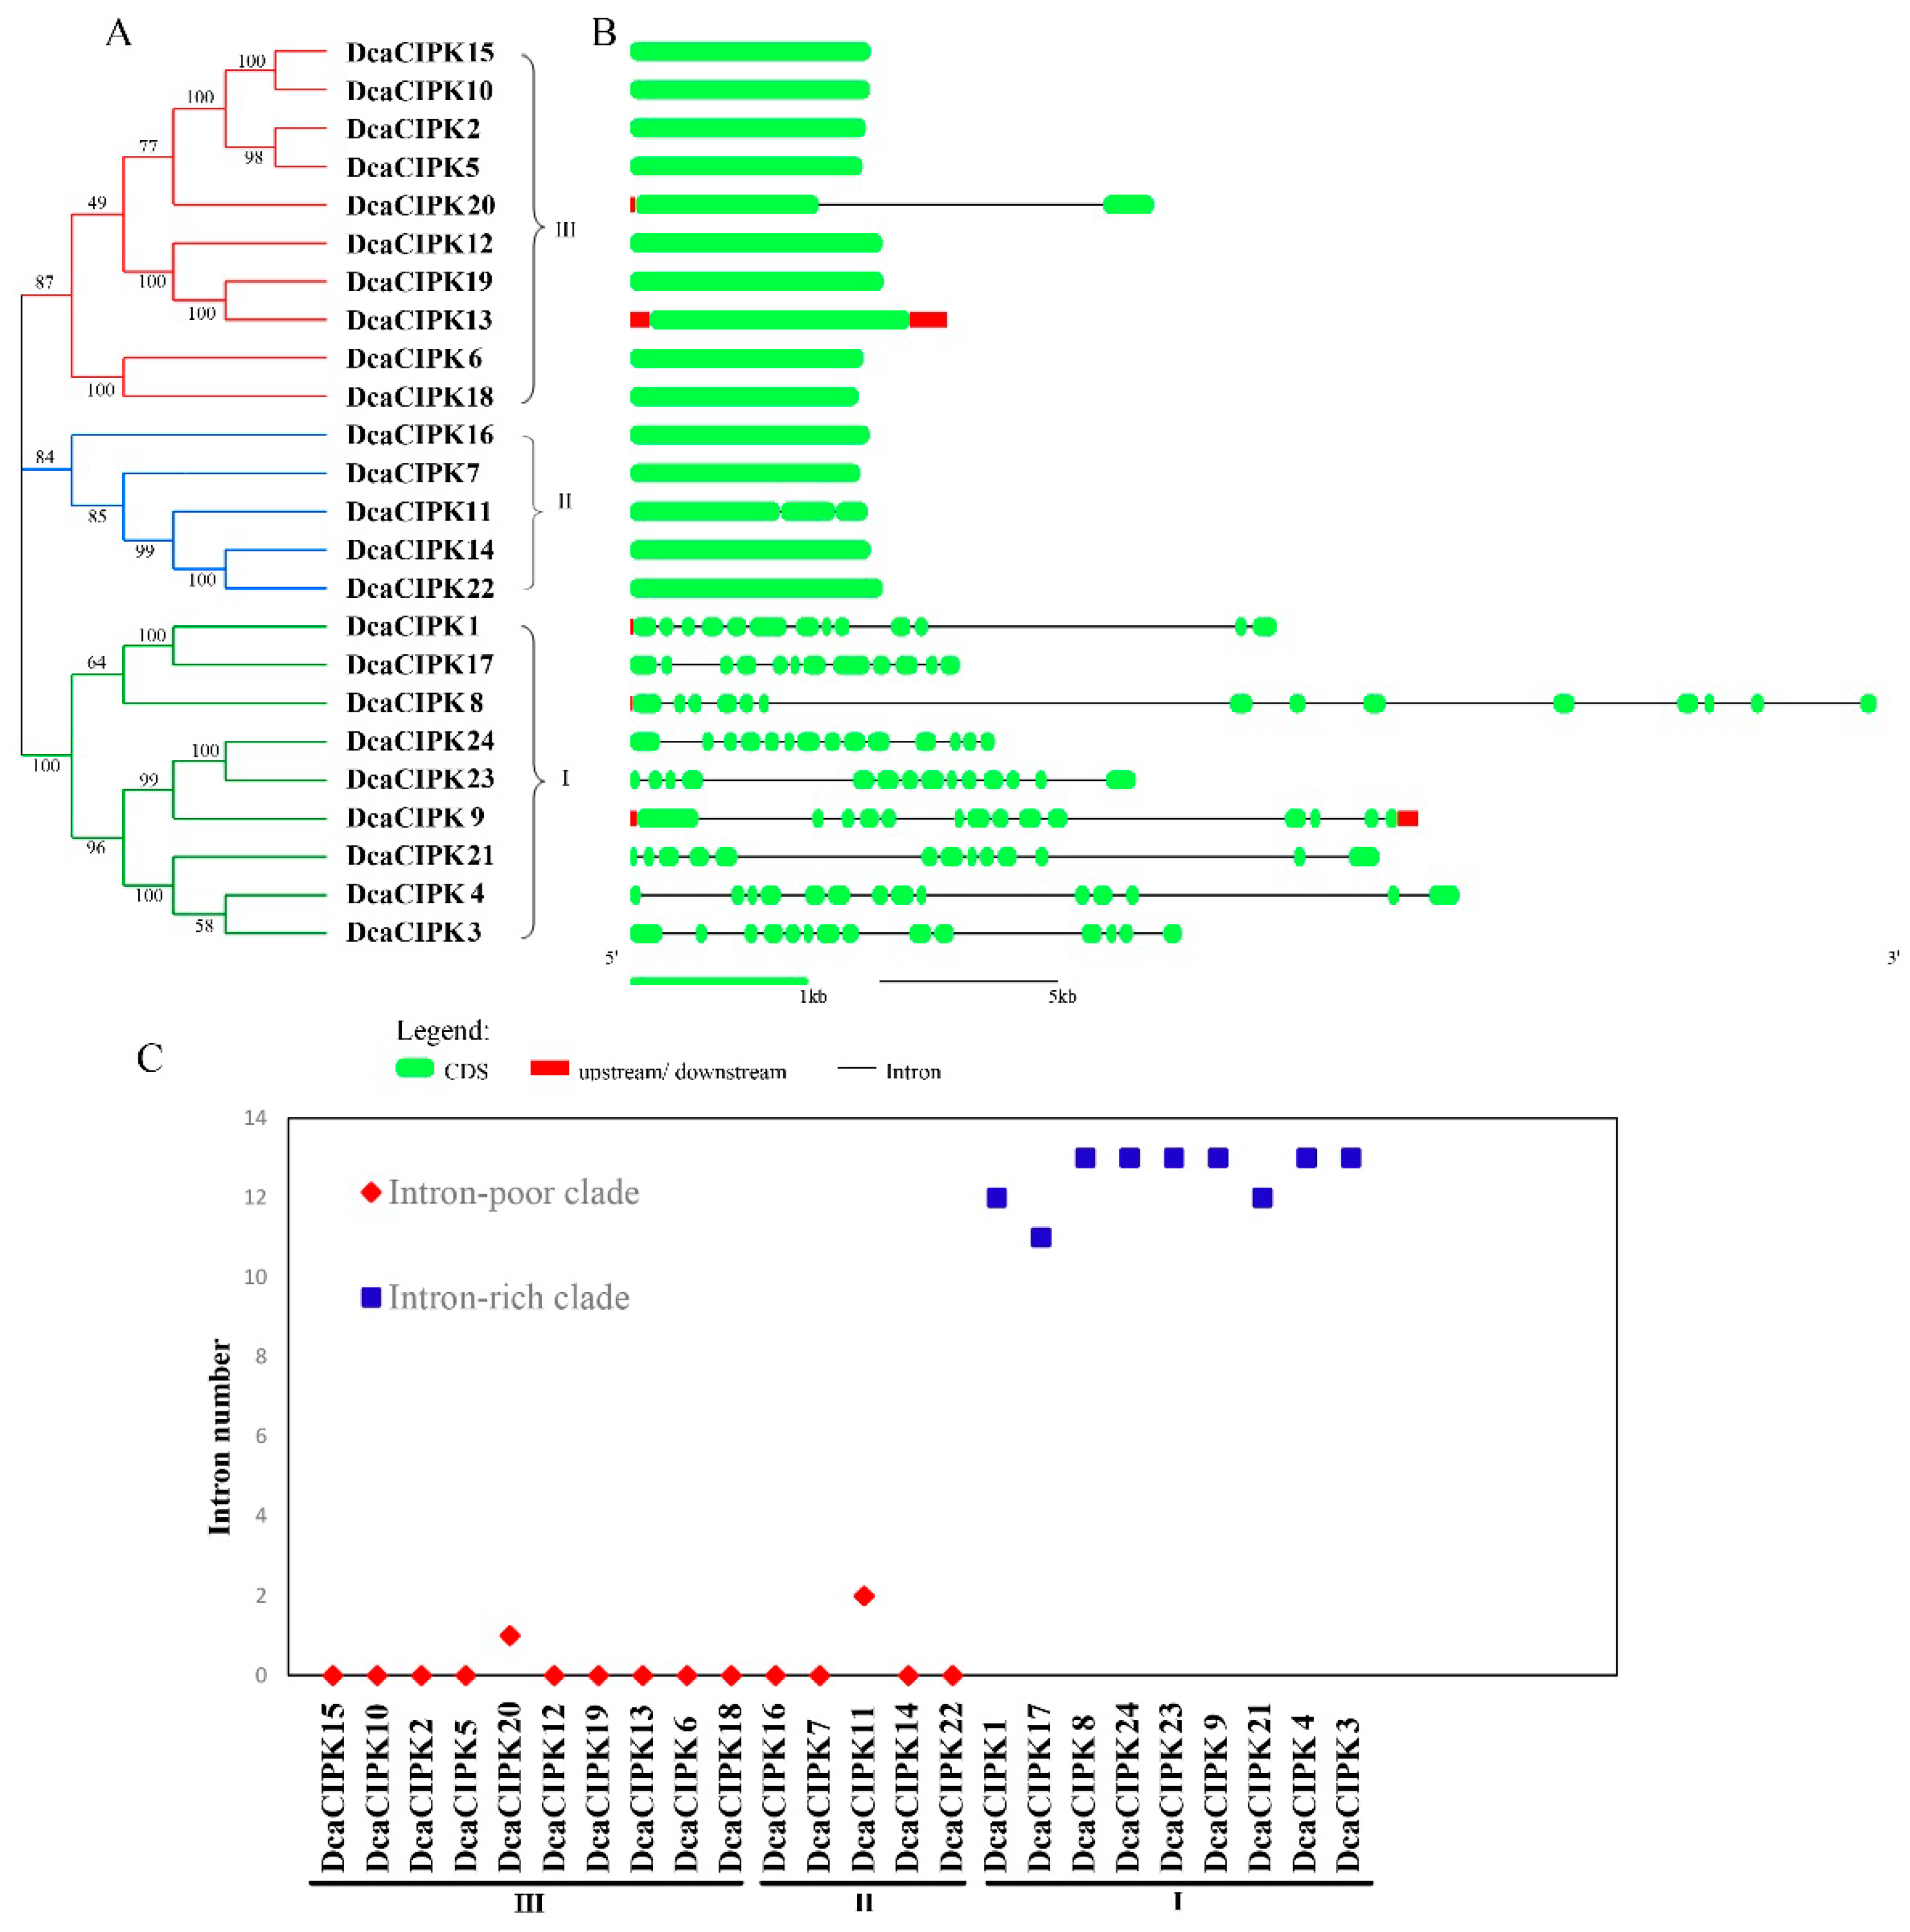
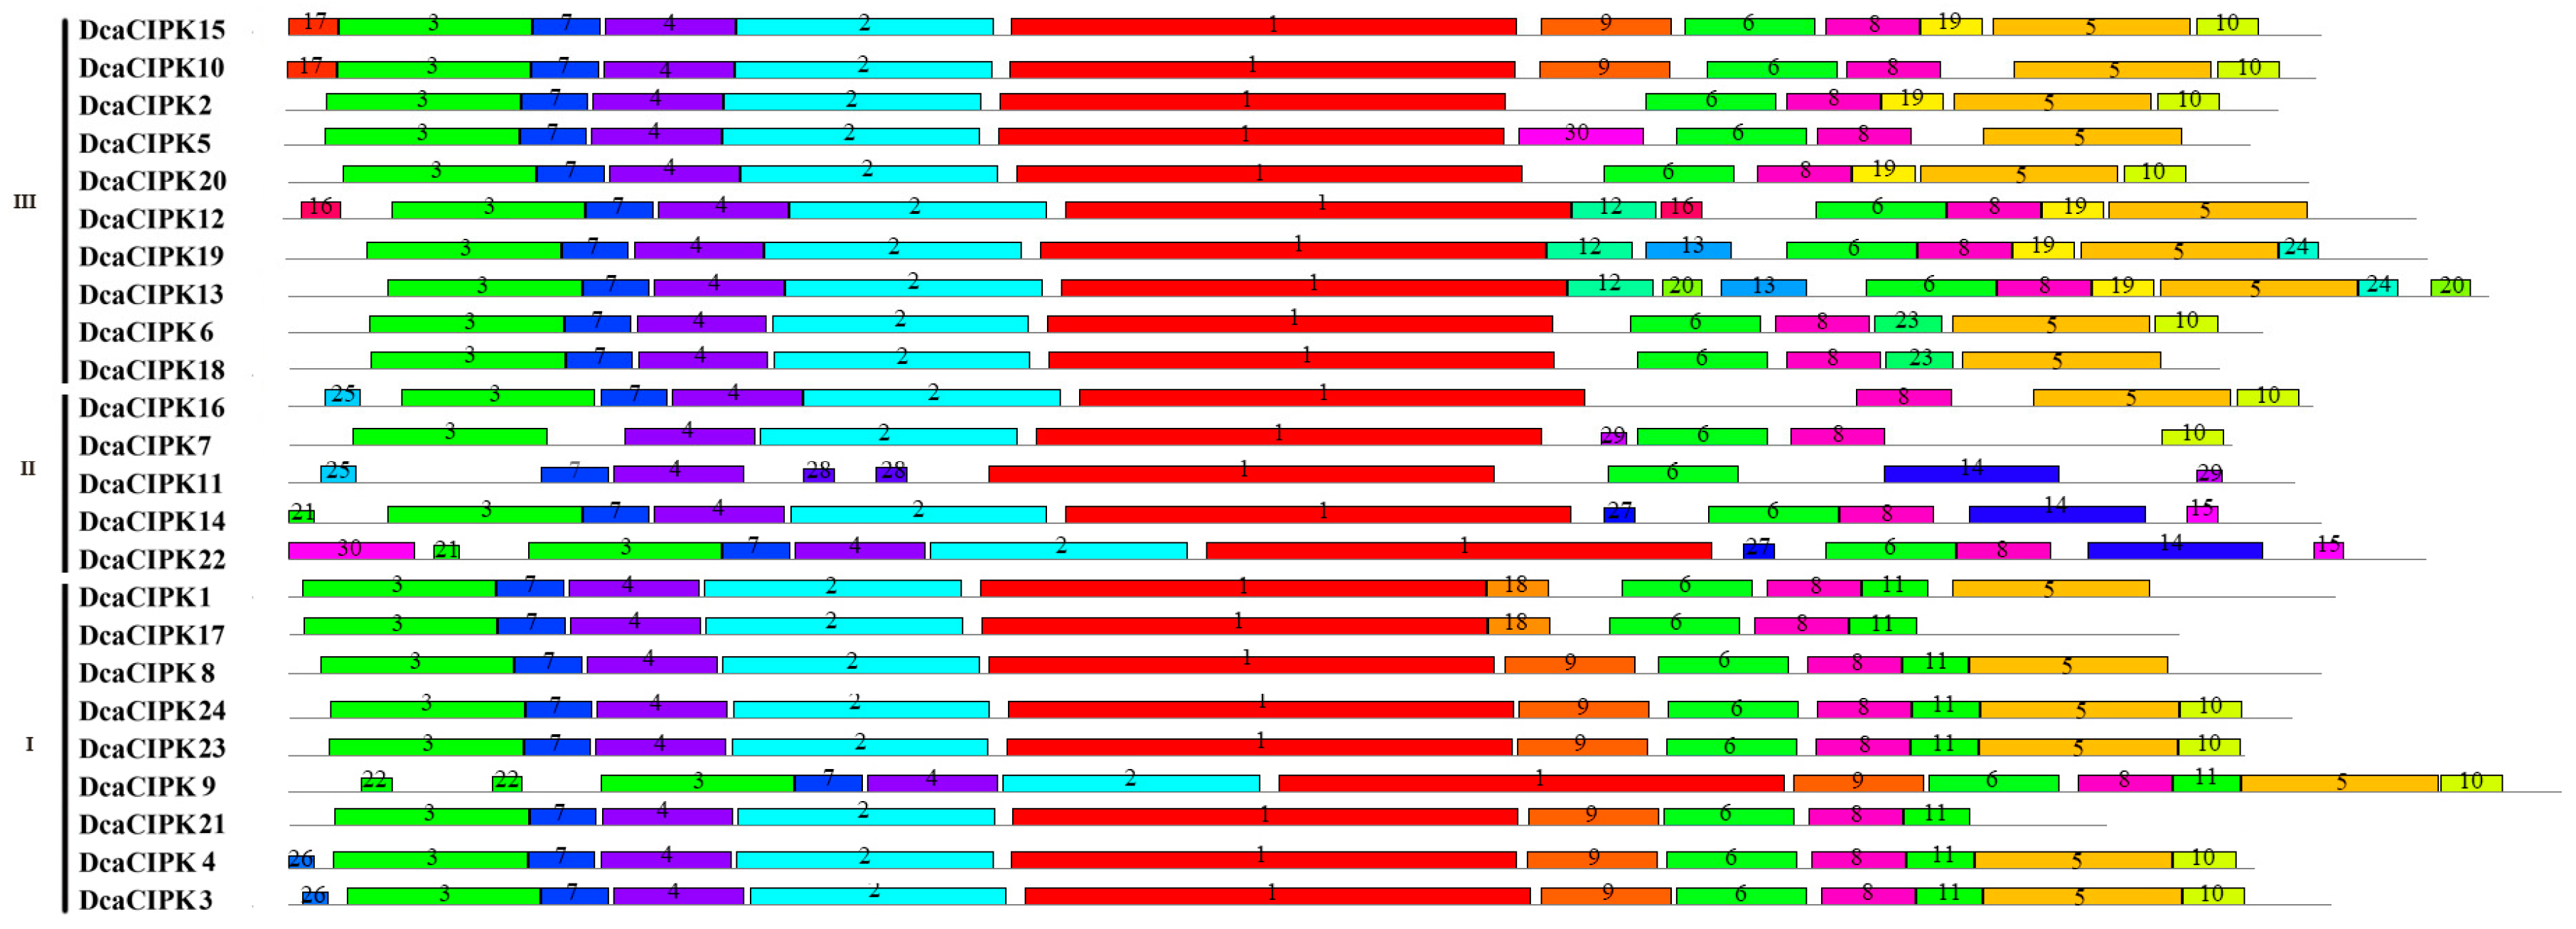
2.2. Phylogenetic Analysis and Structure of the D. catenatum CIPK Gene Family

Phylogenetic analysis classified the CIPK family members into three subgroups (I, II, and III), whose genes contain nine, five, and ten members, respectively (Figure 1A). To further study the features of the genes (from primary genome annotation), the composition and position of exons, introns, and conserved elements were analyzed. The DcaCIPK gene members were clearly divided into an intron-rich clade (>8 intron per gene) and an intron-poor clade [19,23]. All the intron-rich clade members belonged to subgroup I, and those intron-poor clade members related to subgroups II and III (Figure 1B). In subgroups III and II, their genes have introns ranged from zero to four (Figure 1C). In subgroup I, most members contained 13 introns, two members (DcaCIPK1, DcaCIPK21) contained 12 introns, and only one gene (DcaCIPK17) had 11 introns (Figure 1C).
The MEME suite was used to discover conserved motifs of DcaCIPK proteins. Thirty motifs were identified using previously determined parameter settings (see Methods). Twelve of those were statistically significant with an E-value less than 0.05. All CIPK proteins contained motifs 1 and 4. Motifs 11, 18, 22, and 26 were only found in members of the intron-rich clade. Motifs 14, 15, 21, 25, 27, 28, and 29 only existed in subgroup II; motifs 12, 13, 16, 17, 19, 20, 23, and 24 were only found in subgroup III; and motifs 11, 18, 22, and 26 were only in subgroup I (Figure 2).

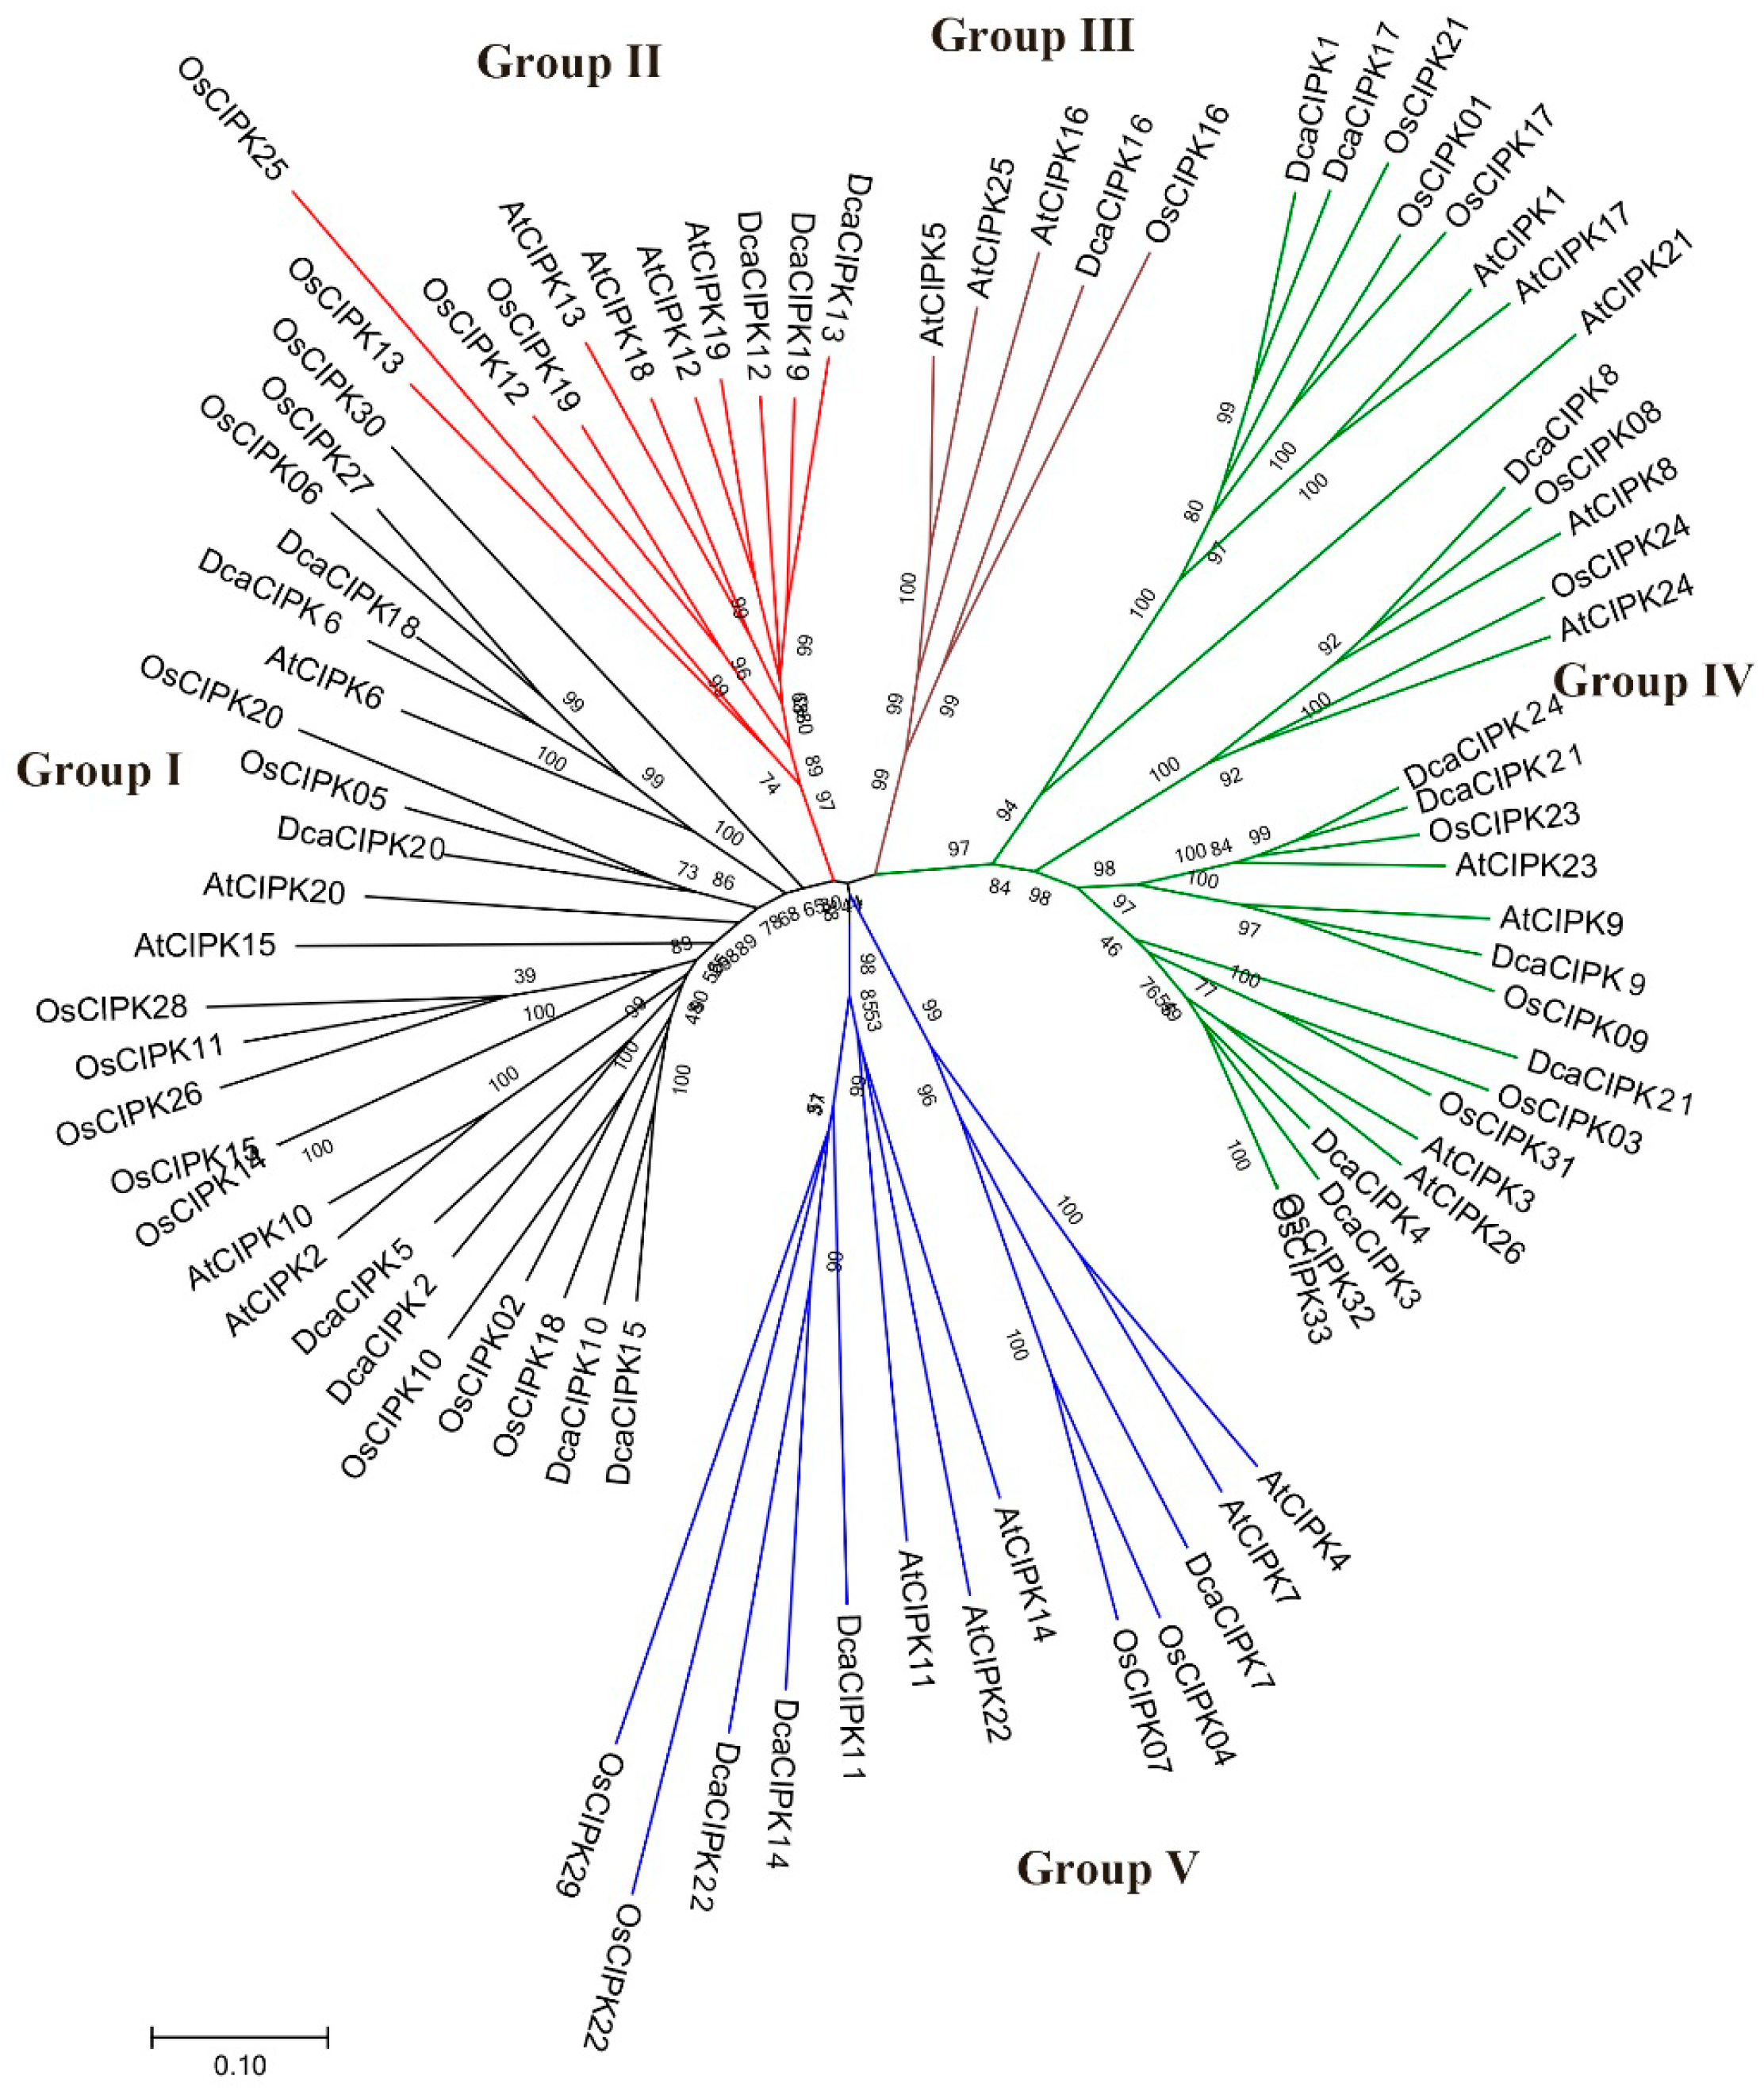
2.3. Phylogenetic Analysis of CIPK in Plants

An NJ (neighbor-joining) phylogenetic tree was built to scrutinize the evolutionary relationships of CIPK family members. Eighty-three protein sequences, including those from Arabidopsis, rice, and D. catenatum, were divided into five groups (Groups I–V). Proteins from all nine intron-rich DcaCIPKs were clustered in Group IV. Including nine AtCIPKs and 11 OsCIPKs, Group IV was the largest group. Group I comprised seven DcaCIPKs, five AtCIPKs, and 13 OsCIPKs. Group II consisted of three DcaCIPKs, four AtCIPKs, and four OsCIPKs. Group III was the smallest group, containing one DcaCIPK, three AtCIPKs, and one OsCIPK. Finally, four DcaCIPKs, five AtCIPKs, and four OsCIPKs were within Group V (Figure 3).

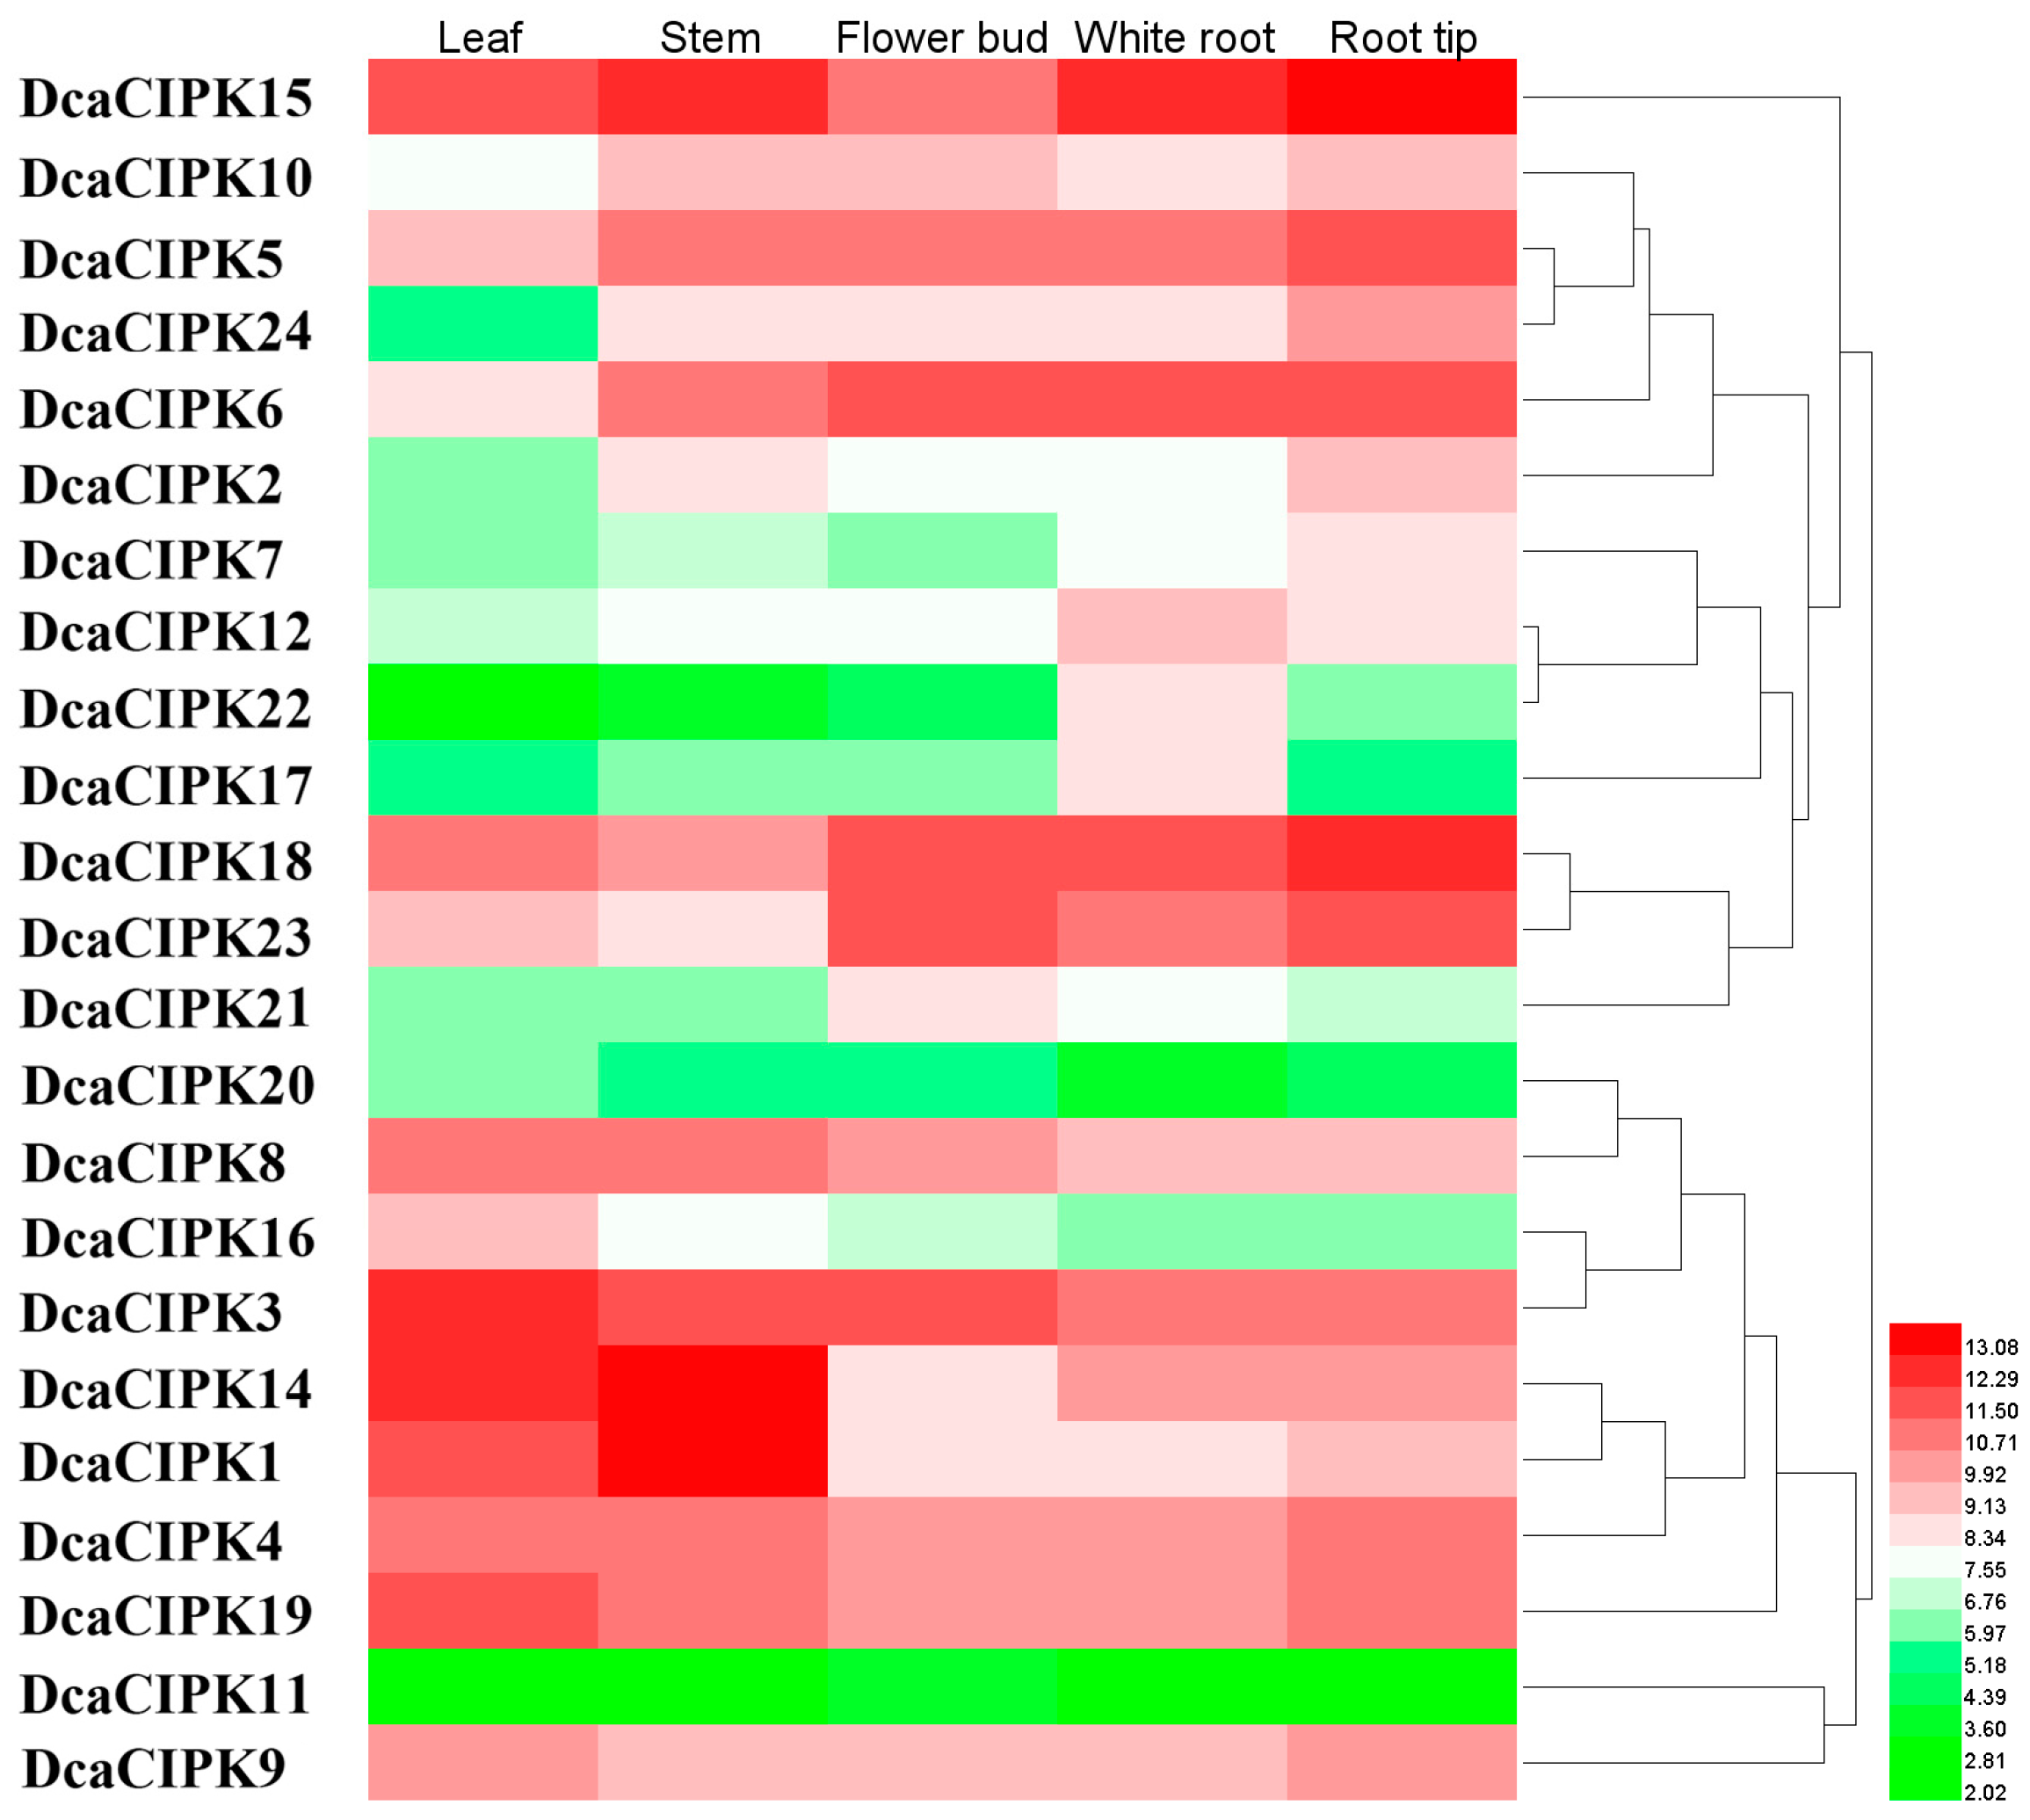
2.4. Expression of D. catenatum CIPK Genes in Different Plant Tissues

To determine the roles of CIPK genes in D. catenatum, reassembled transcriptome data was used to illustrate the expression of DcaCIPKs in different tissues (root tip, root, flower bud, stem, and leaf; Figure 4; Table S1). Two primary clusters for expression patterns of DcaCIPK genes were found and both of them contain intron-poor and intron-rich genes (Figure 4). Most DcaCIPK genes, except DcaCIPK13, were detected in these five tissues. Among these detected genes, DcaCIPK6, -15, and -18 were the most highly expressed genes in root tip and root; DcaCIPK1, -14, and -15 were highly expressed in stem; DcaCIPK3, -14, and -19 were highly expressed in leaf; and DcaCIPK6 and -18 were highly expressed in flower bud. These results suggested these specific highly expressed genes may have important roles in development or sensing of external signals in the corresponding tissues.

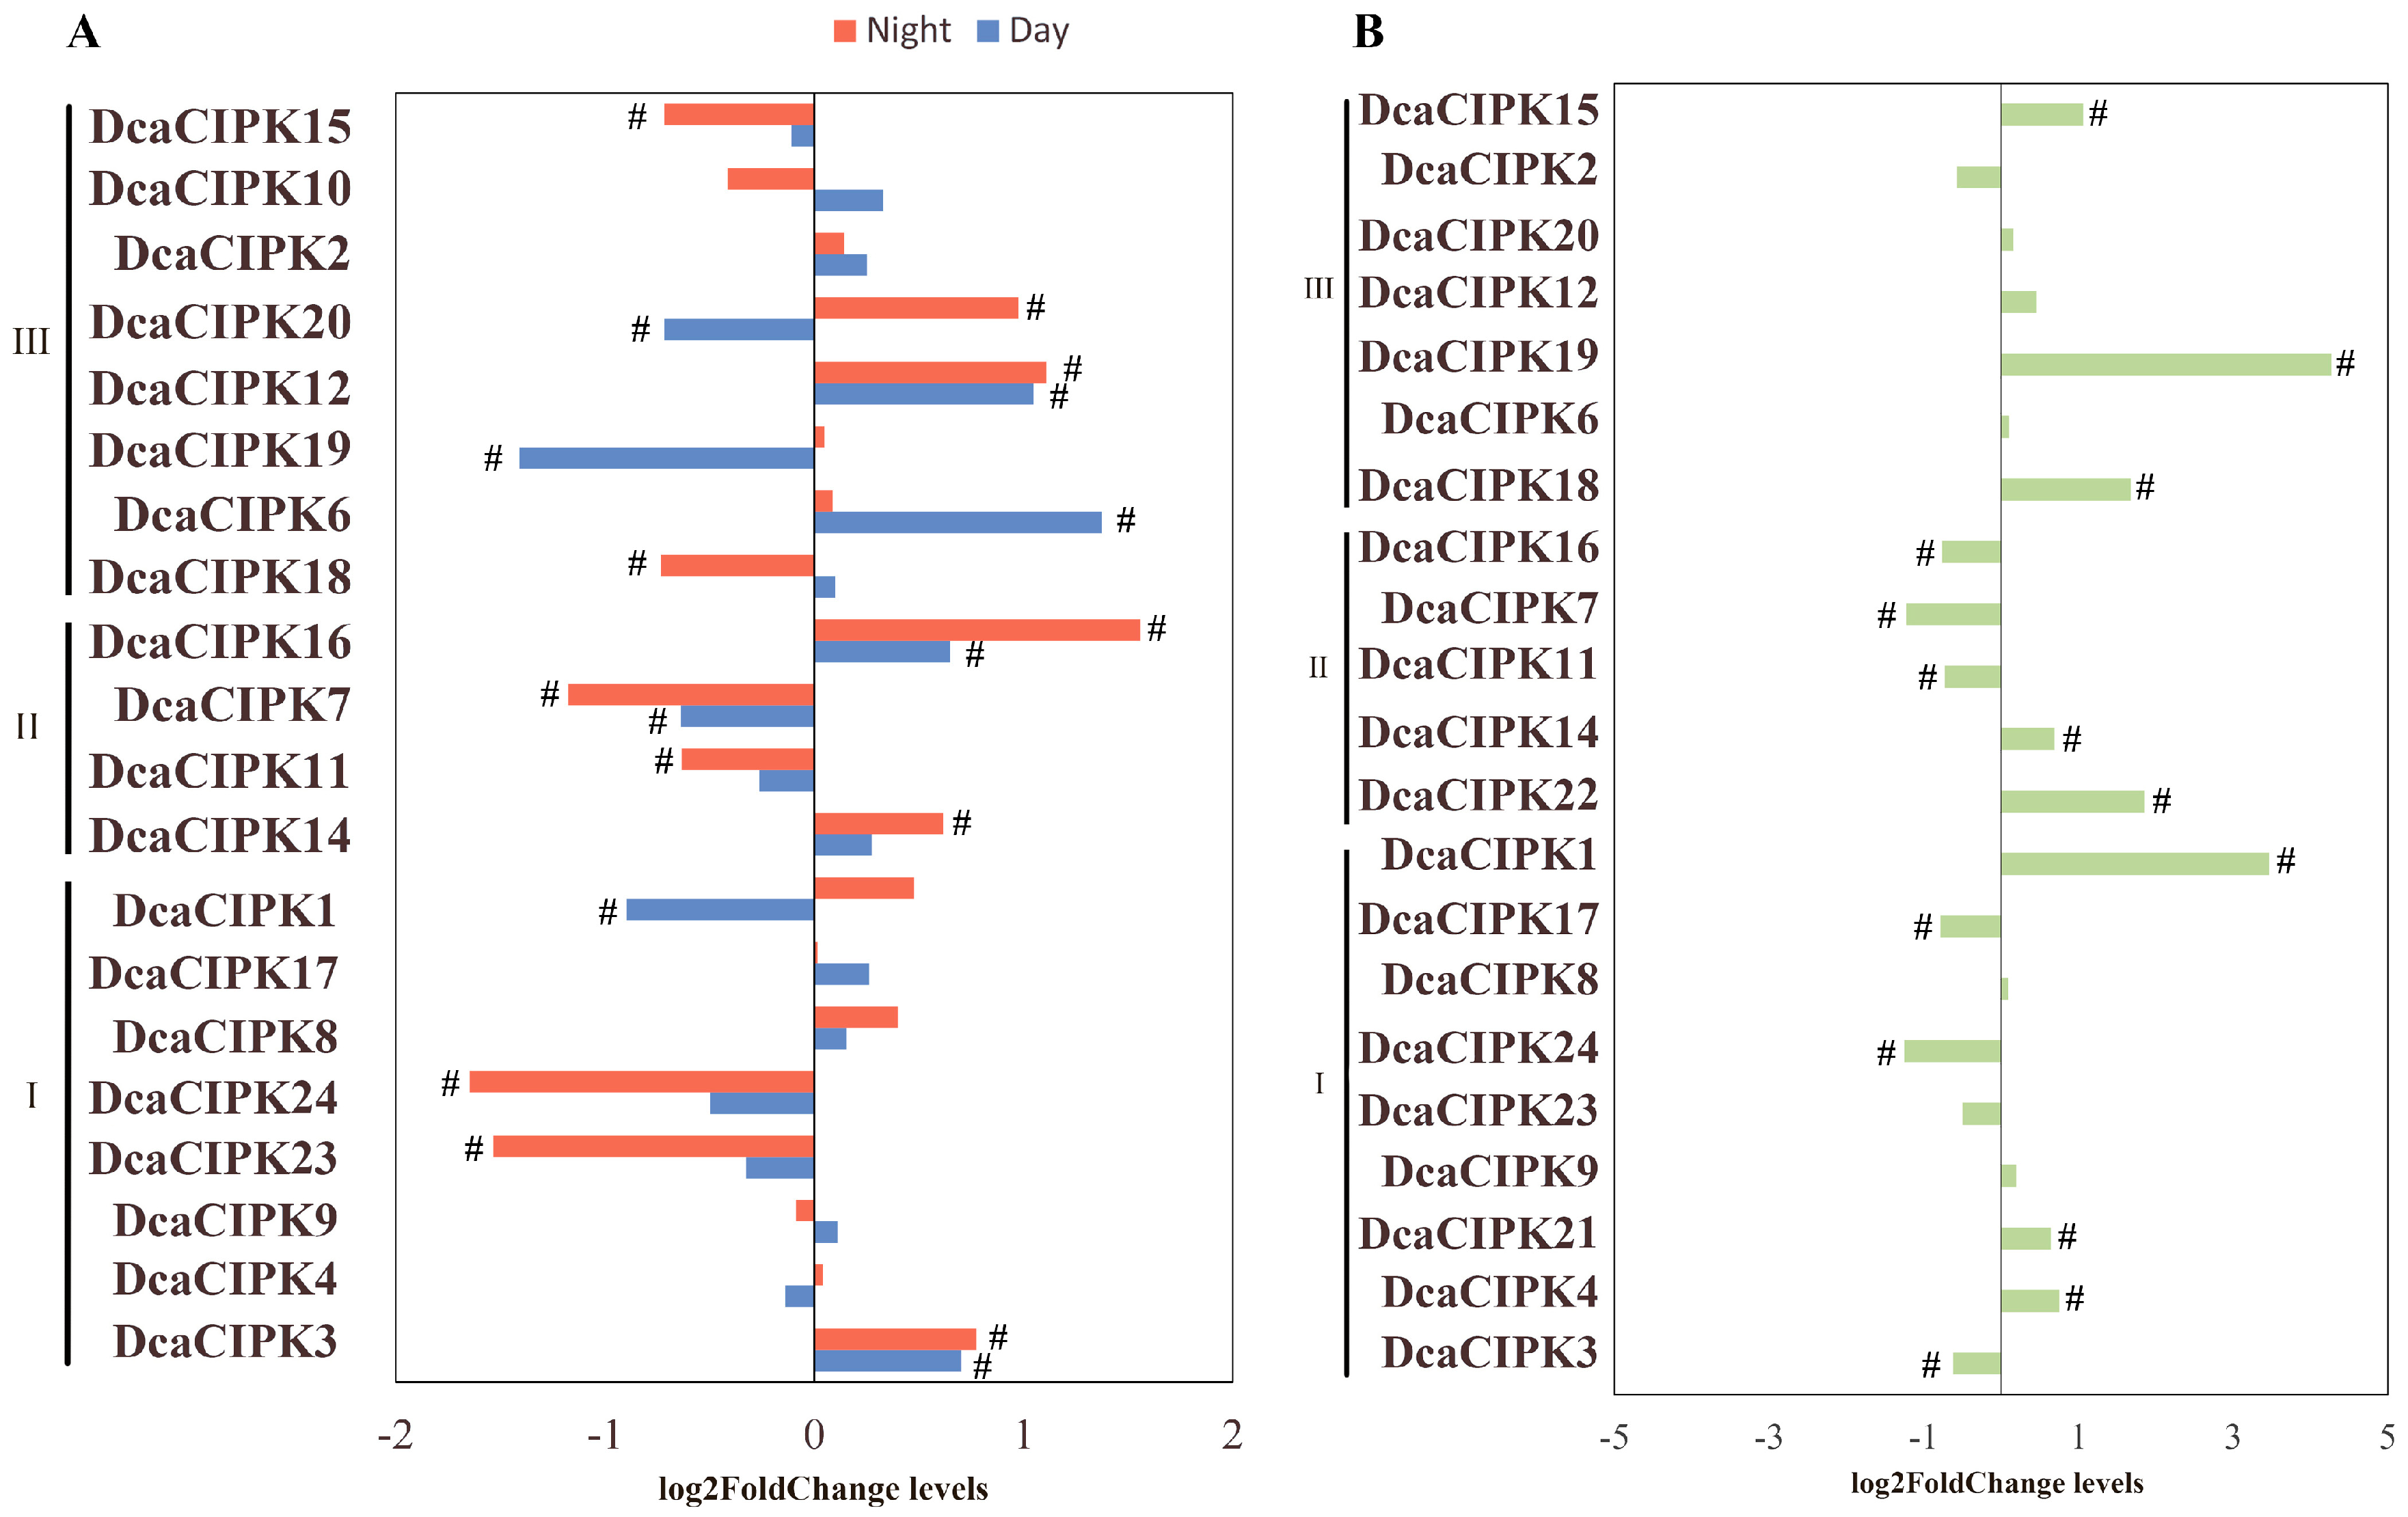
2.5. Expression of D. catenatum CIPK Genes under Abiotic Stress

To figure out how CIPK gene expression changes in response to abiotic stress, we analyzed the expression patterns of CIPK members. Dataset A (see section Materials and methods) represents DcaCIPK expression profiles in D. catenatum leaves during the day (9:00 am) and night (9:00 pm) under drought treatment (Figure 5A). Dataset B represents DcaCIPK expression profiles obtained under cold- and control- treatments (Figure 5B). CIPK20 and -21 were significantly fluctuant under drought and cold treatment as compared with normal conditions, respectively.
Under drought stress, DcaCIPK3, -6, -12, and -16 were upregulated while DcaCIPK19 and -20 were downregulated during the daytime (fold change > 1.5). During nighttime, DcaCIPK3, -12, -14, -16, and -20 were induced significantly and DcaCIPK7, -11, -18, -23, and -24 were inhibited (fold change > 1.5) (Figure 5A; Table S2). During cold treatment, the expression levels of DcaCIPK1, -14, -15, -18, and -19 were increased, while those of DcaCIPK3, -7, -11, -16, -17, and -24 were decreased (fold change > 1.5) (Figure 5B; Table S2). DcaCIPK3, -12, and -16 were abundantly expressed during both day and night under drought treatment. DcaCIPK14 was the only gene that was significantly induced by the two different stress treatments. Ten of the significantly fluctuating expressed genes (DcaCIPK6, -7, -12, -14, -15, -16, -18, -19, -20, and -23) were classified into the intron-poor cluster; the rest of the genes, including DcaCIPK1, -3, -23, and -24, belonged to the intron-rich cluster.

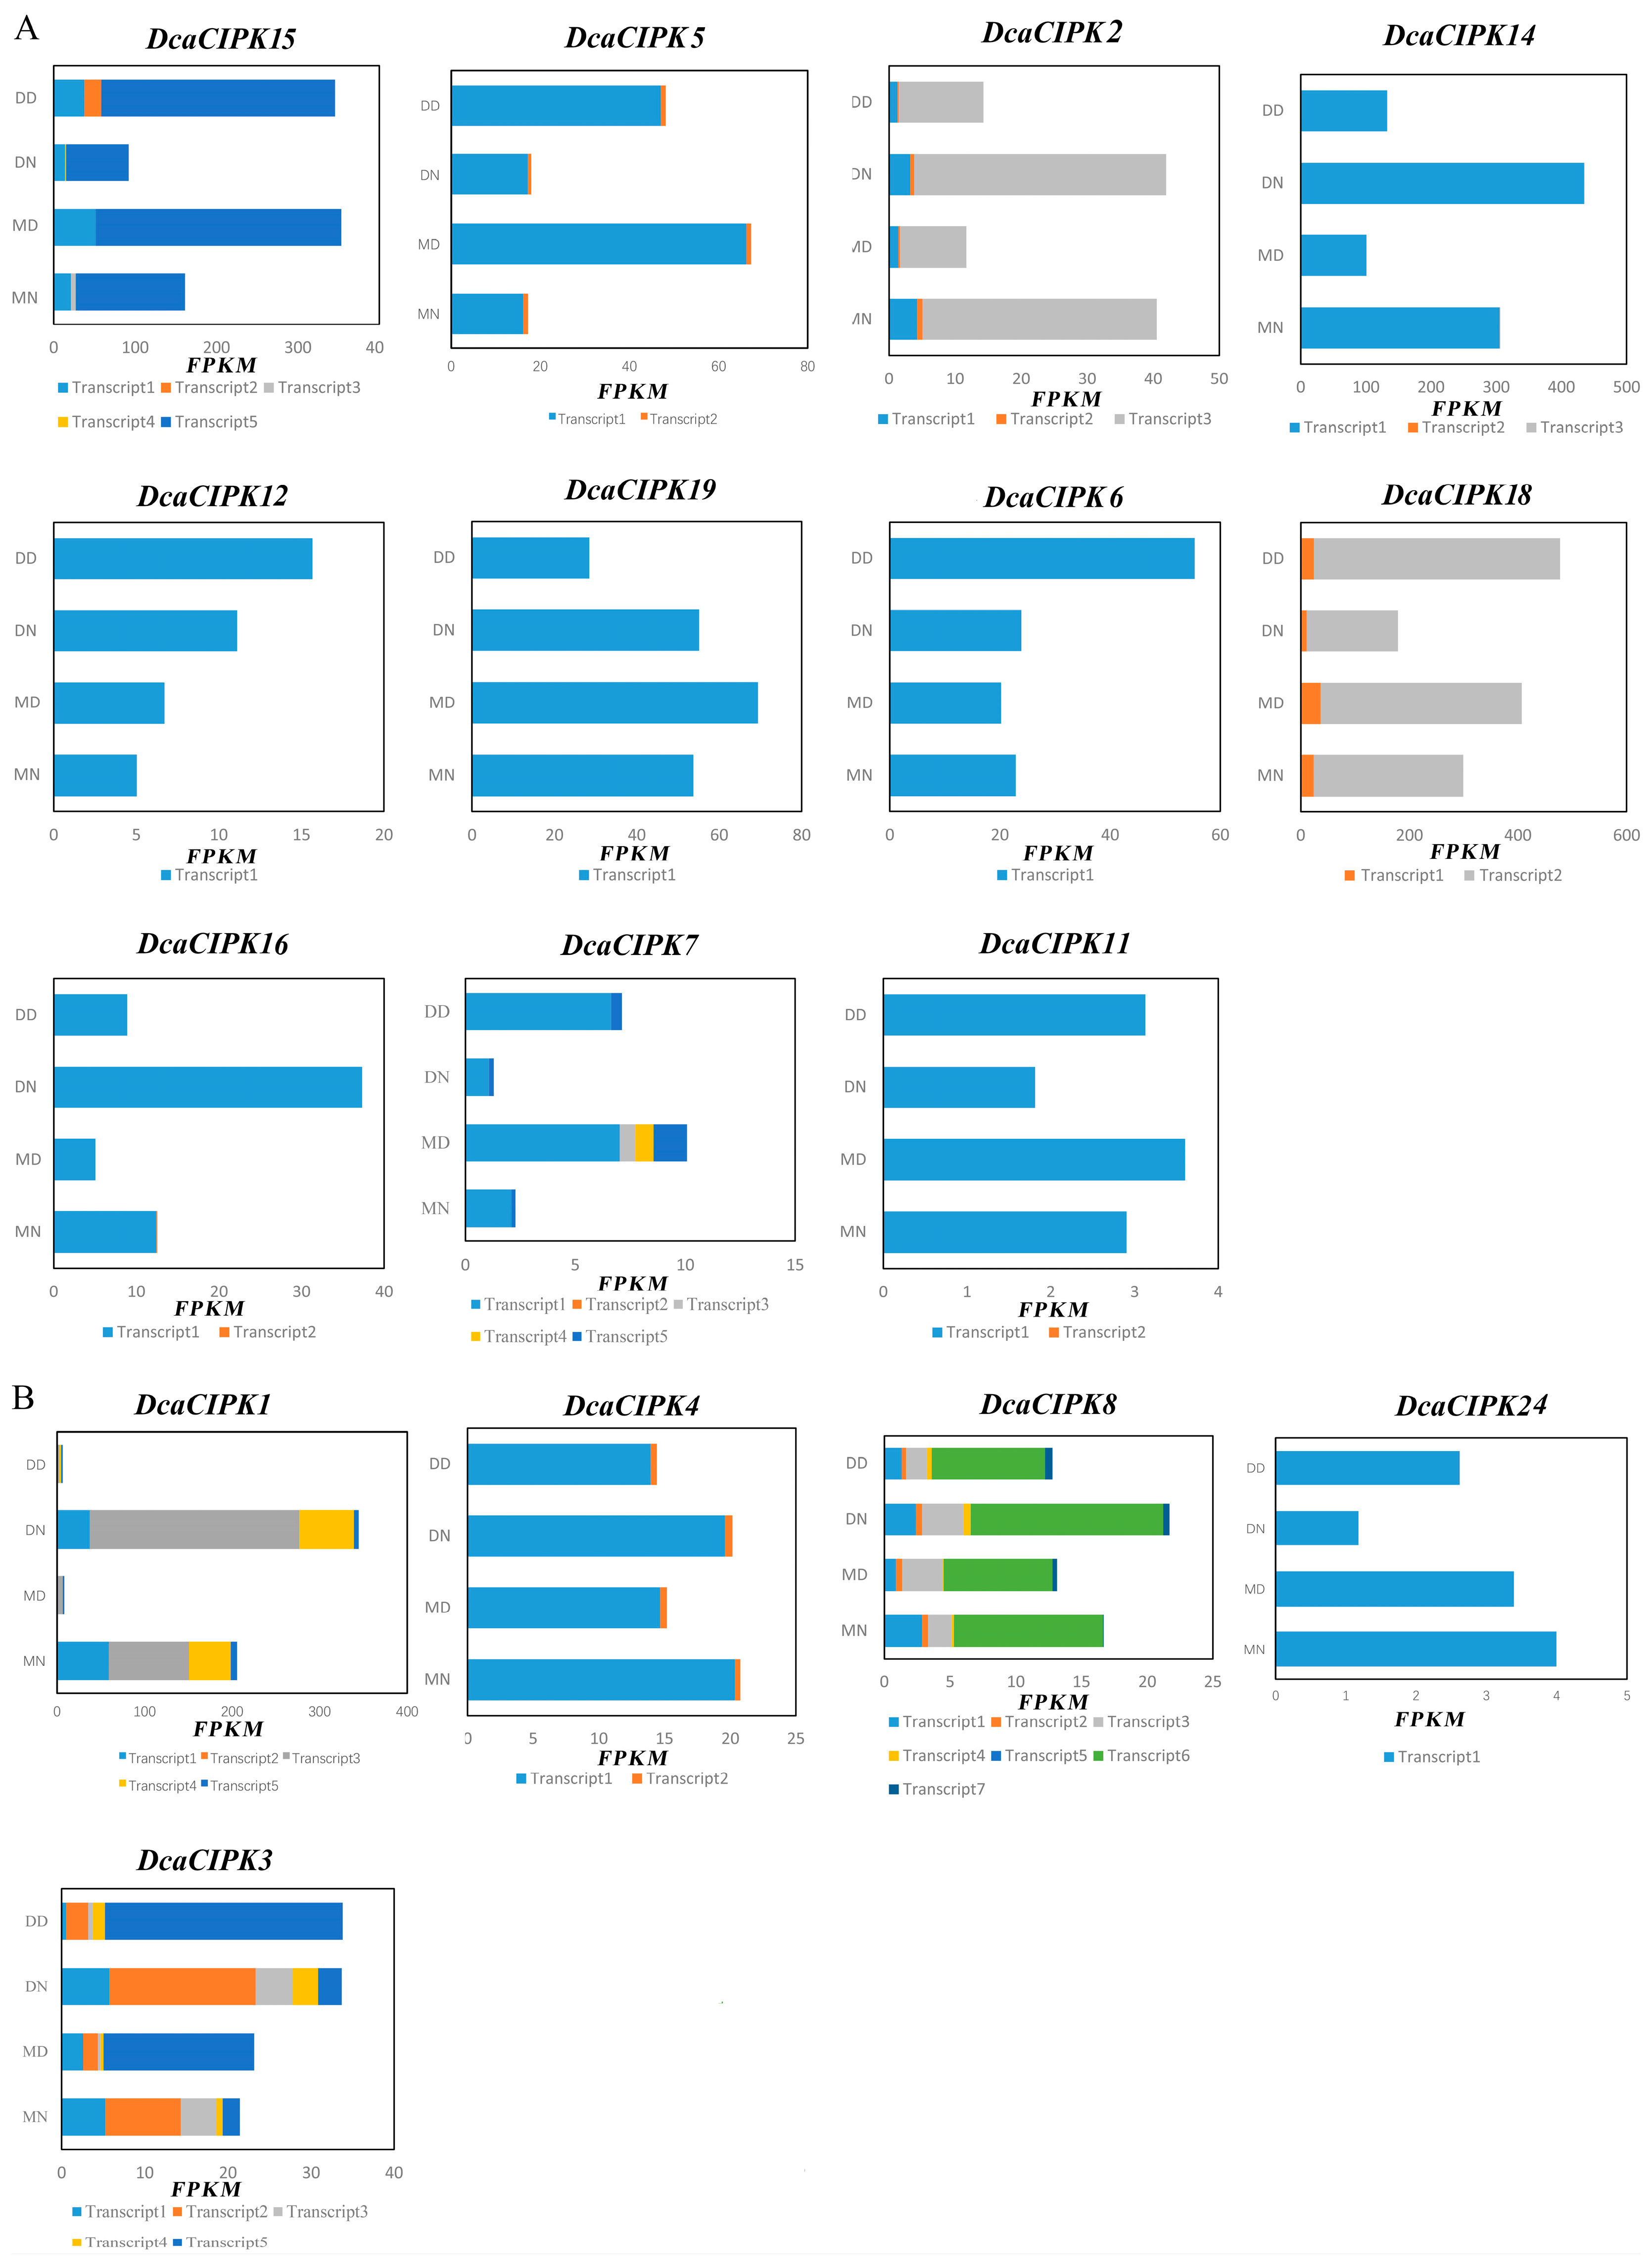
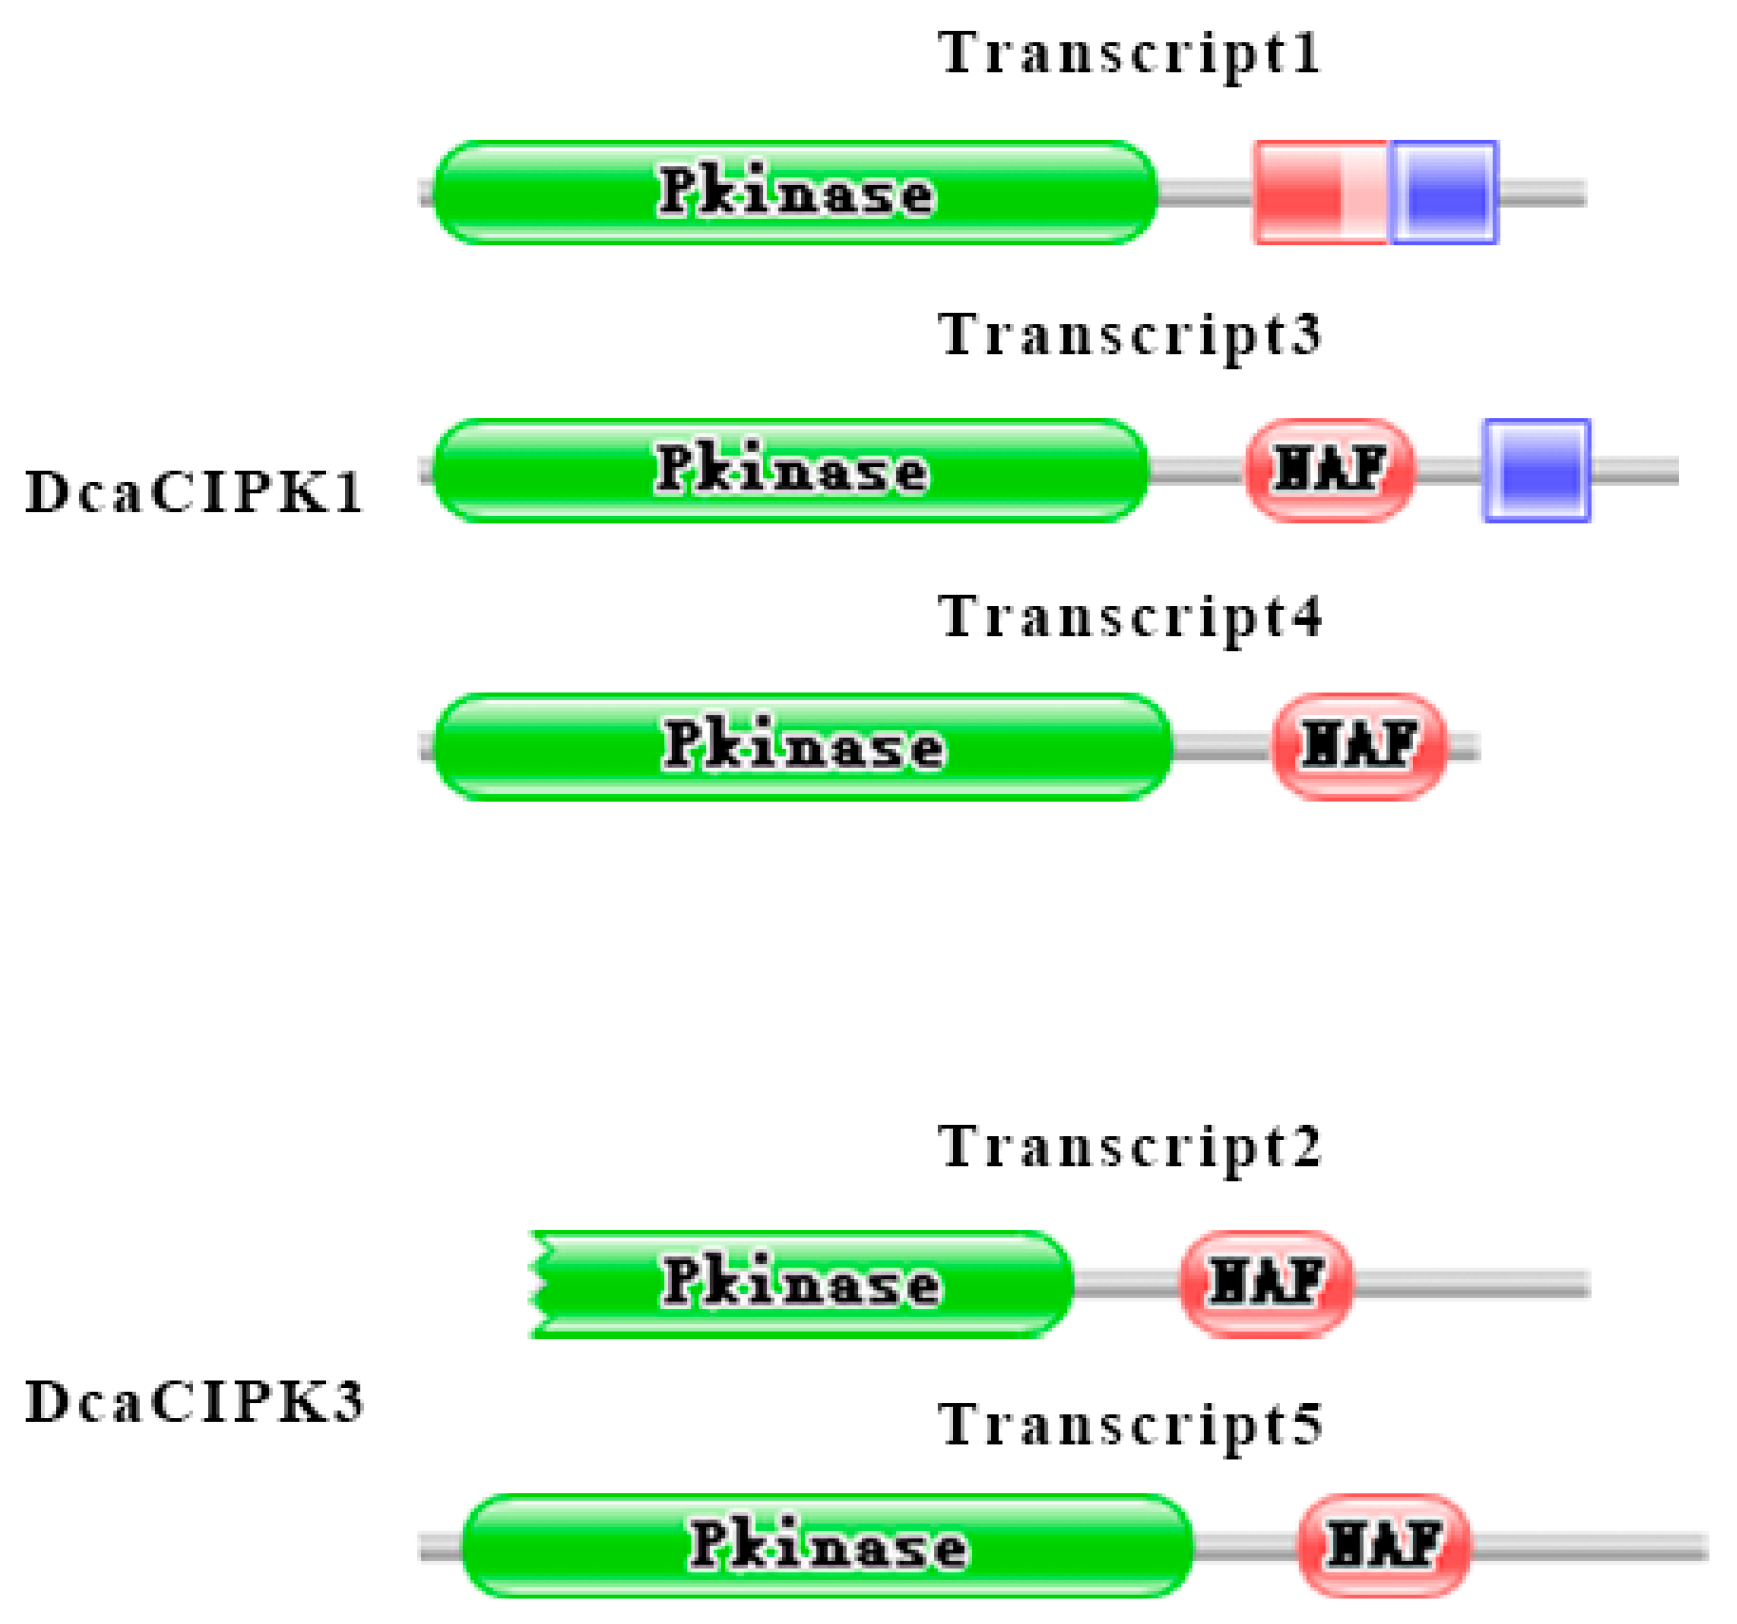
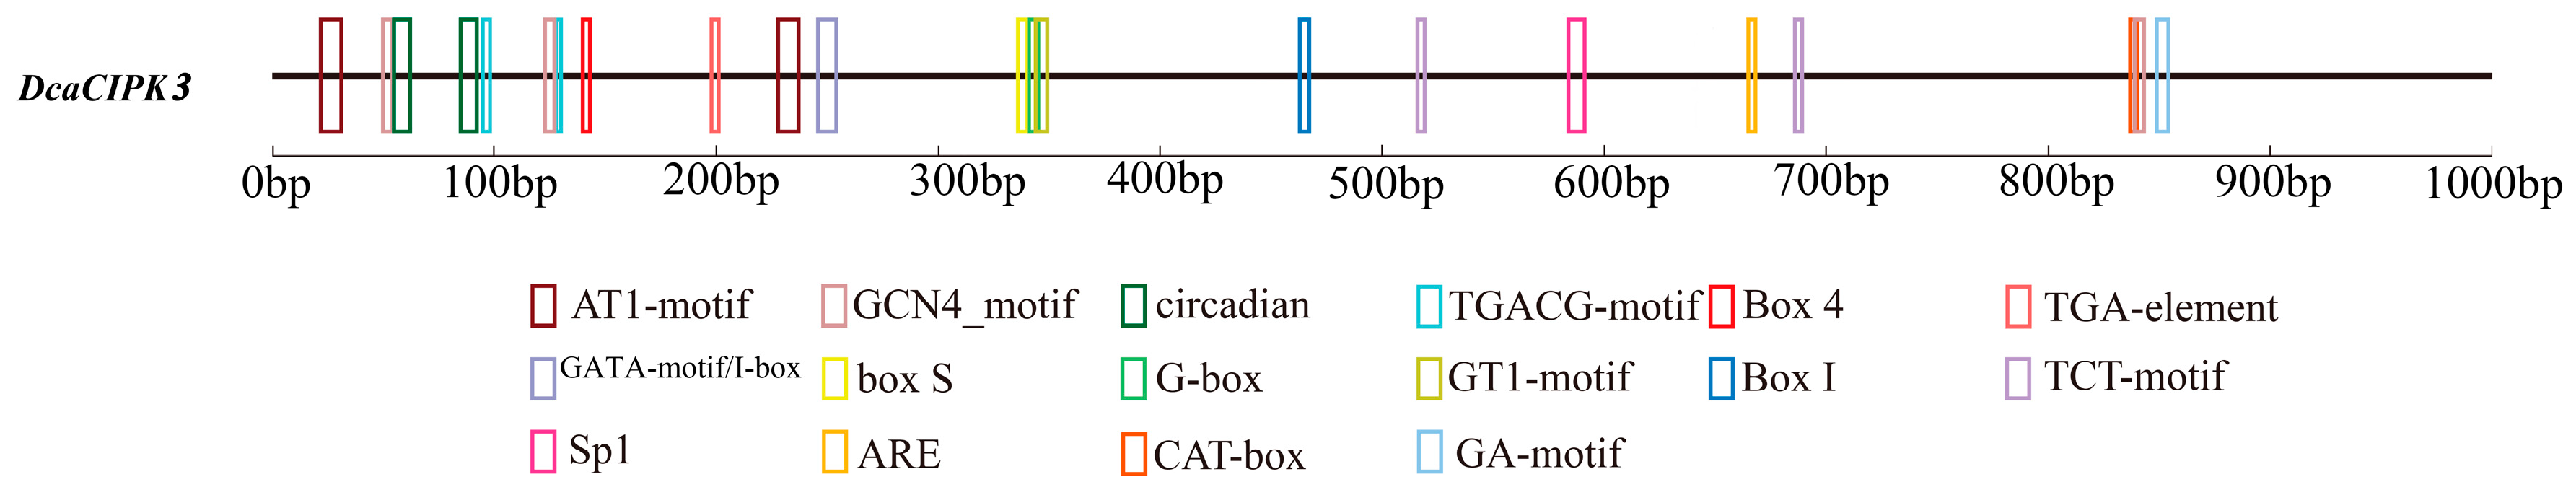
2.6. Alternative Splicing Analysis of CIPK Members under Drought Stress

To study DcaCIPK genes’ expression at transcript levels, we used StringTie to assemble transcripts with genome guide and totally 76 transcripts were reconstructed for the 24 DcaCIPK genes (File S1). As shown in the result, 17 DcaCIPK genes have multiple splicing variants (Table S3). We analyzed alternative splicing by examining the structure and expression levels of CIPK genes. DcaCIPK1 (transcript1, 4, and 5), DcaCIPK2 (transcript1 and 3), DcaCIPK3 (transcript1 and 3), DcaCIPK4 (transcript1), DcaCIPK5 (transcript1), DcaCIPK7 (transcript1), DcaCIPK12 (transcript1), DcaCIPK14 (transcript1), DcaCIPK15 (transcript1 and 5), DcaCIPK16 (transcript1), and DcaCIPK18 (transcript2) showed significantly diurnal variation in expression levels whether under a drought or moist environment. DcaCIPK19 (transcript1) and DcaCIPK24 (transcript1) were only influenced (downregulated) by drought treatment. DcaCIPK1 (transcript3), DcaCIPK3 (transcript2 and 5), DcaCIPK8 (transcript6), DcaCIPK15 (transcript2), and DcaCIPK18 (transcript1) were influenced by both water content of the base material (drought and control) and the harvest time (day and night). DcaCIPK1 (transcript3) at night, DcaCIPK8 (transcript6), and DcaCIPK3 (transcript2 and 5) during both day and night, and DcaCIPK15 (transcript2) during the day were upregulated under drought stress (Figure 6; Table S4).
Interestingly, we found transcripts in DcaCIPK1 and DcaCIPK3 had specific expression patterns: all transcripts in the former gene showed a high abundance in nights but extremely low levels in days (Figure 6B), and the two main transcripts (tanscript1 and transcript3) in the latter gene had a mutually day-and-night reversed expression (Figure 6B). Hence, we analyzed the protein domain of their main expressed transcripts on Pfam according to the hidden Markov model (HMM) profile (Figure 7). Transcript1, 3, and 4 are DcaCIPK1′s major isoforms. Besides including the two basic protein domains—pkinase and NAF—KA1 domain is found in transcript1 and 3. Moreover, KA1 is closely adjacent to NAF domain in transcript1 compared with that in transcript3. As for DcaCIPK3, transcript2 and transcript5 are the main isoforms of alternative splicing. However, the pkinase domain in transcript2 is incomplete.
Prediction of cis-acting regulatory elements indicated that these genes all had elements that are involved with light responsiveness. A circadian element was found in DcaCIPK2, -3, -8, and -12. The MBS element, an MYB binding site involved in drought-inducibility, was found in DcaCIPK5, -12, -15, -16, and -19. DcaCIPK15 was found to have a low-temperature responsiveness element. In addition, many of these genes contained plant hormone responsiveness elements such as an ABA-responsive element, a methyl jasmonate inducible element, a salicylic acid-inducible element, an ethylene-responsive element, a gibberellin-responsive element, and an auxin-responsive element (Table S5).
Under drought stress, the expression level of DcaCIPK3 was upregulated, but the major functional transcript was not the same between day and night. During daytime, transcript5 was the major transcript detected. In contrast, transcript2 was the major transcript at nighttime (Figure 6B, Figure 9C). Promoter region analysis showed DcaCIPK3 has two circadian rhythm binding sites located at 54 and 84 bp (marked as green boxes in Figure 8).

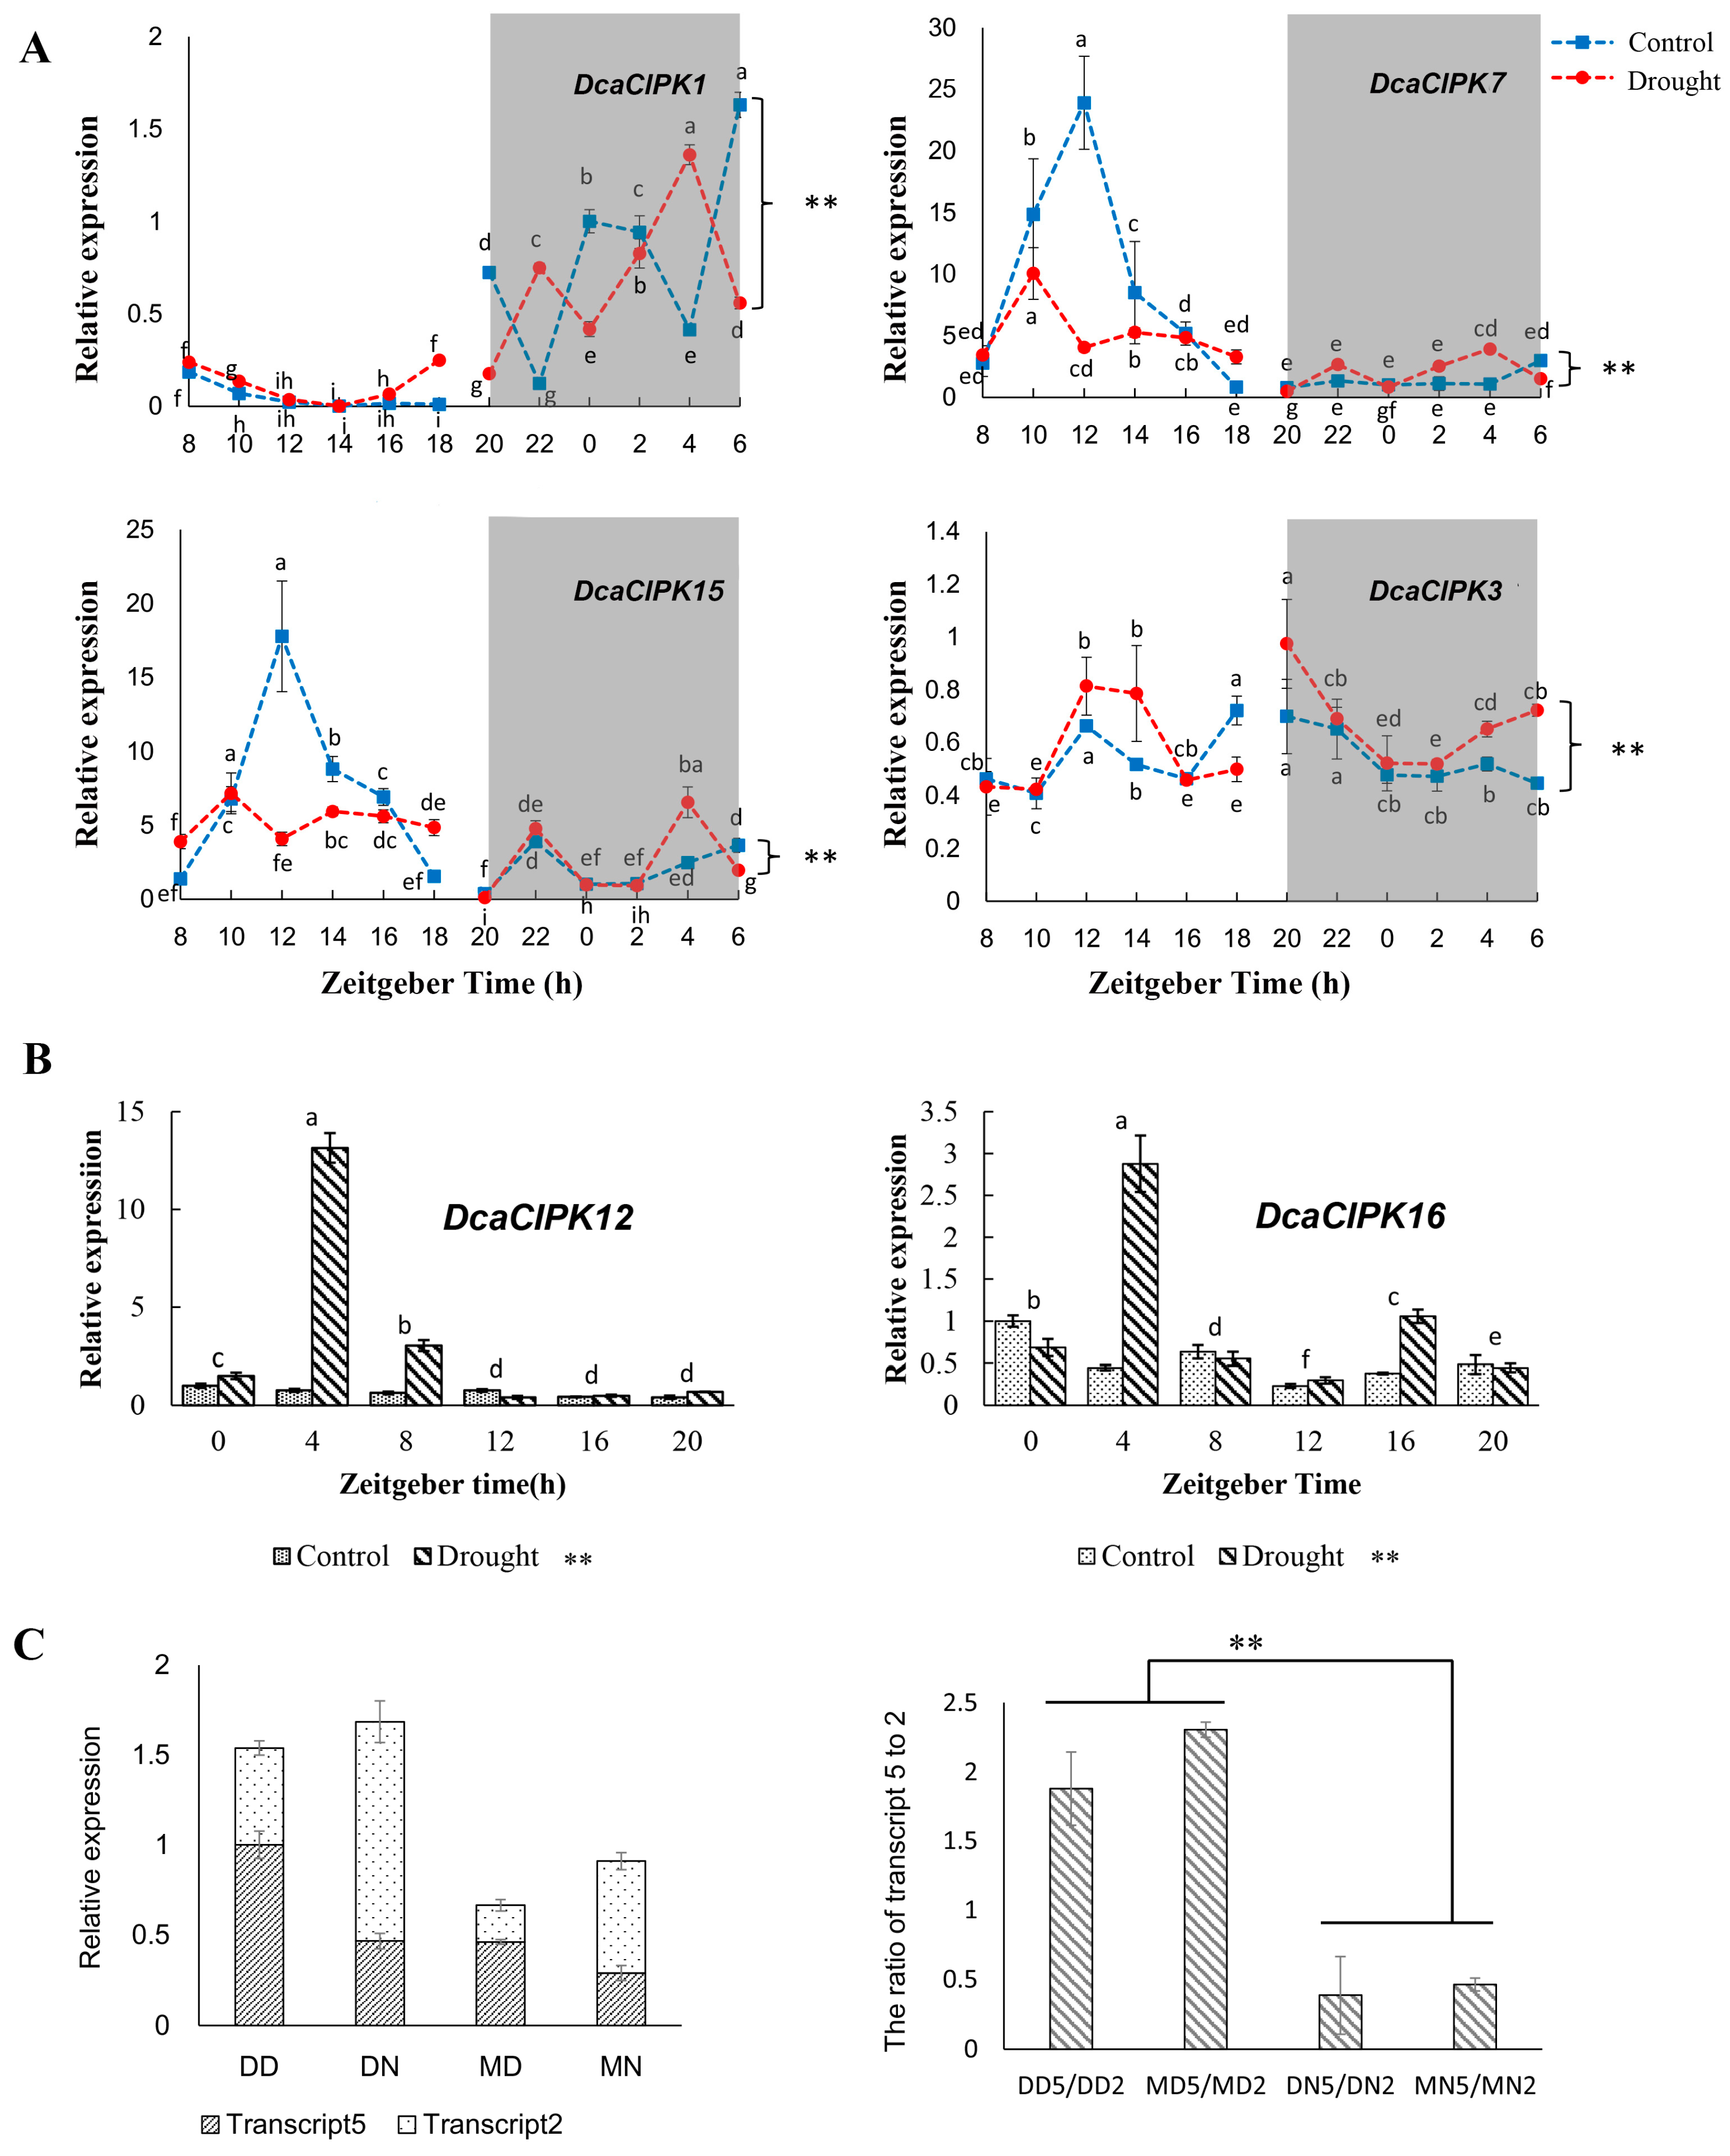
2.7. Effect of Time-of-Day and Drought Stress on Selected Genes mRNA Expression

We selected six genes (DcaCIPK1, -3, -7, -12, -15, and -16) to conduct qRT-PCR validation of their mRNA expression (Figure 9). Time-of-day affected the expression of four selected genes (DcaCIPK1, -3, -7, and -15) under drought and control conditions. The expression of DcaCIPK1, -7, and -15 exhibited a strong circadian rhythmicity and peaked during the active phase both under drought and control. DcaCIPK1 significantly elevated during dark phase, while DcaCIPK7 and 15 were active in day time. The expression levels under drought were lower than that under control both for DcaCIPK7 and -15. DcaCIPK3 had no obviously difference in day and night, but the gene expression level under drought was higher than that under control. qRT-PCR assays also validated the predicted expression patterns of DcaCIPK12 and DcaCIPK16 under drought treatment, respectively. The statistics result shows differences of expression level between drought and control is significant. The average expression level of the two genes under drought stress is higher than that under control, respectively.

3. Discussion

How to sense and conduct external stress signals is a basic biological competence in plants. Osmotic stress is the major signal caused by drought stress [10]. As a major calcium sensor protein, CIPK functioning with CBL could transfer the stress signal downstream. The CIPK family has been analyzed in many C3 and C4 plants [18,19], but comprehensive information about CAM plants is limited. D. catenatum, a facultative CAM species, has a high level of drought resistance. Previous researches related to this species have mostly focused on polysaccharide hydrolysis and synthesis [24,25], while genes involved in signal transduction have been rarely studied.

3.1. Phylogenetics and Structure of DcaCIPK Genes

The phylogenetic analyses of gene structure and evolution provided a theoretical basis for the functional annotation of DcaCIPK genes. The intron-rich CIPK members from Arabidopsis, rice, and Dendrobium catenatum were all clustered in Group IV, whereas the genes in the other four groups were all intron-poor members (Figure 3) [18,20,26]. The closely related orthologous CIPKs among different species suggest that an ancestral series of CIPK genes existed before species divergence. The bipolarity of intron numbers in D. catenatum genes was also observed in those of other species such as Arabidopsis, maize, and rice; these cases suggest that intron loss and gain events may have happened before the monocot-eudicot divergence [18,19,21].
Previous reports have demonstrated the critical role of CIPK genes under diverse stress, which drove us to collect and analyze the expression profiles of these genes in different tissues and under various abiotic stresses from public transcriptome data. The analysis of global gene expression patterns indicated that the most drought- and cold-inducible genes belonged to the intron-poor cluster (Figure 5). This finding was consistent with the analysis of the CIPK family in soybean [21]. Previous research has indicated that the intron-poor CIPK group evolved much later, very likely derived by discarding introns of intron-rich members [21,27]. Therefore, the loss of introns may be an adaption to environmental stress.

3.2. DcaCIPK Gene Expression and Functions in Drought Stress

Our results revealed that DcaCIPK3, -12, and -16 can be significantly induced during both the day and the night under drought treatment (Figure 5, Figure 6 and Figure 9B). DcaCIPK16 is orthologous to AtCIPK16 (Figure 3), which can phosphorylate AKT1 to regulate the absorption of potassium by interacting with CBL1/CBL9 [28]. DcaCIPK16 was thus predicted to have a similar function to AtCIPK16 in dealing with the iron stress resulting from drought. DcaCIPK3, as an orthologous gene of AtCIPK3, may play a critical role in ABA signaling and multiple stress responses as shown by studies on AtCIPK3 [29]. AtCIPK3 can be rapidly activated by salt, drought, cold, and osmotic stress treatments. Both drought and salt have a common ABA-dependent pathway. Disruption of AtCIPK3 altered the expression patterns of stress-responsive genes (RD29A and KIN1/KIN2) triggered by cold, high salt, and ABA. However, the disruption of AtCIPK3 did not affect the expression of genes (RD29A and KIN1/KIN2) induced by drought, suggesting that AtCIPK3 acts in a distinct way in response to drought stress. On account that cold-induced gene expression has been shown to be independent of ABA production, these results indicated AtCIPK3 represents a cross-talk node between the ABA-dependent and ABA-independent pathways in stress responses [29,30]. The precise role of DcaCIPK12 cannot be elucidated from evolutionary relationships because the function of neighboring AtCIPKs (AtCIPK12/19) is still unclear. These genes were upregulated during both the day and the night under water deficit stresses and therefore are forecast to play a critical role in drought resistance.
DcaCIPK14 was significantly upregulated under two types of abiotic stress, which indicated this gene presumably had a functional overlap with responses to both water deficit and low-temperature stress (Figure 5). Moreover, DcaCIPK14 was abundantly expressed in pseudobulbs and leaves, which are rich in polysaccharides (Figure 4). Plentiful polysaccharides could supply a large amount of bound water and also hydrolyze into soluble monosaccharides in case of severe abiotic stress [31,32,33]. Previous studies have indicated that the CIPK gene may have a link with the sucrose content of plants. For example, ScCIPK8, a sugarcane CIPK gene, had a negative correlation with sucrose content of leaves [34,35]. Light-interruption stress, which inhibits the synthesis of sucrose, reduces the expression of AtCIPK14 expression; after feeding sucrose, however, the expression of AtCIPK14 goes up [36]. As an orthologous gene of AtCIPK14, DcaCIPK14 may act in connecting and regulating stress signal induction and energy metabolism.

3.3. Circadian Rhythm and Drought Stress Both Influence Alternative Splicing of CIPK Members

The abundance analysis for DcaCIPK genes’ alternative splicing isoforms indicated that circadian rhythm influences expression levels of transcripts. DcaCIPK3 may play a significant role in drought response similar to the orthologous gene AtCIPK3. The overall abundance of DcaCIPK3 transcripts and the time-of-day qRT-PCR results also supported the important role of this gene in drought stress. AtCIPK3 has the highest number of splice variants of CIPK members in A. thaliana, and two of the transcripts (AtCIPK3.1 and AtCIPK3.4) were more highly induced under ABA and drought treatment [37]. Similarly, preference of specific transcripts was also found in D. catenatum. However, it seemed this phenomenon was more likely raised by circadian rhythm in our experiment. Under drought treatment, the expression levels of different transcripts suggested that the most highly expressed transcript variant of DcaCIPK3 tended to be transcript1 during the daytime and transcript3 at nighttime. The moist treatment had a negative effect on the sum expression abundance of various transcripts, but did not change the routine preference of transcript1 during the day and transcript3 at night, respectively. The analysis of transcript isoforms and the prediction of cis-acting regulatory elements of DcaCIPK3 indicated that circadian rhythm may influence the preference of alternative splicing (Figure 6). DcaCIPK3 may use different splicing ways during day and night to cope with drought stress. DcaCIPK3 represents a critical role for improving tolerance of D. catenatum to drought and deserves further analysis to reveal its functional roles in drought response and the underlying molecular mechanisms for the preference of splicing, which is currently underway.
Diurnal variation in gene expression levels might be ascribed to the impact of biological clocks. If the sampling time had been fixed during the day, the association with drought tolerance of genes such as DcaCIPK1, -7, and -15 (Figure 6 and Figure 9 and Table S4) would have been missed, because its expression level was nearly negligible. Therefore, the choice of sampling time should be taken into consideration in terms of the influence of the bioclock.
Alternative splicing increases gene functional diversity by regulating alternative exon recognition [38]. Our analysis indicated that this combinatorial control mechanism greatly influenced the protein domain in main expressed transcript (Figure 7). Different domain combinations may undertake different duties. Incomplete pkinase domain in transcript2 of DcaCIPK3 may cause losing function of phosphorylation which eventually prevents signal downward transduction in night time.
As a facultative CAM plant, the specific photosynthetic pathway may also have a great influence on the induction of DcaCIPK splice variants. How DcaCIPK genes are influenced by the biological clock and how drought stress affects the abundance of transcripts should be further studied.

4. Materials and Methods

4.1. Genome-Wide Identification of the CIPK Gene Family in D. catenatum

The D. catenatum genome (assembly ASM160598v1) [2] and its annotation (general feature format, GTF) were downloaded from the National Center for Biotechnology Information (NCBI) to extract protein and CDS sequences for all genes. To identify CIPK proteins, the hidden Markov model (HMM) profile of NAF with the signature domains (PF03822) was downloaded from Pfam [39] and used to search by HMMER 3.0 [40]. Each DcaCIPK protein sequence was examined for the presence of the serine/threonine protein kinase domain in the N-terminus to be considered as a member of the D. catenatum CIPK family. The putative CIPK family members were further reviewed by Pfam and SMART software [41]. Molecular weight (MW) [42] and isoelectric point (pI) [43,44] of CIPK members were calculated by “Compute pI/Mw function”of ExPASy [45].

4.2. Multiple Protein Sequence Alignment and Phylogenetic Tree Construction

The protein sequences of all DcaCIPK family members were aligned using Muscle [46] with default parameters, and a phylogenetic tree was constructed using neighbor-joining (NJ) [47] method built-in MEGA7.0 [48]. The bootstrap values for phylogenetic trees were based on 1000 replicates. We downloaded amino acid sequences for 26 AtCIPK [14,17] and 33 OsCIPK [20] proteins from NCBI and pooled them with sequences of 24 DcaCIPK proteins. An NJ phylogenetic tree for protein sequences from D. catenatum, Arabidopsis thaliana, and Oryza sativa was constructed by using the same procedure described above, and pairwise deletion and the Poisson model were introduced.

4.3. Exon–Intron Structure Analysis and Identification of Conserved Motifs

Visualization of gene features was performed using the gene structure display server by mapping the sequences coding for amino acids in proteins (CDS) to genomic sequences [49]. Motifs were discovered by MEME [50]. The parameters were set as follows; number of repetitions, any; maximum number of motifs, 30; optimum motif width, between 6 and 200 residues.

4.4. Transcriptome Analysis of D. catenatum CIPK Gene Expression

The expression patterns of CIPK gene family members in D. catenatum under different stress treatments (drought [51], Dataset A; low temperature [31], Dataset B) and in different tissues (Dataset C) [52] were analyzed (Table 2). Transcriptome data for drought stress, cold treatment, and specific tissues were downloaded from the Sequence Read Archive (SRA) database at the NCBI.
The raw data was stripped of adapters and low-quality reads (and bases) and then rRNA and virus data were filtered out, which were performed by using software Fastq_clean [53] with the settings described in our previous work [51]. The clean reads were aligned to the D. catenatum genome using Hisat2 [54,55] with options: -dta and –no-unal. The aligned outputs were converted from SAM to BAM format by using samtools [56]. The “htseq-count” function of Python package Htseq [57] was used to calculate the read-count of genes with default parameters. Expression differences among gene family members were further analyzed by using the R package DESeq2 with relative log expression (RLE) normalization and an adjusted p-value cutoff 0.05 [58]. HemI 1.0 [59] was used to illustrate heatmaps with settings: average linkage for clustering and Pearson distance for similarity metric.

4.5. Alternative Splicing Analysis and Cis-Acting Regulatory Element Prediction

As the protocol suggested by Pertea et al. [55], the BAM files described above were used as inputs for StringTie [60] to assemble and quantify transcripts of each gene. The visualization of transcripts, including structure and expression levels, was achieved using R [61] package Ballgown [62]. Prediction of cis-acting regulatory elements in promotor sequences was performed by using PlantCARE [63]. The sketch of the domains in main expressed transcripts was obtained at Pfam by inputting transcripts amino acid sequences [39].

4.6. Plant Material, Growth Conditions, and Experimental Treatments

D. catenatum plants were grown in a 5-cm diameter plot in an artificial climate chamber maintained under 12 h light (light intensity ~100 μmol·m−2s−1, 28 °C, 60% relative humidity)/12 h dark (22 °C, 70% relative humidity) cycles. Irrigation was withheld from the drought group until the volumetric water content of the base material dropped to 0%. The volumetric water content of base material was kept at between 30% and 35% in control group and ~0% in drought group. The topmost mature leaves, generally the fourth and fifth leaves, were harvested with a two-hour interval in a day (8:00 am–24:00 pm–6:00 am) and immediately frozen in liquid nitrogen. Moreover, we also sample specifically at 9:00 AM at day and 9:00 PM at night. These samples were for Quantitative Real-Time PCR (qRT-PCR) assessments. Each experimental treatment was performed in four replicates.

4.7. RNA Extraction

RNA was isolated from ground tissue using the RNAprep Pure Plant Kit (Polysaccharides & Polyphenolics-rich, TIANGEN Co. LTD, Beijing, China) according to the manufacturer’s protocols. RNA integrity was analyzed on a 2100 Bioanalyzer (Agilent Technologies, Santa Clara, CA, USA).

4.8. Quantitative Real-Time PCR

Primer pairs (Table S6) were designed by Primer 3. qRT-PCR experiments were performed using Roche LightCycler® 480 II system (LC480, Basel, Switzerland) with TB Green Premix Ex Taq (Takara Bio. Inc., Kusatsu, Japan). Each experimental treatment was performed in four replicates. The relative expression level was calculated as 2-∆∆Ct and normalized using 18s as internal standard.

4.9. Statistical Analysis

Data are presented as means ± SEM. To determine the effect of the volumetric water content of the base material (drought and control) and the harvest time (day and night) on the expression level of DcaCIPK transcripts, a two-way ANOVA was performed using Statistical Analysis System 9.4 (SAS) and then followed by a Duncan’s test (p < 0.05) to determine if there was a statistical difference between the mean expression levels of different isoforms under different treatments [64]. The time-of-day effect was evaluated by ANOVA one-way for drought and control situations followed by LSD post hoc analysis. p < 0.05 was considered significant.

Supplementary Materials

Supplementary materials can be found at https://0-www-mdpi-com.brum.beds.ac.uk/1422-0067/20/3/688/s1.

Author Contributions

X.W., B.-Q.Z., and Y.W. conceived the study. X.W. and L.-H.Z. performed the experiments and carried out the analysis. X.W. and L.-H.Z. designed the experiments and wrote the manuscript. All authors read and approved the final manuscript.

Funding

This research was funded by the National Science & Technology Pillar Program during the Twelfth Five-year Plan Period (Grant No. 2013BAD01B0703; Exploring Germplasm Resources of genus Dendrobium, Innovation, and Utilization).

Acknowledgments

We thank Yinshuai Ding and Shaoli Lin (Department of Veterinary Medicine and Sciences, University of Maryland) for help to improve the writing.

Conflicts of Interest

The authors declare no conflicts of interest.

References

  1. Khanna-Chopra, R.; Singh, K. Drought resistance in crops: Physiological and genetic basis of traits for crop productivity. In Stress Responses in Plants; Tripathi, B.N., Müller, M., Eds.; Springer: New York, NY, USA, 2015; pp. 267–292. [Google Scholar]
  2. Zhang, G.Q.; Xu, Q.; Bian, C.; Tsai, W.C.; Yeh, C.M.; Liu, K.W.; Yoshida, K.; Zhang, L.S.; Chang, S.B.; Chen, F.; et al. The Dendrobium catenatum Lindl. genome sequence provides insights into polysaccharide synthase, floral development and adaptive evolution. Sci. Rep. 2016, 6, 1–10. [Google Scholar] [CrossRef] [PubMed]
  3. Zotz, G.; Winkler, U. Aerial roots of epiphytic orchids: The velamen radicum and its role in water and nutrient uptake. Oecologia 2013, 171, 733–741. [Google Scholar] [CrossRef] [PubMed]
  4. Herrera, A. Crassulacean acid metabolism and fitness under water deficit stress: If not for carbon gain, what is facultative CAM good for? Ann. Bot. 2009, 103, 645–653. [Google Scholar] [CrossRef] [PubMed]
  5. Haider, M.S.; Barnes, J.D.; Cushman, J.C.; Borland, A.M. A CAM-and starch-deficient mutant of the facultative CAM species Mesembryanthemum crystallinum reconciles sink demands by repartitioning carbon during acclimation to salinity. J. Exp. Bot. 2012, 63, 1985–1996. [Google Scholar] [CrossRef] [PubMed]
  6. Winter, K.; Holtum, J.A.M. Facultative crassulacean acid metabolism (CAM) plants: Powerful tools for unravelling the functional elements of CAM photosynthesis. J. Exp. Bot. 2014, 65, 3425–3441. [Google Scholar] [CrossRef] [PubMed]
  7. Celenza, J.; Carlson, M. A yeast gene that is essential for release from glucose repression encodes a protein kinase. Science 1986, 233, 1175–1180. [Google Scholar] [CrossRef] [PubMed]
  8. Gancedo, J.M. Yeast carbon catabolite repression. Microbiol. Mol. Biol. Rev. 1998, 62, 334–361. [Google Scholar]
  9. Honigberg, S.M.; Lee, R.H. Snf1 kinase connects nutritional pathways controlling meiosis in Saccharomyces cerevisiae. Mol. Cell. Biol. 1998, 18, 4548–4555. [Google Scholar] [CrossRef]
  10. Zhu, J.-K. Abiotic stress signaling and responses in plants. Cell 2016, 167, 313–324. [Google Scholar] [CrossRef]
  11. Hardie, D.G. Plant protein serine threonine kinases: Classification and functions. Annu. Rev. Plant Physiol. Plant Mol. Biol. 1999, 50, 97–131. [Google Scholar] [CrossRef]
  12. Hrabak, E.M.; Chan, C.W.M.; Gribskov, M.; Harper, J.F.; Choi, J.H.; Halford, N.; Luan, S.; Nimmo, H.G.; Sussman, M.R.; Thomas, M.; et al. The Arabidopsis CDPK-SnRK superfamily of protein kinases. Plant Physiol. 2015, 132, 666–680. [Google Scholar] [CrossRef] [PubMed]
  13. Xu, J.; Li, H.D.; Chen, L.Q.; Wang, Y.; Liu, L.L.; He, L.; Wu, W.H. A protein kinase, interacting with two calcineurin B-like proteins, regulates K+Transporter AKT1 in Arabidopsis. Cell 2006, 125, 1347–1360. [Google Scholar] [CrossRef] [PubMed]
  14. Drerup, M.M.; Schlücking, K.; Hashimoto, K.; Manishankar, P.; Steinhorst, L.; Kuchitsu, K.; Kudla, J. The calcineurin B-like calcium sensors CBL1 and CBL9 together with their interacting protein kinase CIPK26 regulate the Arabidopsis NADPH oxidase RBOHF. Mol. Plant 2013, 6, 559–569. [Google Scholar] [CrossRef] [PubMed]
  15. He, L.; Yang, X.; Wang, L.; Zhu, L.; Zhou, T.; Deng, J.; Zhang, X. Molecular cloning and functional characterization of a novel cotton CBL-interacting protein kinase gene (GhCIPK6) reveals its involvement in multiple abiotic stress tolerance in transgenic plants. Biochem. Biophys. Res. Commun. 2013, 435, 209–215. [Google Scholar] [CrossRef] [PubMed]
  16. Yang, W.; Kong, Z.; Omo-Ikerodah, E.; Xu, W.; Li, Q.; Xue, Y. Calcineurin B-like interacting protein kinase OsCIPK23 functions in pollination and drought stress responses in rice (Oryza sativa L.). J. Genet. Genom. 2008, 35, 531–543. [Google Scholar] [CrossRef]
  17. Kolukisaoglu, U. Calcium sensors and their interacting protein kinases: Genomics of the Arabidopsis and rice CBL-CIPK signaling networks. Plant Physiol. 2004, 134, 43–58. [Google Scholar] [CrossRef] [PubMed]
  18. Yu, Y.; Xia, X.; Yin, W.; Zhang, H. Comparative genomic analysis of CIPK gene family in Arabidopsis and Populus. Plant Growth Regul. 2007, 52, 101–110. [Google Scholar] [CrossRef]
  19. Chen, X.; Gu, Z.; Xin, D.; Hao, L.; Liu, C.; Huang, J.; Ma, B.; Zhang, H. Identification and characterization of putative CIPK genes in maize. J. Genet. Genom. 2011, 38, 77–87. [Google Scholar] [CrossRef]
  20. Kanwar, P.; Sanyal, S.K.; Tokas, I.; Yadav, A.K.; Pandey, A.; Kapoor, S.; Pandey, G.K. Comprehensive structural, interaction and expression analysis of CBL and CIPK complement during abiotic stresses and development in rice. Cell Calcium 2014, 56, 81–95. [Google Scholar] [CrossRef]
  21. Zhu, K.; Chen, F.; Liu, J.; Chen, X.; Hewezi, T.; Cheng, Z.M.M. Evolution of an intron-poor cluster of the CIPK gene family and expression in response to drought stress in soybean. Sci. Rep. 2016, 6, 1–12. [Google Scholar] [CrossRef]
  22. Zhang, H.; Yang, B.; Liu, W.-Z.; Li, H.; Wang, L.; Wang, B.; Deng, M.; Liang, W.; Deyholos, M.K.; Jiang, Y.-Q. Identification and characterization of CBL and CIPK gene families in canola (Brassica napus L.). BMC Plant Biol. 2014, 14, 8. [Google Scholar] [CrossRef]
  23. Ye, C.-Y.; Xia, X.; Yin, W. Evolutionary analysis of CBL-interacting protein kinase gene family in plants. Plant Growth Regul. 2013, 71, 49–56. [Google Scholar] [CrossRef]
  24. He, C.; Yu, Z.; Teixeira Da Silva, J.A.; Zhang, J.; Liu, X.; Wang, X.; Zhang, X.; Zeng, S.; Wu, K.; Tan, J.; et al. DoGMP1 from Dendrobium officinale contributes to mannose content of water-soluble polysaccharides and plays a role in salt stress response. Sci. Rep. 2017, 7, 1–13. [Google Scholar] [CrossRef]
  25. Zhang, J.; He, C.; Wu, K.; Teixeira da Silva, J.A.; Zeng, S.; Zhang, X.; Yu, Z.; Xia, H.; Duan, J. Transcriptome analysis of Dendrobium officinale and its application to the identification of genes associated with polysaccharide synthesis. Front. Plant Sci. 2016, 7, 1–14. [Google Scholar] [CrossRef] [PubMed]
  26. Kleist, T.J.; Spencley, A.L.; Luan, S. Comparative phylogenomics of the CBL-CIPK calcium-decoding network in the moss Physcomitrella, Arabidopsis, and other green lineages. Front. Plant Sci. 2014, 5, 1–17. [Google Scholar] [CrossRef] [PubMed]
  27. Tan, J.; Miao, Z.; Ren, C.; Yuan, R.; Tang, Y.; Zhang, X.; Han, Z.; Ma, C. Evolution of intron-poor clades and expression patterns of the glycosyltransferase family 47. Planta 2017, 1–16. [Google Scholar] [CrossRef] [PubMed]
  28. Lee, S.C.; Lan, W.-Z.; Kim, B.-G.; Li, L.; Cheong, Y.H.; Pandey, G.K.; Lu, G.; Buchanan, B.B.; Luan, S. A protein phosphorylation/dephosphorylation network regulates a plant potassium channel. Proc. Natl. Acad. Sci. USA 2007, 104, 15959–15964. [Google Scholar] [CrossRef]
  29. Kim, K.-N.; Cheong, Y.H.; Grant, J.J.; Pandey, G.K.; Luan, S. CIPK3, a calcium sensor–associated protein kinase that regulates abscisic acid and cold signal transduction in Arabidopsis. Plant Cell 2003, 15, 411–423. [Google Scholar] [CrossRef]
  30. Xiong, L. The Arabidopsis LOS5/ABA3 locus encodes a molybdenum cofactor sulfurase and modulates cold stress- and osmotic stress-responsive gene expression. Plant Cell Online 2001, 13, 2063–2083. [Google Scholar] [CrossRef]
  31. Wu, Z.-G.; Jiang, W.; Chen, S.-L.; Mantri, N.; Tao, Z.-M.; Jiang, C.-X. Insights from the cold transcriptome and metabolome of Dendrobium officinale: Global reprogramming of metabolic and gene regulation networks during cold acclimation. Front. Plant Sci. 2016, 7, 1–16. [Google Scholar] [CrossRef]
  32. Keunen, E.; Peshev, D.; Vangronsveld, J.; Van Den Ende, W.; Cuypers, A. Plant sugars are crucial players in the oxidative challenge during abiotic stress: Extending the traditional concept. Plant Cell Environ. 2013, 36, 1242–1255. [Google Scholar] [CrossRef] [PubMed]
  33. Nishizawa, A.; Yabuta, Y.; Shigeoka, S. Galactinol and raffinose constitute a novel function to protect plants from oxidative damage. Plant Physiol. 2008, 147, 1251–1263. [Google Scholar] [CrossRef] [PubMed]
  34. Farani, T.F.; Gentile, A.; Tavares, R.G.; Ribeiro, C.; Menossi, M. Characterization of a protein-protein interaction network of the CBL-interacting protein kinase 8 from sugarcane. Genet. Mol. Res. 2015, 14, 483–491. [Google Scholar] [CrossRef] [PubMed]
  35. Ribeiro, C.; Felix, J.M.; Menossi, M. Sugar signaling on the regulation of the CBL/CIPK network in sugarcane contrasting sugar amount varieties. In Proceedings of the 56° Brazilian Genetics Conference, Guarujá, Brazil, 2010. [Google Scholar]
  36. Lee, E.-J.; Iai, H.; Sano, H.; Koizumi, N. Sugar responsible and tissue specific expression of a gene encoding AtCIPK14, an Arabidopsis CBL-interacting protein kinase. Biosci. Biotechnol. Biochem. 2005, 69, 242–245. [Google Scholar] [CrossRef]
  37. Sanyal, S.K.; Kanwar, P.; Samtani, H.; Kaur, K.; Jha, S.K.; Pandey, G.K. Alternative splicing of CIPK3 results in distinct target selection to propagate ABA signaling in Arabidopsis. Front. Plant Sci. 2017, 8, 1–11. [Google Scholar] [CrossRef] [PubMed]
  38. Kelemen, O.; Convertini, P.; Zhang, Z.; Wen, Y.; Shen, M.; Falaleeva, M.; Stamm, S. Function of alternative splicing. Gene 2013, 514, 1–30. [Google Scholar] [CrossRef]
  39. Finn, R.D.; Bateman, A.; Clements, J.; Coggill, P.; Eberhardt, R.Y.; Eddy, S.R.; Heger, A.; Hetherington, K.; Holm, L.; Mistry, J.; et al. Pfam: The protein families database. Nucleic Acids Res. 2014, 42, 222–230. [Google Scholar] [CrossRef] [PubMed]
  40. Eddy, S.R. Profile hidden markov models. Bioinformatics 1999, 14, 755–763. [Google Scholar] [CrossRef]
  41. Letunic, I. SMART 4.0: Towards genomic data integration. Nucleic Acids Res. 2004, 32, 142–144. [Google Scholar] [CrossRef]
  42. Gasteiger, E.; Hoogland, C.; Gattiker, A.; Duvaud, S.; Wilkins, M.R.; Appel, R.D.; Bairoch, A. Protein identification and analysis tools on the ExPASy server. Methods Mol. Biol. 1999, 52, 571–608. [Google Scholar]
  43. Bjellqvist, B.; Hughes, G.J.; Pasquali, C.; Paquet, N.; Ravier, F.; Sanchez, J.; Frutiger, S.; Hochstrasser, D.F. The focusing positions of polypeptides in immobilized pH gradients can be predicted from their amino acid sequences. Electrophoresis 1993, 14, 1023–1031. [Google Scholar] [CrossRef] [PubMed]
  44. Celis, J.E. Reference points for comparisons of two-dimensional maps of proteins from different human cell types defined in a pH scale where isoelectric points correlate with polypeptide compositions. Electrophoresis 1994, 15, 529–539. [Google Scholar] [CrossRef]
  45. Gasteiger, E.; Gattiker, A.; Hoogland, C.; Ivanyi, I.; Appel, R.D.; Bairoch, A. ExPASy: The proteomics server for in-depth protein knowledge and analysis. Nucleic Acids Res. 2003, 31, 3784–3788. [Google Scholar] [CrossRef] [PubMed]
  46. Edgar, R.C. MUSCLE: A multiple sequence alignment method with reduced time and space complexity. BMC Bioinform. 2004, 5, 1–19. [Google Scholar] [CrossRef] [PubMed]
  47. Saitou, N.; Nei, M. The neighbour-joining method: A new method for reconstructing phylogenetic trees. Mol. Biol. Evol. 1987, 4, 406–425. [Google Scholar] [CrossRef] [PubMed]
  48. Kumar, S.; Stecher, G.; Tamura, K. MEGA7: Molecular evolutionary genetics analysis version 7.0 for bigger datasets. Mol. Biol. Evol. 2016, 33, 1870–1874. [Google Scholar] [CrossRef] [PubMed]
  49. Hu, B.; Jin, J.; Guo, A.Y.; Zhang, H.; Luo, J.; Gao, G. GSDS 2.0: An upgraded gene feature visualization server. Bioinformatics 2015, 31, 1296–1297. [Google Scholar] [CrossRef] [PubMed]
  50. Bailey, T.L.; Johnson, J.; Grant, C.E.; Noble, W.S. The MEME Suite. Nucleic Acids Res. 2015, 43, W39–W49. [Google Scholar] [CrossRef] [PubMed]
  51. Wan, X.; Zou, L.; Zheng, B.; Tian, Y.; Wang, Y. Transcriptomic profiling for prolonged drought in Dendrobium catenatum. Sci. Data 2018, 5, 180233. [Google Scholar] [CrossRef]
  52. Zhang, G.Q.; Liu, K.W.; Li, Z.; Lohaus, R.; Hsiao, Y.Y.; Niu, S.C.; Wang, J.Y.; Lin, Y.C.; Xu, Q.; Chen, L.J.; et al. The Apostasia genome and the evolution of orchids. Nature 2017, 549, 379–383. [Google Scholar] [CrossRef]
  53. Zhang, M.; Sun, H.; Fei, Z.; Zhan, F.; Gong, X.; Gao, S. Fastq_clean: An optimized pipeline to clean the Illumina sequencing data with quality control. 2014 IEEE Int. Conf. Bioinform. Biomed. 2014, 44–48. [Google Scholar] [CrossRef]
  54. Kim, D.; Langmead, B.; Salzberg, S.L. HISAT: A fast spliced aligner with low memory requirements. Nat. Methods 2015, 12, 357–360. [Google Scholar] [CrossRef] [PubMed]
  55. Pertea, M.; Kim, D.; Pertea, G.M.; Leek, J.T.; Salzberg, S.L. Transcript-level expression analysis of RNA-seq experiments with HISAT, StringTie and Ballgown. Nat. Protoc. 2016, 11, 1650–1667. [Google Scholar] [CrossRef] [PubMed]
  56. Li, H.; Handsaker, B.; Wysoker, A.; Fennell, T.; Ruan, J.; Homer, N.; Marth, G.; Abecasis, G.; Durbin, R.; 1000 genome project data processing subgroup. The sequence alignment/map (SAM) format and SAMtools. Bioinformatics 2009, 25, 2078–2079. [Google Scholar] [CrossRef] [PubMed]
  57. Anders, S.; Pyl, P.T.; Huber, W. HTSeq-A Python framework to work with high-throughput sequencing data. Bioinformatics 2015, 31, 166–169. [Google Scholar] [CrossRef] [PubMed]
  58. Anders, S.; McCarthy, D.J.; Chen, Y.S.; Okoniewski, M.; Smyth, G.K.; Huber, W.; Robinson, M.D. Count-based differential expression analysis of RNA sequencing data using R and Bioconductor. Nat. Protoc. 2013, 8, 1765–1786. [Google Scholar] [CrossRef] [PubMed]
  59. Deng, W.; Wang, Y.; Liu, Z.; Cheng, H.; Xue, Y.; Min, M. HemI: A Toolkit for Illustrating Heatmaps. PLoS ONE 2014, 9, 9–13. [Google Scholar] [CrossRef]
  60. Pertea, M.; Pertea, G.M.; Antonescu, C.M.; Chang, T.; Mendell, J.T.; Salzberg, S.L. StringTie enables improved reconstruction of a transcriptome from RNA-seq reads. Nat. Biotechnol. 2015, 33, 290–295. [Google Scholar] [CrossRef]
  61. R Foundation for Statistical Computing. R: A Language and Environment for Statistical Computing; R Foundation for Statistical Computing: Vienna, Austria, 2015. [Google Scholar]
  62. Frazee, A.C.; Pertea, G.; Jaffe, A.E.; Langmead, B.; Salzberg, S.L.; Leek, J.T. Ballgown bridges the gap between transcriptome assembly and expression analysis. Nat. Biotechnol. 2015, 33, 243–246. [Google Scholar] [CrossRef]
  63. Lescot, M. PlantCARE, a database of plant cis-acting regulatory elements and a portal to tools for in silico analysis of promoter sequences. Nucleic Acids Res. 2002, 30, 325–327. [Google Scholar] [CrossRef]
  64. Marcoulides, G.A.; Marcoulides, L.D. SAS (Statistical Analysis System); California State University: Fullerton, CA, USA, 2003. [Google Scholar]
Figure 1. Phylogenetic relationship of D. catenatum CIPK proteins and gene structure. (A) Neighbor-joining tree. D. catenatum CIPK genes were divided into three subgroups (I–III) with different colored branches. (B) Exon and intron analysis was performed using GSDS. Green boxes represent exons and black lines represent introns. Red boxes represent upstream/downstream-untranslated regions. (C) Classification of CIPK genes into an intron-poor clade (red diamond) and an intron-rich clade (blue squares).
Ijms 20 00688 g001
Figure 2. Conserved motifs in D. catenatum CIPK proteins. All motifs were identified by MEME with the 24 complete protein sequences of the CIPKs.
Ijms 20 00688 g002
Figure 3. Evolutionary analysis of DcaCIPK proteins. Full-length sequences of 83 CIPK proteins from D. catenatum, Arabidopsis, and rice were used to construct the phylogenetic tree using MEGA7 with the NJ method. Subfamilies (I–V) are highlighted with different colors.
Ijms 20 00688 g003
Figure 4. Heatmap of expression profiles for DcaCIPK genes in different tissues. Read-count values were normalized with logarithm base two. The scale represents the relative signal intensity of read-count values.
Ijms 20 00688 g004
Figure 5. (A) Expression levels of DcaCIPK genes under drought stress vs (normal condition, moist matrix). (B) Expression levels of DcaCIPK genes under cold stress (vs. control). Adjusted p-value < 0.05. # indicates fold change >1.5.
Ijms 20 00688 g005
Figure 6. Abundance of DcaCIPKs’ alternative splicing isoforms under drought stress. (A) Intron-poor group. (B) Intron-rich group. DD represents drought treatment in daytime; DN represents drought treatment in nighttime; MD represents moist treatment in daytime; MN represents moist treatment in nighttime.
Ijms 20 00688 g006
Figure 7. Analysis of the protein domains in main expressed transcripts of DcaCIPK1/3. Green boxes represent pkinase domain. Red boxes represent NAF domain. Blue boxes represent KA1 domain. Grey lines represent amino acid sequences.
Ijms 20 00688 g007
Figure 8. Analysis of the important cis-regulatory elements in the sequence 1 kb upstream of DcaCIPK3. AT1-motif, part of a light responsive module; GCN4 motif, cis-regulatory element involved in endosperm expression; circadian, cis-acting regulatory element involved in circadian control; TGACG-motif, cis-acting regulatory element involved in MeJA responsiveness; Box 4, part of a conserved DNA module involved in light responsiveness; TGA-element, auxin-responsive element; GATA-motif/I-box, part of a light-responsive element; box S, wounding and pathogen responsiveness; G-box, cis-acting regulatory element involved in light responsiveness; GT1-motif, light-responsive element; Box I, light-responsive element; TCT-motif, part of a light-responsive element; Sp1, light-responsive element; ARE, cis-acting regulatory element essential for anaerobic induction; CAT-box, cis-acting regulatory element related to meristem expression; GA-motif, part of a light-responsive element.
Ijms 20 00688 g008
Figure 9. (A) Effect of time-of-day on DcaCIPK genes expression induced by drought stress. Different letters above the line points indicate statistically significant differences among sampling time treatment at the same base material water content level (p < 0.05). (B) Effect of drought treatment on DcaCIPK gene expression. Light phase began at Zeitgeber Time 6 (ZT6) and dark phase (shaded areas) began at ZT18. Data are presented as mean ± SEM. Experiments were performed 4 times. * indicates differences the effect of base material water content is significant. Different letters above the column indicate statistically significant differences among sampling time treatment (p < 0.05). (C) Relative abundance of drought treatment on transcripts (2 and 5) of DcaCIPK3 expression. DD represents drought treatment in daytime; DN represents drought treatment in nighttime; MD represents moist treatment in daytime; MN represents moist treatment in nighttime. “2” and “5” after “DD, MD, MN, and MN” represent transcript2 and 5, respectively.
Ijms 20 00688 g009
Table 1. List of 24 CIPK genes identified in D. catenatum genome and their sequence characteristics.
NameGene IDAccession ID in NCBILocusGene Length (bp)Amino Acid Length (aa)PIMw (KDa)ExonsCDS Length (bp)
DcaCIPK1Dca001684XP_020700642.1Dcat_scaffold_83:1213297-122600012,7044527.9451.17131359
DcaCIPK2Dca021183XP_020683888.1Dcat_scaffold_6544:136242-13756413234409.1650.2311323
DcaCIPK3Dca019377XP_020701813.1Dcat_scaffold_8095:113831-12388810,0584518.751.47141356
DcaCIPK4Dca004523XP_020703034.1Dcat_scaffold_4350:650622-66866818,0474348.3249.36141305
DcaCIPK5Novl001335XP_020700988.1Dcat_scaffold_787:157699-15900313054329.1849.5511299
DcaCIPK6Dca007455XP_020673946.1Dcat_scaffold_3166:141500-14281013114369.148.1911311
DcaCIPK7Dca005524XP_020676722.1Dcat_scaffold_1341:459825-46111412904299.3248.211290
DcaCIPK8Dca002402XP_020676379.1Dcat_scaffold_2414:350624-38020829,5854498.0151.09141350
DcaCIPK9Dca000041XP_020685625.1Dcat_scaffold_358:1253684-126920515,5225029.2457.14141509
DcaCIPK10Dca024760XP_020681762.1Dcat_scaffold_45917:29214-3056013474489.0750.9711347
DcaCIPK11Dca000484XP_020701016.1Dcat_scaffold_787:369843-37121313714438.7149.5831332
DcaCIPK12Dca017399XP_020676379.1Dcat_scaffold_2131:315817-31723214164718.7953.4611416
DcaCIPK13Novl001612XP_020695665.1Dcat_scaffold_937523:77342-7880218474868.0154.7411461
DcaCIPK14Dca010961XP_020686786.1Dcat_scaffold_19096:431277-43262613504498.2850.511350
DcaCIPK15Dca024725XP_020705240.1Dcat_scaffold_18826:50805-5215413504499.2550.9611350
DcaCIPK16Dca007453XP_020673947.1Dcat_scaffold_3166:100617-10196013444478.5949.7811344
DcaCIPK17Dca018676XP_020695665.1Dcat_scaffold_937621:2927-717942534177.5747.27121250
DcaCIPK18Dca003241XP_020675333.1Dcat_scaffold_9707:650080-65136012814269.0447.1511281
DcaCIPK19Dca021168XP_020702232.1Dcat_scaffold_1902:144820-14624114224737.9953.511422
DcaCIPK20Dca003305XP_020702013.1Dcat_scaffold_3734:1066698-107602793304469.3749.9221341
DcaCIPK21Dca016061XP_020688235.1Dcat_scaffold_114:141330-15753116,2024018.7845.15131206
DcaCIPK22Dca021931XP_020680456.1Dcat_scaffold_8676:215192-21661014194729.352.8211419
DcaCIPK23Dca012740XP_020697021.1Dcat_scaffold_2959:424009-43298789794328.9448.82141299
DcaCIPK24Dca025565XP_020688792.1Dcat_scaffold_11189:59465-6436248984428.7849.93141329
Table 2. Treatments and accessions of biosamples in this study.
DatasetTissueTreatmentCollected TimeBioSample Accessions in NCBISources
Dataset ALeafDrought stressDay (9:00 AM)SAMN08512102–SAMN08512105Wan et al. [51]
Night (9:00 PM)SAMN08512110–SAMN08512113
ControlDaySAMN08512106–SAMN08512109
NightSAMN08512114–SAMN08512117
Dataset BLeafCold stressDaySAMN04534730–SAMN04534732Wu et al. [31]
ControlDaySAMN04534727–SAMN04534729
Dataset CFlower budsn.a.DaySAMN05908201Zhang et al. [52]
Leafn.a.DaySAMN05912851
Green root tipn.a.DaySAMN05908239
White root n.a.DaySAMN05908241
Stemn.a.DaySAMN05908200
“n.a.” indicates that the current item is not available.

