Current Coverage of the mTOR Pathway by Next-Generation Sequencing Oncology Panels


1
Clinical Institute of Pathology, University Hospital St. Poelten, Karl Landsteiner University of Health Sciences, 3100 St. Pölten, Austria
2
Department Life Sciences, IMC University of Applied Sciences Krems, 3500 Krems, Austria
3
Department of Pathology, Medical Faculty, Otto-von-Guericke University Magdeburg, 39106 Magdeburg, Germany
4
Department of Pathology, Neuropathology, and Molecular Pathology, Medical University of Innsbruck, 6020 Innsbruck, Austria
5
Department of Neuropathology, Diagnostic & Research Center for Molecular BioMedicine, Institute of Pathology, Medical University of Graz, 8036 Graz, Austria
6
German Center for Neurodegenerative Diseases (DZNE), 39120 Magdeburg, Germany
*
Author to whom correspondence should be addressed.
†
These authors contributed equally to this work.
Int. J. Mol. Sci. 2019, 20(3), 690; https://0-doi-org.brum.beds.ac.uk/10.3390/ijms20030690
Submission received: 16 January 2019
/
Revised: 28 January 2019
/
Accepted: 29 January 2019
/
Published: 5 February 2019
(This article belongs to the Special Issue mTOR in Human Diseases)
Abstract
:The mTOR pathway is in the process of establishing itself as a key access-point of novel oncological drugs and targeted therapies. This is also reflected by the growing number of mTOR pathway genes included in commercially available next-generation sequencing (NGS) oncology panels. This review summarizes the portfolio of medium sized diagnostic, as well as research destined NGS panels and their coverage of the mTOR pathway, including 16 DNA-based panels and the current gene list of Foundation One as a major reference entity. In addition, we give an overview of interesting, mTOR-associated somatic mutations that are not yet incorporated. Especially eukaryotic translation initiation factors (eIFs), a group of mTOR downstream proteins, are on the rise as far as diagnostics and drug targeting in precision medicine are concerned. This review aims to raise awareness for the true coverage of NGS panels, which should be valuable in selecting the ideal platform for diagnostics and research.
1. Introduction
1.1. mTOR Pathway
The mTOR protein, a serine-threonine kinase of the phosphoinositide 3-kinase (PI3K)-related family, is part of two distinct complexes, mTORC1 and mTORC2. It regulates the cells in all catabolic and anabolic processes dependent on nutrients. Major components of the signaling network are summarized in Table 1 and introduced in the following chapters. Being an anchor point of cell growth, mTOR signaling is a critical target of genetic variation in cancer, and when affected it is frequently associated with carcinogenesis and tumor progression. As its term “mechanistic target of rapamycin” implies, mTOR is the target of the rapamycin-FKB12 complex [1]. mTOR is the catalytic subunit of two protein complexes, known as mTORC1 and mTORC2, acquiring different substrate specificities [2]. mTORC1 consists of a total of five components, apart from mTOR, regulatory-associated protein of mTOR (Raptor), mammalian lethal with Sec13 protein eight (mLST8, also referred to as GβL), proline-rich AKT substrate 40 kDa (PRAS40) and DEP-domain-containing mTOR-interacting protein (Deptor) [2].
Raptor is required for the correct subcellular localization of mTOR and facilitates substrate recruitment to mTOR by binding to the TOR signaling (TOS) motif on mTORC1 substrates [1,2,3]. mLST8 has been proposed to associate with the catalytic domain of the complex and to stabilize the kinase loop [4]. Despite these findings, it was also reported that mLST8 is not essential for mTORC1 signaling [5].
The remaining two subunits, PRAS40 and Deptor, have been characterized as negative regulators [6,7]. In this manner, when mTORC1 activity is reduced, the two subunits are recruited to the complex and promote the inhibition of mTORC1. Furthermore, it has been proposed that PRAS40 functions as a regulator of mTORC1 kinase activity by direct inhibition of substrate binding [8]. When mTORC1 is activated, it phosphorylates PRAS40 and Deptor, thereby reducing the physical interaction with mTORC1 and further activating the complex [7,8].
The second complex, mTORC2, shares some of the same subunits: mTOR, mLST8, and Deptor. Additionally, it consists of the rapamycin-insensitive companion of mTOR (Rictor), mammalian stress-activated protein kinase interacting protein (mSIN1), and protein observed with Rictor-1 (Protor-1). Deptor, again, has been shown to negatively regulate the activity of the complex [7]. In contrast, mLST8 seems to play a crucial role in maintaining mTORC2 function [5]. Rictor and mSIN1 have been reported to stabilize each other, thereby providing the structural foundation of mTORC2 [9,10]. mSIN1 additionally contains a phosphoinositide-binding PH domain that is critical for the insulin-dependent regulation of mTORC2 activity [1]. Rictor has also been shown to interact with Protor-1, but the physiological function of this interaction is not yet clear [11,12].
When considering the upstream signaling of these two complexes, it is important to mention, even though not relevant in physiological conditions, that mTORC1 is considered to be rapamycin-sensitive, whereas TOCR2 is not [13]. When rapamycin enters the cell, it binds to FK506-binding protein 12 kDa (FKBP12) and interacts with the FKBP12 binding domain (FBD) of mTOR. This interaction inhibits the function of mTORC1. On the contrary, rapamycin-FKBP12 cannot acutely inhibit mTORC2 [13]. However, it has been shown that, in some cases, chronic rapamycin treatment can inhibit mTORC2 activity after all [14]. Furthermore, it has been reported that rapamycin does not inhibit all functions of mTORC1 [15].
mTORC1 can be regulated by a variety of signals, such as growth factors (GFs), energy status, oxygen, DNA damage, and amino acids [16]. Multiple different GF pathways converge on one of the most important factors regulating mTORC1, the tuberous sclerosis complex (TSC). TSC is a heterotrimer that consists of TSC1, TSC2, and TBC1D7 [17]. This complex functions as a GTPase activation protein (GAP) for the Ras homolog enriched in brain (Rheb), converting it to its inactive, GDP-bound state. Active, GTP-bound Rheb directly interacts with mTORC1 and stimulates its activity. Hence, TSC1/2 negatively regulates mTORC1 [6,16,18]. GF pathways regulating mTORC1 include the insulin/insulin-like growth factor-1 (IGF-1) pathway, receptor-tyrosine kinase-dependent Ras signaling pathway, as well as Wnt and TNFα signaling. IGF-1 causes AKT-dependent phosphorylation of TSC2 [1,19]. Ras signaling also activates mTORC1 via TSC2 phosphorylation, which is achieved through the MAP kinase ERK and its effector p90RSK [1,16,20]. Additionally, AKT activation can activate mTORC1 in a TSC1/2-independent manner, by the promotion of the dissociation of PRAS40 from mTORC1 [6,8,21]. Wnt and TNFα, on the other hand, exert their influence on mTORC1 via the inhibition of TSC1 [22,23].
Intracellular and extracellular stress signals can also regulate mTORC1. In this manner, a reduction in cellular energy activates AMPK, which inhibits mTORC1 through the phosphorylation of Raptor and the activation of TSC2 [1,22]. Hypoxia also activates AMPK, but affects mTORC1 additionally through the induction of REDD1, which activates TSC [24]. DNA damage inhibits the mTORC1 complex via the induction of p53 target genes which, in turn, increase TSC activity [25]. Amino acid sensing by mTORC1 is mediated by Rags, which are heterodimers consisting of RagA or RagB with RagC or RagD [26]. These dimers are tethered to the lysosomal membrane [27,28]. Upon amino acid stimulation, Rags are activated and bind Raptor, leading to the recruitment of mTORC1 to the lysosomal membrane where Rheb is located as well [28]. mTORC1 signaling only takes place when both Rheb and Rags are activated [1].
Compared to the mTORC1 upstream network, mTORC2 seems to be less complex. The complex primarily functions as an effector of insulin/PI3K signaling [1]. The PH domain of mSIN1 inhibits the catalytic function of mTORC2 in the absence of insulin. Upon binding to PI3K-generated PIP3, this inhibition is relieved [29]. Furthermore, AKT can phosphorylate mSIN1, suggesting the presence of a positive feedback loop in which partial AKT activation promotes mTORC2 activation, which then fully activates AKT [30]. Another regulator of mTORC2 is mTORC1, mediated by a negative feedback loop between mTORC1 and insulin/PI3K signaling [1,31]. The upstream network, as described here, is illustrated in Figure 1A.
The downstream signaling of mTORC1 is as diverse as its upstream paths. It plays a crucial role in the balance between anabolism and catabolism by promoting lipid, protein, and nucleotide production while simultaneously suppressing autophagy [1].
Lipid synthesis is promoted by mTORC1 through the sterol responsive element binding protein (SREBP) transcription factors. These control the expression of metabolic genes [1,32]. Usually SREPB is activated due to low sterol levels. However, mTORC1 can activate SREPB independent of sterol levels in a p70S6 Kinase 1 (S6K1)-dependent manner or via the phosphorylation of another substrate, Lipin1. In the absence of mTORC1, Lipin1 inhibits SERBP [33,34].
mTORC1 mostly promotes protein synthesis via S6K1 phosphorylation and eukaryotic initiation factor 4E (eIF4E) Binding Protein-1 (4EBP-1). By phosphorylating S6K1, mTORC1 enables its subsequent activation by PDK1. The active S6K1 then activates factors in favor of mRNA translation initiation, including eIF4B, which is a positive regulator of the 5’ cap binding eIF4F complex [35]. S6K1 is known to phosphorylate, thereby promoting the degradation of PDCD4, an inhibitor of eIF4B [36]. 4EBP inhibits translation by binding eIF4E, which prevents the assembly of the eIF4F complex. However, mTORC1 phosphorylates 4EBP and thereby causes its dissociation from eIF4E. This allows eIF4E to promote cap-dependent translation [37,38,39]. This tremendous regulatory power of translation initiation links these two molecular processes and requires a consideration of further eIF subunits, when looking at the overall impact of mTOR signaling. Taking all subunits into consideration, this protein family comprises more than 30 members [40].
The synthesis of nucleotides is also promoted by mTORC1 signaling. Thus, mTORC1 induces purine synthesis through the increased expression of MTHFD2, which controls the mitochondrial tetrahydrofolate cycle [41]. In a similar vein, S6K1 phosphorylates carbamoyl-phosphate synthetase (CAD), which catalyzes the initial steps of de-novo pyrimidine synthesis [42]. mTORC1 has also been shown to increase the translation of HIF1α, which leads to the expression of glycolytic enzymes such as PFK [33]. The activation of SREBP by mTORC1 additionally leads to an increase in the pentose phosphate pathway (PPP). These mechanisms lead to a shift in glucose metabolism towards glycolysis, which facilitates growth [1]. All these anabolic processes support cell growth, however, mTORC1 also supports growth by the suppression of catabolic processes, the most notable process being autophagy [1]. An important transcription factor that drives the expression of genes for autophagy and lysosomal biogenesis is the transcription factor EB (TFEB). This transcription factor can be phosphorylated by mTORC1, which subsequently inhibits its nuclear translocation [43]. Furthermore, another important step in autophagy can be inhibited by mTORC1, which is the autophagosome formation. ULK1, a kinase that normally forms a complex with a number of other components, drives the autophagosome formation. However, under nutrient-rich conditions, mTORC1 phosphorylates ULK1 and thereby disrupts the interaction between ULK1 and AMPK, which is an activator of autophagy [44].
Similar to the upstream processes, the downstream processes of mTORC2 are considered to be less complex. Most probably, mTORC2 plays a key role in the phosphorylation of AKT [1]. AKT is a key effector protein of the insulin/PI3K signaling pathway and can be activated by mTORC2 [45]. When active, AKT promotes cell proliferation, survival and growth through the inhibition of various substrates, including but not limited to the FoxO1/3a TFs; GSK3ß, a metabolic regulator; and TSC2 [45]. Nevertheless, studies have shown that mTORC2 is not crucial to the phosphorylation of all substrates of Akt, for example, TSC can be phosphorylated by Akt without mTORC2 [5]. However, it has been reported to be essential for the phosphorylation of other substrates, such as FoxO1/3a [10]. mTORC2 phosphorylates several members of the AGC (PKA/PKG/PKC) family and thereby controls proliferation and survival [46,47]. One major cellular process influenced by mTORC2 is the actin cytoskeleton. Several PKC family members have been reported to be phosphorylated by mTORC2, all of which are involved in the regulation of cytoskeletal remodeling and cell migration [46,47,48,49]. Furthermore, mTORC2 can also activate SGK1, which is an AGC-kinase that regulates ion transport and cell survival [50].
1.2. mTOR Signaling in Cancer
Considering how involved the mTOR signaling pathway is, it comes as no surprise that it also plays a crucial role in human disease, particularly cancer. The complex most commonly associated with cell proliferation and cancer progression when deregulated is the mTORC1 complex [53,54]. A number of signaling components both upstream and downstream of mTOR are frequently deregulated or altered in human cancer [53]. Through alterations in one or multiple of these elements, mTOR signaling is activated in many cancer types, suggesting mTOR as a potent target for cancer therapy. Due to this fact, mTOR pathway inhibitors have been of prime interest in recent years. These inhibitors include rapamycin and its analogs (rapalogs) and, more recently, mTOR kinase domain inhibitors [55]. Despite showing promise, rapalog monotherapy has been proven mostly insufficient in causing tumor regression, with notable exceptions of tumors showing mutations in mTOR itself, LOF mutations in TSC1 or TSC2 [55,56,57,58,59]. Broadrange reports correlating mTOR pathway mutations to drug response are yet missing, but there are studies towards that aim that are very promising. Specifically, a study identified 33 MTOR mutations that lead to pathway hyperactivity in cancer [58]. A heightened rapamycin sensitivity in cells harboring these hyperactivating mTOR mutations suggests that they convey mTOR pathway dependency. These results are supported by the report of an extraordinary responder with two activating mTOR mutations in urothelial carcinoma and an exceptional response to rapalog treatment in combination with a TKI [58,59].
Furthermore, patients with the genetic disorder tuberous sclerosis complex (TSC) (mutations in the TSC1 or TSC2 gene), commonly develop tumors like astrocytomas or angiomyolipomas as well as the related lung disorder Lymphangioleiomyomatosis (LAM). Treatment with rapalogs has been shown to improve clinical outcomes and cause tumor regression in TSC patients with astrocytomas or sporadic LAM, again suggesting a dependence on mTOR signaling for tumor growth [60,61,62]. A phase II clinical trial found a 50% response rate in TSC patients with angiomyolipomas or sporadic LAM [63]. Furthermore, heightened treatment sensitivity was associated with TSC1 or TSC2 LOF mutations, as reported in bladder and thyroid cancer [56,57]. Other responders have been reported in one pancreatic cancer with loss of suppression of mTOR signaling and three patients with perivascular epithelioid cell tumors with the loss of TSC2 [64,65]. However, in the thyroid cancer extraordinary responder case study, the tumor gained resistance to rapalog treatment as it acquired a mutation in mTOR, which prevented the binding of the rapalog, as well as a nonsense mutation in TSC2 [57]. Further literature regarding rapamycin and rapalogs as monotherapy includes References [66] and [67]. These specific cases show the importance of rapamycin and rapalogs, as well as the development of reliable biomarkers, for precision medicine. Apart from these cases, it has been shown that, while not very potent on its own, mTORC1 inhibition might be necessary to achieve a proper response to drugs that target the primary oncogenic pathway in the given cancer. On top of that, sustained mTORC1 activation is proposed to be a major mechanism of resistance to targeted therapies [55,56,57,58,59,68].
Furthermore, mTORC1 is, as mentioned above, not only involved in stimulating growth but also in regulating autophagy. Autophagy has been described as double-edged sword in the modulation of cancer, since both inhibition and induction of autophagy have been shown to be both pro and anti-tumorigenic [54,55,56,57,58,59,68,69]. Even though a better understanding of the individual factors contributing to the effect autophagy has on cancer is needed, mTORC1 and its associated regulators of autophagy, ULK1 and AMPK, represent attractive targets for cancer therapy [54].
1.3. Next-Generation-Sequencing
DNA sequence analysis has come a long way since the establishment of the Sanger chain termination method in 1977 [70]. From then on, scientists have developed reliable and reproducible ways of DNA sequencing, steadily decreasing the costs and increasing output. Output, which was formerly one read of one gene at a time, is now more adequately given in gigabases per run, reflecting the parallel analysis of multiple genes with read depths (i.e., the number of reads covering a genetic locus) of 20 up to 1000 or more, depending on the application [71]. Next Generation Sequencing (NGS) is the most common name of the second-generation, deep-sequencing techniques. All platforms are following a three-step procedure: (1) Library-preparation, (2) Cluster/Bridge Amplification, and (3) sequencing, i.e., strands of fragmented DNA are amplified and immobilized on a surface or bead, then nucleotide bases are added sequentially using DNA polymerase; excess reagent is washed out to enable correct imaging according to the base incorporated; this process repeats for each base. The actual sequence analysis is for, e.g., Illumina based on fluorescent signaling, while Ion Torrent technology relies on pH changes detected by semiconductors [72,73,74].
2. Summary and Comparison of Oncological NGS Panels and Their Coverage of the mTOR Pathway
In the following, we summarize commercially available NGS gene panels that cover a number of genes reasonable for research and clinical applications, i.e., covering a medium number of gene loci, excluding large scale screening panels. We included the gold standard genetic analysis panel Foundation One as a reference. In a next step, we look at the coverage of the mTOR pathway by the various panels. Therefore, we submerged a 78-item list of mTOR signaling-relevant genes. This list is based on the publicly available “mTOR Pathway—Gene List”, generated with the help of David Sabatini, a leading expert in the field [75]. We extended the list by a number of genes, among them the complete eIF3 and eIF4 protein families, representing a more general field of mTOR impact (Supplementary Table S1).
Oncological NGS Gene Panels
The growing capacity of NGS devices, with an increasing number of genes and read depth has initiated a trend towards whole exome and whole genome sequencing. These techniques will be state of the art in the near future. Today, bioinformatic and data storage issues also limit the application of global analyses and make panels comprising 10–150 genes to the standards in the field. Most of these panels run on Illumina MiniSeq, MiSeq, and iSeq devices or on the Ion Torrent S5 Series devices by Applied Biosystems [76]. Supplementary Table S1 shows a collection of 16 different gene panels for oncological application and the full gene lists together with the gene list of Foundation One. The gene panels and number of genes are summarized in Table 2. As already mentioned, we consider only ready-made gene panles with a low-medium number of genes analyzed. All these panels are based on DNA only, as DNA material is sufficient to detect genetic mutations. RNA sequencing would add a surplus on information on e.g. gene fusions or gene expression, but RNA is more difficult to isolate from especially FFPE tissue in an adequate quality [77] and besides that hardly any gene panels covering RNA targets are available to date. One of the available gene panels with DNA and RNA pools is the Ion AmpliSeq/AmpliSeq for Illumina Focus Panel, which is also considered in this review. This Focus Panel targets 40 DNA sites and additional 23 RNA sites, among the latter is also the mTOR-relevant AKT3 [78].
The mTOR-relevant genes covered by the oncological NGS panels primarily consist of mTOR upstream AKT and PIK3CA. To elucidate the relevance for the signaling pathway, we collected data from the catalog of somatic mutations in cancer (COSMIC; cancer.sanger.ac.uk/cosmic) on mutational frequency and associated drug sensitivity/resistances (Table 3).
Of the genes analyzed here, TP53 was identified by this catalog as the by far most commonly mutated gene in cancer (25.2%), followed by PIK3CA (9.7%) and PTEN (5%). According to the catalog, none of the genes harbor drug-associated resistance mutations, but indeed, mutations were associated with altered sensitivity. In this manner, mutations of NF1 alter the sensitivity to the drug Nutlin-3a, which is targeting MDM2. Mutations in PIK3CA are associated with altered sensitivity to Pictilisib and GSK690693, targeting PI3K and AKT1/2/3, respectively. Mutations in PIK3R1 are associated with altered sensitivity to Dacinostat, targeting HDAC1. Mutations in PTEN are associated with altered sensitivity to GSK690693. Mutations in TP53 are associated with altered sensitivity to the following seven drugs: 5-Fluorouracil (5-FU, antimetabolite), Rucaparib (targeting PARP1/2), CX-5461 (acts on RNA polymerase 1), (5Z)-7-Oxozeaenol (targeting TAK1), Bleomycin (acts by induction of dsDNA breaks and DNA damage repair), Dabrafenib (targeting BRAF), and Nutlin-3a [79].
The most frequently mutated genes, together with affected tissues and actual occurring mutations, are listed in Table 4.
3. Discussion and Conclusions
We have shown that mTOR-associated genes generally show low mutational frequencies in cancer. Only TP53, with 25.2% is a frequent target of mutations, and is known to interact with numerous signaling cascades besides the mTOR pathway. PIK3CA with 9.7% and PTEN with 5% mutational frequency are especially interesting, as they are also associated with drug sensitivities. In fact, a ranking of genes according to their associated drug sensitivity also shows a better representation of the mTOR pathway than with actual number of mutated samples. When looking at all described genes, it becomes evident that very little awareness is drawn to mTOR downstream, e.g., eIFs, with low mutational frequencies throughout and no reported drug sensitivity alterations. This results in a ambivalent situation; on the one hand the high importance of mTOR pathway and translational control for carcinogenesis and growth control of tumor cells, is emphasized by a growing number of research as well as clinical reports, on the other hand, NGS and following the information of tumor mutational burden, generated by NGS analyses show only limited applicability in terms of mTOR pathway associated readouts. For the here featured pathway, it will be critical to employ RNA-sequencing and nanopore sequencing techniques, which will allow for an evaluation of gene expression next to mutational status, thereby multiplying the information on mTOR signaling in cancer. By those means well described predictive as well as prognostic tumor markers can be evaluated by their expression levels. This is changing the view on our gene panel, which holds numerous marker genes that are known to have great impact on disease progression and prognosis, even though they are poorly covered by NGS and are rarely mutated. Important examples of these markers are the eIF subunits [104,105,106].
Supplementary Materials
Supplementary materials can be found at https://0-www-mdpi-com.brum.beds.ac.uk/1422-0067/20/3/690/s1.
Conflicts of Interest
The authors declare no conflict of interest.
References
- Saxton, R.A.; Sabatini, D.M. mTOR Signaling in Growth, Metabolism, and Disease. Cell 2017, 168, 960–976. [Google Scholar] [CrossRef] [PubMed]
- Guertin, D.A.; Sabatini, D.M. Defining the role of mTOR in cancer. Cancer Cell 2007, 12, 9–22. [Google Scholar] [CrossRef] [PubMed]
- Schalm, S.S.; Fingar, D.C.; Sabatini, D.M.; Blenis, J. TOS motif-mediated raptor binding regulates 4E-BP1 multisite phosphorylation and function. Curr. Biol. 2003, 13, 797–806. [Google Scholar] [CrossRef]
- Nojima, H.; Tokunaga, C.; Eguchi, S.; Oshiro, N.; Hidayat, S.; Yoshino, K.; Hara, K.; Tanaka, N.; Avruch, J.; Yonezawa, K. The mammalian target of rapamycin (mTOR) partner, raptor, binds the mTOR substrates p70 S6 kinase and 4E-BP1 through their TOR signaling (TOS) motif. J. Biol. Chem. 2003, 278, 15461–15464. [Google Scholar] [CrossRef] [PubMed]
- Yang, H.; Rudge, D.G.; Koos, J.D.; Vaidialingam, B.; Yang, H.J.; Pavletich, N.P. mTOR kinase structure, mechanism and regulation. Nature 2013, 497, 217–223. [Google Scholar] [CrossRef] [PubMed]
- Guertin, D.A.; Stevens, D.M.; Thoreen, C.C.; Burds, A.A.; Kalaany, N.Y.; Moffat, J.; Brown, M.; Fitzgerald, K.J.; Sabatini, D.M. Ablation in mice of the mTORC components raptor, rictor, or mLST8 reveals that mTORC2 is required for signaling to Akt-FOXO and PKCalpha, but not S6K1. Dev. Cell 2006, 11, 859–871. [Google Scholar] [CrossRef] [PubMed]
- Sancak, Y.; Thoreen, C.C.; Peterson, T.R.; Lindquist, R.A.; Kang, S.A.; Spooner, E.; Carr, S.A.; Sabatini, D.M. PRAS40 is an insulin-regulated inhibitor of the mTORC1 protein kinase. Mol. Cell 2007, 25, 903–915. [Google Scholar] [CrossRef] [PubMed]
- Peterson, T.R.; Laplante, M.; Thoreen, C.C.; Sancak, Y.; Kang, S.A.; Kuehl, W.M.; Gray, N.S.; Sabatini, D.M. DEPTOR is an mTOR inhibitor frequently overexpressed in multiple myeloma cells and required for their survival. Cell 2009, 137, 873–886. [Google Scholar] [CrossRef] [PubMed]
- Wang, L.; Harris, T.E.; Roth, R.A.; Lawrence, J.C., Jr. PRAS40 regulates mTORC1 kinase activity by functioning as a direct inhibitor of substrate binding. J. Biol. Chem. 2007, 282, 20036–20044. [Google Scholar] [CrossRef]
- Frias, M.A.; Thoreen, C.C.; Jaffe, J.D.; Schroder, W.; Sculley, T.; Carr, S.A.; Sabatini, D.M. mSin1 is necessary for Akt/PKB phosphorylation, and its isoforms define three distinct mTORC2s. Curr. Biol. 2006, 16, 1865–1870. [Google Scholar] [CrossRef] [PubMed]
- Jacinto, E.; Facchinetti, V.; Liu, D.; Soto, N.; Wei, S.; Jung, S.Y.; Huang, Q.; Qin, J.; Su, B. SIN1/MIP1 maintains rictor-mTOR complex integrity and regulates Akt phosphorylation and substrate specificity. Cell 2006, 127, 125–137. [Google Scholar] [CrossRef] [PubMed]
- Woo, S.Y.; Kim, D.H.; Jun, C.B.; Kim, Y.M.; Haar, E.V.; Lee, S.I.; Hegg, J.W.; Bandhakavi, S.; Griffin, T.J. PRR5, a novel component of mTOR complex 2, regulates platelet-derived growth factor receptor beta expression and signaling. J. Biol. Chem. 2007, 282, 25604–25612. [Google Scholar] [CrossRef] [PubMed]
- Thedieck, K.; Polak, P.; Kim, M.L.; Molle, K.D.; Cohen, A.; Jeno, P.; Arrieumerlou, C.; Hall, M.N. PRAS40 and PRR5-like protein are new mTOR interactors that regulate apoptosis. PLoS ONE 2007, 2, e1217. [Google Scholar] [CrossRef] [PubMed]
- Sarbassov, D.D.; Ali, S.M.; Sengupta, S.; Sheen, J.H.; Hsu, P.P.; Bagley, A.F.; Markhard, A.L.; Sabatini, D.M. Prolonged rapamycin treatment inhibits mTORC2 assembly and Akt/PKB. Mol. Cell 2006, 22, 159–168. [Google Scholar] [CrossRef] [PubMed]
- Thoreen, C.C.; Kang, S.A.; Chang, J.W.; Liu, Q.; Zhang, J.; Gao, Y.; Reichling, L.J.; Sim, T.; Sabatini, D.M.; Gray, N.S. An ATP-competitive mammalian target of rapamycin inhibitor reveals rapamycin-resistant functions of mTORC1. J. Biol. Chem. 2009, 284, 8023–8032. [Google Scholar] [CrossRef] [PubMed]
- Laplante, M.; Sabatini, D.M. mTOR signaling at a glance. J. Cell Sci. 2009, 122, 3589–3594. [Google Scholar] [CrossRef] [PubMed]
- Dibble, C.C.; Elis, W.; Menon, S.; Qin, W.; Klekota, J.; Asara, J.M.; Finan, P.M.; Kwiatkowski, D.J.; Murphy, L.O.; Manning, B.D. TBC1D7 is a third subunit of the TSC1-TSC2 complex upstream of mTORC1. Mol. Cell 2012, 47, 535–546. [Google Scholar] [CrossRef]
- Long, X.; Lin, Y.; Ortiz-Vega, S.; Yonezawa, K.; Avruch, J. Rheb binds and regulates the mTOR kinase. Curr. Biol. 2005, 15, 702–713. [Google Scholar] [CrossRef]
- Inoki, K.; Li, Y.; Zhu, T.; Wu, J.; Guan, K.L. TSC2 is phosphorylated and inhibited by Akt and suppresses mTOR signalling. Nat. Cell Biol. 2002, 4, 648–657. [Google Scholar] [CrossRef]
- Ma, L.; Chen, Z.; Erdjument-Bromage, H.; Tempst, P.; Pandolfi, P.P. Phosphorylation and functional inactivation of TSC2 by Erk implications for tuberous sclerosis and cancer pathogenesis. Cell 2005, 121, 179–193. [Google Scholar] [CrossRef]
- Vander Haar, E.; Lee, S.I.; Bandhakavi, S.; Griffin, T.J.; Kim, D.H. Insulin signalling to mTOR mediated by the Akt/PKB substrate PRAS40. Nat. Cell Biol. 2007, 9, 316–323. [Google Scholar] [CrossRef] [PubMed]
- Inoki, K.; Ouyang, H.; Zhu, T.; Lindvall, C.; Wang, Y.; Zhang, X.; Yang, Q.; Bennett, C.; Harada, Y.; Stankunas, K.; et al. TSC2 integrates Wnt and energy signals via a coordinated phosphorylation by AMPK and GSK3 to regulate cell growth. Cell 2006, 126, 955–968. [Google Scholar] [CrossRef] [PubMed]
- Lee, D.F.; Kuo, H.P.; Chen, C.T.; Hsu, J.M.; Chou, C.K.; Wei, Y.; Sun, H.L.; Li, L.Y.; Ping, B.; Huang, W.C.; et al. IKK beta suppression of TSC1 links inflammation and tumor angiogenesis via the mTOR pathway. Cell 2007, 130, 440–455. [Google Scholar] [CrossRef] [PubMed]
- Brugarolas, J.; Lei, K.; Hurley, R.L.; Manning, B.D.; Reiling, J.H.; Hafen, E.; Witters, L.A.; Ellisen, L.W.; Kaelin, W.G., Jr. Regulation of mTOR function in response to hypoxia by REDD1 and the TSC1/TSC2 tumor suppressor complex. Genes Dev. 2004, 18, 2893–2904. [Google Scholar] [CrossRef] [PubMed]
- Feng, Z.; Hu, W.; de Stanchina, E.; Teresky, A.K.; Jin, S.; Lowe, S.; Levine, A.J. The regulation of AMPK beta1, TSC2, and PTEN expression by p53: Stress, cell and tissue specificity, and the role of these gene products in modulating the IGF-1-AKT-mTOR pathways. Cancer Res. 2007, 67, 3043–3053. [Google Scholar] [CrossRef] [PubMed]
- Kim, E.; Goraksha-Hicks, P.; Li, L.; Neufeld, T.P.; Guan, K.L. Regulation of TORC1 by Rag GTPases in nutrient response. Nat. Cell Biol. 2008, 10, 935–945. [Google Scholar] [CrossRef]
- Sancak, Y.; Bar–Peled, L.; Zoncu, R.; Markhard, A.L.; Nada, S.; Sabatini, D.M. Ragulator-Rag complex targets mTORC1 to the lysosomal surface and is necessary for its activation by amino acids. Cell 2010, 141, 290–303. [Google Scholar] [CrossRef]
- Bar-Peled, L.; Schweitzer, L.D.; Zoncu, R.; Sabatini, D.M. Ragulator is a GEF for the rag GTPases that signal amino acid levels to mTORC1. Cell 2012, 150, 1196–1208. [Google Scholar] [CrossRef]
- Liu, P.; Gan, W.; Chin, Y.R.; Ogura, K.; Guo, J.; Zhang, J.; Wang, B.; Blenis, J.; Cantley, L.C.; Toker, A.; et al. PtdIns(3,4,5)P3-Dependent Activation of the mTORC2 Kinase Complex. Cancer Discov. 2015, 5, 1194–1209. [Google Scholar] [CrossRef]
- Yang, G.; Murashige, D.S.; Humphrey, S.J.; James, D.E. A Positive Feedback Loop between Akt and mTORC2 via SIN1 Phosphorylation. Cell Rep. 2015, 12, 937–943. [Google Scholar] [CrossRef]
- Hsu, P.P.; Kang, S.A.; Rameseder, J.; Zhang, Y.; Ottina, K.A.; Lim, D.; Peterson, T.R.; Choi, Y.; Gray, N.S.; Yaffe, M.B.; et al. The mTOR-regulated phosphoproteome reveals a mechanism of mTORC1-mediated inhibition of growth factor signaling. Science 2011, 332, 1317–1322. [Google Scholar] [CrossRef] [PubMed]
- Porstmann, T.; Santos, C.R.; Griffiths, B.; Cully, M.; Wu, M.; Leevers, S.; Griffiths, J.R.; Chung, Y.L.; Schulze, A. SREBP activity is regulated by mTORC1 and contributes to Akt-dependent cell growth. Cell Metab. 2008, 8, 224–236. [Google Scholar] [CrossRef]
- Duvel, K.; Yecies, J.L.; Menon, S.; Raman, P.; Lipovsky, A.I.; Souza, A.L.; Triantafellow, E.; Ma, Q.; Gorski, R.; Cleaver, S.; et al. Activation of a metabolic gene regulatory network downstream of mTOR complex 1. Mol. Cell 2010, 39, 171–183. [Google Scholar] [CrossRef] [PubMed]
- Peterson, T.R.; Sengupta, S.S.; Harris, T.E.; Carmack, A.E.; Kang, S.A.; Balderas, E.; Guertin, D.A.; Madden, K.L.; Carpenter, A.E.; Finck, B.N.; et al. mTOR complex 1 regulates lipin 1 localization to control the SREBP pathway. Cell 2011, 146, 408–420. [Google Scholar] [CrossRef]
- Holz, M.K.; Ballif, B.A.; Gygi, S.P.; Blenis, J. mTOR and S6K1 mediate assembly of the translation preinitiation complex through dynamic protein interchange and ordered phosphorylation events. Cell 2005, 123, 569–580. [Google Scholar] [CrossRef] [PubMed]
- Dorrello, N.V.; Peschiaroli, A.; Guardavaccaro, D.; Colburn, N.H.; Sherman, N.E.; Pagano, M. S6K1- and betaTRCP-mediated degradation of PDCD4 promotes protein translation and cell growth. Science 2006, 314, 467–471. [Google Scholar] [CrossRef] [PubMed]
- Brunn, G.J.; Hudson, C.C.; Sekulic, A.; Williams, J.M.; Hosoi, H.; Houghton, P.J.; Lawrence, J.C., Jr.; Abraham, R.T. Phosphorylation of the translational repressor PHAS-I by the mammalian target of rapamycin. Science 1997, 277, 99–101. [Google Scholar] [CrossRef]
- Gingras, A.C.; Gygi, S.P.; Raught, B.; Polakiewicz, R.D.; Abraham, R.T.; Hoekstra, M.F.; Aebersold, R.; Sonenberg, N. Regulation of 4E-BP1 phosphorylation: A novel two-step mechanism. Genes Dev. 1999, 13, 1422–1437. [Google Scholar] [CrossRef]
- Richter, J.D.; Sonenberg, N. Regulation of cap-dependent translation by eIF4E inhibitory proteins. Nature 2005, 433, 477–480. [Google Scholar] [CrossRef]
- Spilka, R.; Ernst, C.; Mehta, A.K.; Haybaeck, J. Eukaryotic translation initiation factors in cancer development and progression. Cancer Lett. 2013, 340, 9–21. [Google Scholar] [CrossRef]
- Ben-Sahra, I.; Hoxhaj, G.; Ricoult, S.J.H.; Asara, J.M.; Manning, B.D. mTORC1 induces purine synthesis through control of the mitochondrial tetrahydrofolate cycle. Science 2016, 351, 728–733. [Google Scholar] [CrossRef] [PubMed]
- Ben-Sahra, I.; Howell, J.J.; Asara, J.M.; Manning, B.D. Stimulation of de novo pyrimidine synthesis by growth signaling through mTOR and S6K1. Science 2013, 339, 1323–1328. [Google Scholar] [CrossRef] [PubMed]
- Roczniak-Ferguson, A.; Petit, C.S.; Froehlich, F.; Qian, S.; Ky, J.; Angarola, B.; Walther, T.C.; Ferguson, S.M. The transcription factor TFEB links mTORC1 signaling to transcriptional control of lysosome homeostasis. Sci. Signal. 2012, 5, ra42. [Google Scholar] [CrossRef] [PubMed]
- Kim, J.; Kundu, M.; Viollet, B.; Guan, K.L. AMPK and mTOR regulate autophagy through direct phosphorylation of Ulk1. Nat. Cell Biol. 2011, 13, 132–141. [Google Scholar] [CrossRef] [PubMed]
- Sarbassov, D.D.; Guertin, D.A.; Ali, S.M.; Sabatini, D.M. Phosphorylation and regulation of Akt/PKB by the rictor-mTOR complex. Science 2005, 307, 1098–1101. [Google Scholar] [CrossRef] [PubMed]
- Sarbassov, D.D.; Ali, S.M.; Kim, D.H.; Guertin, D.A.; Latek, R.R.; Erdjument-Bromage, H.; Tempst, P.; Sabatini, D.M. Rictor, a novel binding partner of mTOR, defines a rapamycin-insensitive and raptor-independent pathway that regulates the cytoskeleton. Curr. Biol. 2004, 14, 1296–1302. [Google Scholar] [CrossRef] [PubMed]
- Gan, X.; Wang, J.; Wang, C.; Sommer, E.; Kozasa, T.; Srinivasula, S.; Alessi, D.; Offermanns, S.; Simon, M.I.; Wu, D. PRR5L degradation promotes mTORC2-mediated PKC-delta phosphorylation and cell migration downstream of Galpha12. Nat. Cell Biol. 2012, 14, 686–696. [Google Scholar] [CrossRef]
- Li, X.; Gao, T. mTORC2 phosphorylates protein kinase Czeta to regulate its stability and activity. EMBO Rep. 2014, 15, 191–198. [Google Scholar]
- Thomanetz, V.; Angliker, N.; Cloetta, D.; Lustenberger, R.M.; Schweighauser, M.; Oliveri, F.; Suzuki, N.; Ruegg, M.A. Ablation of the mTORC2 component rictor in brain or Purkinje cells affects size and neuron morphology. J. Cell Biol. 2013, 201, 293–308. [Google Scholar] [CrossRef]
- Garcia-Martinez, J.M.; Alessi, D.R. mTOR complex 2 (mTORC2) controls hydrophobic motif phosphorylation and activation of serum- and glucocorticoid-induced protein kinase 1 (SGK1). Biochem. J. 2008, 416, 375–385. [Google Scholar] [CrossRef]
- Fumarola, C.; Bonelli, M.A.; Petronini, P.G.; Alfieri, R.R. Targeting PI3K/AKT/mTOR pathway in non small cell lung cancer. Biochem. Pharmacol. 2014, 90, 197–207. [Google Scholar] [CrossRef] [PubMed]
- Knight, S.D.; Adams, N.D.; Burgess, J.L.; Chaudhari, A.M.; Darcy, M.G.; Donatelli, C.A.; Luengo, J.I.; Newlander, K.A.; Parrish, C.A.; Ridgers, L.H.; et al. Discovery of GSK2126458, a Highly Potent Inhibitor of PI3K and the Mammalian Target of Rapamycin. ACS Med. Chem. Lett. 2010, 1, 39–43. [Google Scholar] [CrossRef] [PubMed]
- Populo, H.; Lopes, J.M.; Soares, P. The mTOR signalling pathway in human cancer. Int. J. Mol. Sci. 2012, 13, 1886–1918. [Google Scholar] [CrossRef] [PubMed]
- Paquette, M.; El-Houjeiri, L.; Pause, A. mTOR Pathways in Cancer and Autophagy. Cancers 2018, 10, 18. [Google Scholar] [CrossRef]
- Ilagan, E.; Manning, B.D. Emerging role of mTOR in the response to cancer therapeutics. Trends Cancer 2016, 2, 241–251. [Google Scholar] [CrossRef] [PubMed]
- Iyer, G.; Hanrahan, A.J.; Milowsky, M.I.; Al-Ahmadie, H.; Scott, S.N.; Janakiraman, M.; Pirun, M.; Sander, C.; Socci, N.D.; Ostrovnaya, I.; et al. Genome sequencing identifies a basis for everolimus sensitivity. Science 2012, 338, 221. [Google Scholar] [CrossRef] [PubMed]
- Wagle, N.; Grabiner, B.C.; Van Allen, E.M.; Amin-Mansour, A.; Taylor-Weiner, A.; Rosenberg, M.; Gray, N.; Barletta, J.A.; Guo, Y.; Swanson, S.J.; et al. Response and acquired resistance to everolimus in anaplastic thyroid cancer. N. Engl. J. Med. 2014, 371, 1426–1433. [Google Scholar] [CrossRef]
- Grabiner, B.C.; Nardi, V.; Birsoy, K.; Possemato, R.; Shen, K.; Sinha, S.; Jordan, A.; Beck, A.H.; Sabatini, D.M. A diverse array of cancer-associated MTOR mutations are hyperactivating and can predict rapamycin sensitivity. Cancer Discov. 2014, 4, 554–563. [Google Scholar] [CrossRef]
- Wagle, N.; Grabiner, B.C.; Van Allen, E.M.; Hodis, E.; Jacobus, S.; Supko, J.G.; Stewart, M.; Choueiri, T.K.; Gandhi, L.; Cleary, J.M.; et al. Activating mTOR mutations in a patient with an extraordinary response on a phase I trial of everolimus and pazopanib. Cancer Discov. 2014, 4, 546–553. [Google Scholar] [CrossRef]
- Bissler, J.J.; McCormack, F.X.; Young, L.R.; Elwing, J.M.; Chuck, G.; Leonard, J.M.; Schmithorst, V.J.; Laor, T.; Brody, A.S.; Bean, J.; et al. Sirolimus for Angiomyolipoma in Tuberous Sclerosis Complex or Lymphangioleiomyomatosis. N. Engl. J. Med. 2008, 358, 140–151. [Google Scholar] [CrossRef]
- Krueger, D.A.; Care, M.M.; Holland, K.; Agricola, K.; Tudor, C.; Mangeshkar, P.; Wilson, K.A.; Byars, A.; Sahmoud, T.; Franz, D.N. Everolimus for subependymal giant-cell astrocytomas in tuberous sclerosis. N. Engl. J. Med. 2010, 363, 1801–1811. [Google Scholar] [CrossRef] [PubMed]
- Franz, D.N.; Leonard, J.; Tudor, C.; Chuck, G.; Care, M.; Sethuraman, G.; Dinopoulos, A.; Thomas, G.; Crone, K.R. Rapamycin causes regression of astrocytomas in tuberous sclerosis complex. Ann. Neurol. 2006, 59, 490–498. [Google Scholar] [CrossRef]
- Davies, D.M.; de Vries, P.J.; Johnson, S.R.; McCartney, D.L.; Cox, J.A.; Serra, A.L.; Watson, P.C.; Howe, C.J.; Doyle, T.; Pointon, K.; et al. Sirolimus therapy for angiomyolipoma in tuberous sclerosis and sporadic lymphangioleiomyomatosis: A phase 2 trial. Clin. Cancer Res. 2011, 17, 4071–4081. [Google Scholar] [CrossRef] [PubMed]
- Klümpen, H.J.; Queiroz, K.C.; Spek, C.A.; van Noesel, C.J.; Brink, H.C.; de Leng, W.W.; de Wilde, R.F.; Mathus-Vliegen, E.M.; Offerhaus, G.J.A.; Alleman, M.A.; et al. mTOR Inhibitor Treatment of Pancreatic Cancer in a Patient With Peutz-Jeghers Syndrome. J. Clin. Oncol. 2011, 29, e150–e153. [Google Scholar] [CrossRef] [PubMed]
- Wagner, A.J.; Malinowska-Kolodziej, I.; Morgan, J.A.; Qin, W.; Fletcher, C.D.; Vena, N.; Ligon, A.H.; Antonescu, C.R.; Ramaiya, N.H.; Demetri, G.D.; et al. Clinical Activity of mTOR Inhibition With Sirolimus in Malignant Perivascular Epithelioid Cell Tumors: Targeting the Pathogenic Activation of mTORC1 in Tumors. J. Clin. Oncol. 2010, 28, 835–840. [Google Scholar] [CrossRef] [PubMed]
- Meng, L.; Zheng, X.S. Toward rapamycin analog (rapalog)-based precision cancer therapy. Acta Pharmacol. Sin. 2015, 36, 1163–1169. [Google Scholar] [CrossRef] [PubMed]
- Li, J.; Kim, S.G.; Blenis, J. Rapamycin: One Drug, Many Effects. Cell Metab. 2014, 19, 373–379. [Google Scholar] [CrossRef]
- Kelsey, I.; Manning, B.D. mTORC1 status dictates tumor response to targeted therapeutics. Sci. Signal. 2013, 6, pe31. [Google Scholar] [CrossRef]
- White, E.; DiPaola, R.S. The double–edged sword of autophagy modulation in cancer. Clin. Cancer Res. 2009, 15, 5308–5316. [Google Scholar] [CrossRef]
- Sanger, F.; Nicklen, S.; Coulson, A.R. DNA sequencing with chain–terminating inhibitors. Proc. Natl. Acad. Sci. USA 1977, 74, 5463–5467. [Google Scholar] [CrossRef]
- Muzzey, D.; Evans, E.A.; Lieber, C. Understanding the Basics of NGS: From Mechanism to Variant Calling. Curr. Genet. Med. Rep. 2015, 3, 158–165. [Google Scholar] [CrossRef]
- Ku, C.S.; Roukos, D.H. From next–generation sequencing to nanopore sequencing technology: paving the way to personalized genomic medicine. Exp. Rev. Med. Devices 2013, 10, 1–6. [Google Scholar] [CrossRef] [PubMed]
- Lahens, N.F.; Ricciotti, E.; Smirnova, O.; Toorens, E.; Kim, E.J.; Baruzzo, G.; Hayer, K.E.; Ganguly, T.; Schug, J.; Grant, G.R. A comparison of Illumina and Ion Torrent sequencing platforms in the context of differential gene expression. BMC Genom. 2017, 18, 602. [Google Scholar] [CrossRef]
- Kamps, R.; Brandao, R.D.; Bosch, B.J.; Paulussen, A.D.; Xanthoulea, S.; Blok, M.J.; Romano, A. Next–Generation Sequencing in Oncology: Genetic Diagnosis, Risk Prediction and Cancer Classification. Int. J. Mol. Sci. 2017, 18. [Google Scholar] [CrossRef] [PubMed]
- mTOR Pathway. Available online: http://www.addgene.org/cancer/mtor–pathway/#gene–list (accessed on 20 December 2018).
- Del Vecchio, F.; Mastroiaco, V.; Di Marco, A.; Compagnoni, C.; Capece, D.; Zazzeroni, F.; Capalbo, C.; Alesse, E.; Tessitore, A. Next–generation sequencing: Recent applications to the analysis of colorectal cancer. J. Transl. Med. 2017, 15, 246. [Google Scholar] [CrossRef] [PubMed]
- Landolt, L.; Marti, H.P.; Beisland, C.; Flatberg, A.; Eikrem, O.S. RNA extraction for RNA sequencing of archival renal tissues. Scand. J. Clin. Lab. Investig. 2016, 76, 426–434. [Google Scholar] [CrossRef] [PubMed]
- AmpliSeq for Illumina Focus Panel Data Sheet. Available online: https://science–docs.illumina.com/documents/LibraryPrep/ampliseq–focus–panel–data–sheet–770–2017–027/Content/Source/Library–Prep/AmpliSeq/focus–panel/ampliseq–focus–panel–data–sheet.htm (accessed on 20 December 2018).
- Forbes, S.A.; Beare, D.; Boutselakis, H.; Bamford, S.; Bindal, N.; Tate, J.; Cole, C.G.; Ward, S.; Dawson, E.; Ponting, L.; et al. COSMIC: somatic cancer genetics at high–resolution. Nucleic Acids Res 2017, 45, D777–D783. [Google Scholar] [CrossRef]
- COSMIC—Catalogue of Somatic Mutations in Cancer. Available online: https://cancer.sanger.ac.uk/cosmic (accessed on 24 January 2019).
- Hyman, D.M.; Smyth, L.M.; Donoghue, M.T.A.; Westin, S.N.; Bedard, P.L.; Dean, E.J.; Bando, H.; El–Khoueiry, A.B.; Perez–Fidalgo, J.A.; Mita, A.; et al. AKT Inhibition in Solid Tumors with AKT1 Mutations. J. Clin. Oncol. 2017, 35, 2251–2259. [Google Scholar] [CrossRef]
- Comtesse, N.; Keller, A.; Diesinger, I.; Bauer, C.; Kayser, K.; Huwer, H.; Lenhof, H.P.; Meese, E. Frequent overexpression of the genes FXR1, CLAPM1 and EFI4G located on amplicon 3q26-27 in squamous cell carcinoma of the lung. Int. J. Cancer 2007, 120, 2538–2544. [Google Scholar] [CrossRef]
- Cheng, F.; Zhao, J.; Hanker, A.B.; Brewer, M.R.; Arteaga, C.L.; Zhao, Z. Transcriptome- and proteome-oriented identification of dysregulated eIF4G, STAT3 and Hippo pathways altered by PIK3CA H1047R in HER2/ER-positive breast cancer. Breast Cancer Res. Treat. 2016, 160, 457–474. [Google Scholar] [CrossRef]
- Sato, T.; Nakashima, A.; Guo, L.; Coffman, K.; Tamanoi, F. Single amino-acid changes that confer constitutive activation of mTOR are discovered in human cancer. Oncogene 2010, 29, 2746–2752. [Google Scholar] [CrossRef] [PubMed]
- Philpott, C.; Tovell, H.; Frayling, I.M.; Cooper, D.N.; Upadhyaya, M. The NF1 somatic mutational landscape in sporadic human cancers. Hum. Genom. 2017, 11, 13. [Google Scholar] [CrossRef] [PubMed]
- Kiuru, M.; Busam, K.J. The NF1 gene in tumor syndromes and melanoma. Lab. Investig. 2017, 97, 146–157. [Google Scholar] [CrossRef] [PubMed]
- Sawa, K.; Koh, Y.; Kawaguchi, T.; Kambayashi, S.; Asai, K.; Mitsuoka, S.; Kimura, T.; Yoshimura, N.; Yoshimoto, N.; Kubo, A.; et al. PIK3CA mutation as a distinctive genetic feature of non-small cell lung cancer with chronic obstructive pulmonary disease: A comprehensive mutational analysis from a multi-institutional cohort. Lung Cancer 2017, 112, 96–101. [Google Scholar] [CrossRef]
- Mei, Z.B.; Duan, C.Y.; Li, C.B.; Cui, L.; Ogino, S. Prognostic role of tumor PIK3CA mutation in colorectal cancer: A systematic review and meta-analysis. Ann. Oncol. 2016, 27, 1836–1848. [Google Scholar] [CrossRef]
- Dirican, E.; Akkiprik, M.; Ozer, A. Mutation distribution and clinical correlations of PIK3CA gene mutations in breast cancer. Tumour Biol. 2016, 37, 7033–7045. [Google Scholar] [CrossRef]
- Lim, S.M.; Park, H.S.; Kim, S.; Ali, S.M.; Greenbowe, J.R.; Yang, I.S.; Kwon, N.J.; Lee, J.L.; Ryu, M.H.; Ahn, J.H.; et al. Next-generation sequencing reveals somatic mutations that conver exceptional response to everolimus. Oncotarget 2016, 7, 10547–10556. [Google Scholar] [CrossRef] [PubMed]
- Liu, P.; Morrison, C.; Wang, L.; Xiong, D.; Vedell, P.; Cui, P.; Hua, X.; Ding, F.; Lu, Y.; James, M.; et al. Identification of somatic mutations in non-small cell lung carcinomas using whole-exome sequencing. Carcinogenesis 2012, 33, 1270–1276. [Google Scholar] [CrossRef]
- Cheung, L.W.; Mills, G.B. Targeting therapeutic liabilities engendered by PIK3R1 mutations for cancer treatment. Pharmacogenomics 2016, 17, 297–307. [Google Scholar] [PubMed]
- Isakov, N. Protein Kinase C (PKC) isoforms in cancer, tumor promotion and tumor suppression. Semin. Cancer Biol. 2018, 48, 36–52. [Google Scholar] [CrossRef] [PubMed]
- Smith, I.N.; Briggs, J.M. Structural mutation analysis of PTEN and its genotype-phenotype correlations in endometriosis and cancer. Proteins 2016, 84, 1625–1643. [Google Scholar] [PubMed]
- Malaney, P.; Uversky, V.N.; Dave, V. PTEN proteoforms in biology and disease. Cell. Mol. Life Sci. 2017, 74, 2783–2794. [Google Scholar] [CrossRef] [PubMed]
- Javle, M.; Rashid, A.; Churi, C.; Kar, S.; Zuo, M.; Eterovic, A.K.; Nogueras–Gonzalez, G.M.; Janku, F.; Shroff, R.T.; Aloia, T.A.; et al. Molecular characterization of gallbladder cancer using somatic mutation profiling. Hum. Pathol. 2014, 45, 701–708. [Google Scholar] [CrossRef] [PubMed]
- Kamp, W.M.; Wang, P.Y.; Hwang, P.M. TP53 mutation, mitochondria and cancer. Curr. Opin. Genet. Dev. 2016, 38, 16–22. [Google Scholar] [CrossRef] [PubMed]
- Te Raa, G.D.; Kater, A.P. TP53 dysfunction in CLL: Implications for prognosis and treatment. Best Pract. Res. Clin. Haematol. 2016, 29, 90–99. [Google Scholar] [CrossRef] [PubMed]
- Ho, D.W.H.; Chan, L.K.; Chiu, Y.T.; Xu, I.M.J.; Poon, R.T.P.; Cheung, T.T.; Tang, C.N.; Tang, V.W.L.; Lo, I.L.O.; Lam, P.W.Y.; et al. TSC1/2 mutations define a molecular subset of HCC with aggressive behaviour and treatment implication. Gut 2017, 66, 1496–1506. [Google Scholar] [CrossRef] [PubMed]
- Ma, M.; Dai, J.; Xu, T.; Yu, S.; Yu, H.; Tang, H.; Yan, J.; Wu, X.; Yu, J.; Chi, Z.; et al. Analysis of TSC1 mutation spectrum in mucosal melanoma. J. Cancer Res. Clin. Oncol. 2018, 144, 257–267. [Google Scholar] [CrossRef]
- Martin, K.R.; Zhou, W.; Bowman, M.J.; Shih, J.; Au, K.S.; Dittenhafer-Reed, K.E.; Sisson, K.A.; Koeman, J.; Weisenberger, D.J.; Cottingham, S.L.; et al. The genomic landscape of tuberous sclerosis complex. Nat. Commun. 2017, 8, 15816. [Google Scholar] [CrossRef]
- Kim, W.Y.; Kaelin, W.G. Role of VHL gene mutation in human cancer. J. Clin. Oncol. 2004, 22, 4991–5004. [Google Scholar] [CrossRef]
- Xu, J.; Pham, C.G.; Albanese, S.K.; Dong, Y.; Oyama, T.; Lee, C.H.; Rodrik–Outmezguine, V.; Yao, Z.; Han, S.; Chen, D.; et al. Mechanistically distinct cancer-associated mTOR activation clusters predict sensitivity to rapamycin. J. Clin. Investig. 2016, 126, 3526–3540. [Google Scholar] [CrossRef]
- Golob–Schwarzl, N.; Schweiger, C.; Koller, C.; Krassnig, S.; Gogg–Kamerer, M.; Gantenbein, N.; Toeglhofer, A.M.; Wodlej, C.; Bergler, H.; Pertschy, B.; et al. Separation of low and high grade colon and rectum carcinoma by eukaryotic translation initiation factors 1, 5 and 6. Oncotarget 2017, 8, 101224–101243. [Google Scholar] [CrossRef] [PubMed]
- Spilka, R.; Laimer, K.; Bachmann, F.; Spizzo, G.; Vogetseder, A.; Wieser, M.; Muller, H.; Haybaeck, J.; Obrist, P. Overexpression of eIF3a in Squamous Cell Carcinoma of the Oral Cavity and Its Putative Relation to Chemotherapy Response. J. Oncol. 2012, 2012, 901956. [Google Scholar] [CrossRef] [PubMed]
- Spilka, R.; Ernst, C.; Bergler, H.; Rainer, J.; Flechsig, S.; Vogetseder, A.; Lederer, E.; Benesch, M.; Brunner, A.; Geley, S.; et al. eIF3a is over–expressed in urinary bladder cancer and influences its phenotype independent of translation initiation. Cell. Oncol. (Dordrecht) 2014, 37, 253–267. [Google Scholar] [CrossRef] [PubMed]
Figure 1.
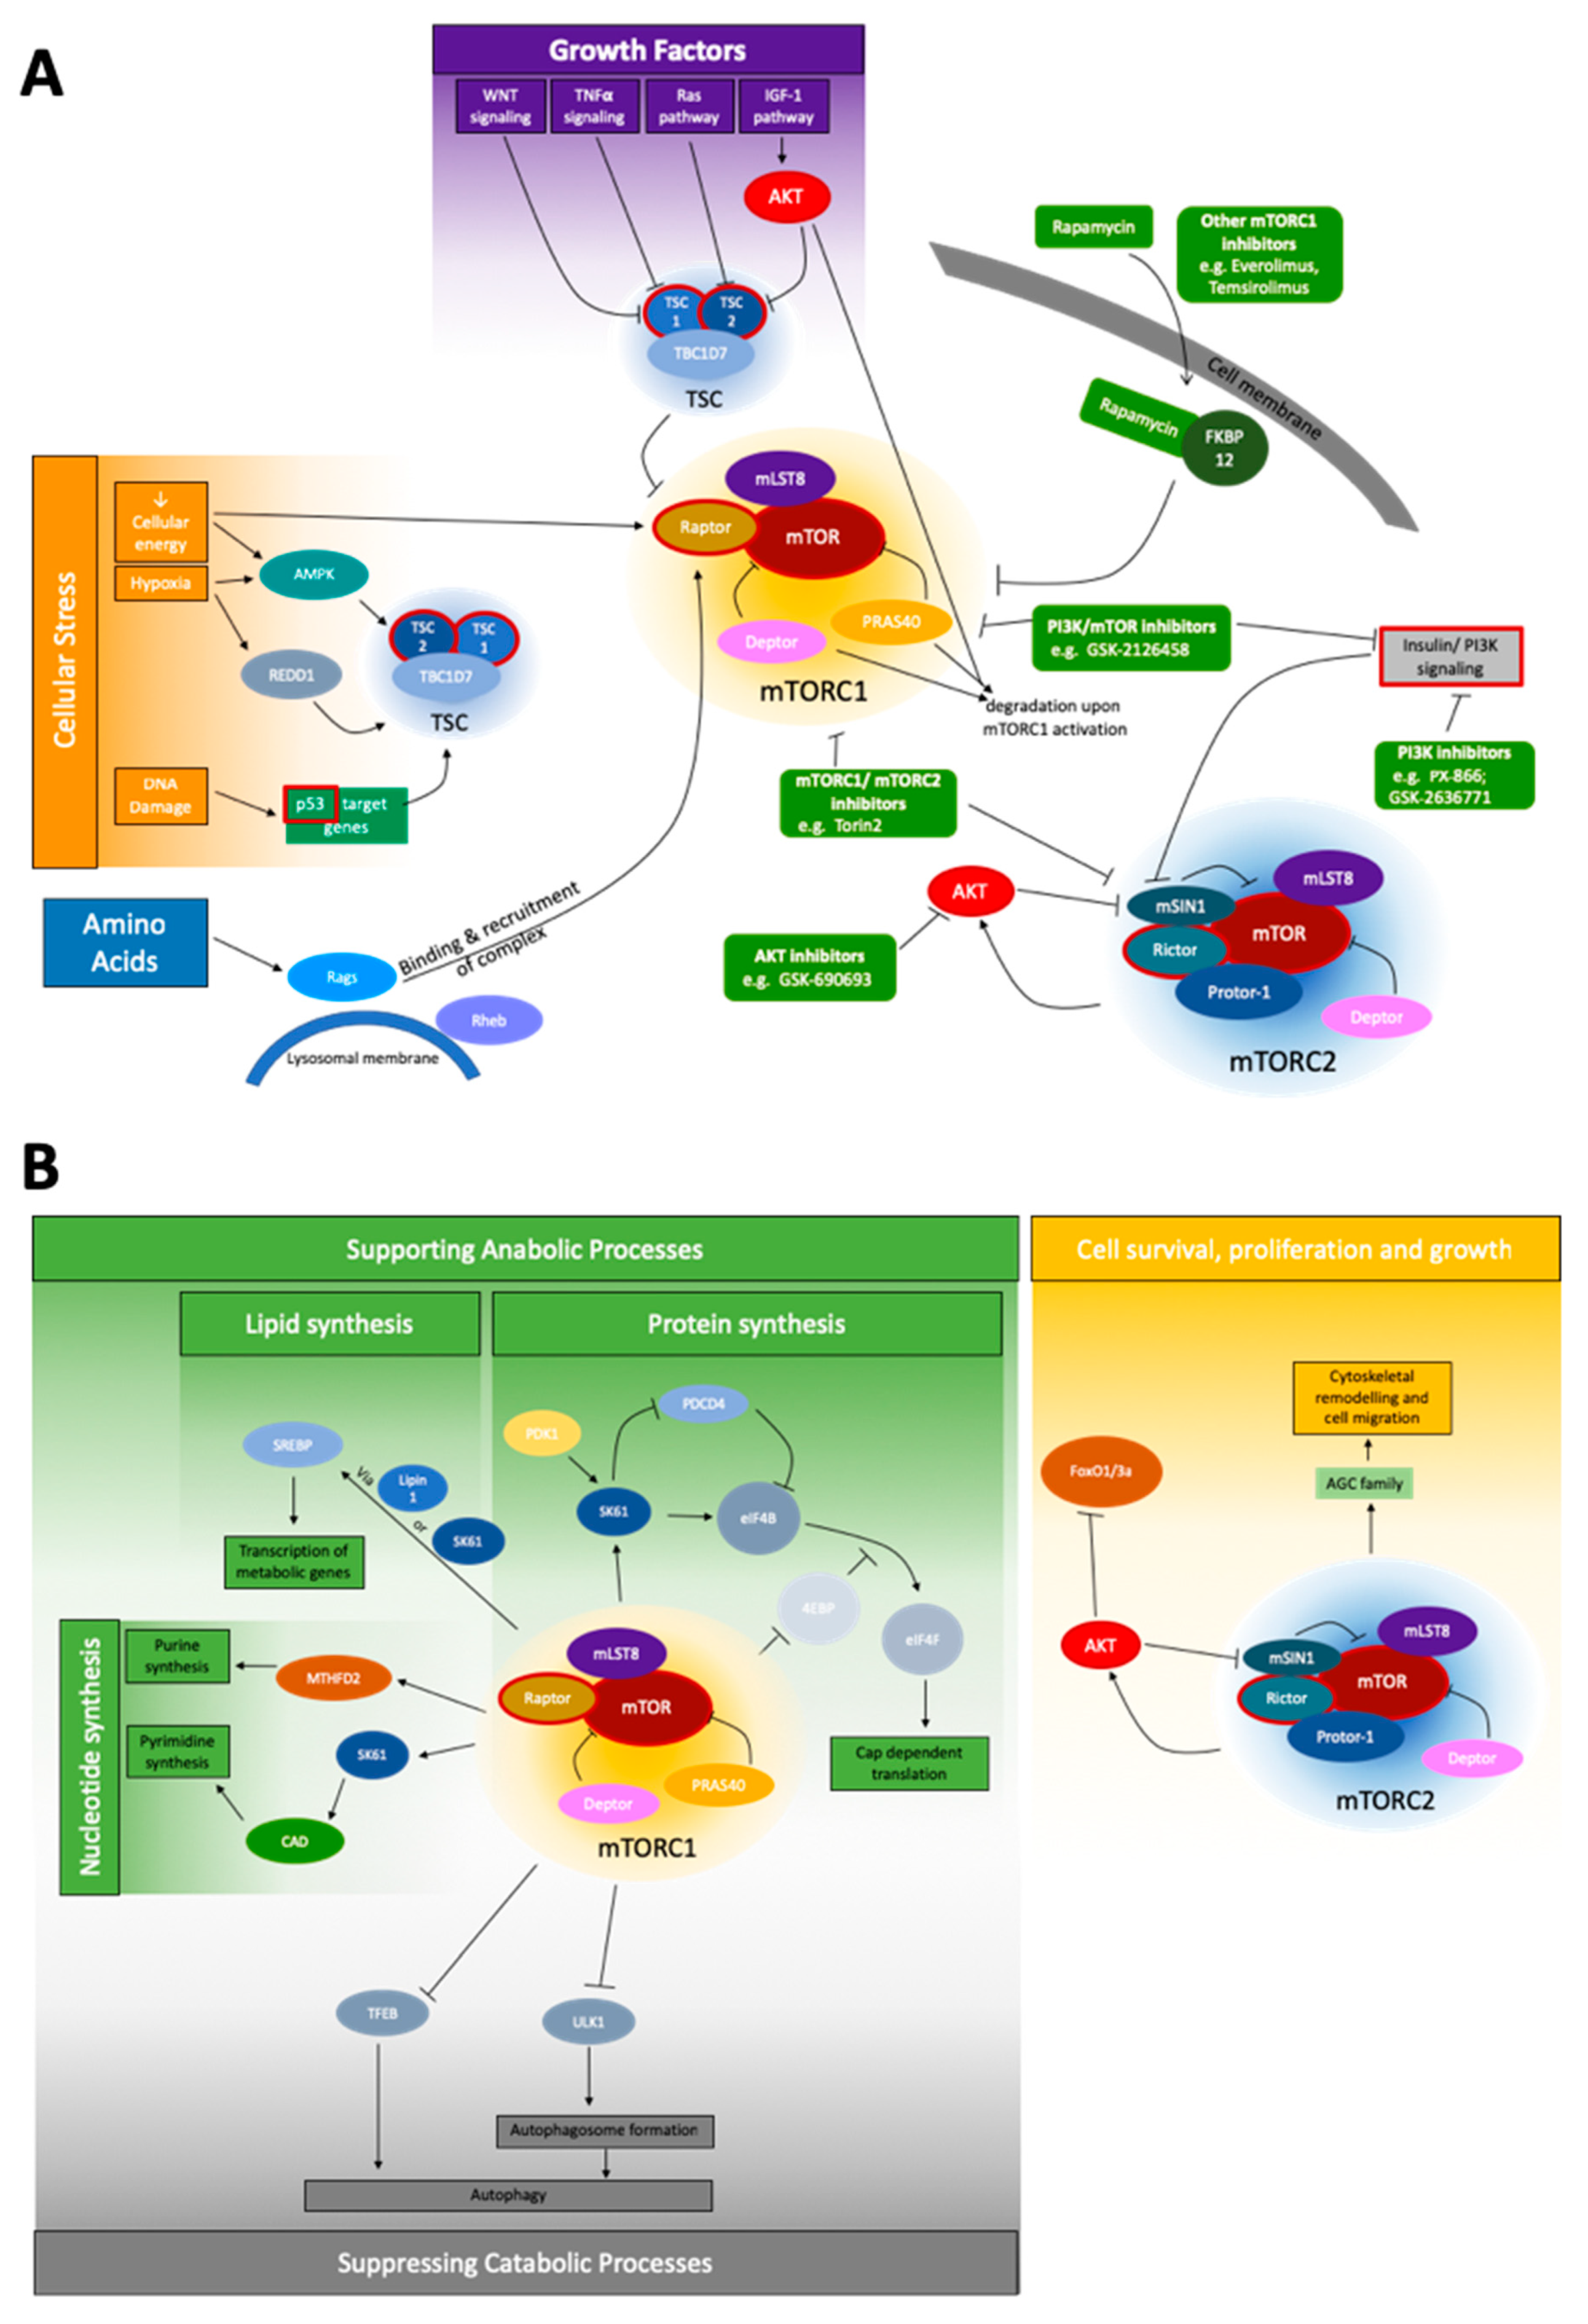
Schematic depiction of the mTOR signaling network. (A) The most important upstream signals of mTOR signaling are cellular stress, growth factors, and amino acids for the mTORC1 complex, and the insulin/PI3K pathway for mTORC2. Genes of special interest for NGS, due to their mutation frequency, are shown with a red border. No prominent pattern of a section specifically affected by these mutations is obvious. To the best of our best knowledge, no companion diagnostic between a specific mutation and treatment is currently applicable. However, a variety of inhibitors (green) affecting the network at different points are known: Inhibitors affecting AKT, mTORC1/mTORC2, PI3K, PI3K/mTOR, and mTORC1 inhibitors like rapamycin and rapalogs [51,52]; and (B) the widespread downstream network of mTORC1 and mTORC2 is shown. mTORC1 is involved both in supporting anabolic processes via influencing nucleotide, lipid and protein synthesis, as well as suppressing catabolic processes, mainly autophagy. mTORC2, under the coregulation of AKT, is known to mainly affect cell survival, proliferation and growth, and the specifically the regulation of the cytoskeleton.
Figure 1.
Schematic depiction of the mTOR signaling network. (A) The most important upstream signals of mTOR signaling are cellular stress, growth factors, and amino acids for the mTORC1 complex, and the insulin/PI3K pathway for mTORC2. Genes of special interest for NGS, due to their mutation frequency, are shown with a red border. No prominent pattern of a section specifically affected by these mutations is obvious. To the best of our best knowledge, no companion diagnostic between a specific mutation and treatment is currently applicable. However, a variety of inhibitors (green) affecting the network at different points are known: Inhibitors affecting AKT, mTORC1/mTORC2, PI3K, PI3K/mTOR, and mTORC1 inhibitors like rapamycin and rapalogs [51,52]; and (B) the widespread downstream network of mTORC1 and mTORC2 is shown. mTORC1 is involved both in supporting anabolic processes via influencing nucleotide, lipid and protein synthesis, as well as suppressing catabolic processes, mainly autophagy. mTORC2, under the coregulation of AKT, is known to mainly affect cell survival, proliferation and growth, and the specifically the regulation of the cytoskeleton.


Table 1.
mTOR pathway-associated proteins, divided into mTOR complex components and upstream/downstream modules. Where applicable, protein activity is denoted as anabolic or catabolic.
Table 1.
mTOR pathway-associated proteins, divided into mTOR complex components and upstream/downstream modules. Where applicable, protein activity is denoted as anabolic or catabolic.
| Abbreviation | Full Name | Function | ↑↓ |
|---|---|---|---|
| mTORC 1 | Stimulating/Inhibiting Signal | ||
| mTOR | mechanistic target of rapamycin | Serine-threonine kinase | - |
| Raptor | regulatory-associated protein of mTOR | Localization of mTOR, substrate recruitment to mTOR [1,3,4] | ↑ |
| mLST8 | mammalian lethal with Sec13 protein 8 | Stabilizing kinase loop [5]; not essential to TORC1 function [6] | - |
| PRAS40 | proline rich AKT substrate 40 kDa | Inhibitory [7]; inhibits substrate binding, phosphorylated by active mTORC1 [9] | ↓ |
| Deptor | DEP-domain-containing mTOR-interacting protein | Inhibitory [8], phosphorylated by active mTORC1 | ↓ |
| mTORC 2 | Stimulating/Inhibiting Signal | ||
| mTOR | mechanistic target of rapamycin | serine-threonine kinase of the phosphoinositide 3-kinase (PI3K)-related family | |
| mLST8 | mammalian lethal with Sec13 protein 8 | Essential for stability and function of mTORC2 [6] | ↑ |
| Deptor | DEP-domain-containing mTOR-interacting protein | Inhibitory [8] | ↓ |
| Rictor | rapamycin-insensitive companion of mTOR | Stabilization [10,11]; shown to interact with Protor-1 [12,13] | ↑ |
| mSIN1 | mammalian stress-activated protein kinase interacting protein | Stabilization [10,11], phosphoinositide-binding PH domain: critical for insulin dependent mTORC2 function, inhibits mTORC2 function in absence of insulin [1] | ↑/↓ |
| Protor-1 | protein observed with Rictor-1 | shown to interact with Rictor [12,13] | |
| mTORC 1 Upstream | Stimulating/Inhibiting Signal | ||
| - | rapamycin | Enters cell and binds FKBP12 [2]; when bound inhibits mTORC 1, but not all functions [15] | ↓ |
| FKBP12 | FK506-binding protein 12 kDa | Is bound by rapamycin, interacts with FBD on mTOR [2]; when bound inhibits mTORC 1, but not all functions [15]; cannot acutely inhibit mTORC2 [2] | - |
| TSC | tuberous sclerosis complex | Consists of TC1, TC2, TBC1D7, negatively regulates mTORC1 via inactivation of Rheb [17], phosphorylated by AKT (mTORC2 independent) [6] | ↓ |
| Rheb | Ras homolog enriched in brain | Stimulates mTOCR1 activity when active [7,16,18] | ↑ |
| IGF-1 pathway | insulin/insulin like growth factor 1 pathway | Causes AKT dependent phosphorylation of TSC2 [1,19] | ↑ |
| Ras pathway | Rat Sarcoma Pathway | Causes TSC2 phosphorylation via ERK and p90rsk [1,16,20] | ↑ |
| AKT | AKT serine/threonine kinase | Phosphorylates TSC2 [1,19]; key effector protein of the insulin/PI3K signaling pathway, and can be activated by mTORC2 [45]; promotes dissociation of PRAS40 from mTORC1. [7,9,21] | ↑ |
| - | Wnt | Inhibits TSC1 [22] | ↑ |
| TNFα | tumor necrosis factor α | Inhibits TSC1 [23] | ↑ |
| AMPK | 5’-AMP-activated protein kinase | Inhibits mTORC1 (in response to reduced cellular energy or hypoxia) by phosphorylating Raptor and activation of TSC2 [1,22,24]; activator of autophagy, activates ULK1 [44] | ↓ |
| REDD1 | regulated in development and DNA damage responses 1 | Activates TSC in response to hypoxia [24] | ↓ |
| - | p53 target genes | Increase TSC activity upon DNA damage [25] | ↓ |
| mTORC 2 Upstream | Stimulating/Inhibiting Signal | ||
| Rapamycin | Enters cell and binds FKBP12 [2]; | ↓ | |
| FKBP12 | FKBP prolyl isomerase | Is bound by rapamycin, interacts with FBD on mTOR cannot acutely inhibit mTORC2 [2]; chronic treatment can inhibit mTORC2 [14] | - |
| PIP3 | Phosphatidylinositol (3,4,5)-trisphosphate | PI3K generated PIP3 binds to PH domain o mSIN1 and relieves inhibition of mTORC2 [29] | ↑ |
| AKT | AKT serine/threonine kinase | Phosphorylates mSIN1, positive feedback loop [30] | ↑ |
| mTORC1 | mammalian target of rapamycin complex 1 | Negative feedback loop between mTORC1 and insulin/PI3K signaling [1,31] | ↓ |
| mTORC1 downstream | Stimulating/Inhibiting Signal | ||
| SREBP | sterol responsive element binding protein | Activated by low sterol levels, in control of expression of metabolic genes, can be activated by mTORC1 independently via S6K1 or Lipin1 [1,32]; expression by mTORC1 increases PPP [1] | ↑ |
| S6K1 | p70S6 Kinase 1 | Can activate SREBP [33,34], when phosphorylated by mTORC1 can be activated by PDK1, promotes mRNA translation intitation [35]; promotes degradation of PDCD4 [36]; phosphorylates CAD (catalyzes first steps in de-novo pyrimidine synthesis) [42] | ↑ |
| - | Lipin1 | Inhibits SREBP in absence of mTORC1, activates when mTORC1 is present [33,34] | ↑ |
| 4EBP | eukaryotic initiation factor 4E binding protein | Inhibits translation by binding eIF4E → prevents assembly of eIF4F complex; when phosphorylated by mTORC1 → dissociates from eIF4e → allows assembly [37,38,39] | ↑ |
| eIF4B | eukaryotic translation initiation factor 4B | Positive regulator of the 5’-cap binding eIF4F complex, activated by S6K1 [35], inhibitor: PDCD4 [36] | ↑ |
| eIF4F complex | eukaryotic translation initiation factor 4F | Positively regulated by eIF4B, 5’-cap binding complex, | ↑ |
| MTHFD2 | methylenetetrahydrofolate dehydrogenase | Controls the mitochondrial tetrahydrofolate cycle, expression increased bymTORC1 induction of purine synthesis [41] | ↑ |
| HIF1α | hypoxia inducible factor 1 | Translation increased by mTORC1 → expression of glycolytic enzymes [33] | ↑ |
| TFEB | Transcription factor EB | expression of genes for autophagy and lysosomal biogenesis, when phosphorylated by mTORC1 →cannot translocate to nucleus [43] | ↓ |
| ULK1 | unc-51 like autophagy activating kinase 1 | Drives autophagosome formation, when phosphorylated by mTORC1 → no interaction with AMPK → no activation [44] | ↓ |
| AMPK | AMP-activated protein kinase | Inhibits mTORC1 (in response to reduced cellular energy or hypoxia) by phosphorylating Raptor and activation of TSC2 [1,22]; activator of autophagy, activates ULK1 [44] | ↓ |
| mTORC2 downstream | Stimulating/Inhibiting Signal | ||
| AKT | AKT serine/threonine kinase | Phosphorylated by mTORC2 [1]; phosphorylates TSC2; key effector protein of the insulin/PI3K signaling pathway [45]; activation by mTORC2 not crucial for the phosphorylation of all, but some of its substrates [6,11] | - |
| FoxO1/3a | Forkhead box protein O1 | TFs, phosphorylated by AKT (mTORC2 dependent) [11] | - |
| GSK3ß | Glycogen synthase kinase 3β | Metabolic regulator, phosphorylated by AKT [6] | - |
| - | AGC (PKA/PKB/PKC) Family | Several members phosphorylated by mTORC2 for regulation of proliferation, survival and cytoskeleton [1,46,47,48,49] | - |
Table 2.
Oncologically relevant, predesigned NGS gene panels, with number of genes covered and the names of covered genes relevant to mTOR signaling.
Table 2.
Oncologically relevant, predesigned NGS gene panels, with number of genes covered and the names of covered genes relevant to mTOR signaling.
| Panel Name | Number of Genes Covered | mTOR Relevant Genes Covered |
|---|---|---|
| Foundation One | 305 | AKT1/2/3; CCND1; GSK3B; MDM2; MTOR; NF1; PDK1; PIK3C2; PIK3CA/B; PIK3R1; PTEN; RICTOR, RPTOR; SGK1; TNFAIP3; TP53; TSC1/2; VHL |
| Agilent ClearSeq Comprehensive Cancer Panel | 150 | AKT1/2/3; NF1; MTOR; PIK3R1; PIK3CA; PTEN; TP53; VHL |
| Qiagen Human Cancer Predisposition GeneRead DNAseq Targeted Panel V2 | 143 | AKT1; NF1; PIK3CA; PTEN; TP53; TSC1/2; VHL |
| Integrated DNA Technologies (IDT) xGen Pan-Cancer Panel | 127 | AKT1; CCND1; EIF4A2; MTOR; NF1; PIK3CA; PIK3CG; PIK3R1; PTEN; TP53; VHL |
| Archer VariantPlex Solid Tumor | 67 | AKT1; CCND1; MDM2; PIK3CA; PIK3R1; PTEN; TP53; VHL |
| Swift Biosciences Accel-Amplicon 56G Oncology Panel v2 | 56 | AKT1; PIK3CA; PTEN; TP53; TSC1; VHL |
| NEBNExt Direct Cancer HotSpot Panel | 50 | AKT1; PIK3CA; PTEN; TP53; VHL |
| AmpliSeq Cancer Hotspot Panel v2 | 49 | AKT1; PIK3CA; PTEN; TP53; VHL |
| TruSeq Amplicon Cancer Panel | 48 | AKT1; PIK3CA; PTEN; TP53; VHL |
| AmpliSeq for Illumina Focus Panel | 40 | AKT1; CCND1; MTOR; PIK3CA |
| Archer VariantPlex Comprehensive Thyroid and Lung Kit | 31 | AKT1; CCND1; MDM2; PIK3CA; PTEN; TP53 |
| TruSight Tumor 26 | 26 | AKT1; PIK3CA; PTEN; TP53 |
| Agilent SureMASTR Tumor Hotspot | 25 | AKT; PIK3CA; PTEN |
| Qiagen Human Clinically Relevant Tumor GeneRead DNAseq Targeted Panel V2 | 24 | AKT1; PIK3CA; PTEN; TP53 |
| Asuragen QuantideX NGS DNA Hotspot 21 Kit | 21 | AKT1/2; PIK3CA |
| TruSight Tumor 15 | 15 | AKT1; PIK3CA; TP53 |
| Qiagen Human Tumor Actionable Mutations GeneRead DNAseq Targeted Panel v2 | 8 | - |
Table 3.
COSMIC data for mTOR pathway-associated genes. The mutational frequencies are highlighted in grey, if >1%. If a gene mutation alters the sensitivity to drug treatment, the gene name is written in bold letters.
Table 3.
COSMIC data for mTOR pathway-associated genes. The mutational frequencies are highlighted in grey, if >1%. If a gene mutation alters the sensitivity to drug treatment, the gene name is written in bold letters.
| Gene | Frequency of Mutation in Cancer |
|---|---|
| 4E-BP | <0.1% |
| AKT1 | 1.1% |
| AKT2 | 0.4% |
| AKT3 | 0.5% |
| CCND1 | 0.3% |
| Deptor | 0.3% |
| eIF3a | 0.8% |
| eIF3b | 0.4% |
| eIF3c | <0.1% |
| eIF3d | 0.3% |
| eIF3e | 0.3% |
| eIF3f | 0.2% |
| eIF3g | 0.2% |
| eIF3h | 0.2% |
| eIF3i | 0.2% |
| eIF3j | 0.1% |
| eIF3k | 0.1% |
| eIF3l | 0.3% |
| eIF3m | 0.2% |
| eIF4a | 0.3% |
| eIF4b | 0.3% |
| eIF4E | 0.2% |
| eIF4g | 1.0% |
| eIF4h | 0.2% |
| FOXO | 0.4% |
| GBL/mLST8 | 0.2% |
| GSK3A | 0.2% |
| GSK3B | 0.4% |
| HIF1α | 0.5% |
| LKB1 | 0.5% |
| MDM2 | 0.4% |
| mSin1 = MAPKAP1 | 0.2% |
| MTHFD2 | 0.1% |
| mTOR | 2.1% |
| NF1 | 3.8% |
| PDK1 | 0.2% |
| PIK3CA | 9.7% |
| PIK3CB | 0.7% |
| PIK3CD | 0.7% |
| PIK3CG | 1.6% |
| PIK3R1 | 1.4% |
| PIK3R2 | 0.5% |
| PIK3R3 | 0.3% |
| PIK3R4 | 0.7% |
| PIK3R5 | 0.7% |
| PIK3R6 | 0.6% |
| PIP3 | 0.4% |
| PKC alpha | 0.4% |
| PKC beta | 1.0% |
| PKC delta | 0.4% |
| PKC epsilon | 0.5% |
| PKC eta | 0.5% |
| PKC gamma | 0.7% |
| PKC iota | 0.4% |
| PKC theta | 0.7% |
| PKC zeta | 0.4% |
| PRAS40 = AKT1S1 | 0.2% |
| Protor = PRR5 | 0.3% |
| PTEN | 5.0% |
| Raptor | 1.0% |
| REDD1 = DDIT4 | 0.1% |
| Rheb | 0.1% |
| Rictor | 1.0% |
| RRAGA | 0.1% |
| RRAGB | 0.2% |
| RRAGC | 0.2% |
| RRAGD | 0.2% |
| S6K | 0.2% |
| SGK | 0.4% |
| SREBP | 0.5% |
| TFEB | 0.3% |
| TNFα | 0.3% |
| TP53 | 25.2% |
| TSC1 | 1.2% |
| TSC2 | 1.7% |
| ULK1 | 0.7% |
| VHL | 4.5% |
| Wnt | 0.3% |
Table 4.
Summary of most frequently mutated mTOR related genes and affected tissues. The mutational frequencies are highlighted in grey, if >1%.
Table 4.
Summary of most frequently mutated mTOR related genes and affected tissues. The mutational frequencies are highlighted in grey, if >1%.
| Gene | Frequency of Mutation in Cancer | Most Common Genetic Mutations | Tissue | Reference |
|---|---|---|---|---|
| AKT1 | 1.1% | E17K, Q79K, L52R | breast, skin, urinary tract | [80,81] |
| eIF4g | 1.0% | T436fs * 86; K643R | colon, lung (overexpression w/o genetic mutation) | [80,82,83] |
| mTOR | 2.1% | S2215Y, S2215F, E1799K, T1977K, L1460P | colon, endometrium, skin, kidney | [80,84] |
| NF1 | 3.8% | R2450 *, R440 *, R1534 * | skin, soft tissue, urinary tract, lung, colon | [80,85,86] |
| PIK3CA | 9.7% | H1047R, E545K, E542K, H1047L, Q546K, R88Q, N345K, C420L | breast, endometrium, urinary tract, colon | [80,87,88,89] |
| PIK3CG | 1.6% | V759I, V165I, R472C, E267K, A84V | skin, colon, lung | [80,90,91] |
| PIK3R1 | 1.4% | N564D, R348 *, K567E, G376R | breast, endometrium, prostate, leukemia | [80,92] |
| PKC beta | 1.0% | D427N, D630N, E533K | lung, skin, colon | [80,93] |
| PTEN | 5.0% | R130G, R130Q, R233 *, R130 * | breast, endometrium, prostate, leukemia | [80,94,95] |
| Raptor | 1.0% | R718C, R139H, Q1264fs * 4, T1121M | various | [80] |
| Rictor | 1.0% | S1101L, R401C | lung, breast | [80,96] |
| TP53 | 25.2% | R175H, R248Q, R273H, R282W, R213 *, G245S, R249S, Y220C, R196 *, R342 * | solid cancer, leukemia, lymphoma, melanoma | [80,97,98] |
| TSC1 | 1.2% | M322T, P1143L | skin, urinary tract, liver | [80,99,100,101] |
| TSC2 | 1.7% | F690fs * 8, R1417fs * 59, S1364fs * 50, K1638 * | liver, breast | [80,101] |
| VHL | 4.5% | kidney, neuroendocrine tumors | R161 *, L89H, S65 * | [80,102,103] |
© 2019 by the authors. Licensee MDPI, Basel, Switzerland. This article is an open access article distributed under the terms and conditions of the Creative Commons Attribution (CC BY) license (http://creativecommons.org/licenses/by/4.0/).
Share and Cite
MDPI and ACS Style
Seeboeck, R.; Sarne, V.; Haybaeck, J. Current Coverage of the mTOR Pathway by Next-Generation Sequencing Oncology Panels. Int. J. Mol. Sci. 2019, 20, 690. https://0-doi-org.brum.beds.ac.uk/10.3390/ijms20030690
AMA Style
Seeboeck R, Sarne V, Haybaeck J. Current Coverage of the mTOR Pathway by Next-Generation Sequencing Oncology Panels. International Journal of Molecular Sciences. 2019; 20(3):690. https://0-doi-org.brum.beds.ac.uk/10.3390/ijms20030690
Chicago/Turabian StyleSeeboeck, Rita, Victoria Sarne, and Johannes Haybaeck. 2019. "Current Coverage of the mTOR Pathway by Next-Generation Sequencing Oncology Panels" International Journal of Molecular Sciences 20, no. 3: 690. https://0-doi-org.brum.beds.ac.uk/10.3390/ijms20030690
Note that from the first issue of 2016, this journal uses article numbers instead of page numbers. See further details here.