Dissecting Intra-Tumor Heterogeneity by the Analysis of Copy Number Variations in Single Cells: The Neuroblastoma Case Study

 , and
, and
Abstract
:1. Introduction
2. Results
3. Discussion
4. Materials and Methods
4.1. Cell Lines
4.2. Isolation of Intact Single Cells by DEPArrayTM
2.3. Whole Genome Amplification
4.4. Next Generation Sequencing
4.5. Data Analysis
5. Conclusions
Author Contributions
Funding
Acknowledgments
Conflicts of Interest
Abbreviations
| IMR-32 | Neuroblastoma cell line |
| SK-N-BE(2)-C | Neuroblastoma cell line |
| CNVs | Copy Number Variants |
| GD2 | Disialoganglioside |
| DEPArray | DiElectrophoresis Array |
| WGA | Whole Genome Amplification |
| NB | Neuroblastoma |
| NCCs | Neural Crest Cells |
| ALK | Anaplastic Lymphoma Kinase |
| SNP | Single-Nucleotide Polymorphisms |
| GWAS | Genome-Wide Association Study |
| FOXPI | Fork Head Box P1 |
| TP53 | Tumor Protein 53 |
| AKT or PKB | Protein Kinase B |
| NGS | Next-Generation Sequencing |
| BSA | Bovine Serum Albumin |
| NTC | No Template Control |
| EDTA | EthyleneDiamineTetraacetic Acid |
| DAPI | 4′,6-Diamidino-2-Phenylindole |
| APC | AlloPhycoCyanin |
| RB | Running Buffer |
References
- Shlush, L.I.; Hershkovitz, D. Clonal Evolution Models of Tumor Heterogeneity. Am. Soc. Clin. Oncol. Educ. B 2015, 35, 662–665. [Google Scholar] [CrossRef] [PubMed]
- De Luca, F.; Rotunno, G.; Salvianti, F.; Galardi, F.; Pestrin, M.; Gabellini, S.; Simi, L.; Mancini, I.; Vannucchi, A.M.; Pazzagli, M.; et al. Mutational analysis of single circulating tumor cells by next generation sequencing in metastatic breast cancer. Oncotarget 2016, 7, 26107–26119. [Google Scholar] [CrossRef] [PubMed] [Green Version]
- Boeva, V.; Louis-Brennetot, C.; Peltier, A.; Durand, S.; Pierre-Eugène, C.; Raynal, V.; Etchevers, H.C.; Thomas, S.; Lermine, A.; Daudigeos-Dubus, E.; et al. Heterogeneity of Neuroblastoma cell identity defined by transcriptional circuitries. Nat. Genet. 2017, 49, 1408–1413. [Google Scholar] [CrossRef] [PubMed]
- Tomolonis, J.A.; Agarwal, S.; Shohet, J.M. Neuroblastoma pathogenesis: Deregulation of embryonic neural crest development. Cell Tissue Res. 2018, 372, 245–262. [Google Scholar] [CrossRef] [PubMed]
- Matthay, K.K.; Maris, J.M.; Schleiermacher, G.; Nakagawara, A.; Mackall, C.L.; Diller, L.; Weiss, W.A. Neuroblastoma. Nat. Rev. Dis. Primers 2016, 16078. [Google Scholar] [CrossRef] [PubMed]
- Heck, J.E.; Ritz, B.; Hung, R.J.; Hashibe, M.; Boffetta, P. The epidemiology of Neuroblastoma: A review. Paediatr. Perinat. Epidemiol. 2009, 23, 125–143. [Google Scholar] [CrossRef]
- Tonini, G.P. Growth, progression and chromosome instability of Neuroblastoma: A new scenario of tumorigenesis? BMC Cancer 2017, 17, 20. [Google Scholar] [CrossRef]
- Sridhar, S.; Al-Moallem, B.; Kamal, H.; Terrile, M.; Stallings, R.L. New insights into the genetics of Neuroblastoma: Implications for diagnosis and therapy. Mol. Diagn. Ther. 2013, 17, 63–69. [Google Scholar] [CrossRef]
- Campbell, K.; Gastier-Foster, J.M.; Mann, M.; Naranjo, A.H.; Van Ryn, C.; Bagatell, R.; Matthay, K.K.; London, W.B.; Irwin, M.S.; Shimada, H.; et al. Association of MYCN copy number with clinical features, tumor biology, and outcomes in Neuroblastoma: A report from the Children’s Oncology Group. Cancer 2017, 123, 4224–4235. [Google Scholar] [CrossRef]
- Sime, W.; Niu, Q.; Abassi, Y.; Masoumi, K.C.; Zarrizi, R.; Køhler, J.B.; Kjellström, S.; Lasorsa, V.A.; Capasso, M.; Fu, H.; et al. BAP1 induces cell death via interaction with 14-3-3 in Neuroblastoma article. Cell Death Dis. 2018, 9, 458. [Google Scholar] [CrossRef] [PubMed]
- Miyamoto, D.T.; Ting, D.T.; Toner, M.; Maheswaran, S.; Haber, D.A. Single-cell analysis of circulating tumor cells as a window into tumor heterogeneity. Cold Spring Harb. Symp. Quant. Biol. 2016, 81, 269–274. [Google Scholar] [CrossRef] [PubMed]
- Tolbert, V.P.; Coggins, G.E.; Maris, J.M. Genetic susceptibility to Neuroblastoma. Curr. Opin. Genet. Dev. 2017, 42, 81–90. [Google Scholar] [CrossRef] [PubMed]
- Maris, J.M.; Mosse, Y.P.; Bradfield, J.P.; Hou, C.; Monni, S.; Scott, R.H.; Asgharzadeh, S.; Attiyeh, E.F.; Diskin, S.J.; Laudenslager, M.; et al. Chromosome 6p22 Locus Associated with Clinically Aggressive Neuroblastoma. N. Engl. J. Med. 2008, 358, 2585–2593. [Google Scholar] [CrossRef] [PubMed] [Green Version]
- Russell, M.R.; Penikis, A.; Oldridge, D.A.; Alvarez-Dominguez, J.R.; McDaniel, L.; Diamond, M.; Padovan, O.; Raman, P.; Li, Y.; Wei, J.S.; et al. CASC15-S is a tumor suppressor lncRNA at the 6p22 Neuroblastoma susceptibility locus. Cancer Res. 2015, 75, 3155–3166. [Google Scholar] [CrossRef] [PubMed]
- Pandey, G.K.; Mitra, S.; Subhash, S.; Hertwig, F.; Kanduri, M.; Mishra, K.; Fransson, S.; Ganeshram, A.; Mondal, T.; Bandaru, S.; et al. The Risk-Associated Long Noncoding RNA NBAT-1 Controls Neuroblastoma Progression by Regulating Cell Proliferation and Neuronal Differentiation. Cancer Cell 2014, 26, 722–737. [Google Scholar] [CrossRef] [PubMed] [Green Version]
- Hattori, K.; Angel, P.; Le Beau, M.M.; Karin, M. Structure and chromosomal localization of the functional intronless human JUN protooncogene. Proc. Natl. Acad. Sci. USA 1988, 85, 9148–9152. [Google Scholar] [CrossRef]
- Hashimoto, K.; Mori, N.; Tamesa, T.; Okada, T.; Kawauchi, S.; Oga, A.; Furuya, T.; Tangoku, A.; Oka, M.; Sasaki, K. Analysis of DNA copy number aberrations in hepatitis C virus-associated hepatocellular carcinomas by conventional CGH and array CGH. Mol. Pathol. 2004, 17, 617–622. [Google Scholar] [CrossRef] [PubMed] [Green Version]
- De Gunzburg, J. RAP1A (RAP1A, member of RAS oncogene family). Atlas Genet. Cytogenet. Oncol. Haematol. 2001, 5, 178–179. [Google Scholar] [CrossRef]
- Faried, A.; Faried, L.S.; Kimura, H.; Nakajima, M.; Sohda, M.; Miyazaki, T.; Kato, H.; Usman, N.; Kuwano, H. RhoA and RhoC proteins promote both cell proliferation and cell invasion of human oesophageal squamous cell carcinoma cell lines in vitro and in vivo. Eur J. Cancer 2006, 42, 1455–1465. [Google Scholar] [CrossRef]
- Ballas, K.; Lyons, J.; Janssen, J.W.G.; Bartram, C.R. Incidence of ras gene mutations in Neuroblastoma. Eur. J. Pediatr. 1988, 147, 313–314. [Google Scholar] [CrossRef] [PubMed]
- Kataoka, H.; Miura, Y.; Joh, T.; Seno, K.; Tada, T.; Tamaoki, T.; Nakabayashi, H.; Kawaguchi, M.; Asai, K.; Kato, T.; et al. Alpha-fetoprotein producing gastric cancer lacks transcription factor ATBF1. Oncogene 2001, 20, 869–873. [Google Scholar] [CrossRef] [PubMed] [Green Version]
- Bednarek, A.K.; Keck-Waggoner, C.L.; Daniel, R.L.; Laflin, K.J.; Bergsagel, P.L.; Kiguchi, K.; Brenner, A.J.; Aldaz, C.M. WWOX, the FRA16D gene, behaves as a suppressor of tumor growth. Cancer Res. 2001, 61, 8068–8073. [Google Scholar] [PubMed]
- Van Der Heul-Nieuwenhuijsen, L.; Dits, N.F.; Jenster, G. Gene expression of forkhead transcription factors in the normal and diseased human prostate. BJU Int. 2009, 103, 1574–1580. [Google Scholar] [CrossRef] [PubMed] [Green Version]
- Larsen, M.; Ressler, S.J.; Gerdes, M.J.; Lu, B.; Byron, M.; Lawrence, J.B.; Rowley, D.R. The WFDC1 gene encoding ps20 localizes to 16q24, a region of LOH in multiple cancers. Mamm. Genome 2000, 11, 767–773. [Google Scholar] [CrossRef] [PubMed]
- Caren, H.; Kryh, H.; Nethander, M.; Sjoberg, R.M.; Trager, C.; Nilsson, S.; Abrahamsson, J.; Kogner, P.; Martinsson, T. High-risk Neuroblastoma tumors with 11q-deletion display a poor prognostic, chromosome instability phenotype with later onset. Proc. Natl. Acad. Sci. USA 2010, 107, 4323–4328. [Google Scholar] [CrossRef] [PubMed]
- Mlakar, V.; Jurkovic Mlakar, S.; Lopez, G.; Maris, J.M.; Ansari, M.; Gumy-Pause, F. 11q deletion in Neuroblastoma: A review of biological and clinical implications. Mol. Cancer 2017, 16, 114. [Google Scholar] [CrossRef] [PubMed]
- Zhao, J.; Lu, B.; Xu, H.; Tong, X.; Wu, G.; Zhang, X.; Liang, A.; Cong, W.; Dai, J.; Wang, H.; et al. Thirty-kilodalton tat-interacting protein suppresses tumor metastasis by inhibition of osteopontin transcription in human hepatocellular carcinoma. Hepatology 2008, 48, 265–275. [Google Scholar] [CrossRef] [PubMed]
- Fukuda, T.; Sumiyoshi, T.; Takahashi, M.; Kataoka, T.; Asahara, T.; Inui, H.; Watatani, M.; Yasutomi, M.; Kamada, N.; Miyagawa, K. Alterations of the double-strand break repair gene MRE11 in cancer. Cancer Res. 2001, 61, 23–26. [Google Scholar] [PubMed]
- Broeks, A.; Urbanus, J.H.M.; Floore, A.N.; Dahler, E.C.; Klijn, J.G.M.; Rutgers, E.J.T.; Devilee, P.; Russell, N.S.; van Leeuwen, F.E.; van’t Veer, L.J. ATM-Heterozygous Germline Mutations Contribute to Breast Cancer–Susceptibility. Am. J. Hum. Genet. 2000, 66, 494–500. [Google Scholar] [CrossRef] [PubMed] [Green Version]
- Maness, P.F.; Schachner, M. Neural recognition molecules of the immunoglobulin superfamily: Signaling transducers of axon guidance and neuronal migration. Nat. Neurosci. 2007, 10, 19–26. [Google Scholar] [CrossRef] [PubMed]
- Davies, H.; Bignell, G.R.; Cox, C.; Stephens, P.; Edkins, S.; Clegg, S.; Teague, J.; Woffendin, H.; Garnett, M.J.; Bottomley, W. Mutations of the BRAF gene in human cancer. Nature 2002, 417, 949–954. [Google Scholar] [CrossRef] [PubMed] [Green Version]
- Tang, X.X.; Evans, A.E.; Zhao, H.; Cnaan, A.; London, W.; Cohn, S.L.; Brodeur, G.M.; Ikegaki, N. High-level expression of EPHB6, EFNB2, and EFNB3 is associated with low tumor stage and high TrkA expression in human Neuroblastomas. Clin. Cancer Res. 1999, 5, 1491–1496. [Google Scholar]
- Unland, R.; Kerl, K.; Schlosser, S.; Farwick, N.; Plagemann, T.; Lechtape, B.; Clifford, S.C.; Kreth, J.H.; Gerss, J.; Mühlisch, J. Epigenetic repression of the dopamine receptor D4 in pediatric tumors of the central nervous system. J. Neurooncol. 2014, 116, 237–249. [Google Scholar] [CrossRef] [PubMed]
- Tamir, A.; Howard, J.; Higgins, R.R.; Li, Y.J.; Berger, L.; Zacksenhaus, E.; Reis, M.; Ben-David, Y. Fli-1, an Ets-related transcription factor, regulates erythropoietin-induced erythroid proliferation and differentiation: Evidence for direct transcriptional repression of the Rb gene during differentiation. Mol. Cell. Biol. 1999, 19, 4452–4464. [Google Scholar] [CrossRef] [PubMed]
- Delattre, O.; Zucman, J.; Plougastel, B.; Desmaze, C.; Melot, T.; Peter, M.; Kovar, H.; Joubert, I.; de Jong, P.; Rouleau, G.; et al. Gene fusion with an ETS DNA-binding domain caused by chromosome translocation in human tumours. Nature 1992, 359, 162–165. [Google Scholar] [CrossRef] [PubMed]
- Ackermann, S.; Kocak, H.; Hero, B.; Ehemann, V.; Kahlert, Y.; Oberthuer, A.; Roels, F.; Theißen, J.; Odenthal, M.; Berthold, F. FOXP1 inhibits cell growth and attenuates tumorigenicity of Neuroblastoma. BMC Cancer 2014, 14, 840. [Google Scholar] [CrossRef]
- Imai, K.; Yamamoto, H. Carcinogenesis and microsatellite instability: The interrelationship between genetics and epigenetics. Carcinogenesis 2008, 29, 673–680. [Google Scholar] [CrossRef]
- Coupier, I.; Cousin, P.Y.; Hughes, D.; Legoix-Né, P.; Trehin, A.; Sinilnikova, O.M.; Stoppa-Lyonnet, D. BAP1 and breast cancer risk. Fam. Cancer 2005, 4, 273–277. [Google Scholar] [CrossRef]
- Wu, L.C.; Wang, Z.W.; Tsan, J.T.; Spillman, M.A.; Phung, A.; Xu, X.L.; Yang, M.C.; Hwang, L.Y.; Bowcock, A.M.; Baer, R. Identification of a RING protein that can interact in vivo with the BRCA1 gene product. Nat. Genet. 1996, 14, 430–440. [Google Scholar] [CrossRef]
- Capasso, M.; Devoto, M.; Hou, C.; Asgharzadeh, S.; Glessner, J.T.; Attiyeh, E.F.; Mosse, Y.P.; Kim, C.; Diskin, S.J.; Cole, K.A. Common variations in BARD1 influence susceptibility to high-risk Neuroblastoma. Nat. Genet. 2009, 41, 718–723. [Google Scholar] [CrossRef]
- Mossé, Y.P.; Laudenslager, M.; Longo, L.; Cole, K.A.; Wood, A.; Attiyeh, E.F.; Laquaglia, M.J.; Sennett, R.; Lynch, J.E.; Perri, P.; et al. Identification of ALK as a major familial Neuroblastoma predisposition gene. Nature 2008, 455, 930–935. [Google Scholar] [CrossRef]
- Chakrabarti, L.; Wang, B.D.; Lee, N.H.; Sandler, A.D. A mechanism linking Id2-TGFβ crosstalk to reversible adaptive plasticity in Neuroblastoma. PLoS ONE 2013, 8, 83521. [Google Scholar] [CrossRef] [PubMed]
- Stallings, R.L.; Nair, P.; Maris, J.M.; Catchpoole, D.; McDermott, M.; O’Meara, A.; Breatnach, F. High-resolution analysis of chromosomal breakpoints and genomic instability identifies PTPRD as a candidate tumor suppressor gene in Neuroblastoma. Cancer Res. 2006, 66, 3673–3680. [Google Scholar] [CrossRef] [PubMed]
- Petrossian, K.; Kanaya, N.; Lo, C.; Hsu, P.Y.; Nguyen, D.; Yang, L.; Yang, L.; Warden, C.; Wu, X.; Pillai, R. ERα-mediated cell cycle progression is an important requisite for CDK4/6 inhibitor response in HR+ breast cancer. Oncotarget 2018, 9, 27736–27751. [Google Scholar] [CrossRef] [PubMed]
- Loi, S.; Haibe-Kains, B.; Majjaj, S.; Lallemand, F.; Durbecq, V.; Larsimont, D.; Gonzalez-Angulo, A.M.; Pusztai, L.; Symmans, W.F.; Bardelli, A. PIK3CA mutations associated with gene signature of low mTORC1 signalling and better outcomes in estrogen receptor-positive breast cancer. Proc. Natl. Acad. Sci. USA 2010, 107, 10208–10213. [Google Scholar] [CrossRef] [PubMed]
- Paolillo, C.; Mu, Z.; Rossi, G.; Schiewer, M.J.; Nguyen, T.; Austin, L.; Capoluongo, E.; Knudsen, K.; Cristofanilli, M.; Fortina, P. Detection of Activating Estrogen Receptor Gene (ESR1) Mutations in Single Circulating Tumor Cells. Clin. Cancer Res. 2017, 23, 6086–6093. [Google Scholar] [CrossRef]
- Shaw, J.A.; Guttery, D.S.; Hills, A.; Fernandez-Garcia, D.; Page, K.; Rosales, B.M.; Goddard, K.S.; Hastings, R.K.; Luo, J.; Ogle, O.; et al. Mutation Analysis of Cell-Free DNA and Single Circulating Tumor Cells in Metastatic Breast Cancer Patients with High Circulating Tumor Cell Counts. Clin. Cancer Res. 2017, 23, 88–96. [Google Scholar] [CrossRef] [PubMed]
- Bulfoni, M.; Gerratana, L.; Del Ben, F.; Marzinotto, S.; Sorrentino, M.; Turetta, M.; Scoles, G.; Toffoletto, B.; Isola, M.; Beltrami, C.A.; et al. In patients with metastatic breast cancer the identification of circulating tumor cells in epithelial-to-mesenchymal transition is associated with a poor prognosis. Breast Cancer Res. 2016, 18, 30. [Google Scholar] [CrossRef] [PubMed]
- Lee, J.W.; Shin, J.Y.; Seo, J.S. Identification of novel mutations in FFPE lung adenocarcinomas using DEPArray sorting technology and next-generation sequencing. J. Appl. Genet. 2018, 59, 269–277. [Google Scholar] [CrossRef] [PubMed] [Green Version]
- Yang, R.K.; Sondel, P.M. Anti-GD2 strategy in the treatment of Neuroblastoma. Drugs Future 2010, 35, 665. [Google Scholar] [CrossRef] [PubMed]


| Gene | ||||
|---|---|---|---|---|
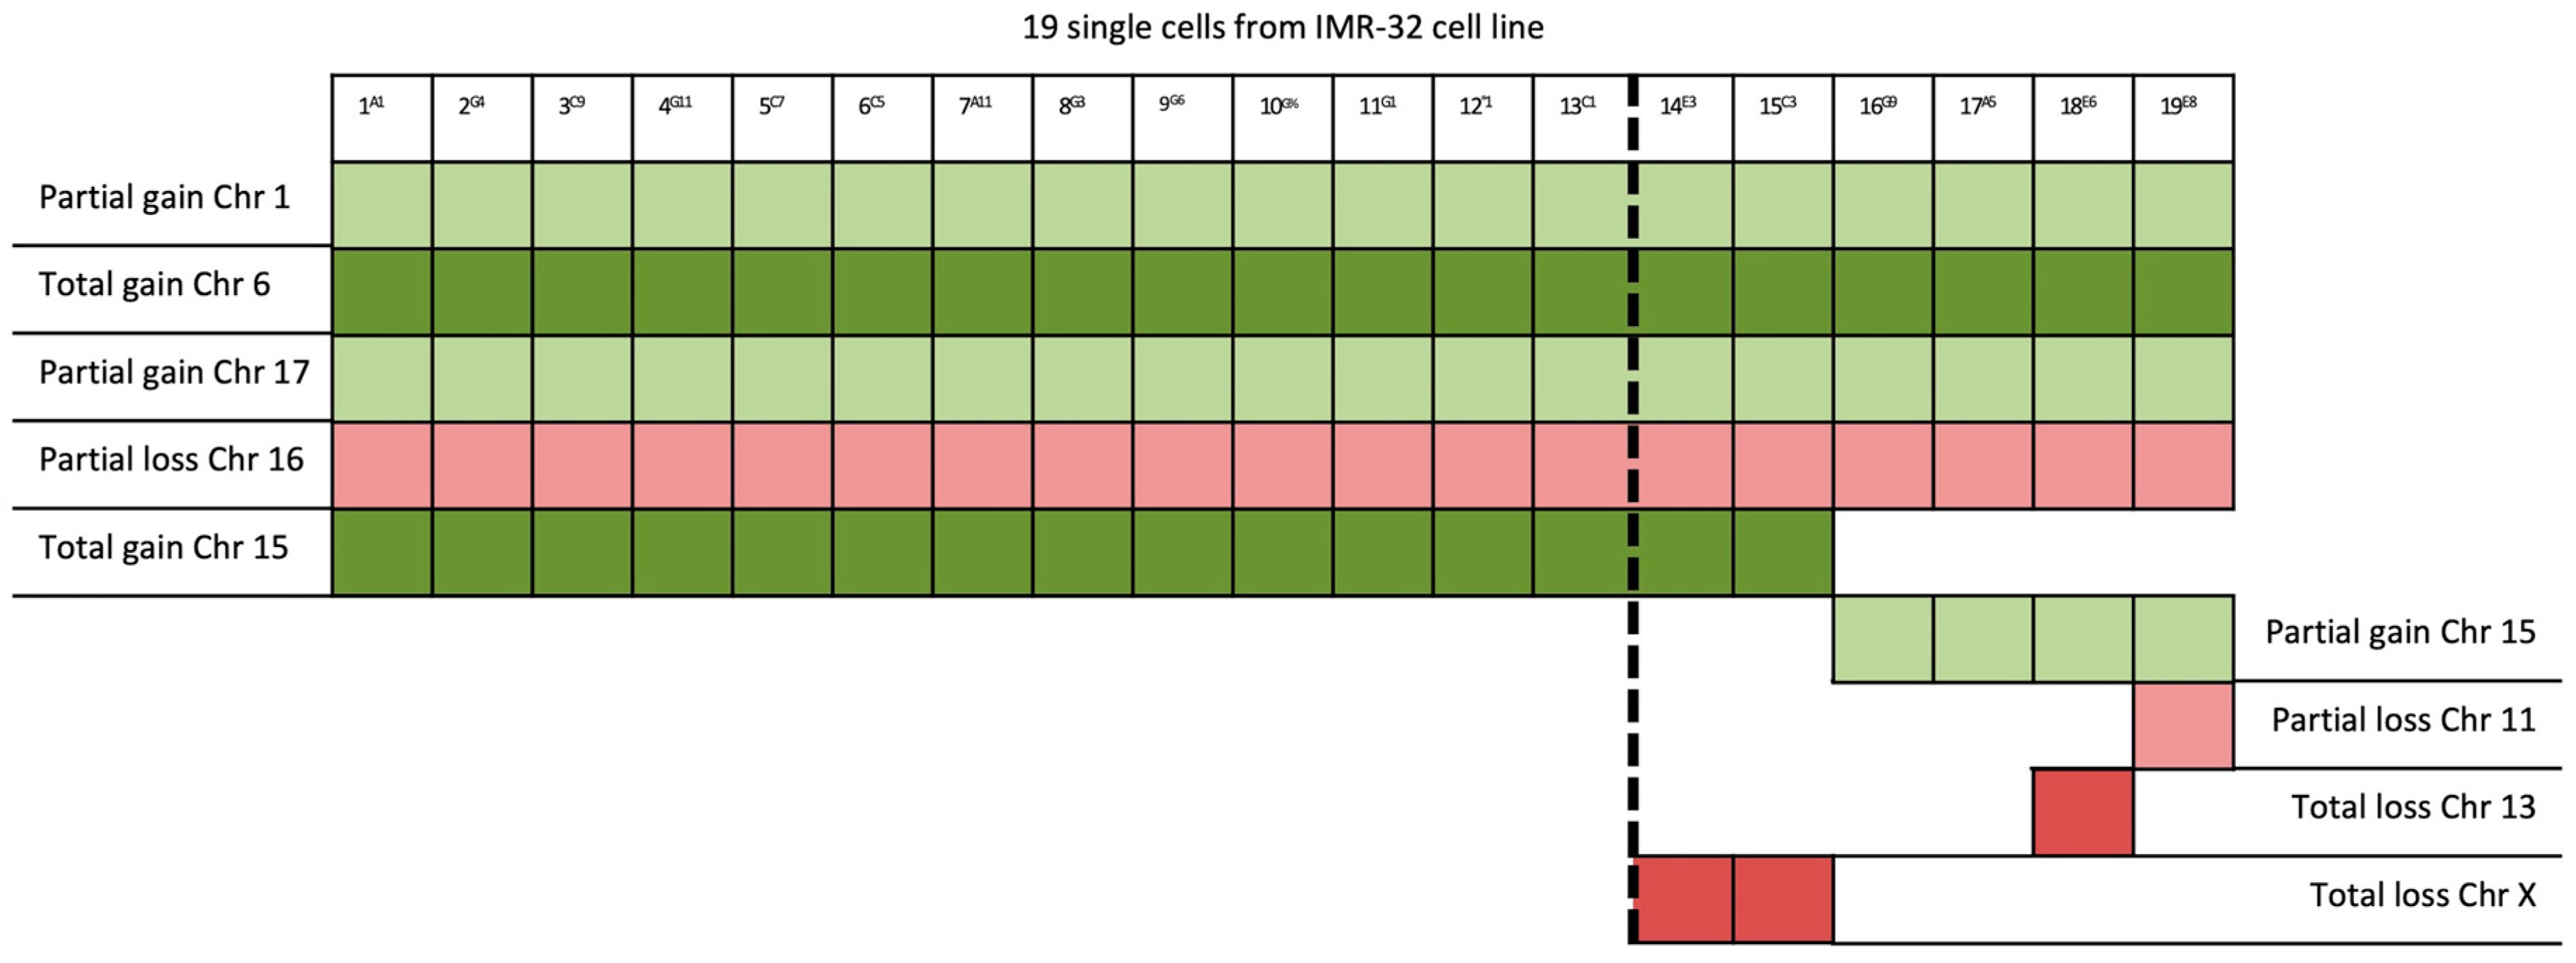
| Single Cell | Chr. Alteration | Name | Position | Features and Implications with Cancer |
| 19/19 | 1p32-3–1q44 (194 Mb) | JUN | 1p32.1 | Cell proliferation and transformation |
| RAPIA | 1p13.2 | Activator of Raf gene in the MAP kinase pathway | ||
| RHOC | 1p13.2 | Believed to have a similar function as Ras | ||
| NRAS | 1p31.2 | Signal transduction pathways | ||
| AKT3 | 1q43–q44 | Cell proliferation, survival, and tumorigenesis | ||
| 6 | FOXQ1 | 6p25.3 | Increased migration and proliferation | |
| SOX4 | 6p22.3 | Increased survival in medulloblastoma | ||
| AGER | 6p21.32 | Promoter of human glioblastoma cell growth and migration | ||
| SRSF3 | 6p21.31 | Cell cycle progression control | ||
| NCR2 | 6p21.1 | Cell cycle regulation | ||
| HACE1 | 6q16.3 | Tumor suppressor | ||
| LATS1 | 6q24-25.1 | Overexpression reduces cell proliferation, migration. and invasion | ||
| 17q21.1–17q25.3 (42 Mb) | SLC4A1 | 16q22.2 | Overexpression leads to tumor progression | |
| NMT1 | 16q23.1 | Upregulated due to gene amplification | ||
| FMNL1 | 16q24.1 | Overexpression leads to cell growth | ||
| NGFR | 16q24.1 | Acts as a tumor marker for neural crest cells | ||
| 16q21–16q24.2 (26 Mb) | ZFHX3 | 17q21.31 | Neuronal differentiation | |
| WWOX | 17q21.31 | Possible involvement in apoptosis | ||
| FXOP1 | 17q21.31 | Cell cycle progression, invasion, and metastasis | ||
| WEDC1 | 17q21.33 | Functions like the tumor suppressor gene | ||
| 15/19 | 15 | PLCB2 | 15q15.1 | Overexpressed in cancer tissues |
| TYRO3 | 15q15.1 | Highly expressed in certain cancers | ||
| 4/19 | 15q15.1–15q26.3 (60 Mb) | RASGRF1 | 15q25.1 | Overexpression in the MAPK cascade in neuronal cells |
| PCSK6 | 15q26.3 | High expression in breast cancer and prostate cancer | ||
| 1/19 | 11p15.2–11p12 (42 Mb); 11q14.1–11q23.2 (32 Mb); 11q23.2–11q25 (21 Mb) | HTATIP2 | 11p15.1 | Suppression of metastasis in various tumors |
| WT1 | 11p13 | Tumor suppressor | ||
| MRE11 | 11q21 | DNA repair mechanism | ||
| ATM | 11q22.3 | DNA repair mechanism | ||
| 1/19 | 13 | See Table 2 | ||
| 2/19 | X | VEGFD | Xp22.2 | Angiogenesis, lymphangiogenesis, and metastasis |
| PRDX4 | Xp22.11 | Facilitates protein folding | ||
| ZBTB33 | Xq24 | Both an activator and repressor of transcription | ||
| PASD1 | Xq28 | Transcription factor | ||
| L1CAM | Xq28 | Axon outgrowth and neuronal migration | ||
| VEGFD | Xp22.2 | Angiogenesis, lymphangiogenesis, and metastasis | ||
| Legend | ||||
| Partial gain | ||||
| Total gain | ||||
| Partial loss | ||||
| Total loss | ||||
| Gene | ||||
|---|---|---|---|---|
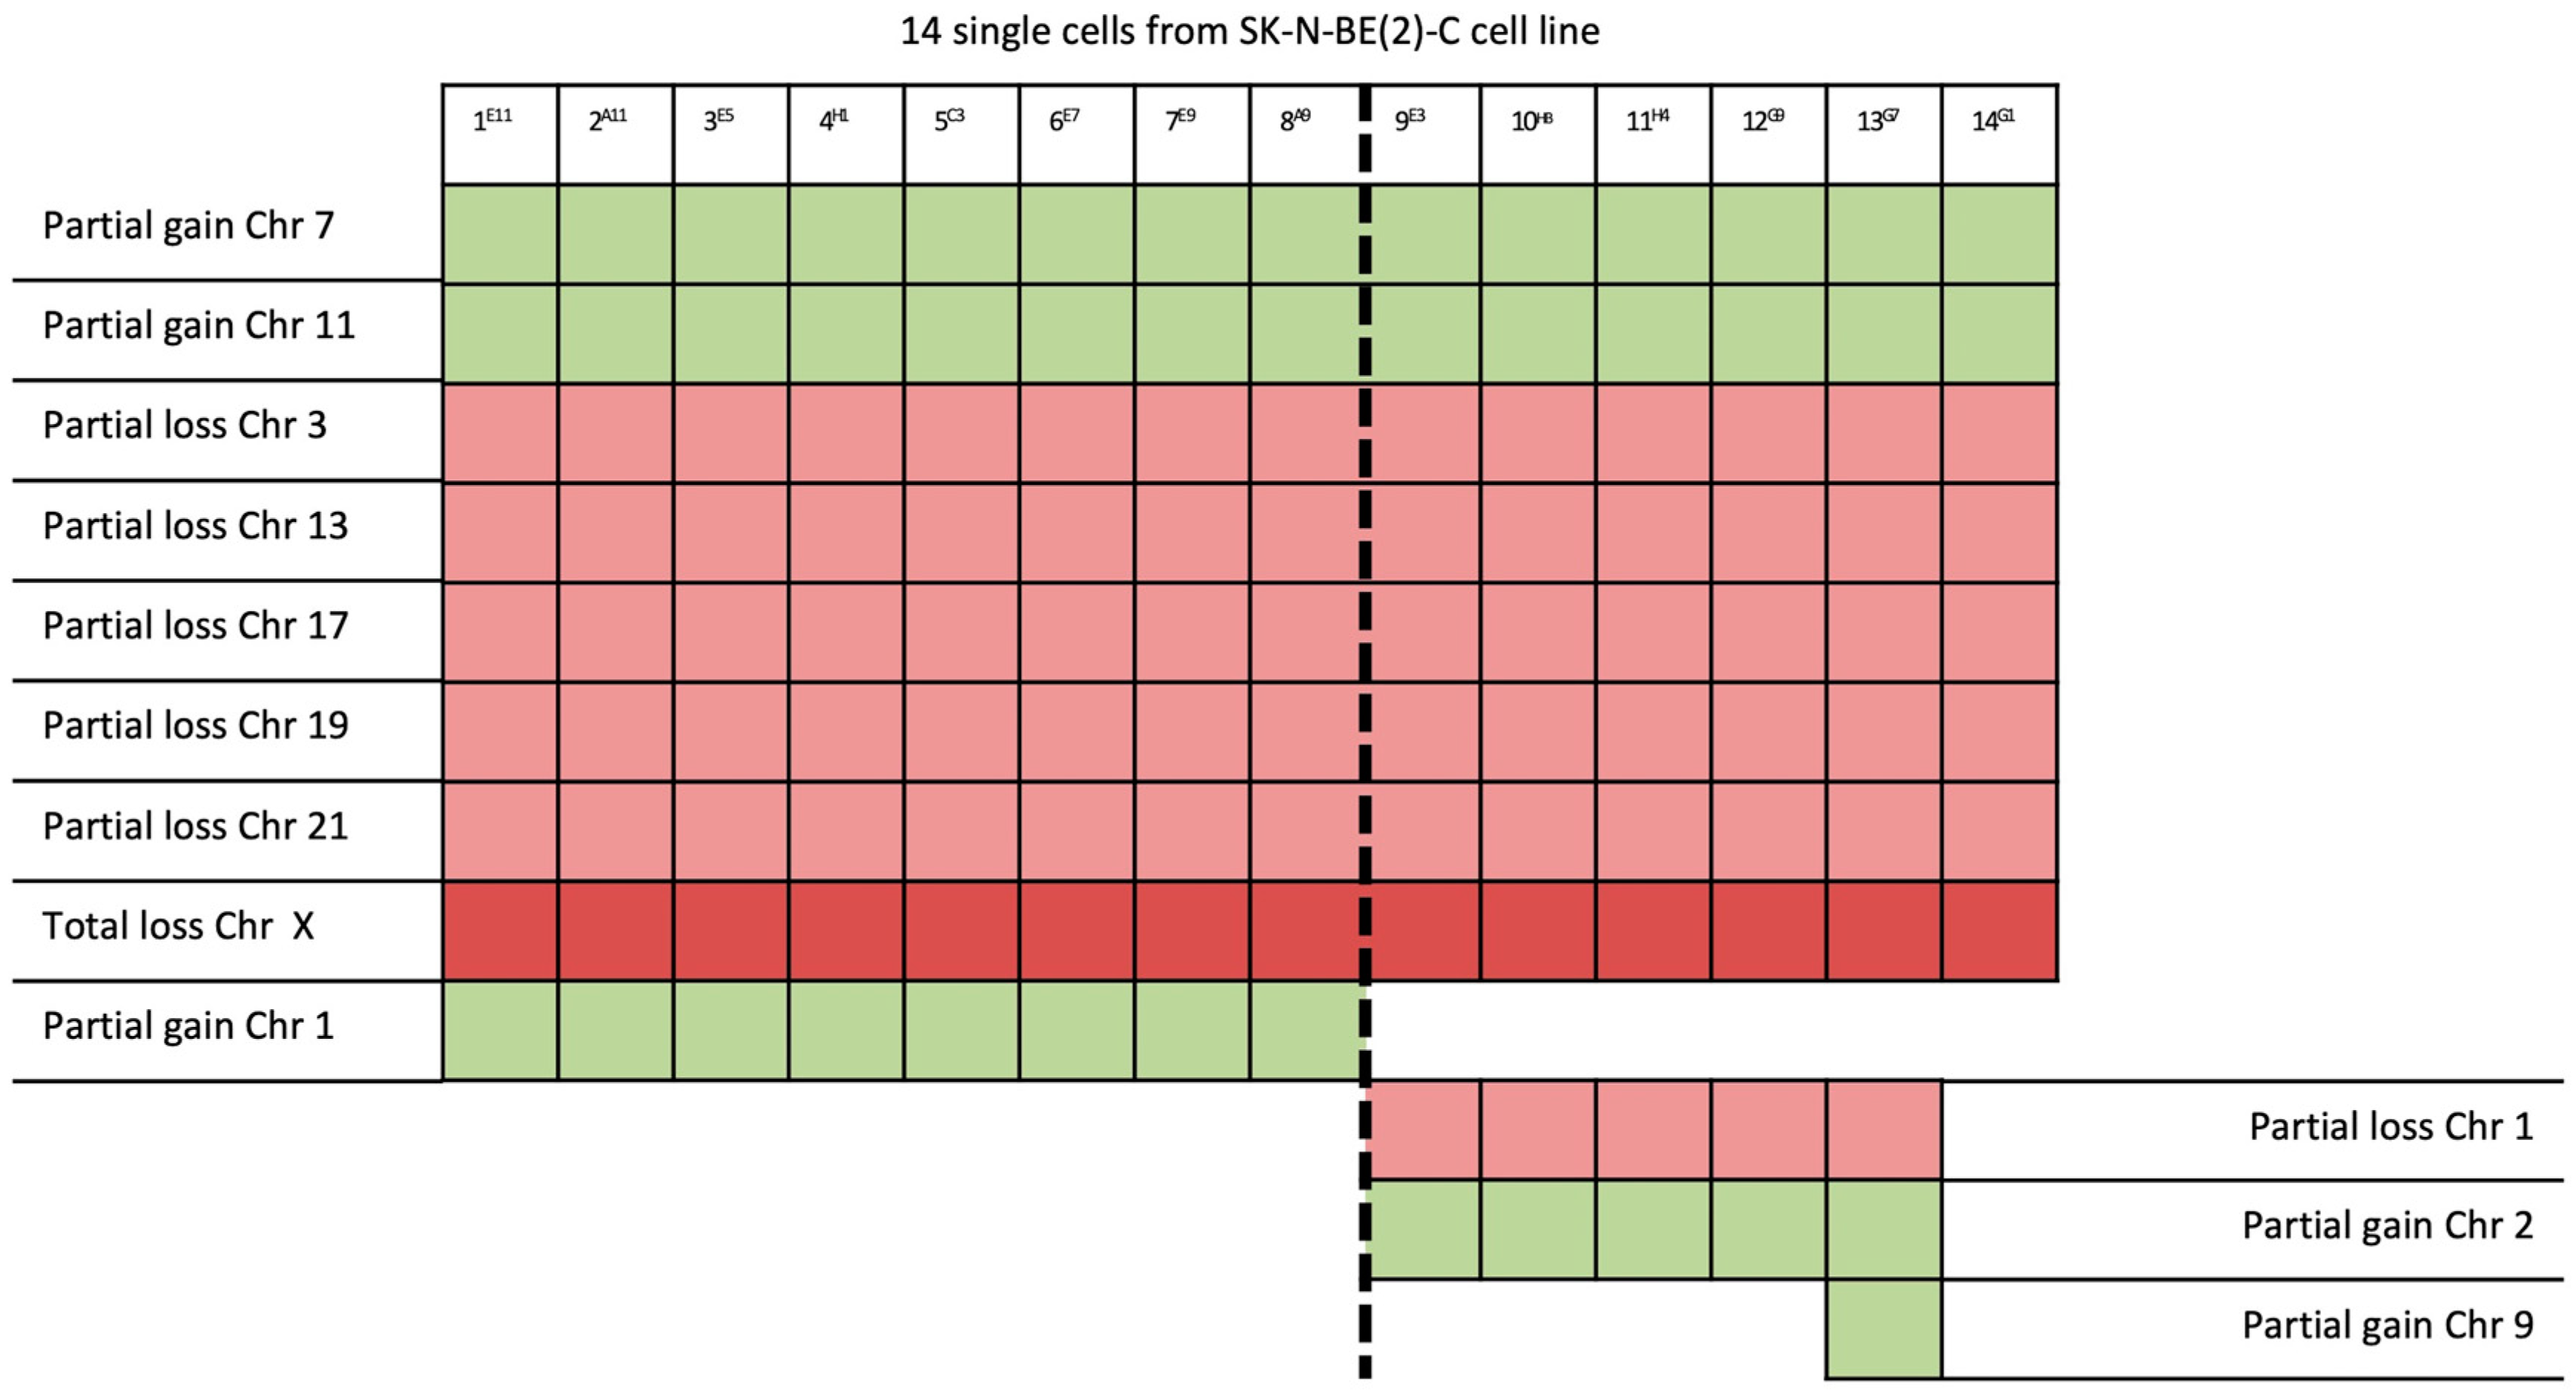
| Single Cell | Chromosomal Alteration | Name | Position | Features and Implications with Cancer |
| 14/14 | 7q32.1–7q36.3 (31 Mb) | NRF1 | 7q32.3 | Cell cycle regulation |
| BRAF | 7q34 | Belongs to the RAS/RAF/MEK/ERK/MAPK pathway | ||
| EPHB6 | 7q34 | Prognostic indicators in neuroblastoma | ||
| EZH2 | 7q36.1 | Role in the control of the central nervous system | ||
| XRCC2 | 7q36.1 | Involved in homologous recombination | ||
| 11q13.3–11q25 (65 Mb) | MRE11 | 11q21 | DNA repair mechanism | |
| ATM | 11q22.3 | DNA repair mechanism | ||
| MCAM | 11q23.3 | Cell adhesion molecules | ||
| FLI1 | 11q24.3 | Role in erythropoiesis | ||
| TMPRSS4 | 11q23.3 | Role in invasion, metastasis, migration, and adhesion | ||
| 3p26.3–3p14.2 (61 Mb) | PPARG | 3p25.2 | Anti-inflammatory role | |
| TGFBR2 | 3p24.1 | Loss of expression is linked with cancer | ||
| MLH1 | 3p22.2 | Recruitment of proteins for excision and repair | ||
| BAP1 | 3p21.1 | Enhances BRCA1-mediated inhibition | ||
| 13q12.11–13q31.1 (66 Mb) | LATS2 | 13q12.11 | Overexpression inhibits tumor formation | |
| PDX1 | 13q12.2 | Overexpression is correlated with metastasis | ||
| BRCA2 | 13q13.1 | Maintenance of genomic integrity | ||
| RB1 | 13q14.2 | Cell cycle regulation and differentiation | ||
| KLF5 | 13q22.1 | Cell cycle, cell proliferation, and apoptosis | ||
| LATS2 | 13q12.11 | Overexpression inhibits tumor formation | ||
| 17p13.3–17q11.2 (30 Mb) | FAM57A | 17p13.3 | Amino acid transport and glutathione metabolism | |
| CRK | 17p13.3 | Overexpressed in various human cancers | ||
| MAP2K4 | 17p12 | Response to cellular stress | ||
| NF1 | 17q11.2 | Loss of function leads to neurofibromatosis type 1 | ||
| KSR1 | 17q11.2 | Might be involved in Ras-mediated oncogenesis | ||
| 19q12–19q13.43 (28 Mb) | PDCD5 | 19q13.11 | Promotes apoptosis; underexpressed | |
| FXYD3 | 19q13.12 | Downregulated in various cancers | ||
| PAF1 | 19q13.2 | Overexpression results in enhanced growth rates | ||
| BAX | 19q13.33 | Proapoptotic function | ||
| ATF5 | 19q13.33 | Proliferation and differentiation of neural cells | ||
| 21q22.2–21q22.3 (6 Mb) | ERG | 21q22.2 | Regulator of mitogenic signal transduction pathways | |
| ETS2 | 21q22.3 | Positive or negative regulator of gene expression | ||
| TMPRSS2 | 21q22.3 | Involved in prostate cancer | ||
| CSTB | 21q22.3 | Related to a favorable prognosis for cancer patients | ||
| PTTG1IP | 21q22.3 | Overexpressed in thyroid tumors | ||
| X | See Table 1 | |||
| 8/14 | 1p21.3–1q44 (151 Mb) | ABL2 | 1q25.2 | Involved in acute non-lymphocytic leukemia |
| TP53BP2 | 1q43–44 | Apoptosis, cell cycle, tumor suppression, and cell polarity | ||
| 5/14 | 1p32.2–1p21.3 (44 Mb) | JUN | 1p32.1 | Cell proliferation and transformation |
| JAK1 | 1p31.3 | Signaling by the majority of cytokines | ||
| GADD45A | 1p31.3 | Maintenance of genome integrity | ||
| NRAS | 1p31.2 | Signal transduction pathways | ||
| 6/14 | 2p25.3–2p21 (44 Mb) | SOX11 | 2p25.2 | Development in the nervous system of the human fetus |
| ID2 | 2p25.1 | Phenotypic transition of neuroblastoma tumor cells | ||
| N-Myc | 2p24.3 | Expressed in several tumors | ||
| ALK | 2p23.2 | Development and maintenance of the nervous system | ||
| EPCAM | 2p21 | Oncogenic signaling molecule | ||
| 1/14 | 9p24.3–9p23 (13 Mb) | JAK2 | 9p24.1 | Associated with cytokine receptors |
| RLN2 | 9p24.1 | Induced by a variety of factors in different tissues | ||
| PTPRD | 9p24.1 | Tumor suppressor gene in neuroblastoma | ||
| TYRP1 | 9p23 | Correlated with distant metastasis-free survival | ||
| Legend | ||||
| Partial gain | ||||
| Total gain | ||||
| Partial loss | ||||
| Total loss | ||||
© 2019 by the authors. Licensee MDPI, Basel, Switzerland. This article is an open access article distributed under the terms and conditions of the Creative Commons Attribution (CC BY) license (http://creativecommons.org/licenses/by/4.0/).
Share and Cite
Cariati, F.; Borrillo, F.; Shankar, V.; Nunziato, M.; D’Argenio, V.; Tomaiuolo, R. Dissecting Intra-Tumor Heterogeneity by the Analysis of Copy Number Variations in Single Cells: The Neuroblastoma Case Study. Int. J. Mol. Sci. 2019, 20, 893. https://0-doi-org.brum.beds.ac.uk/10.3390/ijms20040893
Cariati F, Borrillo F, Shankar V, Nunziato M, D’Argenio V, Tomaiuolo R. Dissecting Intra-Tumor Heterogeneity by the Analysis of Copy Number Variations in Single Cells: The Neuroblastoma Case Study. International Journal of Molecular Sciences. 2019; 20(4):893. https://0-doi-org.brum.beds.ac.uk/10.3390/ijms20040893
Chicago/Turabian StyleCariati, Federica, Francesca Borrillo, Varun Shankar, Marcella Nunziato, Valeria D’Argenio, and Rossella Tomaiuolo. 2019. "Dissecting Intra-Tumor Heterogeneity by the Analysis of Copy Number Variations in Single Cells: The Neuroblastoma Case Study" International Journal of Molecular Sciences 20, no. 4: 893. https://0-doi-org.brum.beds.ac.uk/10.3390/ijms20040893