Article

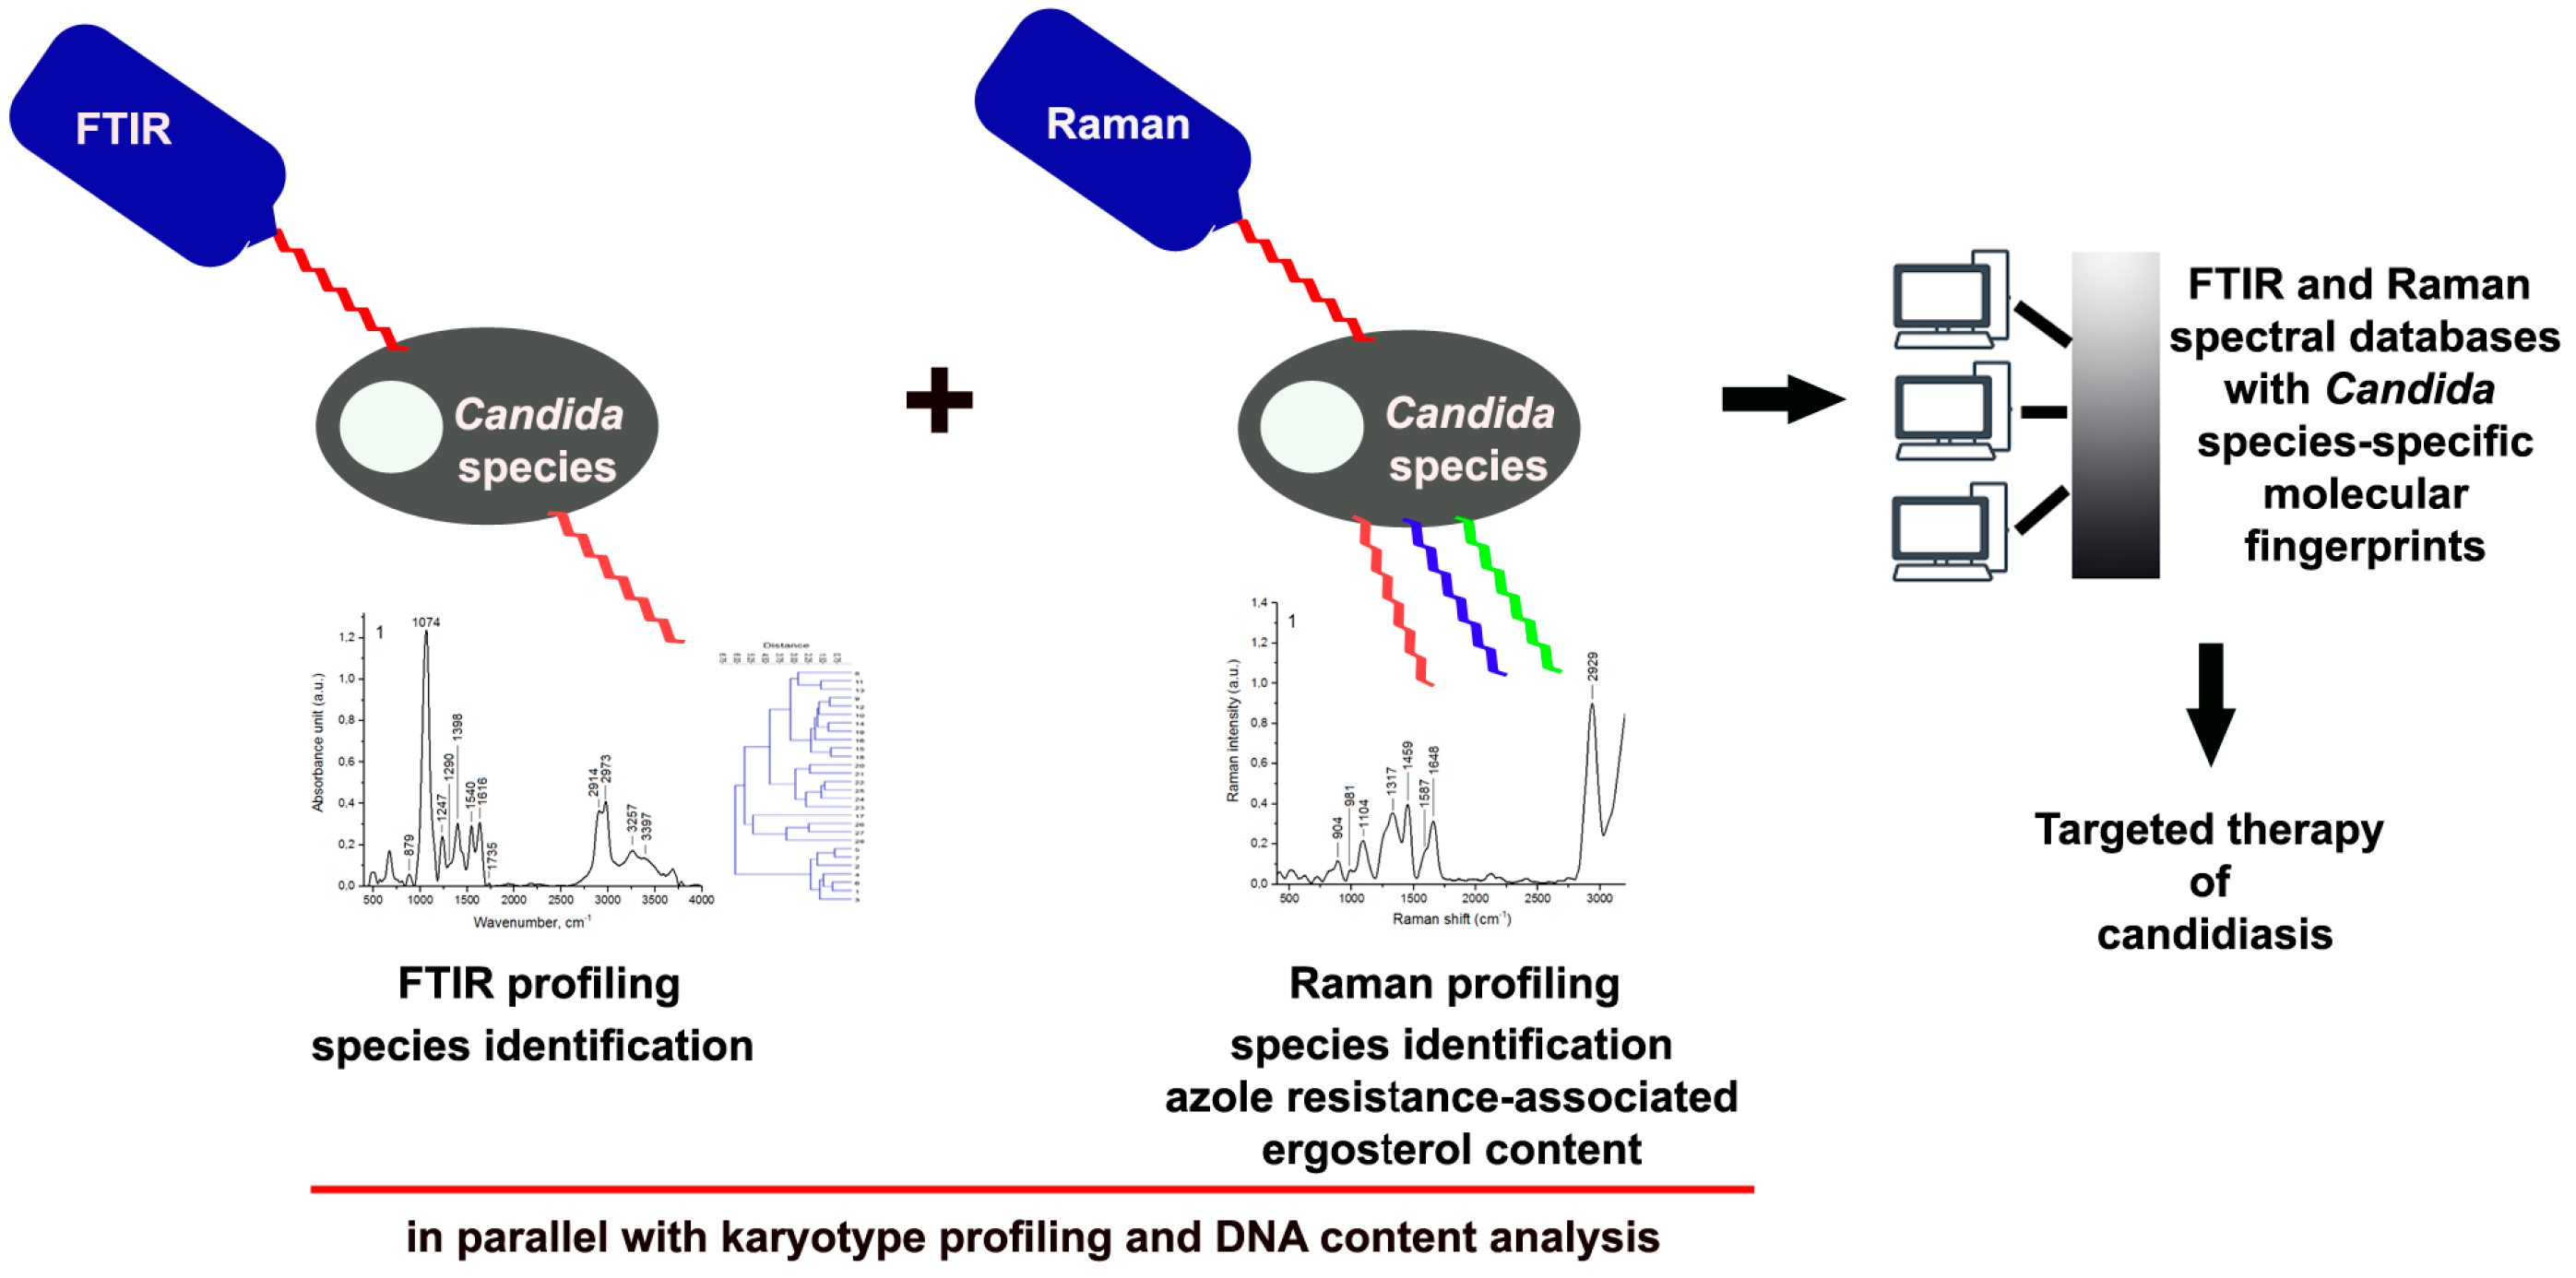
FTIR and Raman Spectroscopy-Based Biochemical Profiling Reflects Genomic Diversity of Clinical Candida Isolates That May Be Useful for Diagnosis and Targeted Therapy of Candidiasis

1
Department of Genetics, Faculty of Biotechnology, University of Rzeszow, Pigonia 1, 35-310 Rzeszow, Poland
2
Institute of Nuclear Physics, Polish Academy of Sciences, 31-342 Krakow, Poland
3
Department of Microbiology, Faculty of Medicine, University of Rzeszow, 35-959 Rzeszow, Poland
4
Department of Cell Biochemistry, Faculty of Biotechnology, University of Rzeszow, 35-310 Rzeszow, Poland
*
Authors to whom correspondence should be addressed.
These authors contributed equally to this work.
Int. J. Mol. Sci. 2019, 20(4), 988; https://0-doi-org.brum.beds.ac.uk/10.3390/ijms20040988
Submission received: 19 January 2019 / Revised: 16 February 2019 / Accepted: 18 February 2019 / Published: 25 February 2019
(This article belongs to the Section Molecular Pathology, Diagnostics, and Therapeutics)

Abstract

:
Despite the fact that Candida albicans is documented to be the main cause of human candidiasis, non-C. albicans Candida (NCAC) species, such as Candida glabrata and Candida tropicalis, are also suggested to be implicated in the etiopathogenesis of opportunistic fungal infections. As biology, epidemiology, pathogenicity, and antifungal resistance of NCAC species may be affected as a result of genomic diversity and plasticity, rapid and unambiguous identification of Candida species in clinical samples is essential for proper diagnosis and therapy. In the present study, 25 clinical isolates of C. albicans, C. glabrata, and C. tropicalis species were characterized in terms of their karyotype patterns, DNA content, and biochemical features. Fourier transform infrared (FTIR) spectra- and Raman spectra-based molecular fingerprints corresponded to the diversity of chromosomal traits and DNA levels that provided correct species identification. Moreover, Raman spectroscopy was documented to be useful for the evaluation of ergosterol content that may be associated with azole resistance. Taken together, we found that vibrational spectroscopy-based biochemical profiling reflects the variability of chromosome patterns and DNA content of clinical Candida species isolates and may facilitate the diagnosis and targeted therapy of candidiasis.

Graphical Abstract

1. Introduction

Fungal infections caused by Candida species are either mucosal or systemic, in which the fungus invades and penetrates internal organs or tissues and/or reaches the bloodstream and spreads throughout the body (candidemia) [1,2]. Invasive candidiasis, which accounts for approximately three-fourths of systemic fungal infections, may be a life threatening condition, especially in a case of immunocompromised patients [2,3,4]. The Candida genus is composed of more than 150 heterogeneous species, but just a few of them have been implicated in human candidiasis [1]. While C. albicans causes the majority of human infections [1], the number of fungal infections caused by non-C. albicans Candida (NCAC) species, such as C. glabrata, C. parapsilosis, and C. tropicalis has been significantly elevated [5,6,7]. This may be due, at least in part, to improvements in diagnostic procedures, such as the use of chromogenic media with the ability to differentiate Candida species and some molecular diagnostic techniques, e.g., PCR [8]. In addition, some of the NCAC species associated with candidiasis are also less susceptible to antifungal drug treatment compared to C. albicans [9,10]. The biology, epidemiology, pathogenicity, and the mechanisms of antifungal resistance of NCAC species have not been studied as extensively as those of C. albicans [11].
Despite the fact that the techniques of isolation and identification of Candida species have been improved [11,12,13,14], the laboratory diagnosis of candidiasis remains challenging. This may be due to the genomic plasticity of Candida species [15,16,17]. Indeed, karyotypic diversity is commonly observed in Candida species and isolates [18,19,20,21], and yeast cells can be found as haploids, diploids, and tetraploids, as well as aneuploids [22,23,24] as a consequence of drug-induced genomic instability or as a selective advantage in the presence of the drug [25]. Changes in karyotype patterns and ploidy levels have the potential to cause phenotypic changes that promote adaptation to stress conditions in the environment, host niches or in response to antifungal drugs [15,16]. More recently, matrix-assisted laser desorption ionization time-of-flight mass spectrometry MALDI-TOF MS [26,27] and vibrational spectroscopy, namely FTIR [28,29,30] and Raman [31,32,33] spectroscopy, have been adapted as an accurate, rapid, and inexpensive typing methods for Candida species. However, these methods have not yet been comparatively evaluated in a large number of clinical isolates concomitantly with accepted standards and have been used as isolated methods without providing a comparison to karyotype profiling and/or ploidy analysis.
The aim of the present study was to verify the usefulness of FTIR and Raman spectroscopy for Candida clinical isolate identification and diagnosis and establish the impact of selected parameters (karyotype polymorphism, DNA content, antifungal treatment) on vibrational spectroscopy-based biochemical profiling. In the present study, 25 clinical Candida isolates were characterized for their karyotypic features, DNA content and FTIR spectra- and Raman spectra-based molecular fingerprints and collected data (chromosome number, DNA content, characteristic FTIR and Raman vibrations) were used to create a heat map and group Candida isolates. We have documented a joined cluster analysis for proper and successful Candida species grouping. The effect of antifungal treatment was also established.

2. Results and Discussion

2.1. Karyotype Profiling and DNA Content Analysis

A total of 25 clinical Candida samples were classified into three species categories, namely C. albicans (samples from 1 to 2 and from 4 to 19, n = 18), C. tropicalis (samples from 20 to 21, n = 2) and C. glabrata (sample 3 and samples from 22 to 25, n = 5) (Table 1) based on DNA sequencing and a biochemical test. In general, these two assays yielded similar identification results, except of sample 3 that was identified as C. glabrata species based on ITS1 sequencing and as C. albicans species based on a biochemical test. As DNA sequencing is a more reliable identification method, we assumed that sample 3 is indeed C. glabrata. Firstly, morphological features of yeast cells were assessed (Figure 1a).
In general, typical shapes (spherical to oval) and sizes (2–5 × 3–7 µm) of Candida cell isolates with the ability to form buds and/or hyphae/pseudohyphae were compared to reference strains (Figure 1a). The ability to grow in yeast, pseudohyphal and hyphal forms is a characteristic feature of C. albicans biology [34]. As expected [1,11,35], C. glabrata budding cells (blastoconidia) (1–4 µm) were smaller then C. albicans (4–6 µm) and C. tropicalis cells (4–8 µm) that is due to the fact that C. glabrata is generally considered haploid while C. albicans and C. tropicalis are diploid and C. glabrata did not form hyphae/pseudohyphae (Figure 1a).
Of course, clinical species cannot be determined solely based upon morphological features (Figure 1a). CHEF-PFGE was used for karyotype analysis (Figure 1b). C. albicans cells have eight pairs of chromosomal homologs, ranging in size from 0.95 to 3.3 Mb and comprising 16 Mb in total [36], but we were able to observe from four to nine chromosomes in clinical isolates assigned to C. albicans species (Figure 1b). The reference strains of C. albicans, namely haploid (302), diploid (SC5314) and tetraploid (T15) were characterized by seven, eight, and six distinguishable chromosomes, respectively (Figure 1b). This confirms a high genomic diversity of C. albicans species [18,36]. It has been suggested that genomic diversity of C. albicans is due to chromosome length polymorphism (CLP) that results from expansion and contraction of subrepeats RPS; reciprocal translocation at the major repeat sequence (MRS) loci; chromosomal deletion and trisomy of individual chromosomes [36]. The karyotypes of C. tropicalis and C. glabrata isolates were found to be much more consistent (Figure 1b). Two C. tropicalis isolates had four chromosomes and five C. glabrata isolates had from six to twelve distinguishable chromosome bands (Figure 1b). The genome of C. glabrata clinical isolates was found to be very plastic with the variations in the number and size of chromosomes and the occurrence of intra- and interchromosomal segmental duplications [37]. For example, it has been reported that C. glabrata CBS 138 strain has 13 chromosomes with the genome size of 12.3 Mb [38]. CHEF-PFGE analysis found a minimum of 10 chromosome bands in C. glabrata [39]. Moreover, rapid changes in C. glabrata genomic organization have been comprehensively documented in numerous clinical studies [40,41,42,43]. Interestingly, isolates from one patient may exhibit 2 or 3 different karyotypes and during infection the chromosome pattern may change within a few days [41].
Phylogenetically, C. glabrata is more closely related to the model yeast Saccharomyces cerevisiae than to other Candida pathogens [38], as C. glabrata belongs to post-WGD (whole genome duplication) yeasts [37]. Chromosome similarity between 25 clinical Candida isolates was also further evaluated using NJ clustering (this study). Three considered species, namely C. albicans, C. tropicalis, and C. glabrata were characterized by clearly separate three clusters (Figure 1c). The most accented chromosome polymorphism was observed among the C. albicans group. Nevertheless, due to high genomic diversity and plasticity [15,36,44], it is difficult to discriminate between Candida species based on karyotype profiling only.
We also analyzed DNA content of Candida isolates using fluorescent measurements and compared them to the reference strains used (n, 2n, and 4n) (Figure 2). However, one should remember that haploid strains of C. albicans are considered to be unstable, often autodiploidize, and that genomic features often vary among tetraploid strains as well [23,45].
As expected [46], DNA content of C. glabrata isolates was found to be the lowest (Figure 2). DNA content of C. tropicalis isolates was higher than that of C. albicans and DNA content of C. albicans isolates was enormously diverse with a broad range between minimal and maximal values (Figure 2). When considered relative fluorescent units (arbitrary units), n, 2n, and 4n reference strains were characterized by mean arbitrary units of 0.6, 0.74, and 1.07, respectively, whereas C. glabrata, C. tropicalis, and C. albicans isolates were characterized by mean arbitrary units of 0.46, 0.87, and 0.62, respectively (Figure 2). Our data confirm DNA content diversity and plasticity of Candida albicans [16,44]. The DNA content/ploidy variation is considered as an adaptive mechanism in human pathogenic fungi [16,44,47]. C. albicans is normally a diploid organism (2n = 16), but a variety of stresses, namely heat shock, antifungal drug treatment or host-pathogen interactions can stimulate a plethora of aneuploidy events that seems to be well tolerated and may be considered as a selectively advantageous, e.g., may promote antifungal drug resistance [16,44,47]. Indeed, a specific segmental aneuploidy, consisting of an isochromosome composed of the two left arms of chromosome 5 (i5L), was reported to be associated with azole resistance in C. albicans [48]. This was achieved by amplification of two genes involved in fluconazole resistance, namely ERG11 (that encodes lanosterol–14-α-demethylase, the target of fluconazole) and TAC1 (that encodes a transcriptional regulator of ABC-transporter drug efflux pumps Cdr1 and Cdr2 that reduce intracellular azole concentration) [49]. More recently, trisomy of chromosome R and trisomy of chromosome 4 have been also reported to contribute to azole resistance in C. albicans [50,51]. The genomic plasticity is also associated with antifungal drug resistance in C. glabrata as the formation of new chromosomes was established as a virulence mechanism in C. glabrata clinical isolates [43]. Surprisingly, spontaneous changes in ploidy are also widespread in nonpathogenic fungi, namely in the model yeast Saccharomyces cerevisiae [52]. The appearance of diploid cells among haploid yeast cultures evolving for over 100 generations was documented and spontaneous diploidization was observed [52]. This relatively common event was based on both whole genome duplication (endoreduplication) and mating-type switching despite the use of heterothallic strains [52]. It has been suggested that spontaneous diploidization can be advantageous under certain stressful conditions in budding yeast [52]. Chromosomal copy number changes were also observed while analyzing the genome of clinical Saccharomyces cerevisiae strains that highlights the potential importance of large-scale genomic copy variation in yeast adaptation [53].

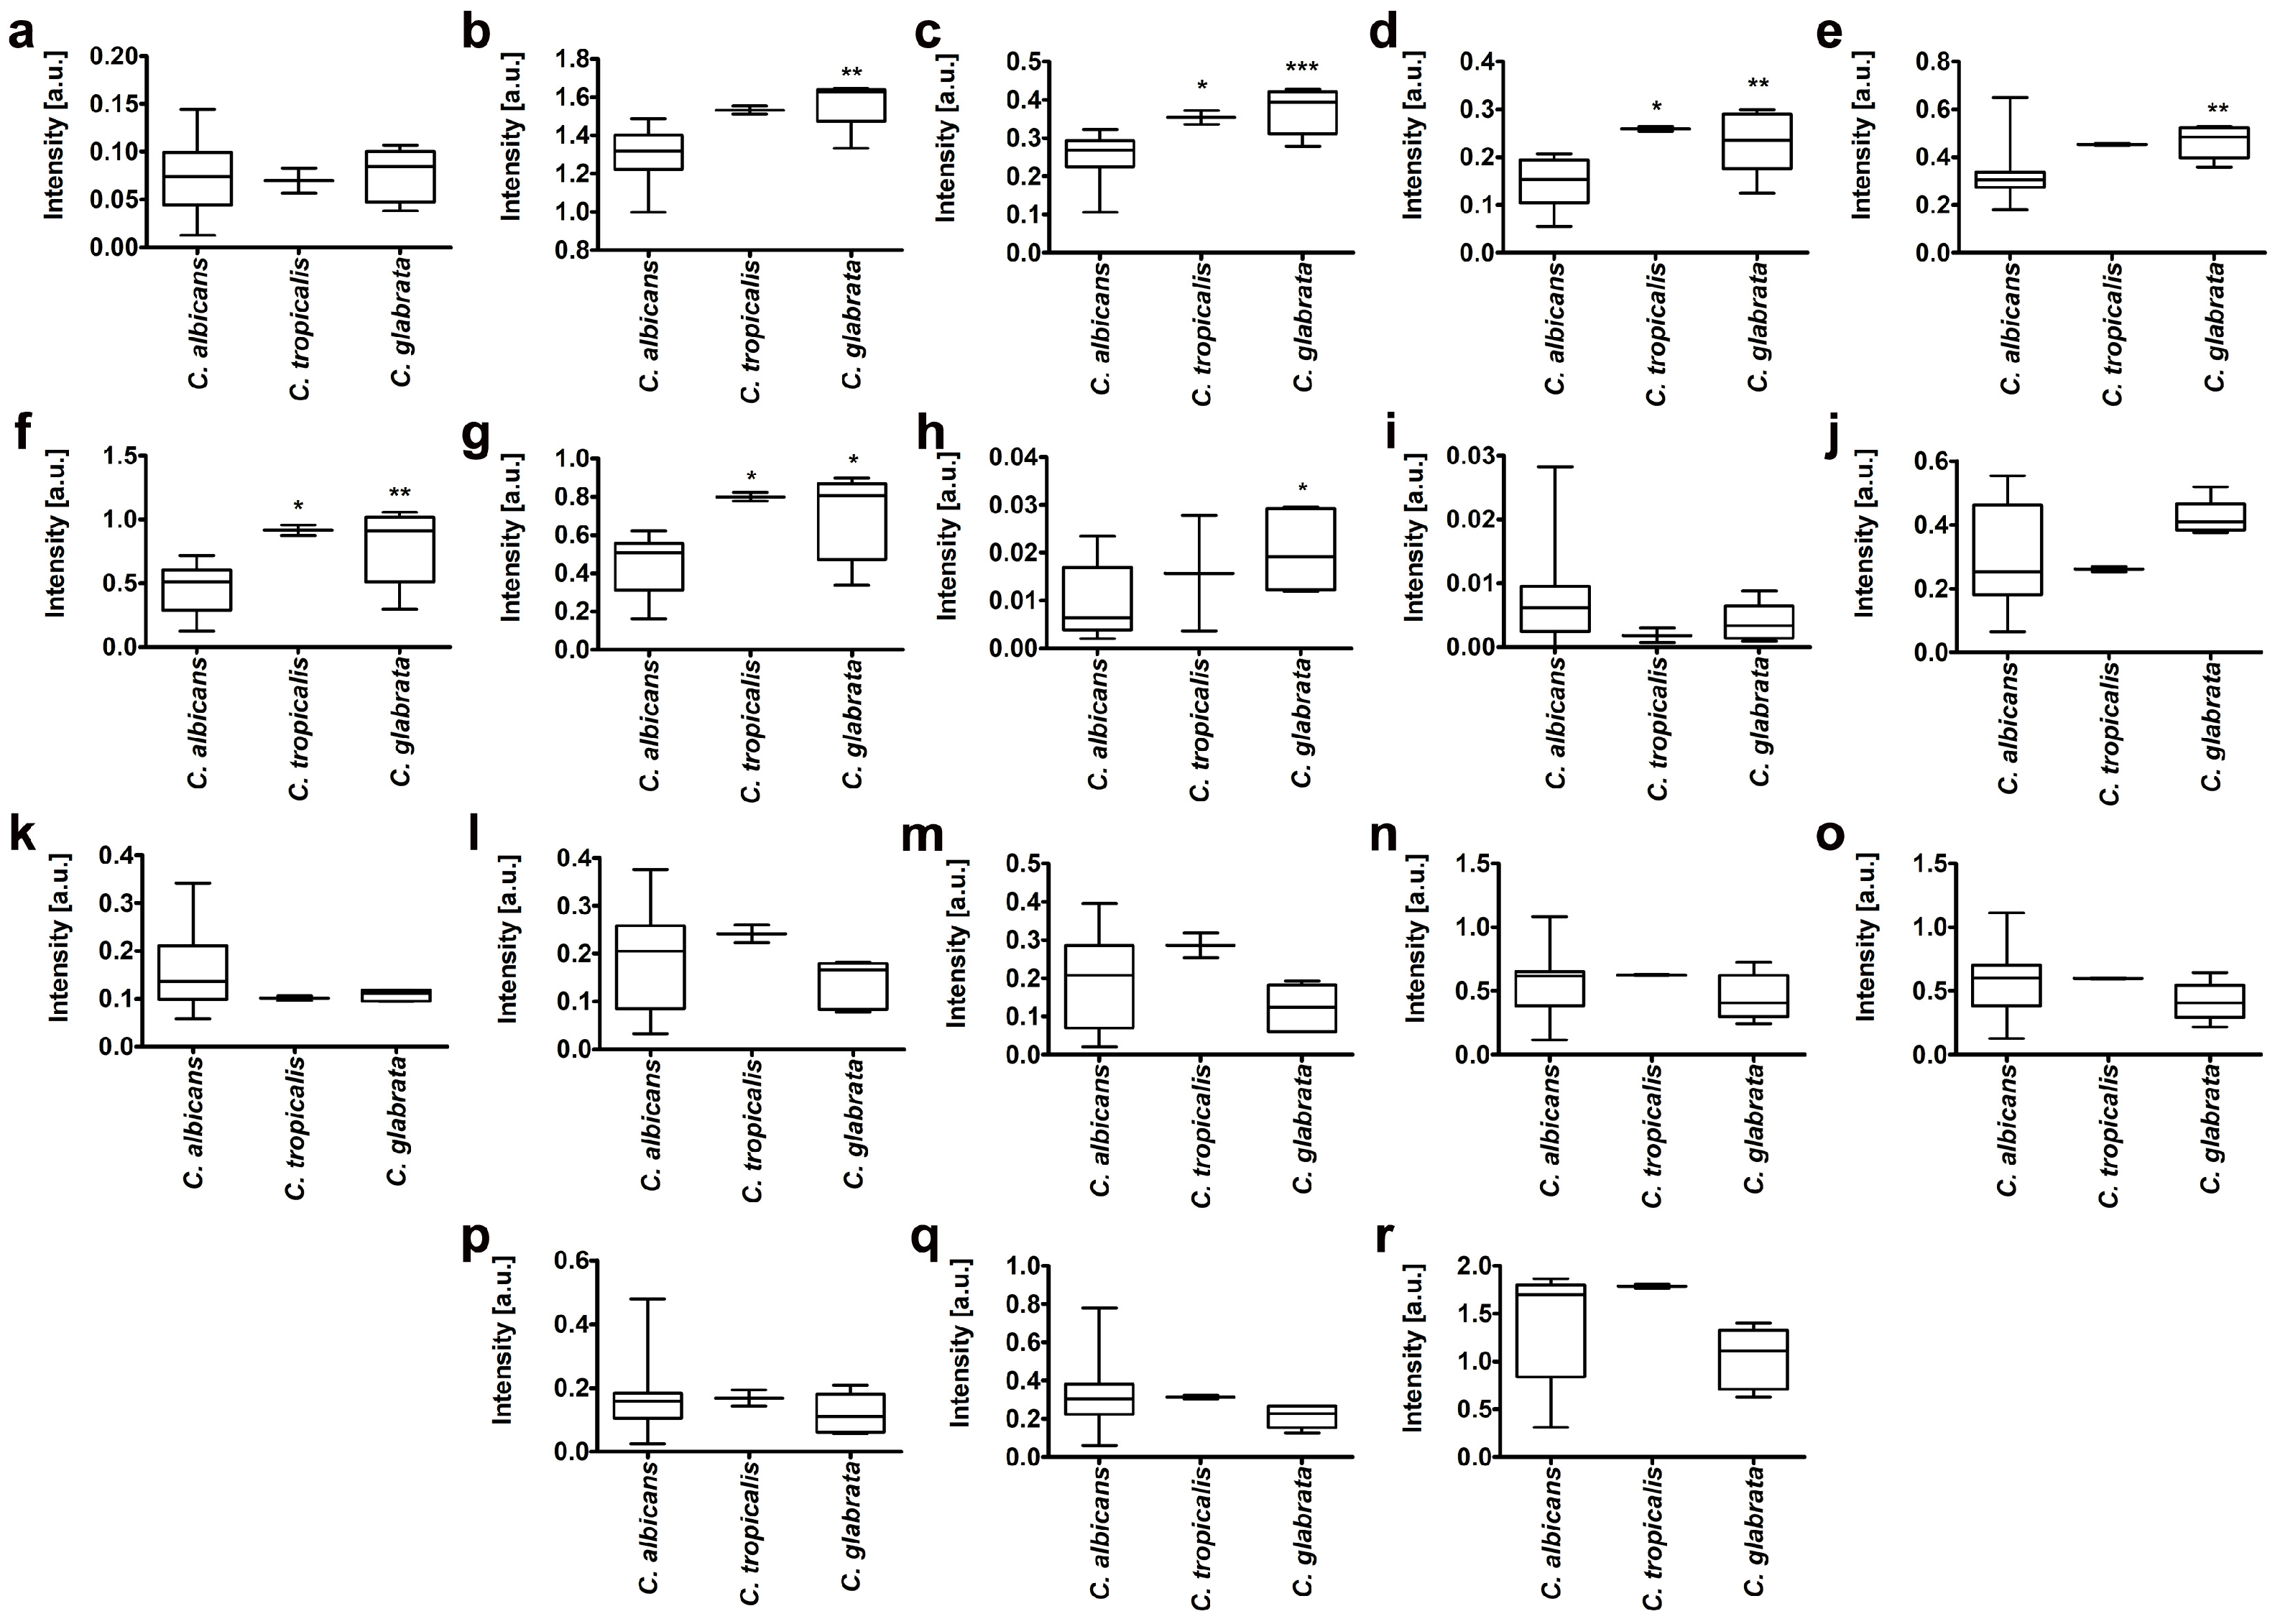
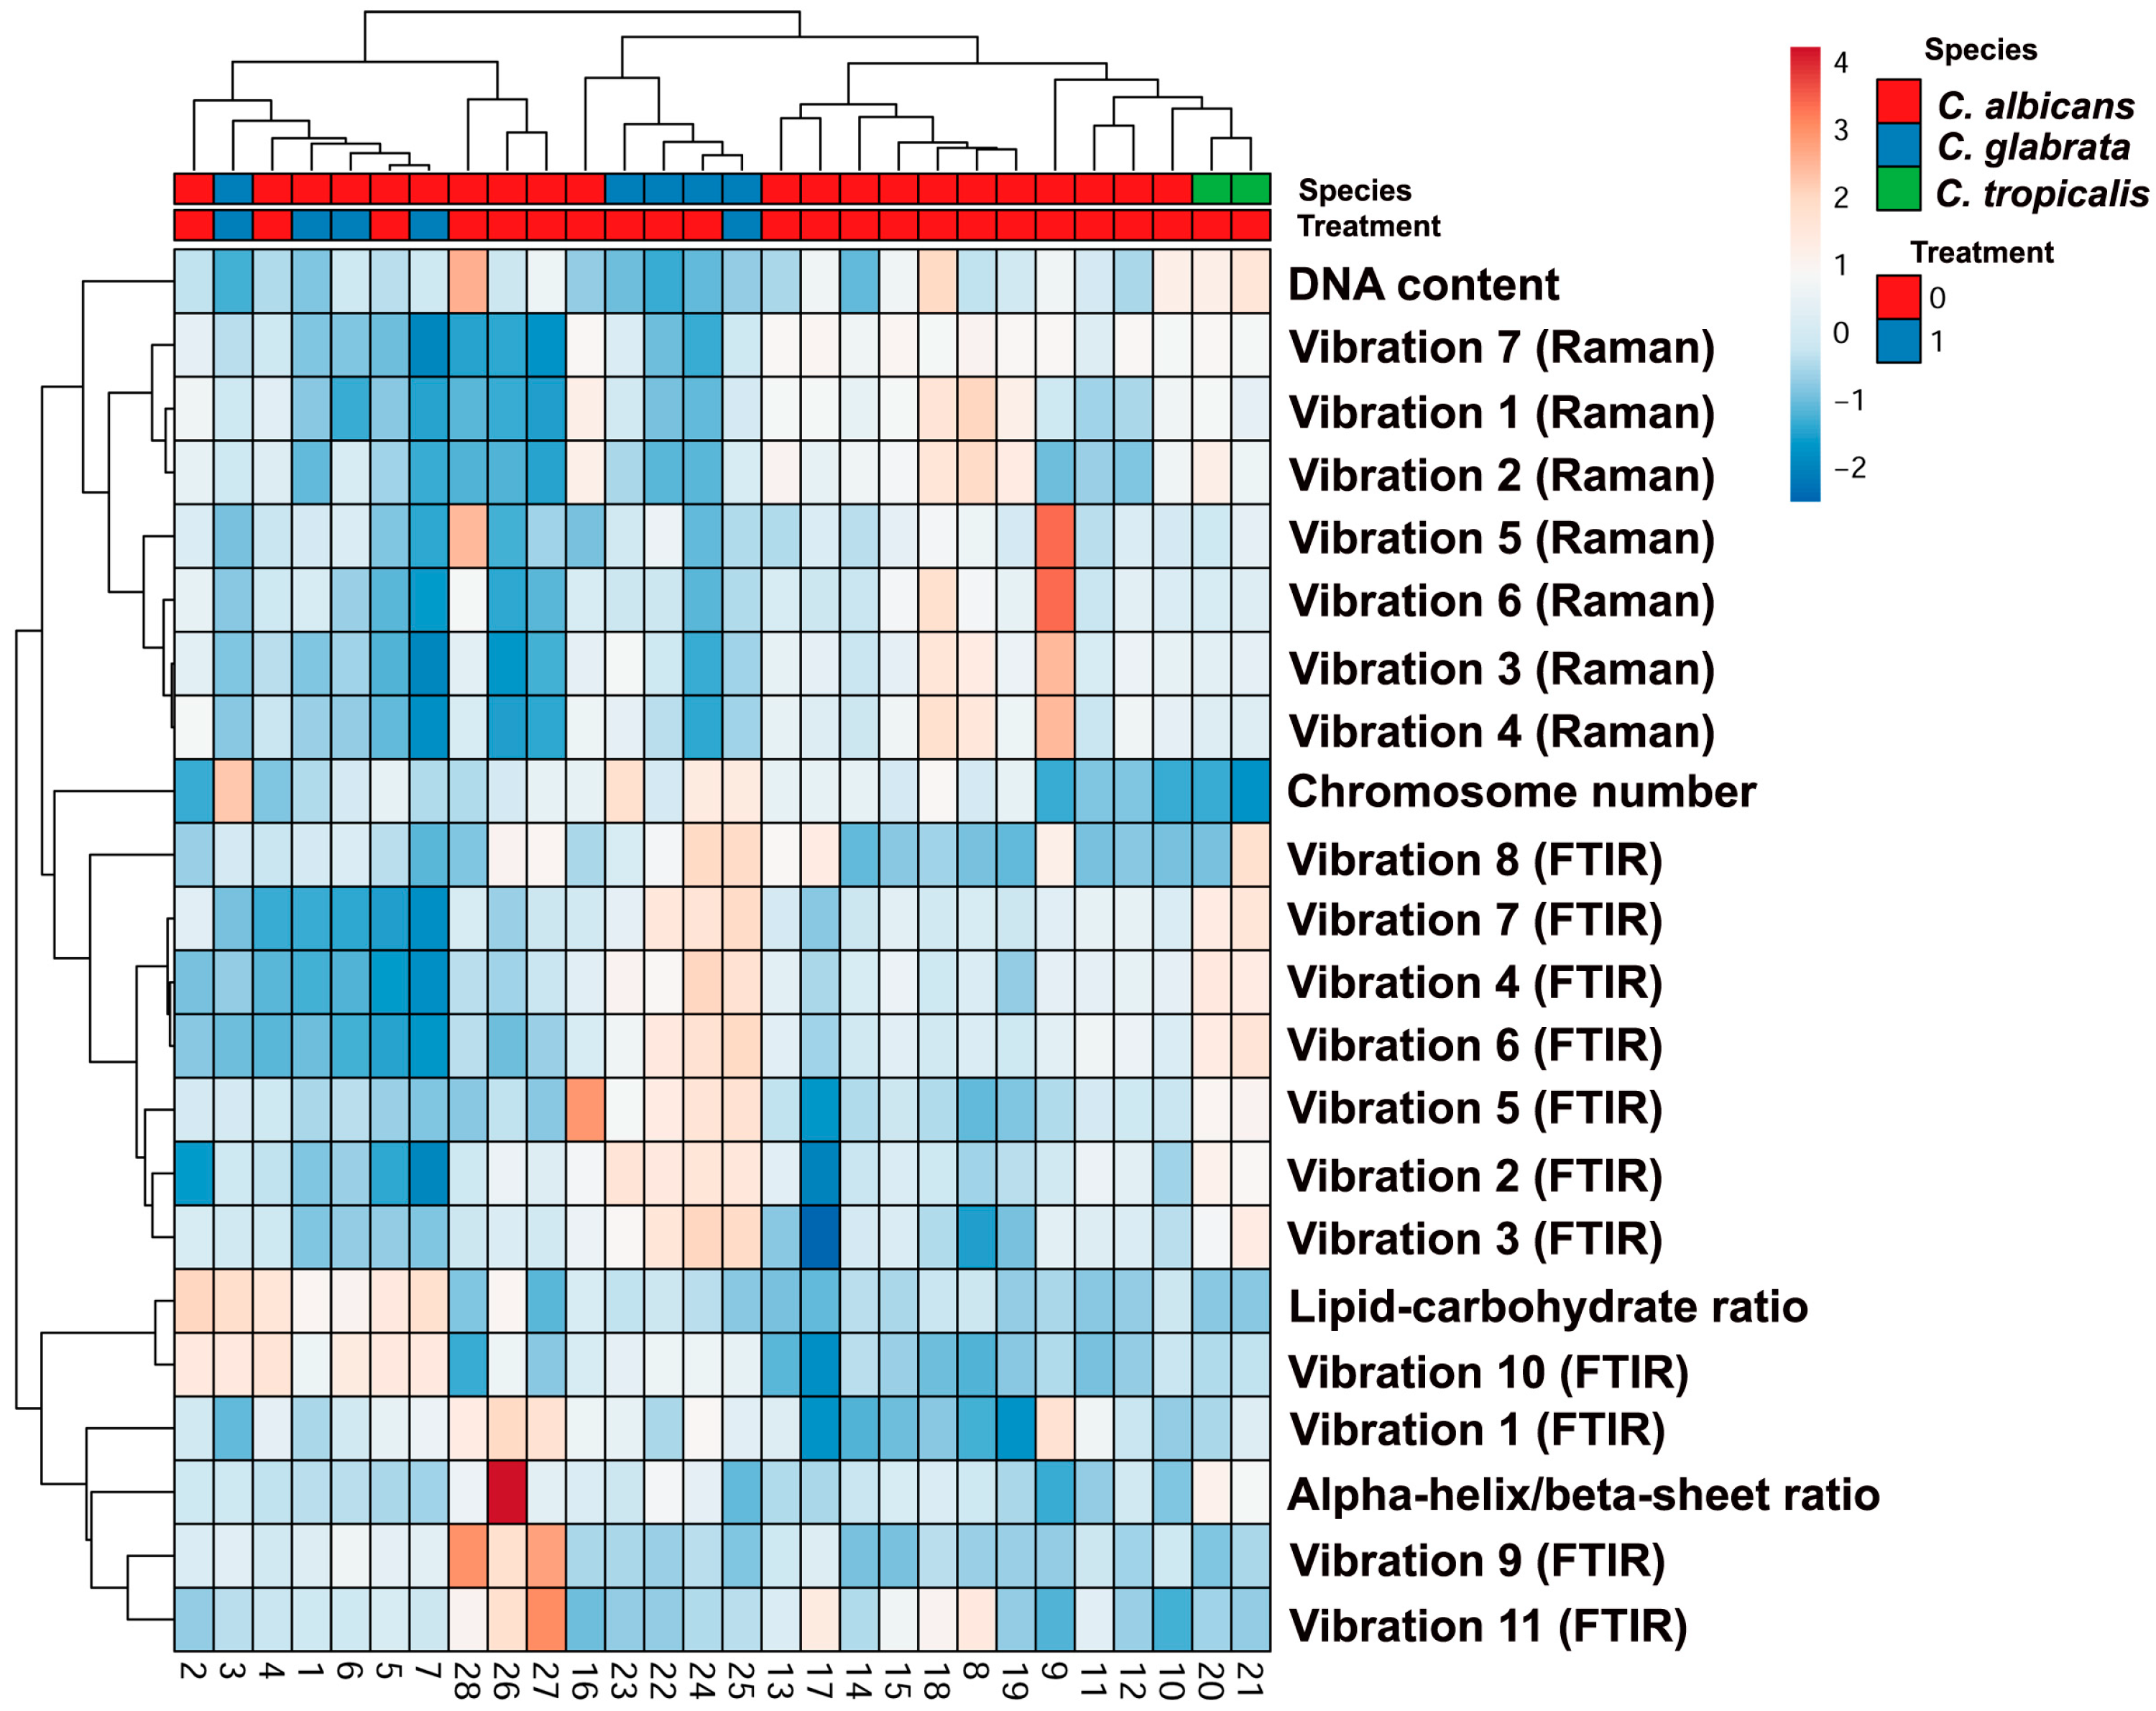
2.2. Biochemical Features Reflect Genomic Diversity and Plasticity of Candida Cells

We have then analyzed some biochemical features of clinical Candida isolates and we focused on elucidation of the usefulness of FTIR and Raman spectroscopy for Candida clinical isolate identification and determination of the effects of selected traits, such as karyotype polymorphism and DNA content on vibrational spectroscopy-based biochemical profiling. Initially, we considered the ability of Candida cells to accumulate glycogen (Figure 3).
We found that higher DNA content was correlated with higher glycogen storage as judged using C. albicans reference strains of different ploidy, namely n, 2n, and 4n cells (Figure 3b). Moreover, isolates of C. glabrata with relatively low DNA content were characterized by the lowest ability to accumulate glycogen (Figure 3a). In contrast, clinical C. tropicalis isolates with higher DNA content compared to C. glabrata cells (Figure 2) were found to accumulate the highest levels of glycogen among Candida cells considered (Figure 3a). Additionally, C. albicans samples, namely isolates 2, 10, and 18, with much higher DNA content compared to other C. albicans samples were characterized by much higher ability to accumulate glycogen (Figure 3a). As the DNA content may reflect biochemical/metabolic features in Candida isolates, we have then considered more sophisticated biochemical profiling using both FTIR and Raman spectroscopy (Figure 4).
In general, FTIR spectroscopy and Raman spectroscopy are used for analytical chemistry applications. More recently, vibrational spectroscopy has been used to characterize biological materials, especially in the field of biomedicine for the rapid differentiation, classification, identification and large-scale screening at subspecies level of clinically relevant microorganisms [54,55,56,57]. These reagentless and nondestructive techniques are based on the absorption (FTIR) or scattering (Raman) of light directed onto a sample and provide a highly specific spectroscopic fingerprints of microorganisms by which they can be identified [54,55,56,57], and also enable for a detailed structural analysis to identify certain intracellular macromolecules [58]. However, data on vibrational spectroscopic identification of clinical Candida isolates in parallel with karyotype profiling, DNA content analysis and routine diagnostic phenotypic identification are not available.
Typical FTIR and Raman spectra of Candida isolate 1 with marked individual vibrations corresponding to functional groups of nucleic acids, phospholipids, carbohydrates, proteins, and lipids are presented in Figure 4. In the FTIR spectrum (Figure 4a), peaks at wavenumbers 879 cm−1 and 1074 cm−1 are corresponding to C-O, C-O-H, and C-O-C deformation and C-C stretching vibrations of carbohydrates and β(1–3)glucans, nucleic acids and glycogen and PO2− symmetric stretching vibrations mainly from RNA [58,59,60], respectively. The peak at 1247 cm–1 originates from C-O asymmetric stretching vibrations in phospholipids [59]. Moreover, the vibration at 1290 cm−1 corresponds to amide III [59]. In the FTIR spectrum, peak at 1398 cm−1 originates from C=O of COO symmetric stretching vibrations in proteins and CH2 wagging vibrations in lipids and β(1–3)glucans [59]. The peaks at 1540 cm−1 and 1616 cm−1 correspond to amide II and amide I vibrations, respectively [58]. Furthermore, peaks at: 1735 cm−1, 2914 cm−1, and 2973 cm−1 originate from CH vibrations in lipids [61]. The last two peaks in the FTIR spectrum (3257 cm−1 and 3397 cm−1) correspond to OH vibrations from water and amide A from proteins, respectively [62]. Moreover, in the Raman spectrum (Figure 4b), the vibrations from symmetric benzene/pyrrole in-phase and out-of-phase breathing modes of tryptophan and phenylalanine (904 cm−1, 981 cm−1) are observed. Furthermore, peaks at 1317 cm−1 and 1459 cm−1 correspond to C-H deformation vibrations from proteins [63] and C-H deformation vibrations from lipids [63], respectively. In the Raman spectrum, a vibration at 1587 cm−1 originating from ring stretching vibrations of the deoxyribonucleotide adenosine monophosphate is observed [63]. Amide I vibrations in Raman spectrum are documented at 1648 cm−1 [63]. Moreover, a peak at 2929 cm−1 originates from C-H stretching vibration from lipids is observed [64]. FTIR and Raman spectra of all clinical isolates considered are presented in Supplemental Figure S1 and Supplemental Figure S2. The peak positions and information about vibrations for all samples are denoted in Supplemental Table S1. According to FTIR and Raman spectra, the differences in the signal intensity of functional groups as well as differences in the occurrence of these groups may be noticed (Supplemental Figure S1 and Supplemental Figure S2 and Supplemental Table S1). According to the differences in signal intensities of some selected vibrations of FTIR and Raman spectra, we have performed a comparative analysis between clinical samples belonging to three Candida species (Figure 5). We have considered 11 vibrations of the FTIR spectrum and seven vibrations of the Raman spectrum (Figure 5).
For seven vibrations of FTIR spectrum, we were able to obtain statistically significant differences in signal intensities between C. albicans isolates and other Candida isolates. These vibrations were: vibrations from β(1–3) glucans, nucleic acids and glycogen, PO2− symmetric stretching vibrations mainly from RNA; C-O asymmetric stretching vibrations from phospholipids and lipids; amide III: C–N and C–O stretching vibrations, N–H and O=C–N bending vibrations; C=O of COO symmetric stretching vibrations from proteins, CH2 wagging vibrations from lipids and β(1–3)glucans; amide II: mainly C–N stretching vibrations and N–H bending vibrations, amide I: mainly C=O stretching vibrations and contributions of N–H bending vibrations; C=O stretching vibrations from lipid esters (Figure 5). Protein components of clinical Candida isolates were also characterized. To determine a secondary protein structure, a deconvolution of FTIR amide I region was considered (Supplemental Figure S3). The abundance of α and β structures, as well as the ratio of α/β structures within analyzed peak were calculated (Supplemental Table S2). C. tropicalis group was characterized by higher ratio of α/β structures compared to other Candida groups (Supplemental Table S2). The lipid-carbohydrate ratio was also analyzed in clinical Candida isolates (Supplemental Table S3) that was calculated on the basis of peak area corresponding to lipid and carbohydrate vibrations (Supplementary Table S4). In general, within C. tropicalis and C. glabrata groups, the lipid-carbohydrate ratio was comparable and the variability was rather slightly accented. In contrast, C. albicans group was characterized by a diverse lipid-carbohydrate ratio, e.g., ranging from 0.16 to 0.93 (Supplemental Table S3).
More recently, the quantitation of ergosterol content has been established as a novel method for determination of fluconazole susceptibility of C. albicans [65]. Azole stress has been also reported to cause upregulation of genes involved in sterol uptake and biosynthesis in C. glabrata [66]. Fluconazole treatment resulted in increased mRNA levels of ergosterol biosynthetic genes, namely CgERG2, CgERG3, CgERG4, CgERG10, and CgERG11 and sterol influx transporter AUS1 and sterol metabolism regulators SUT1 and UPC2 in C. glabrata [66]. Moreover, stimulation with exogenous source of cholesterol or ergosterol conferred resistance to fluconazole and voriconazole in C. glabrata [66]. As ergosterol abundance may modulate azole antifungal resistance in clinical Candida isolates, we decided then to analyze ergosterol content using both FTIR and Raman spectroscopy (Figure 6).
Representative FTIR and Raman spectra of ergosterol are presented in Figure 6a,b, respectively. Using FTIR spectroscopy, similar levels of ergosterol were revealed in all analyzed samples (Figure 6c). However, using Raman spectroscopy, we were able to show differences in the content of ergosterol (Figure 6c). For ergosterol content analysis, we have selected a peak at 1459 cm−1 instead of a peak at 1602 cm−1 [67] to rule out the possibility of some overlapping with protein signals. The most diverse group in term of ergosterol content was C. albicans group, e.g., sample 7 was characterized by eight times lower levels of ergosterol than sample 9 (Figure 6c).
We have then considered principal component analysis (PCA) and hierarchical cluster analysis (HCA) using both FTIR and Raman spectra (Figure 7).
For PCA, we have selected lipid-carbohydrate ratio and α/β structure ratio (Figure 7a,b). According to FTIR spectra (Figure 7a), isolates from C. tropicalis (samples 20 and 21) and C. glabrata (samples 22 to 25, but not sample 3) species were grouped together within their own categories, whereas C. albicans group was found to be diverse with several separated subgroups, e.g., a subgroup that consists of samples 1, 2, 4–7 or a subgroup that consists of samples 14, 17, and 19 that was also grouped with a haploid reference strain (sample 26). Raman spectra-based PCA did not reveal similar clustering (Figure 7b). We have then considered HCA based on FTIR spectra from 500 to 4000 cm−1 and Raman spectra from 500 to 3000 cm−1 (Figure 7c,d). According to FTIR spectra, Candida isolates were grouped into previously assigned species, namely C. albicans, C. tropicalis, and C. glabrata (Table 1, Figure 7c). Similarly to PCA, several subgroups of C. albicans group were documented, e.g., one containing samples from 1 to 2 and from 4 to 7 and second with samples from 8 to 19 without sample 17 that was grouped as its own category (Figure 7c). In general, such clustering also reflected the differences in DNA content among C. albicans group (Figure 2). In contrast, Raman spectra-based HCA did not provide discrimination between Candida species (Figure 7d).
There are several reports on vibrational spectroscopy identification of clinical Candida isolates, but none of them provide a comparison with karyotype profiling and DNA content analysis. The difficulty of differentiating at the strain level, especially when high accumulated doses of an antifungal agent are involved, has been documented while analyzing FTIR spectra of pathogenic C. albicans isolates from HIV-positive patients [28]. Using FTIR spectroscopy, six species (C. albicans, C. glabrata, C. parapsilosis, C. tropicalis, C. krusei, and C. kefyr) from a collection of 57 clinical strains of Candida and isolated from hospitalized patients were identified with a classification rate of 100% for both microcolonies and 24 h cultures [29]. More recently, next generation sequencing (NGS) of ITS and D1/D2 LSU marker regions together with FTIR spectroscopy were applied to identify 256 pathogenic strains belonging to Candida genus [30]. Strains of C. albicans, C. parapsilosis, C. glabrata, and C. tropicalis were identified with high-throughput NGS sequencing of ITS and LSU markers and then with FTIR, and total percentage of correct identification reached 97.4% for C. albicans and 74% for C. parapsilosis while the other two species showed lower identification rates [30]. The authors concluded that the identification success increases with the increasing number of strains actually used in the PLS analysis [30].
A set of 42 Candida strains comprising five species that are frequently encountered in clinical microbiology was also considered to analyze the usefulness of confocal Raman microspectroscopy for the rapid identification of Candida species [32]. Using multivariate statistical analyses, a high prediction accuracy (97 to 100%) was documented [32]. The authors concluded that confocal Raman microspectroscopy offers a rapid, accurate, and easy-to-use alternative for the identification of clinically relevant Candida species [32]. Raman spectroscopy has been also found an accurate and rapid (12–24 h) alternative for the identification of Candida spp. in peritonitis patients [31].
Finally, we have considered a joined clustering analysis of chromosome number, DNA content, the intensities of 11 vibrations of FTIR spectrum and seven vibrations of Raman spectrum, alpha-helix/beta-sheet ratio, and lipid-carbohydrate ratio (Figure 8).
Using this approach, we were able to discriminate between Candida species considered (Figure 8). One exception was sample 3, C. glabrata species that was classified within C. albicans group (Figure 8). However, this result may be due to fluconazole treatment (Table 1, Figure 8).
Taken together, we have shown for the first time that vibrational spectroscopy-based biochemical profiling reflected genomic diversity (karyotype patterns, DNA content) of 25 clinical Candida isolates (Figure 8). However, using FTIR or Raman spectroscopy as isolated methods for Candida species identification may be limited. FTIR- as well as Raman-based clustering analysis (Figure 7) yielded ambiguous results that were not entirely comparable to karyotype profiling-based clustering analysis (Figure 1c). Thus, only joined clustering analysis of chromosome number, DNA content and vibrational spectroscopy-based biochemical profiling may allow for grouping together the clinical Candida isolates from the same species (Figure 8). The usefulness of vibrational spectroscopy methods for characterization and identification of clinical Candida isolates is also summarized in Figure 9.
We also postulate that Raman spectroscopy can be adapted for rapid and accurate analysis of ergosterol content in clinical Candida isolates and thus may provide information on azole resistance/susceptibility (Figure 9). Vibrational spectroscopy-based data may be included in global spectral databases for identification purposes and may facilitate diagnosis and targeted therapy of candidiasis (Figure 9). Indeed, limited use of vibrational spectroscopy-based techniques for medical diagnostics seems to be due to the absence of reliable and validated libraries linked to taxonomically sound identification procedure [30]. More recently, it has been postulated that such libraries should include several tens of strains for each relevant species and the panel of strains needs to be composed of well-identified strains, e.g., deriving from diverse sources and collected over an extensive time period [30]. Postulated approach would require a multidisciplinary effort of specialists working in strain isolation and maintenance, molecular taxonomy, vibrational spectroscopy-based techniques, data management and data basing [30].

3. Materials and Methods

3.1. Ethics Statement

This study was approved by the Ethics Committee of the Faculty of Medicine, University of Rzeszow, Poland (approval code 2018/06/03, approved on 14 June 2018). All samples were analyzed anonymously. Clinical Candida species isolates were obtained from the Clinical Microbiology Laboratory (Department of Diagnostic Medicine, Provincial Medical Specialist Unit, Rzeszow, Poland).

3.2. Clinical Specimens and Reference Strains

A total of 25 clinical samples used in this study are listed in Table 1. Clinical isolates were originated from human bronchoalveolar lavage, sputum, pharynx, wound, urine, and vagina. Patient 1 and patients 3, 6, 8, and 25 had been treated with voriconazole and fluconazole, respectively (Table 1). The following three Candida albicans strains of known ploidy were used as reference strains: C. albicans 302 (haploid), C. albicans SC5314 (diploid), and C. albicans T15 (FH6, tetraploid but trisomic for chromosomes 2/3 with multiple copies of chromosome 5L) [49]. The reference strains were a generous gift from Prof. Judith Berman (Department of Molecular Microbiology and Biotechnology, Tel Aviv University, Israel).

3.3. Culture Conditions and Species Identification

For identification of Candida species, clinical samples were diluted in 0.9% NaCl (Sigma-Aldrich, Poznan, Poland) and evaluated under a light microscope, e.g., the presence of hyphae, pseudohyphae and yeast cells was considered, and spread onto Sabouraud Dextrose Agar (SDA) plates (bioMerieux, Warsaw, Poland). Yeast cells were cultured at 25 °C and at 37 °C for seven days and morphological features were then assessed. Species identification was based on the API® Candida biochemical test (bioMerieux, Warsaw, Poland) and DNA sequencing. For DNA isolation, clinical isolates were inoculated in 20 mL of Sabouraud dextrose broth (BTL, Lodz, Poland) under shaking conditions at 29 °C to obtain log-phase cultures. Five milliliters of overnight culture was centrifuged (5000× g) at 4 °C for 10 min. The cells were washed twice with 20 mM phosphate buffer, 1 mM EDTA, pH 7.5 and resuspended in 1 mL of extraction buffer (1 M sorbitol, 0.1 M EDTA, pH 7.5). For spheroplast preparation, zymolyase (1 mg/mL) was then added and samples were incubated at 37 °C for 30 min. The spheroplasts were then centrifuged and resuspended in 500 μL of lysis buffer (50 mM Tris-HCl pH 7.5, 20 mM EDTA, pH 8.0) containing 50 μL of 10% SDS. The mixture was incubated at 65 °C for 10 min and then 200 μL of 5 M potassium acetate was added. The samples were incubated on ice for 5 min and centrifuged (13,000 rpm) for 10 min. The supernatant was transferred to a new tube and then an equal volume of isopropanol was added. Samples were centrifuged (13,000 rpm) for 10 min and the supernatant was subsequently removed. DNA pellets were washed using 95% and 70% ethanol and then dried in a SpeedVac (Thermo Fisher Scientific, Warsaw, Poland). Obtained DNA samples were resuspended in 40 μL of ultrapure DNase⁄RNase-free distilled water and stored at −20 °C until use. The genomic DNA concentration and purity were assessed by using A260/A280 ratio using NanoDrop™ 2000 Spectrophotometer (Thermo Fisher Scientific, Warsaw, Poland). ITS-PCR was carried out in 50 μL reaction volume using ready to use PCR Master Mix (A&A Biotechnology, Gdynia, Poland) and ITS1 primer (5′-TCCGTAGGTGAACCTGCGG-3′, Genomed, Warsaw, Poland) and ITS4 primer (5′-TCCTCCGCTTATTGATATGC-3′, Genomed, Warsaw, Poland). Each reaction mixture contained 300 ng of DNA, 1x PCR Mix with 0.5 mM dNTP (dATP, dCTP, dGTP, dTTP), 2.5 U recombinant DNA polymerase, and 0.1 μM of forward (ITS1) and reverse (ITS4) primers. Eppendorf MastercyclerTM PCR system (Eppendorf, Warsaw, Poland) was used with initial denaturation at 95 °C for 3 min, followed by 30 cycles of denaturation at 95 °C for 30 s, annealing at 55°C for 1 min, extension at 72 °C for 1 min and a final extension step at 72 °C for 5 min. The products of Sanger sequencing were subjected to capillary electrophoresis (Genomed, Warsaw, Poland) and the sequencing reads were analyzed using NCBI nucleotide sequence database (BLASTN option).
Drug susceptibility was evaluated using an ATB FUNGUS 3 strip (bioMerieux, Warsaw, Poland) that consists of 16 pairs of cupules including two growth control wells and five antifungal drugs at different concentrations: 5-flucytosine (4–16 µg/mL), amphotericin B (0.5–16 µg/mL), fluconazole (1–128 µg/mL), itraconazole (0.125–4 µg/mL), and voriconazole (0.06–8 µg/mL). After identification, C. albicans, C. tropicalis, and C. glabrata cells were routinely cultured using YPD medium (1% w/v Difco Yeast Extract, 2% w/v Difco Yeast Bacto-Peptone, 2% w/v dextrose) (BD Biosciences, Sparks, MD, USA) from single colonies either on liquid YPD medium or on solid YPD medium containing 2% w/v Difco Bacto-agar, at 28 °C. For vibrational spectroscopy-based biochemical profiling, 4 μL of Candida cell suspensions at 108 cells/mL were used.

3.4. Preparation of Agarose-Embedded Yeast DNA

Yeast DNA, isolated from cells at a logarithmic phase of growth (3 × 10⁸ cells), was obtained using BIORAD CHEF Yeast Genomic DNA Plug Kit (BIORAD, Warsaw, Poland) using a standard protocol [15] according to the manufacturer’s instructions, with minor modifications. Briefly, instead of standard lyticase solution, a mix of standard lyticase and zymolyase 100T, 125 μg/mL (US Biological, Salem, MA, USA), and overnight incubation at 37 °C was used for spheroplast preparation and prolonged proteinase K treatment (48 h at 50 °C) was applied for protein digestion.

3.5. Pulsed-Field Gel Electrophoresis (PFGE)

Contour clamped homogeneous electric field (CHEF)-PFGE separation of yeast whole chromosomes was performed on a 1% agarose gel in 0.5× TBE according to the manufacturer’s instructions using CHEF-DR®III Pulsed Field Electrophoresis System (BIORAD, Warsaw, Poland) and the following conditions: 60 to 120 s switch, 6 V cm−1, 120° angle for 36 h, followed by 120 to 300 s switch, 4.5 V cm–1, 120° angle for 12 h. After CHEF-PFGE separation, yeast chromosomes were stained using ethidium bromide. The dendrogram of chromosomal DNA-based similarity was created using Free-Tree software [68] using neighbor-joining (NJ) method with Sokal-Sneath-Anderberg matrix and FigTree tree figure drawing tool (http://tree.bio.ed.ac.uk/software/figtree/) (access on 12 September 2018).

3.6. DNA Content Analysis

Yeast cells from log phase cultures were diluted to 107 cells/mL and fixed with 70% ethanol at −21 °C for 24 h. After incubation, the cells were washed with PBS and resuspended in 500 μL of spheroplast buffer, spread onto slides and permeabilized with PBS containing 0.1% Triton X–100. The slides were treated with 100 μg/mL RNAse (Sigma-Aldrich) in 2× saline sodium citrate (SSC) buffer in a humidified chamber at 37 °C for 1 h for enhanced results. Next, the slides were washed three times in PBS buffer. For DNA visualization, the slides were counterstained with a drop of mounting medium containing 4′,6′-diamino-2-phenylindole (DAPI) (Cambio, Cambridge, UK) and then analyzed using an Olympus BX61 fluorescence microscope equipped with a DP72 CCD camera and Olympus CellF software (Olympus, Warsaw, Poland). The CCD capture conditions were as the following: exposure time 150 ms, 100× oil immersion objective. DAPI fluorescent signals were collected using DAPI filters (λex = 345 nm, λem = 455). Fluorescence microscopy was adapted for DNA content analysis. ImageJ software (http://rsbweb.nih.gov/ij/) (access on 29 July 2018). was used to analyze the nuclear DNA content. DNA content was expressed as arbitrary units [a.u.].

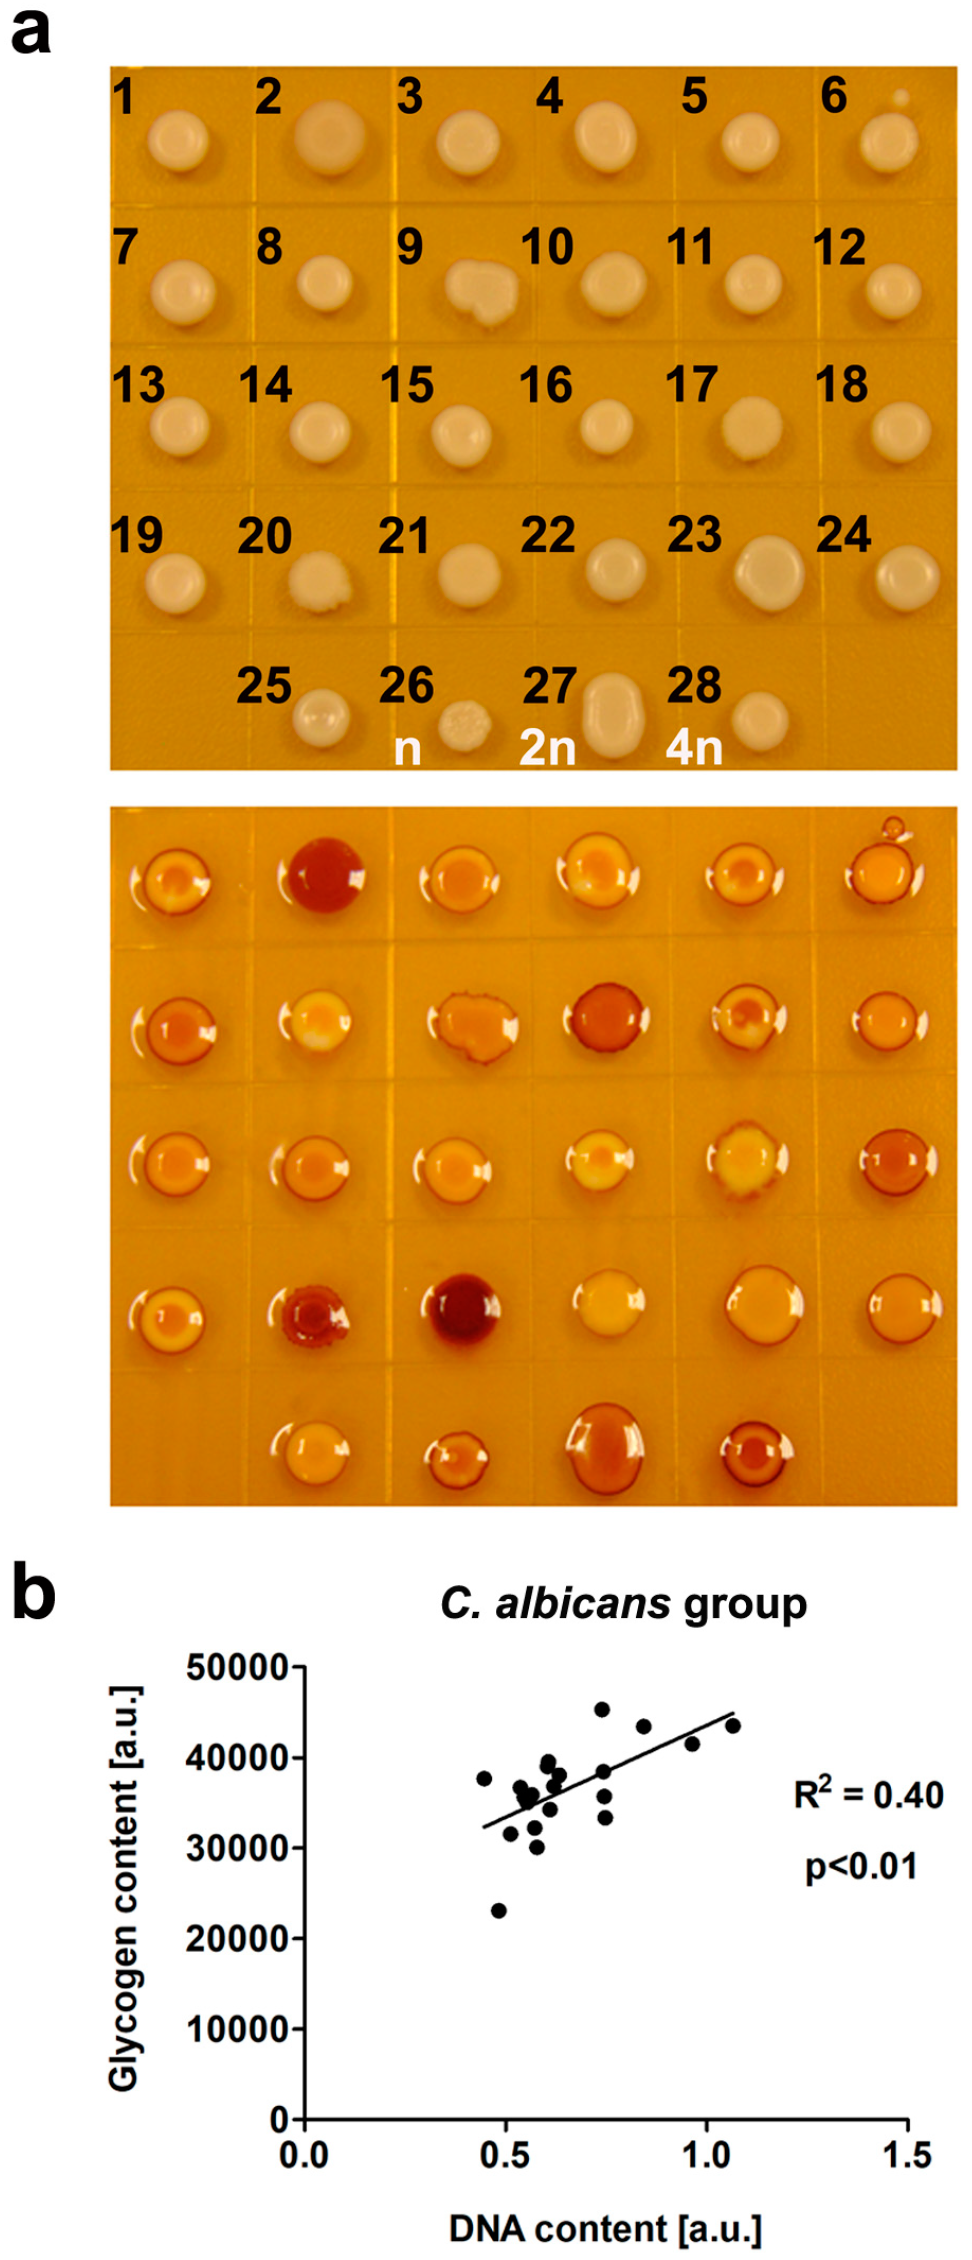
3.7. Glycogen Storage Assay

The ability of yeast cells to accumulate glycogen was evaluated using iodine staining of yeast colonies [69] on the basis that glycogen gives a reddish-brown coloration with iodine. Briefly, 2 µL of Candida cell suspensions at 107 cells/mL were inoculated on solid YPD medium and glycogen storage was detected by flooding 3-day colonies with 5 mL of iodine solution (0.2% I2 in 0.4% KI). The staining reactions of the colonies were recorded 1 min after adding the iodine and glycogen content [a.u.] was calculated using ImageJ software (http://rsbweb.nih.gov/ij/) (access on 12 July 2018). Correlation between glycogen content (a.u.) and DNA content (a.u.) was considered. Correlation analysis of the data was performed using linear correlation (Pearson r) test.

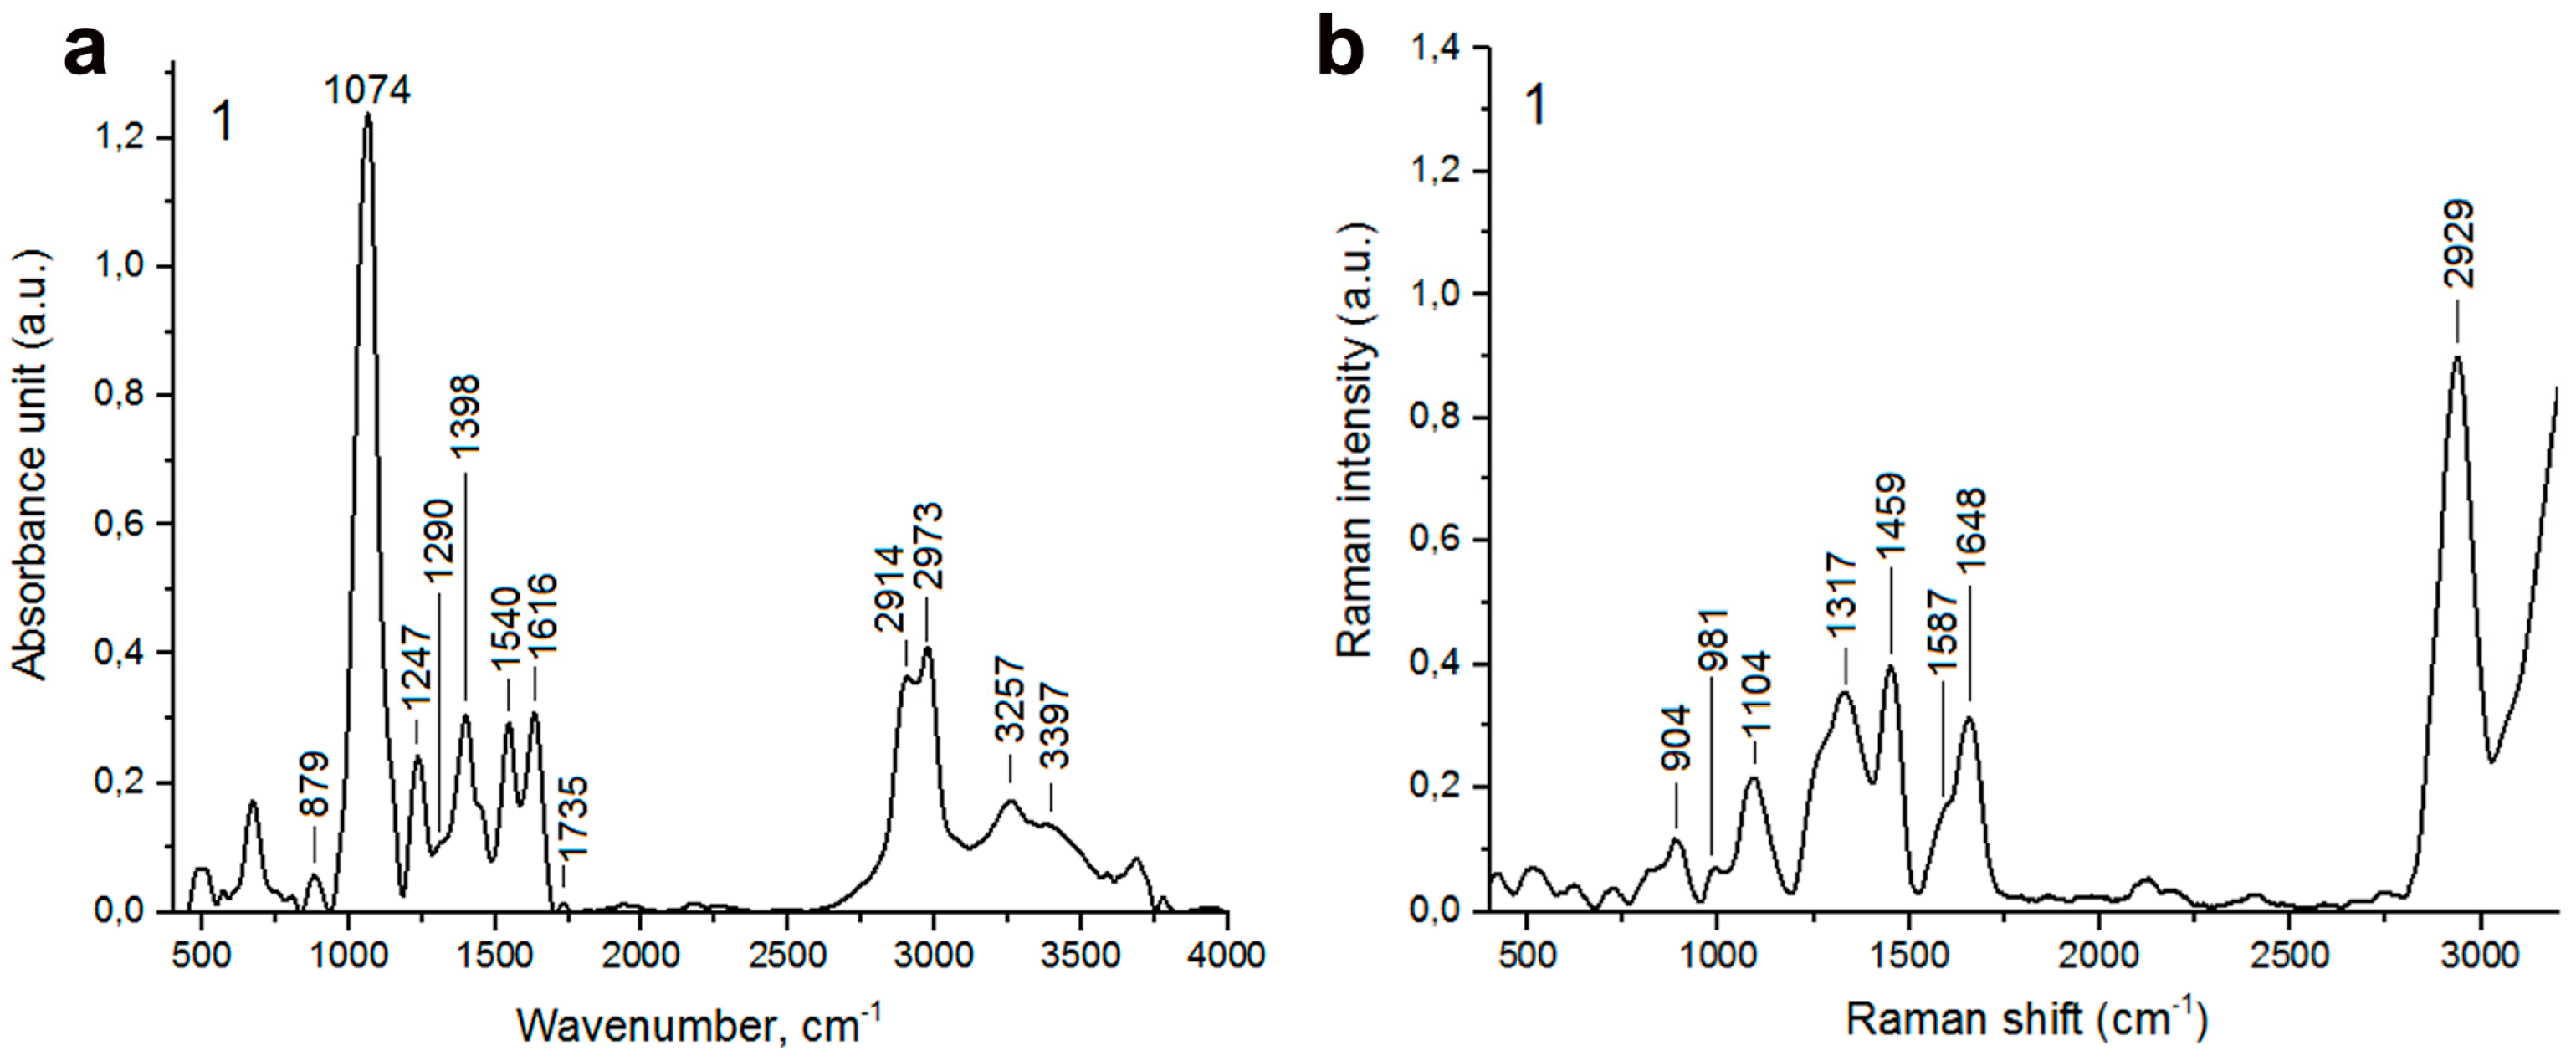
3.8. FTIR Spectroscopy

Fourier-transform infrared (FTIR) spectroscopy measurements were performed using the Vertex 70 (Bruker, Poznan, Poland) spectrometer using the attenuated total reflectance (ATR) technique. The range of selected infrared radiation was the average IR (400–4000 cm−1). 32 scans with 2 cm–1 spectral resolution were performed. Normalization and baseline correction of obtained spectra were considered. All spectra were analyzed using OPUS software (Bruker, Poznan, Poland).

3.9. Deconvolution of Amide I region (1600–1700 cm−1)

The secondary protein structure was analyzed by means of curve fitting using MagicPlot 2.1. software (https://magicplot.com/downloads.php) (access on 3 July 2018). First, the secondary derivative spectra were determined based on the ATR-FTIR spectra to determine the initial peak positions for curve fitting, and the peaks were fitted using Gaussian function. The area under the curve was considered 100% and each component was expressed as its percentage after fitting.

3.10. Raman Spectroscopy

FT-Raman spectra were recorded using a Nicolet NXR 9650 FT-Raman Spectrometer equipped with an Nd:YAG laser (1064 nm) and a germanium detector. Measurements were performed in the range of 150 to 3700 cm−1 with a laser power of 1.5 W. An unfocused laser beam of a diameter of approximately 100 μm and a spectral resolution of 8 cm−1 was used. Raman spectra were processed by the Omnic/Thermo Scientific software based on 64 scans.

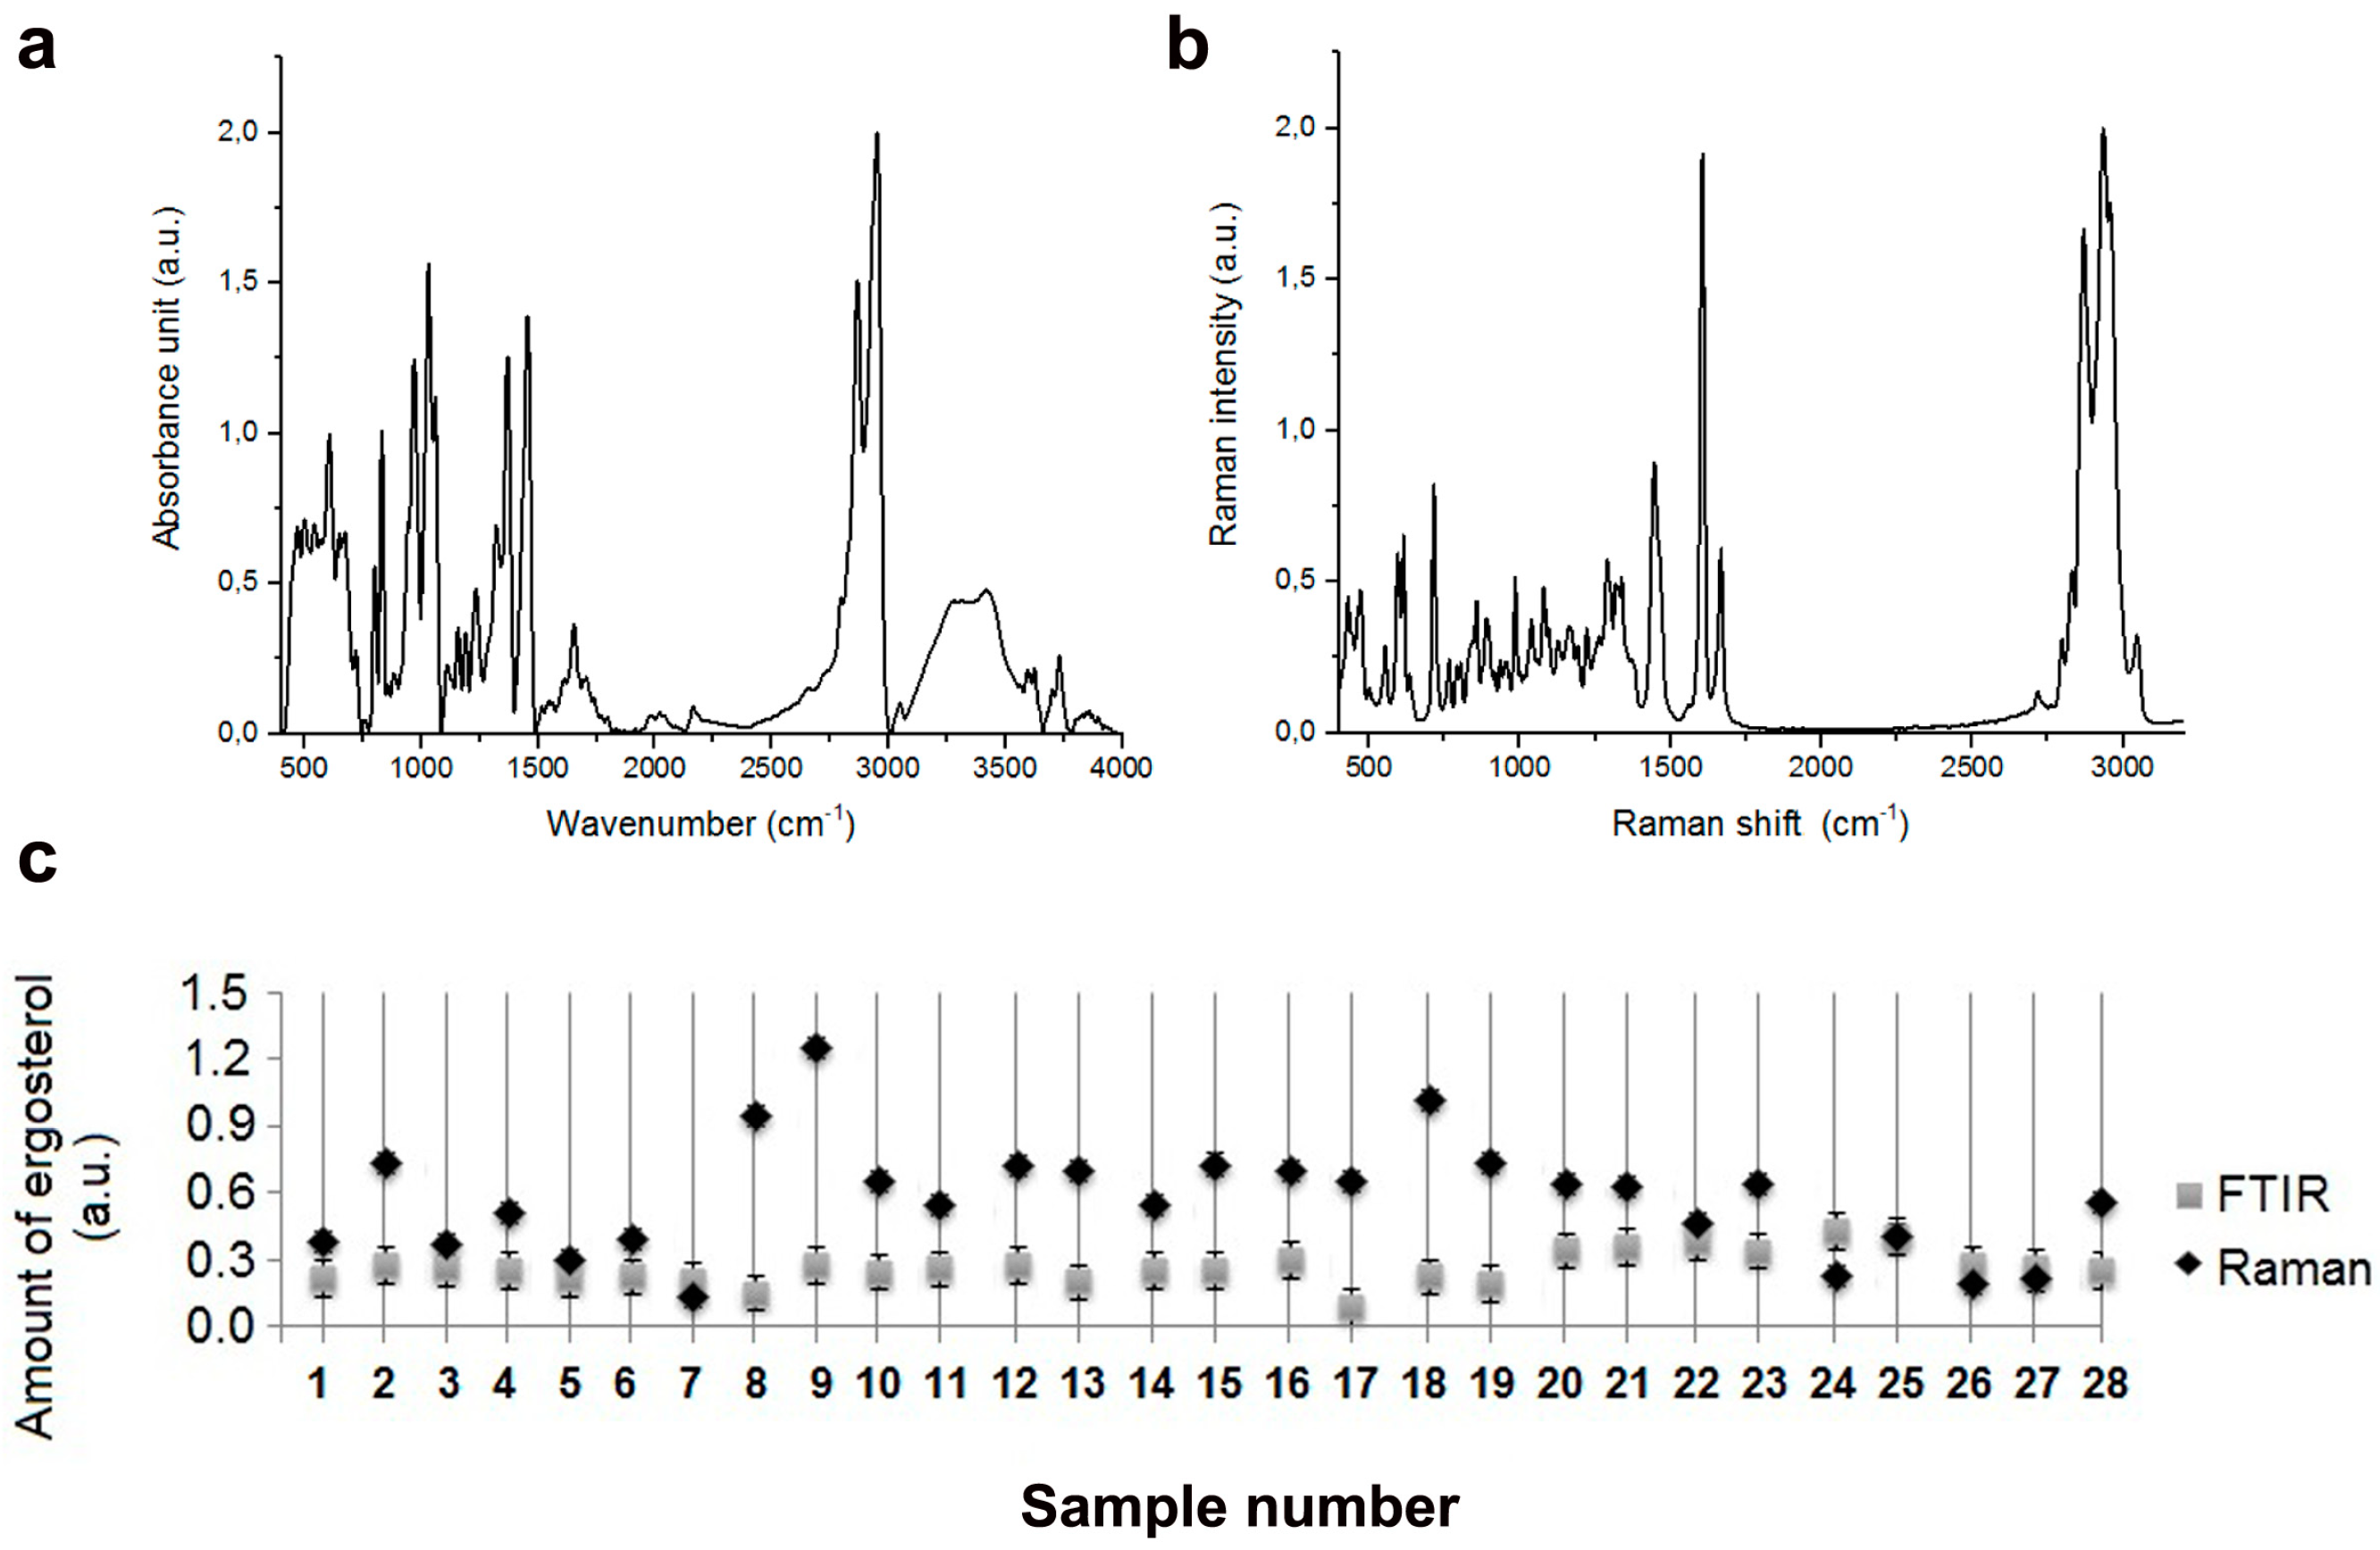
3.11. Lipid-Carbohydrate Ratio

To evaluate lipid-carbohydrate ratio, an area of peaks corresponding to lipid and carbohydrate vibrations were calculated [70]. The sum of the lipid as well as carbohydrate peak area were then calculated and the ratio of the sum of lipid and carbohydrate was calculated. To evaluate lipid-carbohydrate ratio, ORIGIN software was used.

3.12. Ergosterol Content

To estimate the levels of ergosterol, FTIR and Raman spectra of ergosterol were obtained. Ergosterol (Sigma-Aldrich, Poznan, Poland) was used as a reference standard. The value of intensity of individual peak from FTIR as well as Raman spectra at 1247 cm−1 and 1459 cm−1, respectively, was considered.

3.13. Multivariate Data Analysis

All obtained spectra were subjected to multivariate analysis using principal component analysis (PCA) and hierarchical cluster analysis (HCA) using PAST 3.0. software. HCA was based on Euclidean distance and Ward’s algorithms. The PCA and HCA were performed for all FTIR as well as Raman spectral ranges.
Moreover, a joined clustering analysis of chromosome number, DNA content, 11 vibrations of FTIR spectrum, seven vibrations of Raman spectrum, alpha-helix/beta-sheet ratio and lipid-carbohydrate ratio was performed using ClustVis, a web tool for visualizing clustering of multivariate data (BETA) (https://biit.cs.ut.ee/clustvis/) (access on 3 September 2018). [71]. Species clustering as well as antifungal treatment were included. A heat map was generated on the basis of karyotype profiling, DNA content analysis and signal intensities of some selected vibrations of FTIR and Raman spectra, namely FTIR vibrations: (1) C–O, C–O–H, and C–O–C deformation and C–C stretching vibrations from carbohydrates, (2) β(1–3) glucans, nucleic acids and glycogen, PO2– symmetric stretching vibrations mainly from RNA, (3) C–O asymmetric stretching vibrations from phospholipids and lipids, (4) amide III: C–N and C–O stretching vibrations, N–H and O=C–N bending vibrations, (5) C=O of COO symmetric stretching vibrations from proteins, CH2 wagging vibrations from lipids and β(1–3) glucans, (6) Amide II: mainly C–N stretching vibrations and N–H bending vibrations, (7) amide I: mainly C=O stretching vibrations and contributions of N–H bending vibrations, (8) C=O stretching vibrations from lipid esters, (9) CH2 stretching vibrations from lipids, (10) CH3 stretching vibrations from lipids, (11) amide A from proteins; Raman vibrations: (1) symmetric benzene/pyrrole in-phase and out of phase breathing mode of tryptophan and phenylalanine, (2) symmetric benzene/pyrrole in-phase and out of phase breathing mode of tryptophan and phenylalanine, (3) C–H deformation vibrations from proteins, (4) C–H deformation vibrations from lipids, (5) ring stretching vibrations from the deoxyribonucleotide adenosine monophosphate, (6) amide I: mainly C=O stretching vibrations and contributions of N–H bending vibrations, and (7) C–H stretching vibration from lipids.

3.14. Statistical Analysis

The mean values ± SD were calculated on the basis of at least three independent experiments. Box and whisker plots were also considered. Statistical significance was evaluated using GraphPad Prism 5 using one-way ANOVA and Tukey’s test.

Supplementary Materials

Supplementary materials can be found at https://0-www-mdpi-com.brum.beds.ac.uk/1422-0067/20/4/988/s1. Figure S1. FTIR spectra of clinical Candida isolates and reference strains (1–28). Figure S2. Raman spectra of clinical Candida isolates and reference strains (1–28). Figure S3. Spectra of component bands of amide I FTIR region of clinical Candida isolates and reference strains (1–28). Table S1. The peak positions and comments on vibrations for clinical Candida isolates and reference strains based on both (a) FTIR spectroscopy and (b) Raman spectroscopy. Table S2. Analysis of secondary protein structures of clinical Candida isolates based on IR region between 1700–1600 cm−1 (amide I region). Table S3. Lipid-carbohydrate ratio based on FTIR spectroscopy. Table S4. FTIR spectroscopy –peak area for lipid-carbohydrate ratio of clinical Candida isolates and reference strains (1–28).

Author Contributions

Conceived and designed the experiments: M.W. (Maciej Wnuk). Performed the experiments: L.P., J.D., E.K., M.W. (Mariusz Worek). Analyzed the data: J.D., A.L., M.W. (Maciej Wnuk). Contributed reagents/materials/analysis tools: L.P., A.L., M.W. (Mariusz Worek), M.W. (Maciej Wnuk). Wrote the paper: A.L.

Funding

This research received no external funding.

Acknowledgments

We are indebted to Prof. Judith Berman (Department of Molecular Microbiology and Biotechnology, Tel Aviv University, Israel) for sharing with us haploid (302), diploid (SC5314), and tetraploid (T15) reference strains and providing valuable comments on the manuscript.

Conflicts of Interest

The authors declare no conflict of interests.

References

  1. Calderone, R.A. Introduction and historical perspectives. In Candida and Candidiasis; Calderone, R.A., Ed.; ASM Press: Washington, DC, USA, 2002; pp. 15–25. [Google Scholar]
  2. Antinori, S.; Milazzo, L.; Sollima, S.; Galli, M.; Corbellino, M. Candidemia and invasive candidiasis in adults: A narrative review. Eur. J. Intern. Med. 2016, 34, 21–28. [Google Scholar] [CrossRef] [PubMed]
  3. Wilson, L.S.; Reyes, C.M.; Stolpman, M.; Speckman, J.; Allen, K.; Beney, J. The direct cost and incidence of systemic fungal infections. Value Health 2002, 5, 26–34. [Google Scholar] [CrossRef] [PubMed]
  4. Pappas, P.G.; Lionakis, M.S.; Arendrup, M.C.; Ostrosky-Zeichner, L.; Kullberg, B.J. Invasive candidiasis. Nat. Rev. Dis. Primers 2018, 4, 18026. [Google Scholar] [CrossRef] [PubMed]
  5. Diekema, D.; Arbefeville, S.; Boyken, L.; Kroeger, J.; Pfaller, M. The changing epidemiology of healthcare-associated candidemia over three decades. Diagn Microbiol. Infect. Dis. 2012, 73, 45–48. [Google Scholar] [CrossRef] [PubMed]
  6. Kauffman, C.A.; Vazquez, J.A.; Sobel, J.D.; Gallis, H.A.; McKinsey, D.S.; Karchmer, A.W.; Sugar, A.M.; Sharkey, P.K.; Wise, G.J.; Mangi, R.; et al. Prospective multicenter surveillance study of funguria in hospitalized patients. The National Institute for Allergy and Infectious Diseases (NIAID) Mycoses Study Group. Clin. Infect. Dis. 2000, 30, 14–18. [Google Scholar] [CrossRef] [PubMed]
  7. Ruan, S.Y.; Hsueh, P.R. Invasive candidiasis: An overview from Taiwan. J. Formos. Med. Assoc. 2009, 108, 443–451. [Google Scholar] [CrossRef]
  8. Liguori, G.; Di Onofrio, V.; Lucariello, A.; Galle, F.; Signoriello, G.; Colella, G.; D’Amora, M.; Rossano, F. Oral candidiasis: A comparison between conventional methods and multiplex polymerase chain reaction for species identification. Oral Microbiol. Immunol. 2009, 24, 76–78. [Google Scholar] [CrossRef] [PubMed]
  9. Gonzalez, G.M.; Elizondo, M.; Ayala, J. Trends in species distribution and susceptibility of bloodstream isolates of Candida collected in Monterrey, Mexico, to seven antifungal agents: Results of a 3-year (2004 to 2007) surveillance study. J. Clin. Microbiol. 2008, 46, 2902–2905. [Google Scholar] [CrossRef] [PubMed]
  10. Ruiz-Gaitan, A.; Moret, A.M.; Tasias-Pitarch, M.; Aleixandre-Lopez, A.I.; Martinez-Morel, H.; Calabuig, E.; Salavert-Lleti, M.; Ramirez, P.; Lopez-Hontangas, J.L.; Hagen, F.; et al. An outbreak due to Candida auris with prolonged colonisation and candidaemia in a tertiary care European hospital. Mycoses 2018, 61, 498–505. [Google Scholar] [CrossRef] [PubMed]
  11. Silva, S.; Negri, M.; Henriques, M.; Oliveira, R.; Williams, D.W.; Azeredo, J. Candida glabrata, Candida parapsilosis and Candida tropicalis: Biology, epidemiology, pathogenicity and antifungal resistance. FEMS Microbiol. Rev. 2012, 36, 288–305. [Google Scholar] [CrossRef] [PubMed]
  12. Alexander, B.D.; Ashley, E.D.; Reller, L.B.; Reed, S.D. Cost savings with implementation of PNA FISH testing for identification of Candida albicans in blood cultures. Diagn Microbiol. Infect. Dis. 2006, 54, 277–282. [Google Scholar] [CrossRef] [PubMed]
  13. Ellepola, A.N.; Morrison, C.J. Laboratory diagnosis of invasive candidiasis. J. Microbiol. 2005, 43, 65–84. [Google Scholar] [PubMed]
  14. Dijck, P.V.; Sjollema, J.; Cammue, B.P.A.; Lagrou, K.; Berman, J.; d’Enfert, C.; Andes, D.R.; Arendrup, M.C.; Brakhage, A.A.; Calderone, R.; et al. Methodologies for in vitro and in vivo evaluation of efficacy of antifungal and antibiofilm agents and surface coatings against fungal biofilms. Microb. Cell 2018, 5, 300–326. [Google Scholar] [CrossRef] [PubMed]
  15. Selmecki, A.; Forche, A.; Berman, J. Genomic plasticity of the human fungal pathogen Candida albicans. Eukaryot. Cell 2010, 9, 991–1008. [Google Scholar] [CrossRef] [PubMed]
  16. Berman, J. Ploidy plasticity: A rapid and reversible strategy for adaptation to stress. FEMS Yeast Res. 2016, 16. [Google Scholar] [CrossRef] [PubMed]
  17. Todd, R.T.; Forche, A.; Selmecki, A. Ploidy Variation in Fungi: Polyploidy, Aneuploidy, and Genome Evolution. Microbiol. Spectr. 2017, 5. [Google Scholar] [CrossRef]
  18. Magee, B.B.; Magee, P.T. Electrophoretic karyotypes and chromosome numbers in Candida species. J. Gen. Microbiol. 1987, 133, 425–430. [Google Scholar] [PubMed]
  19. Rustchenko-Bulgac, E.P. Variations of Candida albicans electrophoretic karyotypes. J. Bacteriol. 1991, 173, 6586–6596. [Google Scholar] [CrossRef] [PubMed]
  20. Iwaguchi, S.; Homma, M.; Tanaka, K. Variation in the electrophoretic karyotype analysed by the assignment of DNA probes in Candida albicans. J. Gen. Microbiol. 1990, 136, 2433–2442. [Google Scholar] [CrossRef] [PubMed]
  21. Pfaller, M.A.; Rhine-Chalberg, J.; Redding, S.W.; Smith, J.; Farinacci, G.; Fothergill, A.W.; Rinaldi, M.G. Variations in fluconazole susceptibility and electrophoretic karyotype among oral isolates of Candida albicans from patients with AIDS and oral candidiasis. J. Clin. Microbiol. 1994, 32, 59–64. [Google Scholar] [PubMed]
  22. Perepnikhatka, V.; Fischer, F.J.; Niimi, M.; Baker, R.A.; Cannon, R.D.; Wang, Y.K.; Sherman, F.; Rustchenko, E. Specific chromosome alterations in fluconazole-resistant mutants of Candida albicans. J. Bacteriol. 1999, 181, 4041–4049. [Google Scholar] [PubMed]
  23. Hickman, M.A.; Zeng, G.; Forche, A.; Hirakawa, M.P.; Abbey, D.; Harrison, B.D.; Wang, Y.M.; Su, C.H.; Bennett, R.J.; Wang, Y.; et al. The ‘obligate diploid’ Candida albicans forms mating-competent haploids. Nature 2013, 494, 55–59. [Google Scholar] [CrossRef] [PubMed]
  24. Selmecki, A.; Bergmann, S.; Berman, J. Comparative genome hybridization reveals widespread aneuploidy in Candida albicans laboratory strains. Mol. Microbiol. 2005, 55, 1553–1565. [Google Scholar] [CrossRef] [PubMed]
  25. Harrison, B.D.; Hashemi, J.; Bibi, M.; Pulver, R.; Bavli, D.; Nahmias, Y.; Wellington, M.; Sapiro, G.; Berman, J. A tetraploid intermediate precedes aneuploid formation in yeasts exposed to fluconazole. PLoS Biol. 2014, 12, e1001815. [Google Scholar] [CrossRef] [PubMed]
  26. Bader, O.; Weig, M.; Taverne-Ghadwal, L.; Lugert, R.; Gross, U.; Kuhns, M. Improved clinical laboratory identification of human pathogenic yeasts by matrix-assisted laser desorption ionization time-of-flight mass spectrometry. Clin. Microbiol. Infect. 2011, 17, 1359–1365. [Google Scholar] [CrossRef] [PubMed] [Green Version]
  27. Tan, K.E.; Ellis, B.C.; Lee, R.; Stamper, P.D.; Zhang, S.X.; Carroll, K.C. Prospective evaluation of a matrix-assisted laser desorption ionization-time of flight mass spectrometry system in a hospital clinical microbiology laboratory for identification of bacteria and yeasts: A bench-by-bench study for assessing the impact on time to identification and cost-effectiveness. J. Clin. Microbiol. 2012, 50, 3301–3308. [Google Scholar] [PubMed]
  28. Sockalingum, G.D.; Sandt, C.; Toubas, D.; Gomez, J.; Pina, P.; Beguinot, I.; Witthuhn, F.; Aubert, D.; Allouch, P.; Pinon, J.M.; et al. FTIR characterization of Candida species: A study on some reference strains and pathogenic C. albicans isolates from HIV+ patients. Vib. Spectrosc. 2002, 28, 137–146. [Google Scholar] [CrossRef]
  29. Essendoubi, M.; Toubas, D.; Bouzaggou, M.; Pinon, J.M.; Manfait, M.; Sockalingum, G.D. Rapid identification of Candida species by FT-IR microspectroscopy. Biochim. Biophys. Acta 2005, 1724, 239–247. [Google Scholar] [CrossRef] [PubMed]
  30. Colabella, C.; Corte, L.; Roscini, L.; Shapaval, V.; Kohler, A.; Tafintseva, V.; Tascini, C.; Cardinali, G. Merging FT-IR and NGS for simultaneous phenotypic and genotypic identification of pathogenic Candida species. PLoS ONE 2017, 12, e0188104. [Google Scholar] [CrossRef] [PubMed]
  31. Ibelings, M.S.; Maquelin, K.; Endtz, H.P.; Bruining, H.A.; Puppels, G.J. Rapid identification of Candida spp. in peritonitis patients by Raman spectroscopy. Clin. Microbiol. Infect. 2005, 11, 353–358. [Google Scholar] [CrossRef] [PubMed]
  32. Maquelin, K.; Choo-Smith, L.P.; Endtz, H.P.; Bruining, H.A.; Puppels, G.J. Rapid identification of Candida species by confocal Raman microspectroscopy. J. Clin. Microbiol. 2002, 40, 594–600. [Google Scholar] [CrossRef] [PubMed]
  33. Silge, A.; Heinke, R.; Bocklitz, T.; Wiegand, C.; Hipler, U.C.; Rosch, P.; Popp, J. The application of UV resonance Raman spectroscopy for the differentiation of clinically relevant Candida species. Anal. Bioanal. Chem. 2018, 410, 5839–5847. [Google Scholar] [CrossRef] [PubMed]
  34. Sudbery, P.E. Growth of Candida albicans hyphae. Nat. Rev. Microbiol. 2011, 9, 737–748. [Google Scholar] [CrossRef] [PubMed]
  35. Larone, D.H. Medically Important Fungi: A Guide to Identification; ASM Press: Washington, DC, USA, 2011. [Google Scholar]
  36. Chibana, H.; Beckerman, J.L.; Magee, P.T. Fine-resolution physical mapping of genomic diversity in Candida albicans. Genome Res. 2000, 10, 1865–1877. [Google Scholar] [CrossRef] [PubMed]
  37. Ahmad, K.M.; Kokosar, J.; Guo, X.; Gu, Z.; Ishchuk, O.P.; Piskur, J. Genome structure and dynamics of the yeast pathogen Candida glabrata. FEMS Yeast Res. 2014, 14, 529–535. [Google Scholar] [CrossRef] [PubMed]
  38. Dujon, B.; Sherman, D.; Fischer, G.; Durrens, P.; Casaregola, S.; Lafontaine, I.; De Montigny, J.; Marck, C.; Neuveglise, C.; Talla, E.; et al. Genome evolution in yeasts. Nature 2004, 430, 35–44. [Google Scholar] [CrossRef] [PubMed]
  39. Healey, K.R.; Jimenez Ortigosa, C.; Shor, E.; Perlin, D.S. Genetic Drivers of Multidrug Resistance in Candida glabrata. Front. Microbiol. 2016, 7, 1995. [Google Scholar] [CrossRef] [PubMed]
  40. Klempp-Selb, B.; Rimek, D.; Kappe, R. Karyotyping of Candida albicans and Candida glabrata from patients with Candida sepsis. Mycoses 2000, 43, 159–163. [Google Scholar] [CrossRef] [PubMed]
  41. Shin, J.H.; Chae, M.J.; Song, J.W.; Jung, S.I.; Cho, D.; Kee, S.J.; Kim, S.H.; Shin, M.G.; Suh, S.P.; Ryang, D.W. Changes in karyotype and azole susceptibility of sequential bloodstream isolates from patients with Candida glabrata candidemia. J. Clin. Microbiol. 2007, 45, 2385–2391. [Google Scholar] [CrossRef] [PubMed]
  42. Lin, C.Y.; Chen, Y.C.; Lo, H.J.; Chen, K.W.; Li, S.Y. Assessment of Candida glabrata strain relatedness by pulsed-field gel electrophoresis and multilocus sequence typing. J. Clin. Microbiol. 2007, 45, 2452–2459. [Google Scholar] [CrossRef] [PubMed]
  43. Polakova, S.; Blume, C.; Zarate, J.A.; Mentel, M.; Jorck-Ramberg, D.; Stenderup, J.; Piskur, J. Formation of new chromosomes as a virulence mechanism in yeast Candida glabrata. Proc. Natl. Acad. Sci. USA 2009, 106, 2688–2693. [Google Scholar] [CrossRef] [PubMed]
  44. Wertheimer, N.B.; Stone, N.; Berman, J. Ploidy dynamics and evolvability in fungi. Philos. Trans. R. Soc. Lond. B Biol. Sci. 2016, 371. [Google Scholar] [CrossRef] [PubMed]
  45. Hickman, M.A.; Paulson, C.; Dudley, A.; Berman, J. Parasexual Ploidy Reduction Drives Population Heterogeneity Through Random and Transient Aneuploidy in Candida albicans. Genetics 2015, 200, 781–794. [Google Scholar] [CrossRef] [PubMed]
  46. Kaur, R.; Domergue, R.; Zupancic, M.L.; Cormack, B.P. A yeast by any other name: Candida glabrata and its interaction with the host. Curr. Opin. Microbiol. 2005, 8, 378–384. [Google Scholar] [CrossRef] [PubMed]
  47. Morrow, C.A.; Fraser, J.A. Ploidy variation as an adaptive mechanism in human pathogenic fungi. Semin. Cell Dev. Biol. 2013, 24, 339–346. [Google Scholar] [CrossRef] [PubMed]
  48. Selmecki, A.; Forche, A.; Berman, J. Aneuploidy and isochromosome formation in drug-resistant Candida albicans. Science 2006, 313, 367–370. [Google Scholar] [CrossRef] [PubMed]
  49. Selmecki, A.; Gerami-Nejad, M.; Paulson, C.; Forche, A.; Berman, J. An isochromosome confers drug resistance in vivo by amplification of two genes, ERG11 and TAC1. Mol. Microbiol. 2008, 68, 624–641. [Google Scholar] [CrossRef] [PubMed]
  50. Li, X.; Yang, F.; Li, D.; Zhou, M.; Wang, X.; Xu, Q.; Zhang, Y.; Yan, L.; Jiang, Y. Trisomy of chromosome R confers resistance to triazoles in Candida albicans. Med. Mycol. 2015, 53, 302–309. [Google Scholar] [CrossRef] [PubMed]
  51. Anderson, M.Z.; Saha, A.; Haseeb, A.; Bennett, R.J. A chromosome 4 trisomy contributes to increased fluconazole resistance in a clinical isolate of Candida albicans. Microbiology 2017, 163, 856–865. [Google Scholar] [CrossRef] [PubMed]
  52. Harari, Y.; Ram, Y.; Rappoport, N.; Hadany, L.; Kupiec, M. Spontaneous Changes in Ploidy Are Common in Yeast. Curr. Biol. 2018, 28, 825–835. [Google Scholar] [CrossRef] [PubMed]
  53. Zhu, Y.O.; Sherlock, G.; Petrov, D.A. Whole Genome Analysis of 132 Clinical Saccharomyces cerevisiae Strains Reveals Extensive Ploidy Variation. G3 (Bethesda) 2016, 6, 2421–2434. [Google Scholar] [CrossRef] [PubMed]
  54. Naumann, D.; Helm, D.; Labischinski, H. Microbiological characterizations by FT-IR spectroscopy. Nature 1991, 351, 81–82. [Google Scholar] [CrossRef] [PubMed]
  55. Maquelin, K.; Kirschner, C.; Choo-Smith, L.P.; van den Braak, N.; Endtz, H.P.; Naumann, D.; Puppels, G.J. Identification of medically relevant microorganisms by vibrational spectroscopy. J. Microbiol. Methods 2002, 51, 255–271. [Google Scholar] [CrossRef]
  56. Butler, H.J.; Ashton, L.; Bird, B.; Cinque, G.; Curtis, K.; Dorney, J.; Esmonde-White, K.; Fullwood, N.J.; Gardner, B.; Martin-Hirsch, P.L.; et al. Using Raman spectroscopy to characterize biological materials. Nat. Protoc. 2016, 11, 664–687. [Google Scholar] [CrossRef] [PubMed] [Green Version]
  57. Maquelin, K.; Kirschner, C.; Choo-Smith, L.P.; Ngo-Thi, N.A.; van Vreeswijk, T.; Stammler, M.; Endtz, H.P.; Bruining, H.A.; Naumann, D.; Puppels, G.J. Prospective study of the performance of vibrational spectroscopies for rapid identification of bacterial and fungal pathogens recovered from blood cultures. J. Clin. Microbiol. 2003, 41, 324–329. [Google Scholar] [CrossRef] [PubMed]
  58. Galichet, A.; Sockalingum, G.D.; Belarbi, A.; Manfait, M. FTIR spectroscopic analysis of Saccharomyces cerevisiae cell walls: Study of an anomalous strain exhibiting a pink-colored cell phenotype. FEMS Microbiol. Lett. 2001, 197, 179–186. [Google Scholar] [CrossRef] [PubMed]
  59. Burattini, E.; Cavagna, M.; Dell’Anna, R.; Campeggi, F.M.; Monti, F.; Rossi, F.; Torriani, S. A FTIR microspectroscopy study of autolysis in cells of the wine yeast Saccharomyces cerevisiae. Vib. Spectrosc. 2008, 47, 139–147. [Google Scholar] [CrossRef]
  60. Mihoubi, W.; Sahli, E.; Gargouri, A.; Amiel, C. FTIR spectroscopy of whole cells for the monitoring of yeast apoptosis mediated by p53 over-expression and its suppression by Nigella sativa extracts. PLoS ONE 2017, 12, e0180680. [Google Scholar] [CrossRef] [PubMed]
  61. Wrobel, T.P.; Mateuszuk, L.; Chlopicki, S.; Malek, K.; Baranska, M. Imaging of lipids in atherosclerotic lesion in aorta from ApoE/LDLR-/- mice by FT-IR spectroscopy and Hierarchical Cluster Analysis. Analyst 2011, 136, 5247–5255. [Google Scholar] [CrossRef] [PubMed]
  62. Barth, A.; Zscherp, C. What vibrations tell us about proteins. Q. Rev. Biophys. 2002, 35, 369–430. [Google Scholar] [CrossRef] [PubMed]
  63. Mikoliunaite, L.; Rodriguez, R.D.; Sheremet, E.; Kolchuzhin, V.; Mehner, J.; Ramanavicius, A.; Zahn, D.R. The substrate matters in the Raman spectroscopy analysis of cells. Sci. Rep. 2015, 5, 13150. [Google Scholar] [CrossRef] [PubMed] [Green Version]
  64. Harz, M.; Rosch, P.; Popp, J. Vibrational spectroscopy-a powerful tool for the rapid identification of microbial cells at the single-cell level. Cytometry A 2009, 75, 104–113. [Google Scholar] [CrossRef] [PubMed]
  65. Arthington-Skaggs, B.A.; Jradi, H.; Desai, T.; Morrison, C.J. Quantitation of ergosterol content: Novel method for determination of fluconazole susceptibility of Candida albicans. J. Clin. Microbiol. 1999, 37, 3332–3337. [Google Scholar] [PubMed]
  66. Li, Q.Q.; Tsai, H.F.; Mandal, A.; Walker, B.A.; Noble, J.A.; Fukuda, Y.; Bennett, J.E. Sterol uptake and sterol biosynthesis act coordinately to mediate antifungal resistance in Candida glabrata under azole and hypoxic stress. Mol. Med. Rep. 2018, 17, 6585–6597. [Google Scholar] [PubMed]
  67. Chiu, L.D.; Hullin-Matsuda, F.; Kobayashi, T.; Torii, H.; Hamaguchi, H.O. On the origin of the 1602 cm−1 Raman band of yeasts; contribution of ergosterol. J. Biophotonics 2012, 5, 724–728. [Google Scholar] [CrossRef] [PubMed]
  68. Deregowska, A.; Skoneczny, M.; Adamczyk, J.; Kwiatkowska, A.; Rawska, E.; Skoneczna, A.; Lewinska, A.; Wnuk, M. Genome-wide array-CGH analysis reveals YRF1 gene copy number variation that modulates genetic stability in distillery yeasts. Oncotarget 2015, 6, 30650–30663. [Google Scholar] [CrossRef] [PubMed]
  69. Chester, V.E. Heritable glycogen-storage deficiency in yeast and its induction by ultra-violet light. J. Gen. Microbiol. 1968, 51, 49–56. [Google Scholar] [CrossRef] [PubMed]
  70. Chiu, L.D.; Ho, S.H.; Shimada, R.; Ren, N.Q.; Ozawa, T. Rapid in vivo lipid/carbohydrate quantification of single microalgal cell by Raman spectral imaging to reveal salinity-induced starch-to-lipid shift. Biotechnol. Biofuels 2017, 10, 9. [Google Scholar] [CrossRef] [PubMed]
  71. Metsalu, T.; Vilo, J. ClustVis: A web tool for visualizing clustering of multivariate data using Principal Component Analysis and heatmap. Nucleic Acids Res. 2015, 43, W566–W570. [Google Scholar] [CrossRef] [PubMed]
Figure 1. Cell morphology (a) and electrophoretic karyotyping (b,c) of 25 clinical Candida isolates and three reference strains (haploid, diploid, and tetraploid). (a) Representative microphotographs are shown. Scale bar 5 μm, objective 100×. (b) Representative karyotype patterns are shown. (c) The dendrogram of chromosome band-based similarity. C. albicans group (1, 2, and 4–19), C. tropicalis group (20, 21), C. glabrata group (3 and 22–25), 302 haploid reference strain (26), SC5314 diploid strain (27), and T15 tetraploid strain (28).
Ijms 20 00988 g001
Figure 2. Fluorescence microscopy-based analysis of DNA content. Fixed cells (n = 100) were analyzed using an Olympus BX61 fluorescence microscope equipped with a DP72 CCD camera and Olympus CellF software (Olympus, Warsaw, Poland). For DNA visualization, the slides were counterstained with a drop of mounting medium containing 4′,6′-diamino-2-phenylindole (DAPI) (blue). DNA content of clinical Candida isolates were compared to reference strains, namely haploid (26), diploid (27), and tetraploid (28) strains. DNA content was expressed as arbitrary units (relative fluorescence units from 0 to 4). Representative microphotographs and data distribution (histograms) are shown. C. albicans group (1, 2, and 4–19), C. tropicalis group (20, 21), C. glabrata group (3 and 22–25), 302 haploid reference strain (26), SC5314 diploid strain (27), and T15 tetraploid strain (28).
Ijms 20 00988 g002
Figure 3. Examination of glycogen content by iodine staining (a, lower panel). Unstained Candida cells (spots) are also presented for comparison (a, upper panel). C. albicans group (1, 2, and 4–19), C. tropicalis group (20, 21), C. glabrata group (3 and 22–25), 302 haploid reference strain (26), SC5314 diploid strain (27), and T15 tetraploid strain (28). (b) Correlation analysis between glycogen content [a.u.] and DNA content [a.u.] within C. albicans group is shown. Correlation analysis of the data was performed using a linear correlation (Pearson r) test. The R2 value is shown.
Ijms 20 00988 g003
Figure 4. A representative FTIR spectrum (a) and Raman spectrum (b) of a clinical Candida albicans isolate 1. Characteristic peaks are denoted; a.u., arbitrary units. A comma was used as a decimal separator.
Ijms 20 00988 g004
Figure 5. A comparative analysis of differences in the intensities of some FTIR (ak) and Raman (lr) vibrations between C. albicans group (1, 2, and 4–19), C. tropicalis group (20, 21), C. glabrata group (3 and 22–25), reference strain group (haploid, 26; diploid, 27; and tetraploid, 28); a.u., arbitrary units. (a) C-O, C-O-H, and C-O-C deformation and C–C stretching vibrations from carbohydrates, (b) β(1–3) glucans, nucleic acids and glycogen, PO2− symmetric stretching vibrations mainly from RNA, (c) C–O asymmetric stretching vibrations from phospholipids and lipids, (d) amide III: C–N and C–O stretching vibrations, N–H and O=C–N bending vibrations, (e) C=O of COO symmetric stretching vibrations from proteins, CH2 wagging vibrations from lipids and β(1–3) glucans, (f) amide II: mainly C–N stretching vibrations and N–H bending vibrations, (g) amide I: mainly C=O stretching vibrations and contributions of N–H bending vibrations, (h) C=O stretching vibrations from lipid esters, (i) CH2 stretching vibrations from lipids, (j) CH3 stretching vibrations from lipids, (k) amide A from proteins, (l) symmetric benzene/pyrrole in-phase and out of phase breathing mode of tryptophan and phenylalanine, (m) symmetric benzene/pyrrole in-phase and out of phase breathing mode of tryptophan and phenylalanine, (n) C–H deformation vibrations from proteins, (o) C–H deformation vibrations from lipids, (p) ring stretching vibrations from the deoxyribonucleotide adenosine monophosphate, (q) Amide I: mainly C=O stretching vibrations and contributions of N–H bending vibrations, (r) C-H stretching vibration from lipids. Box and whisker plots are shown, *** p < 0.001, ** p < 0.01, * p < 0.05 compared to C. albicans group (ANOVA and Tukey’s a posteriori test).
Ijms 20 00988 g005
Figure 6. FTIR spectrum (a) and Raman spectrum (b) of ergosterol reference standard. (c) Quantitative analysis of ergosterol content in clinical Candida isolates based on both FTIR and Raman spectroscopy. C. albicans group (1, 2, and 4–19), C. tropicalis group (20, 21), C. glabrata group (3 and 22–25), 302 haploid reference strain (26), SC5314 diploid strain (27), and T15 tetraploid strain (28). Bars indicate SD, n = 3, a.u., arbitrary units.
Ijms 20 00988 g006
Figure 7. PCA two-dimensional score plot of FTIR spectra (a) and Raman spectra (b) for principle components (PA) 1 and 2 based on lipid-carbohydrate ratio and α/β structure ratio. HCA analysis based on FTIR spectra ranging from 500 to 4000 cm−1 (c) and Raman spectra ranging from 500 to 3000 cm−1 (d). Representative dendrograms are shown. C. albicans group (1, 2, and 4–19), C. tropicalis group (20, 21), C. glabrata group (3 and 22–25), 302 haploid reference strain (26), SC5314 diploid strain (27), and T15 tetraploid strain (28).
Ijms 20 00988 g007
Figure 8. A joined clustering analysis of chromosome number, DNA content, signal intensities of some selected vibrations of FTIR and Raman spectra (11 vibrations of FTIR spectrum, seven vibrations of Raman spectrum), alpha-helix/beta-sheet ratio and lipid-carbohydrate ratio that allows for proper grouping of three Candida species considered. The effect of antifungal treatment is also denoted. A heat map generated from FTIR and Raman spectroscopy data, karyotype profiling, and DNA content data is shown. Hierarchical clustering was created using ClustVis, a web tool for visualizing clustering of multivariate data (BETA) (https://biit.cs.ut.ee/clustvis/). FTIR vibrations: (1) C–O, C–O–H, and C–O–C deformation and C–C stretching vibrations from carbohydrates, (2) β(1–3) glucans, nucleic acids and glycogen, PO2– symmetric stretching vibrations mainly from RNA, (3) C–O asymmetric stretching vibrations from phospholipids and lipids, (4) amide III: C–N and C–O stretching vibrations, N–H and O=C–N bending vibrations, (5) C=O of COO symmetric stretching vibrations from proteins, CH2 wagging vibrations from lipids and β(1–3)glucans, (6) amide II: mainly C–N stretching vibrations and N–H bending vibrations, (7) amide I: mainly C=O stretching vibrations and contributions of N–H bending vibrations, (8) C=O stretching vibrations from lipid esters, (9) CH2 stretching vibrations from lipids, (10) CH3 stretching vibrations from lipids, (11) Amide A from proteins; Raman vibrations: (1) symmetric benzene/pyrrole in-phase and out of phase breathing mode of tryptophan and phenylalanine, (2) symmetric benzene/pyrrole in-phase and out of phase breathing mode of tryptophan and phenylalanine, (3) C–H deformation vibrations from proteins, (4) C–H deformation vibrations from lipids, (5) ring stretching vibrations from the deoxyribonucleotide adenosine monophosphate, (6) amide I: mainly C=O stretching vibrations and contributions of N–H bending vibrations, (7) C–H stretching vibration from lipids.
Ijms 20 00988 g008
Figure 9. The usefulness of vibrational spectroscopy methods for comprehensive biochemical characterization and identification of clinical Candida isolates. FTIR spectra- and Raman spectra-based biochemical profiling of clinical Candida isolates together with karyotype profiling and DNA content analysis allows for accurate identification of Candida species. Raman spectroscopy can be also adapted for rapid and accurate measurements of ergosterol content that may provide information of azole resistance/susceptibility. Established spectral databases can be useful for diagnosis and targeted therapy of candidiasis.
Ijms 20 00988 g009
Table 1. Clinical Candida species isolates used in the present study. Three reference strains, namely haploid, diploid, and tetraploid strains were also considered.
IsolateIsolate Identification
(API® Candida Biochemical Test)
Isolate Identification
(DNA Sequencing)
GenBank
Accession Number
Sequence
Identity (%)/Query Cover (%)
Isolation SiteSexTreatment
1.Candida albicans 4316Candida albicans M366BKP675609.199/98bronchoalveolar lavagefemalevoriconazole
2.Candida albicans 154Candida albicans NG76MH019247.199/96vaginafemale
3.Candida albicans 4200Candida glabrataAM492797.198/98sputummalefluconazole
4.Candida albicans 4248Candida albicans M215BKP675383.199/98urinefemale
5.Candida albicans 4310Candida albicans CGP41MF276783.199/100sputumfemale
6.Candida albicans M/529Candida albicans M179AKP675353.199/100bronchoalveolar lavagemalefluconazole
7.Candida albicans 532Candida albicans M221BKP675393.199/98bronchoalveolar lavagemale
8.Candida albicans 4331Candida albicans M363BKP675603.199/98inoculation from urinemalefluconazole
9.Candida albicans 4324Candida albicans M366BKP675609.199/97sputumfemale
10.Candida albicans 534Candida sp.KY996547.199/97bronchoalveolar lavagemale
11.Candida albicans 152Candida albicans M357BKP675591.199/99vaginafemale
12.Candida albicans 153Candida albicans H291BKP675000.189/97vaginafemale
13.Candida albicans 521Candida albicans 125AKP765018.196/97pharynxmale
14.Candida albicans 4369Candida albicans H296BKP675010.1100/99woundfemale
15.Candida albicans 556Candida albicans n96bKP675680.1100/96bronchoalveolar lavagefemale
16.Candida albicans 563Candida albicans M349AKP675580.1100/97bronchoalveolar lavagemale
17.Candida albicans 4335Candida albicans H257BKP674940.188/97bronchoalveolar lavagefemale
18.Candida albicans 539Candida albicans H294AKP675005.1100/98bronchoalveolar lavagemale
19.Candida albicans 7363Candida albicans M215BKP675383.1100/98bronchoalveolar lavagefemale
20.Candida tropicalis 4403Candida tropicalis H260CKP674945.199/98sputummale
21.Candida tropicalis 4114Candida tropicalis CTR817KX664669.199/98bronchoalveolar lavagemale
22.Candida glabrata 520Candida glabrata IFM 64525LC317501.199/97bronchoalveolar lavagemale
23.Candida glabrata 4570Candida glabrata M9LC389275.199/97sputummale
24.Candida glabrata 144Candida glabrata H160MF187244.199/97vaginafemale
25.Candida glabrata 4246Candida glabrata H160LC389261.199/97urinefemalefluconazole
26.Candida albicans 302Candida albicans H194BKP674872.1100/98reference strain—n
27.Candida albicans SC5314Candida albicans SC5314CP017630.199/98reference strain—2n
28.Candida albicans T15Candida albicans B280AKP674535.199/97reference strain—4n

