Article

Placenta Transcriptome Profiling in Intrauterine Growth Restriction (IUGR)

1
Department of Human Physiology, School of Medicine, Collegium Medicum, University of Warmia and Mazury in Olsztyn, Warszawska Str 30, 10-082 Olsztyn, Poland
2
Department of Gynecology and Obstetrics, School of Medicine, Collegium Medicum, University of Warmia and Mazury in Olsztyn, Niepodleglosci Str 44, 10-045 Olsztyn, Poland
3
Department of Plant Physiology, Genetics and Biotechnology, Faculty of Biology and Biotechnology, University of Warmia and Mazury in Olsztyn, Oczapowskiego Str 1A, 10-719 Olsztyn-Kortowo, Poland
4
Department of Animal Anatomy and Physiology, Faculty of Biology and Biotechnology, University of Warmia and Mazury in Olsztyn, Oczapowskiego Str 1A, 10-719 Olsztyn-Kortowo, Poland
*
Author to whom correspondence should be addressed.
Int. J. Mol. Sci. 2019, 20(6), 1510; https://0-doi-org.brum.beds.ac.uk/10.3390/ijms20061510
Submission received: 5 March 2019 / Revised: 22 March 2019 / Accepted: 24 March 2019 / Published: 26 March 2019
(This article belongs to the Section Molecular Pathology, Diagnostics, and Therapeutics)

Abstract

:
Intrauterine growth restriction (IUGR) is a serious pathological complication associated with compromised fetal development during pregnancy. The aim of the study was to broaden knowledge about the transcriptomic complexity of the human placenta by identifying genes potentially involved in IUGR pathophysiology. RNA-Seq data were used to profile protein-coding genes, detect alternative splicing events (AS), single nucleotide variant (SNV) calling, and RNA editing sites prediction in IUGR-affected placental transcriptome. The applied methodology enabled detection of 37,501 transcriptionally active regions and the selection of 28 differentially-expressed genes (DEGs), among them 10 were upregulated and 18 downregulated in IUGR-affected placentas. Functional enrichment annotation indicated that most of the DEGs were implicated in the processes of inflammation and immune disorders related to IUGR and preeclampsia. Additionally, we revealed that some genes (S100A13, GPR126, CTRP1, and TFPI) involved in the alternation of splicing events were mainly implicated in angiogenic-related processes. Significant SNVs were overlapped with 6533 transcripts and assigned to 2386 coding sequence (CDS), 1528 introns, 345 5’ untranslated region (UTR), 1260 3’UTR, 918 non-coding RNA (ncRNA), and 10 intergenic regions. Within CDS regions, 543 missense substitutions with functional effects were recognized. Two known mutations (rs4575, synonymous; rs3817, on the downstream region) were detected within the range of AS and DEG candidates: PA28β and PINLYP, respectively. Novel genes that are dysregulated in IUGR were detected in the current research. Investigating genes underlying the IUGR is crucial for identification of mechanisms regulating placental development during a complicated pregnancy.

1. Introduction

Intrauterine growth restriction (IUGR) is a serious pathological complication associated with compromised fetal development during pregnancy [1,2]. By definition, the ultrasound estimated fetal weight (EFW) is below the 10th percentile, in relation to the gender, race and genetic growth potential, as per gestational age [3,4,5]. Generally, IUGR may evolve in asymmetrical (70–80% of cases) or symmetrical (20–30% of cases) manner [6], and may be diagnosed as early or late-onset [7]. To examine the fetal growth, serial of typical ultrasonographic biometric measures as biparietal diameter, head, and abdominal circumference, femur length, jointly with monitoring of fetal anatomy are commonly applied [8]. Additional evaluations such as amniotic fluid assessment, fetal vessels (especially: umbilical artery, medial cerebral artery and ductus venosus) and maternal (uterine arteries) Doppler velocimetry are applied in-depth analysis as an indicator of IUGR [9,10]. Clinically, IUGR refers either to prenatal condition or neonates born with sights of malnutrition and in utero growth retardation [11]. However, the universally accepted definition and a consensus diagnosis of IUGR do not exist [10,12,13].
Adequate fetal growth and proper functioning of the placenta is a valuable predictor of pregnancy outcome [1]. Hence, impaired fetal growth is one of the most important causes of prematurity, stillbirth and infant mortality [14,15]. Moreover, growth-restricted newborns are susceptible to pulmonary hypertension, hypothermia, hypo-, hyper-glycemia, pulmonary hemorrhage [16], and may suffer from cognitive delay, neurological, and psychiatric disorders in childhood [17,18,19]. Adults are prone to obesity, hypertension, type-2 diabetes, as well as neurological, cardiovascular, renal, hepatic, and respiratory diseases [20,21,22,23]. Etiology of IUGR is multifactorial and comprises a wide range of various either maternal, fetal, placental or genetic causes [4]. Maternal risk factors include parasite infections (TORCH, malaria), poor maternal health (malnutrition, diabetes mellitus, hypertension, anemia, cardiac, hepatic and chronic renal diseases), obesity (BMI > 30), drug abuse, smoking, female age above 35 years, and multiple gestations [6,24]. Fetal factors encompass chromosomal abnormalities, as at least 50% of fetuses with trisomy 21, 13, or 18 or Turner’s syndrome are associated with higher rate of fetal growth restriction (FGR) [25]. Moreover, specific placental disorders like infarction, fetal vessel thrombosis, preeclampsia (PE), decidual or spiral artery arteritis, chronic villitis, placental hemangioma, as well as umbilical cord abnormalities like velamentous or marginal cord insertion also affect IUGR initiation [6,26]. FGR and related placental pathologies occur when inadequate remodeling of maternal spiral arteries leads to a high-resistance low-flow system of uteroplacental circulation [27]. Nevertheless, among all causes, uteroplacental insufficiency, usually related to incorrect implantation of the placenta, is assumed to be the most common cause of IUGR [28]. The placenta is essential for the development of the fetus and successful pregnancy outcome serves as an organ for nourishing, protection, and gas exchange, constantly supports and enhances the growth of the fetus [29]. Placenta produces and secretes both growth factors and hormones that regulate fetal growth [30]. The uteroplacental insufficiency that interrupts oxygen and nutrients supply to the fetus results in abnormal fetal growth and creates conditions for IUGR initiation [24]. However, sometimes IUGR develops in healthy, young, slim pregnant women who do not manifest any known risk factors or addictions that may be connected with incorrect implantation, which relies on genes expression.
Development and function of the placenta are under influence of sophisticated pathways related to the expression of substantial genes throughout pregnancy progress [31,32]. The placenta has a unique transcriptional landscape [33,34], therefore, any alterations in gene expression or posttranslational modification may disturb various critical functions, manifested in pathologies and disorders during pregnancy [35]. Consequently, impaired expression of fetal, maternal or placental genes affects fetal growth deceleration that underlies course of IUGR [6,36]. Mutations, polymorphisms, alternative splicing (AS) events, disturbed over or under-expression of specific placental genes - all of them may also be responsible for uteroplacental insufficiency leading to abnormal fetal growth and development [4]. The previous analysis enabled insight into the general human placental transcriptome of the term placenta [33,34]. The goal of the current study was to broaden knowledge about the transcriptomic complexity of the human placenta by identifying genes potentially involved in IUGR pathophysiology.

2. Results

2.1. Statistics of the Placenta Transcriptome

The RNA-seq of the constructed cDNA libraries allowed the characterization of the transcriptome profile of IUGR-affected human placenta (Figure 1).
High-throughput sequencing on an Illumina platform generated 546,017,586 raw paired-end reads. After trimming, 477,019,796 reads with good quality were obtained, of them, 419,725,222 were uniquely mapped. Moreover, 8.8% of reads were mapped to multiple loci (Table 1). For all input data, the mean percentage distribution of aligned bases was as follow: 2% were derived from intergenic, 8% from intronic, 35% from untranslated regions, and 55% from coding regions (Figure S1). The total number of 37,501 transcriptionally active regions, including protein-coding genes, were expressed in at least half of the placental libraries.

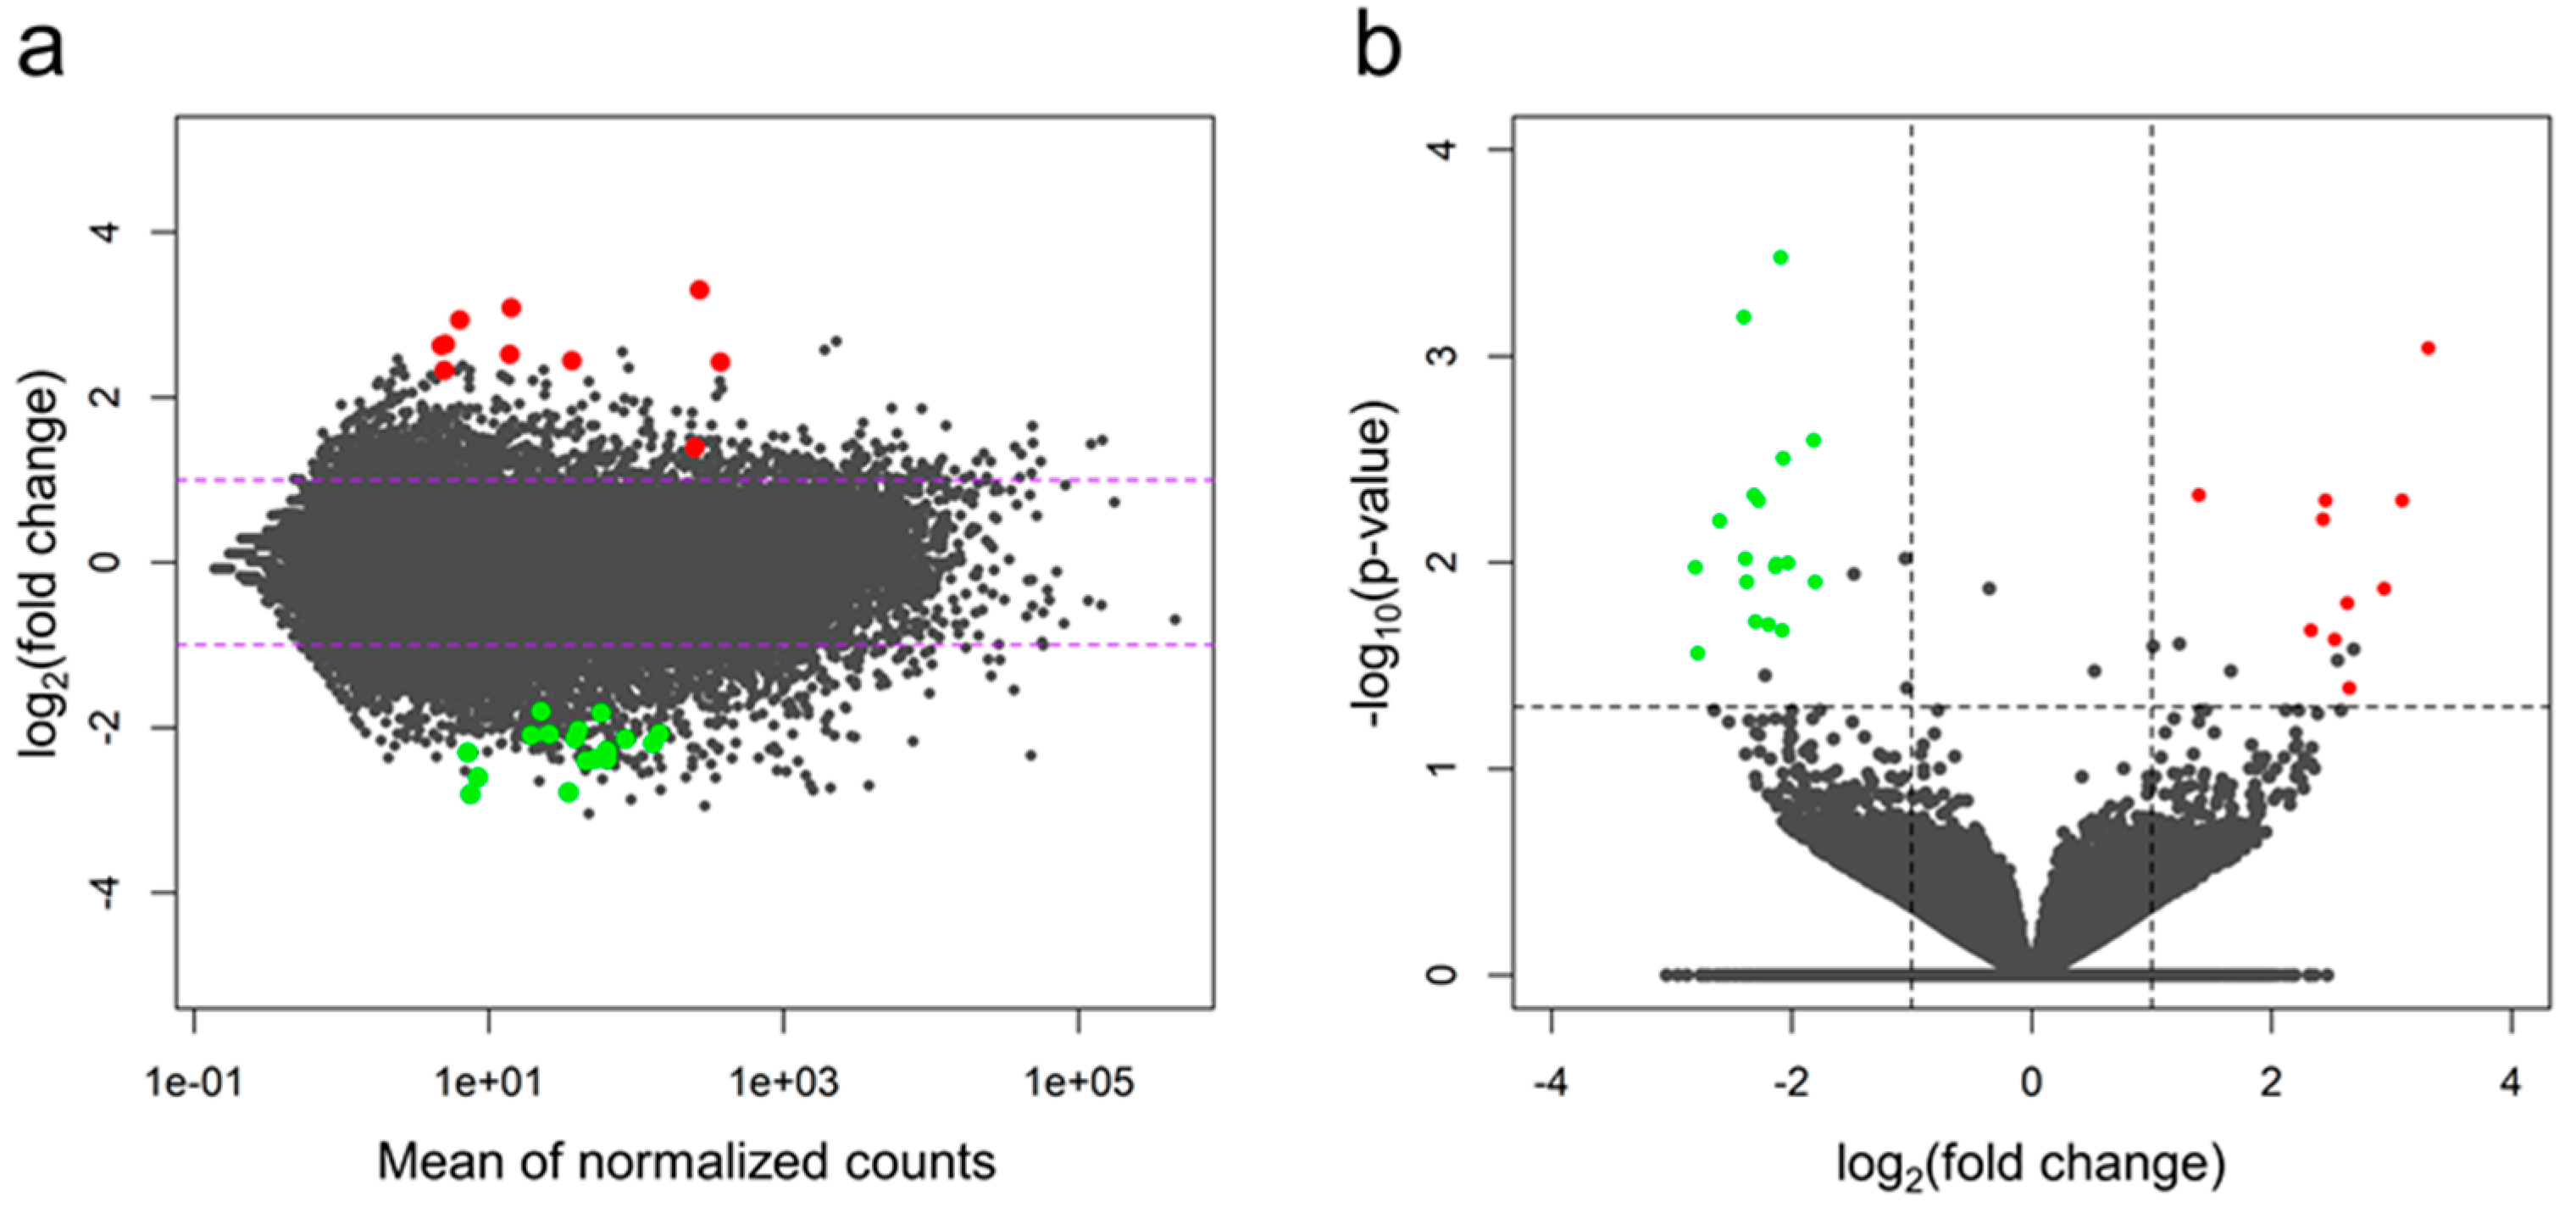
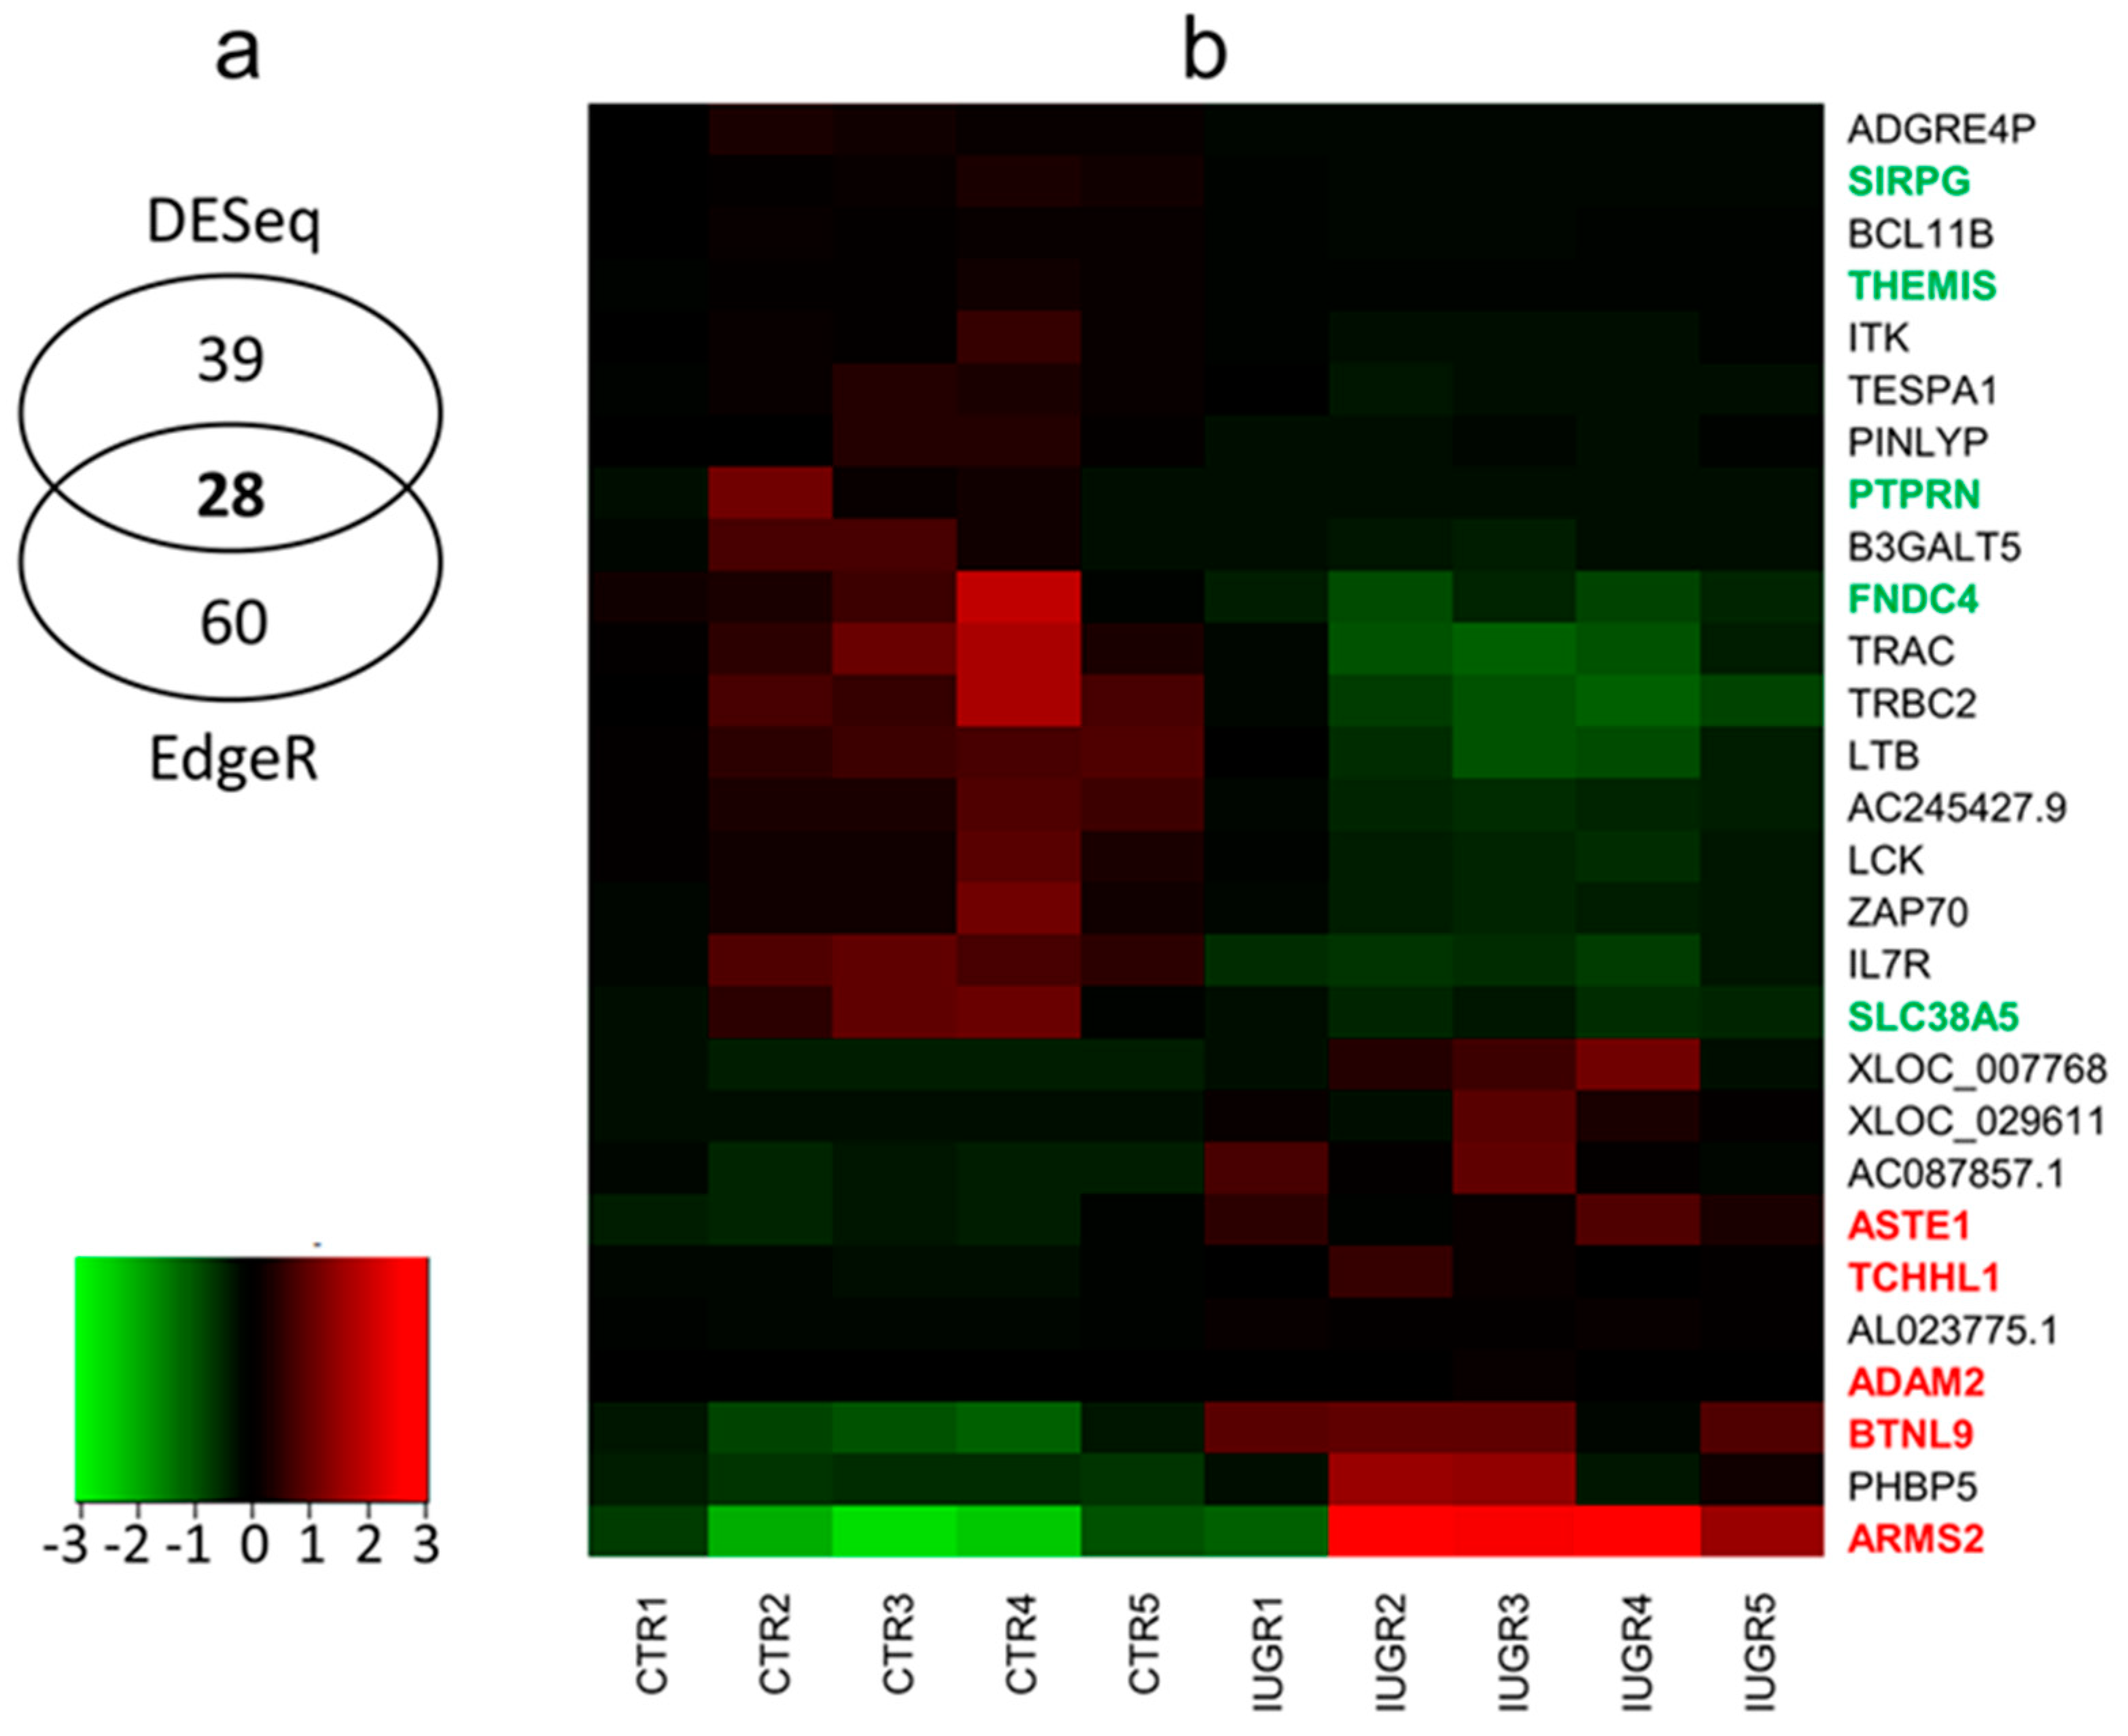
2.2. Differentially-expressed Genes (DEGs) and Functional Annotations

Two algorithms, DESeq2, and edgeR revealed 39 and 60 differentially-expressed genes (adjusted p-value < 0.05), respectively. Normalized counts and logarithmic values of fold change (log2FC) were visualized in MA (Figure 2A) and Volcano plots (Figure 2B).
Merging of these methods allowed the selection of 28 differentially-expressed genes (DEGs), between IUGR-affected and control libraries (Figure 3A; Table 2). Among the identified DEGs, 10 were upregulated and 18 were downregulated in IUGR-affected placentas.
Expression profiles of DEGs were prepared for all biological replicates and presented on heatmap (Figure 3B). The five upregulated protein-coding genes were: ARMS2, ASTE1, ADAM2, TCHHL1, BTNL9. Five the most downregulated gene were: THEMIS, PTPRN, FNDC4, SIRPG, SLC38A5 (Table 2).
The 21 out of 28 DEGs were assigned to 10 main Gene Ontology (GO) categories. Only underexpressed DEGs, engaged mainly in T cell regulation and in the immune response, created biological networks that were qualified as significant. (Table 3). Functional enrichment annotation indicated, that most of the DEGs were implicated in the processes of inflammation and immune disorders (IL7R, PINLYP, FNDC4, ARMS2, LCK, ZAP70, BCL11B, SIRPG, ITK, BTNL9) related with IUGR and preeclampsia (PE). Enrichment Kyoto Encyclopedia of Genes and Genomes (KEGG) analysis revealed DEGs engaged into three metabolic pathways: NF-kappa B signaling pathway (ZAP70, LCK, LTB), T cell receptor signaling pathway (ITK, ZAP70, LCK), and primary immunodeficiency (ZAP70, IL7R, LCK).

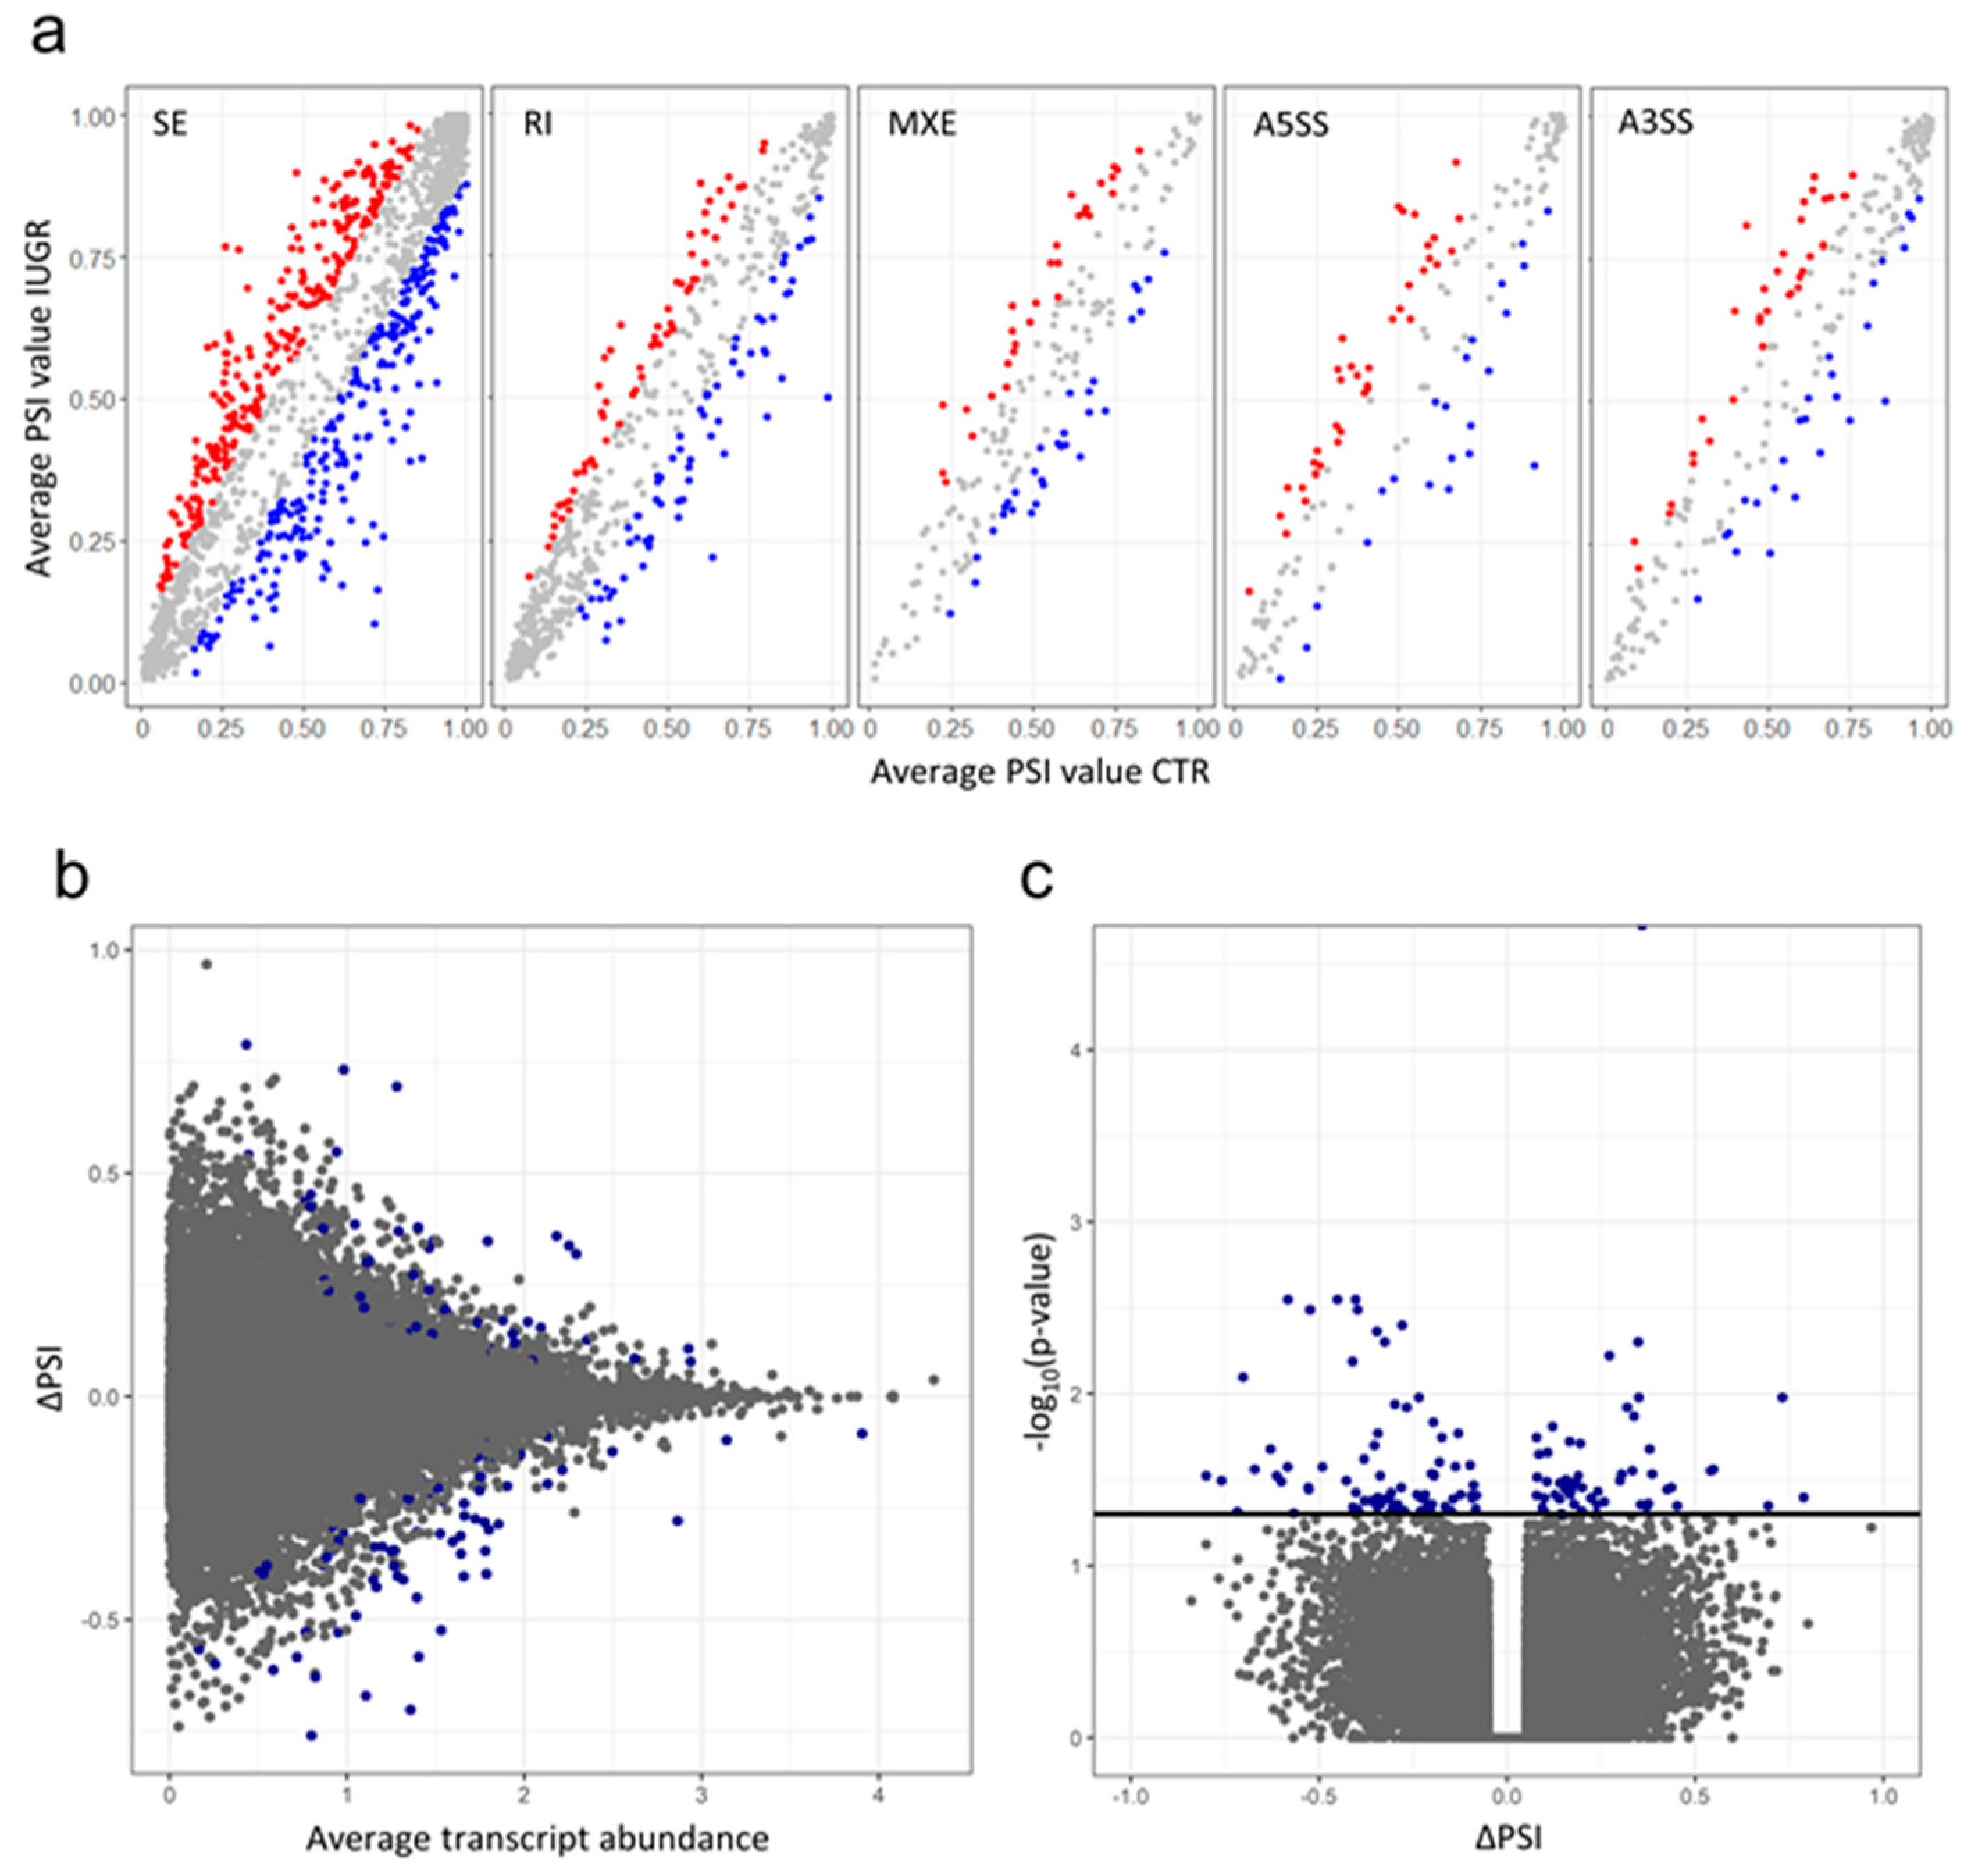
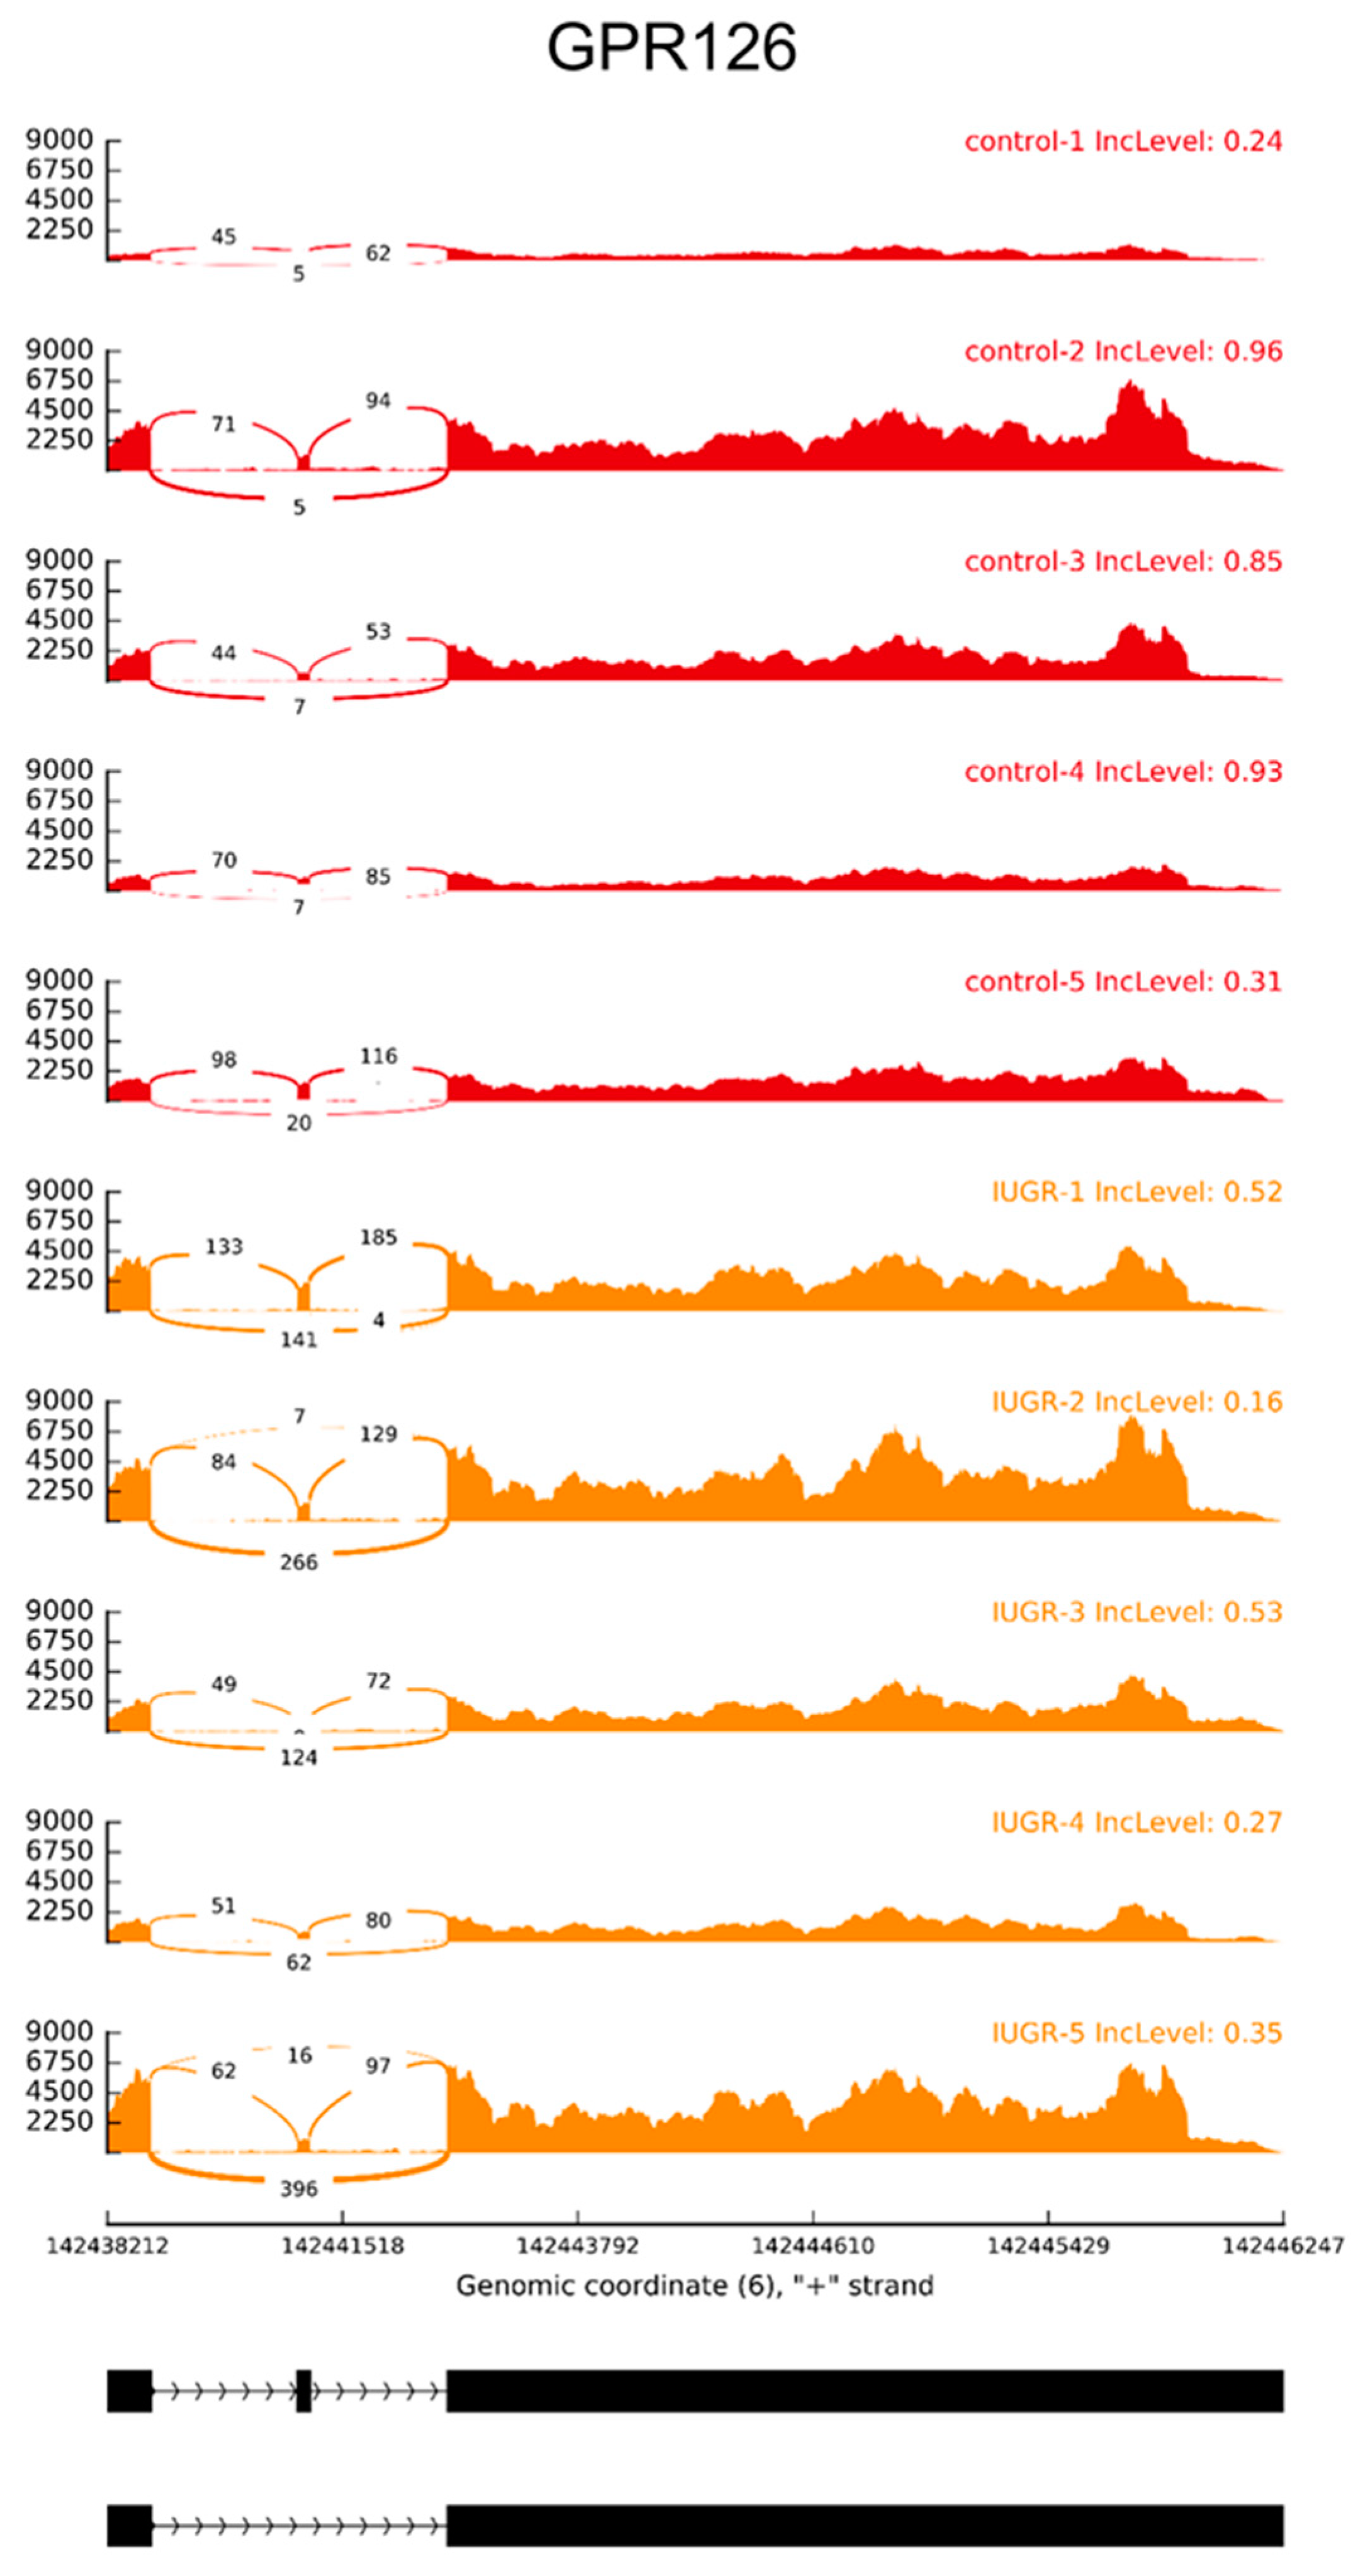
2.3. Alternative Splicing Patterns

Comparing IUGR-affected and control samples the short reads were used to measure percent splicing inclusion (PSI) of the alternative exon, or changes of its inclusion/exclusion (ΔPSI). Alternative splicing events (ASEs) were investigated by rMATs software that permitted to identify 37,527/38,956 splice junctions and reads on target (ROT + JC) and splice junctions only (JC) ASEs and within this group, 2,997/3,691 (ROT+JC/JC) were qualified as differential alternative splicing (DAS) events (Table S1, Figure 4A). Simultaneously, SUPPA method indicated 90,233 ASEs, among them 130 events were significant DAS (Table S1, Figure 4B,C). Finally, 11 DAS genes were detected by both methods and intersected according to genomic localization. Among them 26 DAS events were assigned to 20 skipping exon (SE), three (alternative 3′splice site) A3SS, and three (retention intron) RI by rMATS (Table S1).
In the same pool of genes, SUPPA described 20 DAS including 10 alternative first exon (AF), 8 SE, one alternative last exon (AL) and mutually exclusive exons (MXE) events (Table 4). In the case when both methods predicted the different type of events, we decided to consider SUPPA results as a more precise approach (recover additional types of AS events—AF and AL). Our findings revealed that some genes (S100A13, GPR126, CTRP1, and TFPI) involved in the alternation of splicing events were mainly implicated in angiogenic-related processes. The four alternative exons (skipping events) within SCEL (ΔPSI = 0.36), SIN3B (ΔPSI = 0.09), CTRP1 (ΔPSI = 0.24), and TFPI (ΔPSI = 0.13) tended to be highly included in IUGR samples (Table 4). Moreover, higher percentage of exclusion were calculated within PA28β (ΔPSI = −0.29), PSAP (ΔPSI = −0.1), EVI5 (ΔPSI = −0.31), and GPR126 (ΔPSI = −0.28).
Higher coverage of exon 23 (E23), in the range of GPR126, was detected in IUGR samples, although the higher percentage of this exon usage (inclusion) was discovered in controls (Figure 5). Seven alternative first exon events with higher coverage ratios and PSI scores in controls libraries (-ΔPSI) were indicated in TFPI, PSG6, CTRP1, and S100A13 (Table 4). Moreover, two promoter exons (AF) of TFPI were preferably used in IUGR-affected transcripts. Furthermore, the highest change in the percentage of transcripts with the exon spliced in (ΔPSI = 0.70) was calculated for WARS. Further, PSG6 and TFPI harbored two additional AS events (AL and MXE) with differential splice junction usage (Table 4).

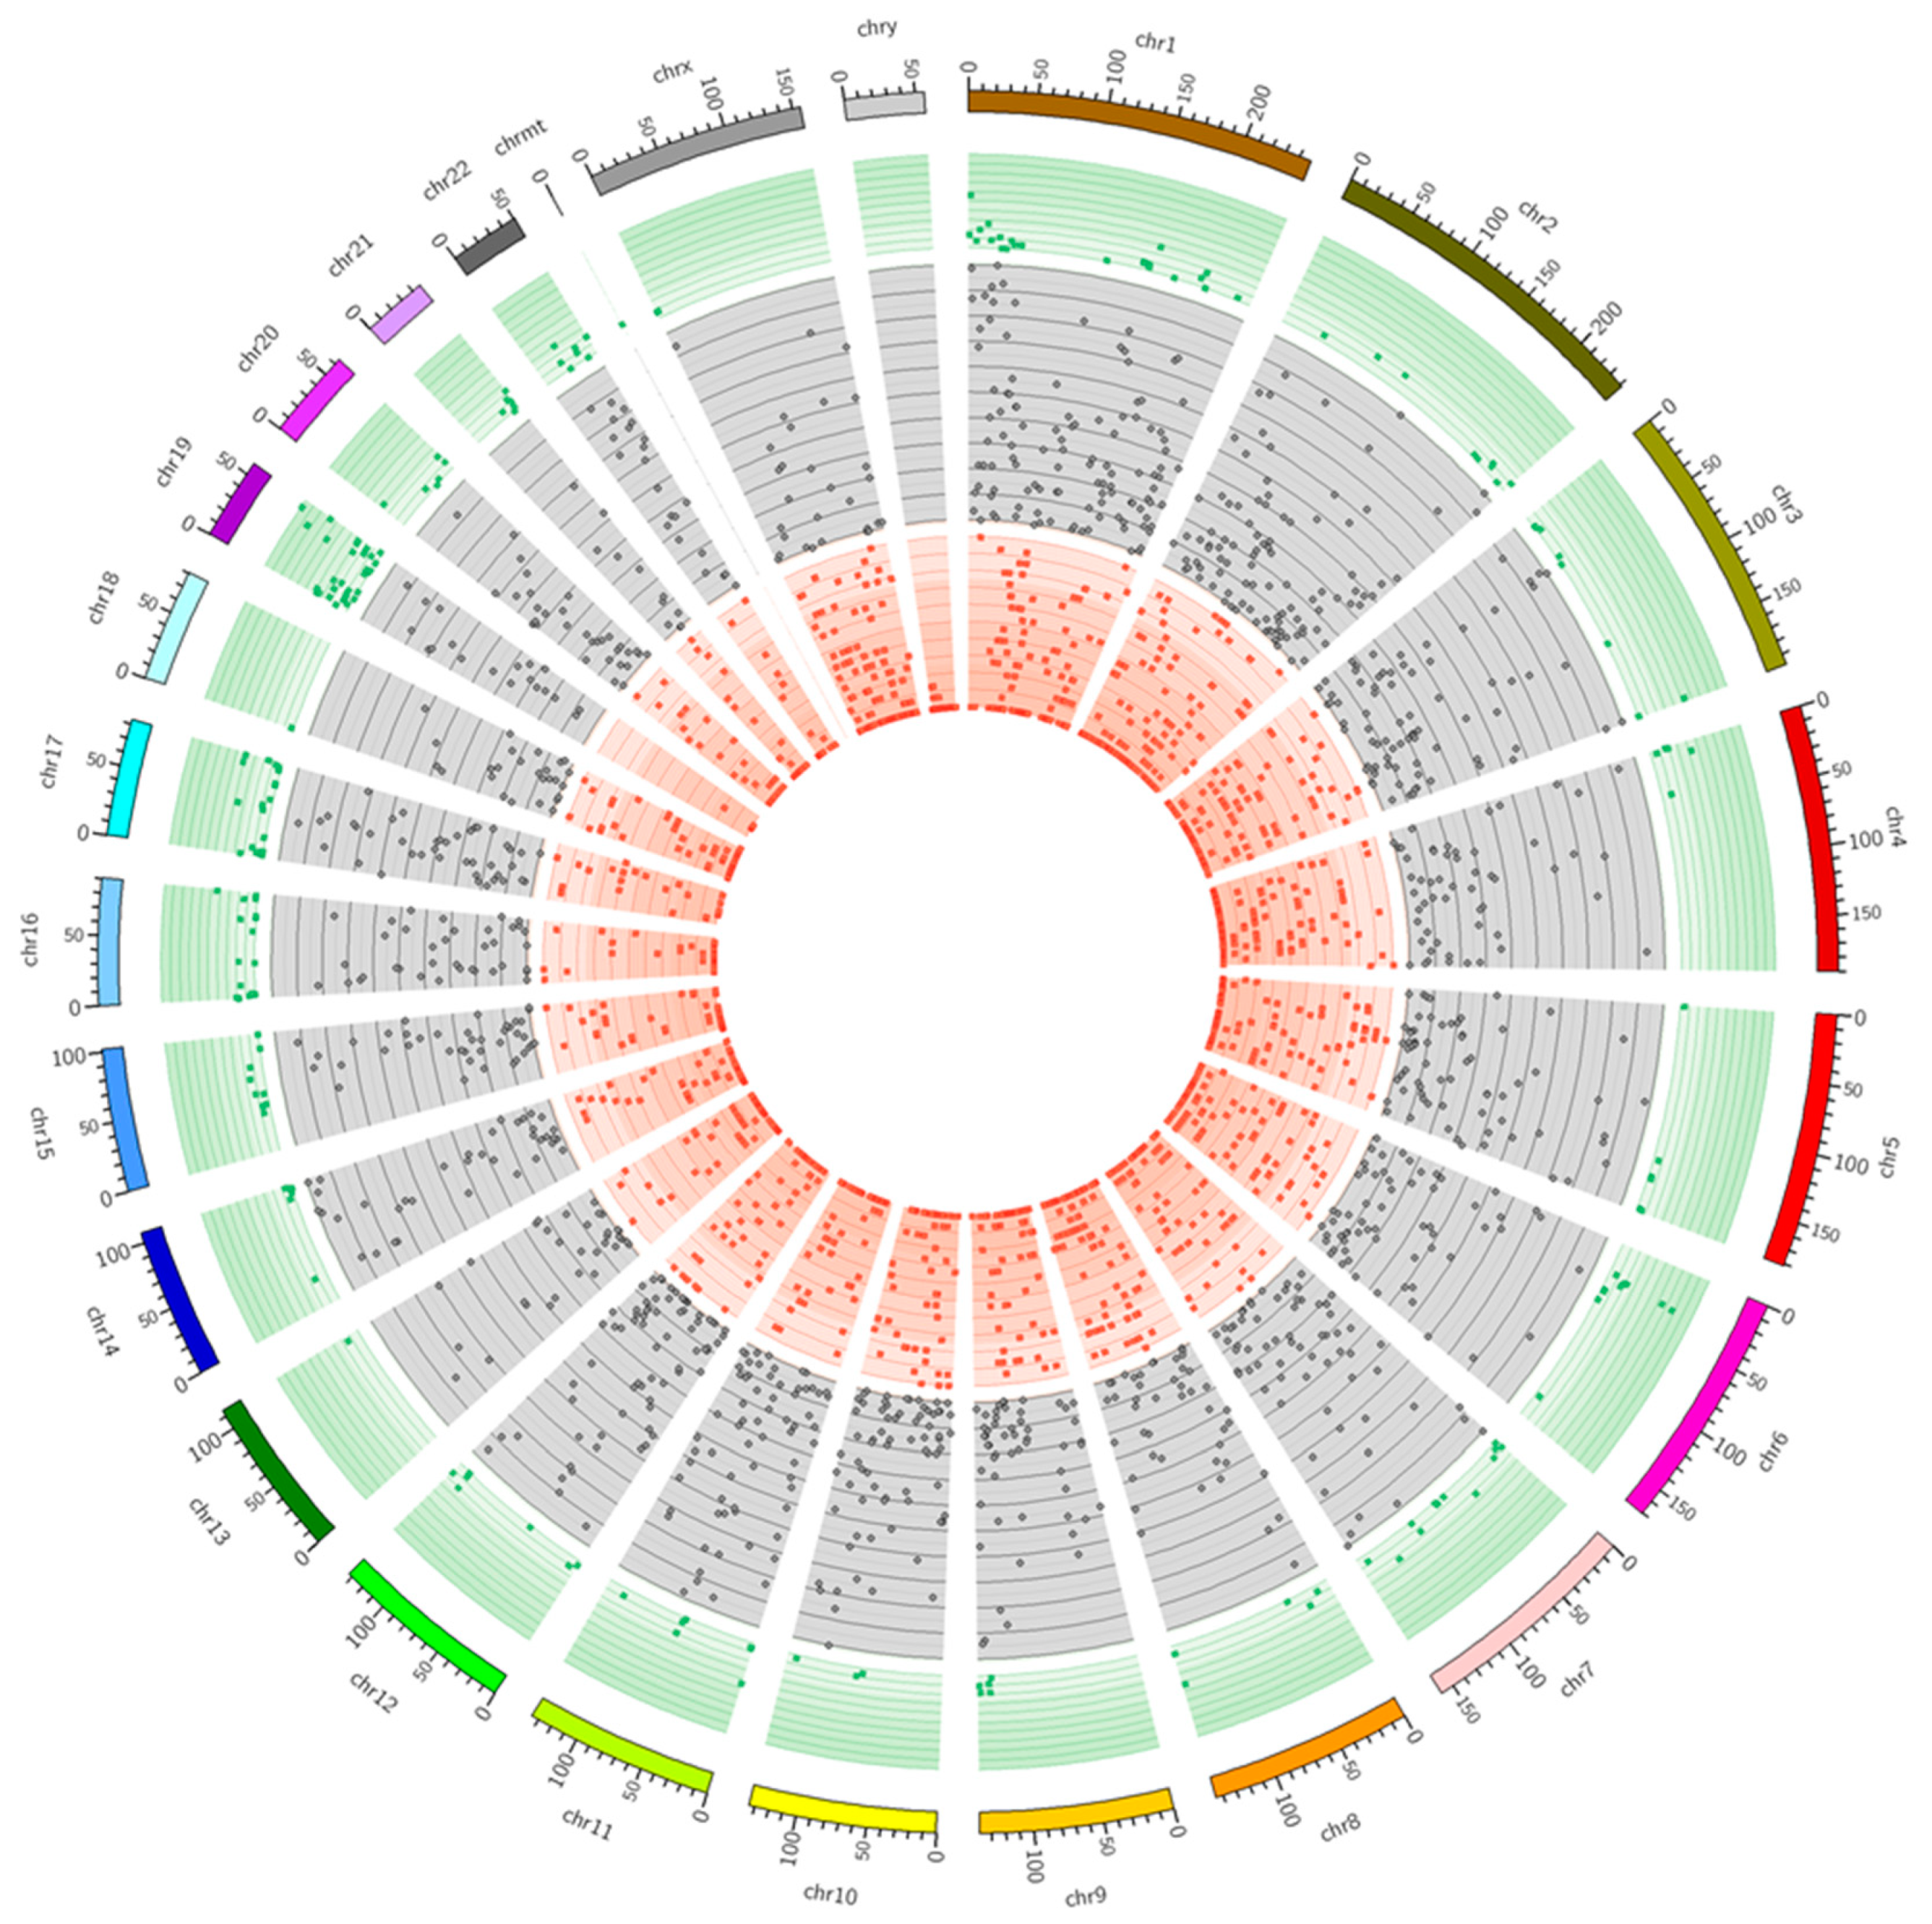
2.4. SNV Calling and RNA Editing Prediction

Based on reads aligned to the human genome, 88,859 SNVs candidates were discovered (Figure 6). After first filtering using standard GATK parameters, 72,275 SNVs were forwarded for further analysis. Substitutions located on bidirectional genes (24,877 SNVs), in the range of paralogous sequence (13,310), repetitive regions (2,529), close to any splice junction (723), and alternative allele fraction detected in a small number of biological replicates (23,184) were removed.
Among 7652 remaining allelic variants, 1,168 were significantly changed (FDR < 0.001) in alternative allele frequency (AAF) and were annotated according to chromosome localization, gene assignment, substitution type, variant functional effect, and transversion/transition ratio by SnpEff. Significant SNVs were overlapped with 6533 transcripts and assigned to 2386 CDS, 1528 introns, 345 5’UTR, 1260 3’UTR, 918 ncRNA, and 10 intergenic regions (Table 5). Within CDS regions, 543 missense substitutions with functional effects were recognized. The highest number of these changes occurred in downstream 5kb range out of 3’UTR (31.4%; Table 5).
GO enrichment analysis of genes with nonsynonymous substitutions (FDR < 0.001) annotated PIEZO1, PODXL, SWAP70 to “regulation of cell-cell adhesion mediated by integrin” biological process. Additionally, two known mutations (rs4575, synonymous; rs3817, on the downstream region) were detected within the range of AS and DEG candidates: PA28β and PINLYP, respectively. Among sites with significant AAF changes, four were qualified (frequency < 0.7 in all samples and no annotation in dbSNP, outside coding region) as the RNA editing candidates. RNA editing canonical candidates (adenosine to inosine, ‘A to I’) were localized within 3’ UTR of EIF2AK2 and CD99L2, and within the intronic regions of PPP1R13L and ARPC2 (Table 6).

3. Discussion

IUGR affects up to 15% of pregnancies [37]. Failure of deep placentation and maldevelopment of the placental villi, reduced cytotrophoblast proliferation, and capillarization constitute common pathologies of IUGR [38,39,40]. The proper placental vasculature is crucial for efficient transfer of nutrients, gases and waste elimination [40]. Imbalance of the immune system results in pathological pregnancies complicated by preeclampsia [41,42]. The condition is related to the increased inflammatory response that may contribute to disease progression [43,44]. IUGR is often complicated by preeclampsia that is manifested by multi-system disorder, as a result of severe maternal gestational hypertension with marked proteinuria [45,46]. Similar abnormalities for both diseases are associated with impaired interaction between the cytotrophoblast and the maternal spiral arteries, shallow placentation associated with endothelial dysfunction and impaired vascularization [47,48,49]. The functional insufficiency of the placenta may lead to miscarriage, fetal growth retardation or premature placental abruption [38]. Nearly one-third of IUGRs are due to genetic causes [4]. The aim of the current research was to present the global expression profile of human term placentas from pregnancies complicated by IUGR. We made an attempt to illustrate not only common differences in gene expression level but also deep transcriptomic changes in spliceosome and editome. Many known human diseases are frequently affected by alternative splicing events (ASEs) and genomic mutations [50]. Some disease-causing mutations (SNP) are conserved in human populations, others may appear spontaneously, i.e., during the transcriptional process. Especially RNA-editing sites may play a crucial role in the modulation of alternative isoforms splicing and consequently influence occurrence and course of diseases. Mutations might enhance or silence splice site signals of pre-mRNA, leading to the formation of the aberrant mRNA and protein products [51].
Pregnancy, complicated by IUGR, is considered to be a pro-inflammatory state with excessive activation of inflammatory cells and cytokines that may promote placental insufficiency [47]. Receptor for interleukin 7 (IL7R) codes the protein that plays a critical role during lymphocytes development [52,53]. Inhibiting of IL- 7/IL- 7R signaling pathway may contribute to maintaining a pregnancy [54]. Dysfunction of IL7R has been detected in patients with severe combined immunodeficiency (SCID) leading to chronic inflammatory diseases [55,56]. Revealed underexpression (log2FC = −2.07) of IL7R could have contributed to the immunological imbalance in IUGR-affected samples. Also, fibronectin type III domain containing 4 (FNDC4) dampen macrophage activation [57,58], and its robust upregulation results in the reduction of inflammation [59]. Considering mentioned functions, the identified underexpression of FNDC4 (log2FC = −2.38), in the growth-restricted placentas, may be associated with progression of pro-inflammatory state contributing to the severity of the disease [57,59]. Gene expression analysis of placental microvascular endothelial cells indicates that butyrophilin like 9 (BTNL9) is significantly upregulated in IUGR [40]. BTNL9 belongs to the butyrophilins (BTNs) family that comprises the molecules able to modulate immune homeostasis [60]. Our data confirmed the significant overexpression of BTNL9 (log2FC = 2.43) in IUGR-affected placentas. It has been speculated that the upregulation of BTNL9 in IUGR may oppose the inflammation associated with this pathology [40]. The IL2 inducible T cell kinase (ITK) regulates both the T and NK-cell development and signaling, influencing inflammatory cytokines secretion [61]. ITK seems to be indispensable in haematopoiesis as its deficiency cause immune dysregulation [62]. We observed decreased expression (log2FC = −2.03) of ITK in IUGR samples that is in agreement with the Zhong et al. [61], who indicated that deficiency of ITK leads to various disorders including malignancies, inflammation, and autoimmune diseases. PINLYP encodes phospholipase A2 inhibitor and LY6/PLAUR domain containing protein that may favor an anti-inflammatory effect [63]. Identified underexpression of PINLYP (log2FC = −1.8) may contribute to pro-inflammatory state. Moreover, we discovered rs3817 SNP (localized on the downstream region; < 5000 bp) close to PINLYP gene, indicating differential alternative allele frequency (ΔAAF), and such significant differences may be associated with PINLYP expression regulation. Additionally, we detected the underexpression (log2FC = −2.19) of beta-1,3-galactosyltransferase 5 (B3GALT5), that variants may be associated with fetal growth [64]. During pregnancy, inflammation may contribute to various disorders so further studies are needed to reveal how exactly the downregulation of mentioned gene affects the placental development leading to growth retardation of the fetus.
IUGR is a multifactorial disorder and any systemic infections might elicit changes in placental structure and might also be associated with increased risk for neurodevelopmental disorders [65,66]. B cell CLL/lymphoma 11B (BCL11B) is a transcriptional factor, required for the postnatal development of the hippocampus so the deficiency results in structural brain defects [67,68]. Patients with BCL11B mutations are affected by SCID and impaired T-cell development [68,69]. Underexpression of BCL11B (log2FC = −2.09) observed in studied IUGR-affected placentas may result in both immune and neuronal imbalance. PA28β proteasome activator subunit 2 (PA28β), a major regulator of the 20S proteasome [70], participates in protein degradation, regulation of cell cycle and antigen processing for the initiation of cell-mediated immunity [71]. Additionally, PA28β inhibits both cell growth and proliferation [72]. We detected ΔAAF in the synonymous site (rs4575) and occurrence of SE (skipping exon) within PA28β with decreasing value of PSI in IUGR samples. Mutations localized close to splice site signals may lead to the production of aberrant mRNA and finally altered protein product [50]. Further, signal regulatory protein gamma (SIRPG) is connected with systemic lupus erythematosus (SLE), one of the maternal risk factors of IUGR [6]. SIRPG expression during the active phase of SLE patients was significantly higher [73], however, our results indicated the downregulation (log2FC = −2.30) of SIRPG, so specific role in IUGR-affected placentas still needs to be explored. Additionally, we identified AAF change in EIF2AK2, the major marker of SLE [74]. Our stringent pipeline qualified this SNV as a candidate of RNA editing site associated with IUGR disorder. Another RNA editing candidates were localized within an intron of PPP1R13L (protein phosphatase 1 regulatory subunit 13 like) and ARPC2 (actin related protein 2/3 complex subunit 2). PPP1R13L is significantly induced during in vitro trophectoderm differentiation [75], and ARPC2 supports endothelial barrier during angiogenesis [76]. RNA editing site was also localized within 3’UTR of CD99L2, that is mostly expressed on leukocytes, endothelial cells and plays a role in extravasation of neutrophils under inflammatory conditions [77]. Selection and maturation of T-cells are regulated by both LCK proto-oncogene, Src family tyrosine kinase (LCK) and tyrosine kinases (ZAP70), as key signaling molecules essential for lymphokine production [78,79], moreover, LCK affects trophoblast invasion and decidualization [80,81]. Our analysis revealed underexpression of ZAP70 (log2FC = −2.14) and LCK (log2FC = −2.13), what could have an impact on growth-retarded fetus. Deficient trophoblast invasion with the inadequate transformation of spiral arteries results in reduced uteroplacental blood flow and diminished placental oxygen levels [47,82]. Another gene found to be differentially-expressed in examined growth restricted placentas was the age-related maculopathy susceptibility 2 (ARMS2; log2FC = 3.30) that has been previously identified as highly expressed in the placenta [83,84]. Elevated levels of ARMS2 protein detected in the growth-restricted twin placenta may be connected with dysfunction of the normal extracellular matrix [85]. Moreover, ARMS2 might interact with pro-inflammatory molecules and impact on angiogenesis [83,86].
IUGR may be also induced through impaired placental nutrient transfer as highly associated with fetal malnutrition [87,88]. Solute carrier family 38 member 5 (SLC38A5) encodes SNAT5 protein, that mediates the cotransport of placental amino acids including glutamine, essential to cellular growth [89,90,91]. The altered expression of nutrient transporters is implicated in diverse mechanisms of fetal development [88]. Microarray analysis detected the SLC38A5 expression as significantly upregulated however, the protein level was only slightly elevated in both IUGR and PE [88]. The current analysis detected downregulation of SLC38A5 (log2FC = −2.28) in IUGR-affected placentas, that might be connected with the cellular metabolic status, modified in such heterogeneous disorder as IUGR [92]. Ligand-receptor interactions of TNF family members impact on placental cell death, growth, migration and hormone production [93]. Our analysis revealed downregulation (log2FC = −1.82) of lymphotoxin beta (LTB), a member of TNF family [94]. Pregnancy-specific glycoproteins (PSGs) are secreted by placental syncytiotrophoblasts [95] and contribute to the maintenance of successful pregnancy as low levels are associated with pathological complications including spontaneous abortion and IUGR [96]. PSG6 have been recently found to be located within a genomic region enriched in segmental duplication of preeclampsia patients [97]. Within the range of PSG6, we observed alternative splicing of last (AL) and first (AF) exon, this may be associated with regulation of various isoforms expression and its consequences secretion of active proteins. SIN3B transcription regulator family member B (SIN3B) regulates the transcription of target genes to influence diverse cellular and biological functions such as embryonic development [98]. Results obtained in the present study provided ASE (skipping exon) within the region of SIN3B gene, and SE events revealed higher PSI values in IUGR samples. This may be related to the stability of protein isoforms and their divergent structures and functions [51]. Another transcriptomic marker of embryo development [99], ADAM metallopeptidase domain 2 (ADAM2) was overexpressed (log2FC = 2.56) within the IUGR-affected placenta. However, a significant decrease in ADAM2 mRNA expression has been found in couples with the failure of in vitro fertilization, making it the valuable predictive marker of the efficiency of assisted reproductive technologies [99,100]. Another gene found to be upregulated in examined placentas was the age-related maculopathy susceptibility 2 (ARMS2; log2FC = 3.30). Elevated levels of ARMS2 protein detected in the growth-restricted twin placenta are suggested to be connected with dysfunction of the extracellular matrix [85]. Moreover, ARMS2 interacts with pro-inflammatory molecules and impact on angiogenesis [101].
Analysis of SNP with recoding effect revealed PIEZO1, PODXL, and SWAP70 as genes involved in the regulation of cell-cell adhesion mediated by integrins. Expression of integrins allows invasion of the trophoblasts into the endometrium and promotes placentation [102]. Several diseases, including IUGR, are caused by vascular problems that may be explained by anomalies in integrin patterns [103]. Together with the maternal uteroplacental circulation, the fetoplacental vasculature is essential for placental perfusion and determines fetal growth and successful pregnancy outcome [38,104]. Piezo type mechanosensitive ion channel component 1 (PIEZO1), is an important molecular marker of blood flow in the placenta and has the potential to be a new therapeutic target for the treatment of placental vascular diseases [105]. Switching B cell complex subunit SWAP70 is involved in regulating migration and invasion of trophoblast cells during the processes of embryonic implantation as well as placentation [106]. Podocalyxin (PODXL) is significantly increased in early-onset preeclampsia and may represent a novel marker of maternal endothelial cell dysfunction [107,108]. Taking under consideration such important functions of the above genes our results concerning recoding effect of identified SNPs should be further investigated.
Placental vascular pathologies represent multisystem disorders that may cause placental hypoperfusion, leading to IUGR [109], and affected placentas have significantly increased vascular lesions [110]. In the current analysis, we detected the set of angiogenesis-related genes associated with IUGR disorders. A pro-angiogenic factor (S100A13) is involved in angiogenesis by regulating cell signaling and endothelial cells metabolism [111]. Our investigation revealed decreased alternative usage of the first exon (AF) within S100A13. This alternative promoter change of S100A13 may be essential in the adjustment processes of placental angiogenesis. Additionally, IUGR generated higher exon skipping rates within adhesion G protein-coupled receptor G6 (GPR126) gene, associated with endothelial cells of umbilical veins and angiogenesis [112]. Furthermore, a series of differential ASEs were identified on genomic loci of TFPI and CTRP1. Three splicing types (AF, SE, and MXE) detected within TFPI may alter the stability of the transcript causing unproductive placental splicing isoforms occurrence. Tissue factor pathway inhibitor (TFPI) regulates the extrinsic pathway of coagulation and plays a critical role in haemostasis [113]. Since TFPI is found in syncytiotrophoblasts, cytotrophoblasts, vascular endothelium, and macrophages of term pregnancy [114,115], the perturbations of placental expression may be involved in the occurrence of obstetrical vascular complications [116]. Furthermore, TFPI-deficient embryos die with signs of severe growth retardation [114]. We identified interesting spliceosome effect within CTRP1 gene, affected by IUGR, revealed by underexpression of the alternative first exon, but with higher PSI value in the range of cassette exon. C1q/TNF-α–related protein 1 (CTRP1) exerts an anti-inflammatory effect by suppressing pro-inflammatory cytokine expression, and inflammatory responses in vascular cells [117,118]. CTRP1 functions as an adipokine to prevent the development of pathological vascular remodeling [119]. Disturbed regulation of alternative promoters, exon skipping, and mutually exclusive exons of these genes are valuable to elucidate IUGR etiology. Lower PSI value of SE event, detected within prosaposin (PSAP), may modulate gene function by removing protein domains and affecting protein activity. PSAP effects on the oligomerization of secreted PGRN monomers what might be detectable on protein-protein interaction [120]. Our data indicated that high PGRN expression, although not statistically significant, may be related to the splicing modulatory effect of PSAP. Trophoblastic expression of the PGRN was upregulated during the third trimester in cases of FGR and PE [121], however, the specific function of PSAP in placental vasculogenesis needs to be evaluated. Additionally, we detected the inclusion of sciellin (SCEL) cassette exon that may promote longer (active) protein isoform production. SCEL transcripts were upregulated by prolonged exposure to biomechanical stress in vascular smooth muscle cells [122]. Our investigation revealed that SCEL expression is regulated by alternative splicing, which may be affected by various IUGR factors. Tryptophanyl tRNA synthetase (WARS) has two variants that are produced via alternative splicing with anti-angiogenic activity [123]. WARS proteins were identified as downregulated in placentas complicated with gestational diabetes mellitus, one of the main risk factor of IUGR [6,124]. Our analysis enriched the present knowledge of WARS, indicating that increased exon usage of alternative promoter (AF) during pathological state suggest higher susceptibility of unknown transcription factor recruitment. Identified alternative variants should be further investigated to explore their potential role in IUGR pathobiology and the possibility to use as therapeutic targets.

4. Materials and Methods

4.1. Ethics Statement

All clinical samples were collected at the Clinical Ward for Gynecology, Obstetrics, and Oncological Gynecology at the Regional Specialist Hospital in Olsztyn. The experimental protocol was approved by the Bioethics Committee of the Warmia-Mazury Medical Chamber (OIL. 164/15/Bioet) in Olsztyn, Poland. The hand-written informed consent, containing information about this study, was obtained from all of the pregnant women.

4.2. Clinical Characteristics of Placental Samples

The aim of the study was to compare the expression pattern of human term placenta between IUGR (n = 5) and control samples (n = 5). IUGR-affected placentas for the study group were collected from patients who underwent an elective or immediate cesarean section, due to the symptoms of the insufficiency of the fetal circulation or the abruption of the placenta. IUGR samples were confirmed not to bear any chromosomal abnormalities. Placentas for the control group were collected from healthy women, with no clinical abnormal signs of gestation, normal fetus growth, and development, at term pregnancy, who underwent a scheduled Cesarean section (CS) before the onset of labor due to states after previous CS. To reduce the sex bias, the placenta samples were derived from both fetus sexes. Placentas for the study group were collected from women with diagnosed IUGR. Fetal Growth Calculator (https://medicinafetalbarcelona.org/calc/) was applied to determine the percentiles based on estimated fetal weight, biparietal diameter, head circumference, abdominal circumference, and femur length that were appointed ultrasonographically and values of pulsatile index flows into medial cerebral artery, umbilical artery, maternal uterine arteries, resistance index, and systolic/diastolic ratio were calculated (GE Voluson 730). Abnormal fetal growth was recognized in these pregnancies where ultrasound EFW was below the 10th centile [8]. To diagnose IUGR, vessels flow should be estimated as a poor or cerebroplacental ratio below the 5th percentile or mean uterine artery pulsatility index higher than 95th percentile or correct flows but with EFW ≤ 3rd percentile, for given gestational age. For all patients, gestational age was confirmed by the assessing the first day of last menstrual period confirmed by the ultrasound scans with crown-rump length measurement performed during the first trimester of the pregnancy (between 8th–12th week) in 28-days cycles or only by ultrasound scans (between 8–10 weeks of pregnancy) in women with irregular cycles. Samples of placental tissues were collected immediately after delivery then, small pieces of placentas were frozen in liquid nitrogen. Preserved tissues were stored at −70 °C until RNA extraction.

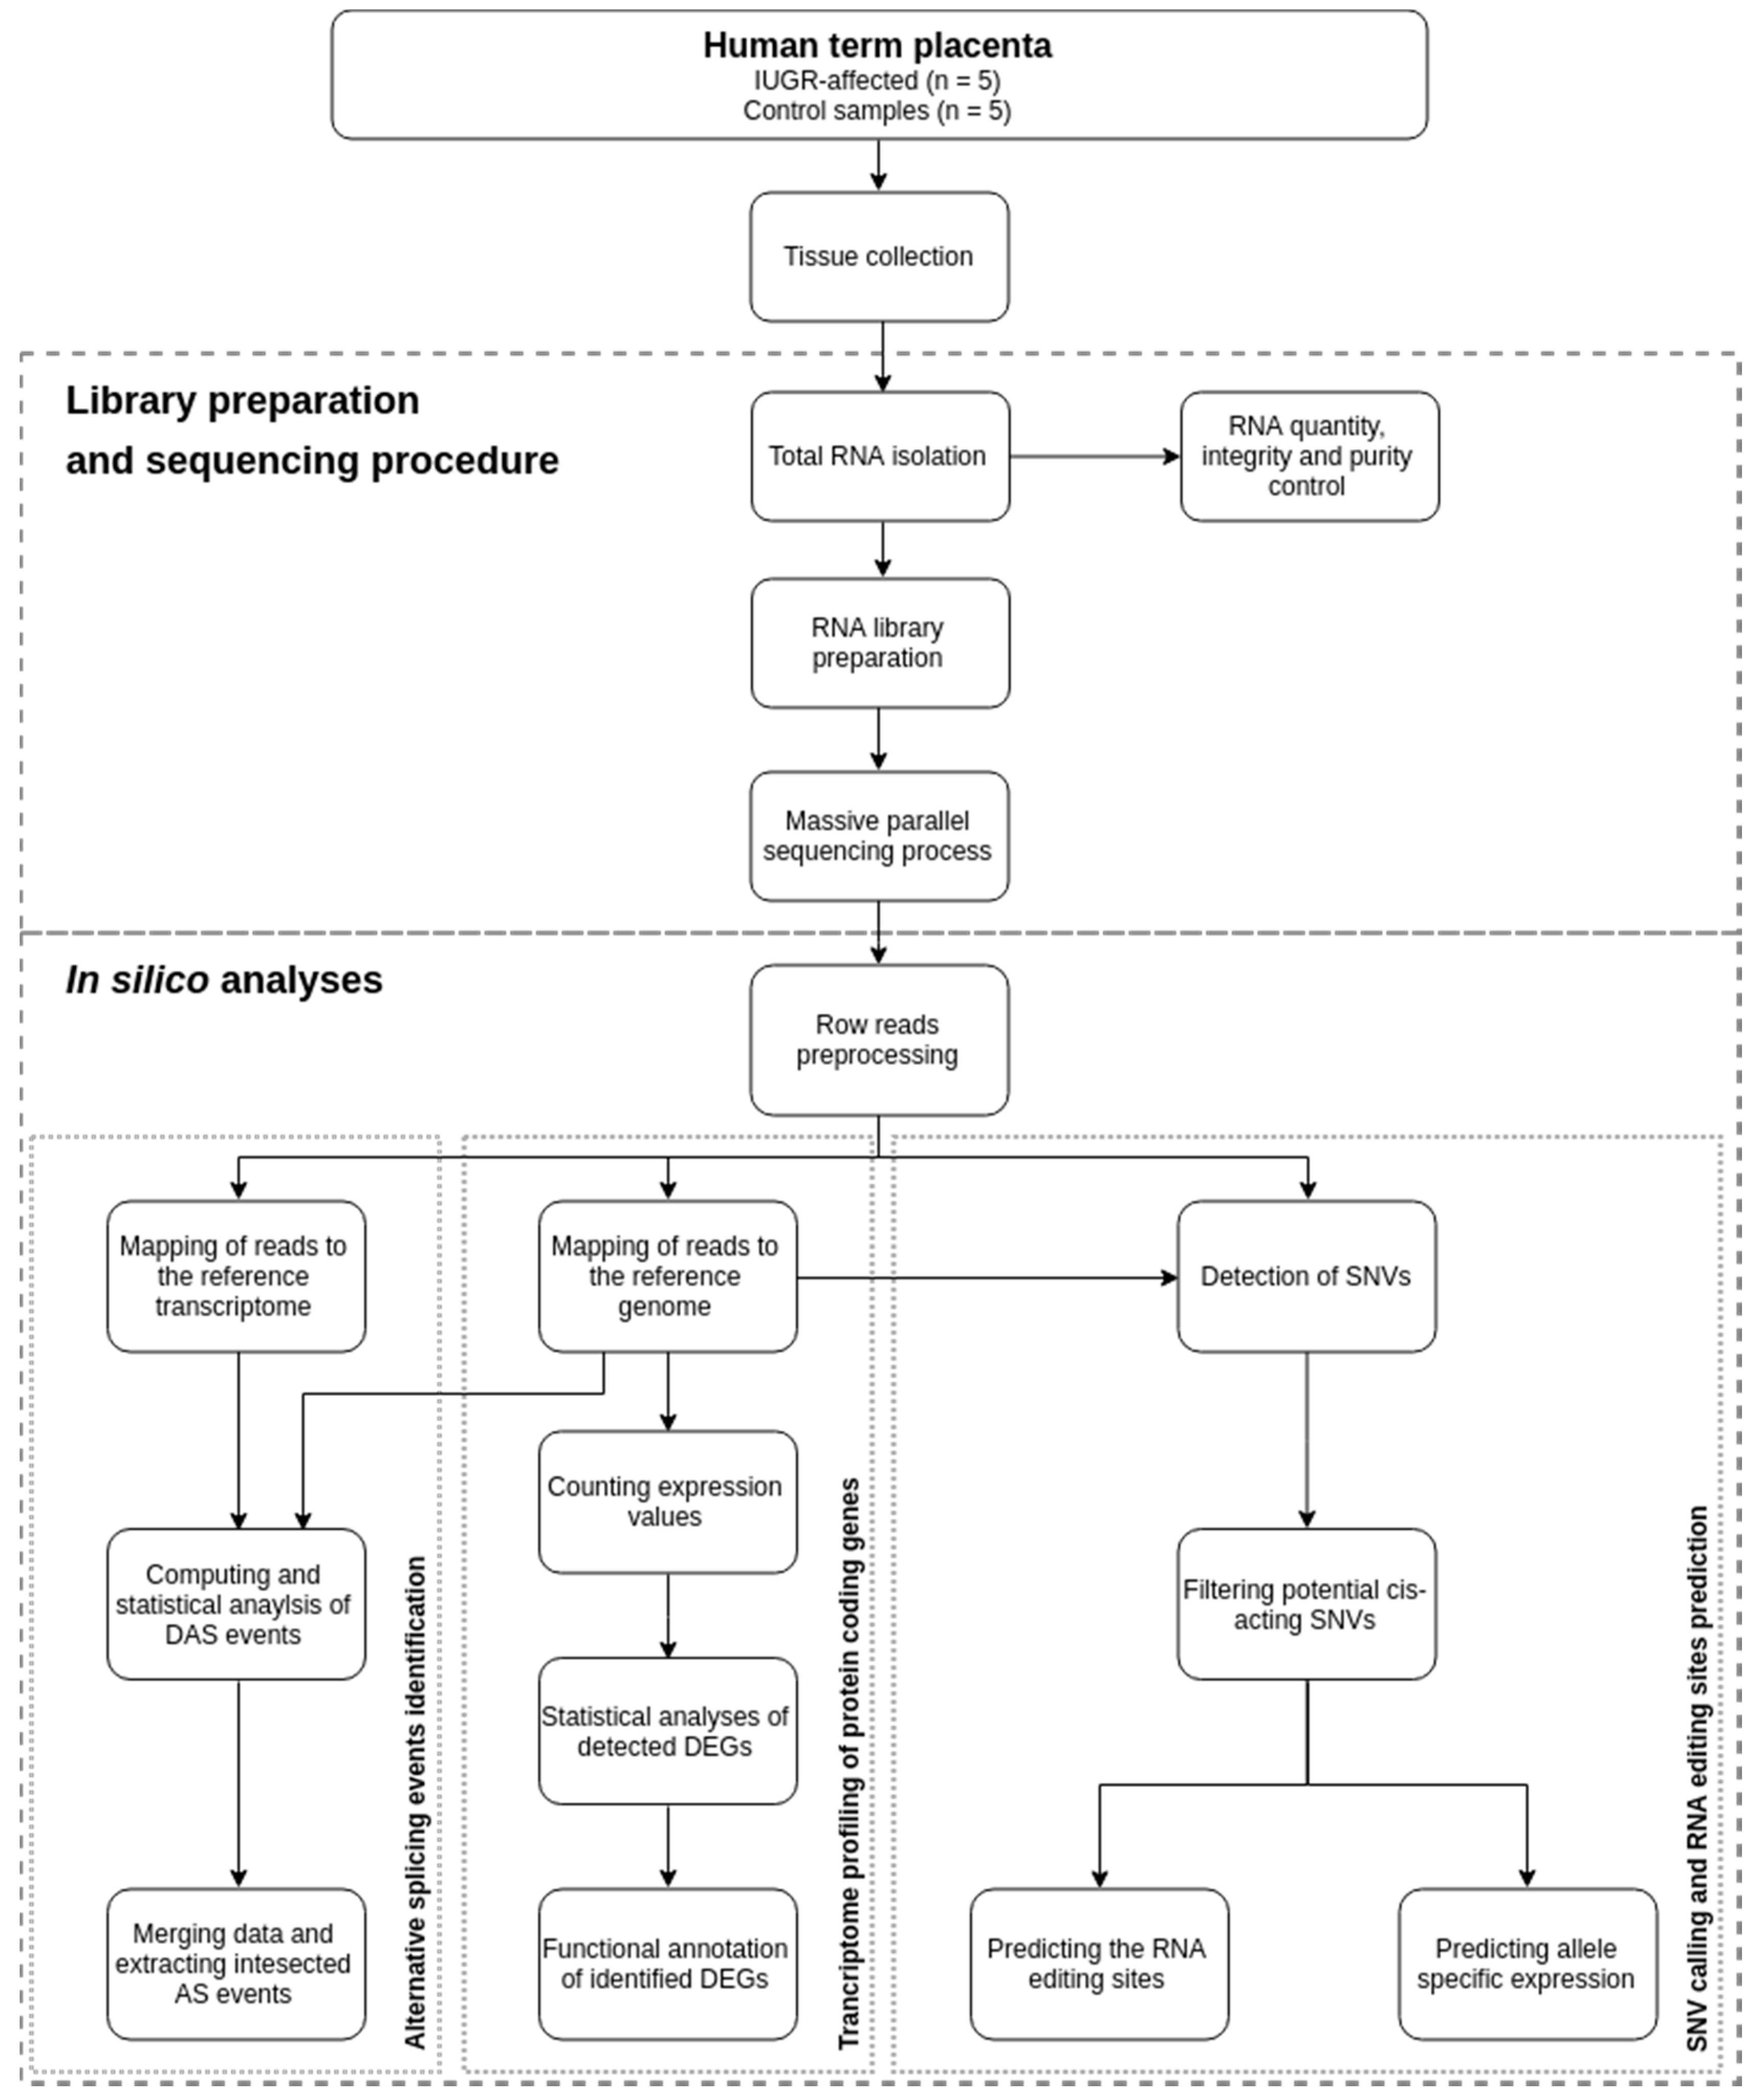
4.3. Library Preparation and Sequencing Procedure

Total RNA was isolated from the placental tissues using the Qiagen RNeasy Kit according to the manufacturer’s recommendations. The RNase-Free DNase Set (Qiagen Venlo, The Netherlands) with DNA-ase digestion was used to obtain high-quality RNA. The total RNA concentration was calculated by Quant-IT RiboGreen (Invitrogen, Waltham, MA, USA). To assess the integrity of the total RNA, samples were run on the TapeStation RNA screentape (Agilent Technologies, Waldbronn, Germany). Only high-quality RNA preparations, with RIN greater than 8.0, were used for RNA library construction. A library was prepared with 1ug of total RNA for each sample by Illumina TruSeq mRNA Sample Prep kit (Illumina, Inc., San Diego, CA, USA). The first step in the workflow involved purifying the poly-A containing mRNA molecules using poly-T-attached magnetic beads. Following purification, the mRNA was fragmented into small pieces using divalent cations under elevated temperature. The cleaved RNA fragments were copied into first strand cDNA using SuperScript II reverse transcriptase (Invitrogen, Waltham, MA, USA) and random primers. This was followed by second strand cDNA synthesis using DNA Polymerase I and RNase H. These cDNA fragments then went through an end repair process, the addition of a single ‘A’ base, and then ligation of the indexing adapters. The products were then purified and enriched with PCR to create the final cDNA library. The libraries were quantified using qPCR according to the qPCR Quantification Protocol Guide (KAPA Library Quantification kits for Illumina Sequencing platforms) and qualified using the TapeStation D1000 ScreenTape (Agilent Technologies, Waldbronn, Germany). Indexed libraries were then sequenced using the HiSeq4000 platform (Illumina, San Diego, CA, USA). The sequencing data from this study have been submitted (https://www.ebi.ac.uk/ena) to the European Nucleotide Archive under accession no. PRJEB30656.

4.4. Quality Control and Mapping Processes

The raw paired-end reads quality was verified using the FastQC software v. 0.11.7 [www.bioinformatics.babraham.ac.uk]. Preprocessing using a Trimmomatic software v. 0.32 [125] included removal of Illumina adaptors and poly(A) stretches, exclusion of low-quality reads (Phred cutoff score ≤ 20; calculated on both ends of reads and with 10bp frameshift), and trimming of reads to equal length (90 bp). Next, paired-end clean reads were mapped to the reference human genome (Homo_sapiens.GRCh38.dna.primary_assembly.fa) with ENSEMBL/GENCODE annotation (Homo_sapiens.GRCh38.90.gtf) applying the STAR software v. 2.4 [https://github.com/alexdobin/STAR] mapper. Samtools software [126] was used for conversion BAM to SAM format. Further, Picard tool (with MarkDuplicates function) was used to remove multi-mapped reads and retain uniquely aligned reads in SAM file. StringTie v. 1.3.3 [https://0-ccb-jhu-edu.brum.beds.ac.uk/software/stringtie] [127] was used to prepare new annotations by merging Ensembl GTF file with reads mapped to the reference genome. Count expression values were estimated by ballgown software [128] and prepDE.py python script (stringtie module). All transcript sequences were extracted to FASTA file using a gffread script (https://github.com/gpertea/gffread). Mapping, SAM to BAM conversion and expression level calculation, as memory intensive processes, were performed in Regional IT Center of University of Warmia and Mazury in Olsztyn, applying 24-core CPU and 136 GB RAM server.

4.5. Transcriptome Profiling of Protein-coding Genes

Genome-wide transcriptome analysis of IUGR-affected placentas (Figure 1) was applied to identify transcriptome profiles and reveal the alternative regulation mechanism of spliceosome and editome. Count gene expression matrix was examined by two statistical methods, DESeq2 [129] and edgeR [130]. Both of them were applied to obtain the stringent results of differentially-expressed genes (DEGs). The changes in gene expression levels were considered as significant when statistical test values (adjusted p-value) were lower than 0.05. Candidate DEGs were visualized in an MA, volcano and heatmap plots with gplots [131] and ggplot2 [132] R Bioconductor packages [http://www.r-project.org/]. Obtained DEGs were scanned by Gene ontology (GO) and KEGG pathway databases using g.Profiler [133] software.

4.6. Alternative Splicing Events

We aimed to predict percent splicing inclusion (PSI) of the alternative exon, or changes of its inclusion (ΔPSI). Differential alternative splicing (DAS) events were explored by two compatible methods: a super-fast pipeline for alternative splicing analysis (SUPPA) [134] and the replicate multivariate analysis of transcript splicing (rMATS) [135]. Both software calculated ΔPSI score between IUGR-affected and control samples. Splicing analysis performed by SUPPA calculated PSI values directly from transcript isoform abundance. In order to receive SUPPA score, we extracted uniquely mapped reads from BAM files and remapped these reads to the reference transcriptome using Salmon software [136]. Next, SUPPA scripts generated potential splicing events and estimated ΔPSI values were statistically tested between biological replicates of IUGR-affected and controls samples. Standard parameters of rMATS v3.2.1 were applied to identify alternative splicing events (ASEs) using mapping to splice junctions and reads on target (ROT + JC) and splice junctions only (JC). Significant DAS events (FDR < 0.05) from rMATS and SUPPA were intersected using BEDTools software [137]. Obtained final set of DAS events were classified according to seven splicing types: alternative 5′splice site (A5SS), alternative 3′splice site (A3SS), alternative first exon (AF), alternative last exon (AL), mutually exclusive exons (MXE), retention intron (RI), and skipping exon (SE). Visualization of ASEs events was performed by maser package [138] and rmats2sashimiplot.py scripts [https://github.com/Xinglab/rmats2sashimiplot].

4.7. SNV calling and RNA Editing Sites Prediction

Picard tool [http://picard.sourceforge.net] was applied in the recalibration process to filter out reads that may constitute a noise disturbing single nucleotide variants (SNVs) calling. Variant calling analysis was performed by rMATS-DVR [139] and GATK tool (the golden standard for variant detection by NGS) [140]. Heterozygous genomic position of each potential SNV was statistically proven by UnifiedGenotyper and collected in Variant Call Format (VCF). Identified SNVs were described, for IUGR-affected and control samples, by allele and reference fraction, allele fraction difference, p-value, FDR value, chromosomal position, gene, and single nucleotide polymorphism (SNP) annotation. To predict RNA editing site, R Bioconductor multi-step analysis was applied to filter previously detected SNVs. First, SNVs were filtered out according to standard GATK parameters: total depth of base coverage <10; RMSMappingQuality <40; QualitybyDepth < 2; MappingQualityRankSum < −12.5; and ReadPosRankSum < −8. Moreover, all SNVs located within: 5bp intronic flanking region, bidirectional transcription regions (sense and antisense genes), and simple sequence repeat (SSR) regions (with +/− 3 bp range) identified by GMATo tool [141] were filtered out. SNVs, along with 50 bp upstream and downstream sequences, were aligned to the human genome by BLAT [142], to eliminate multi-aligned SNVs, localized within repetitive regions or paralogs. Further, SNVs displaying alternative allele fraction = 0, in at least five libraries, were also excluded from the dataset. According to the assumption of the next filter, the occurrence of alternative allele must have been observed in more than half samples of the experiment. To point out variants related to IUGR disorder only SNVs with significant allele differentiation (FDR < 0.001) were selected to the annotation step. Survived SNVs were tested by VEP [143] and SnpEff [144] to predict the effects of variants. Annotated variants were divided into potential RNA editing sites and SNVs associated with IUGR. We qualified variants as potential RNA editing site when the frequency of alternative allele was < 0.7 in all samples, the substitution was canonical (A-to-I and C-to-U) and the site was unclassified in dbSNP. The second pool consisted of known variants (rs_ID in dbSNP), noncanonical substitutions, intergenic sites and all variants with alternative allele frequency > 0.7 at least one sample. Circos software package [145] was implemented to visualize all IUGR-affected variants. Additionally, to identify the functions of the genes harboring SNVs, GO analysis was performed.

5. Conclusions

Despite progress in the field of molecular diagnosis, there is still an urgent need to develop detection, prevention, and management of IUGR-affected pregnancies to improve their outcomes. Investigating the molecular mechanisms underlying the IUGR could be useful for better understanding of placental signaling pathways. This severe gestational condition still lacks direct causation and is a valid scientific target. We pointed novel genes that are dysregulated in IUGR, which can serve as a basis for identifying the mechanisms underlying pathological pregnancies, as well as may be useful for early detection of the genomic defects. The tremendous efforts should be undertaken to decipher their implication in the course of gestation, placenta development and reproductive disorders.

Supplementary Materials

Supplementary materials can be found at https://0-www-mdpi-com.brum.beds.ac.uk/1422-0067/20/6/1510/s1. Figure S1. The mean percentage distribution for intergenic, intronic, UTR, and coding regions of aligned bases for all input data. Table S1. DAS events investigated by rMATs and SUPPA in IUGR-affected and control samples.

Author Contributions

M.M. conceived the conception and study design, performed experimental work, and drafted the manuscript; A.L. assisted in the study design, performed experimental work, and helped in writing the manuscript; L.P. and J.P.J. analyzed the data; K.S. participated in experimental work; M.G. provided placental samples; E.L. provided important intellectual support; M.J. helped in writing the final version of the manuscript; and M.K.M. approved the final version of the manuscript. All authors have seen and approved the final version.

Funding

This study was supported by the School of Medicine, Collegium Medicum (61.610.001-300), University of Warmia and Mazury in Olsztyn.

Conflicts of Interest

The authors declare no conflict of interest.

Availability of Supporting Data

The sequencing data from this study have been submitted (https://www.ebi.ac.uk/ena) to the European Nucleotide Archive under accession no. PRJEB30656.

References

  1. Albu, A.R.; Anca, A.F.; Horhoianu, V.V.; Horhoianu, I.A. Predictive factors for intrauterine growth restriction. J. Med. Life 2014, 7, 165–171. [Google Scholar] [PubMed]
  2. Vayssière, C.; Sentilhes, L.; Ego, A.; Bernard, C.; Cambourieu, D.; Flamant, C.; Gascoin, G.; Gaudineau, A.; Grangé, G.; Houfflin-Debarge, V.; et al. Fetal growth restriction and intra-uterine growth restriction: Guidelines for clinical practice from the French College of Gynaecologists and Obstetricians. Eur. J. Obstet. Gynecol. Reprod. Biol. 2015, 193, 10–18. [Google Scholar] [CrossRef] [PubMed]
  3. Unterscheider, J.; Daly, S.; Geary, M.P.; Kennelly, M.M.; McAuliffe, F.M.; O’Donoghue, K.; Hunter, A.; Morrison, J.J.; Burke, G.; Dicker, P.; et al. Optimizing the Definition of Intrauterine Growth Restriction. Obstet. Gynecol. Surv. 2013, 68, 549–551. [Google Scholar] [CrossRef]
  4. Sharma, D.; Sharma, P.; Shastri, S. Genetic, metabolic and endocrine aspect of intrauterine growth restriction: An update. J. Matern. Neonatal Med. 2017, 30, 2263–2275. [Google Scholar] [CrossRef] [PubMed]
  5. Carducci, B.; Bhutta, Z.A. Care of the growth-restricted newborn. Best Pract. Res. Clin. Obstet. Gynaecol. 2018, 49, 103–116. [Google Scholar] [CrossRef]
  6. Sharma, D.; Shastri, S.; Farahbakhsh, N.; Sharma, P. Intrauterine growth restriction—Part 1. J. Matern. Neonatal Med. 2016, 29, 3977–3987. [Google Scholar] [CrossRef]
  7. Figueras, F.; Gratacos, E. An integrated approach to fetal growth restriction. Best Pract. Res. Clin. Obstet. Gynaecol. 2017, 38, 48–58. [Google Scholar] [CrossRef]
  8. Hadlock, F.P.; Harrist, R.B.; Sharman, R.S.; Deter, R.L.; Park, S.K. Estimation of fetal weight with the use of head, body, and femur measurements—A prospective study. Am. J. Obstet. Gynecol. 1985, 151, 333–337. [Google Scholar] [CrossRef]
  9. Sahoo, R.K.; Nayak, S.; Panda, S.K.; Pati, P.B.; Sahoo, S.; Sahu, M.C. Doppler assessment of the fetus with intrauterine growth restriction. Int. J. Pharm. Sci. Rev. Res. 2015, 32, 162–170. [Google Scholar] [CrossRef]
  10. Villalaín, C.; Herraiz, I.; Quezada, M.S.; Gómez-Arriaga, P.I.; Gómez-Montes, E.; Galindo, A. Fetal Biometry and Doppler Study for the Assessment of Perinatal Outcome in Stage I Late-Onset Fetal Growth Restriction. Fetal Diagn. Ther. 2018, 44, 1–7. [Google Scholar] [CrossRef]
  11. Sharma, D.; Farahbakhsh, N.; Shastri, S.; Sharma, P. Intrauterine growth restriction—Part 2. J. Matern. Neonatal Med. 2016, 29, 4037–4048. [Google Scholar] [CrossRef] [PubMed]
  12. Gordijn, S.J.; Beune, I.M.; Thilaganathan, B.; Papageorghiou, A.; Baschat, A.A.; Baker, P.N.; Silver, R.M.; Wynia, K.; Ganzevoort, W. Consensus definition of fetal growth restriction: A Delphi procedure. Ultrasound Obstet. Gynecol. 2016, 48, 333–339. [Google Scholar] [CrossRef] [PubMed]
  13. Capros, H.; Scoricova, I.; Mihalcean, L. Intrauterine growth restriction: Contemporary issues in diagnosis and management. Mold. Med. J. 2017, 60, 26–30. [Google Scholar] [CrossRef]
  14. Zeitlin, J.; El Ayoubi, M.; Jarreau, P.H.; Draper, E.S.; Blondel, B.; Künzel, W.; Cuttini, M.; Kaminski, M.; Gortner, L.; Van Reempts, P.; et al. Impact of fetal growth restriction on mortality and morbidity in a very preterm birth cohort. J. Pediatr. 2010, 157, 733.e1–739.e1. [Google Scholar] [CrossRef]
  15. Serena, C.; Marchetti, G.; Rambaldi, M.P.; Ottanelli, S.; Di Tommaso, M.; Avagliano, L.; Pieralli, A.; Mello, G.; Mecacci, F. Stillbirth and fetal growth restriction. J. Matern. Neonatal Med. 2013, 26, 16–20. [Google Scholar] [CrossRef]
  16. Sharma, D.; Shastri, S.; Sharma, P. Intrauterine Growth Restriction: Antenatal and Postnatal Aspects. Clin. Med. Insights Pediatr. 2016, 10, 67–83. [Google Scholar] [CrossRef] [PubMed] [Green Version]
  17. Damodaram, M.; Story, L.; Kulinskaya, E.; Rutherford, M.; Kumar, S. Early adverse perinatal complications in preterm growth-restricted fetuses. Aust. N. Z. J. Obstet. Gynaecol. 2011, 51, 204–209. [Google Scholar] [CrossRef]
  18. Murray, E.; Fernandes, M.; Fazel, M.; Kennedy, S.; Villar, J.; Stein, A. Differential effect of intrauterine growth restriction on childhood neurodevelopment: A systematic review. BJOG An Int. J. Obstet. Gynaecol. 2015, 122, 1062–1072. [Google Scholar] [CrossRef]
  19. Wixey, J.A.; Chand, K.K.; Colditz, P.B.; Bjorkman, S.T. Review: Neuroinflammation in intrauterine growth restriction. Placenta 2017, 54, 117–124. [Google Scholar] [CrossRef] [Green Version]
  20. Gardosi, J.; Madurasinghe, V.; Williams, M.; Malik, A.; Francis, A. Maternal and fetal risk factors for stillbirth: Population based study. BMJ 2013, 346, f108. [Google Scholar] [CrossRef]
  21. Mayer, C.; Joseph, K.S. Fetal growth: A review of terms, concepts and issues relevant to obstetrics. Ultrasound Obstet. Gynecol. 2013, 41, 136–145. [Google Scholar] [CrossRef] [PubMed]
  22. Sarvari, S.I.; Rodriguez-Lopez, M.; Nuñez-Garcia, M.; Sitges, M.; Sepulveda-Martinez, A.; Camara, O.; Butakoff, C.; Gratacos, E.; Bijnens, B.; Crispi, F. Persistence of Cardiac Remodeling in Preadolescents With Fetal Growth Restriction. Circ. Cardiovasc. Imaging 2017, 10, 1–9. [Google Scholar] [CrossRef] [PubMed]
  23. Yzydorczyk, C.; Armengaud, J.B.; Peyter, A.C.; Chehade, H.; Cachat, F.; Juvet, C.; Siddeek, B.; Simoncini, S.; Sabatier, F.; Dignat-George, F.; et al. Endothelial dysfunction in individuals born after fetal growth restriction: Cardiovascular and renal consequences and preventive approaches. J. Dev. Orig. Health Dis. 2017, 8, 448–464. [Google Scholar] [CrossRef] [PubMed]
  24. Haroun, H.S.W. Intrauterine Growth Restriction. Anat. Physiol. Biochem. Int. J. 2017, 1, 555572. [Google Scholar] [CrossRef]
  25. Eydoux, P.; Choiset, A.; le Porrier, N.; Thépot, F.; Szpiro-Tapia, S.; Alliet, J.; Ramond, S.; Viel, J.F.; Gautier, E.; Morichon, N.; et al. Chromosomal prenatal diagnosis: Study of 936 cases of intrauterine abnormalities after ultrasound assessment. Prenat. Diagn. 1989, 9, 255–269. [Google Scholar] [CrossRef] [PubMed]
  26. Veerbeek, J.H.W.; Nikkels, P.G.J.; Torrance, H.L.; Gravesteijn, J.; Post Uiterweer, E.D.; Derks, J.B.; Koenen, S.V.; Visser, G.H.A.; Van Rijn, B.B.; Franx, A. Placental pathology in early intrauterine growth restriction associated with maternal hypertension. Placenta 2014, 35, 696–701. [Google Scholar] [CrossRef] [PubMed]
  27. Groom, K.M.; David, A.L. The role of aspirin, heparin, and other interventions in the prevention and treatment of fetal growth restriction. Am. J. Obstet. Gynecol. 2018, 218, S829–S840. [Google Scholar] [CrossRef]
  28. Salomon, L.J.; Malan, V. Bilan étiologique du retard de croissance intra-utérin (RCIU). La Revue Sage-Femme 2014, 13, 99–110. [Google Scholar] [CrossRef]
  29. Deshpande, S.S.; Balasinor, N.H. Placental Defects: An Epigenetic Perspective. Reprod. Sci. 2018, 25, 1143–1160. [Google Scholar] [CrossRef]
  30. John, R.M. Imprinted genes and the regulation of placental endocrine function: Pregnancy and beyond. Placenta 2017, 56, 86–90. [Google Scholar] [CrossRef] [Green Version]
  31. Lipka, A.; Paukszto, L.; Majewska, M.; Jastrzebski, J.P.; Myszczynski, K.; Panasiewicz, G.; Szafranska, B. Identification of differentially-expressed placental transcripts during multiple gestations in the Eurasian beaver (Castor fiber L.). Reprod. Fertil. Dev. 2017, 29, 2073. [Google Scholar] [CrossRef]
  32. Lipka, A.; Panasiewicz, G.; Majewska, M.; Paukszto, L.; Bieniek-Kobuszewska, M.; Szafranska, B. Identification of Placental Aspartic Proteinase in the Eurasian Beaver (Castor fiber L.). Int. J. Mol. Sci. 2018, 19, 1229. [Google Scholar] [CrossRef] [PubMed]
  33. Majewska, M.; Lipka, A.; Paukszto, L.; Jastrzebski, J.P.; Myszczynski, K.; Gowkielewicz, M.; Jozwik, M.; Majewski, M.K. Transcriptome profile of the human placenta. Funct. Integr. Genomics 2017, 17, 551–563. [Google Scholar] [CrossRef] [Green Version]
  34. Majewska, M.; Lipka, A.; Paukszto, L.; Jastrzebski, J.P.; Gowkielewicz, M.; Jozwik, M.; Majewski, M.K. Preliminary RNA-Seq Analysis of Long Non-Coding RNAs Expressed in Human Term Placenta. Int. J. Mol. Sci. 2018, 19, 1894. [Google Scholar] [CrossRef] [PubMed]
  35. Juiz, N.A.; Torrejón, I.; Burgos, M.; Torres, A.M.F.; Duffy, T.; Cayo, N.M.; Tabasco, A.; Salvo, M.; Longhi, S.A.; Schijman, A.G. Alterations in Placental Gene Expression of Pregnant Women with Chronic Chagas Disease. Am. J. Pathol. 2018, 188, 1345–1353. [Google Scholar] [CrossRef] [PubMed]
  36. Sitras, V.; Paulssen, R.; Leirvik, J.; Vårtun, Å.; Acharya, G. Placental Gene Expression Profile in Intrauterine Growth Restriction Due to Placental Insufficiency. Reprod. Sci. 2009, 16, 701–711. [Google Scholar] [CrossRef] [PubMed]
  37. Leftwich, H.K.; Stetson, B.; Sabol, B.; Leung, K.; Hibbard, J.; Wilkins, I. Growth restriction: Identifying fetuses at risk. J. Matern. Neonatal Med. 2018, 31, 1962–1966. [Google Scholar] [CrossRef] [PubMed]
  38. Kingdom, J.; Huppertz, B.; Seaward, G.; Kaufmann, P. Development of the placental villous tree and its consequences for fetal growth. Eur. J. Obstet. Gynecol. Reprod. Biol. 2000, 92, 35–43. [Google Scholar] [CrossRef]
  39. Fitzgerald, B.; Levytska, K.; Kingdom, J.; Walker, M.; Baczyk, D.; Keating, S. Villous trophoblast abnormalities in extremely preterm deliveries with elevated second trimester maternal serum hCG or inhibin-A. Placenta 2011, 32, 339–345. [Google Scholar] [CrossRef]
  40. Dunk, C.E.; Roggensack, A.M.; Cox, B.; Perkins, J.E.; Senius, F.; Keating, S.; Weksberg, R.; Kingdom, J.C.P.; Adamson, S.L. A distinct microvascular endothelial gene expression profile in severe IUGR placentas. Placenta 2012, 33, 285–293. [Google Scholar] [CrossRef]
  41. Fu, B.; Tian, Z.; Wei, H. TH17 cells in human recurrent pregnancy loss and pre-eclampsia. Cell. Mol. Immunol. 2014, 11, 564–570. [Google Scholar] [CrossRef] [Green Version]
  42. Piccinni, M.-P.; Lombardelli, L.; Logiodice, F.; Kullolli, O.; Romagnani, S.; Le Bouteiller, P. T helper cell mediated-tolerance towards fetal allograft in successful pregnancy. Clin. Mol. Allergy 2015, 13, 9. [Google Scholar] [CrossRef] [PubMed]
  43. Granger, J.P.; Alexander, B.T.; Llinas, M.T.; Bennett, W.A.; Khalil, R.A. Pathophysiology of preeclampsia: Linking placental ischemia/hypoxia with microvascular dysfunction. Microcirculation 2002, 9, 147–160. [Google Scholar] [CrossRef]
  44. LaMarca, B. The role of immune activation in contributing to vascular dysfunction and the pathophysiology of hypertension during preeclampsia. Minerva Ginecol. 2010, 62, 105–120. [Google Scholar] [CrossRef] [PubMed]
  45. Sankaralingam, S.; Arenas, I.A.; Lalu, M.M.; Davidge, S.T. Preeclampsia: Current understanding of the molecular basis of vascular dysfunction. Expert Rev. Mol. Med. 2006, 8, 1–20. [Google Scholar] [CrossRef]
  46. Trogstad, L.; Magnus, P.; Stoltenberg, C. Pre-eclampsia: Risk factors and causal models. Best Pract. Res. Clin. Obstet. Gynaecol. 2011, 25, 329–342. [Google Scholar] [CrossRef] [PubMed]
  47. Ness, R.B.; Sibai, B.M. Shared and disparate components of the pathophysiologies of fetal growth restriction and preeclampsia. Am. J. Obstet. Gynecol. 2006, 195, 40–49. [Google Scholar] [CrossRef]
  48. Myatt, L. Placental adaptive responses and fetal programming. J. Physiol. 2006, 572, 25–30. [Google Scholar] [CrossRef] [Green Version]
  49. Faraci, M.; Renda, E.; Monte, S.; Di Prima, F.A.F.; Valenti, O.; De Domenico, R.; Giorgio, E.; Hyseni, E. Fetal growth restriction: Current perspectives. J. Prenat. Med. 2011, 5, 31–33. [Google Scholar] [PubMed]
  50. Pagani, F.; Baralle, F.E. Genomic variants in exons and introns: Identifying the splicing spoilers. Nat. Rev. Genet. 2004, 5, 389–396. [Google Scholar] [CrossRef] [PubMed]
  51. Park, E.; Pan, Z.; Zhang, Z.; Lin, L.; Xing, Y. The Expanding Landscape of Alternative Splicing Variation in Human Populations. Am. J. Hum. Genet. 2018, 102, 11–26. [Google Scholar] [CrossRef]
  52. Mazzucchelli, R.; Durum, S.K. Interleukin-7 receptor expression: Intelligent design. Nat. Rev. Immunol. 2007, 7, 144–154. [Google Scholar] [CrossRef]
  53. Palmer, M.J.; Mahajan, V.S.; Trajman, L.C.; Irvine, D.J.; Lauffenburger, D.A.; Chen, J. Interleukin-7 Receptor Signaling Network: An Integrated Systems Perspective. Cell. Mol. Immunol. 2008, 5, 79–89. [Google Scholar] [CrossRef] [PubMed] [Green Version]
  54. Wu, L.; Li, J.; Xu, H.L.; Xu, B.; Tong, X.H.; Kwak-Kim, J.; Liu, Y.S. IL-7/IL-7R signaling pathway might play a role in recurrent pregnancy losses by increasing inflammatory Th17 cells and decreasing Treg cells. Am. J. Reprod. Immunol. 2016, 76, 454–464. [Google Scholar] [CrossRef] [PubMed]
  55. Inchley, C.S.; Østerholt, H.C.D.; Sonerud, T.; Fjærli, H.O.; Nakstad, B. Downregulation of IL7R, CCR7, and TLR4 in the cord blood of children with respiratory syncytial virus disease. J. Infect. Dis. 2013, 208, 1431–1435. [Google Scholar] [CrossRef] [PubMed]
  56. Liao, C.Y.; Yu, H.W.; Cheng, C.N.; Chen, J.S.; Lin, C.W.; Chen, P.C.; Shieh, C.C. A novel pathogenic mutation on Interleukin-7 receptor leading to severe combined immunodeficiency identified with newborn screening and whole exome sequencing. J. Microbiol. Immunol. Infect. 2018, S1684-1182(18)30049-5. [Google Scholar] [CrossRef] [PubMed]
  57. Lee, W.; Yun, S.; Choi, G.H.; Jung, T.W. Fibronectin Type III Domain Containing 4 attenuates hyperlipidemia-induced insulin resistance via suppression of inflammation and ER stress through HO-1 expression in adipocytes. Biochem. Biophys. Res. Commun. 2018, 502, 129–136. [Google Scholar] [CrossRef]
  58. Goyer, B.; Thériault, M.; Gendron, S.P.; Brunette, I.; Rochette, P.J.; Proulx, S. Extracellular Matrix and Integrin Expression Profiles in Fuchs Endothelial Corneal Dystrophy Cells and Tissue Model. Tissue Eng. Part A 2018, 24, 607–615. [Google Scholar] [CrossRef] [PubMed]
  59. Bosma, M.; Gerling, M.; Pasto, J.; Georgiadi, A.; Graham, E.; Shilkova, O.; Iwata, Y.; Almer, S.; Söderman, J.; Toftgård, R.; et al. FNDC4 acts as an anti-inflammatory factor on macrophages and improves colitis in mice. Nat. Commun. 2016, 7, 11314. [Google Scholar] [CrossRef] [PubMed] [Green Version]
  60. Arnett, H.A.; Viney, J.L. Immune modulation by butyrophilins. Nat. Rev. Immunol. 2014, 14, 559–569. [Google Scholar] [CrossRef]
  61. Zhong, Y.; Johnson, A.J.; Byrd, J.C.; Dubovsky, J.A. Targeting Interleukin-2-Inducible T-cell Kinase (ITK) in T-Cell Related Diseases. Postdoc J. 2014, 2, 1–11. [Google Scholar] [CrossRef]
  62. Alme, C.; Satwani, P.; Alobeid, B.; Bhagat, G.; Kelly, K.M. Atypical clinical course in pediatric Hodgkin lymphoma: Association with germline mutations in interleukin-2-inducible T-cell kinase. J. Pediatr. Hematol. Oncol. 2015, 37, 507–508. [Google Scholar] [CrossRef] [PubMed]
  63. Vélez, J.I.; Lopera, F.; Sepulveda-Falla, D.; Patel, H.R.; Johar, A.S.; Chuah, A.; Tobón, C.; Rivera, D.; Villegas, A.; Cai, Y.; et al. APOE*E2 allele delays age of onset in PSEN1 E280A Alzheimer’s disease. Mol. Psychiatry 2016, 21, 916–924. [Google Scholar] [CrossRef] [PubMed]
  64. Schierding, W.; Antony, J.; Karhunen, V.; Vääräsmäki, M.; Franks, S.; Elliott, P.; Kajantie, E.; Sebert, S.; Blakemore, A.; Horsfield, J.A.; et al. GWAS on prolonged gestation (post-term birth): Analysis of successive Finnish birth cohorts. J. Med. Genet. 2018, 55, 55–63. [Google Scholar] [CrossRef]
  65. Brown, A.S.; Hooton, J.; Schaefer, C.A.; Zhang, H.; Petkova, E.; Babulas, V.; Perrin, M.; Gorman, J.M.; Susser, E.S. Elevated Maternal Interleukin-8 Levels and Risk of Schizophrenia in Adult Offspring. Am. J. Psychiatry 2004, 161, 889–895. [Google Scholar] [CrossRef] [PubMed]
  66. Beversdorf, D.Q.; Manning, S.E.; Hillier, A.; Anderson, S.L.; Nordgren, R.E.; Walters, S.E.; Nagaraja, H.N.; Cooley, W.C.; Gaelic, S.E.; Bauman, M.L. Timing of Prenatal Stressors and Autism. J. Autism Dev. Disord. 2005, 35, 471–478. [Google Scholar] [CrossRef] [PubMed]
  67. Whitton, L.; Apostolova, G.; Rieder, D.; Dechant, G.; Rea, S.; Donohoe, G.; Morris, D.W. Genes regulated by SATB2 during neurodevelopment contribute to schizophrenia and educational attainment. PLoS Genet. 2018, 14, e1007515. [Google Scholar] [CrossRef] [PubMed]
  68. Lessel, D.; Gehbauer, C.; Bramswig, N.C.; Schluth-Bolard, C.; Venkataramanappa, S.; van Gassen, K.L.I.; Hempel, M.; Haack, T.B.; Baresic, A.; Genetti, C.A.; et al. BCL11B mutations in patients affected by a neurodevelopmental disorder with reduced type 2 innate lymphoid cells. Brain 2018, 141, 2299–2311. [Google Scholar] [CrossRef]
  69. Punwani, D.; Zhang, Y.; Yu, J.; Cowan, M.J.; Rana, S.; Kwan, A.; Adhikari, A.N.; Lizama, C.O.; Mendelsohn, B.A.; Fahl, S.P.; et al. Multisystem Anomalies in Severe Combined Immunodeficiency with Mutant BCL11B. N. Engl. J. Med. 2016, 375, 2165–2176. [Google Scholar] [CrossRef] [PubMed] [Green Version]
  70. Song, X.; von Kampen, J.; Slaughter, C.A.; DeMartino, G.N. Relative Functions of the α and β Subunits of the Proteasome Activator, PA28. J. Biol. Chem. 1997, 272, 27994–28000. [Google Scholar] [CrossRef] [PubMed] [Green Version]
  71. Tanaka, K.; Mizushima, T.; Saeki, Y. The proteasome: Molecular machinery and pathophysiological roles. Biol. Chem. 2012, 393, 217–234. [Google Scholar] [CrossRef]
  72. Chen, J.-Y.; Xu, L.; Fang, W.-M.; Han, J.-Y.; Wang, K.; Zhu, K.-S. Identification of PA28β as a potential novel biomarker in human esophageal squamous cell carcinoma. Tumor Biol. 2017, 39, 101042831771978. [Google Scholar] [CrossRef] [PubMed]
  73. Kawasaki, M.; Sekigawa, I.; Nozawa, K.; Kaneko, H.; Takasaki, Y.; Takamori, K.; Ogawa, H. Changes in the gene expression of peripheral blood mononuclear cells during the menstrual cycle of females is associated with a gender bias in the incidence of systemic lupus erythematosus. Clin. Exp. Rheumatol. 2009, 27, 260–266. [Google Scholar] [PubMed]
  74. Bing, P.-F.; Xia, W.; Wang, L.; Zhang, Y.-H.; Lei, S.-F.; Deng, F.-Y. Common Marker Genes Identified from Various Sample Types for Systemic Lupus Erythematosus. PLoS ONE 2016, 11, e0156234. [Google Scholar] [CrossRef]
  75. Bai, Q.; Assou, S.; Haouzi, D.; Ramirez, J.-M.; Monzo, C.; Becker, F.; Gerbal-Chaloin, S.; Hamamah, S.; De Vos, J. Dissecting the First Transcriptional Divergence During Human Embryonic Development. Stem Cell Rev. Rep. 2012, 8, 150–162. [Google Scholar] [CrossRef] [PubMed]
  76. Abu Taha, A.; Schnittler, H.-J. Dynamics between actin and the VE–cadherin/catenin complex. Cell Adh. Migr. 2014, 8, 125–135. [Google Scholar] [CrossRef]
  77. Rutledge, N.S.; Weber, E.W.; Winger, R.; Tourtellotte, W.G.; Park, S.H.; Muller, W.A. CD99-like 2 (CD99L2)-deficient mice are defective in the acute inflammatory response. Exp. Mol. Pathol. 2015, 99, 455–459. [Google Scholar] [CrossRef] [PubMed] [Green Version]
  78. Zamoyska, R.; Basson, A.; Filby, A.; Legname, G.; Lovatt, M.; Seddon, B. The influence of the src-family kinases, Lck and Fyn, on T cell differentiation, survival and activation. Immunol. Rev. 2003, 191, 107–118. [Google Scholar] [CrossRef]
  79. Gladkikh, A.A.; Potashnikova, D.M.; Tatarskiy, V.; Yastrebova, M.; Khamidullina, A.; Barteneva, N.; Vorobjev, I. Comparison of the mRNA expression profile of B-cell receptor components in normal CD5-high B-lymphocytes and chronic lymphocytic leukemia: A key role of ZAP70. Cancer Med. 2017, 6, 2984–2997. [Google Scholar] [CrossRef]
  80. Daoud, G.; Rassart, É.; Masse, A.; Lafond, J. Src family kinases play multiple roles in differentiation of trophoblasts from human term placenta. J. Physiol. 2006, 571, 537–553. [Google Scholar] [CrossRef] [Green Version]
  81. Irtegun, S.; Akcora-Yıldız, D.; Pektanc, G.; Karabulut, C. Deregulation of c-Src tyrosine kinase and its downstream targets in pre-eclamptic placenta. J. Obstet. Gynaecol. Res. 2017, 43, 1278–1284. [Google Scholar] [CrossRef]
  82. Burton, G.J. Oxygen, the Janus gas; its effects on human placental development and function. J. Anat. 2009, 215, 27–35. [Google Scholar] [CrossRef]
  83. Fritsche, L.G.; Loenhardt, T.; Janssen, A.; Fisher, S.A.; Rivera, A.; Keilhauer, C.N.; Weber, B.H.F. Age-related macular degeneration is associated with an unstable ARMS2 (LOC387715) mRNA. Nat. Genet. 2008, 40, 892–896. [Google Scholar] [CrossRef]
  84. Wang, G.; Spencer, K.L.; Scott, W.K.; Whitehead, P.; Court, B.L.; Ayala-Haedo, J.; Mayo, P.; Schwartz, S.G.; Kovach, J.L.; Gallins, P.; et al. Analysis of the indel at the ARMS2 3UTR in age-related macular degeneration. Hum. Genet. 2010, 127, 595–602. [Google Scholar] [CrossRef]
  85. Sun, L.; Zhou, J.; Wang, K.; Wang, J.; Shang, L.; Zhang, J.; Wu, J.; Cram, D.S. Placental Up-Regulation of Leptin and ARMS2 is Associated with Growth Discordance in Monochorionic Diamniotic Twin Pregnancies. Twin Res. Hum. Genet. 2017, 20, 169–179. [Google Scholar] [CrossRef]
  86. Zeng, F.; Zhang, M.; Xu, Y.; Xu, H. ARMS2 interference leads to decrease of proinflammatory mediators. Graefe’s Arch. Clin. Exp. Ophthalmol. 2013, 251, 2539–2544. [Google Scholar] [CrossRef]
  87. Brett, K.E.; Ferraro, Z.M.; Yockell-Lelievre, J.; Gruslin, A.; Adamo, K.B. Maternal–Fetal nutrient transport in pregnancy pathologies: The role of the placenta. Int. J. Mol. Sci. 2014, 15, 16153–16185. [Google Scholar] [CrossRef]
  88. Huang, X.; Anderle, P.; Hostettler, L.; Baumann, M.U.; Surbek, D.V.; Ontsouka, E.C.; Albrecht, C. Identification of placental nutrient transporters associated with intrauterine growth restriction and pre-eclampsia. BMC Genomics 2018, 19, 173. [Google Scholar] [CrossRef]
  89. Day, P.E.L.; Cleal, J.K.; Lofthouse, E.M.; Goss, V.; Koster, G.; Postle, A.; Jackson, J.M.; Hanson, M.A.; Jackson, A.A.; Lewis, R.M. Partitioning of glutamine synthesised by the isolated perfused human placenta between the maternal and fetal circulations q. Placenta 2013, 34, 1223–1231. [Google Scholar] [CrossRef]
  90. Rodríguez, A.; Ortega, A.; Berumen, L.C.; García-Alcocer, M.G.; Giménez, C.; Zafra, F. Expression of the System N transporter (SNAT5/SN2) during development indicates its plausible role in glutamatergic neurotransmission. Neurochem. Int. 2014, 73, 166–171. [Google Scholar] [CrossRef]
  91. Bröer, S. The SLC38 family of sodium-amino acid co-transporters. Pflug. Arch. Eur. J. Physiol. 2014, 466, 155–172. [Google Scholar] [CrossRef]
  92. Mackenzie, B.; Erickson, J.D. Sodium-coupled neutral amino acid (System N/A) transporters of the SLC38 gene family. Pflug. Arch. Eur. J. Physiol. 2004, 447, 784–795. [Google Scholar] [CrossRef]
  93. Hunt, J.S.; Rasmussen, C.A. The tumor necrosis factor gene family in pregnancy. Placenta 1998, 19, 139–147. [Google Scholar] [CrossRef]
  94. Browning, J.L.; Ngam-ek, A.; Lawton, P.; DeMarinis, J.; Tizard, R.; Chow, E.P.; Hession, C.; O’Brine-Greco, B.; Foley, S.F.; Ware, C.F. Lymphotoxin β, a novel member of the TNF family that forms a heteromeric complex with lymphotoxin on the cell surface. Cell 1993, 72, 847–856. [Google Scholar] [CrossRef]
  95. Snyder, S.K.; Wessells, J.L.; Waterhouse, R.M.; Dveksler, G.S.; Wessner, D.H.; Wahl, L.M.; Zimmermann, W. Pregnancy-Specific Glycoproteins Function as Immunomodulators by Inducing Secretion of IL-10, IL-6 and TGF-beta1 by Human Monocytes. Am. J. Reprod. Immunol. 2001, 45, 205–216. [Google Scholar] [CrossRef]
  96. Gordon, Y.B.; Jeffrey, D.; Grudzinskas, J.G.; Chard, T.; Letchworth, A.T. Concentrations of pregnancy-specific β1-glycoprotein in maternal blood in normal pregnancy and in intrauterine growth retardation. Lancet 1977, 309, 331–333. [Google Scholar] [CrossRef]
  97. Zhao, L.; Triche, E.W.; Walsh, K.M.; Bracken, M.B.; Saftlas, A.F.; Hoh, J.; Dewan, A.T. Genome-wide association study identifies a maternal copy-number deletion in PSG11 enriched among preeclampsia patients. BMC Pregnancy Childbirth 2012, 12, 1–10. [Google Scholar] [CrossRef]
  98. Kadamb, R.; Mittal, S.; Bansal, N.; Batra, H.; Saluja, D. Sin3: Insight into its transcription regulatory functions. Eur. J. Cell Biol. 2013, 237–246. [Google Scholar] [CrossRef]
  99. Sukhikh, G.T.; Bourmenskaya, O.V.; Smolnikova, V.Y.; Krasnoschoka, O.E.; Trofimov, D.Y.; Donnikov, A.E.; Kalinina, E.A. Protamine and fertilin mRNA: Potential biomarkers of assisted reproductive technology outcomes. Bull. Exp. Biol. Med. 2012, 153, 513–515. [Google Scholar] [CrossRef]
  100. Depa-Martynów, M.; Kempisty, B.; Lianeri, L.; Pawel, P.; Jagodziñski, P.J. Association between fertilin β, protamines 1 and 2 and spermatid-specific linker histone H1-like protein mRNA levels, fertilization ability of human spermatozoa, and quality of preimplantation embryos. Folia Histochem. Cytobiol. 2007, 45, 79–85. [Google Scholar]
  101. Cascella, R.; Strafella, C.; Caputo, V.; Errichiello, V.; Zampatti, S.; Milano, F.; Potenza, S.; Mauriello, S.; Novelli, G.; Ricci, F.; et al. Towards the application of precision medicine in Age-Related Macular Degeneration. Prog. Retin. Eye Res. 2018, 63, 132–146. [Google Scholar] [CrossRef]
  102. Sharma, S.; Godbole, G.; Modi, D. Decidual Control of Trophoblast Invasion. Am. J. Reprod. Immunol. 2016, 75, 341–350. [Google Scholar] [CrossRef] [Green Version]
  103. Merviel, P.; Challier, J.-C.; Carbillon, L.; Foidart, J.-M.; Uzan, S. The Role of Integrins in Human Embryo Implantation. Fetal Diagn. Ther. 2001, 16, 364–371. [Google Scholar] [CrossRef]
  104. Su, E.J. Role of the fetoplacental endothelium in fetal growth restriction with abnormal umbilical artery Doppler velocimetry. Am. J. Obstet. Gynecol. 2015, 213, S123–S130. [Google Scholar] [CrossRef]
  105. Morley, L.C.; Shi, J.; Gaunt, H.J.; Hyman, A.J.; Webster, P.J.; Williams, C.; Forbes, K.; Walker, J.J.; Simpson, N.A.B.; Beech, D.J. Piezo1 channels are mechanosensors in human fetoplacental endothelial cells. MHR Basic Sci. Reprod. Med. 2018, 24, 510–520. [Google Scholar] [CrossRef]
  106. Liu, J.; Li, D.; Cao, B.; Li, Y.; Herva, R.; Piao, Y.; Wang, Y. Expression and Localization of SWAP-70 in Human Fetomaternal Interface and Placenta During Tubal Pregnancy and Normal Placentation. J. Histochem. Cytochem. 2007, 55, 701–708. [Google Scholar] [CrossRef] [Green Version]
  107. Mansilla, M.; Wang, Y.; Hyett, J.; da Silva Costa, F.; Nie, G. Serum podocalyxin for early detection of preeclampsia at 11–13 weeks of gestation. Placenta 2018, 71, 13–15. [Google Scholar] [CrossRef]
  108. Chen, Q.; Wang, Y.; Li, Y.; Zhao, M.; Nie, G. Serum podocalyxin is significantly increased in early-onset preeclampsia and may represent a novel marker of maternal endothelial cell dysfunction. J. Hypertens. 2017, 35, 2287–2294. [Google Scholar] [CrossRef]
  109. Di Bartolomeo, A.; Chauleur, C.; Gris, J.C.; Chapelle, C.; Noblot, E.; Laporte, S.; Raia-Barjat, T. Tissue factor pathway inhibitor for prediction of placenta-mediated adverse pregnancy outcomes in high-risk women: AngioPred study. PLoS ONE 2017, 12, e0173596. [Google Scholar] [CrossRef]
  110. Redline, R.W. Placental Pathology: A Systematic Approach with Clinical Correlations. Placenta 2008, 29, 86–91. [Google Scholar] [CrossRef]
  111. Landriscina, M.; Schinzari, G.; Di Leonardo, G.; Quirino, M.; Cassano, A.; D’Argento, E.; Lauriola, L.; Scerrati, M.; Prudovsky, I.; Barone, C. S100A13, a new marker of angiogenesis in human astrocytic gliomas. J. Neurooncol. 2006, 80, 251–259. [Google Scholar] [CrossRef]
  112. Cui, H.; Wang, Y.; Huang, H.; Yu, W.; Bai, M.; Zhang, L.; Bryan, B.A.; Wang, Y.; Luo, J.; Li, D.; et al. GPR126 protein regulates developmental and pathological angiogenesis through modulation of VEGFR2 receptor signaling. J. Biol. Chem. 2014, 289, 34871–34885. [Google Scholar] [CrossRef]
  113. Lwaleed, B.A.; Bass, P.S. Tissue factor pathway inhibitor: Structure, biology and involvement in disease. J. Pathol. 2006, 208, 327–339. [Google Scholar] [CrossRef]
  114. Edstrom, C.S.; Calhoun, D.A.; Christensen, R.D. Expression of tissue factor pathway inhibitor in human fetal and placental tissues. Early Hum. Dev. 2000, 59, 77–84. [Google Scholar] [CrossRef]
  115. Aharon, A.; Brenner, B.; Katz, T.; Miyagi, Y.; Lanir, N. Tissue factor and tissue factor pathway inhibitor levels in trophoblast cells: Implications for placental hemostasis. Thromb. Haemost. 2004, 92, 776–786. [Google Scholar] [CrossRef]
  116. Ittel, A.; Bretelle, F.; Gris, J.C.; Chau, C.; Sébahoun, G.; Boubli, L.; Arnoux, D. Increased risk of gestational vascular complications in women with low free tissue factor pathway inhibitor plasma levels out of pregnancy. Thromb. Haemost. 2011, 105, 66–71. [Google Scholar] [CrossRef]
  117. Wong, G.W.; Krawczyk, S.A.; Kitidis-Mitrokostas, C.; Revett, T.; Gimeno, R.; Lodish, H.F. Molecular, biochemical and functional characterizations of C1q/TNF family members: Adipose-tissue-selective expression patterns, regulation by PPAR-γ agonist, cysteine-mediated oligomerizations, combinatorial associations and metabolic functions. Biochem. J. 2008, 416, 161–177. [Google Scholar] [CrossRef]
  118. Liu, Z.H.; Li, C.; Chen, J.W.; Shen, Y.; Gao, J.; Shen, W.F.; Zhang, R.Y.; Wang, X.Q.; Lu, L. C1q/TNF-related protein 1 promotes endothelial barrier dysfunction under disturbed flow. Biochem. Biophys. Res. Commun. 2017, 490, 580–586. [Google Scholar] [CrossRef]
  119. Kanemura, N.; Shibata, R.; Ohashi, K.; Ogawa, H.; Hiramatsu-Ito, M.; Enomoto, T.; Yuasa, D.; Ito, M.; Hayakawa, S.; Otaka, N.; et al. C1q/TNF-related protein 1 prevents neointimal formation after arterial injury. Atherosclerosis 2017, 257, 138–145. [Google Scholar] [CrossRef]
  120. Nicholson, A.M.; Finch, N.A.; Almeida, M.; Perkerson, R.B.; van Blitterswijk, M.; Wojtas, A.; Cenik, B.; Rotondo, S.; Inskeep, V.; Almasy, L.; et al. Prosaposin is a regulator of progranulin levels and oligomerization. Nat. Commun. 2016, 7, 11992. [Google Scholar] [CrossRef] [Green Version]
  121. Stubert, J.; Schattenberg, F.; Richter, D.-U.; Dieterich, M.; Briese, V. Trophoblastic progranulin expression is upregulated in cases of fetal growth restriction and preeclampsia. J. Perinat. Med. 2012, 40, 475–481. [Google Scholar] [CrossRef]
  122. Pyle, A.L.; Li, B.; Maupin, A.B.; Guzman, R.J.; Crimmins, D.L.; Olson, S.; Atkinson, J.B.; Young, P.P. Biomechanical stress induces novel arterial intima-enriched genes: Implications for vascular adaptation to stress. Cardiovasc. Pathol. 2010, 19, e13–e20. [Google Scholar] [CrossRef]
  123. Wakasugi, K.; Slike, B.M.; Hood, J.; Otani, A.; Ewalt, K.L.; Friedlander, M.; Cheresh, D.A.; Schimmel, P. A human aminoacyl-tRNA synthetase as a regulator of angiogenesis. Proc. Natl. Acad. Sci. USA 2002, 99, 173–177. [Google Scholar] [CrossRef] [Green Version]
  124. Liu, B.; Xu, Y.; Voss, C.; Qiu, F.H.; Zhao, M.Z.; Liu, Y.D.; Nie, J.; Wang, Z.L. Altered Protein Expression in Gestational Diabetes Mellitus Placentas Provides Insight into Insulin Resistance and Coagulation/Fibrinolysis Pathways. PLoS ONE 2012, 7, e44701. [Google Scholar] [CrossRef]
  125. Bolger, A.M.; Lohse, M.; Usadel, B. Trimmomatic: A flexible trimmer for Illumina sequence data. Bioinformatics 2014, 30, 2114–2120. [Google Scholar] [CrossRef]
  126. Li, H.; Handsaker, B.; Wysoker, A.; Fennell, T.; Ruan, J.; Homer, N.; Marth, G.; Abecasis, G.; Durbin, R. The Sequence Alignment/Map format and SAMtools. Bioinformatics 2009, 25, 2078–2079. [Google Scholar] [CrossRef] [Green Version]
  127. Pertea, M.; Pertea, G.M.; Antonescu, C.M.; Chang, T.-C.; Mendell, J.T.; Salzberg, S.L. StringTie enables improved reconstruction of a transcriptome from RNA-seq reads. Nat. Biotechnol. 2015, 33, 290–295. [Google Scholar] [CrossRef] [Green Version]
  128. Pertea, M.; Kim, D.; Pertea, G.M.; Leek, J.T.; Salzberg, S.L. Transcript-level expression analysis of RNA-seq experiments with HISAT, StringTie and Ballgown. Nat. Protoc. 2016, 11, 1650–1667. [Google Scholar] [CrossRef]
  129. Anders, S.; Huber, W. Differential expression analysis for sequence count data. Genome Biol. 2010, 11, R106. [Google Scholar] [CrossRef]
  130. Robinson, M.D.; Mccarthy, D.J.; Smyth, G.K. edgeR: A Bioconductor package for differential expression analysis of digital gene expression data. Bioinforma. Appl. NOTE 2010, 26, 139–140. [Google Scholar] [CrossRef]
  131. Warnes, G.R.; Bolker, B.; Bonebakker, L.; Gentleman, R.; Liaw, W.H.A.; Lumley, T.; Maechler, M.; Magnusson, A.; Moeller, S.; Schwartz, M.V.B. gplots: Various R programming tools for plotting data. R Packag. Vers. 2009, 2, 1. [Google Scholar]
  132. Wickham, H. ggplot2: Elegant Graphics for Data Analysis; Springer: New York, NY, USA, 2016. [Google Scholar]
  133. Reimand, J.; Arak, T.; Adler, P.; Kolberg, L.; Reisberg, S.; Peterson, H.; Vilo, J. g:Profiler-a web server for functional interpretation of gene lists (2016 update). Nucleic Acids Res. 2016, 44, W83–W89. [Google Scholar] [CrossRef]
  134. Alamancos, G.P.; Pagès, A.; Trincado, J.L.; Bellora, N.; Eyras, E. SUPPA: A super-fast pipeline for alternative splicing analysis from RNA-Seq. bioRxiv 2014, 008763. [Google Scholar] [CrossRef]
  135. Shen, S.; Park, J.W.; Lu, Z.-X.; Lin, L.; Henry, M.D.; Wu, Y.N.; Zhou, Q.; Xing, Y. rMATS: Robust and flexible detection of differential alternative splicing from replicate RNA-Seq data. Proc. Natl. Acad. Sci. USA 2014, 111, E5593–E5601. [Google Scholar] [CrossRef] [Green Version]
  136. Patro, R.; Duggal, G.; Love, M.I.; Irizarry, R.A.; Kingsford, C. Salmon provides fast and bias-aware quantification of transcript expression. Nat. Methods 2017, 14, 417–419. [Google Scholar] [CrossRef]
  137. Quinlan, A.R.; Hall, I.M. BEDTools: A flexible suite of utilities for comparing genomic features. Bioinformatics 2010, 26, 841–842. [Google Scholar] [CrossRef]
  138. Veiga, D. maser: Mapping Alternative Splicing Events to pRoteins; R Package Version 1.0.0. 2018. Available online: https://github.com/DiogoVeiga/maser (accessed on 26 March 2019).
  139. Wang, J.; Pan, Y.; Shen, S.; Lin, L.; Xing, Y. rMATS-DVR: rMATS discovery of differential variants in RNA. Bioinformatics 2017, 33, 2216–2217. [Google Scholar] [CrossRef]
  140. McKenna, A.; Hanna, M.; Banks, E.; Sivachenko, A.; Cibulskis, K.; Kernytsky, A.; Garimella, K.; Altshuler, D.; Gabriel, S.; Daly, M.; et al. The genome analysis toolkit: A MapReduce framework for analyzing next-generation DNA sequencing data. Genome Res. 2010, 20, 1297–1303. [Google Scholar] [CrossRef]
  141. Wang, X.; Lu, P.; Luo, Z. GMATo: A novel tool for the identification and analysis of microsatellites in large genomes. Bioinformation 2013, 9, 541–544. [Google Scholar] [CrossRef]
  142. Kent, W.J. BLAT—The BLAST-Like Alignment Tool. Genome Res. 2002, 12, 656–664. [Google Scholar] [CrossRef]
  143. McLaren, W.; Gil, L.; Hunt, S.E.; Riat, H.S.; Ritchie, G.R.S.; Thormann, A.; Flicek, P.; Cunningham, F. The Ensembl Variant Effect Predictor. Genome Biol. 2016, 17, 122. [Google Scholar] [CrossRef] [PubMed] [Green Version]
  144. Cingolani, P.; Platts, A.; Wang, L.L.; Coon, M.; Nguyen, T.; Wang, L.; Land, S.J.; Lu, X.; Ruden, D.M. A program for annotating and predicting the effects of single nucleotide polymorphisms, SnpEff: SNPs in the genome of Drosophila melanogaster strain w1118; iso-2; iso-3. Fly (Austin) 2012, 6, 80–92. [Google Scholar] [CrossRef] [PubMed]
  145. Krzywinski, M.; Schein, J.; Birol, I.; Connors, J.; Gascoyne, R.; Horsman, D.; Jones, S.J.; Marra, M.A. Circos: An Information Aesthetic for Comparative Genomics. Genome Res. 2009, 19, 1639–1645. [Google Scholar] [CrossRef] [PubMed]
Figure 1. Flowchart of sequencing, computational analysis, and validation procedures.
Ijms 20 01510 g001
Figure 2. (A) MA plot presenting logarithmic values of fold change plotted against normalized counts for IUGR-affected and control libraries. Dotted horizontal lines indicate applied fold change (absolute value of log2FC >1) cut-off. (B) Volcano plot showing log2FC plotted against normalized p-values. Dotted horizontal line indicates negative logarithmic adjusted p-value (0.05) cut-off. Dotted vertical lines indicate applied fold change (absolute value of log2FC >1) cut-off. Each point (dot) represents gene expression value; green (underexpressed in IUGR) and red (overexpressed in IUGR) represent the significant DEGs (adjusted p-value < 0.05). Both plots present values (points positions) calculated with the DESeq2 algorithm, green and red points depict DEGs confirmed by both DESEq2 and edgeR methods. Grey dots indicate nonsignificant genes.
Ijms 20 01510 g002
Figure 3. (A) Venn diagram with the number of differentially-expressed genes (DEGs) identified by DESeq2 and edgeR. Middle number indicates common DEGs confirmed by both methods. (B) Heatmap of expression data for the 28 DEGs (for definitions of gene symbols, see Table 2). Columns represent individual libraries; rows indicate gene symbols of DEGs. The z-score scale was applied for visualization expression values (FPKM) of each biological replicate.
Ijms 20 01510 g003
Figure 4. The abundance of alternative splicing events. (A) Dot plots for five alternative splicing (AS) events types depicting imbalance in percent splicing inclusion (PSI) values investigated by rMATs. Red and blue dots indicate significant AS events with higher PSI value in IUGR-affected and control libraries, respectively. Grey dots represent no changes in PSI ratio. (B) MA plot showing changes in the percentage of transcripts with the exon spliced in (ΔPSI) plotted against average transcript abundance for all AS events detected in IUGR-affected and control libraries retrieved by SUPPA. (C) ΔPSI values of each AS event were presented on X-axis and the negative logarithmic adjusted p-value was presented on the Y-axis. Horizontal line indicates negative logarithmic adjusted p-value (0.05) cut-off. Each point (dot) on Volcano and MA plot represents the splicing event; blue dots represent significant DAS events (adjusted p-value < 0.05) and grey dots were not significant.
Ijms 20 01510 g004
Figure 5. Quantitative visualization (Sashimi plot) of an alternative skipping event of exon 23 (E23) within the GPR126 (ADGRG6). Ten upper tracks represent biological replicates for control (red) and IUGR (orange) libraries. Numbers on curved lines indicate counts engaged in each splice junction. The scale on left present coverage depth of GPR126 in range of ASE region. Percent splicing inclusion (PSI) present on the right side of each sample in the upper track. Middle track depicts genomic coordinates of ASE on chromosome 6. The bottom track represents exon-intron structures of DAS event in the range of E23.
Ijms 20 01510 g005
Figure 6. Distribution of SNVs detected on the physical map of the human genome designated by rMATS-DFR; scale in Mb. The red circle indicates the regions with small numbers (< 15) of SNVs per 1 Mb. The gray circle indicates the regions with medium numbers (>15 and <100) of SNVs. The green circle indicates the richest regions of SNVs (>100).
Ijms 20 01510 g006
Table 1. Sequencing, quality control and mapping metrics for each placental control (CTR) and IUGR-affected library. Mapped reads were divided to uniquely (reads that map exactly one time on the genome), multi-mapped (reads that map 2–20 times on the genome) and to too many loci (reads that map more 20 times on the genome).
CTR1CTR2CTR3CTR4CTR5IUGR1IUGR2IUGR3IUGR4IUGR5
Fetal sexfemalefemalefemalemalemalefemalefemalemalemalemale
Row reads64,041,86876,079,17855,220,59873,481,43857,398,09243,095,03456,174,78636,854,90442,138,70441,532,984
Trimmed reads57,087,67066,388,44647,395,04464,759,84849,765,75237,894,43049,348,79630,969,75036,987,26636,422,794
Mapped54,927,73064,035,63445,653,62662,541,87048,246,00236,523,43447,657,00829,887,32835,801,52035,037,148
Uniquely mapped50,834,55853,206,55241,489,48060,190,95844,263,50033,625,16842,868,41028,014,30032,690,42032,541,876
Multi-mapped4,082,30010,817,5004,156,8862,342,9363,974,6022,891,8724,780,5641,868,8143,104,8082,488,174
Too many loci10,87211,58272607976790063948034421462927098
Table 2. List of 28 differentially-expressed genes (under and over-expressed) between IUGR-affected and control libraries.
Gene_IDBaseMeanlog2FCPadjGene Symbol
XLOC_0485847.49193−2.8051.05 × 10−2THEMIS
XLOC_03299234.69158−2.7842.74 × 10−2PTPRN
XLOC_0280558.40907−2.6036.26 × 10-3ADGRE4P
XLOC_05048045.34250−2.4016.47 × 10−4AC245427.9
XLOC_03148863.22940−2.3869.55 × 10-3FNDC4
XLOC_01572352.46403−2.3751.24 × 10−2TRAC
XLOC_05048262.93612−2.3134.71 × 10-3TRBC2
XLOC_0341737.15533−2.3041.93 × 10−2SIRPG
XLOC_05887262.88279−2.2775.00 × 10−3SLC38A5
XLOC_035229129.54309−2.1911.99 × 10−2B3GALT5
XLOC_03010184.31897−2.1371.05 × 10−2ZAP70
XLOC_00051638.22445−2.1301.02 × 10−2LCK
XLOC_01736119.31762−2.0933.33 × 10−4BCL11B
XLOC_01323625.54894−2.0782.13 × 10−2TESPA1
XLOC_043316143.34412−2.0723.12 × 10−3IL7R
XLOC_04422240.17459−2.0331.00 × 10−2ITK
XLOC_04790157.73795−1.8172.56 × 10−3LTB
XLOC_02740222.55203−1.8041.24 × 10−2PINLYP
XLOC_039524248.131311.3924.71 × 10−3ASTE1
XLOC_0488724.956202.3262.13 × 10−2AL023775.1
XLOC_044458371.824842.4296.17 × 10−3BTNL9
XLOC_03718336.608272.4475.00 × 10−3AC087857.1
XLOC_00405713.879592.5242.36 × 10−2TCHHL1
XLOC_0296114.741192.6291.57 × 10−2NA
XLOC_0537365.041412.6474.06 × 10−2ADAM2
XLOC_0077686.308892.9371.34 × 10−2NA
XLOC_05125614.103283.0875.00 × 10−3PHBP5
XLOC_006484268.768883.3049.15 × 10−4ARMS2
Table 3. Gene Ontology (GO) and Kyoto Encyclopedia of Genes and Genomes (KEGG) analysis of differentially-expressed genes identified in IUGR-affected placentas.
Term IDTerm NameGene Symbol
GO:0050851antigen receptor-mediated signaling pathwayITK, ZAP70, TESPA1, THEMIS, LCK
GO:0050852T cell receptor signaling pathwayITK, ZAP70, TESPA1, THEMIS, LCK
GO:0007159leukocyte cell-cell adhesionSIRPG, ZAP70, TESPA1, IL7R, LCK
GO:1903037regulation of leukocyte cell-cell adhesionSIRPG, ZAP70, TESPA1, IL7R, LCK
GO:0045321leukocyte activationSIRPG, ITK, ZAP70, BCL11B, TESPA1, IL7R, THEMIS, LCK
GO:0046649lymphocyte activationSIRPG, ITK, ZAP70, BCL11B, TESPA1, IL7R, THEMIS, LCK
GO:0042110T cell activationSIRPG, ITK, ZAP70, BCL11B, TESPA1, IL7R, THEMIS, LCK
GO:0002520immune system developmentITK, ZAP70, BCL11B, TESPA1, IL7R, THEMIS, LCK, LTB
GO:0048534hematopoietic or lymphoid organ developmentITK, ZAP70, BCL11B, TESPA1, IL7R, THEMIS, LCK, LTB
GO:0030097hemopoiesisITK, ZAP70, BCL11B, TESPA1, IL7R, THEMIS, LCK,
GO:0022409positive regulation of cell-cell adhesionSIRPG, ZAP70, TESPA1, IL7R, LCK
GO:1903039positive regulation of leukocyte cell-cell adhesionSIRPG, ZAP70, TESPA1, IL7R, LCK
GO:0050863regulation of T cell activationSIRPG, ZAP70, TESPA1, IL7R, LCK
GO:0002521leukocyte differentiationITK, ZAP70, BCL11B, TESPA1, IL7R, THEMIS, LCK
GO:0030098lymphocyte differentiationITK, ZAP70, BCL11B, TESPA1, IL7R, THEMIS, LCK
GO:0030217T cell differentiationITK, ZAP70, BCL11B, TESPA1, IL7R, THEMIS, LCK
GO:0045058T cell selectionZAP70, BCL11B, THEMIS
GO:0043368positive T cell selectionZAP70, BCL11B, THEMIS
GO:0033077T cell differentiation in thymusZAP70, BCL11B, TESPA1, IL7R
GO:0051251positive regulation of lymphocyte activationSIRPG, ZAP70, TESPA1, IL7R, LCK
GO:0050870positive regulation of T cell activationSIRPG, ZAP70, TESPA1, IL7R, LCK
GO:0004715non-membrane spanning protein tyrosine kinase activityITK, ZAP70, LCK
KEGG:04064NF-kappa B signaling pathwayZAP70, LCK, LTB
KEGG:04660T cell receptor signaling pathwayITK, ZAP70, LCK
KEGG:05340Primary immunodeficiencyZAP70, IL7R, LCK
Table 4. Statistically significant AS events identified by Suppa (p-value < 0.05) and intersected with rMATs (adjusted p-value < 0.05).
Gene
Symbol
AS
Type
ΔPSIp-valueAS Genomic Coordinates
TFPIAF0.3594302:187503770-187513616:187513641:187503770-187554200:187554492:-
TFPIAF0.337631.349 × 10−22:187503770-187513616:187513653:187503770-187554200:187554492:-
TFPIAF−0.239953.853 × 10−22:187503770-187513616:187519860:187503770-187554200:187554438:-
WARSAF0.693584.496 × 10−214:100369258-100375283:100375473:100369258-100376260:100376308:-
PSG6AF−0.200692.922 × 10−219:42910858-42916125:42916398:42910858-42917729:42917887:-
C1QTNF1AF−0.311953.996 × 10−217:79022934:79023088-79043955:79025663:79025935-79043955:+
C1QTNF1AF−0.210924.396 × 10−217:79024070:79024494-79043955:79025663:79025935-79043955:+
C1QTNF1AF−0.336454.396 × 10−217:79024261:79024494-79046555:79043593:79044123-79046555:+
S100A13AF−0.229214.795 × 10−21:153626533-153626951:153627048:153626533-153628121:153628180:-
S100A13AF−0.205344.795 × 10−21:153626533-153627139:153627268:153626533-153628121:153628180:-
PSG6AL−0.200692.922 × 10−219:42906636:42907176-42910580:42907725:42907854-42910580:-
TFPIMX−0.218233.853 × 10−22:187503770-187513616:187513646-187554200:187503770-187520542:187520613-187554200:-
TFPISE0.126833.853 × 10−22:187503770-187529364:187529485-187554200:-
EVI5SE−0.308174.795 × 10−21:92636336-92663420:92663452-92665939:-
PSME2SE−0.285534.895 × 10−214:24145772-24146208:24146240-24146534:-
ADGRG6SE−0.281553.497 × 10−26:142438364-142440908:142440953-142443337:+
SIN3BSE0.093384.595 × 10−219:16862559-16862884:16862979-16863680:+
SCELSE0.355274.412 × 10−213:77591460-77593514:77593573-77597545:+
C1QTNF1SE0.238314.396 × 10−217:79024494-79043955:79044123-79046555:+
PSAPSE−0.098182.597 × 10−210:71822007-71823888:71823896-71825837:-
Table 5. Distribution (%) of significant SNV (ΔAFF; FDR < 0.05) annotated according to gene components (upstream region, 5’UTR, CDS, intron, 3’UTR, and downstream region).
SNV LocalizationNumber of SNV AnnotationsPercentage Ratio
DOWNSTREAM317931.38%
EXON238623.55%
INTERGENIC100.10%
INTRON152815.08%
SPLICE_SITE_ACCEPTOR10.01%
SPLICE_SITE_REGION540.53%
UPSTREAM136913.51%
UTR_3_PRIME126012.44%
UTR_5_PRIME3453.41%
Table 6. Four main RNA editing candidates identified in IUGR-affected samples.
ChrSiteQualityFDRFraction DifferenceGene NameStrandLocationSubst.
1945394416357.149.99 × 10−50.122PPP1R13L-IntronA>G
237100515373.161.06 × 10−50.106EIF2AK2-3UTRA>G
2218237842275.357.53 × 10−40.178ARPC2+IntronA>G
X150767753438.582.39 × 10−40.047CD99L2-3UTRA>G

