Article

Metabolome and Transcriptome Association Analysis Reveals Dynamic Regulation of Purine Metabolism and Flavonoid Synthesis in Transdifferentiation during Somatic Embryogenesis in Cotton

1
State Key Laboratory of Crop Biology, College of Horticulture Science and Engineering, Shandong Agricultural University, Tai’an 271018, China
2
State Key Laboratory of Crop Biology, College of Agronomy, Shandong Agricultural University, Tai’an 271018, China
*
Author to whom correspondence should be addressed.
These authors contributed equally to this paper.
Int. J. Mol. Sci. 2019, 20(9), 2070; https://0-doi-org.brum.beds.ac.uk/10.3390/ijms20092070
Submission received: 13 March 2019 / Revised: 21 April 2019 / Accepted: 24 April 2019 / Published: 26 April 2019

Abstract

:
Plant regeneration via somatic embryogenesis (SE) is a key step during genetic engineering. In the current study, integrated widely targeted metabolomics and RNA sequencing were performed to investigate the dynamic metabolic and transcriptional profiling of cotton SE. Our data revealed that a total of 581 metabolites were present in nonembryogenic staged calli (NEC), primary embryogenic calli (PEC), and initiation staged globular embryos (GE). Of the differentially accumulated metabolites (DAMs), nucleotides, and lipids were specifically accumulated during embryogenic differentiation, whereas flavones and hydroxycinnamoyl derivatives were accumulated during somatic embryo development. Additionally, metabolites related to purine metabolism were significantly enriched in PEC vs. NEC, whereas in GE vs. PEC, DAMs were remarkably associated with flavonoid biosynthesis. An association analysis of the metabolome and transcriptome data indicated that purine metabolism and flavonoid biosynthesis were co-mapped based on the Kyoto encyclopedia of genes and genomes (KEGG) database. Moreover, purine metabolism-related genes associated with signal recognition, transcription, stress, and lipid binding were significantly upregulated. Moreover, several classic somatic embryogenesis (SE) genes were highly correlated with their corresponding metabolites that were involved in purine metabolism and flavonoid biosynthesis. The current study identified a series of potential metabolites and corresponding genes responsible for SE transdifferentiation, which provides a valuable foundation for a deeper understanding of the regulatory mechanisms underlying cell totipotency at the molecular and biochemical levels.

Graphical Abstract

1. Introduction

Somatic embryogenesis (SE) plays a crucial role in the genetic transformation of plants and in their in vitro rapid propagation. SE refers to the process of transformation from the somatic to the embryogenic state and is a unique phenomenon similar to what occurs during the development of zygotic embryos. The SE process can be artificially controlled in vitro conditions. It is also a classic example of cell totipotency. The underlying mechanisms of SE are significant for revealing important scientific theoretical problems that involve cell development, differentiation, and morphogenesis [1,2,3,4].
Nic-Can et al. [5] reported that SE is a complex process of molecular regulation in which somatic cells acquire totipotency to transform into embryonic cells. How does a somatic cell become a whole plant? This question has been reported to be one of the 25 questions most important within the scientific community [6]. However, the regulatory networks that are involved in the transition from the nonembryogenic staged callus (NEC) to the somatic embryo during SE remain poorly understood [7]. In addition to environmental factors, external stimuli and hormones, many specifically expressed genes also participate in the SE process and play a decisive role [8,9,10,11]. Therefore, it is particularly important to identify and isolate key genes that regulate SE. Candidate genes that may regulate SE were identified using bioinformatics tools [12]. The results showed that auxin response factor (ARF) [11,13,14], leafy cotyledon (LEC) [10,15], Wuschel (WUS) [16,17,18], somatic embryogenesis receptor kinase (SERK) [8], shoot meristemless (STM), and baby boom (BBM) [10,19,20] were involved in SE. In addition, the salicylic acid (SA) and jasmonic acid (JA) signaling pathways were also predicted to regulate SE [12,21,22,23,24,25,26,27].
During the process of cotton SE, Hu et al. [28] found that interference of the high-mobility group box 3 (GhHmgb3) gene enhanced the proliferation and differentiation of embryogenic callus. Poon et al. [29] found that embryogenic callus could secrete a specific AGP protein (GhPLA1), which was extracted and added to the medium to enhance SE. Min et al. [7] showed that the process of SE was negatively regulated by a casein kinase gene (GhCKI) via a complex regulatory network. Several differentially expressed small RNAs and their target genes were identified via small RNA sequencing and degradation sequencing, which indicated that the SE process in cotton was regulated by complex gene expression networks [30]. Genes related to stress, such as SERK1, abscisic aldehyde synthesis enzyme 2 (ABA2), abscisic acid insensitive 3 (ABI3), jasmonate ZIM-domain 1 (JAZ1), late embriogenesis abundant protein 1 (LEA1), and transcription factors (NACs, WRKYs, MYBs, ERFs, Zinc finger family proteins) were also involved in callus induction [31,32,33,34,35,36,37]. Transcriptome sequencing was carried out during callus dedifferentiation and redifferentiation. Auxin and stress response molecules were found to be involved in SE in cotton [38]. Xu et al. [39] also found that plant growth regulators played an important regulatory role in SE.
In recent years, metabolomics, which involves the collection of all low molecular weight metabolites that are present in a certain organism, cell, or tissue during a specific physiological period, has attracted a great deal of attention. It mainly involves the examination of endogenous small molecules with molecular weights less than 1000 Da. Plants can produce 200,000 to 1 million kinds of metabolites, which can be divided into primary metabolites and secondary metabolites [40].
Metabolites are the ultimate result of gene transcription and protein expression in organisms that are under the influence of internal and external factors. They form a bridge between genes and phenotypes and can directly reflect the physiological phenomena within plants. At the same time, metabolites can regulate gene transcription and protein expression. As the final products of cellular regulatory processes, metabolites represent the building blocks of macromolecules and are also an essential component of cellular energy pathways [41]. Metabolomic technologies enable the examination and identification of endogenous biochemical reaction products and thereby reveal information about the metabolic pathways and processes occurring within a living cell [42].
Metabolomics data can provide a wealth of information about the biochemical status of tissues, and the interpretation of such data offers an effective approach that can be used for the functional characterization of genes [43,44,45]. Transcriptomic and proteomic studies are only able to predict changes at the gene expression and protein levels, respectively, while metabolomics studies investigate the changes in functioning exhibited by these genes or proteins [46]. Compared with the genome, transcriptome, or proteome, the metabolome more accurately reflects the phenotype of the organism, and the minor changes in the genome and proteome can be reflected and amplified by the metabolome [47]. The applicability of metabolomics to the SE process has been demonstrated in many plant genera [48,49,50,51,52].
The development of ‘omics’ technology has allowed for comprehensive analysis of the SE process at the transcript, protein, and metabolite levels [50,52]. The combination of modern omics technologies such as transcriptomics and metabolomics provides a great opportunity to acquire a deeper understanding of the mechanisms of cell totipotency at the molecular and biochemical levels [52]. To date, there have been few studies that have used transcriptomics and metabolomics techniques to identify potential key factors involved in the SE process [48,49,51,52]. Additionally, the relationship between callus tissues and the media used to culture them is not well understood at the biochemical level in terms of nutrient uptake by callus from the medium or release of chemicals into the medium [52]. Integrated metabolomic and transcriptomic network analyses can elucidate the functioning of a series of secondary metabolites along with changes in content, as well as the corresponding differentially expressed genes, which can broaden the global view of SE regulation [52].
In this study, we comparatively investigated the dynamic metabolomic and transcriptomic profiles of two transdifferentiation processes, embryogenic differentiation and somatic embryo development, during the SE process in cotton. By interactively comparing metabolomic and transcriptomic data, we were able to identify potential metabolites and the corresponding differentially expressed genes at the molecular and biochemical levels, as well as draw a comprehensive picture of the events underpinning SE development to provide a valuable foundation for uncovering the regulatory mechanisms underlying plant cell totipotency.

2. Results

2.1. Transdifferentiation Staged Cultures Derived from Cotton Somatic Embryogenesis

We established an efficient cotton SE system and obtained cultures from different developmental stages, including nonembryogenic staged calli (NEC), primary embryogenic calli (PEC), and initiation staged embryos with globular-like enriched (GE) based on our previous approach as published recently [53] (Figure 1). These representative staged samples would be highly enriched and collected to establish the metabolic and transcriptional profiles.

2.2. UPLC-MS/MS-Based Quantitative Metabolomic Analysis and Overall Metabolite Identification

Ultra-performance liquid chromatography (UPLC) and tandem mass spectrometry (MS/MS) were conducted to assess the dynamic metabolite changes in NEC, PEC, and GE in cotton. During the process of instrumental analysis, one quality control (QC) sample was injected after every ten samples to monitor the repeatability of the analysis process. The repeatability of metabolite extraction and detection can be judged using overlapping analysis of the total ion current (TIC) in the different QC samples (Figure 2). The results showed the overlap in the TIC curves during metabolite detection. The retention times and peak intensities were consistent, which indicated that the signal was stable when an identical sample was detected at a different time. The instrumental stability provided an important guarantee of the repeatability and reliability of our metabonomic data.
The determination of Pearson’s correlation coefficient reflected the repeatability among the intragroup samples (Figure 3a). Principal component analysis (PCA) was used to determine the rate of contribution of the first two primary components (67.49%). The three period materials were obviously separated, and each formed a cluster (Figure 3b). These results suggested that there was sufficient reproducibility of the materials, which made them suitable for the following qualitative and quantitative analyses.
After quality validation, a total of 581 metabolites with known structures were identified in NEC, PEC and GE, each of which was analyzed using three biological replicates (Table S1). Of the 581 metabolites, amino acids (15%), flavones (15%), organic acids (12%), lipids (11%), and nucleotides (10%) accounted for a large proportion (Figure 3c). Detailed information about the identified metabolites, including the compounds, classes, molecular weights (Da), ionization models, Kyoto Encyclopedia of Genes and Genomes (KEGG) pathways, and quantities for each of the three periods is shown in Table S1.

2.3. Identification of Differentially Accumulated Metabolites (DAMs)

Differentially accumulated metabolites (DAMs) were defined as those exhibiting a fold change ≥2 or a fold change ≤0.5 and a variable importance in project (VIP) ≥1 between PEC versus NEC, GE versus PEC, or GE versus NEC (p < 0.05). In total, 156, 139, and 159 DAMs were identified, respectively (Table 1 and Table S2). For PEC vs. NEC, 124 of 156 (79.5%) were upregulated and 32 of 156 (20.5%) were downregulated. Of the 139 DAMs identified between GE and PEC, 86 (61.9%) and 53 (38.1%) metabolites were upregulated and downregulated, respectively. Of the 159 metabolites differentially accumulated in GE compared to NEC, 128 (80.5%) and 31 (19.5%) metabolites were upregulated and downregulated, respectively. Volcano plots were generated to represent the significant differences between PEC vs. NEC, GE vs. PEC, and GE vs NEC (Figure 4a–c). A hierarchical cluster analysis was also performed to assess the DAM accumulation patterns (Figure 4d–f).
Of these DAMs, amino acids (17%), organic acids (13%), flavones (12%), nucleotides (12%), and hydroxycinnamoyl derivatives (6%) accounted for a large proportion in PEC compared to NEC (Figure 4g). Flavones (23%), amino acids (12%), hydroxycinnamoyl derivatives (9%), organic acids (9%), and other compounds (9%) were shown to be differentially accumulated in GE and PEC (Figure 4h). Of the differentially accumulated metabolites in GE vs. NEC, flavones (16%), organic acids (15%), amino acids (14%), nucleotides (11%), and other metabolites (8%) had the highest representation (Figure 4i). Differential metabolites commonly and specifically accumulated in PEC vs. NEC, GE vs. PEC, and GE vs. NEC were also investigated (Figure 5).

2.4. Functional Annotation and KEGG Enrichment Analysis of DAMs

Differentially accumulated metabolites in PEC vs. NEC, GE vs. PEC, and GE vs. NEC were functionally annotated using the Kyoto Encyclopedia of Genes and Genomes (KEGG) database, which was summarized in Table S4. To further investigate the functioning of SE-related metabolites, we analyzed the differences and dynamic changes of biological processes among the three groups. For PEC vs. NEC (embryogenic differentiation), the KEGG enrichment analysis showed that the terms ‘purine metabolism’, ‘cGMP-PKG signaling pathway’, and ‘olfactory transduction’ were significantly enriched (Figure 6a). However, the terms ‘phenylpropanoid biosynthesis’, ‘flavone and flavonol biosynthesis’, ‘flavonoid biosynthesis’, and ‘biosynthesis of phenylpropanoids’ were enriched in GE vs. PEC (somatic embryo development) (Figure 6b). Meanwhile, for GE vs. NEC, the DAMs were most strongly associated with the terms ‘purine metabolism’, ‘microbial metabolism in diverse environments’, ‘biosynthesis of plant secondary metabolites’, and ‘cGMP-PKG signaling pathway’ (Figure 6c).

2.5. Association Analysis of the Metabolome and Transcriptome Data Sets

To provide an overview of the system-wide changes that occur during SE in cotton, transcriptomic profiling based on RNA-seq was performed. Significant differentially expressed genes (DEGs) were detected among NEC, PEC, and GE (unpublished data). By interactively comparing the metabolomic and transcriptomic data, we were able to identify potential metabolites and the corresponding differentially expressed genes at the molecular and biochemical levels.

2.5.1. KEGG Enrichment Analysis of DAMs and DEGs During Cotton SE

To investigate the relationships between genes and metabolites involved in the two transdifferentiation processes during SE in cotton, the DAMs and DEGs in the two compared groups (PEC vs. NEC and GE vs. PEC) were mapped according to the KEGG database. There were 96 and 55 co-mapped pathways in PEC vs. NEC and GE vs. PEC, respectively (Table S5).
Interestingly, of these co-mapped pathways, ‘purine metabolism’ (ko00230) was significantly enriched in PEC vs. NEC. Meanwhile, ‘phenylpropanoid biosynthesis’ (ko00940), ‘flavonoid biosynthesis’ (ko00941), and ‘flavone and flavonol biosynthesis’ (ko00944) showed significant accumulation in GE vs. PEC. DAMs involved in purine metabolism during embryogenic differentiation and in flavonoid biosynthesis during somatic embryo development are listed in Table 2 and Table 3, respectively.

2.5.2. Correlation Analysis of DAMs and DEGs during SE in Cotton

Log2 conversion data for the differentially accumulated metabolites and differentially expressed genes were selected that had a Pearson’s correlation coefficient (PCC) > 0.8. To obtain a systematic view of the variations in metabolites and their corresponding genes with PCC > 0.8, nine quadrant diagrams were generated for the embryogenic differentiation and somatic embryo development processes (Figure 7).
The black dotted lines divide each graph into 9 quadrants. Upregulated metabolites and downregulated genes are displayed in quadrant 1, upregulated metabolites and unchanged genes are displayed in quadrant 2, upregulated metabolites and upregulated genes are displayed in quadrant 3, unchanged metabolites and downregulated genes are displayed in quadrant 4, unchanged metabolites and unchanged genes are displayed in quadrant 5, unchanged metabolites and upregulated genes are displayed in quadrant 6, downregulated metabolites and downregulated genes are displayed in quadrant 7, downregulated metabolites and unchanged genes are displayed in quadrant 8, and downregulated metabolites and upregulated genes are displayed in quadrant 9. Moreover, the DAMs and DEGs shown in quadrant 3 and quadrant 7 are positively correlated and have similar consistent patterns, while the DAMs and DEGs shown in quadrant 1 and quadrant 9 are negatively correlated and have opposite patterns.
Notably, in quadrant 3, several representative factors that are related to receptor-like protein kinases, signal recognition, transcription, stress regulation, lipid binding, hormone responses, and histone modification were significantly activated during embryogenic differentiation process (Table 4).

2.5.3. Transcript-Metabolite Correlation Network Representing DAMs and DEGs during SE in Cotton

To model the synthetic and regulatory characteristics of DAMs and DEGs, subnetworks were constructed to determine transcript-metabolite correlations. Only the correlation pairs with a correlation coefficient > 0.8 were included in the analysis.
In PEC vs. NEC, the differential metabolites involved in purine metabolism are listed in Table 2. Several classic key genes that have been shown to be specifically activated during embryogenic differentiation were included in the correlation test, including BBM [10,19,20], SERK [8], LEC [10,15], ARF [11,13,14], AGL15 [54], AGP [29], GLP [55], AGO1 [56], LTP, and AMY [57]. The visualized network revealed that a total of 22 nodes were connected by 81 edges. Meanwhile, 53 pairs showed a positive correlation, and 28 pairs were negatively correlated (Figure 8a). Detailed information about the gene-metabolite pairs that are involved in purine metabolism during embryogenic differentiation is listed in Table 5.
The differential metabolites involved in flavonoid biosynthesis in GE vs. PEC are listed in Table 3. Genes that control somatic embryo development, including wuschel (WUS) [16,17,18], clavata1 (CLV1) [16,17,18], cup-shaped cotyledon 2 (CUC2) [58], short-root (SHR), and scarecrow (SCW) [59], were subjected to correlation tests. A transcript-metabolite correlation network was built that consisted of 12 nodes and 13 edges. Four pairs showed a positive correlation, and nine pairs were negatively correlated (Figure 8b). Detailed information about the gene-metabolite pairs involved in flavonoid biosynthesis during somatic embryo development is listed in Table 6.
These results indicated that several classic SE-related genes were highly correlated with their corresponding metabolites involved in purine metabolism and flavonoid biosynthesis, which reconfirmed the specific importance of purine metabolism during embryogenic differentiation, as well as the importance of flavonoid biosynthesis during somatic embryo development. The transcriptome data validated the authenticity and accuracy of the metabolic analysis.

3. Discussion

Metabolomics is an emerging omics technology that, like genomics and proteomics, can be used to qualify and quantify all metabolites of small molecular weight within the cells of an organism. Plant metabolomics has been widely applied to the investigation of patterns of metabolite accumulation and their underlying genetic basis via the identification of genes involved in metabolism, which is currently a topic of interest in modern plant biology. As the final products of genome expression, metabolites directly define the biochemical characteristics of a cell or tissue, which allows metabolomic data to be used to explain the biochemical mechanisms underlying SE. Meanwhile, integrated transcriptomic and metabolomic analysis allows for the more precise representation of gene-to-metabolite networks and thus will be an effective method that can be used to decipher the mechanisms involved in SE regulation in cotton. In the current study, we combined transcriptome and metabolome analyses to generate dynamic profiles of two transdifferentiation processes, embryogenic differentiation, and somatic embryo development, during SE in cotton, with the aim to provide a better understanding of the processes of SE transdifferentiation that resulted in cell totipotency at the molecular and biochemical levels.

3.1. Accumulated DAMs Specifically Involved in Two SE Transdifferentiation Processes in Cotton

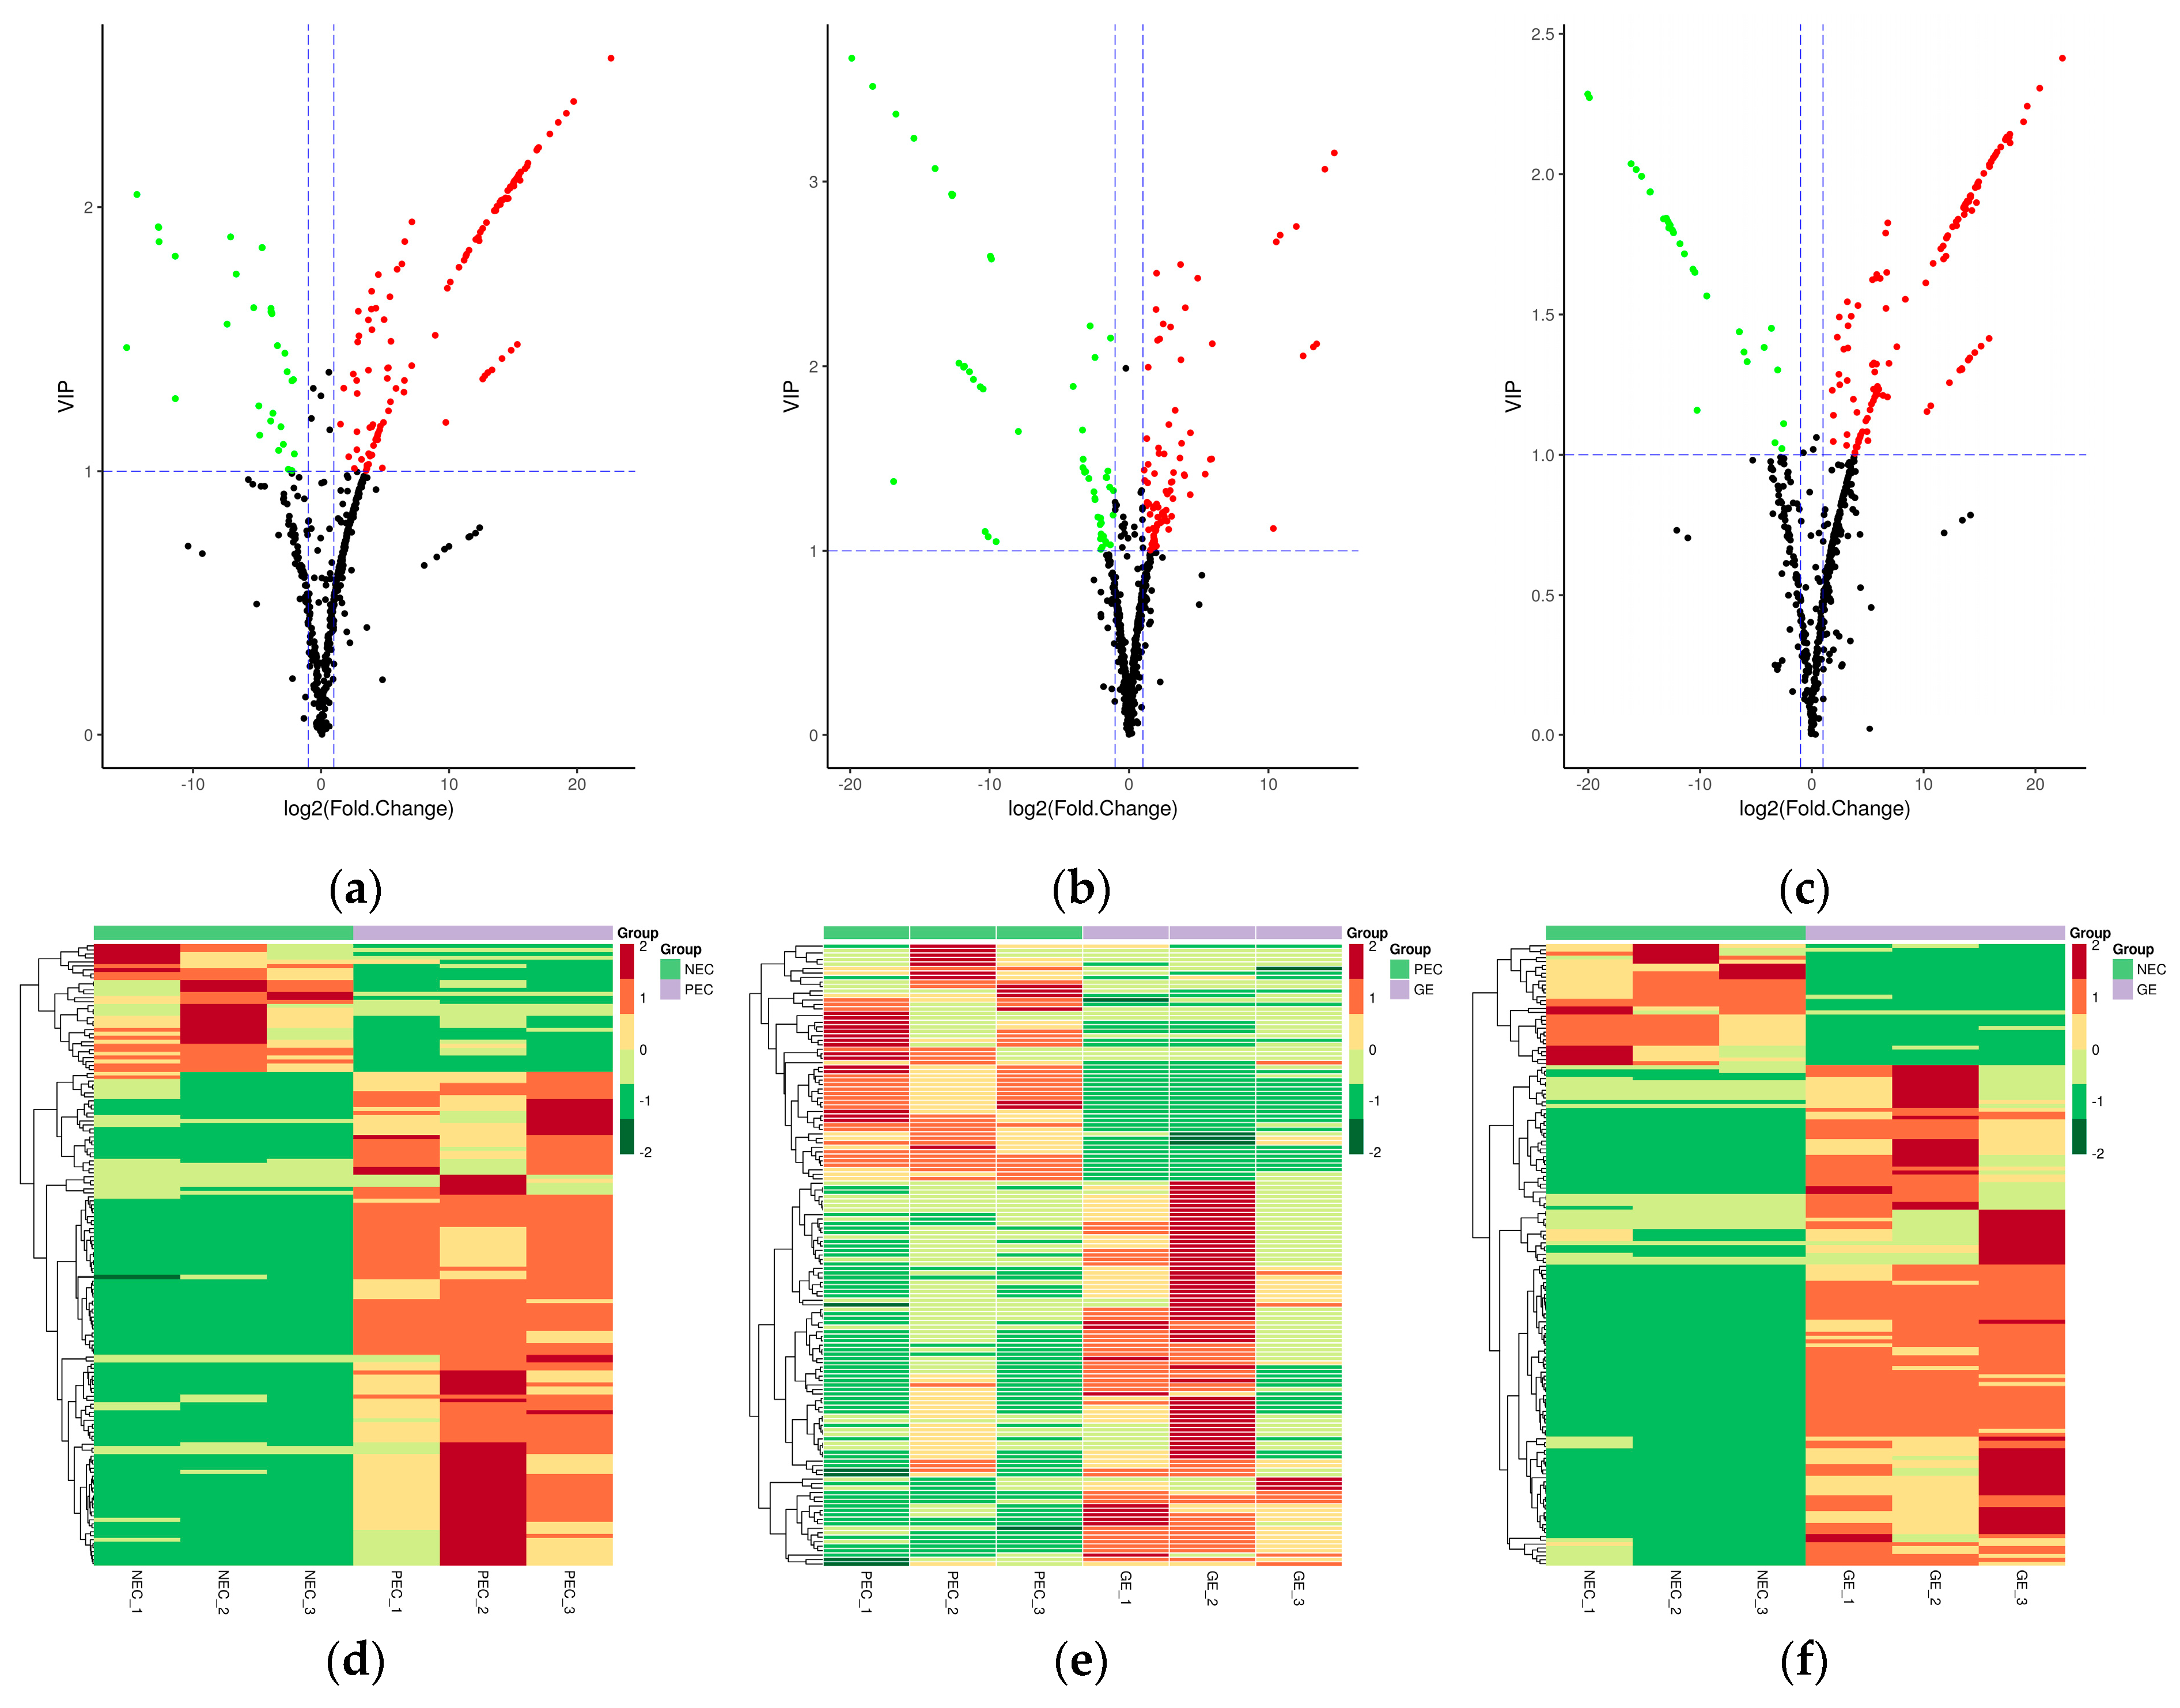
In this study, a hierarchical cluster analysis (HCA) was performed to assess the patterns of accumulation of the metabolites among the different samples. Results showed that PEC and GE can be clustered together while NEC forms a separate cluster, which suggests that there is significant differential accumulation of metabolites between the two transdifferentiation processes, embryogenic differentiation (PEC-NEC) and somatic embryo developmental initiation (GE-PEC).
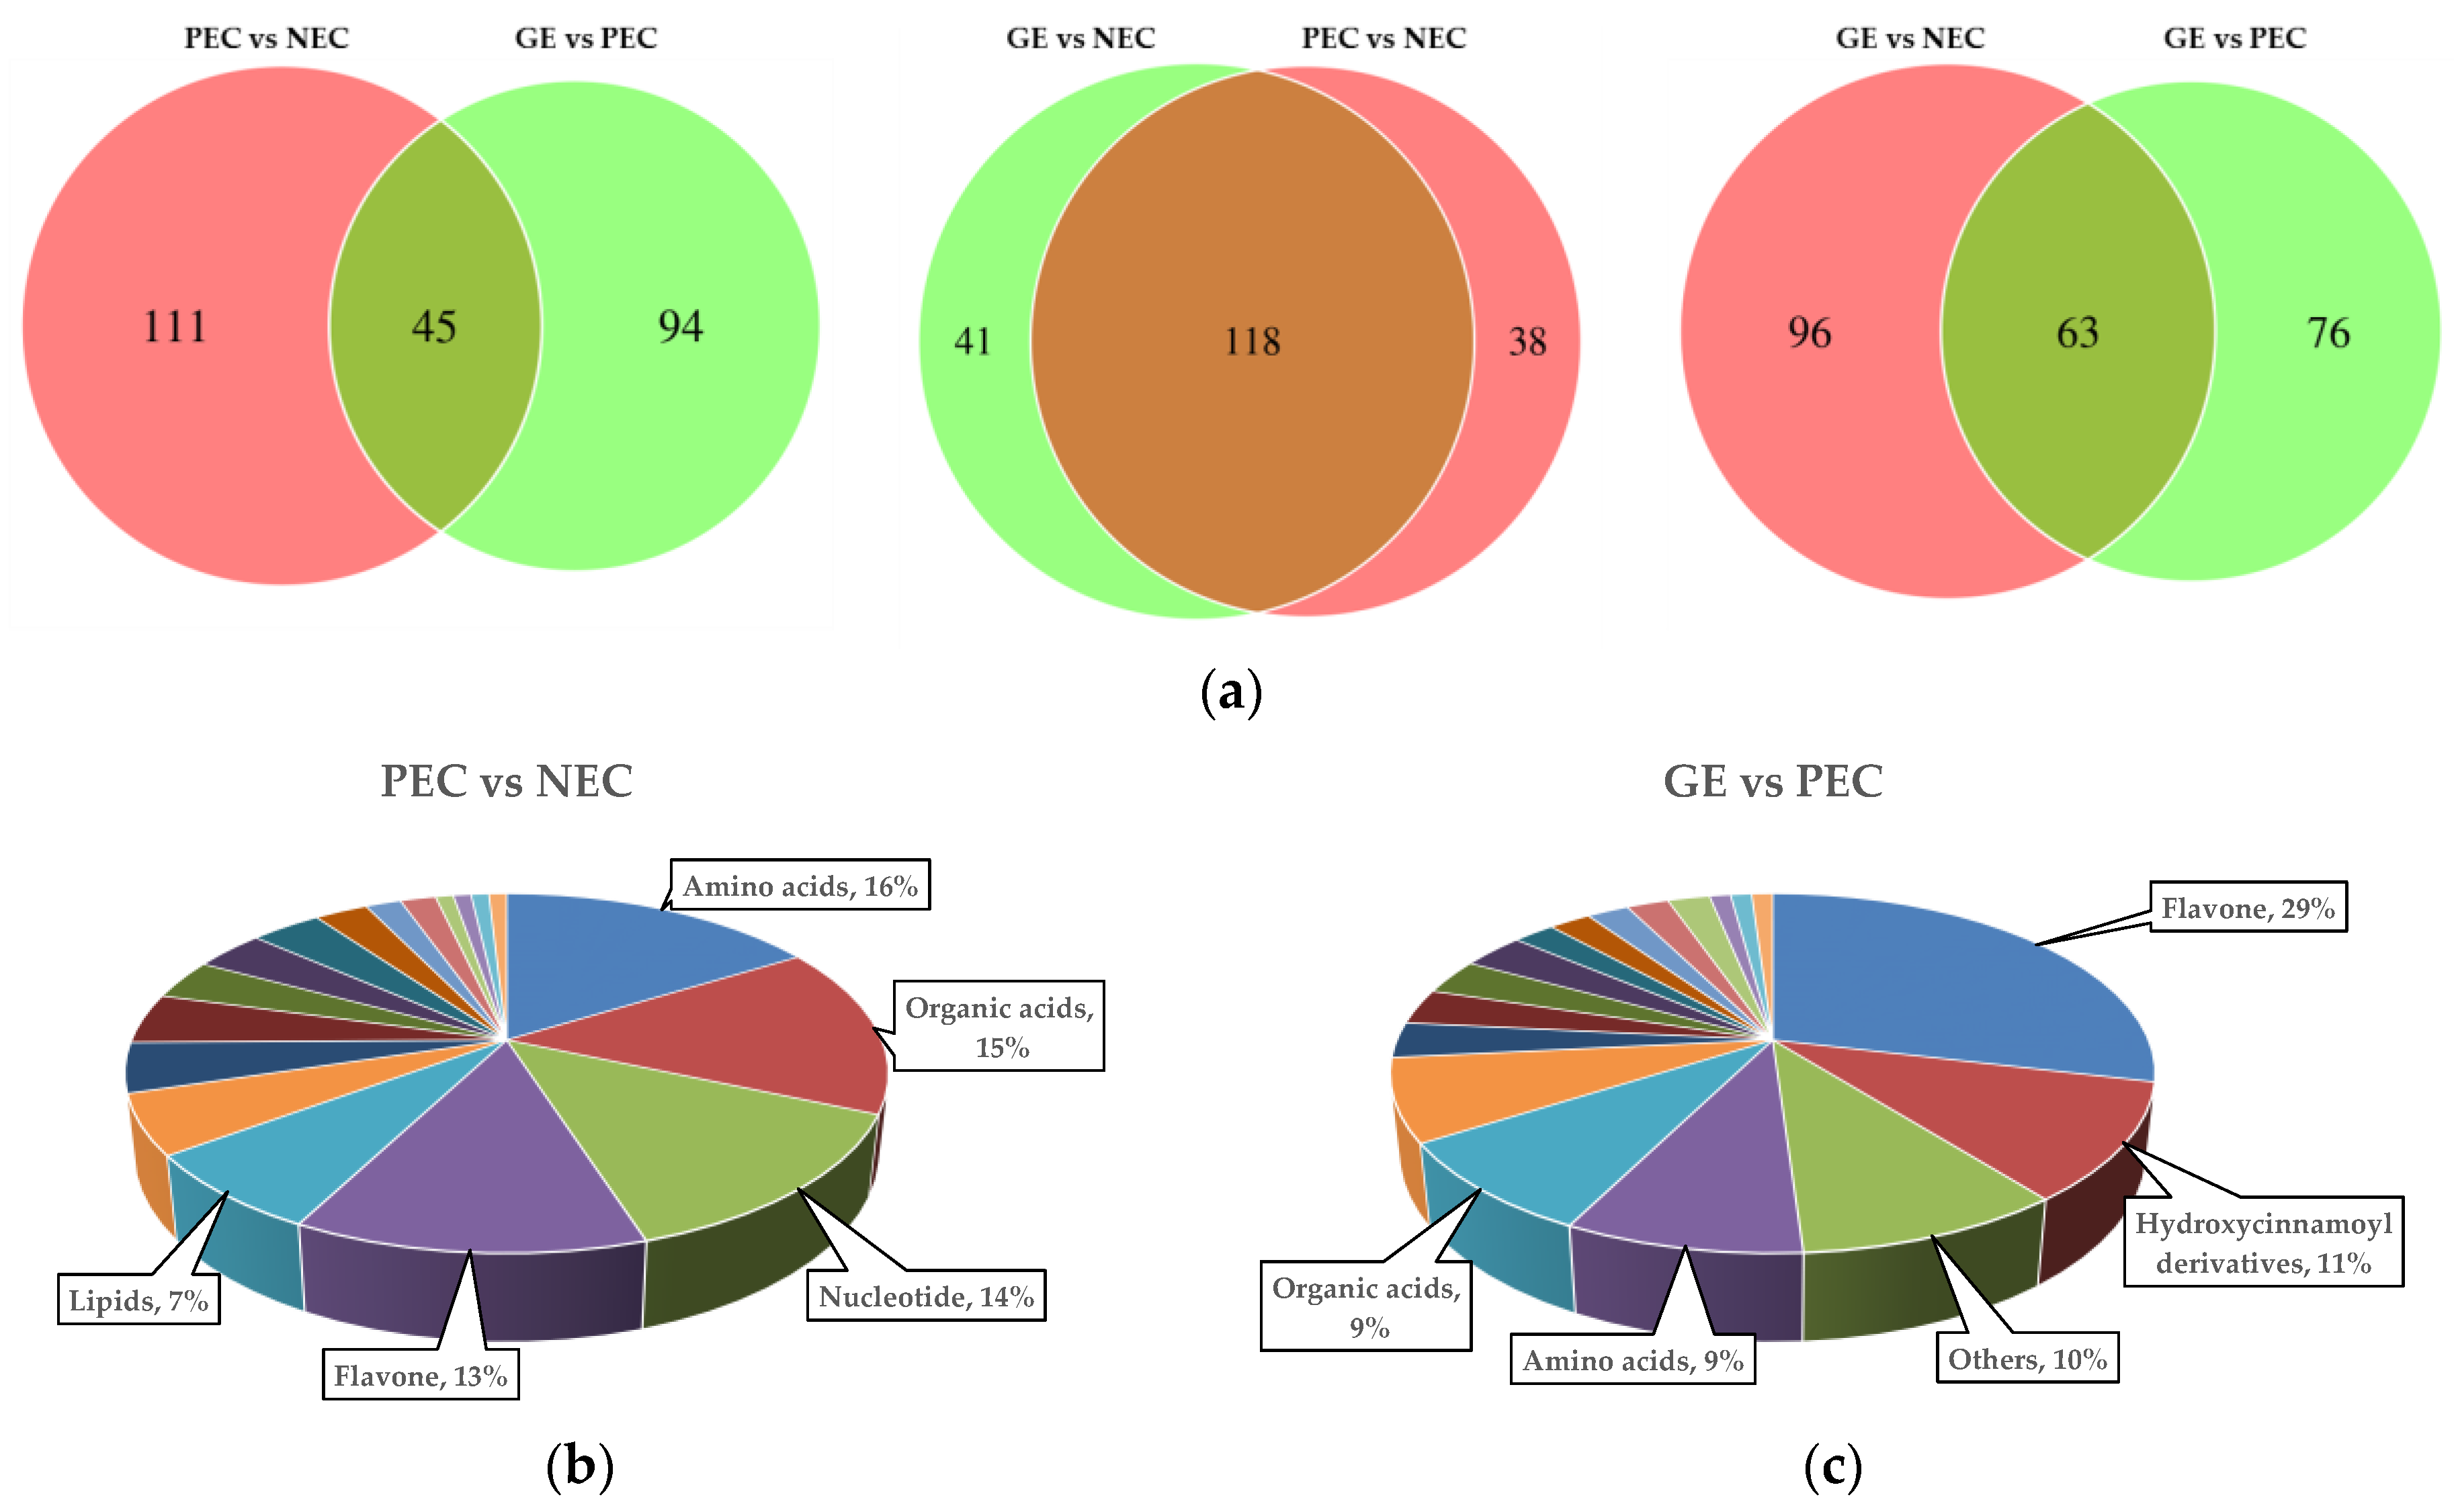
To investigate the differential metabolites specifically accumulated in (PEC-NEC) vs. (GE-PEC) vs. (GE-NEC), a Venn diagram was generated (Figure 5a; Table S3). The results showed that 26 metabolites were accumulated in common among (PEC-NEC) vs. (GE-PEC) vs. (GE-NEC). Meanwhile, 45 DAMs were accumulated in both (PEC-NEC) vs. (GE-PEC), 118 DAMs in both (PEC-NEC) vs. (GE-NEC), and 63 DAMs in both (GE-PEC) vs. (GE-NEC).
We examined the metabolites that were specifically accumulated between the two transdifferentiation processes, embryogenic differentiation (PEC-NEC), and somatic embryo development (GE-PEC). The results showed that there were 111 DAMs that were specifically accumulated in PEC vs. NEC, of which amino acids, organic acids, nucleotides, flavones, and lipids were the most represented (Figure 5b). Meanwhile, 94 DAMs were accumulated specifically in GE vs. PEC, of which flavones hydroxycinnamoyl derivatives, other metabolites, amino acids and organic acids accounted for a large proportion (Figure 5c). Specifically, nucleotides and lipids were more greatly accumulated during embryogenic differentiation, whereas greater amounts of flavones and hydroxycinnamoyl derivatives were accumulated during the somatic embryo development process. These data indicated that nucleotides and lipids may play important and special roles during embryogenic differentiation, whereas flavonoids are more important during the embryo maturation process.

3.2. Enrichment of Purine Metabolism in Embryogenic Differentiation

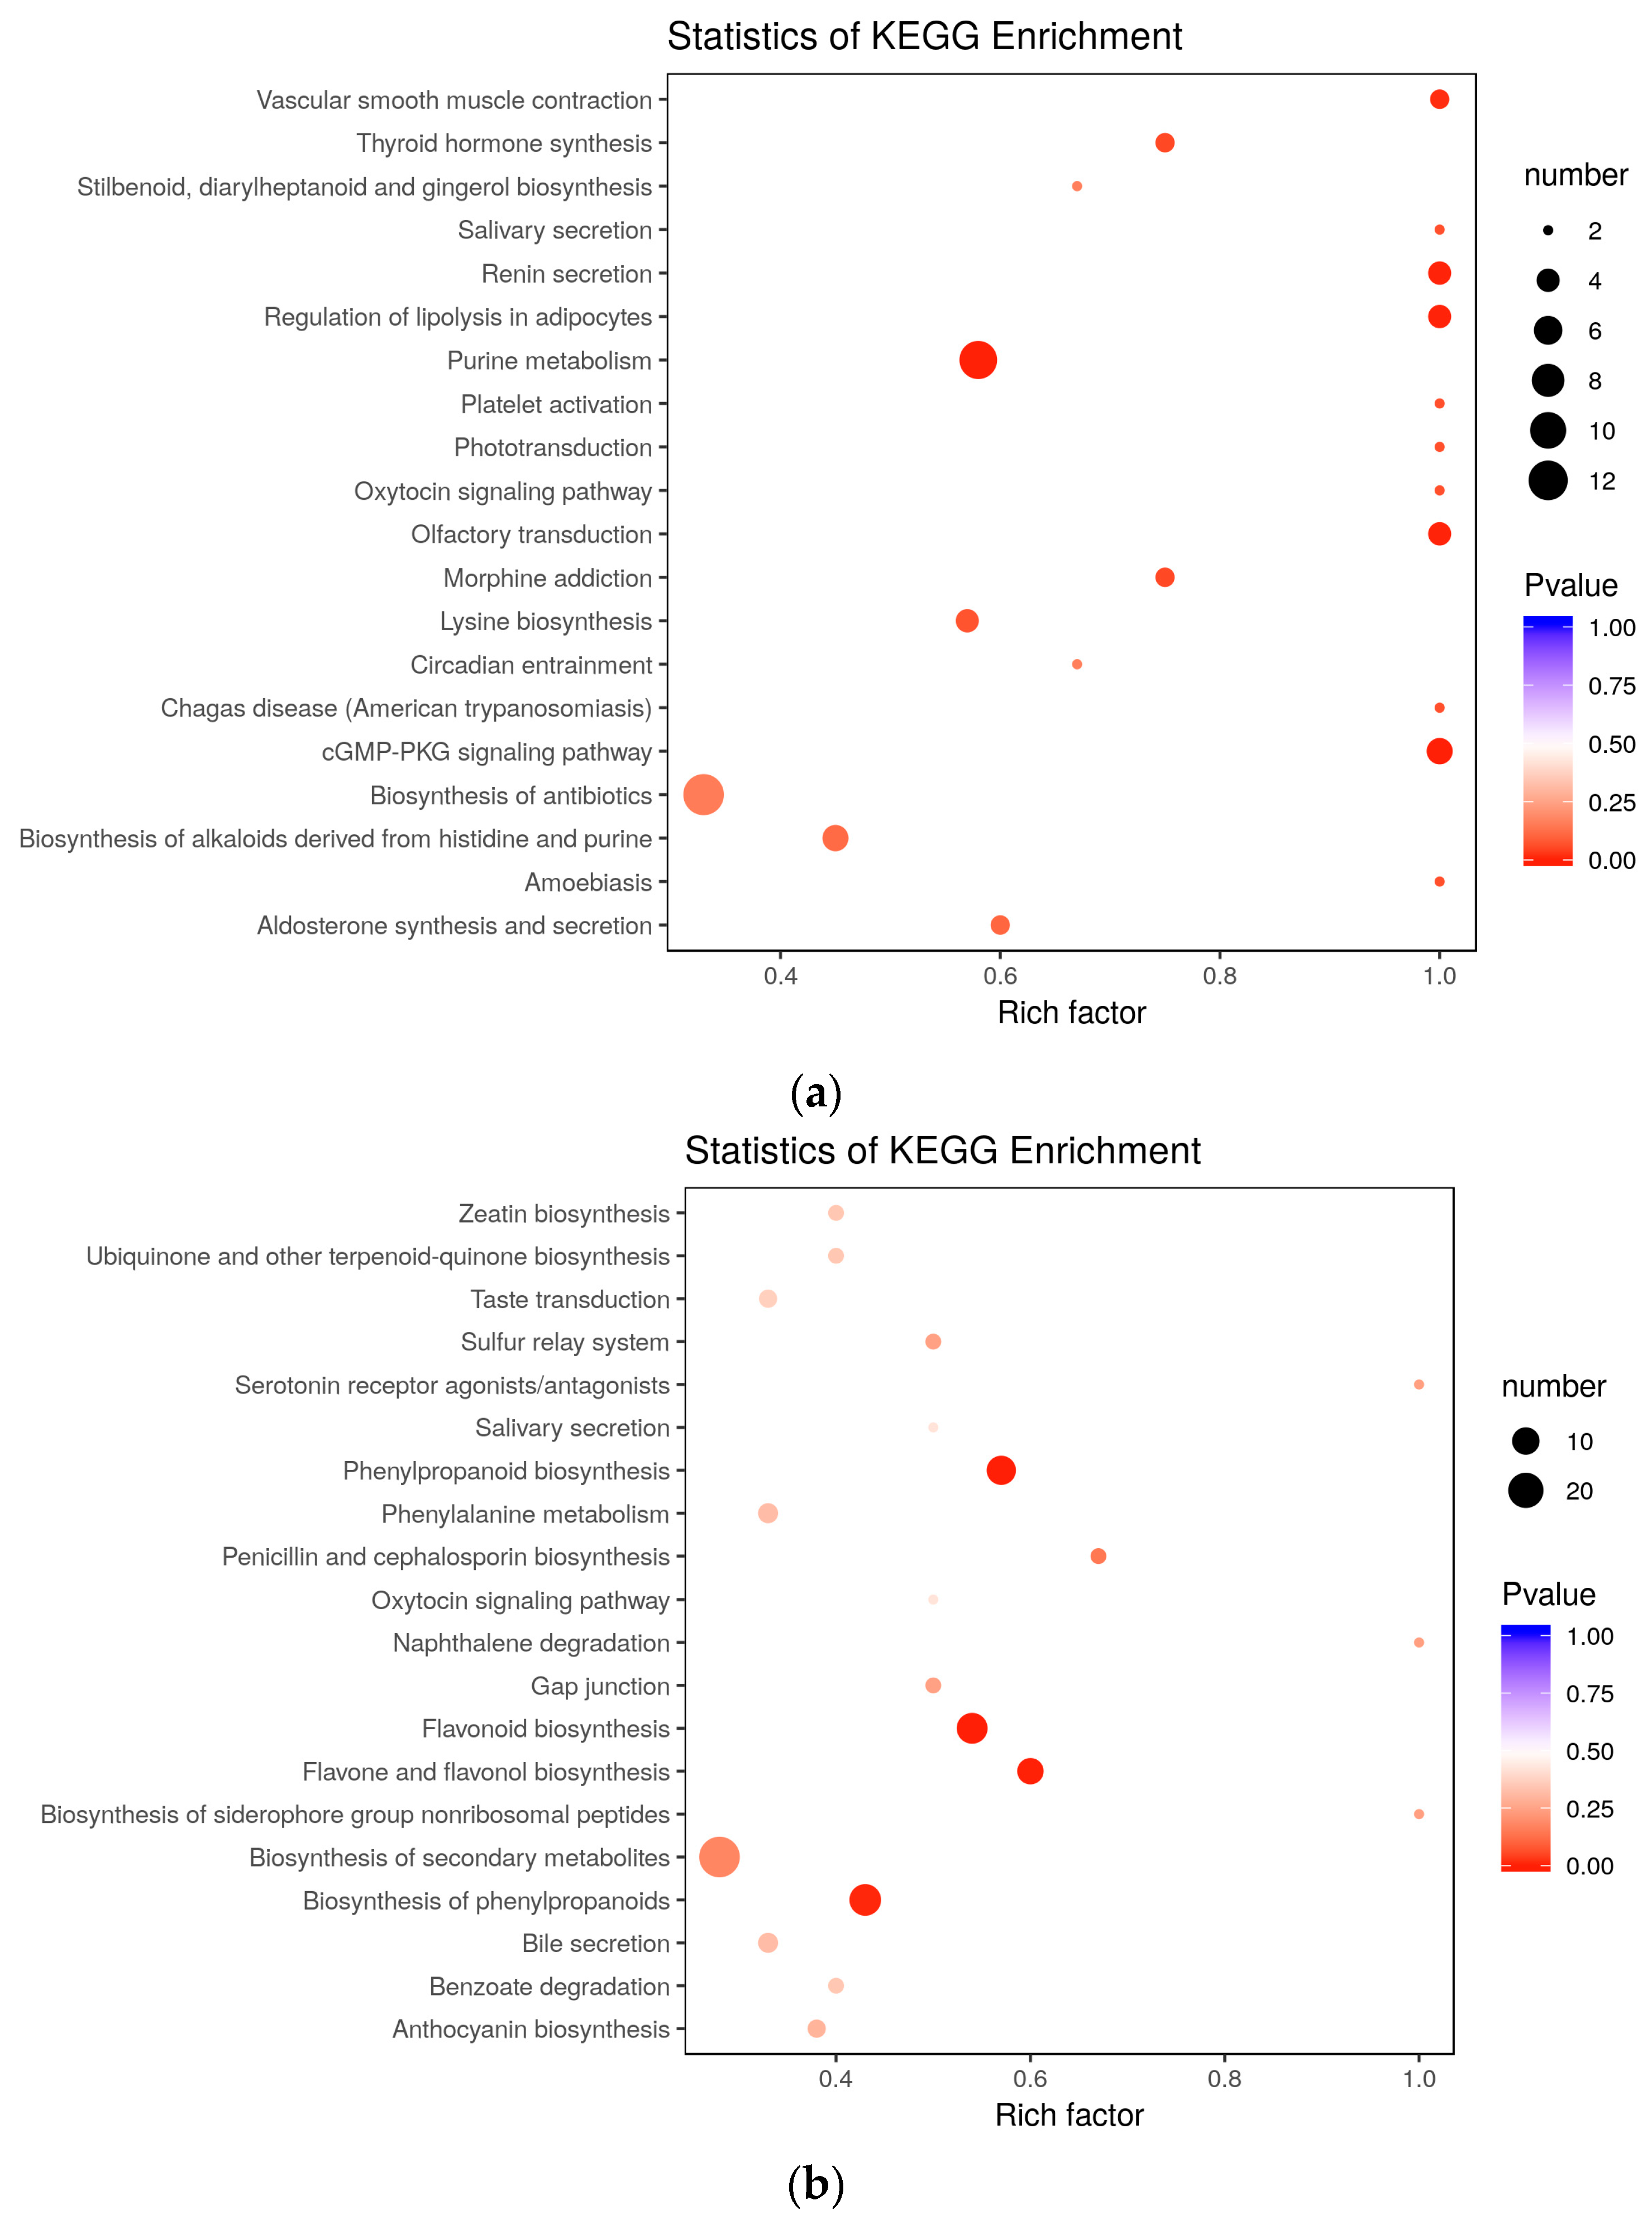
Purine metabolism refers to the metabolic pathways that synthesize and break down the purines that are present in many organisms. In our study, to investigate the functioning of SE-related metabolites, we analyzed the differences and dynamic metabolite changes among the three groups, PEC vs. NEC, GE vs. PEC, and GE vs. NEC. KEGG enrichment analysis showed that the ‘purine metabolism’ pathway was significantly enriched during embryogenic differentiation (
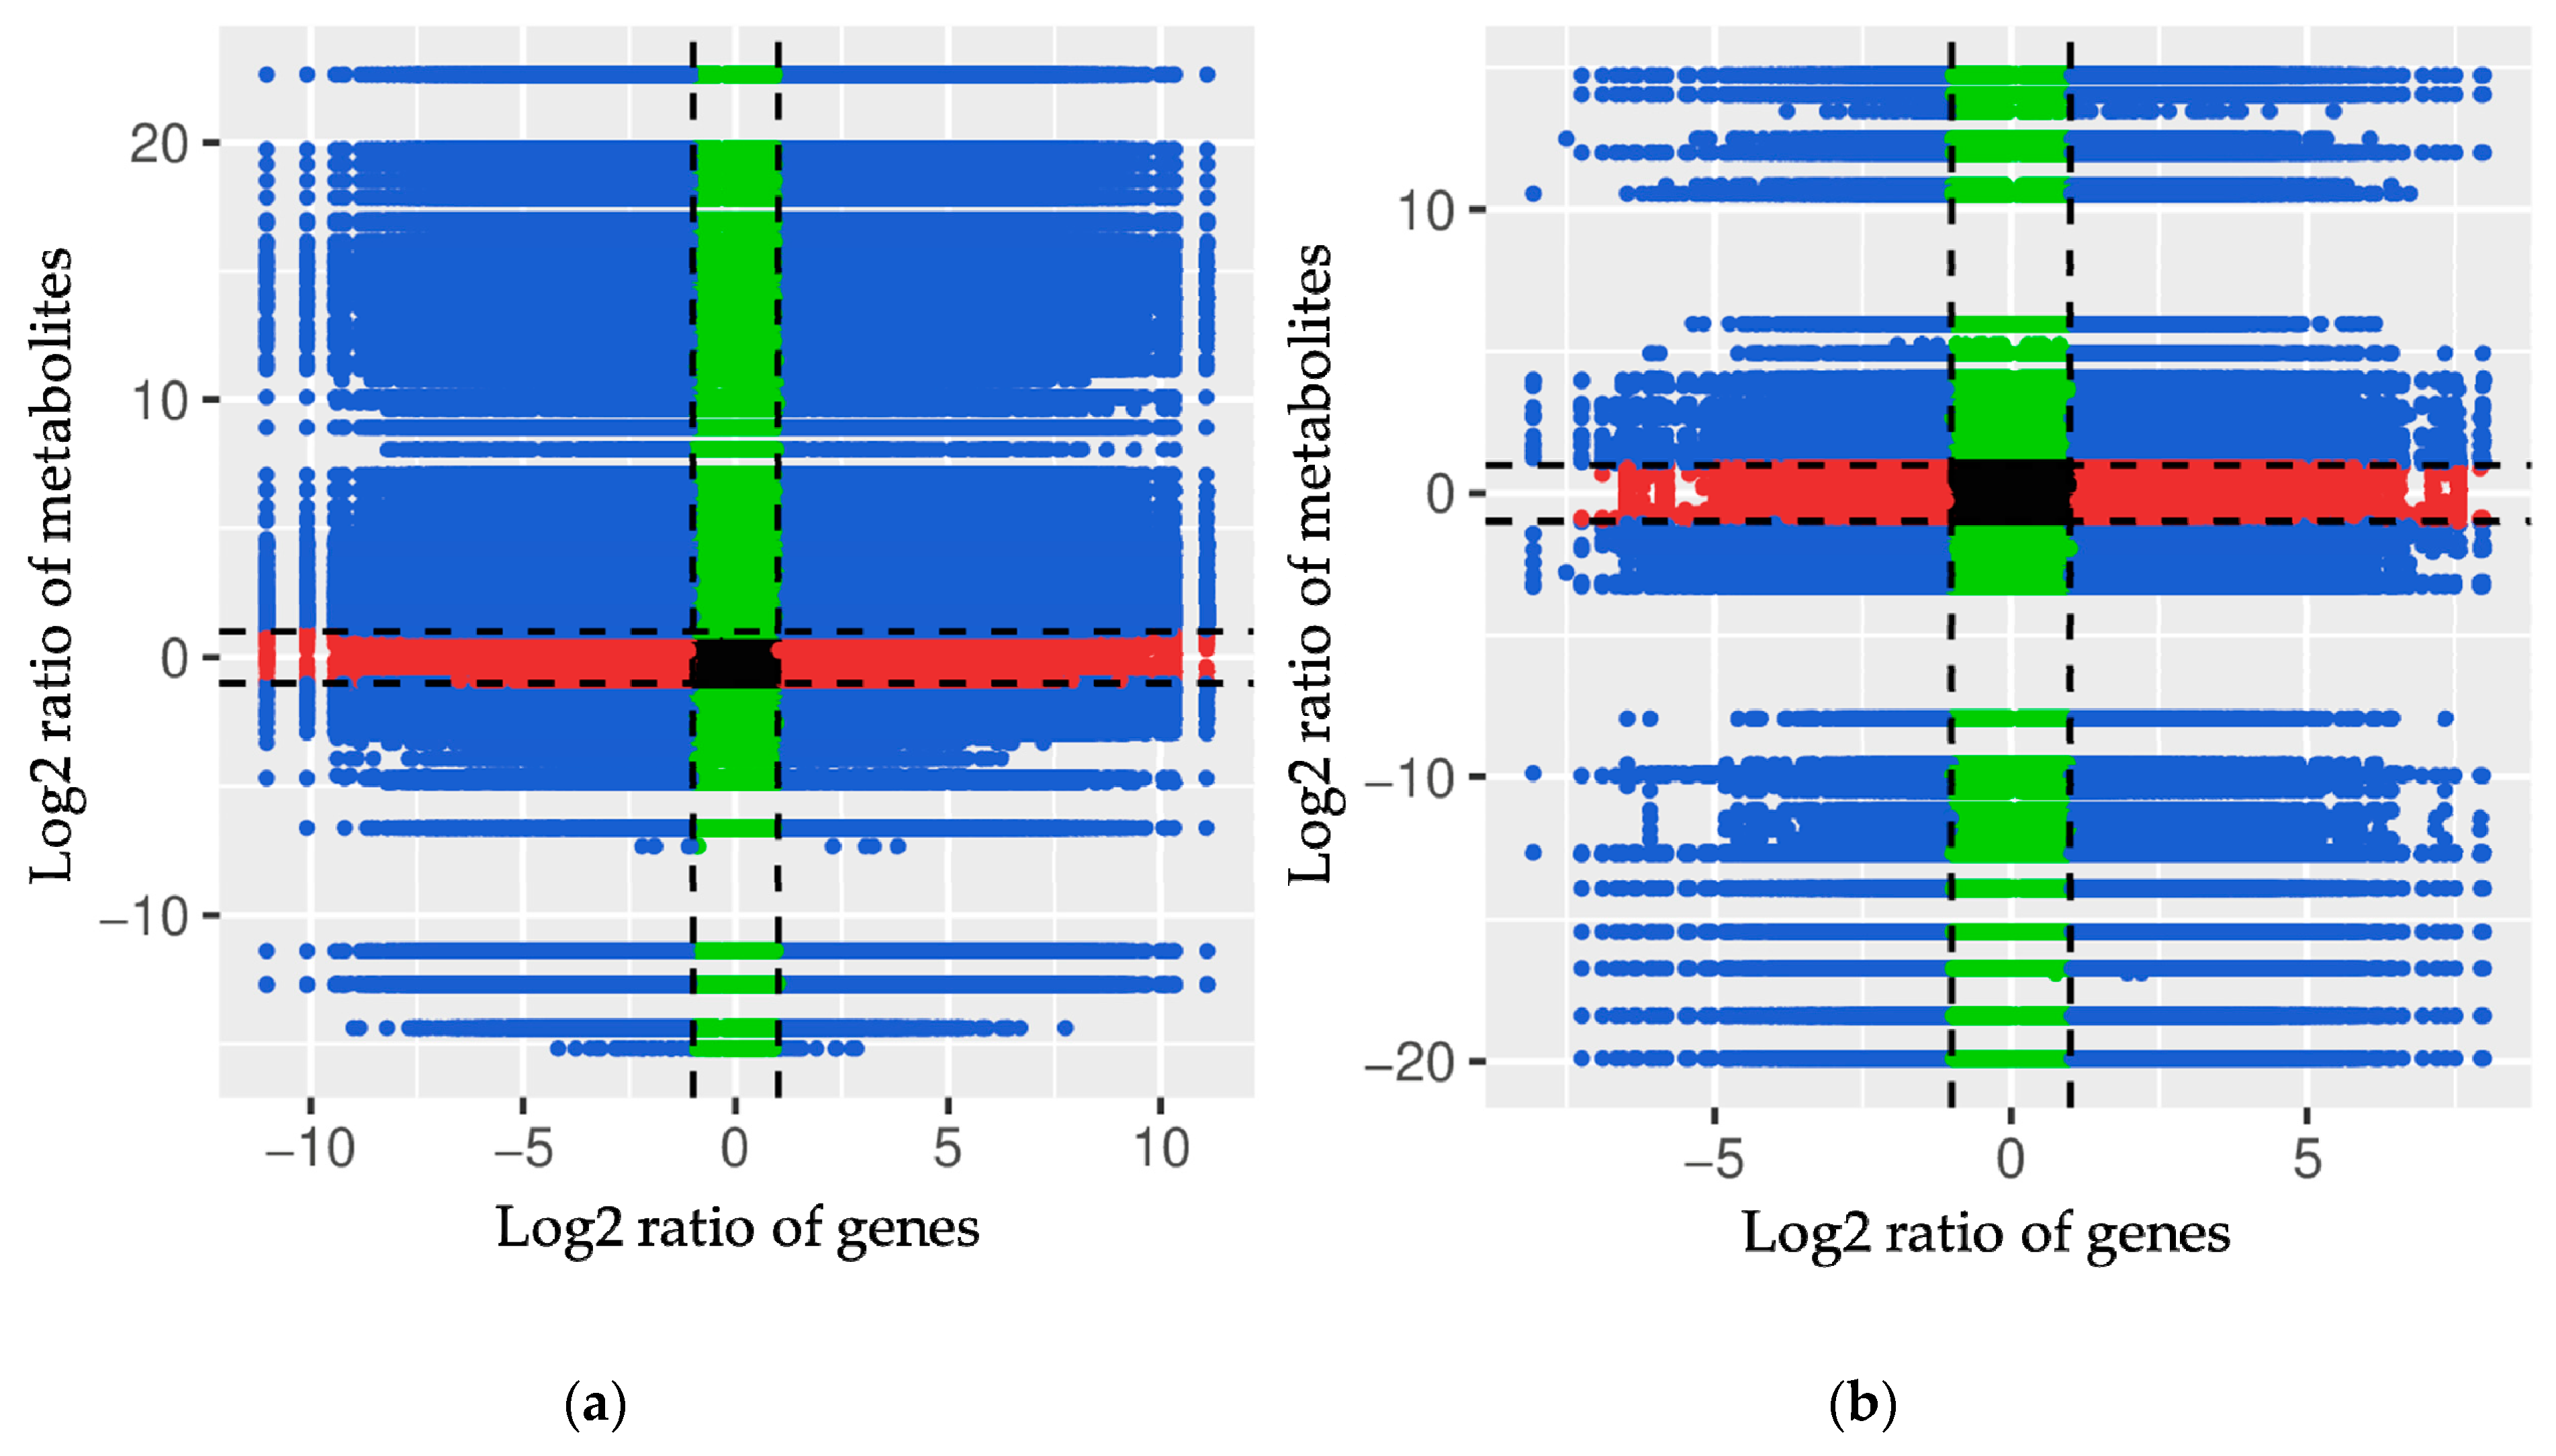
Figure 6b). All of the differentially accumulated metabolites related to purine metabolism were upregulated. Meanwhile, enrichment analysis of DAMs and DEGs showed that ‘purine metabolism’ was co-mapped based on results from the KEGG database (Table S5).
In our study, several major DEGs of regulatory factors were identified and significantly associated with purine metabolism in embryogenic differentiation, including receptor-like protein kinases, signal recognition, transcription, stress regulation, lipid binding, hormone responses, and histone modification were significantly upregulated during the embryogenic differentiation process (Table 4).
The role of purine metabolism in the SE process has been demonstrated in many plants. A comparative omic analysis of tree fern Cyathea delgadii explants that were undergoing direct SE was performed. The results revealed that the differentially regulated proteins adenine phosphoribosyl transferase 3 and adenosine kinase 2 were assigned to the purine metabolism category and were associated with direct SE in C. delgadii [60]. To understand the molecular mechanisms that regulate early SE in Eleutherococcus senticosus Maxim, a high-throughput RNA-seq technology was used to investigate its transcriptome. The initiation of SE affected gene expression in many KEGG pathways but predominantly affected expression in metabolic pathways and those related to the biosynthesis of secondary metabolites. Other unigenes were classified into the purine metabolism pathway [61]. Similar results were obtained in cotton (Gossypium hirsutum L.). RNA-seq was performed to analyze the genes expressed during SE and their expression dynamics using RNAs isolated from nonembryogenic callus (NEC), embryogenic callus (EC), and somatic embryos (SEs). The differentially expressed genes in NEC, EC, and SEs were identified, annotated, and classified. Partial DEGs were identified that were related to purine metabolism [62]. A possible critical role for purines during embryogenesis in geranium hypocotyl tissues (Pelargonium x hortorum) has also been reported [63]. The above results revealed the significant role of purine metabolism in EC proliferation.

3.3. Enrichment of Flavonoid Biosynthesis in Somatic Embryo Developmental Initiation

Flavonoids are synthesized by the phenylpropanoid metabolic pathway in which the amino acid phenylalanine is used to produce 4-coumaroyl-CoA. The metabolic pathway continues through a series of enzymatic modifications to yield flavanones, dihydroflavonols, and then anthocyanins. Along this pathway, many products can be formed, including flavonols, flavan-3-ols, proanthocyanidins (tannins) and a host of other various polyphenolics. In the current study, 139 differentially accumulated metabolites were identified in GE vs. PEC, and flavone was largely detected (Figure 4h). 94 DAMs accumulated specifically in somatic embryo development, of which flavone accounted for a large proportion (Figure 5c). KEGG enrichment analysis of DAMs suggested that ‘phenylpropanoid biosynthesis’, ‘flavone and flavonol biosynthesis’, ‘flavonoid biosynthesis’, and ‘biosynthesis of phenylpropanoids’ were enriched in GE vs. PEC (Figure 6b). Meanwhile, in co-mapped pathways between genes and metabolites, ‘phenylpropanoid biosynthesis’ (ko00940), ‘flavonoid biosynthesis’ (ko00941), and ‘flavone and flavonol biosynthesis’ (ko00944) showed significant accumulation in GE vs. PEC (Table S5).
The significant role of flavonoid biosynthesis in the somatic embryo development process has been investigated. In citrus cell cultures, there was no detectable accumulation of flavonoid in the undifferentiated calli, but flavonoid accumulated after the morphological changes to embryos. Two chalcone synthase (CHS) genes differentially expressed during citrus SE and CHS gene may regulate the accumulation of flavonoid [64].
With the goal to better understand SE development and to improve the efficiency of SE conversion in Theobroma cacao L., gene expression differences between zygotic and somatic embryos were examined using a whole genome microarray. Expression levels of genes involved in fatty acid metabolism and flavonoid biosynthesis were differentially expressed in the two types of embryos. The relatively higher expression of flavonoid related genes during SE suggested that the developing tissues may be experiencing high levels of stress during SE maturation caused by the in vitro environment [65].
Moreover, Wang et al. reported that overexpression of GhSPL10, a target of GhmiR157a, activated the flavonoid biosynthesis pathway, and promoted initial cellular dedifferentiation and callus proliferation [66]. The synthesis of flavonoids like anthocyanin in several plant tissues has been associated with increased phenylalanine ammonia lyase (PAL) activity. The increased PAL level was detected in samples collected from different growth phases during SE in Silybum marianum. As intermediary products of phenylpropanoid metabolism, flavonoids may stimulate differentiation and create a situation that is more favorable for embryogenesis [67]. These conclusions demonstrated that flavonoids biosynthesis might be frequently associated with somatic embryo development during cotton SE transdifferentiation.

4. Materials and Methods

4.1. Plant Materials and Culture Conditions

Upland cotton (Gossypium hirsutum cv. YZ-1) seeds were sterilized in 0.1% HgCl2 (w/v) for 8 min and were then rinsed 3–4 times with distilled water. The seeds were then germinated in Murashige and Skoog (MS) medium supplemented with 3% (w/v) sucrose and 0.25% (w/v) phytagel. Hypocotyl explants (0.5–1.0 cm) from 7-day-old seedlings were cultured in MS plus B5 vitamin (MSB) medium containing 0.45 μmol·L−1 2,4-dichlorophenoxyacetic acid (2,4-D) and 0.46 μmol·L−1 kinetin (KT). NEC were maintained in MSB medium for 6 weeks at 28 °C in a 16/8 h light/dark photoperiod and were then subcultured in fresh MSB medium without hormones. Following an additional 3–4 weeks of growth, the somatic-to-embryogenic transition progressed to the point where it induced the development of PEC and GE. Based on our previous approach as published recently [53], these representative staged samples of NEC, PEC, and GE could be highly enriched and collected, frozen immediately in liquid nitrogen, and stored at −80 °C for subsequent metabolic and transcriptomic profiling. The sample from each stage was prepared using three biological replicates.

4.2. Sample Preparation and Extraction for Widely Targeted Metabolic Profiling

Chemical extraction was carried out on nine samples (three biological replicates for each of three developmental stages) for the purposes of metabolic analyses. Each freeze-dried sample was crushed using a mixer mill (MM 400, Retsch, Haan, Germany) with a zirconia bead for 1.5 min at 30 Hz. One hundred milligrams of powder was weighed and extracted overnight at 4 °C in 1.0 mL 70% aqueous methanol. Following centrifugation at 10000 g for 10 min, the extracts were absorbed using a CNWBOND Carbon-GCB SPE Cartridge (250 mg, 3 mL; ANPEL, Shanghai, China, www.anpel.com.cn/cnw) and filtered with a SCAA-104 filter (0.22 μm pore size; ANPEL, Shanghai, China, http://www.anpel.com.cn/) prior to LC-MS analysis.

4.3. HPLC Conditions

The sample extracts were analyzed using an LC-ESI-MS/MS system (HPLC: Shim-pack UFLC SHIMADZU CBM30A system, www.shimadzu.com.cn/; MS: Applied Biosystems 6500 Q TRAP, www.appliedbiosystems.com.cn/). The analytical conditions were as follows: HPLC column, Waters ACQUITY UPLC HSS T3 C18 (1.8 μm, 2.1 × 100 mm); solvent system, water (0.04% acetic acid) and acetonitrile (0.04% acetic acid); gradient program, 95:5 v/v at 0 min, 5:95 v/v at 11.0 min, 5:95 v/v at 12.0 min, 95:5 v/v at 12.1 min, 95:5 v/v at 15.0 min; flow rate, 0.40 mL/min; temperature, 40 °C; injection volume, 2 μL. The effluent was alternatively connected to an ESI-triple quadrupole-linear ion trap (Q TRAP)-MS.

4.4. ESI-Q TRAP-MS/MS

LIT and triple quadrupole (QQQ) scans were acquired using a triple quadrupole-linear ion trap mass spectrometer (Q TRAP) API 6500 Q TRAP LC/MS/MS System equipped with an ESI Turbo ion-spray interface, operated in positive ion mode and controlled using Analyst 1.6 software (AB Sciex). The ESI source operation parameters were as follows: ion source, turbo spray; source temperature, 500 °C; ion spray voltage (IS), 5500 V; ion source gas I (GSI), gas II (GSII), and curtain gas (CUR), 55, 60, and 25.0 psi, respectively; the collision gas (CAD) was set to high. The instrument tuning and mass calibration were performed using 10 and 100 μmol/L polypropylene glycol solutions in QQQ and LIT modes, respectively. QQQ scans were acquired during MRM experiments in which the collision gas (nitrogen) was set to 5 psi. DP and CE for individual MRM transitions were conducted after further DP and CE optimization. A specific set of MRM transitions were monitored during each period based on the metabolites that eluted during this period [68,69].

4.5. Widely Targeted Metabolic Profiling

The samples were analyzed using a metabolomic platform that combined ultra-performance liquid chromatography (UPLC) and tandem mass spectrometry (MS/MS). Metabolite identification was performed using the MWDB metware database (Metware Biotechnology Co., Ltd. Wuhan, China) and other public databases according to standard metabolic operating procedures.

4.6. Statistical Analysis

The metabolite abundances were quantified using the peak areas. The data obtaining from the metabolite profiling were normalized for the principal component analysis (PCA) and partial least squares-discriminant analysis (PLS-DA) [70,71]. Metabolites with significant differences in content were defined as having a variable importance in project (VIP) ≥ 1 and a fold change ≥ 2 or ≤ 0.5. Fisher’s exact test was applied to identify the significant KEGG pathways with a false discovery rate (FDR) < 0.05 [72]. Gene-metabolite pairs with a Pearson’s correlation coefficient > 0.8 were used to construct the transcript-metabolite network.

5. Conclusions

Somatic embryogenesis is the developmental reprogramming of somatic cells toward the embryogenesis pathway. In this study, the dynamic metabolomic and transcriptomic profiling of cotton SE transdifferentiation processes, embryogenic differentiation, and somatic embryo development, were comparatively investigated.
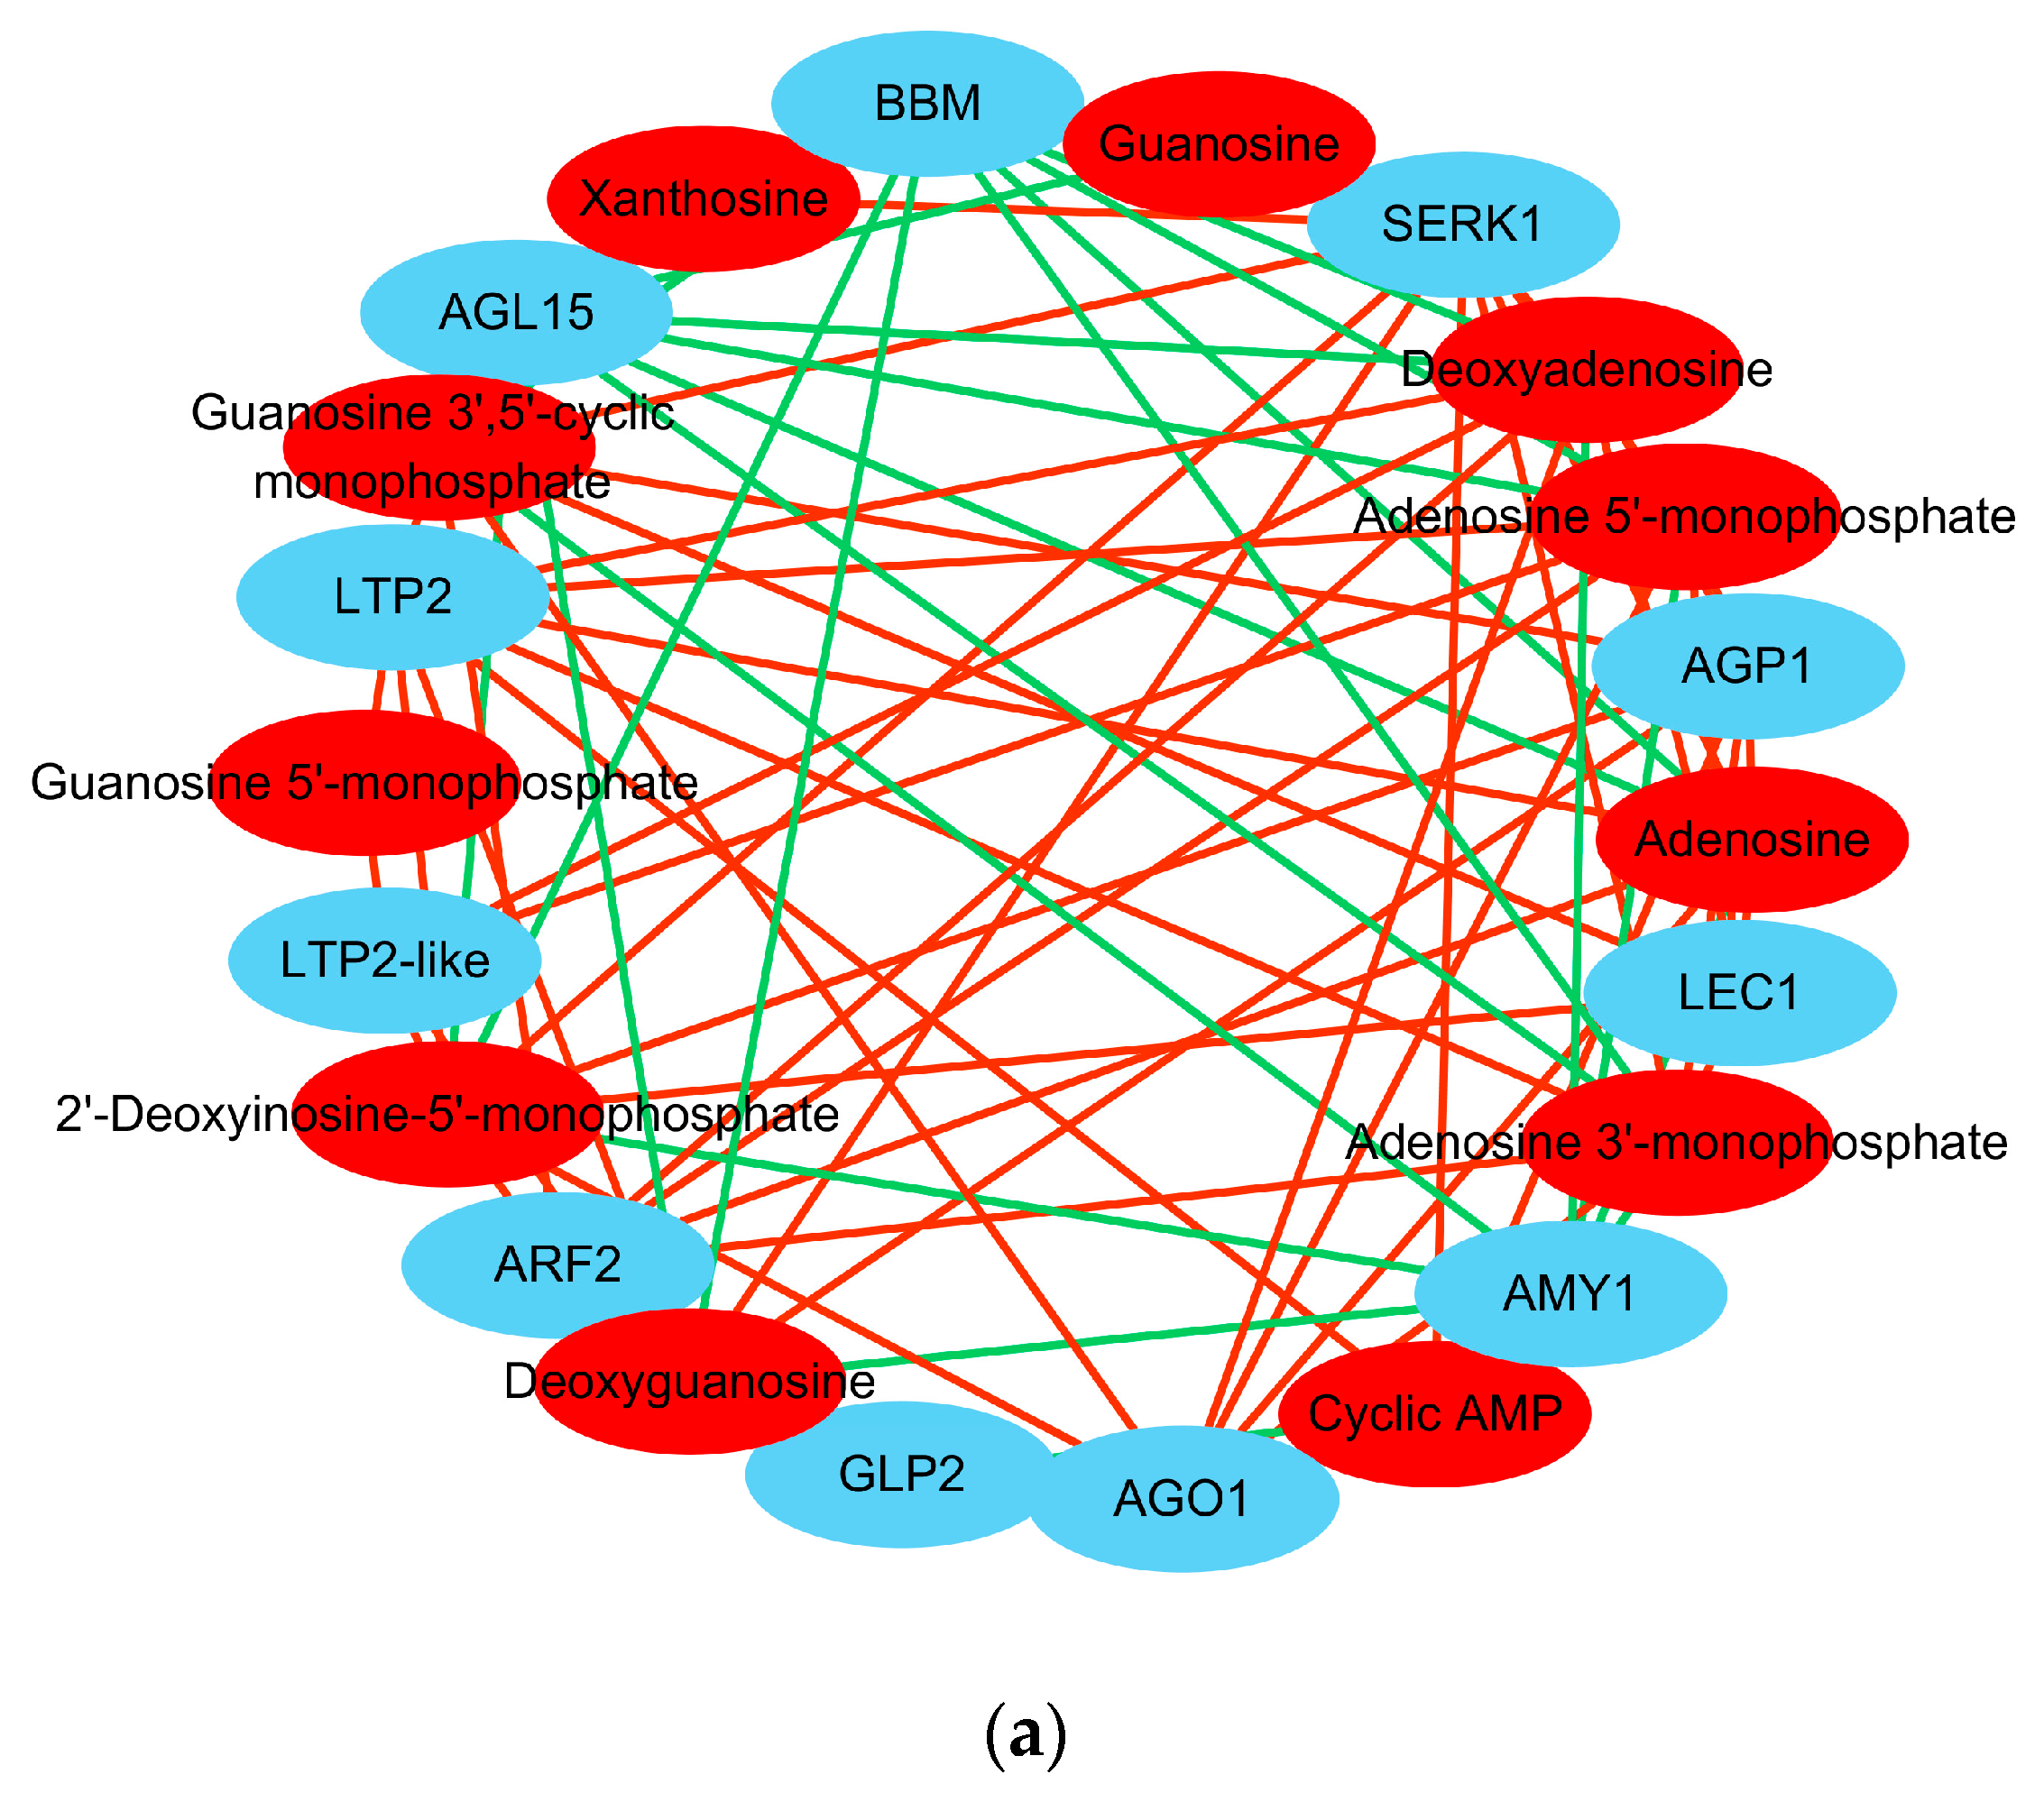
During embryogenic differentiation (PEC vs. NEC), nucleotides and lipids were specifically accumulated. And the metabolome wide DAMs significantly enriched in purine metabolism (Table 2). In addition, purine metabolism-related genes associated with signal recognition, transcription, stress, and lipid binding were remarkably activated (Table 4). Moreover, several classic SE genes that specifically activated during embryogenic differentiation, including BBM, SERK1, LEC1, ARF2, AGL15, AGP1, GLP2, AGO1, LTP2, and AMY1, were highly correlated with the corresponding metabolites that were involved in purine metabolism (Table 5).
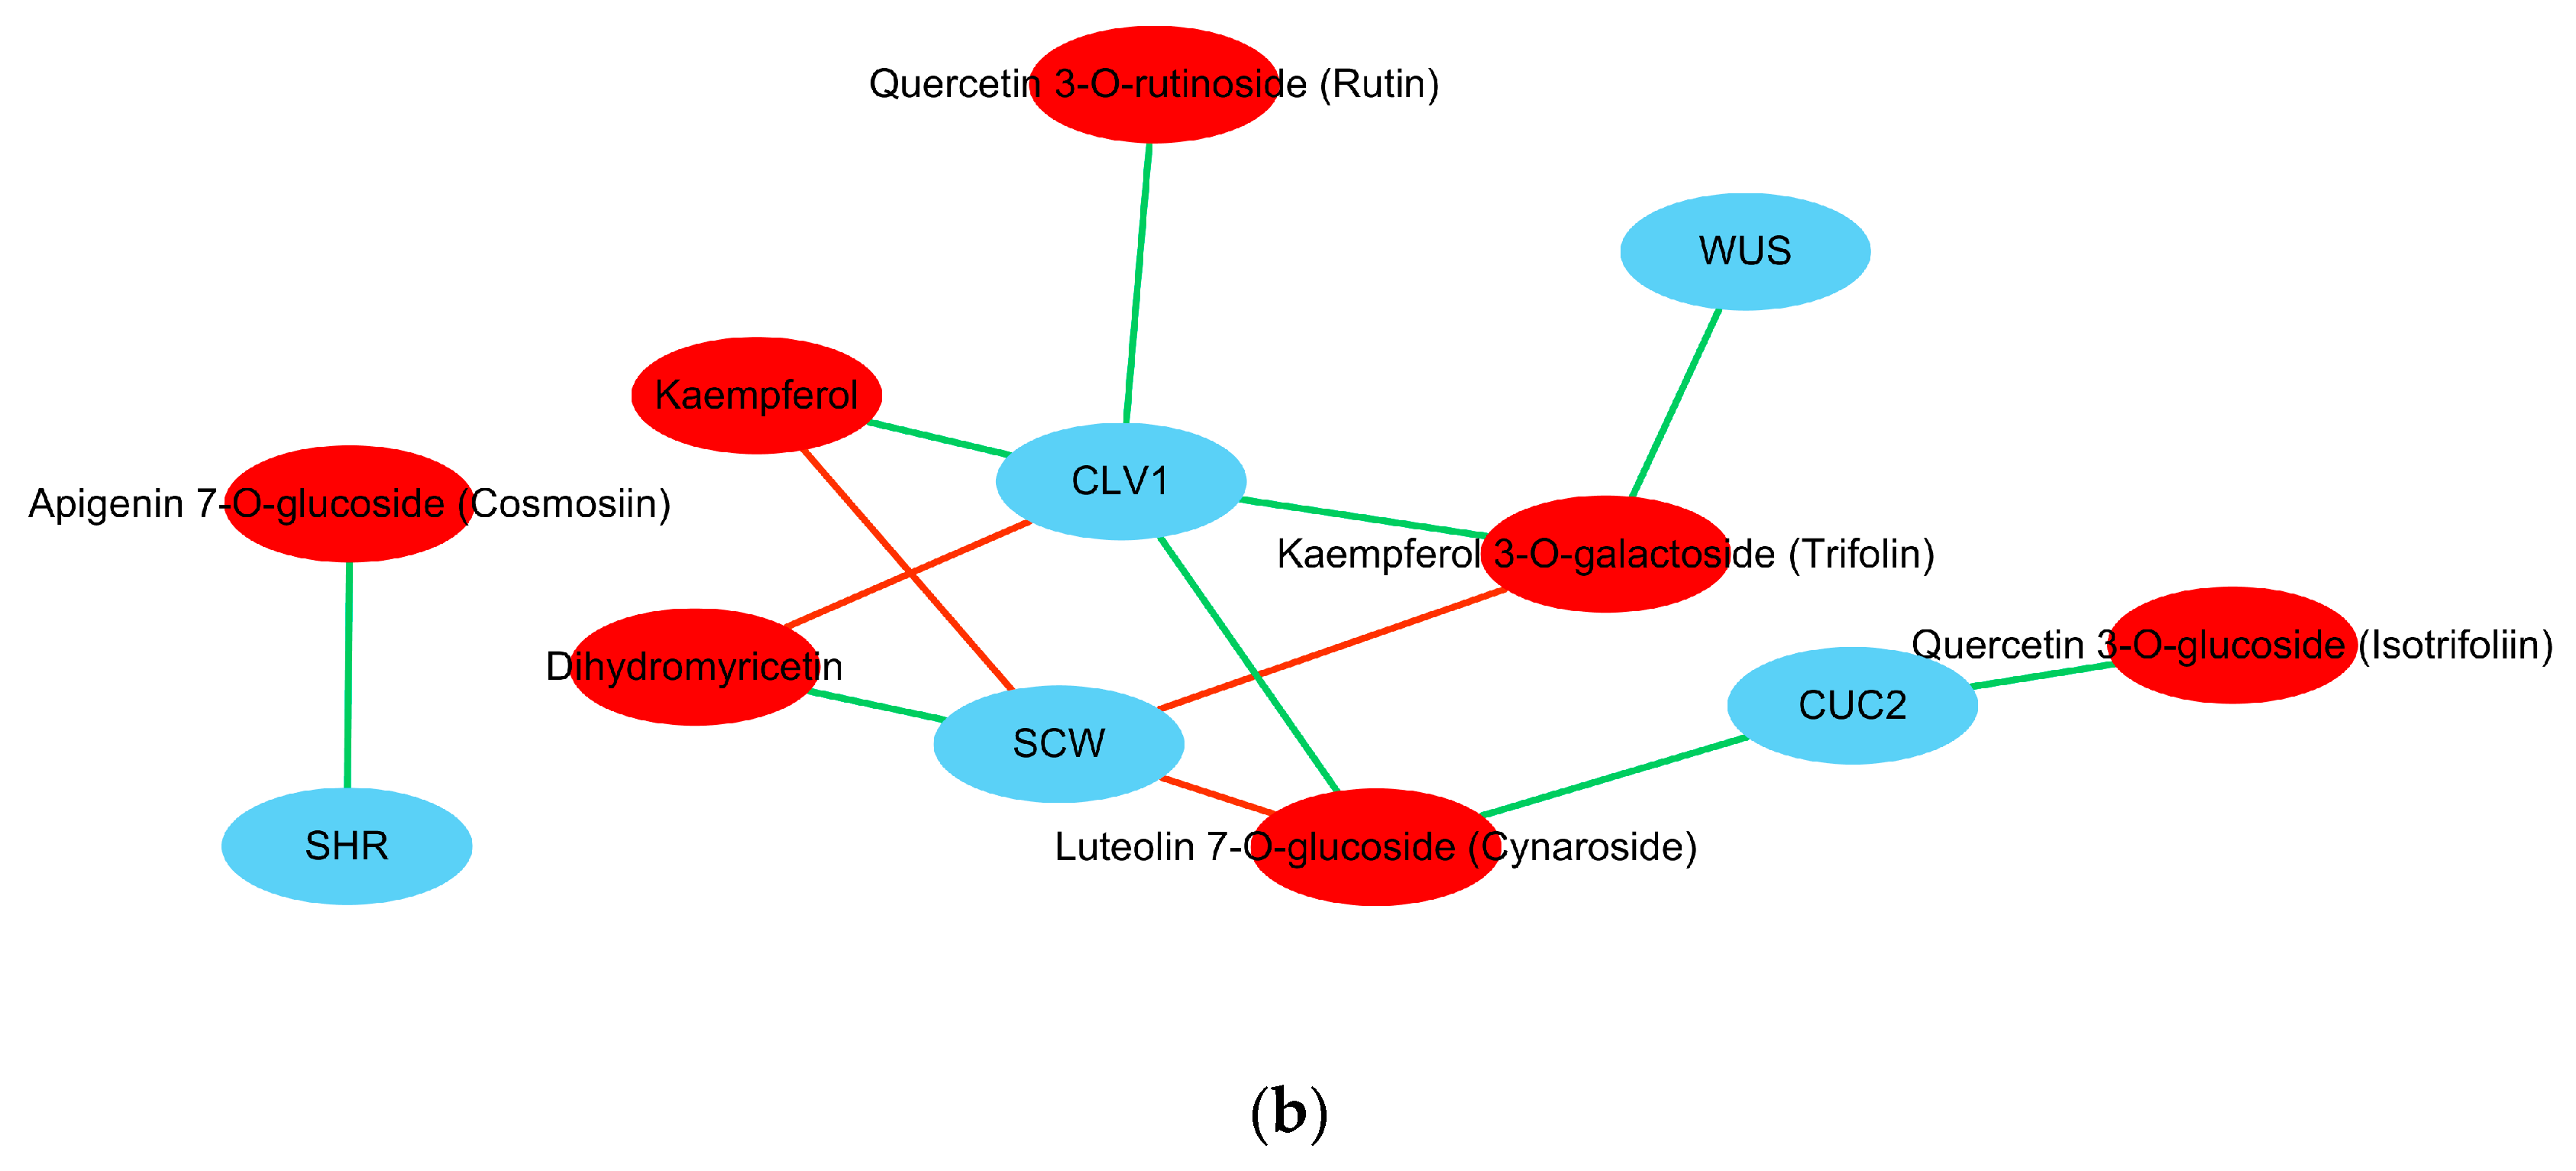
During somatic embryo development (GE vs. PEC), flavones and hydroxycinnamoyl derivatives were largely accumulated. DAMs were most significantly associated with flavonoid biosynthesis (Table 3). Classic SE genes that control somatic embryo development, including WUS, CLV1, CUC2, SHR, and SCW, were highly correlated with the corresponding metabolites that were involved in flavonoid biosynthesis (Table 6).
By interactively comparing metabolomic and transcriptomic data, we identified a series of potential metabolites and the corresponding differentially expressed genes candidate for a relevant role in SE transdifferentiation. The findings in our work provide new insights into the underlying molecular and biochemical basis associated with embryogenic competence acquisition underpinning cotton SE development.

Supplementary Materials

Supplementary materials can be found at https://0-www-mdpi-com.brum.beds.ac.uk/1422-0067/20/9/2070/s1.

Author Contributions

Data curation, H.G. (Huihui Guo), H.G. (Haixia Guo), L.Z., Z.T., X.Y., J.W. and F.Z.; Formal analysis, H.G. (Huihui Guo), Z.T. and F.Z.; Funding acquisition, F.Z.; Investigation, H.G. (Huihui Guo), H.G. (Haixia Guo), L.Z. and X.Y.; Methodology, H.G. (Huihui Guo), H.G. (Haixia Guo), L.Z., Z.T. and J.W.; Project administration, F.Z.; Resources, H.G. (Haixia Guo), L.Z. and X.Y.; Software, J.W.; Supervision, F.Z.; Validation, H.G. (Huihui Guo), H.G. (Haixia Guo) and Z.T.; Writing—original draft, H.G. (Huihui Guo) and H.G. (Haixia Guo); Writing—review & editing, H.G. (Huihui Guo), X.Y. and F.Z.

Funding

This work was supported by the National Natural Science Foundation of China (31401428), Fok Ying-Tong Foundation (151024), Taishan Scholar Talent Project from PRC (TSQN20161018).

Conflicts of Interest

The authors declare no conflict of interest.

Abbreviations

ABA2Abscisic aldehyde synthesis enzyme 2
ABI3Abscisic acid insensitive 3
AGL15Agamous-like 15
AGO1Argonaute 1
AGPArabinogalactan protein
AMYAlpha-amylase
ARFAuxin response factor
BBMBaby boom
CLV1Clavata 1
CUC2Cup-shaped cotyledon 2
DAMsDifferentially accumulated metabolites
DEGsDifferentially expressed genes
GEInitiation staged embryos with globular-like enriched
GLPGermin-like protein
HCAHierarchical cluster analysis
JAZ1Jasmonate ZIM-domain 1
KEGGKyoto encyclopedia of genes and genomes
LEA1Late embryogenesis abundant protein 1
LECLeafy cotyledon
LTPLipid transfer protein
MS/MSTandem mass spectrometry
NECNonembryogenic staged calli
PCAPrincipal component analysis
PCCPearson correlation coefficient
PECPrimary embryogenic calli
QCQuality control
SCWScarecrow
SESomatic embryogenesis
SERKSomatic embryogenesis receptor kinase
SHRShort-root
STMShoot meristemless
TICTotal ions current
UPLCUltra-performance liquid chromatography
VIPVariable importance in project
WUSWuschel

References

  1. Zeng, F.; Zhang, X.; Cheng, L.; Hu, L.; Zhu, L.; Cao, J.; Guo, X. A draft gene regulatory network for cellular totipotency reprogramming during plant somatic embryogenesis. Genomics 2007, 90, 620–628. [Google Scholar] [CrossRef] [Green Version]
  2. Loyolavargas, V.; Delapeña, C.; Galazávalos, R.; Quirozfigueroa, F. Plant tissue culture. In Molecular Biomethods Handbook, 2nd ed.; Walker, J., Rapley, R., Eds.; Humana Press: New York, NY, USA, 2008; pp. 875–904. [Google Scholar]
  3. Ikeuchi, M.; Sugimoto, K.; Iwase, A. Plant callus: Mechanisms of induction and repression. Plant Cell 2013, 25, 3159–3173. [Google Scholar] [CrossRef] [PubMed]
  4. Sakhanokho, H.; Rajasekaran, K. Cotton regeneration in vitro. In Fiber Plants; Ramawat, K.G., Ahuja, M.R., Eds.; Springer: Berlin, Germany, 2016; pp. 87–110. [Google Scholar]
  5. Nic-Can, G.; De la Peña, C. Epigenetic advances on somatic embryogenesis of agronomical and important crops. In Epigenetics in Plants of Agronomic Importance: Fundamentals and Applications, 6th ed.; Alvarez-Venegas, R., Ed.; Springer International Publishing: Berlin, Germany, 2014; pp. 91–109. [Google Scholar]
  6. Vogel, G. How does a single somatic cell become a whole plant? Science 2005, 309, 86. [Google Scholar] [CrossRef] [PubMed]
  7. Min, L.; Hu, Q.; Li, Y.; Xu, J.; Ma, Y.; Zhu, L.; Yang, X.; Zhang, X. Leafy cotyledon1-casein kinase I-TCP15-phytochrome interacting factor 4 network regulates somatic embryogenesis by regulating auxin homeostasis. Plant Physiol. 2015, 169, 2805–2821. [Google Scholar] [PubMed]
  8. Hu, H.; Xiong, L.; Yang, Y. Rice SERK1 gene positively regulates somatic embryogenesis of cultured cell and host defense response against fungal infection. Planta 2005, 222, 107–117. [Google Scholar] [CrossRef] [PubMed]
  9. Ikeuchi, M.; Iwase, A.; Rymen, B.; Harashima, H.; Shibata, M.; Ohnuma, M.; Breuer, C.; Morao, A.; Lucas, M.; Veylder, L.; et al. PRC2 represses dedifferentiation of mature somatic cells in Arabidopsis. Nat. Plants 2015, 1, 15089–15095. [Google Scholar] [CrossRef] [PubMed]
  10. Rupps, A.; Raschke, J.; Rümmler, M.; Linke, B.; Zoglauer, K. Identification of putative homologs of Larix decidua to baby boom (BBM), leafy cotyledon1 (LEC1), wuschel-related homeobox2 (WOX2) and somatic embryogenesis receptor-like kinase (SERK) during somatic embryogenesis. Planta 2016, 243, 473–488. [Google Scholar] [CrossRef]
  11. Zhai, L.; Xu, L.; Wang, Y.; Zhu, X.; Feng, H.; Li, C.; Luo, X.; Everlyne, M.; Liu, L. Transcriptional identification and characterization of differentially expressed genes associated with embryogenesis in radish (Raphanus sativus L.). Sci. Rep. 2016, 6, 21652–21664. [Google Scholar] [CrossRef]
  12. Kumar, V.; Van Staden, J. New insights into plant somatic embryogenesis: An epigenetic view. Acta Physiol. Plant 2017, 39, 194–211. [Google Scholar] [CrossRef]
  13. Lin, Y.; Lai, Z.; Tian, Q.; Lin, L.; Lai, R.; Yang, M.; Zhang, D.; Chen, Y.; Zhang, Z. Endogenous target mimics down-regulate miR160 mediation of ARF10, -16, and -17 cleavage during somatic embryogenesis in Dimocarpus longan Lour. Front. Plant Sci. 2015, 6, 956–971. [Google Scholar] [CrossRef]
  14. Su, Y.; Liu, Y.; Zhou, C.; Li, X.; Zhang, X. The microRNA167 controls somatic embryogenesis in Arabidopsis through regulating its target genes ARF6 and ARF8. Plant Cell Tiss. Org. Cult. 2016, 124, 405–417. [Google Scholar] [CrossRef]
  15. Harada, J. Role of Arabidopsis LEAFY COTYLEDON genes in seed development. J. Plant Physiol. 2001, 158, 405–409. [Google Scholar] [CrossRef]
  16. Su, Y.H.; Zhang, X.S. Auxin gradients trigger de novo formation of stem cells during somatic embryogenesis. Plant Signal. Behav. 2009, 4, 574–576. [Google Scholar] [CrossRef] [Green Version]
  17. Chen, S.K.; Kurdyukov, S.; Kereszt, A.; Wang, X.D.; Gresshoff, P.M.; Rose, R.J. The association of homeobox gene expression with stem cell formation and morphogenesis in cultured Medicago truncatula. Planta 2009, 230, 827–840. [Google Scholar] [CrossRef]
  18. Elhiti, M.; Tahir, M.; Gulden, R.H.; Khamiss, K.; Stasolla, C. Modulation of embryo-forming capacity in culture through the expression of Brassica genes involved in the regulation of the shoot apical meristem. J. Exp. Bot. 2010, 61, 4069–4085. [Google Scholar] [CrossRef]
  19. Kulinska-Lukaszek, K.; Tobojka, M.; Adamiok, A.; Kurczynska, E. Expression of the BBM gene during somatic embryogenesis of Arabidopsis thaliana. Biol. Plant. 2012, 56, 389–394. [Google Scholar] [CrossRef]
  20. Florez, S.; Erwin, R.; Maximova, S.; Guiltinan, M.; Curtis, W. Enhanced somatic embryogenesis in Theobroma cacao using the homologous BABY BOOM transcription factor. BMC Plant Biol. 2015, 15, 121–132. [Google Scholar] [CrossRef]
  21. Ahmadi, B.; Shariatpanahi, M.E.; Teixeira da Silva, J.A. Efficient induction of microspore embryogenesis using abscisic acid, jasmonic acid and salicylic acid in Brassica napus L. Plant Cell Tiss. Org. Cult. 2014, 116, 343–351. [Google Scholar] [CrossRef]
  22. Pérez-Jiménez, M.; Cantero-Navarro, E.; Acosta, M.; Cos-Terrer, J. Relationships between endogenous hormonal content and direct somatic embryogenesis in Prunus persica L. Batsch cotyledons. Plant Growth Regul. 2013, 71, 219–224. [Google Scholar] [CrossRef]
  23. Pérez-Jiménez, M.; Cantero-Navarro, E.; Pérez-Alfocea, F.; Le-Disquet, I.; Guivarc’hc, A.; Cos-Terrera, J. Relationship between endogenous hormonal content and somatic organogenesis in callus of peach (Prunus persica L. Batsch) cultivars and Prunus persica × Prunus dulcis rootstocks. J. Plant Physiol. 2014, 171, 619–624. [Google Scholar] [CrossRef]
  24. Nieves, N.; Martínez, M.E.; Castillo, R.; Blanco, M.A.; González-Olmedo, J.L. Effect of abscissic acid and jasmonic acid on partial desiccation of encapsulated somatic embryos of sugarcane. Plant Cell Tiss. Org. Cult. 2001, 65, 15–21. [Google Scholar] [CrossRef]
  25. Mira, M.M.; Wally, O.S.D.; Elhiti, M.; El-Shanshory, A.; Reddy, D.S.; Hill, R.D.; Stasolla, C. Jasmonic acid is a downstream component in the modulation of somatic embryogenesis by Arabidopsis Class 2 phytoglobin. J. Exp. Bot. 2016, 67, 2231–2246. [Google Scholar] [CrossRef] [PubMed]
  26. Ma, J.; He, Y.H.; Hu, Z.Y.; Kanakala, S.; Xu, W.T.; Xia, J.X.; Guo, C.H.; Lin, S.Q.; Chen, C.J.; Wu, C.H.; et al. Histological analysis of somatic embryogenesis in pineapple: AcSERK1 and its expression validation under stress conditions. J. Plant Biochem. Biot. 2016, 25, 49–55. [Google Scholar] [CrossRef]
  27. Ruduś, I.; Weiler, E.W.; Kępczyńska, E. Do stress-related phytohormones, abscisic acid and jasmonic acid play a role in the regulation of Medicago sativa L. somatic embryogenesis? Plant Growth Regul. 2009, 59, 159–169. [Google Scholar] [CrossRef]
  28. Hu, L.; Yang, X.; Yuan, D.; Zeng, F.; Zhang, X. GhHmgB3 deficiency deregulates proliferation and differentiation of cells during somatic embryogenesis in cotton. Plant Biotechnol. J. 2011, 9, 1038–1048. [Google Scholar] [CrossRef]
  29. Poon, S.; Heath, R.; Clarke, A. A chimeric arabinogalactan protein promotes somatic embryogenesis in cotton cell culture. Plant Physiol. 2012, 160, 684–695. [Google Scholar] [CrossRef]
  30. Yang, X.; Wang, L.; Yuan, D.; Lindsey, K.; Zhang, X. Small RNA and degradome sequencing reveal complex miRNA regulation during cotton somatic embryogenesis. J. Exp. Bot. 2013, 64, 1521–1536. [Google Scholar] [CrossRef] [Green Version]
  31. Jin, F.; Hu, L.; Yuan, D.; Xu, J.; Gao, W.; He, L.; Yang, X.; Zhang, X. Comparative transcriptome analysis between somatic embryos (SEs) and zygotic embryos in cotton: Evidence for stress response functions in SE development. Plant Biotechnol. J. 2014, 12, 161–173. [Google Scholar] [CrossRef]
  32. Pandey, D.K.; Chaudhary, B. Oxidative stress responsive SERK1 gene directs the progression of somatic embryogenesis in cotton (Gossypium hirsutum L. cv. Coker 310). Am. J. Plant Sci. 2014, 5, 80–102. [Google Scholar] [CrossRef]
  33. Karami, O.; Saidi, A. The molecular basis for stress-induced acquisition of somatic embryogenesis. Mol. Biol. Rep. 2010, 37, 2493–2507. [Google Scholar] [CrossRef]
  34. Fehér, A. Somatic embryogenesis-Stress-induced remodeling of plant cell fate. BBA-Gene Regul. Mech. 2015, 1849, 385–402. [Google Scholar] [CrossRef]
  35. Ma, J.; He, Y.; Hu, Z.; Xu, W.T.; Xia, J.X.; Guo, C.H.; Lin, S.Q.; Cao, L.; Chen, C.J.; Wu, C.H.; et al. Characterization and expression analysis of AcSERK2, a somatic embryogenesis and stress resistance related gene in pineapple. Gene 2012, 500, 115–123. [Google Scholar] [CrossRef]
  36. Cabrera-Ponce, J.L.; López, L.; León-Ramírez, C.G.; Jofre-Garfias, A.E.; Verver-y-Vargas, A. Stress induced acquisition of somatic embryogenesis in common bean Phaseolus vulgaris L. Protoplasma 2014, 252, 559–570. [Google Scholar] [CrossRef]
  37. Salo, H.M.; Sarjala, T.; Jokela, A.; Häggman, H.; Vuosku, J. Moderate stress responses and specific changes in polyamine metabolism characterize Scots pine somatic embryogenesis. Tree Physiol. 2016, 36, 392–402. [Google Scholar] [CrossRef] [Green Version]
  38. Yang, X.; Zhang, X.; Yuan, D.; Jin, F.; Zhang, Y.; Xu, J. Transcript profiling reveals complex auxin signalling pathway and transcription regulation involved in dedifferentiation and redifferentiation during somatic embryogenesis in cotton. BMC Plant Biol. 2012, 12, 110–128. [Google Scholar] [CrossRef]
  39. Xu, Z.; Zhang, C.; Zhang, X.; Liu, C.; Wu, Z.; Yang, Z.; Zhou, K.; Yang, X.; Li, F. Transcriptome profiling reveals auxin and cytokinin regulating somatic embryogenesis in different sister lines of cotton cultivar CCRI24. J. Integr. Plant Biol. 2013, 55, 631–642. [Google Scholar] [CrossRef]
  40. Dixon, R.A.; Strack, D. Phytochemistry meets genome analysis, and beyond. Phytochemistry 2003, 62, 815–816. [Google Scholar] [CrossRef]
  41. Fiehn, O. Metabolomics-the link between genotypes and phenotypes. Plant Mol. Biol. 2002, 48, 155–171. [Google Scholar] [CrossRef]
  42. Panopoulos, A.D.; Yanes, O.; Ruiz, S.; Kida, Y.S.; Diep, D.; Tautenhahn, R.; Herrerías, A.; Batchelder, E.M.; Plongthongkum, N.; Lutz, M.; et al. The metabolome of induced pluripotent stem cells reveals metabolic changes occurring in somatic cell reprogramming. Cell Res. 2012, 22, 168–177. [Google Scholar] [CrossRef]
  43. Fiehn, O.; Kopka, J.; Dörmann, P.; Altmann, T.; Trethewey, R.N.; Willmitzer, L. Metabolite profiling for plant functional genomics. Nat. Biotechnol. 2000, 18, 1157–1161. [Google Scholar] [CrossRef]
  44. Sumner, L.W.; Mendes, P.; Dixon, R.A. Plant metabolomics: Large-scale phytochemistry in the functional genomics era. Phytochemistry 2003, 62, 817–836. [Google Scholar] [CrossRef]
  45. Weckwerth, W. Metabolomics in systems biology. Annu. Rev. Plant Biol. 2003, 54, 669–689. [Google Scholar] [CrossRef]
  46. Liu, Q.; Wang, X.; Tzin, V.; Romeis, J.; Peng, Y.; Li, Y. Combined transcriptome and metabolome analyses to understand the dynamic responses of rice plants to attack by the rice stem borer Chilo suppressalis (Lepidoptera: Crambidae). BMC Plant Biol. 2016, 16, 259–275. [Google Scholar] [CrossRef]
  47. Taylor, J.; King, R.D.; Altmann, T.; Fiehn, O. Application of metabolomics to plant genotype discrimination using statistics and machine learning. Bioinformatics 2002, 18, 241–248. [Google Scholar] [CrossRef]
  48. Robinson, A.R.; Dauwe, R.; Ukrainetz, N.K.; Cullis, I.F.; White, R.; Mansfield, S.D. Predicting the regenerative capacity of conifer somatic embryogenic cultures by metabolomics. Plant Biotechnol. J. 2009, 7, 952–963. [Google Scholar] [CrossRef] [Green Version]
  49. Dowlatabadi, R.; Weljie, A.M.; Thorpe, T.A.; Yeung, E.C.; Vogel, H.J. Metabolic footprinting study of white spruce somatic embryogenesis using NMR spectroscopy. Plant Physiol. Biochem. 2009, 47, 343–350. [Google Scholar] [CrossRef]
  50. Palama, T.L.; Menard, P.; Fock, I.; Choi, Y.H.; Bourdon, E.; Govinden-Soulange, J.; Bahut, M.; Payet, B.; Verpoorte, R.; Kodja, H. Shoot differentiation from protocorm callus cultures of Vanilla planifolia (Orchidaceae): Proteomic and metabolic responses at early stage. BMC Plant Biol. 2010, 10, 82–99. [Google Scholar] [CrossRef]
  51. Businge, E.; Brackmann, K.; Moritz, T.; Egertsdotter, U. Metabolite profiling reveals clear metabolic changes during somatic embryo development of Norway spruce (Picea abies). Tree Physiol. 2012, 32, 232–244. [Google Scholar] [CrossRef]
  52. Mahmud, I.; Thapaliya, M.; Boroujerdi, A.; Chowdhury, K. NMR-based metabolomics study of the biochemical relationship between sugarcane callus tissues and their respective nutrient culture media. Anal. Bioanal. Chem. 2014, 406, 5997–6005. [Google Scholar] [CrossRef] [Green Version]
  53. Guo, H.; Wu, J.; Chen, C.; Wang, H.; Zhao, Y.; Zhang, C.; Jia, Y.; Liu, F.; Ning, T.; Chu, Z.; et al. Identification and characterization of cell cultures with various embryogenic/regenerative potential in cotton based on morphological, cytochemical, and cytogenetical assessment. J. Integr. Agr. 2019, 18, 1–8. [Google Scholar] [CrossRef]
  54. Zheng, Q.; Zheng, Y.; Perry, S. AGAMOUS-Like15 promotes somatic embryogenesis in Arabidopsis and Soybean in part by the control of ethylene biosynthesis and response. Plant Physiol. 2013, 161, 2113–2127. [Google Scholar] [CrossRef]
  55. Mathieu, M.; Lelu-Walter, M.A.; Blervacq, A.S.; David, H.; Hawkins, S.; Neutelings, G. Germin-like genes are expressed during somatic embryogenesis and early development of conifers. Plant Mol. Biol. 2006, 61, 615–627. [Google Scholar] [CrossRef]
  56. Schlögl, P.; Santos, A.; Vieira, L.; Floh, E.; Guerra, M. Gene expression during early somatic embryogenesis in Brazilian pine (Araucaria angustifolia (Bert) O. Ktze). Plant Cell Tiss. Org. Cult. 2012, 108, 173–180. [Google Scholar] [CrossRef]
  57. Guo, H.; Guo, H.; Zhang, L.; Fan, Y.; Fan, Y.; Zeng, F. SELTP assembled battery drives totipotency of somatic plant cell. Plant Biotechnol. J. 2019. [Google Scholar] [CrossRef]
  58. Aida, M.; Ishida, T.; Tasaka, M. Shoot apical meristem and cotyledon formation during Arabidopsis embryogenesis: Interaction among the cup-shaped cotyledon and shoot meristemless genes. Development 1999, 126, 1563–1570. [Google Scholar]
  59. Di Laurenzio, L.; Wysocka-Diller, J.; Malamy, J.E.; Pysh, L.; Helariutta, Y.; Freshour, G.; Hahn, M.G.; Feldmann, K.A.; Benfey, F.N. The scarecrow gene regulates an asymmetric cell division that is essential for generating the radial organization of the Arabidopsis root. Cell 1996, 8, 423–433. [Google Scholar] [CrossRef]
  60. Domżalska, L.; Kędracka-Krok, S.; Jankowska, U.; Grzyb, M.; Sobczak, M.; Rybczyński, J.J.; Mikuła, A. Proteomic analysis of stipe explants reveals differentially expressed proteins involved in early direct somatic embryogenesis of the tree fern Cyathea delgadii Sternb. Plant Sci. 2017, 258, 61–76. [Google Scholar] [CrossRef]
  61. Tao, L.; Zhao, Y.; Wu, Y.; Wang, Q.; Yuan, H.; Zhao, L.; Guo, W.; You, X. Transcriptome profiling and digital gene expression by deep sequencing in early somatic embryogenesis of endangered medicinal Eleutherococcus senticosus Maxim. Gene 2016, 578, 17–24. [Google Scholar] [CrossRef]
  62. Cheng, W.H.; Zhu, H.G.; Tian, W.G.; Zhu, S.H.; Xiong, X.P.; Sun, Y.Q.; Zhu, Q.H.; Sun, J. De novo transcriptome analysis reveals insights into dynamic homeostasis regulation of somatic embryogenesis in upland cotton (G. hirsutum L.). Plant Mol. Biol. 2016, 92, 279–292. [Google Scholar] [CrossRef]
  63. Hutchinson, M.J.; Saxena, P.K. Role of purine metabolism in thidiazuron-induced somatic embryogenesis of geranium (Pelargonium× hortorum) hypocotyl cultures. Physiol. Plant. 1996, 98, 517–522. [Google Scholar] [CrossRef]
  64. Moriguchi, T.; Kita, M.; Tomono, Y.; EndoInagaki, T.; Omura, M. One type of chalcone synthase gene expressed during embryogenesis regulates the flavonoid accumulation in citrus cell cultures. Plant Cell Physiol. 1999, 40, 651–655. [Google Scholar] [CrossRef]
  65. Maximova, S.N.; Florez, S.; Shen, X.; Niemenak, N.; Zhang, Y.; Curtis, W.; Guiltinan, M.J. Genome-wide analysis reveals divergent patterns of gene expression during zygotic and somatic embryo maturation of Theobroma cacao L., the chocolate tree. BMC Plant Biol. 2014, 14, 185–201. [Google Scholar] [CrossRef] [PubMed]
  66. Wang, L.; Liu, N.; Wang, T.; Li, J.; Wen, T.; Yang, X.; Lindsey, K.; Zhang, X. The GhmiR157a-GhSPL10 regulatory module controls initial cellular dedifferentiation and callus proliferation in cotton by modulating ethylene-mediated flavonoid biosynthesis. J. Exp. Bot. 2017, 69, 1081–1093. [Google Scholar] [CrossRef] [PubMed]
  67. Khan, M.A.; Abbasi, B.H.; Ali, H.; Ali, M. Temporal variations in metabolite profiles at different growth phases during somatic embryogenesis of Silybum marianum L. Plant Cell Tiss. Org. Cult. 2015, 120, 127–139. [Google Scholar] [CrossRef]
  68. Chen, W.; Gong, L.; Guo, Z.; Wang, W.; Zhang, H.; Liu, X.; Yu, S.; Xiong, L.; Luo, J. A novel integrated method for large-scale detection, identification, and quantification of widely targeted metabolites: Application in the study of rice metabolomics. Mol. Plant. 2013, 6, 1769–1780. [Google Scholar] [CrossRef] [PubMed]
  69. Fraga, C.G.; Clowers, B.H.; Moore, R.J.; Zink, E.M. Signature-discovery approach for sample matching of a nerve-agent precursor using liquid chromatography-mass spectrometry, XCMS, and chemometrics. Anal. Chem. 2010, 82, 4165–4173. [Google Scholar] [CrossRef] [PubMed]
  70. Chen, Y.; Zhang, R.; Song, Y.; He, J.; Sun, J.; Bai, J.; An, Z.; Dong, L.; Zhan, Q.; Abliz, Z. RRLC-MS/MS-based metabonomics combined with in-depth analysis of metabolic correlation network: Finding potential biomarkers for breast cancer. Analyst 2009, 134, 2003–2011. [Google Scholar] [CrossRef] [PubMed]
  71. Thévenot, E.A.; Roux, A.; Xu, Y.; Ezan, E.; Junot, C. Analysis of the human adult urinary metabolome variations with age, body mass index, and gender by implementing a comprehensive workflow for univariate and OPLS statistical analyses. J. Proteome Res. 2015, 14, 3322–3335. [Google Scholar] [CrossRef]
  72. Kanehisa, M.; Goto, S. KEGG: Kyoto encyclopedia of genes and genomes. Nucleic Acids Res. 2000, 28, 27–30. [Google Scholar] [CrossRef] [PubMed]
Figure 1. Cultures derived from different developmental stages of cotton somatic embryogenesis (SE) for the purposes of the metabolome and transcriptome assays. (a) Nonembryogenic staged calli (NEC); (b) primary embryogenic calli (PEC); (c) initiation staged embryos with globular-like enriched (GE). Bars = 1 mm.
Ijms 20 02070 g001
Figure 2. Overlapping analysis of the total ion current (TIC) in different quality control (QC) samples. The abscissa represents the retention time (min) of metabolite detection, and the ordinate represents the intensity of the ion current (cps: count per second).
Ijms 20 02070 g002
Figure 3. Overall qualitative and quantitative analysis of the metabolomics data. (a) Pearson’s correlation coefficients among the three samples (NEC, PEC, and GE) and quality control samples (mix); (b) PCA analysis of the three samples (NEC, blue; PEC, purple; GE, red) and quality control samples (mix, green); the x-axis represents the first principal component and the y-axis represents the second principal component. (c) Component analysis of the identified metabolites. The top five metabolites are shown beside the graph. NEC, nonembryogenic staged calli; PEC, primary embryogenic calli; GE, initiation staged embryos with globular-like enriched.
Ijms 20 02070 g003
Figure 4. Differentially accumulated metabolites (DAMs) among NEC, PEC, and GE. (a) Volcano plot showing the differential metabolites in PEC vs. NEC; (b) volcano plot showing the differential metabolites in GE vs. PEC; (c) volcano plot showing the differential metabolites in GE vs. NEC. The red spots represent upregulated DAMs, the green dots represent downregulated DAMs, and the black dots represent nondifferentially accumulated metabolites; (d) Heat map representing the hierarchical cluster analysis in PEC vs. NEC; (e) heat map representing the hierarchical cluster analysis in GE vs. PEC; (f) heat map representing the hierarchical cluster analysis in GE vs. NEC. Red indicates high abundance, whereas the relatively low-abundance metabolites are shown in green; (g) component analysis of DAMs in PEC vs. NEC; (h) component analysis of DAMs in GE vs. PEC; (i) component analysis of DAMs in GE vs. NEC. The top five DAMs are noted beside each graph. NEC, nonembryogenic staged calli; PEC, primary embryogenic calli; GE, initiation staged embryos with globular-like enriched.
Ijms 20 02070 g004aIjms 20 02070 g004b
Figure 5. Differential metabolites commonly and specifically accumulated in PEC vs. NEC, GE vs. PEC, and GE vs. NEC. (a) Venn diagrams showing the distribution of DAMs in PEC vs. NEC, GE vs. PEC, and GE vs. NEC; (b) component analysis of DAMs accumulated specifically in PEC vs. NEC; (c) component analysis of DAMs accumulated specifically in GE vs. PEC. The top five specific DAMs are noted beside each graph. DAMs, differentially accumulated metabolites; NEC, nonembryogenic staged calli; PEC, primary embryogenic calli; GE, initiation staged embryos with globular-like enriched.
Ijms 20 02070 g005
Figure 6. KEGG pathway enrichment analysis of DAMs. (a) Pathway enrichment in PEC vs. NEC; (b) pathway enrichment in GE vs. PEC; (c) pathway enrichment in GE vs. NEC. The x-axis represents the enrichment factor, while the y-axis represents the enrichment pathway. The dot sizes represent the number of differentially enriched metabolites. The statistical analysis of the pathway enrichment was performed using Fisher’s exact test. DAMs, differentially accumulated metabolites; NEC, nonembryogenic staged calli; PEC, primary embryogenic calli; GE, initiation staged embryos with globular-like enriched.
Ijms 20 02070 g006aIjms 20 02070 g006b
Figure 7. Quadrant diagrams representing association of metabolomic and transcriptomic variation during SE in cotton. (a) Overview of metabolomic and transcriptomic variation in PEC vs. NEC; (b) overview of metabolomic and transcriptomic variation in GE vs. PEC. The x-axis represents the fold changes in the transcriptome data; the y-axis represents the fold changes in the metabolome data. The black dotted lines represent the differential thresholds. Outside of the threshold lines, there were significant differences in the genes/metabolites, and within the threshold lines are shown the unchanged genes/metabolites. Each point represents a gene/metabolite. Black dots represent the unchanged genes/metabolites; green dots represent differentially accumulated metabolites with unchanged genes; red dots represent differentially expressed genes with unchanged metabolites; blue dots represent both differentially expressed genes and differentially accumulated metabolites. NEC, nonembryogenic staged calli; PEC, primary embryogenic calli; GE, initiation staged embryos with globular-like enriched.
Ijms 20 02070 g007
Figure 8. Transcript-metabolite correlation network representing DAMs and DEGs involved in PEC vs. NEC and GE vs. PEC. (a) Pearson correlation network representing factors associated with purine metabolism in PEC vs. NEC; (b) Pearson correlation network representing factors associated with flavonoid biosynthesis in GE vs. PEC. The gene-metabolite pairs were connected within the network by edges. Blue nodes represent genes and red nodes represent metabolites. Red edges represent positive correlations, and green edges represent negative correlations. DAMs, differentially accumulated metabolites; DEGs, differentially expressed genes; NEC, nonembryogenic staged calli; PEC, primary embryogenic calli; GE, initiation staged embryos with globular-like enriched.
Ijms 20 02070 g008aIjms 20 02070 g008b
Table 1. Summary of differentially accumulated metabolites (DAMs) among NEC, PEC, and GE.
Group NameNumber of Differential MetabolitesNumber UpregulatedNumber Downregulated
PEC vs. NEC15612432
GE vs. PEC1398653
GE vs. NEC15912831
NEC, nonembryogenic staged calli; PEC, primary embryogenic calli; GE, initiation staged embryos with globular-like enriched.
Table 2. DAMs involved in purine metabolism during embryogenic differentiation (PEC vs. NEC).
IndexCompoundClassFold ChangeLog2 (FC)Type
pmb0981Adenosine 5′-monophosphateNucleotide and its derivates3.92 × 10415.3up
pmb2684Cyclic AMPNucleotide and its derivates4.79 × 10415.5up
pmb2948Adenosine 3′-monophosphateNucleotide and its derivates2.54 × 10311.3up
pmb4344Guanosine 5′-monophosphateNucleotide and its derivates2.19 × 10414.4up
pmc00662′-Deoxyinosine-5′-monophosphateNucleotide and its derivates1.29 × 10413.7up
pmd0023AdenosineNucleotide and its derivates1.36 × 1027.08up
pme1175GuanosineNucleotide and its derivates93.16.54up
pme1181DeoxyguanosineNucleotide and its derivates17.14.10up
pme1296XanthosineNucleotide and its derivates1.37 × 1027.10up
pme3835Guanosine 3′,5′-cyclic monophosphateNucleotide and its derivates1.64 × 10414.0up
pme3960DeoxyadenosineNucleotide and its derivates7.32 × 10416.2up
DAMs, differentially accumulated metabolites; NEC, nonembryogenic staged calli; PEC, primary embryogenic calli.
Table 3. DAMs involved in flavonoid biosynthesis during somatic embryo development (GE vs. PEC).
IndexCompoundClassFold ChangeLog2 (FC)Type
pme1580EriodictyolFlavanone4.172.06up
pme2319HesperetinFlavanone2.431.28up
pmb0605Apigenin 7-O-glucoside (Cosmosiin)Flavone0.145−2.79down
pme0088LuteolinFlavone3.561.83up
pme2459Luteolin 7-O-glucoside (Cynaroside)Flavone3.301.72up
pme3300TricetinFlavone2.601.38up
pme0199QuercetinFlavonol56.95.83up
pme0200KaempferolFlavonol4.09 × 10312.0up
pme0202Quercetin 3-O-rutinoside (Rutin)Flavonol15.93.99up
pme1478MyricetinFlavonol44.25.46up
pme1521Dihydroquercetin (Taxifolin)Flavonol4.602.20up
pme2898DihydromyricetinFlavonol2.92 × 10−6−18.4down
pme3212Quercetin 3-O-glucoside (Isotrifoliin)Flavonol6.632.73up
pme3268Kaempferol 3-O-galactoside (Trifolin)Flavonol6.262.65up
DAMs, differentially accumulated metabolites; PEC, primary embryogenic calli; GE, initiation staged embryos with globular-like enriched.
Table 4. Significant representative differentially expressed genes (DEGs) involved in purine metabolism during embryogenic differentiation (PEC vs. NEC).
Gene IDGene NameDescriptionLog2 (FC)Meta IDLog2 (FC)PCC
Gh_D05G1280PERK13Proline-rich receptor-like protein kinase 3.61pme11756.541
pme12967.101
Gh_D10G1867IRKLRR receptor-like protein kinase3.52pmb098115.261
pmb294811.311
pmc006613.651
Gh_A03G1831CAOSignal recognition protein1.99pme11756.541
pme12967.101
Gh_A07G2239ABI3B3 transcription factor5.70pmb098115.261
pmb294811.311
pmc006613.651
Gh_A08G2488WRKY2WRKY transcription factor 21.77pmb098115.261
pmb294811.311
pmc006613.651
Gh_A11G2618NFYC2Nuclear transcription factor3.07pmb098115.261
pmb294811.311
pmc006613.651
Gh_D04G0086NFYA3Nuclear transcription factor2.29pmb098115.261
pmb294811.311
pmc006613.651
Gh_A06G1368SERP2Stress-associated protein4.36pme11756.541
4.36pme12967.101
Gh_D04G1347ARR4Two-component response regulator2.55pme11756.541
pme12967.101
Gh_D12G2180AIR1Putative lipid-binding protein3.55pme11756.541
3.55pme12967.101
Gh_D12G1336HMGB7High mobility group B protein3.75pmb098115.261
3.75pmb294811.311
3.75pmc006613.651
Gh_D11G0232HMGB13High mobility group B protein5.55pme11756.541
5.55pme12967.101
Gh_A06G0239IAA9Auxin-responsive protein3.87pmb294811.311
Gh_D09G0145GASA4Gibberellin-regulated protein6.53pmb098115.261
pmb294811.311
pmc006613.651
Gh_A10G0472B34Histone H3.23.80pmb098115.261
3.80pmb294811.311
Gh_A13G1866B34Histone H3.23.46pmb294811.311
Gh_D08G1979HIS2AHistone H2AX4.15pmb098115.261
Gh_D08G0034HIS2AHistone H2A3.15pmb294811.311
NEC, nonembryogenic staged calli; PEC, primary embryogenic calli.
Table 5. Classic gene-metabolite pairs involved in purine metabolism during embryogenic differentiation (PEC vs. NEC).
Gene IDGene NameDescriptionLog2 (FC)Meta IDLog2 (FC)PCC
Gh_A08G2008BBMBaby boom6.54pmc006613.65−1
pmd00237.08−1
pmb294811.31−1
pmb098115.26−1
pme396016.20 −1
pme11814.10 −1
pme11756.54−1
pme383514.00 −1
pme12967.10 −1
Gh_D06G1184SERK1Somatic embryogenesis receptor kinase1.25pmc006613.651
pmd00237.081
pmb294811.311
pmb098115.261
pmb268415.50 1
pme396016.20 1
pme11814.10 1
pme11756.541
pme383514.00 1
pme12967.10 1
Gh_D13G1387LEC1Leafy cotyledon6.44pmc006613.651
pmd00237.081
pmb294811.311
pmb098115.261
pme396016.20 1
pme383514.00 1
Gh_D07G0476ARF2Auxin response factor 21.89pmc006613.651
pmd00237.081
pmb294811.311
pmb098115.261
pme396016.20 1
pme11814.10 1
pme383514.00 1
Gh_A12G0910AGL15Agamous-like 156.47pmc006613.65−1
pmd00237.08−1
pmb294811.31−1
pmb098115.26−1
pme396016.20 −1
pme11814.10 −1
pme11756.54−1
pme383514.00 −1
pme12967.10 −1
Gh_D07G0323AGP1Arabinogalactan protein15.93pmc006613.651
pmd00237.081
pmb294811.311
pmb098115.261
pmb268415.50 1
pme396016.20 1
pme11814.10 1
pme383514.00 1
Gh_A12G1076GLP2Germin-like protein 2−1.13pmb268415.50 −1
pme11814.10 −1
Gh_A09G1557AGO1Argonaute 11.19pmc006613.651
pmd00237.081
pmb294811.311
pmb098115.261
pmb268415.50 1
pme396016.20 1
pme11814.10 1
pme383514.00 1
Gh_D05G1937AMY1Alpha-amylase 1−4.34pmc006613.65−1
pmd00237.08−1
pmb294811.31−1
pmb098115.26−1
pmb268415.50 −1
pme396016.20 −1
pme11814.10 −1
pme383514.00 −1
Gh_A12G0504LTP2Lipid transfer protein 23.58pmc006613.651
pmd00237.081
pmb294811.311
pmb098115.261
pmb268415.50 1
pme396016.20 1
pme11814.10 1
pme383514.00 1
pmb434414.40 1
Gh_D12G0517LTP2-likeLipid transfer protein 2-like3.03pmc006613.651
pmb098115.261
pme396016.20 1
pme11814.10 1
pmb434414.40 1
NEC, nonembryogenic staged calli; PEC, primary embryogenic calli.
Table 6. Classic gene-metabolite pairs involved in flavonoid biosynthesis during somatic embryo development (GE vs. PEC).
Gene IDGene NameDescriptionLog2 (FC)Meta IDLog2 (FC)PCC
Gh_A10G0884WUSWusche l2.12pme32682.65−1
Gh_A02G0853CLV1Clavata 13.00pme2898−18.401
pme020012.00−1
pme32682.65−1
pme24591.72−1
pme02023.99−1
Gh_D01G0448CUC2Cup-shaped cotyledon 22.77pme24591.72−1
pme32122.73−1
Gh_D02G0017SCWScarecrow2.55pme2898−18.40−1
pme020012.001
pme32682.651
pme24591.721
Gh_A12G0710SHRShort-root1.90pmb0605−2.79−1
PEC, primary embryogenic calli; GE, initiation staged embryos with globular-like enriched.

