Photocycle Dynamics of the Archaerhodopsin 3 Based Fluorescent Voltage Sensor QuasAr1

1
Fakultät für Physik, Universität Regensburg, Universitätsstraße 31, D-93053 Regensburg, Germany
2
Experimentelle Biophysik, Institut für Biologie, Humboldt Universität zu Berlin, Invalidenstraße 42, D-10115 Berlin, Germany
*
Author to whom correspondence should be addressed.
Int. J. Mol. Sci. 2020, 21(1), 160; https://0-doi-org.brum.beds.ac.uk/10.3390/ijms21010160
Submission received: 8 November 2019
/
Revised: 18 December 2019
/
Accepted: 19 December 2019
/
Published: 25 December 2019
(This article belongs to the Special Issue Advanced Photochemistry and Photobiology within Confining Chemical and Biological Hosts)
Abstract
:The retinal photocycle dynamics of the fluorescent voltage sensor QuasAr1 (Archaerhodopsin 3 P60S-T80S-D95H-D106H-F161V mutant from Halorubrum sodomense) in pH 8 Tris buffer was studied. The samples were photoexcited to the first absorption band of the protonated retinal Schiff base (PRSB) Ret_580 (absorption maximum at λmax ≈ 580 nm), and the retinal Schiff base photoisomerization and protonation state changes were followed by absorption spectra recordings during light exposure and after light exposure. Ret_580 turned out to be composed of two protonated retinal Schiff base isomers, namely Ret_580I and Ret_580II. Photoexcitation of Ret_580I resulted in barrier-involved isomerization to Ret_540 (quantum yield ≈ 0.056) and subsequent retinal proton release leading to Ret_410 deprotonated retinal Schiff base (RSB). In the dark, Ret_410 partially recovered to Ret_580I and partially stabilized to irreversible Ret_400 due to apoprotein restructuring (Ret_410 lifetime ≈ 2 h). Photoexcitation of Ret_580II resulted in barrier-involved isomerization to Ret_640 (quantum yield ≈ 0.00135) and subsequent deprotonation to Ret_370 (RSB). In the dark, Ret_370 partially recovered to Ret_580II and partially stabilized to irreversible Ret_350 due to apoprotein restructuring (Ret_370 lifetime ≈ 10 h). Photocycle schemes and reaction coordinate diagrams for Ret_580I and Ret_580II were developed and photocyle parameters were determined.
1. Introduction
Tracking membrane potential of cells, especially neurons, using fluorescence methods is of high interest and is an active field of research (change of membrane voltage causes change of fluorescence efficiency) [1,2,3,4,5,6,7,8,9,10]. To determine membrane voltage, a variety of voltage sensitive dyes [11,12,13], genetically encoded calcium indicators (GECI) [4,14,15], and genetically encoded voltage indicators (GEVI) based on voltage sensing domains (VSD, composed of four trans-membrane helices and fused fluorescent proteins) [16,17,18,19,20] and on microbial rhodopsins (composed of seven trans-membrane α-helices with covalently bound retinal, using the intrinsic fluorescence of retinal [9,10,21,22,23] or the modified fluorescence from attached fluorescent proteins [19,23,24] or dyes [12]) are in use. Often, Förster-type resonance energy transfer (FRET) is involved in dye or fluorescent protein connection to VSDs and rhodopins [12,25].
All-optical electrophysiology in neuroscience was achieved by channelrhodopsin based optical perturbation of membrane potentials and the membrane potential readout with fluorescent voltage sensing domains [26,27,28].
Most microbial rhodopsin voltage indicators are based on Archaerhodopsin 3 (Arch) from Halorubrum sodomense [29] and variants thereof obtained by mutations (Arch D95N [29], Arch D95N-D106E [27], Arch D95Q-D106E [30], Archer1 (=Arch D95E-T99C) [31], Archer2 (=Arch D95E-T99C-A225M) [31], QuasAr1 (=Arch P60S-T80S-D95H-D106H-F161V) [26], QuasAr2 (=QuasAr1 H95Q) [26], QuasAr3 (=QuasAr2 K171R) [28], paQuasAr3 (=QuasAr3 V59A) [28], Archon1 (=Arch T20S-G41A-V44E-P60S-T80P-D86N-D95Q-D106H-A136T-F161V-T183I-L197I-G241Q) [32], and Archon2 (=Arch T56P-P60S-T80P-D95H-T99S-T116I-F161V-T183I-L197I-A225C) [32]). The mutations improved the fluorescence intensity dependence on membrane voltage and the membrane localization [26,28,31,32].
Here, a detailed study is presented of the photocycle dynamics of QuasAr1 (“Quality superior to Arch”) in pH 8 Tris buffer to better understand the photoexcitation and relaxation dynamics affecting the behavior of the fluorescent voltage sensor.
The analysis of the photocycle dynamics revealed that Ret_580 was composed of two protonated retinal Schiff base (PRSB) isomers, named Ret_580I and Ret_580II, with different photocycle dynamics (different photoisomerization paths, isomerization yields, deprotonation rates, and protonation recoveries). Schemes of the photocycle were developed according to the experimental results. While the photoisomerization occurred on a ten picoseconds timescale, the protonated retinal Schiff base deprotonation to neutral retinal Schiff base (RSB) in the formed isomeric states occurred on a ten seconds timescale. The reprotonation to the original state was found to be slow, of the order of an hour for the reformation of Ret_580I and of the order of ten hours for the reformation of Ret_580II. The slow reformation of Ret_580I and Ret_580II was competing with thermal apoprotein restructuring leading to RSB stabilization without reprotonation. The thermal dynamics of QuasAr1 was studied in a separate paper (apparent melting temperature determination, thermal activated ground-state protonated retinal Schiff base isomerization, deprotonation, and apoprotein restructuring) [33].
2. Results
The QuasAr1 samples in pH 8 Tris buffer were photoexcited to the first absorption band (protonated retinal Schiff base Ret_580) in the green-yellow-orange spectral range, and the retinal photoisomerization and protonation state changes were followed by absorption spectra recordings during light exposure and after light exposure. The temporal absorption coefficient development at fixed wavelengths was measured with high time resolution. Additionally, excitation wavelength dependent fluorescence emission quantum distributions were measured immediately after excitation light switch-off and after sample recovery in the dark (results presented in the Supplementary Materials). Emission wavelength dependent fluorescence excitation quantum distributions were also determined after sample recovery (results are shown in the Supplementary Materials).
2.1. Absorption Spectroscopic Photocycle Studies
QuasAr1 samples were excited with light emitting diodes LED 590 nm (excitation near absorption maximum of Ret_580) and LED 530 nm (excitation near absorption maximum of protonated retinal Schiff base photoisomer Ret_540 of Ret_580I) as well as with a HeNe laser at 632.8 nm (excitation near absorption maximum of protonated retinal Schiff base photoisomer Ret_640 of Ret_580II). For the excitation with LED 590 nm, photocycle studies with three different excitation intensities were carried out to study the dependence of the photocycle dynamics on the excitation intensity. The excitations with LED530 nm and a HeNe laser were carried out to study the influence of the excitation wavelength within the broad S0–S1 absorption band of the Ret_580 chromophores and of the formed photoisomer excitations on the photocycle dynamics.
The results of the photocycle studies with LED 590 nm at high excitation intensity are presented below (Figure 1, Figure 2, Figure 3 and Figure 4), while the results of the photocycle studies with LED 590 nm at medium intensity (Figures S1–S3) and at low intensity (Figures S4 and S5) as well as the results of the photocycle studies with LED 530 nm (Figures S6–S9) and with the HeNe laser (Figures S10–S13) are presented in the Supplementary Materials.
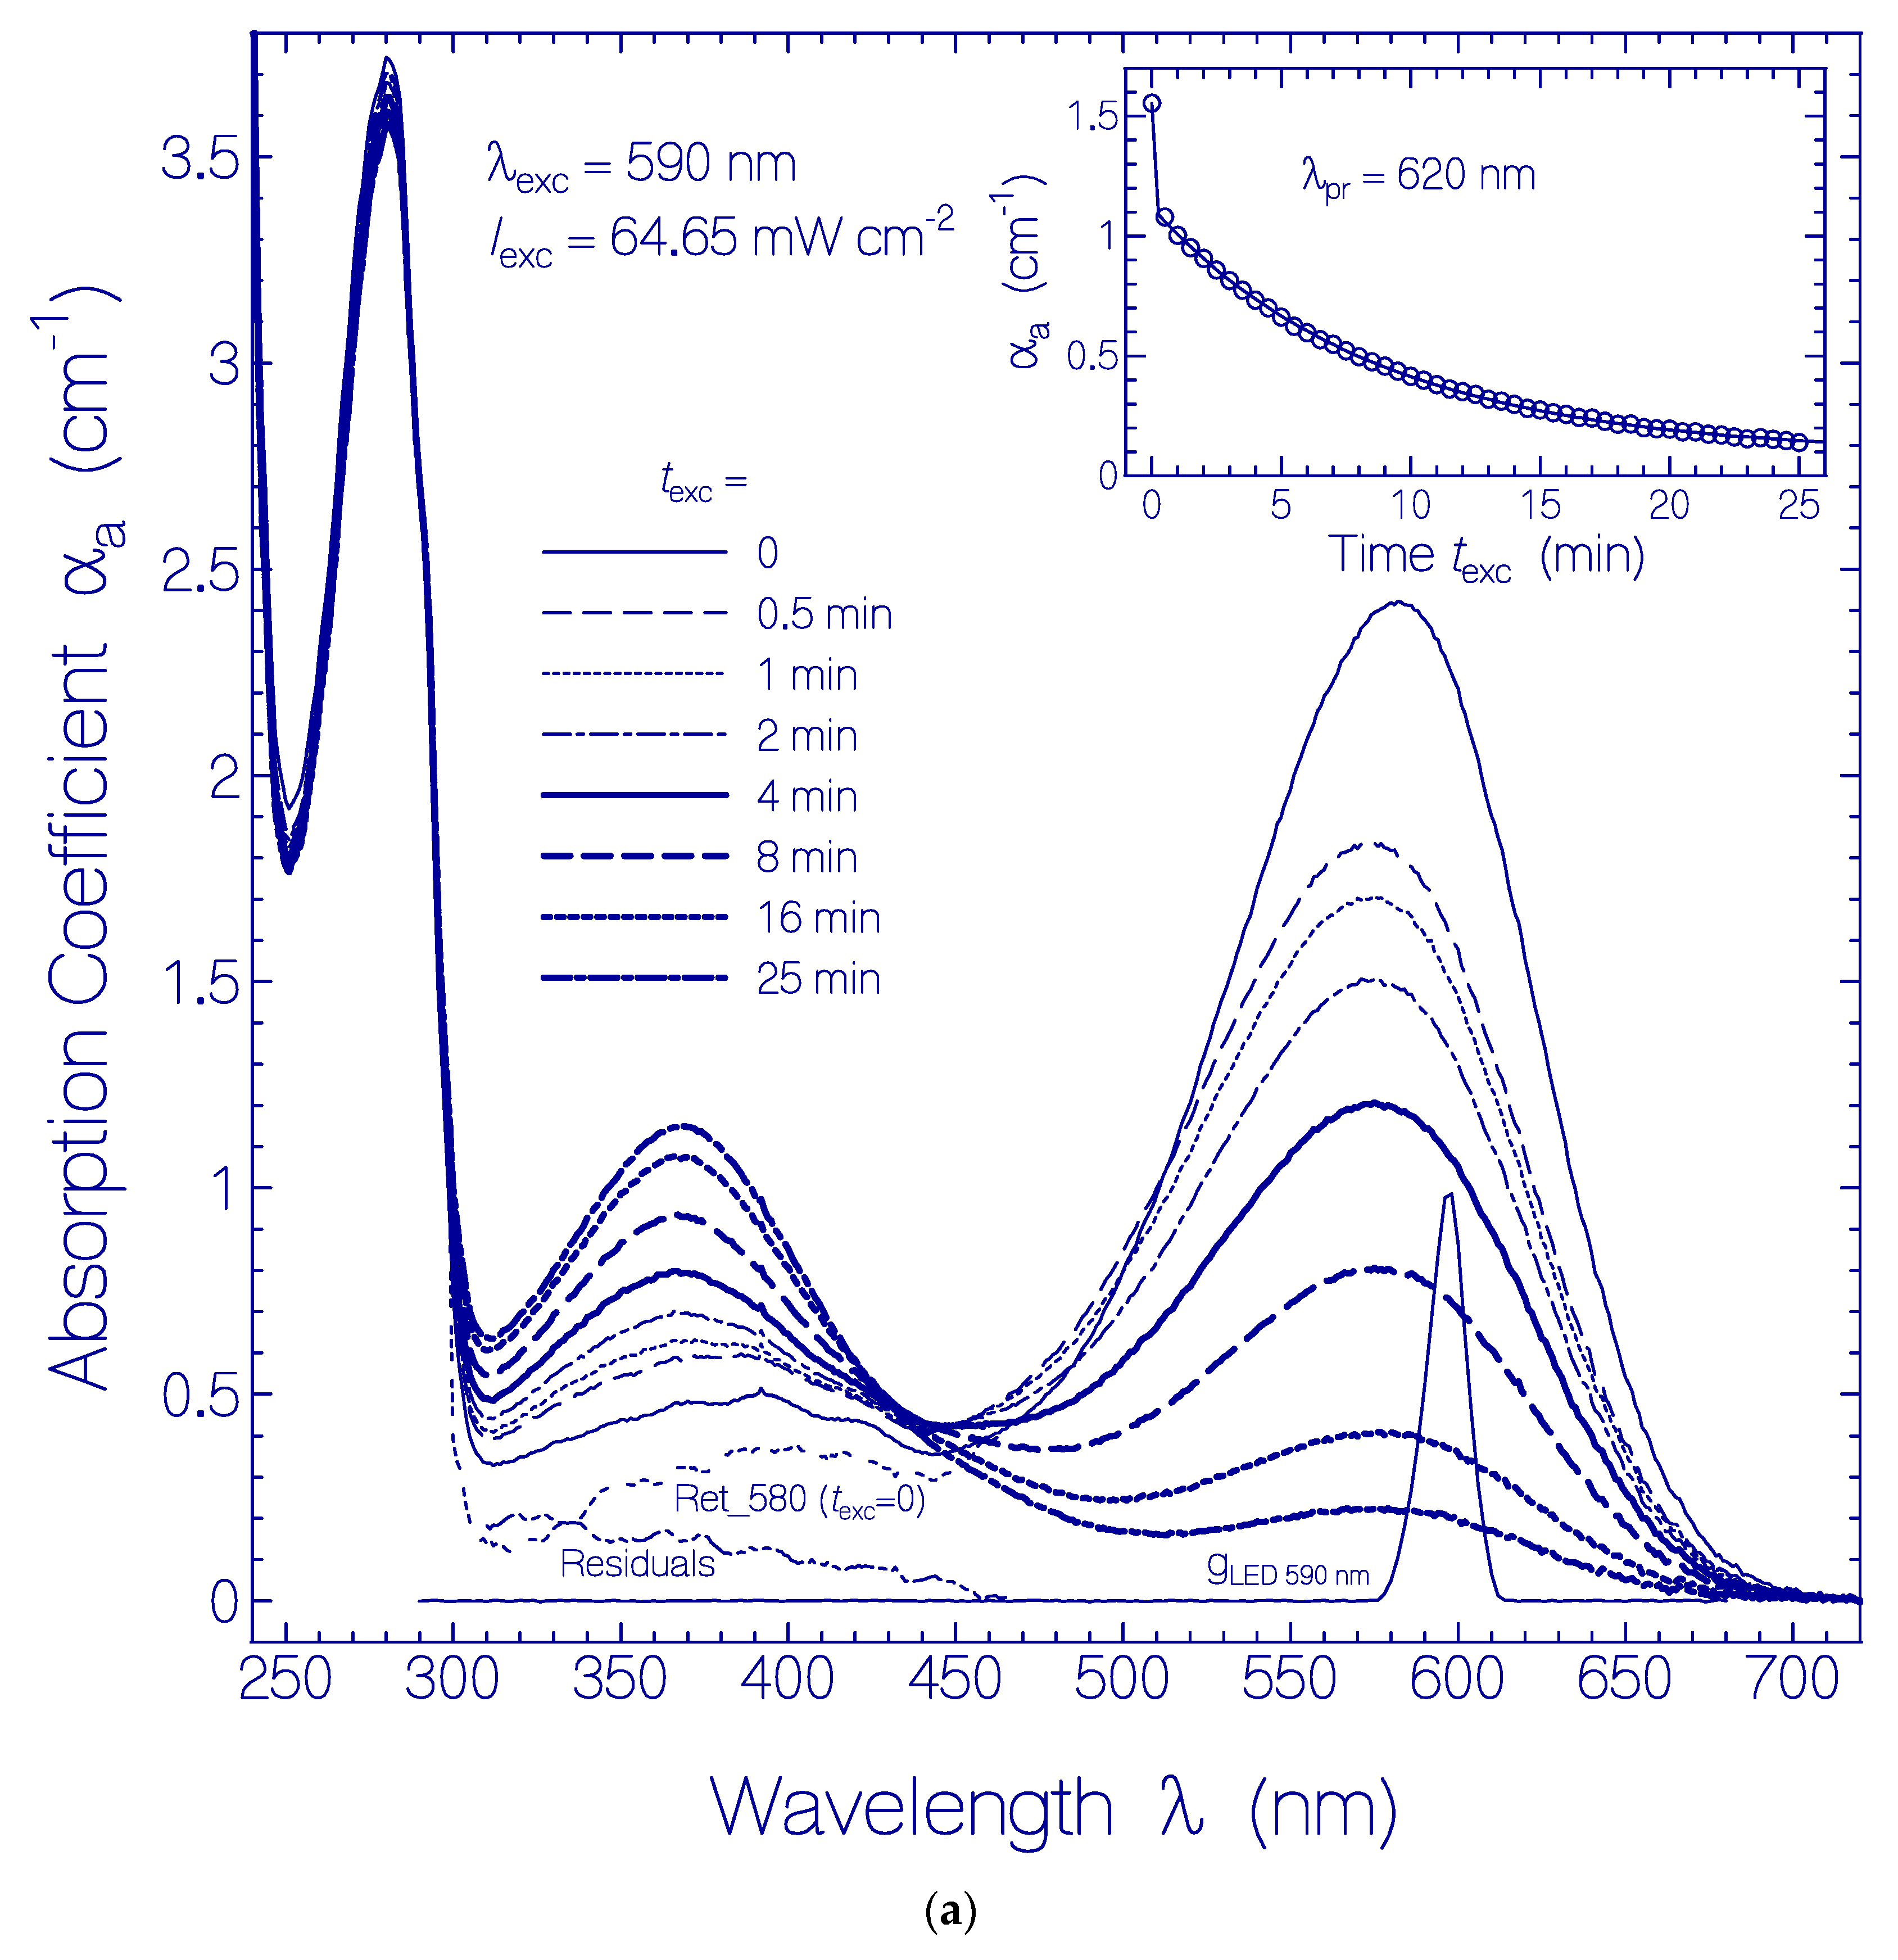
In Figure 1a, the development of absorption coefficient spectra of QuasAr1 in pH 8 buffer during light exposure with LED 590 nm (λexc = 590 nm) of input intensity Iexc = 64.65 mW cm−2 is displayed. The spectral light distribution gLED 590 nm (λ) of the LED 590 nm is included in the figure. The absorption coefficient curves belong to the exposure times listed in the legend. With increasing exposure time, the curves show the decrease of the absorption band around 580 nm and the dominant buildup of an absorption band around 370 nm. The triple-dotted curve belonging to texc = 0 (named Ret_580 (texc = 0)) shows the initial absorption coefficient spectrum of QuasAr1 deprived from retinal isomer contributions other than Ret_580 (dashed triple dotted curve named Residuals). The curves Ret_580 (texc = 0) and Residuals were determined in [33]. The inset in Figure 1a shows the temporal development of the absorption coefficient αa (texc) at the probe wavelength λpr = 620 nm (long-wavelength absorption region of Ret_580). It indicates an initially fast absorption decrease (photoconversion of Ret_580I component) followed by a slow absorption decrease (photoconversion of Ret_580II component).
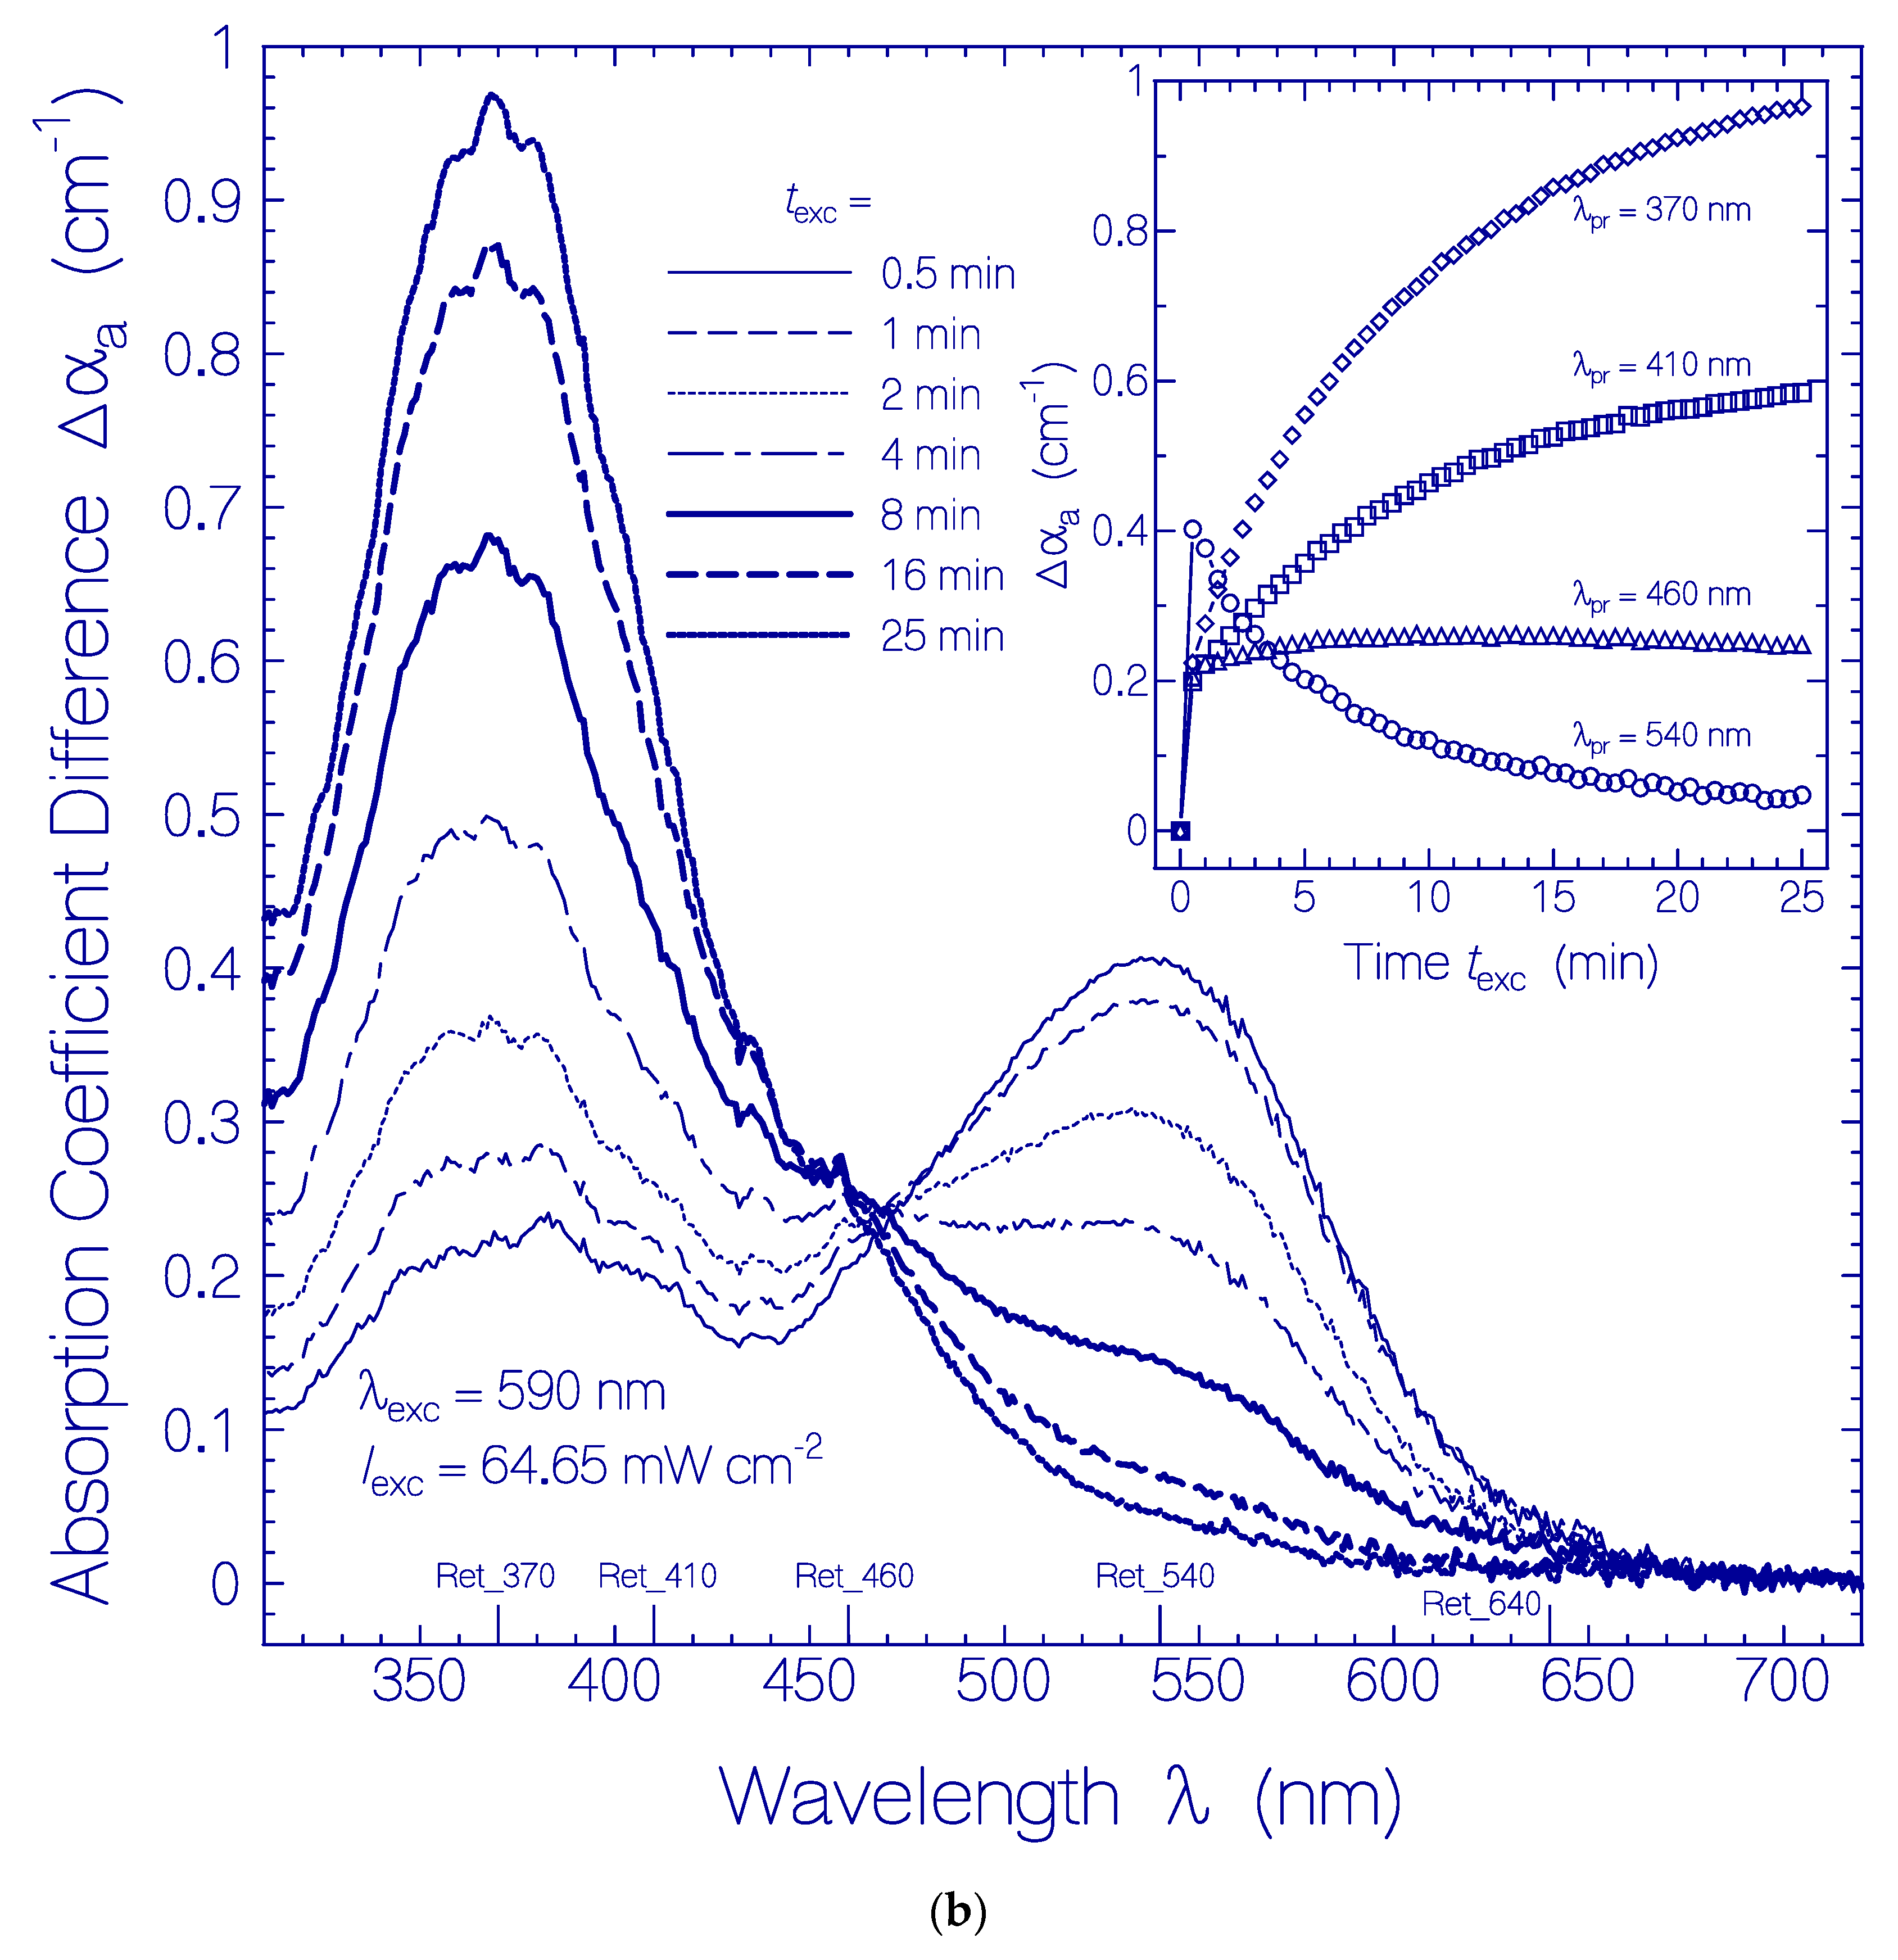
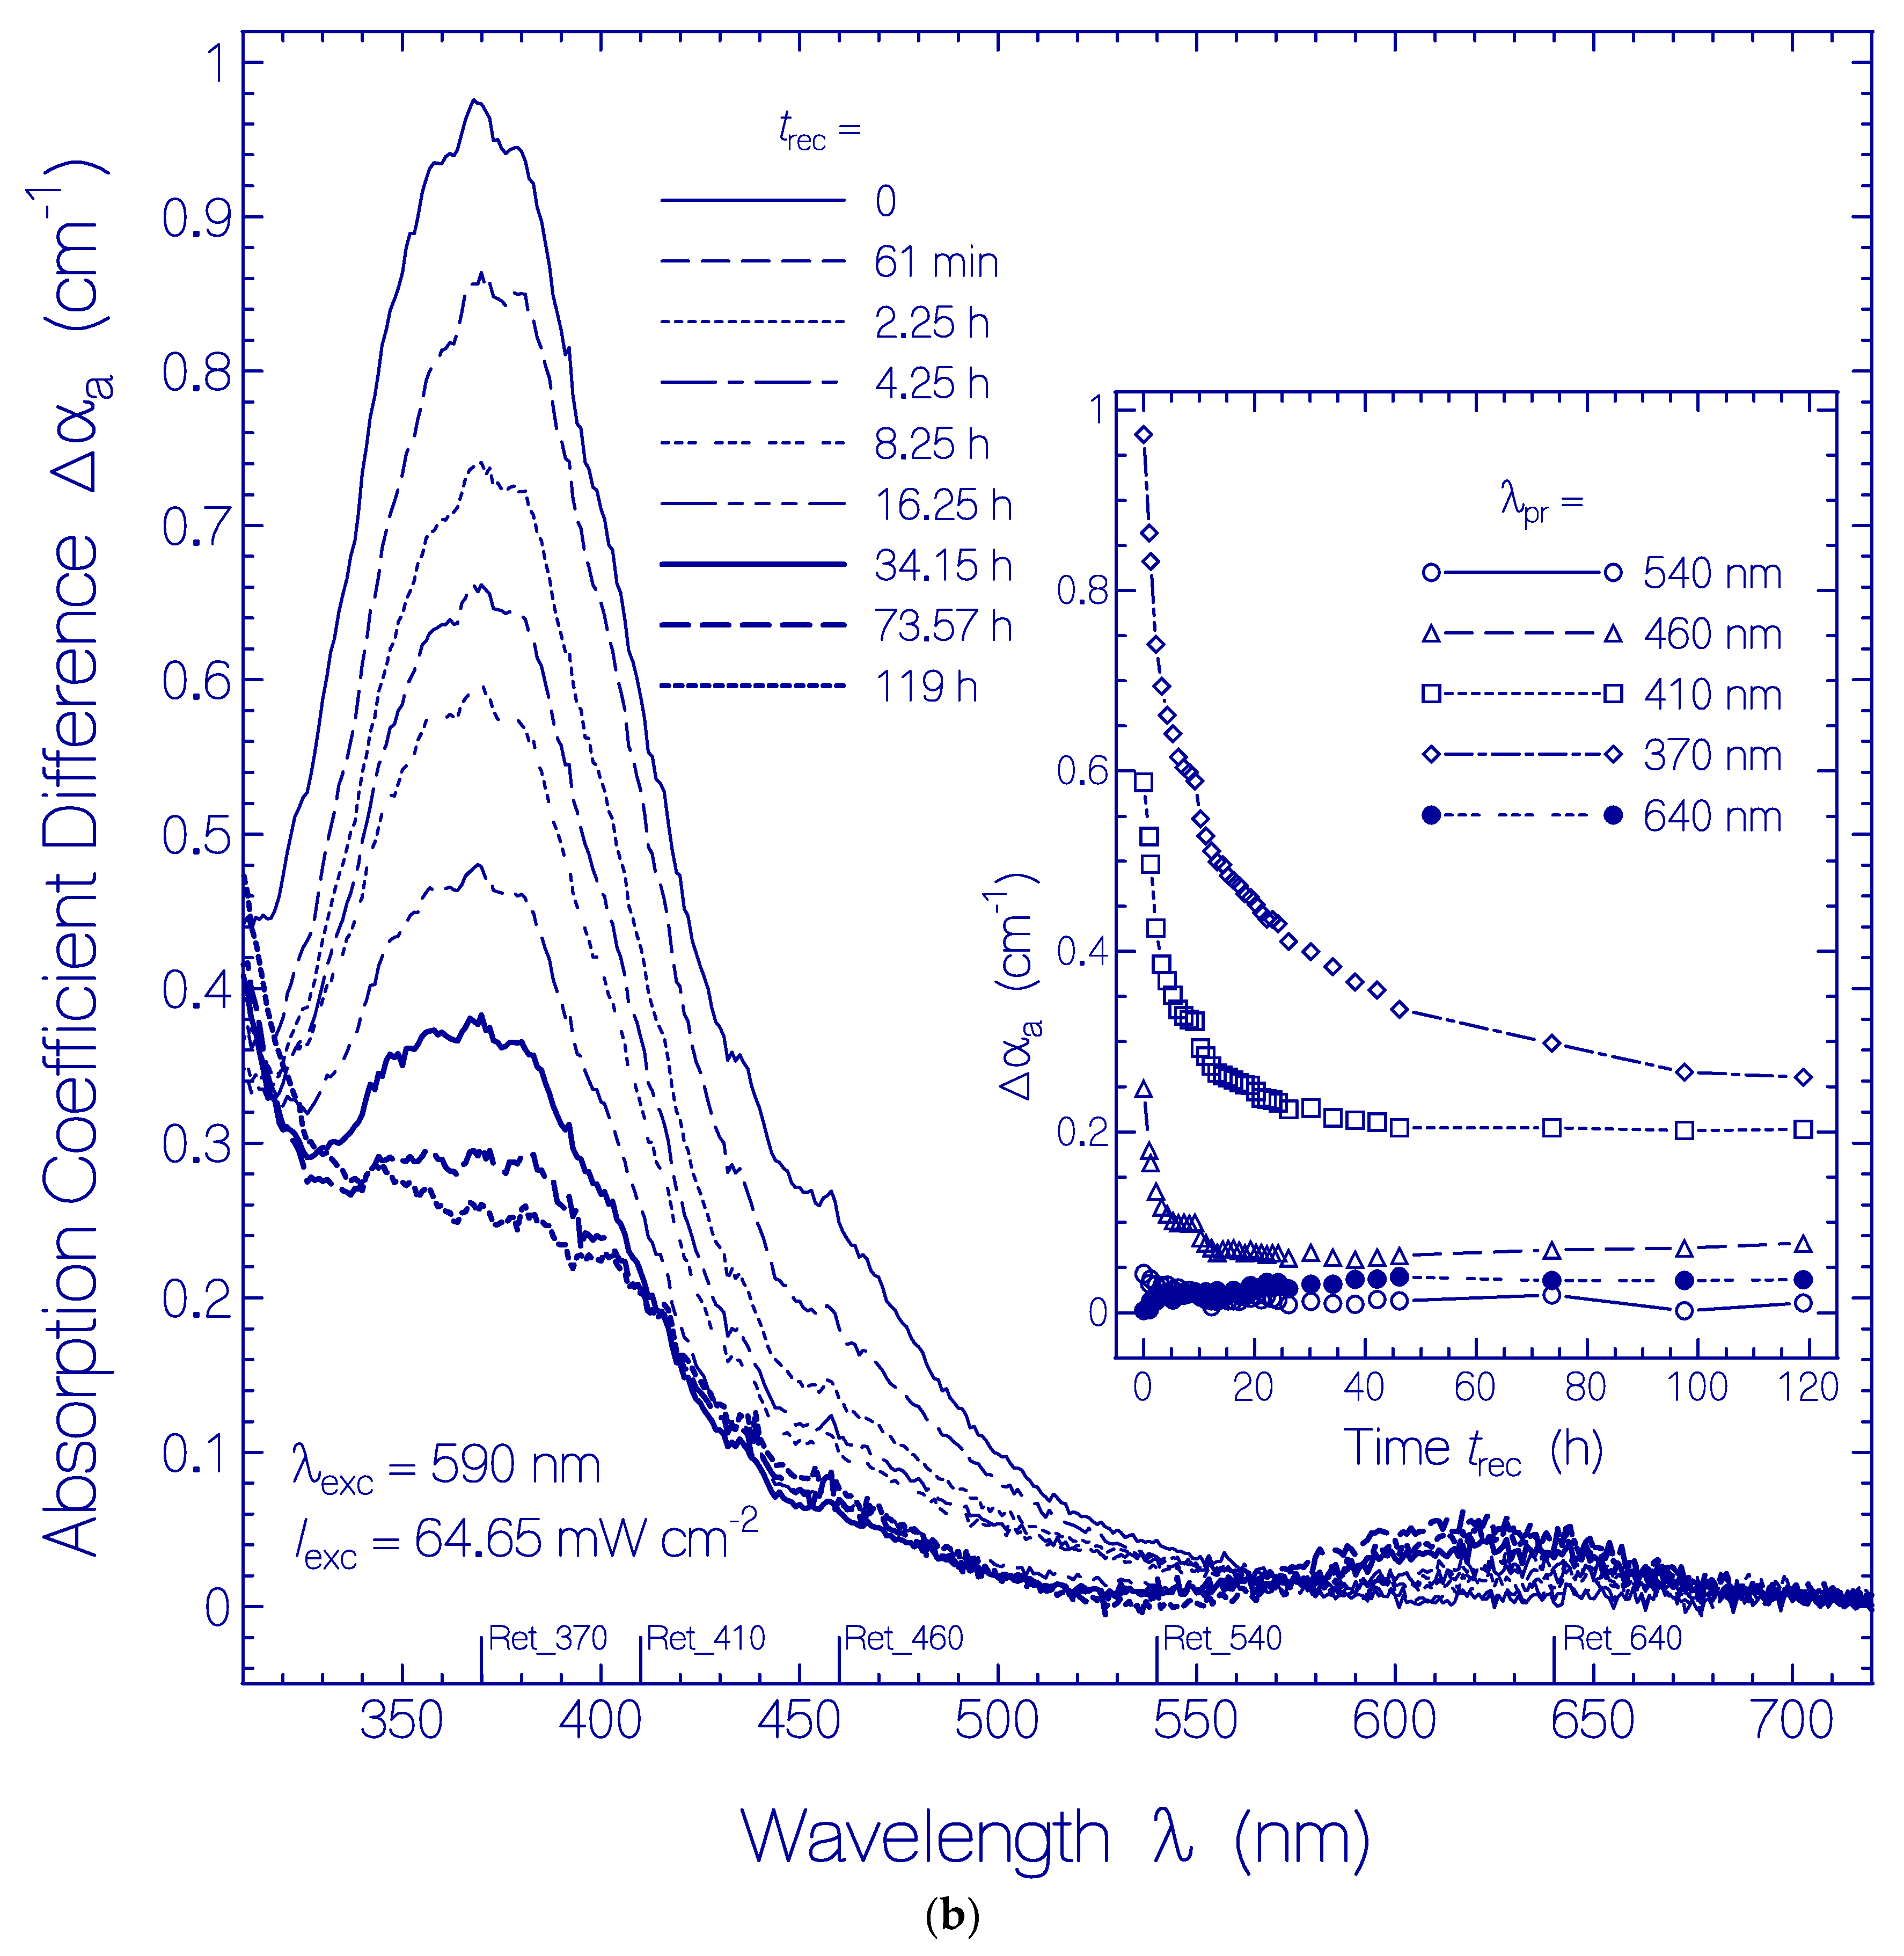
More detailed information on the photoinduced retinal isomerization and deprotonation dynamics of Ret_580 during light exposure was obtained by subtracting the remaining Ret_580 absorption coefficient contributions αa,Ret_580(λ,texc) at time texc and the initial residual retinal isomers contributions Residuals from the developing absorption coefficient spectra of Figure 1a. The remaining Ret_580 absorption coefficient contributions are approximately determined by (the spectral shape of αa,Ret_580 is assumed to do not change with exposure time, the magnitude of αa,Ret_580(λ = 620 nm, texc) is nearly given by the magnitude of αa(λ = 620 nm, texc) of QuasAr1 since at λ = 620 nm absorption contributions from formed species are thought to be small). The resulting curves , which are displayed in the main part of Figure 1b, show the absorption coefficient spectra development of formed species of QuasAr1 due to the light exposure. New absorption bands are seen around λ ≈ 540 nm (PRSB Ret_540), ≈ 460 nm (PRSB Ret_460), ≈ 410 nm (RSB Ret_410), and ≈ 370 nm (RSB Ret_370). There is an indication of a new absorption band around 640 nm (PRSB Ret_640). The absorption band of Ret_540 extends out beyond λexc = 590 nm. The temporal developments of Δαa at the probe wavelengths λpr = 540 nm, 460 nm, 410 nm, and 370 nm are depicted in the inset of Figure 1b. The absorption band of Ret_540 decreased with continued light exposure. It is thought that Ret_540 is formed by photoisomerization of PRSB Ret_580I (likely 13-cis isomer in specific apoprotein conformation ApoproteinI) to PRSB Ret_540 (likely all-trans isomer in apoprotein conformation ApoproteinI). The decrease of Ret_540 for texc > 30 s is thought to be determined dominantly by deprotonation of Ret_540 to Ret_410. The absorption bands of Ret_460, Ret_410, and Ret_370 are overlapping. Ret_370 was built up during the whole time of light exposure. It is thought that Ret_580II (likely all-trans isomer in specific apoprotein conformation ApoproteinII) is converted to Ret_370 (likely formed by photoisomerization of all-trans retinal isomer to a cis isomer Ret_640 in specific apoprotein conformationApoproteinII and subsequent deprotonation, for details see discussion below). At λpr = 460 nm the absorption changes are dominated by the short-wavelength tail of Ret_540 and the long-wavelength tails of Ret_410 and Ret_370. The build-up of Ret_460 population is small and only indicated by a small absorption structure change around 460 nm.
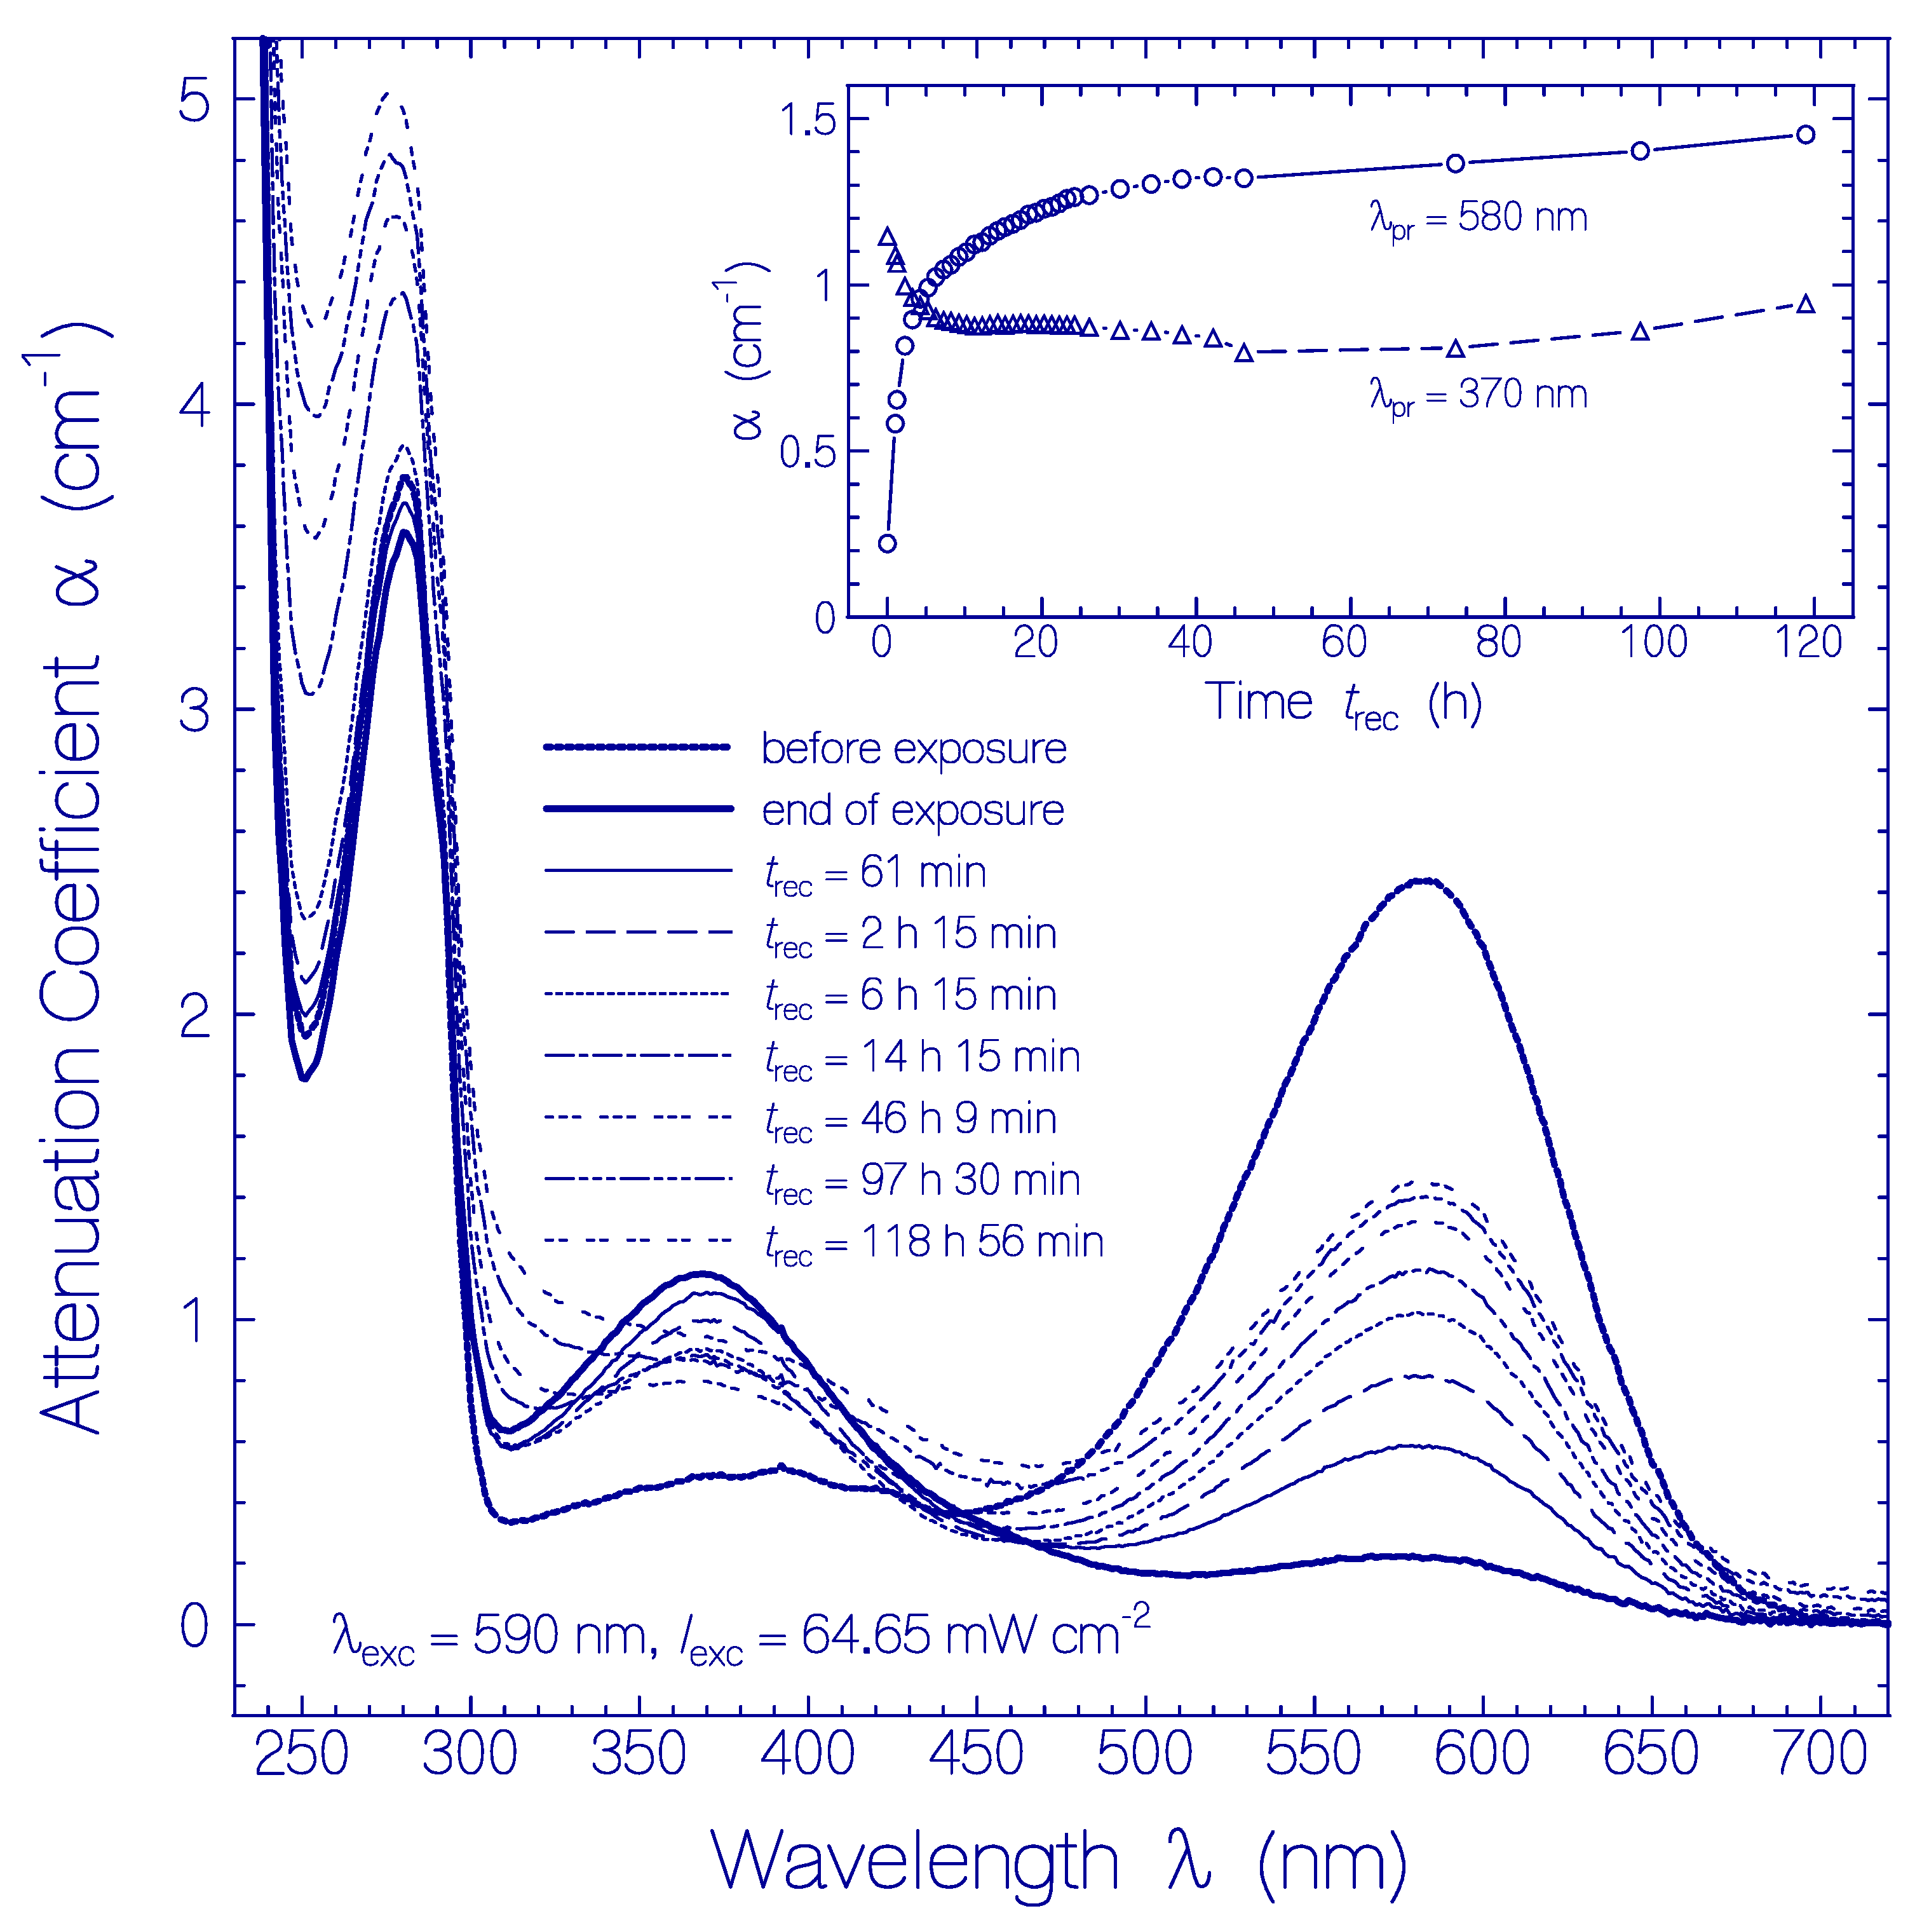
The attenuation coefficient spectra development of the QuasAr1 sample used in Figure 1a after excitation light switch-off over a recovery time range of nearly five days (sample in the dark at room temperature) is displayed in Figure 2. The inset in Figure 2 shows the temporal attenuation coefficient development at λpr = 580 nm and 370 nm.
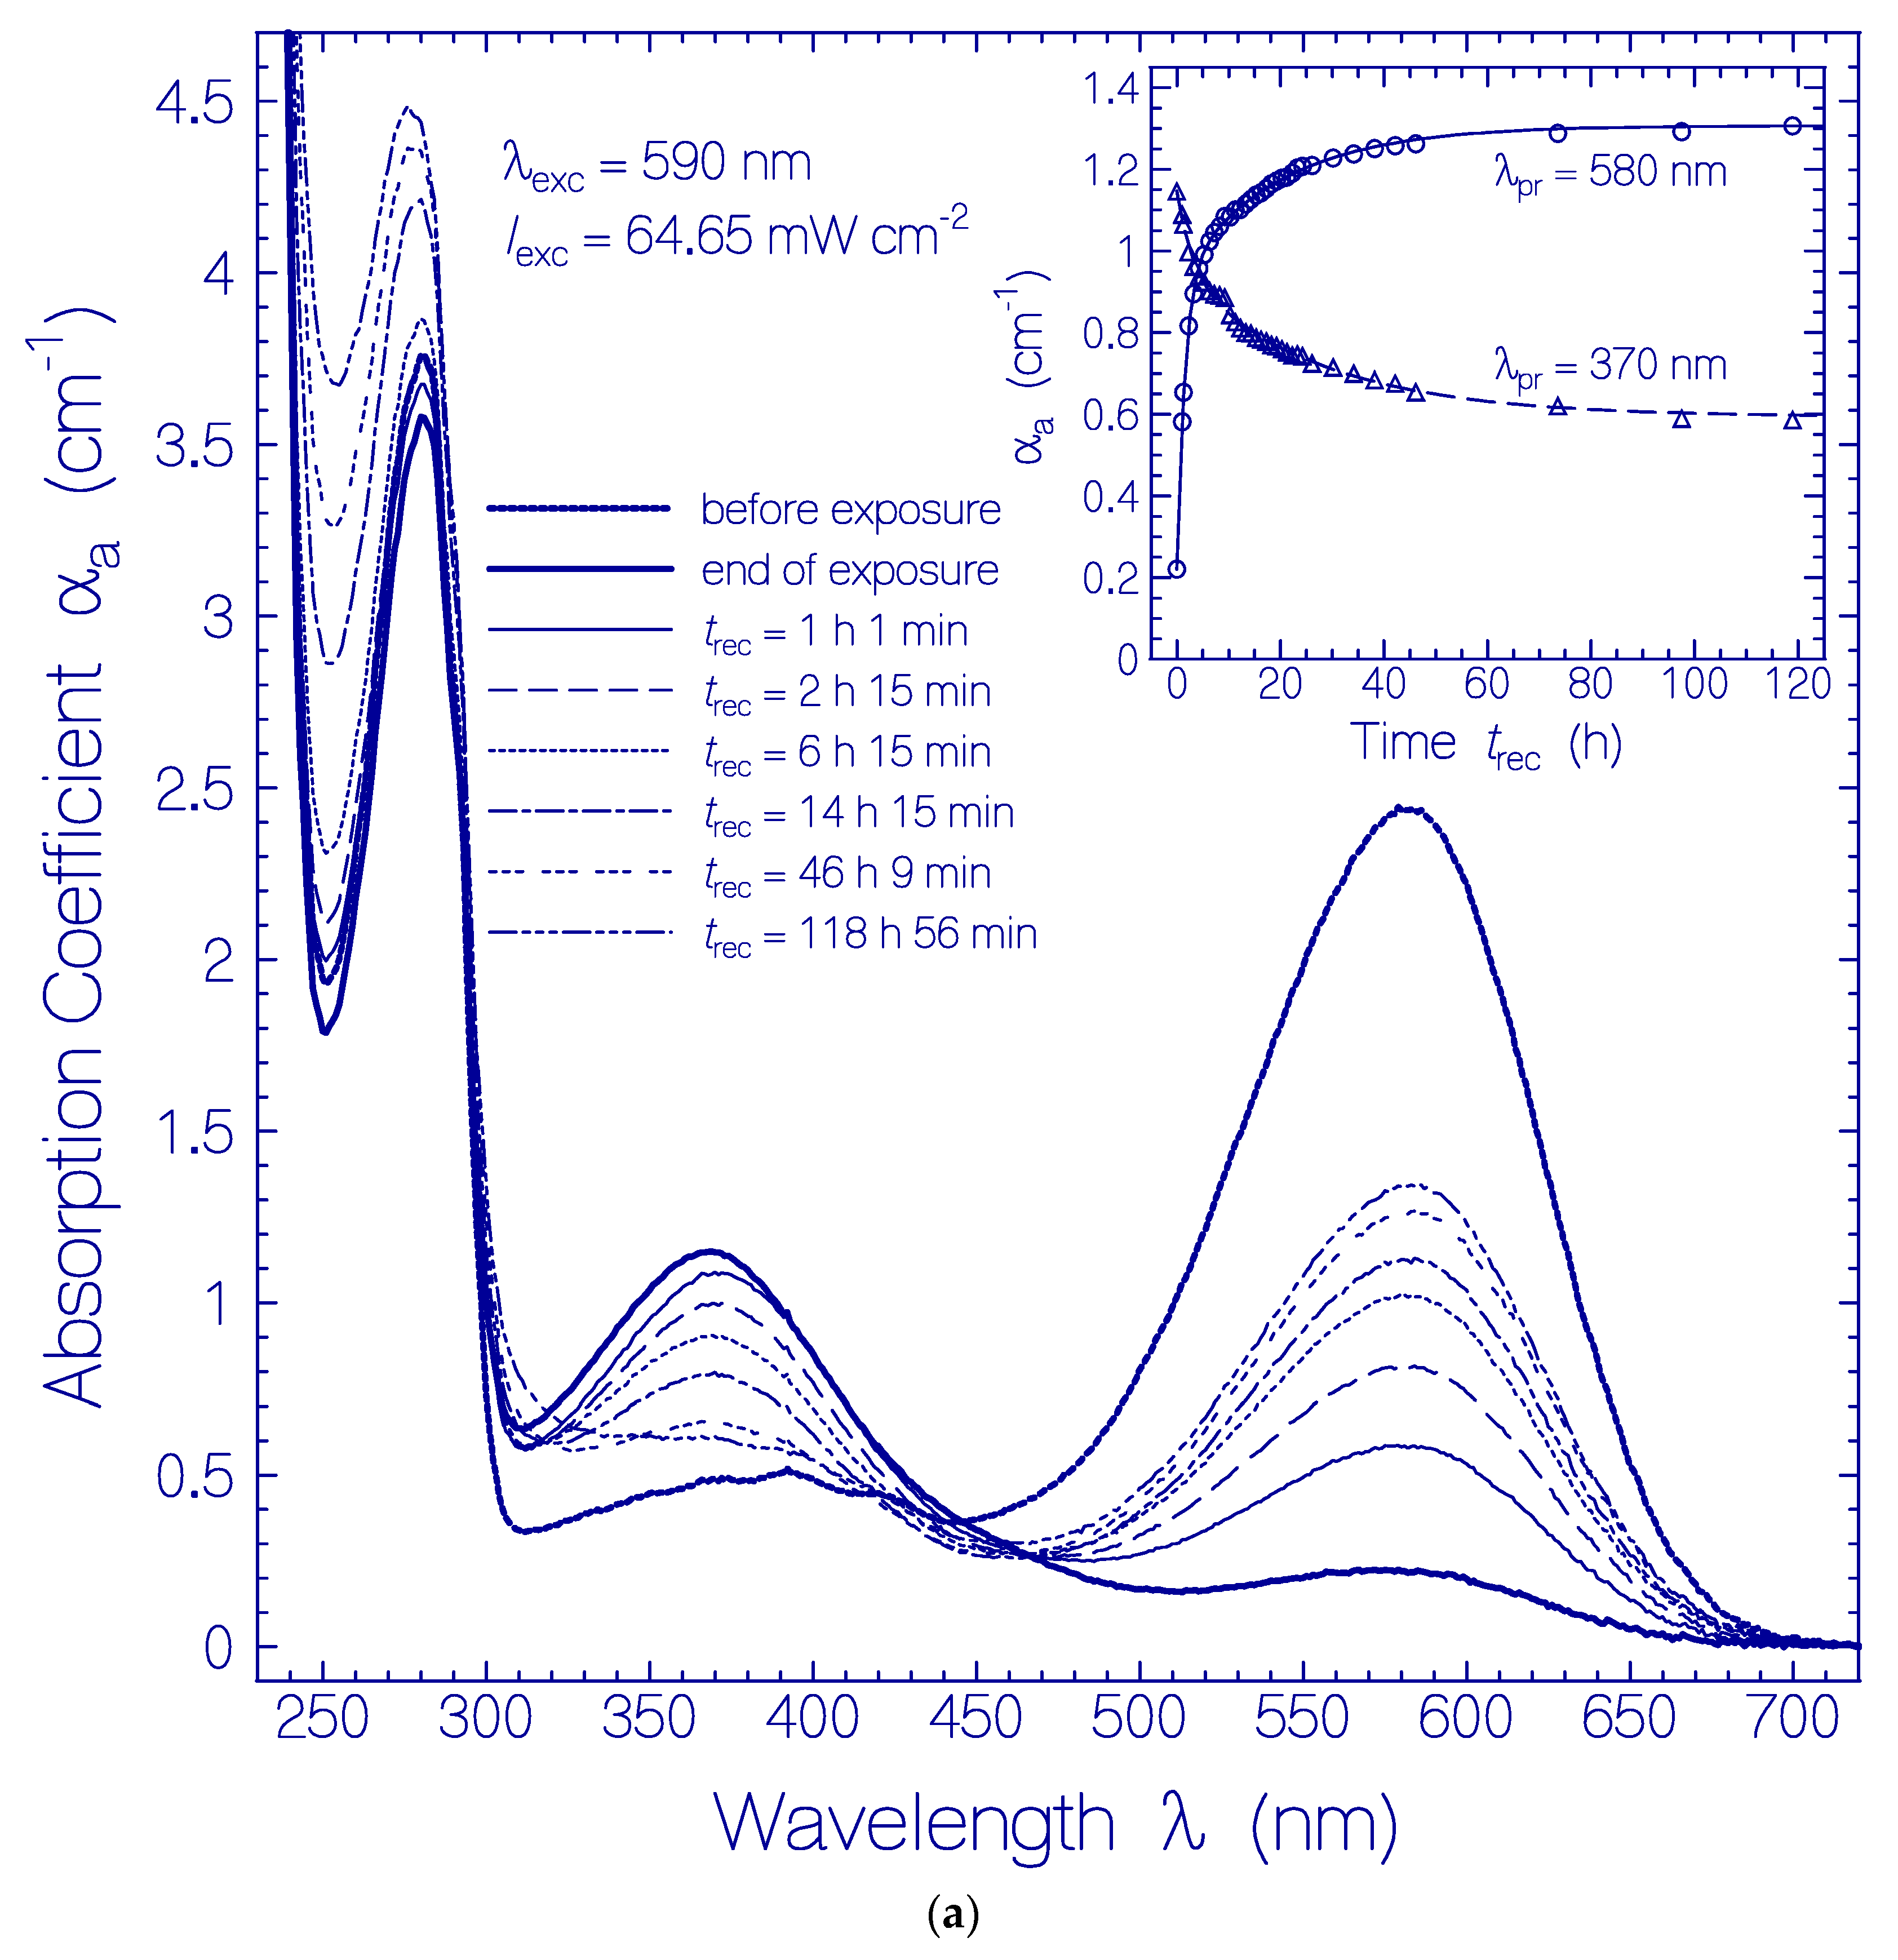
The corresponding absorption coefficient spectra development (scattering contributions approximately subtracted) is shown in Figure 3a. The absorption band centered at 580 nm (Ret_580) recovered partly, and the formed absorption band around 370 nm (Ret_370 including Ret_410) disappeared partly. The absorption band around 280 nm (dominant tryptophan absorption) increased steadily due to thermal apoprotein restructuring [33]. The inset in Figure 3a shows the partial absorption coefficient recovery at λpr = 580 nm were the absorption is determined by Ret_580, and the partial absorption coefficient decrease at λpr = 370 nm due to reprotonation of Ret_370 to Ret_580. The only partial reconversion of Ret_370 to Ret_580 is due to a changeover from the reversible photocycle dynamics to the thermal irreversible deprotonation of Ret_580 and the Ret_370 ground-state potential energy lowering below the ground-state energy level of Ret_580 (changeover from Ret_370 to Ret_350, see discussion below) caused by the dynamic thermal apoprotein restructuring [33] during the slow recovery time of the photocycle process.
In order to see details in the absorption coefficient spectra development after excitation light switch-off in Figure 3a, the absorption coefficient spectra development is displayed in Figure 3b (Ret_580 contribution and initial residual retinal contributions are subtracted from Figure 3a). The inset of Figure 3b shows the temporal development of Δαa(trec) at the probe wavelengths λpr = 540 nm, 460 nm, 410 nm, 370 nm, and 640 nm. The absorption of Ret_370, Ret_410, and Ret_460 decreased within the first 20 h of light switch-off and then leveled off. Δαa(640 nm,trec) indicates the formation of Ret_640 by thermal activation of isomerization of Ret_580II [33].
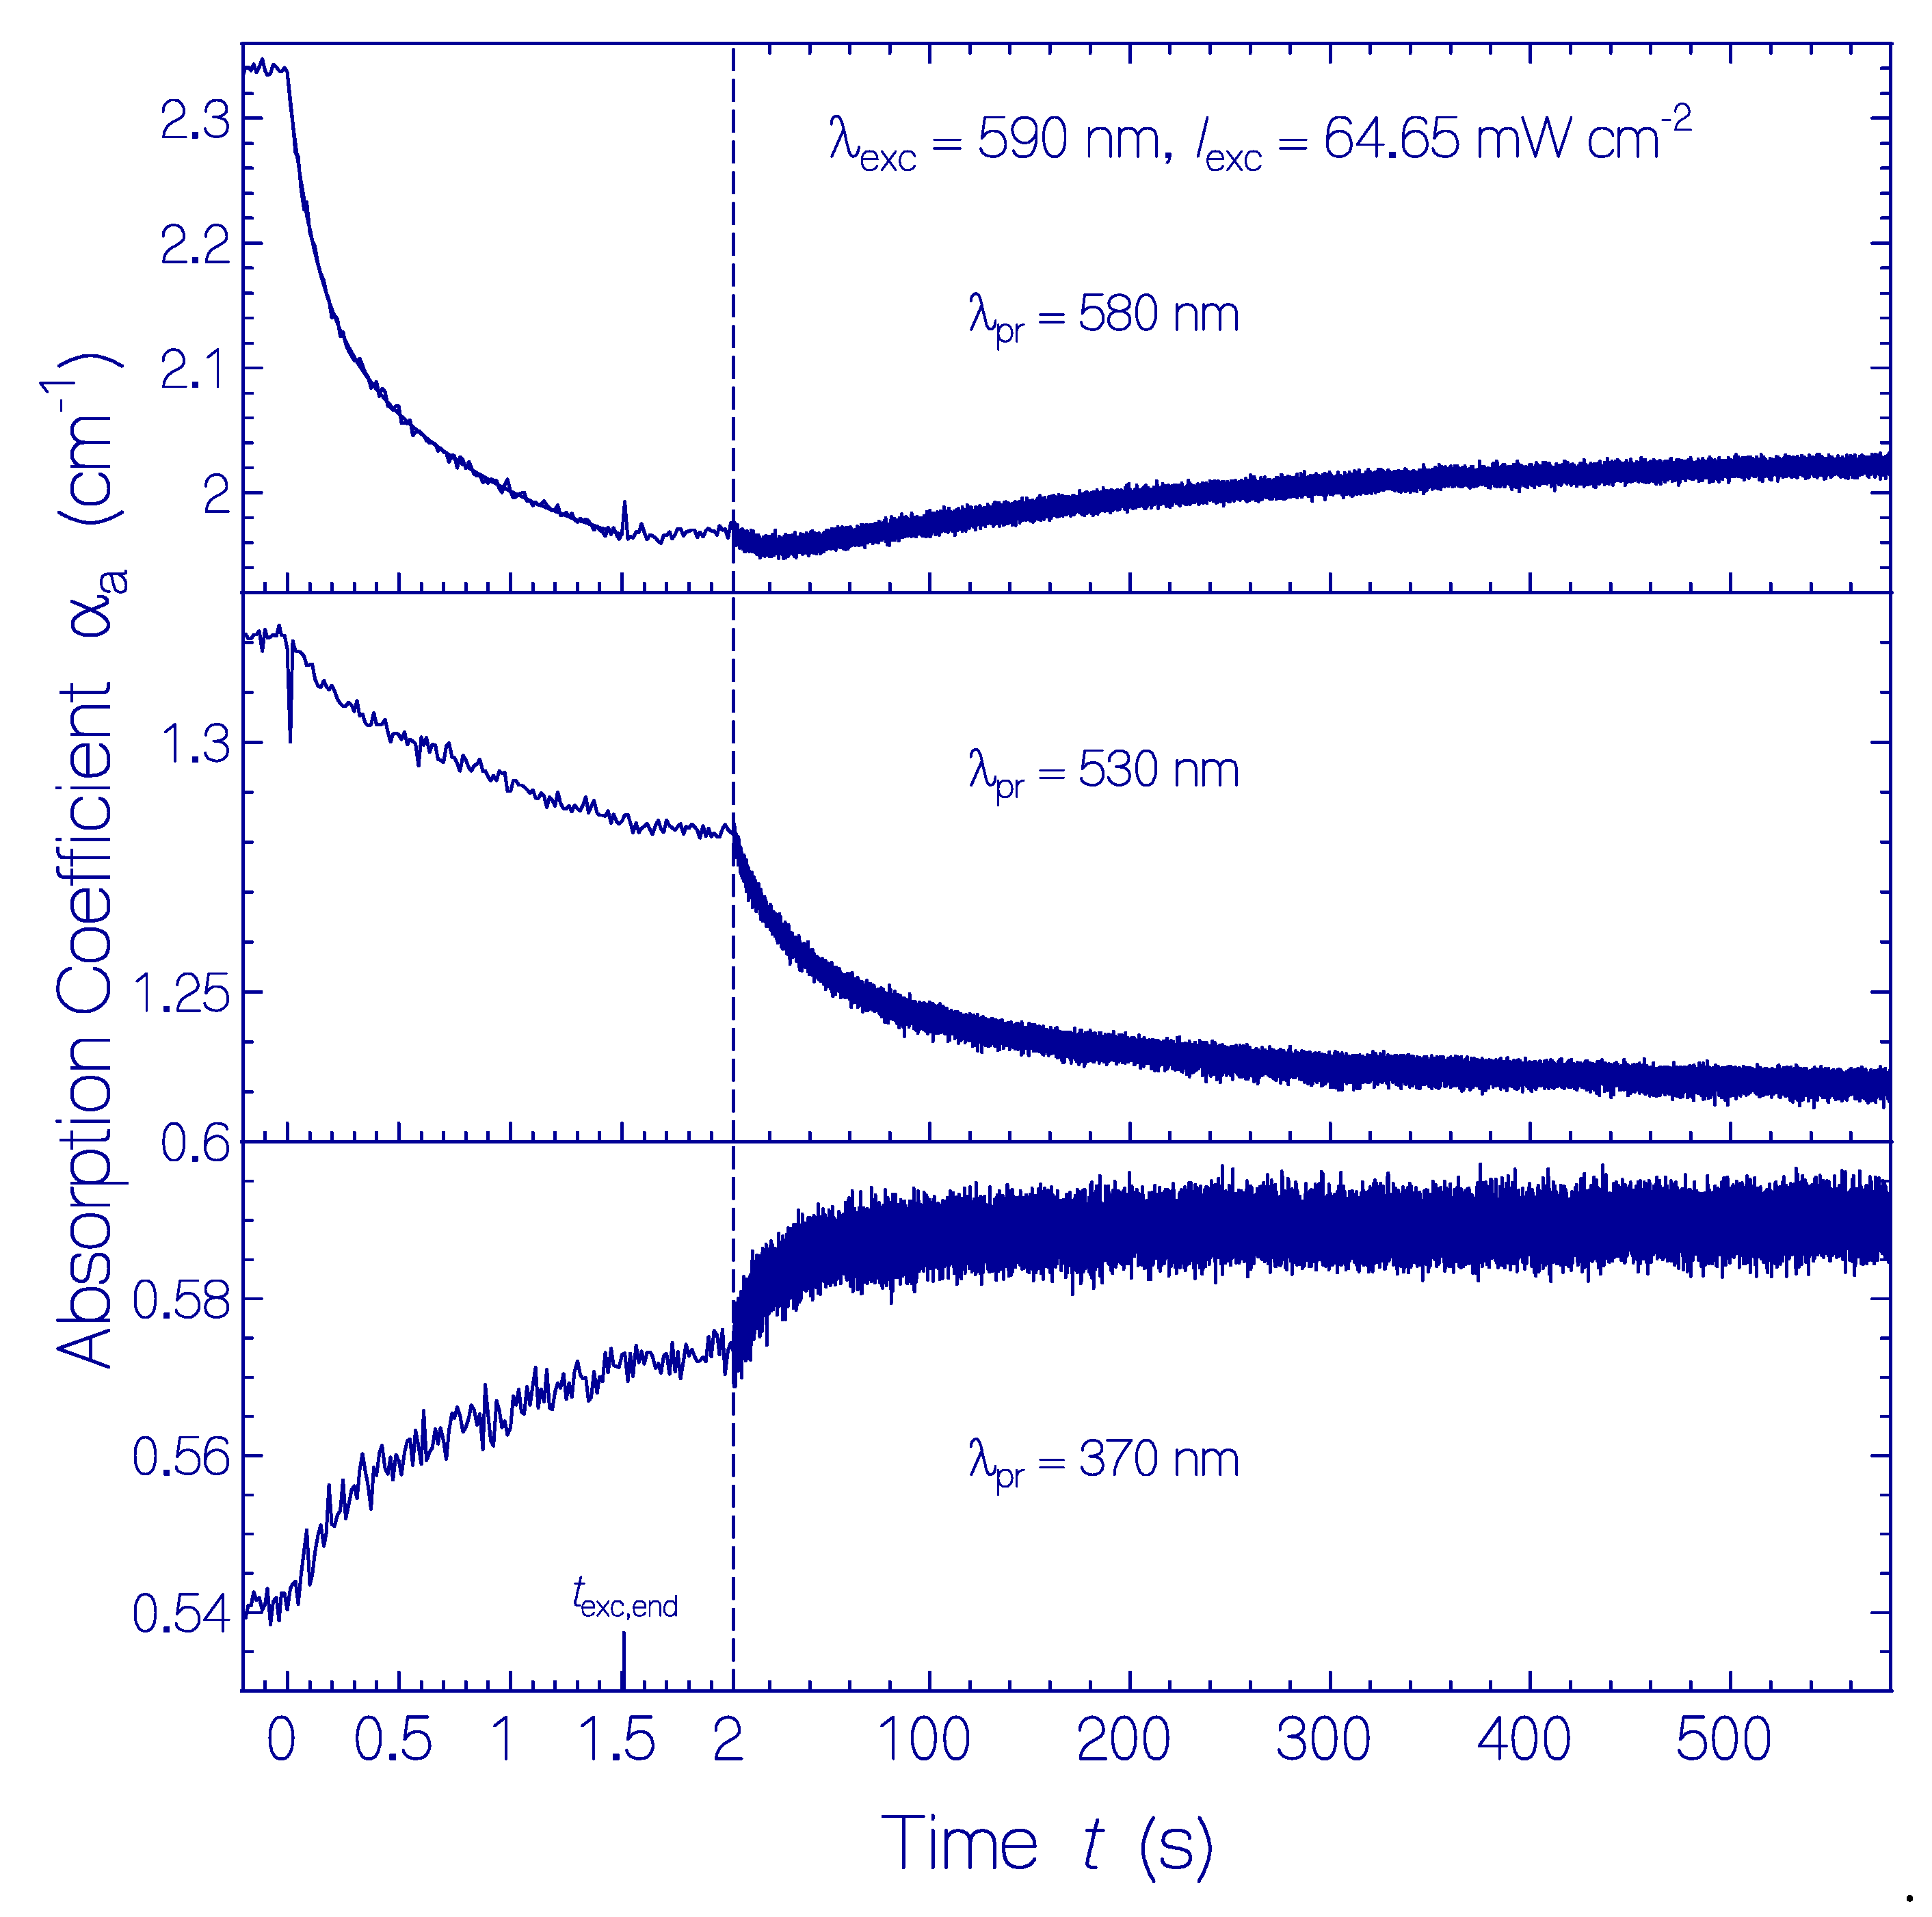
The temporal absorption coefficient developments with a time resolution of δtres = 12.5 ms at λpr = 580 nm, 530 nm, and 370 nm are displayed in Figure 4 for a QuasAr1 sample in pH 8 Tris buffer. A fresh thawed sample was used. In the first run, the probe wavelength was set to λpr = 580 nm, the exposure time was texc = 1.5 s, and the time of recovery in the dark was set to 10 min. Then, it was followed immediately by the second run with the same exposure/dark parameters at λpr = 530 nm. Next, it was followed immediately by the third run with the same exposure/dark parameters at λpr = 370 nm.
The top part of Figure 4 shows the absorption development at λpr = 580 nm during and after light exposure. During light exposure, the absorption decreased dominantly by photoisomerization of Ret_580I to Ret_540. After excitation light switch-off, initially a minute absorption decrease is observed likely due to the conversion of Ret_540 to Ret_410 (absorption band of Ret_540 extends out to 580 nm). The following slight absorption increase is thought to be due to partial reprotonation of Ret_410 to Ret_580I (see discussion below).
The middle part of Figure 4 shows the absorption development at λpr = 530 nm in a second exposure of the sample. The absorption decrease during light exposure is due to the absorption decrease of the broad absorption band of Ret_580 which dominates the absorption at 530 nm. The weaker absorption decrease, as compared with λpr = 580 nm, is due to the formation of the absorption band of Ret_540 during light exposure. After light switch-off, the absorption at 530 nm decreased because of deprotonation of Ret_540 to Ret_410 (time constant τrel,Ret_540 ≈ 37 s, see discussion below). The spike at the position of light switch-on is thought to be an artifact caused by a photoinduced transient thermal grating [34,35] (the same effect was observed by replacing the QuasAr1 sample with a sample of rhodamine 6G in methanol).
The bottom part of Figure 4 shows the absorption development at λpr = 370 nm in a third exposure of the sample. After excitation light switch-on, the increase of absorption is slightly time delayed (≈0.1 s). After excitation light switch-off (texc,end = 1.5 s), the absorption continues to increase within the first 40 s, and then, levels off (time constant τrel,Ret_640 ≈ 17 s). The absorption dynamics is thought to be dominated by the conversion of Ret_640 to Ret_370 by proton release (see discussion below).
2.2. Quantum Yield of Photoconversion
The quantum yield of photoconversion ϕcon of Ret_580 to other retinal isomers during light exposure is given [36] by the ratio of the number density ΔNcon of converted Ret_580 molecules to the number density Δnph,abs of absorbed photons by Ret_580, i.e.,
The number density ΔNcon is determined by
where N0 is the initial number density of Ret_580, αa,0(λpr) is the initial absorption coefficient of Ret_580 at the probe wavelength λpr, and Δαa(λpr) is the absorption coefficient change of Ret_580 at λpr (λpr is selected at a wavelength region where practically only Ret_580 is absorbing).
The initial number density N0 of Ret_580 is given by
where σa(λpr) is the absorption cross-section of Ret_580 at λpr. It is presented in Figure S2 of the Supplementary Materials to [33].
The number density Δnph,abs of absorbed photons by Ret_580 is determined by the excitation light intensity Iexc at the excitation wavelength λexc, the time interval of light exposure δtexc and the absorption coefficient αa(λexc) of Ret_580. It is given by
where hνexc is the photon excitation energy (νexc = c0/λexc is the photon frequency, c0 is the speed of light in vacuum, and h is the Planck constant).
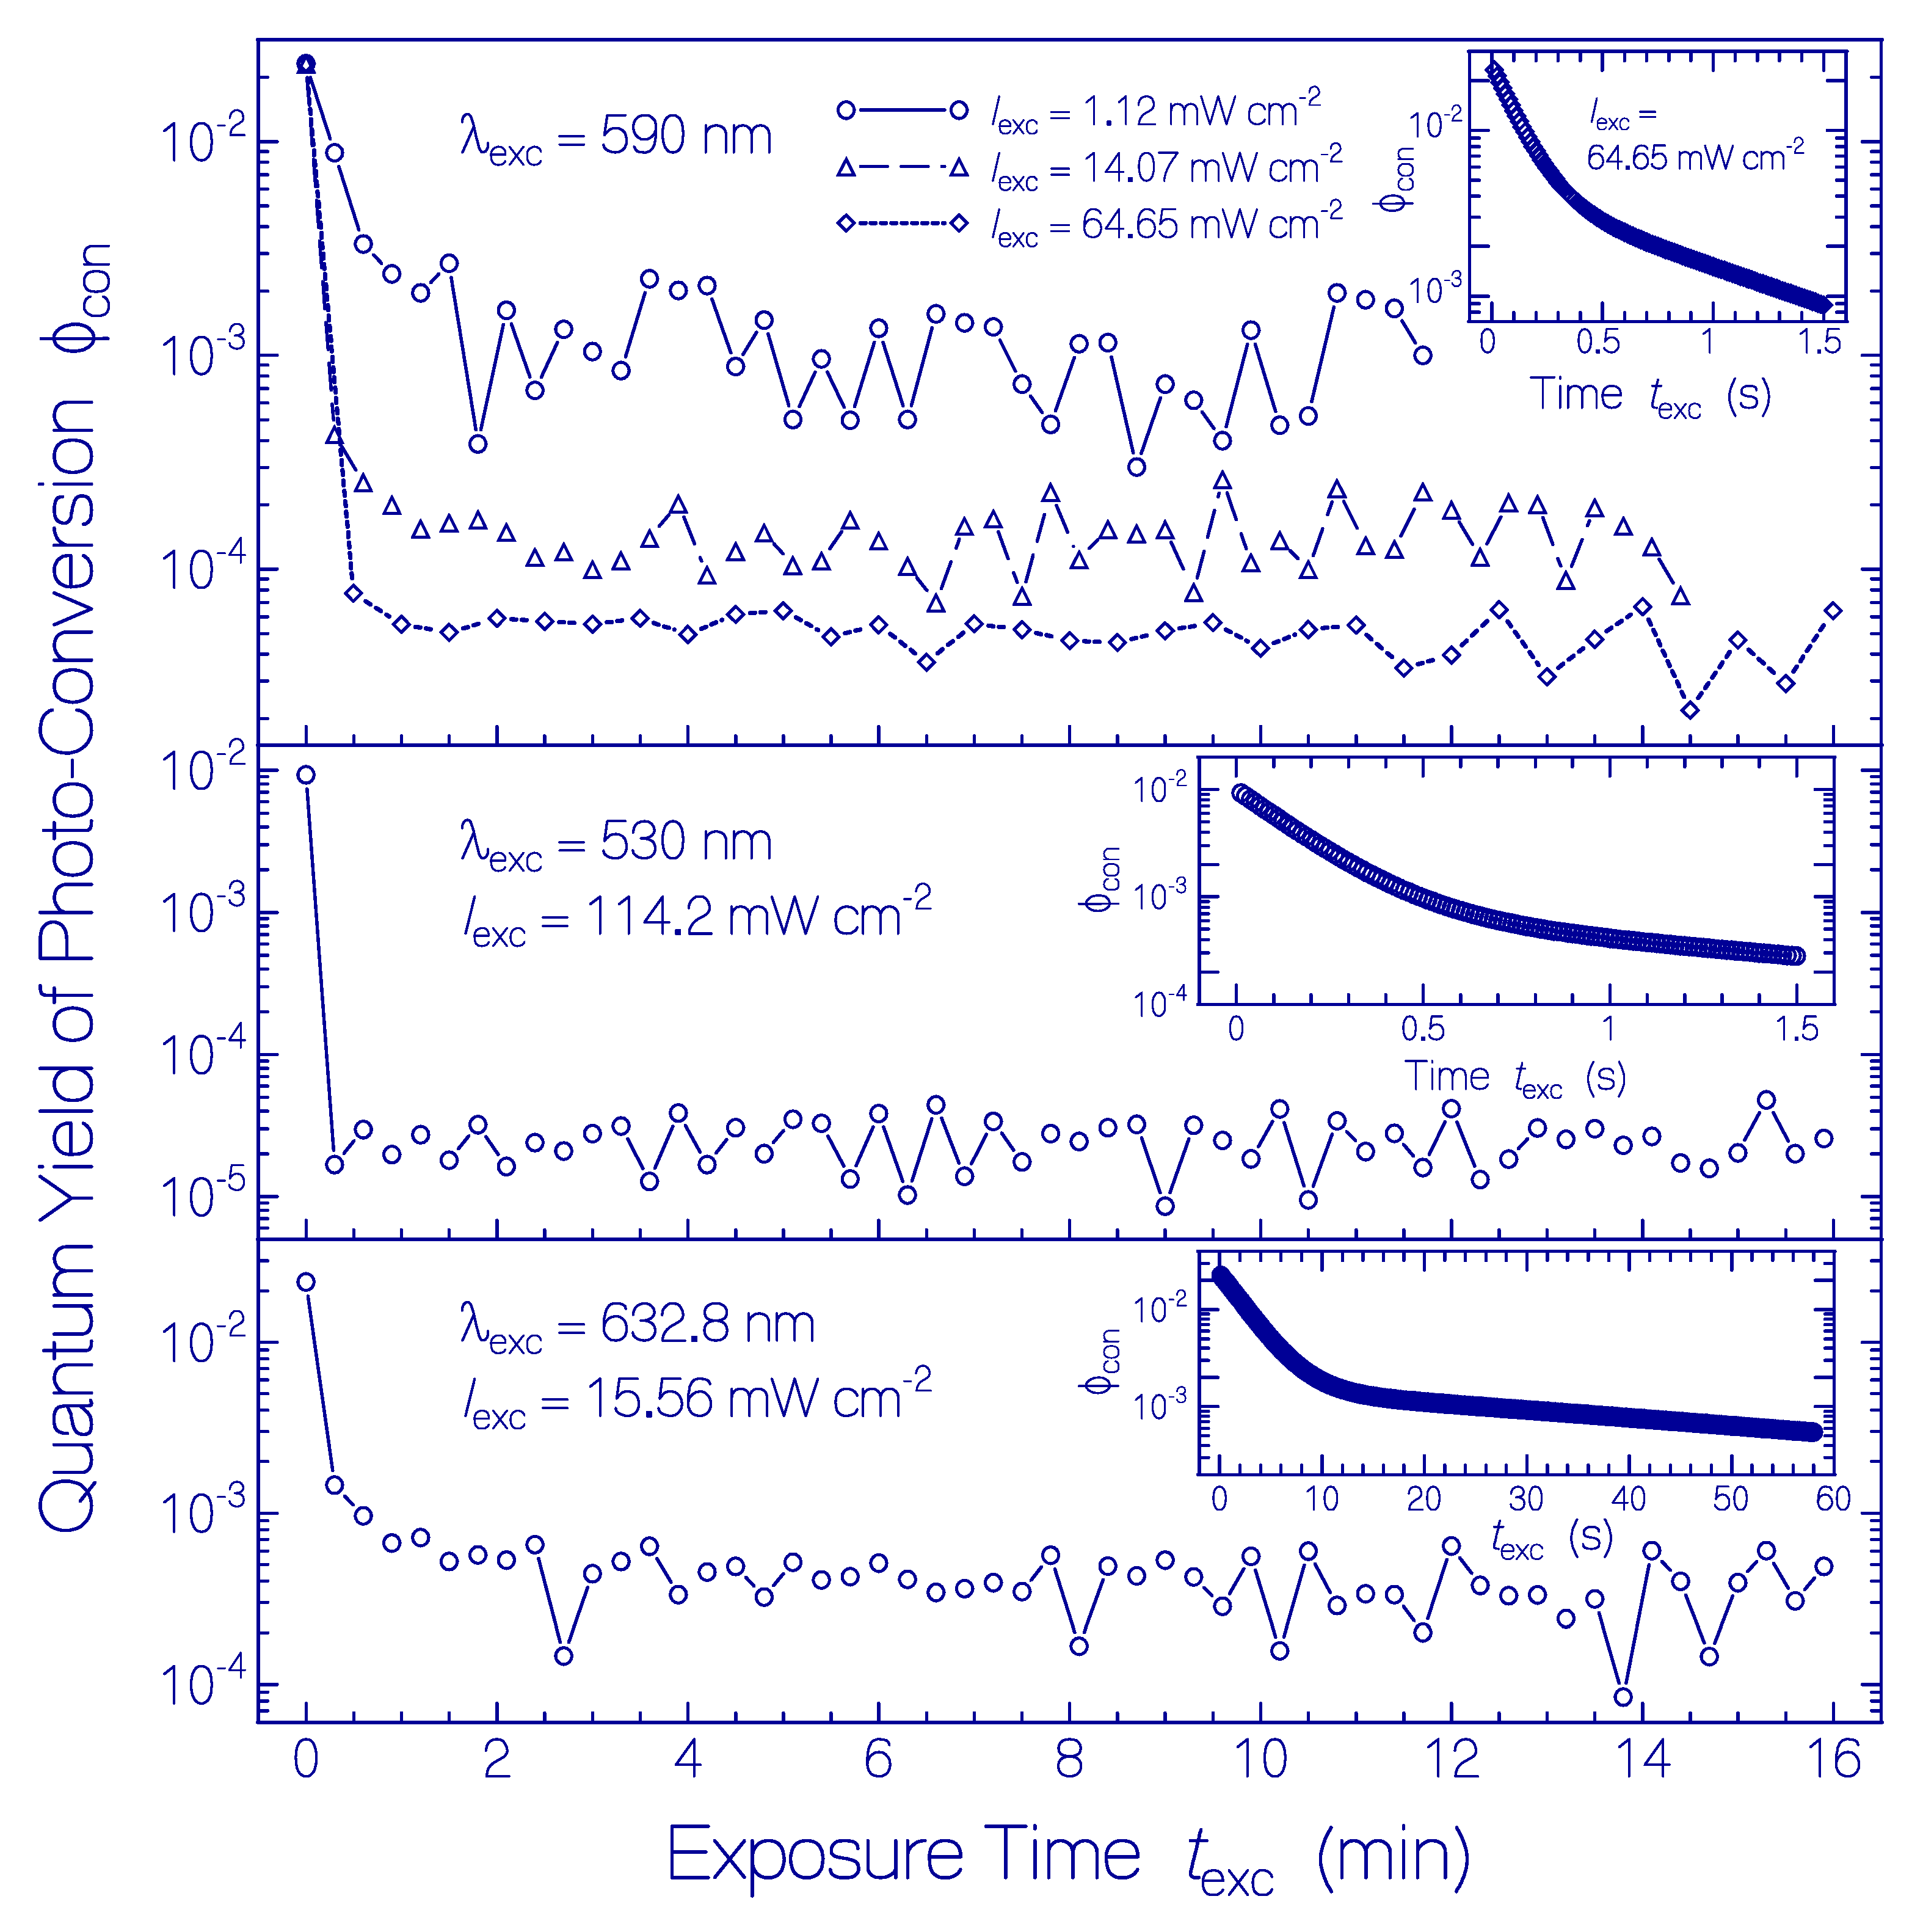
The determined approximate quantum yields of photoconversion of Ret_580 versus exposure time are displayed in Figure 5. The ϕcon(texc) curves give only approximate values of ϕcon,Ret_580(texc) since αa(λpr,texc) used in the calculations is only approximately equal to αa,Ret_580(λpr,texc), and the used αa(λexc,texc) is only approximately equal to αa,Ret_580(λexc,texc). In the main subfigures, λpr = 620 nm was used where αa(λpr,texc) is nearly equal to αa,Ret_580(λpr,texc) during the whole exposure time. In the insets of the subfigures, λpr = 580 nm was used. There, αa(texc) was measured with high time resolution and for the short exposure times αa(λpr,texc) remained nearly equal to αa,Ret_580(λpr,texc). The absorption coefficient data in the insets of Figure 1a (λexc = 590 nm, Iexc = 64.65 mW cm−2, and λpr = 620 nm), Figure S1a (λexc = 590 nm, Iexc = 14.07 mW cm−2, and λpr = 620 nm), Figure S4a (λexc = 590 nm, Iexc = 1.12 mW cm−2, and λpr = 620 nm), Figure S6a (λexc = 530 nm, Iexc = 114.2 mW cm−2, and λpr = 620 nm), and Figure S10a (λexc = 632.8 nm, Iexc = 15.56 mW cm−2, and λpr = 620 nm) were employed for the main subfigures. The absorption coefficient curves in the top left parts of Figure 4 (λexc = 590 nm, Iexc = 64.65 mW cm−2, and λpr = 580 nm), Figure S9 (λexc = 530 nm, Iexc = 114.2 mW cm−2, and λpr = 580 nm), and Figure S13 (λexc = 632.8 nm, Iexc = 15.65 mW cm−2, and λpr = 580 nm) were employed for the insets in the subfigures.
All ϕcon(texc) curves in Figure 5 show an initially fast decrease and a changeover to a near exposure time independent but excitation light intensity dependent low value. As was shown in [33] and is discussed below, Ret_580 consists of two protonated retinal Schiff base isomers Ret_580I (fraction ≈ 0.41 [33]) and Ret_580II (fraction ≈ 0.59 [33]) with different ground-state isomerization dynamics [33] and photoisomerization dynamics. The initially large quantum yield of photoconversion is due to the photoisomerization of Ret_580I to Ret_540 and subsequent deprotonation of Ret_540 to Ret_410. The low quantum yield of photoconversion after conversion of Ret_580I is due to the low-efficient photoisomerization of Ret_580II to Ret_640 and subsequent deprotonation to Ret_370. The excitation intensity dependent lowering of ϕcon(texc) for texc > 0 is due to the generation of the photoisomers Ret_540 and Ret_640 and their subsequent back photoisomerization of Ret_540 to Ret_580I and Ret_640 to Ret_580II (see discussion below).
In the top part of Figure 5, the photoconversion of Ret_580 at λexc = 590 nm is displayed for three different excitation intensities. The initial quantum yield of photoconversion (for texc → 0) is excitation intensity independent. It is ϕcon(texc = 0) = ≈ ≈ 0.023 giving ≈ 0.056. After complete photoconversion of Ret_580I (texc > 1 min), the quantum yield of photoconversion is which depends on the photoexcitation intensity. We find = (1.19 ± 0.11) × 10−3, = (1.38 ± 0.084) × 10−4, and = (4.53 ± 0.31) × 10−5. This behavior is thought to be due to the low initial quantum yield of photoconversion and the excitation intensity dependent back photoisomerization of Ret_640 to Ret_580II (see discussion below).
In the middle part of Figure 5, the approximate photoconversion of Ret_580 is displayed for λexc = 530 nm and Iexc = 114.2 mW cm−2. The initial quantum yield of photoconversion is ϕcon(texc = 0) ≈ ≈ 0.0093 giving ≈ 0.023. For λexc = 530 the photoconversion of Ret_580I is lower than that for λexc = 590 nm indicating some excitation wavelength influence on the photoisomerization efficiency. After complete photoconversion of Ret_580I (texc > 0.5 min) the quantum yield of photoconversion is = (2.43 ± 0.143) × 10−5, due to the excitation intensity dependent back photoisomerization of Ret_640 to Ret_580II (see discussion below).
In the bottom part of Figure 5, the photoconversion of Ret_580 is displayed for λexc = 632.8 nm and Iexc = 15.56 mW cm−2. The initial quantum yield of photoconversion is ϕcon(texc = 0) ≈ = 0.023 giving ≈ 0.056, as in the top part of Figure 5. After complete photoconversion of Ret_580I (texc > 1 min), the quantum yield of photoconversion is = (4.48 ± 0.3) × 10−4, due to the excitation intensity dependent back photoisomerization of Ret_640 to Ret_580II (see discussion below).
2.3. Fluorescence Behavior
The excitation wavelength dependent fluorescence emission quantum distributions were measured immediately after excitation light switch-off and after sample recovery in the dark. Obtained fluorescence quantum distributions are shown in Figure S14a,b and fluorescence quantum yields are shown in Figure S15 of Section S2 of the Supplementary Materials for the QuasAr1 sample used in the photocycle experiments of Figure 1a (λexc = 590 nm, Iexc = 64.65 mW cm−2, and texc = 25 min). Immediately after photoexcitation, the fluorescence quantum efficiency in the fluorescence wavelength region of the photoconversion products turned out to be reduced. After long-time recovery in the dark at room temperature, the fluorescence behavior changed over to the fluorescence behavior of the unexposed samples stored for a long time in the dark at room temperature [33].
The emission wavelength dependent fluorescence excitation quantum distributions of photoexcited QuasAr1 samples were determined after sample recovery in the dark at room temperature. Results are shown in Figure S16 of Section S3 of the Supplementary Materials. The fluorescence excitation spectra behaved similar to the unexposed samples stored for a long time in the dark at room temperature.
3. Discussion
The absorption and emission spectroscopic investigation of the thermal dynamics of the Archaerhodopsin 3 based fluorescent voltage sensor QuasAr1 [33] revealed that fresh thawed samples contained, as covalently bound chromophore, dominantly protonated retinal Schiff base (PRSB) Ret_580 (absorption maximum around 580 nm) with minor amounts of a PRSB isomer absorbing around 450 nm and deprotonated retinal Schiff base (RSB) isomers absorbing below 420 nm. Ret_580 was found to be composed of two isomers, Ret_580I of mole fraction ≈ 0.41 (likely having the 13-cis conformation in a specific ApoproteinI structure) and Ret_580II of mole fraction ≈ 0.59 (likely having the all-trans conformation in a specific ApoproteinII structure). The photocycle dynamics of Ret_580 were studied experimentally above in Section 2 and in Section S1 of the Supplementary Materials by observing the absorption spectra development during light exposure and after light exposure. The light excitation wavelength and the light excitation intensity were varied.
From the experimental results, we try to resolve the photocycle dynamics of Ret_580I and Ret_580II and to extract photocycle parameters in the following: The photoexcitation dynamics and the recovery dynamics of Ret_580I were faster than the photoexcitation dynamics and the recovery dynamics of Ret_580II. These dynamics differences allow the separate characterization of the photocycle dynamics of Ret_580I and Ret_580II.
Generally, the photoexcitation of rhodopsins causes retinal spatial cis-trans isomerization [37,38]. In the rhodopsin photocycle, the photoisomerization of protonated retinal Schiff base (PRSB) is followed by deprotonation to neutral retinal Schiff base (RSB), and the cycle is closed by reprotonation and back isomerization [37,38,39,40,41,42].
3.1. Photocycle Dynamics of Ret_580I
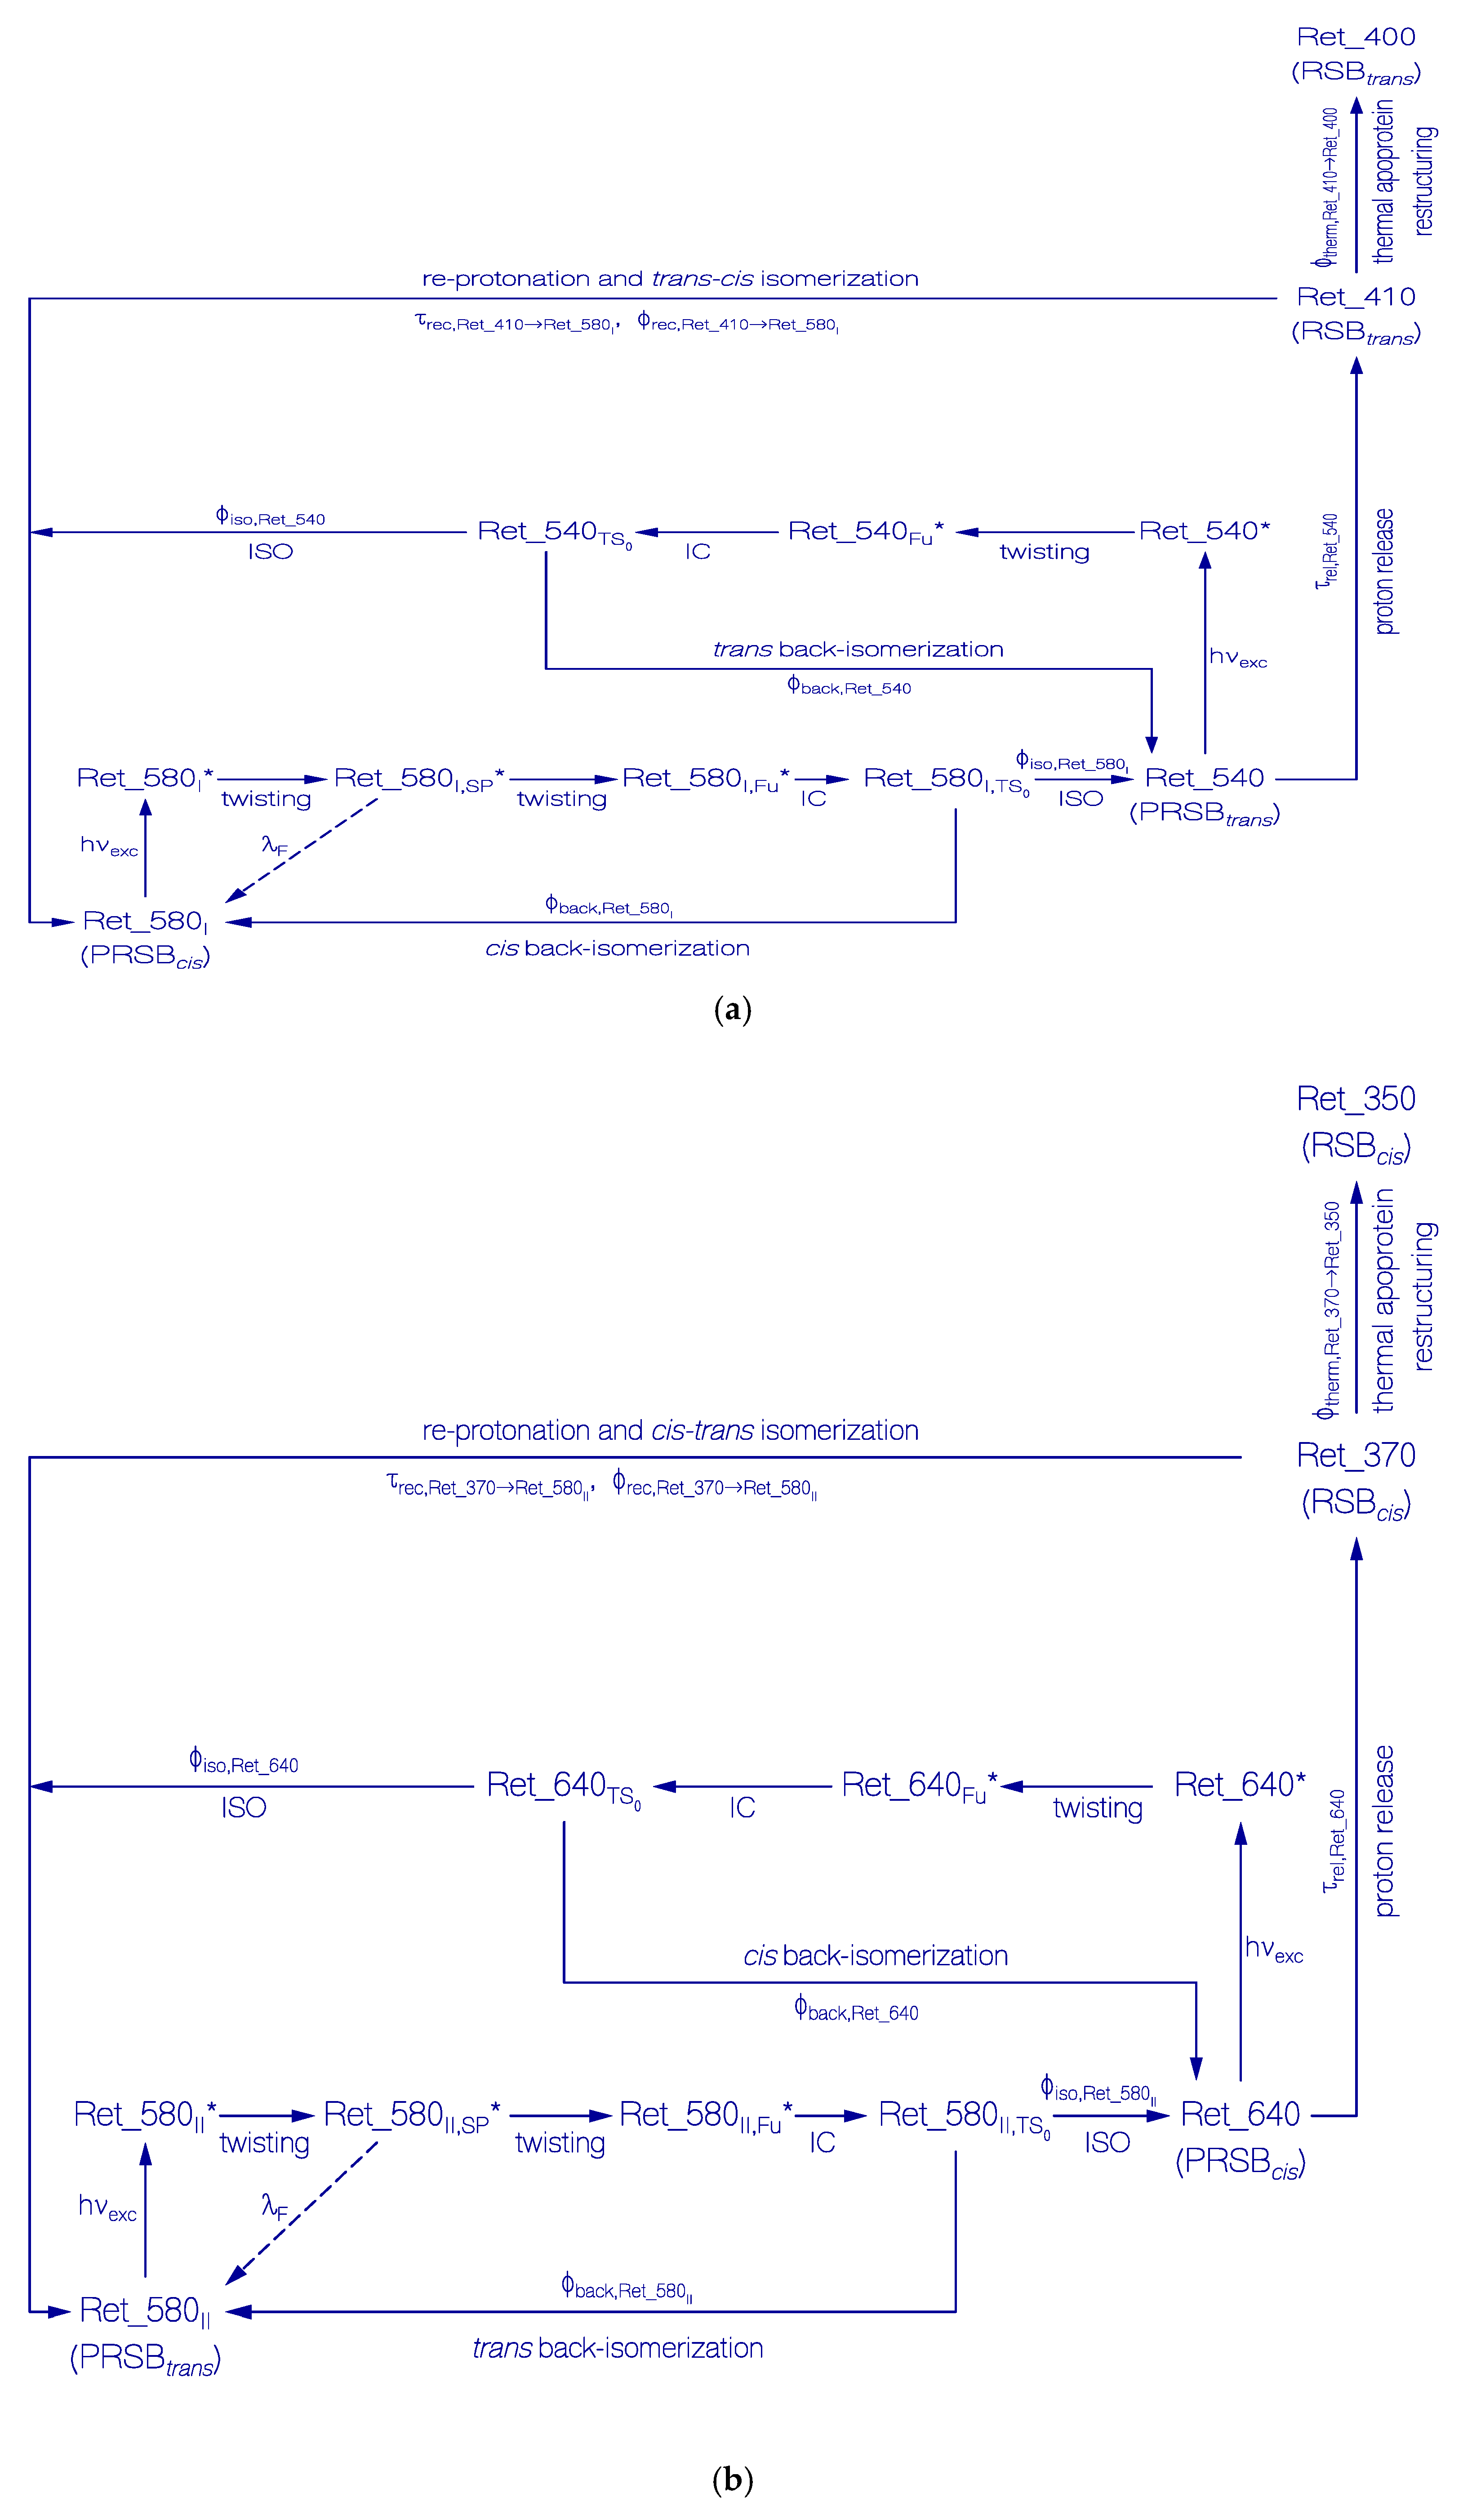
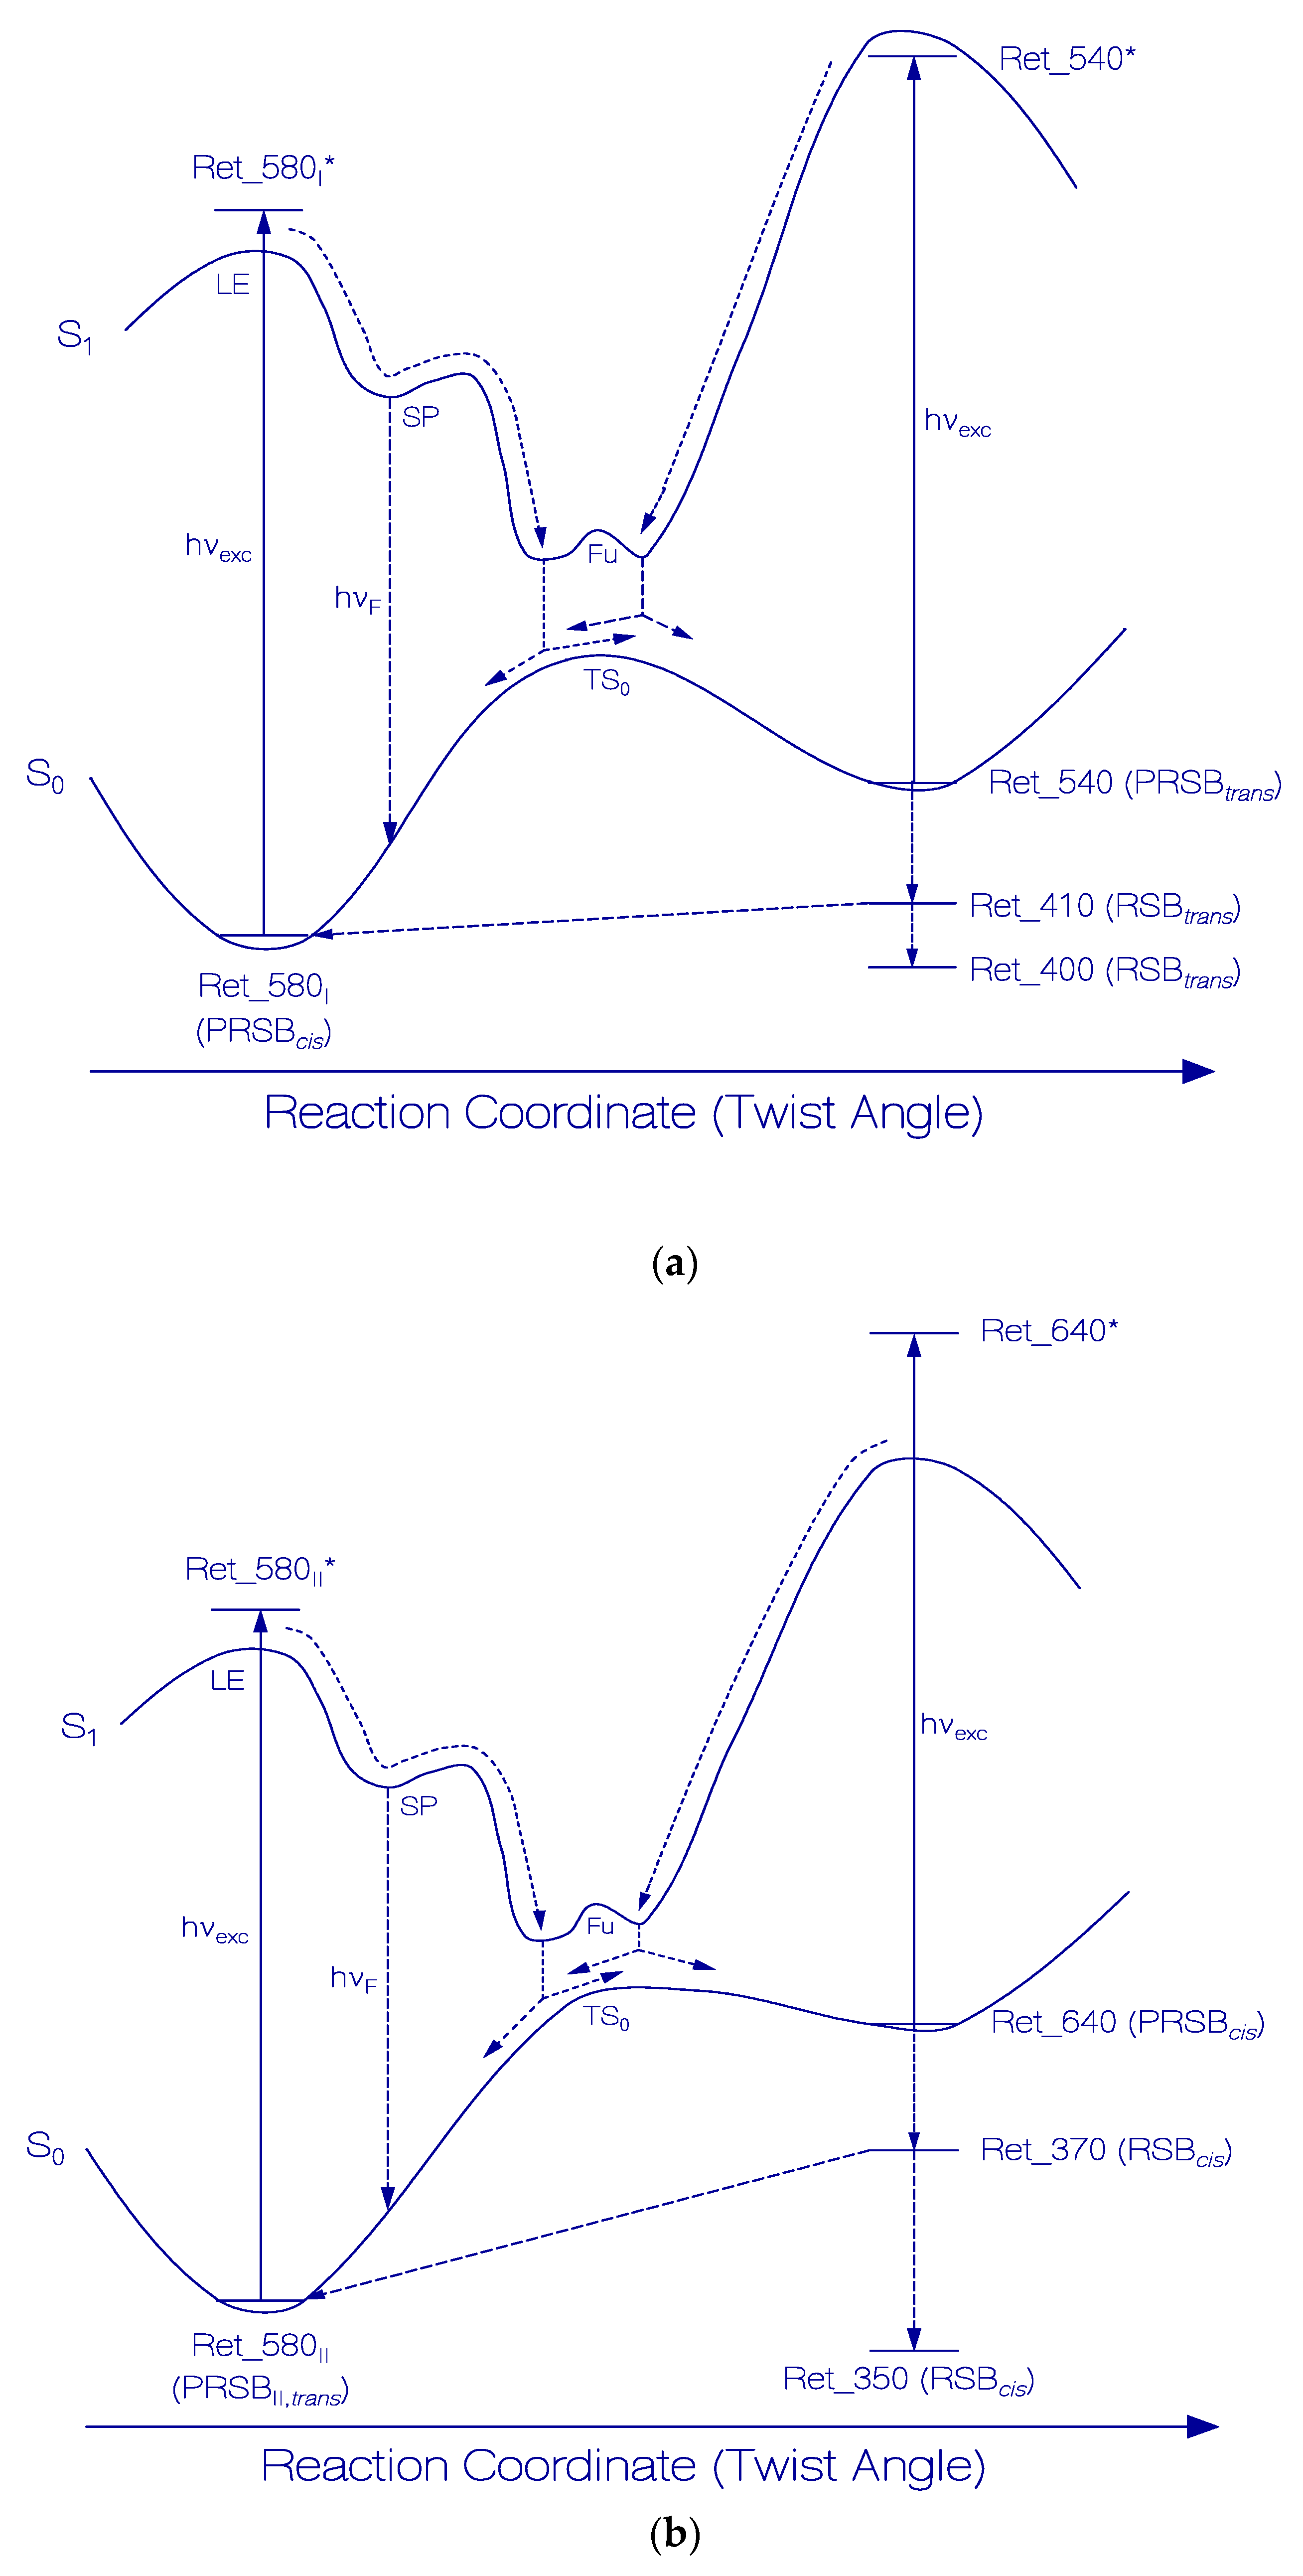
In Figure 6a, a proposed scheme of the photocycle dynamics of the PRSB component Ret_580I is shown, and in Figure 7a the corresponding schematic reaction coordinate diagram is depicted. Light absorption excites Ret_580I in its S0 ground state (likely PRSBcis) to a local excited state position LE in the S1 first excited state (Ret_580I*). From there, the S1 state cis-trans isomerization begins along a torsional reaction coordinate via the stationary point SP (Ret_580I,SP*), and the funnel state Fu (Ret_580I,Fu*) with S1–S0 internal conversion (IC) to the S0 transition state TS0 () and further torsion towards the ground-state isomer Ret_540 (likely PRSBtrans). At the TS0 transition state, there occurs forward trans isomerization to Ret_540 with quantum yield of and cis back isomerization with quantum yield . Continued light exposure causes Ret_540 photoisomerization with excitation to Ret_540*, S1 state twisting to Ret_540Fu*, S1–S0 internal conversion IC to , forward isomerization to Ret_580I (quantum yield ) and back isomerization to Ret_540 (quantum yield ). Ret_540 (PRSBtrans) deprotonates to Ret_410 (RSBtrans) with a relaxation time constant of τrel,Ret_540. Ret_410 partly recovers back to Ret_580I by reprotonation and trans-cis isomerization (recovery time and quantum yield of back recovery ) and it partly relaxes to permanently stable Ret_400 (RSBtrans) caused by thermal apoproteinI restructuring [33]. The quantum yield of Ret_400 formation is = .
The photodynamics of Ret_580I is described in Section S4.1 of the Supplementary Materials. The parameters of the Ret_580I photocycle dynamics derived in the analysis are collected in Table 1.
The speed of Ret_580I cis-trans photoisomerization to Ret_540 is slowed down by a potential energy barrier along the S1 state torsional path from the local excited state LE to the funnel state Fu of internal conversion. The time constant of Ret_580I cis-trans photoisomerization to Ret_540, is of the order of the Ret_580 average Strickler–Berg based fluorescence lifetime [43,44,45] of τF,SB,Ret_580 ≈ 61.5 ps [33] (separate fluorescence lifetimes for Ret_580I and Ret_580II were not determined).
The quantum yield of Ret_580I → Ret_540 photoisomerization was found to be rather small and dependent on the photoexcitation wavelength ( ≈ 0.056, ≈ 0.023). The S1–S0 internal conversion occurs at a reaction coordinate twist angle of less than 90° favoring the back isomerization to the original state ( ≈ 0.944, ≈ 0.977).
The metastable Ret_540 lifetime was found to be τrel,Ret_540 = 39 ± 3 s. Ret_540 deprotonates to Ret_410. During light exposure, the population of Ret_540 accumulates and the light exposure causes photoexcitation and photoisomerization of Ret_540. The data analysis (Section S.4.1 of Supplementary Materials) gives a quantum yield of Ret_540 forward photoisomerization to Ret_580I of ≈ 0.21 and ≈ 0.125. The S1–S0 internal conversion occurs at a reaction coordinate twist angle of slightly larger than 90° favoring the back isomerization to the original Ret_540 state ( ≈ 0.79, ≈ 0.875).
The lifetime of the deprotonated retinal Schiff base Ret_410 after excitation light switch-off depended somewhat on the previous excitation light conditions ( (λexc = 632.8 nm and Iexc = 15.65 mW cm−2) ≈ 2.6 h, (λexc = 530 nm and Iexc = 114.2 mW cm−2) ≈ 0.9 h). Ret_410 recovers partly back to Ret_580I by reprotonation and trans-cis back isomerization ( (λexc = 632.8 nm and Iexc = 15.65 mW cm−2) ≈ 0.38, (λexc = 530 nm and Iexc = 114.2 mW cm−2) ≈ 0.42). This back recovery process is limited by thermal ApoproteinI restructuring, thereby lowering the energy level position of the deprotonated retinal Schiff base (RSBtrans) below the energy level position of Ret_580I [33] (changing of metastable Ret_410 to permanently stable Ret_400 with the quantum yields (λexc = 632.8 nm and Iexc = 15.65 mW cm−2) ≈ 0.62, (λexc = 530 nm and Iexc = 114.2 mW cm−2) ≈ 0.58).
3.2. Photocycle Dynamics of Ret_580II
In Figure 6b, a proposed scheme of the photocycle dynamics the PRSB component Ret_580II is shown. In Figure 7b, the corresponding schematic reaction coordinate diagram is depicted. Light absorption excites Ret_580II in its S0 ground state (likely PRSBtrans) to a local excited state position LE in the S1 first excited state (Ret_580II *). From there, begins the S1 state trans-cis isomerization along a torsional reaction coordinate via the stationary point SP (Ret_580II,SP*), and the funnel state Fu (Ret_580II,Fu*). It follows S1–S0 internal conversion IC to the S0 transition state TS0 () and continued torsion towards the ground-state isomer Ret_640 (likely PRSBcis). At the TS0 transition state, there occurs forward cis isomerization to Ret_640 with a quantum yield of and trans back isomerization with quantum yield of . The continued light exposure causes Ret_640 photoisomerization with excitation to Ret_640*, S1 state twisting to Ret_640Fu*¸ S1–S0 internal conversion IC to , forward isomerization to Ret_580II (quantum yield ), and back isomerization to Ret_640 (quantum yield ). Ret_640 (PRSBcis) deprotonates to Ret_370 (RSBcis) with a relaxation time constant of τrel,Ret_640. Ret_370 partly recovers back to Ret_580II by reprotonation and cis-trans isomerization (recovery time , quantum yield ), and it partly relaxes to permanently stable Ret_350 (RSBcis) caused by thermal apoproteinII restructuring [33]. The quantum yield of Ret_350 formation is .
The photodynamics of Ret_580II is described in Section S4.2 of the Supplementary Materials. The parameters of the Ret_580II photocycle dynamics derived in the analysis there are collected in Table 1.
The speed of Ret_580II trans-cis photoisomerization to Ret_640 slowed down by a potential energy barrier along the S1 state torsional path from the local excited state LE to the funnel state Fu of internal conversion. The time constant of Ret_580II trans-cis photoisomerization to Ret_640, is of the order of the Ret_580 average Strickler–Berg based fluorescence lifetime [43,44,45] of τF,SB,Ret_580 ≈ 61.5 ps [33].
The quantum yield of Ret_580II → Ret_640 photoisomerization was found to be very small ( ≈ 0.00135). The S1–S0 internal conversion occurs at a reaction coordinate twist angle of less than 90° favoring the back isomerization to the original state ( ≈ 0.99865).
The metastable Ret_640 lifetime was found to be τrel,Ret_640 = 17 ± 3 s. Ret_640 deprotonates to Ret_370. During light exposure, Ret_640 is populated and the light exposure causes photoexcitation and photoisomerization of Ret_640. The data analysis (Section S.4.2 of Supplementary Materials) gives a quantum yield of Ret_640 forward photoisomerization to Ret_580II of ≈ 0.12. The S1–S0 internal conversion occurs at a reaction coordinate twist angle of slightly larger than 90° favoring the back isomerization to the original Ret_640 state ( ≈ 0.88).
The lifetime of the deprotonated retinal Schiff base Ret_370 after excitation light switch-off depended somewhat on the previous excitation light conditions ( (λexc = 632.8 nm and Iexc = 15.65 mW cm−2) ≈ 15 h, (λexc = 530 nm and Iexc = 114.2 mW cm−2) ≈ 8 h). Ret_370 recovers partly back to Ret_580II by reprotonation and cis-trans back isomerization ( (λexc = 632.8 nm and Iexc = 15.65 mW cm−2) ≈ 0.43, (λexc = 530 nm and Iexc = 114.2 mW cm−2) ≈ 0.64). This back recovery process is limited by thermal ApoproteinII restructuring, thereby lowering the energy level position of the deprotonated retinal Schiff base (RSBcis) below the energy level position of Ret_580II [33] (changing of metastable Ret_370 to permanently stable Ret_350 with the quantum yields (λexc = 632.8 nm and Iexc = 15.65 mW cm−2) ≈ 0.57, (λexc = 530 nm and Iexc = 114.2 mW cm−2) ≈ 0.36).
3.3. Comparison with Other Rhodopsins
The photocycle dynamics of QuasAr1 turned out to be slow and the quantum yield of photoizmerization was found to be low. In Table S1 of the Supplementary Materials (Section S5) quantum yields of primary photoisomerization of some rhodopsins are collected for comparization. The optimization of QuasAr1 for high fluorescence efficiency and high membrane voltage sensitivity lowered the speed of photocycle dynamics and the efficiency of photoisomerization.
4. Experimental
4.1. Sample Preparation
The sample preparation of QuasAr1 was described in [33]. The buffer contained 50 mM Tris-HCl (pH 8), 150 mM NaCl, 0.02% DDM, 0.004% CHS, 0.1 mM PMSF, and 5% glycerol. The expressed QuasAr1 solution was aliquoted to amounts of 30 μL in Eppendorf tubes, shock-frozen, and stored at −80 °C until they were thawed for experimental investigations. The experiments were carried out at room temperature.
4.2. Spectroscopic Measurements
Transmission measurements, T(λ) (λ is the wavelength), were carried out with a spectrophotometer (Cary 50, Varian Australia Pty Ltd., Mulgrave, Victoria, Australia; wavelength resolution 1.5 nm). Attenuation coefficients, α(λ) = −ln[T(λ)]/l, (l is sample length) were calculated, and absorption coefficients, αa(λ), were determined by subtracting scattering coefficient contributions, αs(λ), according to αa(λ) = α(λ)−αs(λ). The scattering coefficient spectrum was approximated by the empirical relation [46] where the wavelength λ0 is selected in the transparency region and γ ≤ 4 is fitted to the experimental attenuation in the transparency region (for details see [33]).
For the absorption spectroscopic photocycle experiments, QuasAr1 samples were excited with light emitting diodes (LED 590 nm and LED 530 nm from Thorlabs Inc., Newton, NJ, United States) or with a He-Ne laser emitting at 632.8 nm (Model OEM4P, Aerotech Inc., 101 Zeta Drive, Pittsburgh, PA, USA). The sample cell in the spectrophotometer was irradiated transverse to the transmission detection path (exposed area 3 × 5 mm2, sample thickness along excitation path 1.5 mm, and transmission detection path length 3 mm). The excitation power Pexc was measured with a power meter (model PD 300-UV-SH photodiode detector head with NOVA power monitor, Ophir Optronics LTD., Science-based Industrial Park, Hartom St 6, Jerusalem, Israel). In the study of the absorption coefficient spectra development, transmission spectra T(λ) were recorded repeatedly during the period of light exposure and after light switch-off (data interval 1 nm, averaging time 0.0125 s, recording time for a spectrum from 1100 nm to 200 nm was 11.25 s, the spectra repeating time was set to 18 or 30 s during light exposure and to longer intervals in the observation of the absorption recovery after excitation light switch-off). The temporal development of the absorption behavior of QuasAr1 at selected wavelengths was carried out with a temporal resolution of 12.5 ms.
Fluorescence spectroscopic measurements immediately after the end of photoexcitation and after excitation recovery were carried out with a spectrophotometer (Cary Eclipse, Varian Australia Pty Ltd., Mulgrave, Victoria, Australia). Details of the determination of the fluorescence quantum distributions EF(λ), the fluorescence quantum yields ϕF, and the fluorescence excitation quantum distributions Eex(λ) are given in [33]. The fluorescence spectroscopic results are presented in Sections S2 and S3 of the Supplementary Materials.
5. Conclusions
The photocycle dynamics of the Archaerhodopsin 3 based fluorescent voltage sensor QuasAr1 from Halorubrum sodomense was studied in detail. Its dominant protonated retinal Schiff base Ret_580 absorption band around 580 nm was found to consist of two isomers Ret_580I (likely a cis isomer) and Ret_580II (likely a trans isomer) stabilized by different adjacent apoprotein amino acid arrangements. Their slow barrier-involved photoisomerization dynamics in the tens of picosecond regime and the low quantum efficiency of photoisomerization are thought to be responsible for the high fluorescence efficiency and high membrane voltage sensitivity of QuasAr1.
The primary photoisomerization products, Ret_540 (likely PRSBtrans) from the educt Ret_580I, and Ret_640 (likely PRSBcis) from the educt Ret_580II, deprotonate slowly on a time scale of tens of seconds to the neutral retinal Schiff bases Ret_410 and Ret_370, respectively. The long lifetimes of the metastable photoisomers Ret_540 and Ret_640 cause strong excitation intensity dependent back photoisomerization to the primary isomers Ret_580I and Ret_580II.
The reprotonation and back isomerization of the deprotonated retinal Schiff bases Ret_410 Ret_370 to the original isomers Ret_580I and Ret_580II occurred on a timescale of several hours. During this long time period, thermal apoprotein restructuring led to a stabilization of the deprotonated retinal Schiff base isomers, Ret_410 to Ret_400 and Ret_370 to Ret_350, leading to an incomplete recovery to the originals Ret_580I and Ret_580II in the photocycle process.
The performed photocycle studies on QuasAr1 are hoped to be of value for the application of this fluorescent voltage sensor in cell membrane and neuronal function studies.
Supplementary Materials
Supplementary materials can be found at https://0-www-mdpi-com.brum.beds.ac.uk/1422-0067/21/1/160/s1.
Author Contributions
The study was initiated by A.S. and P.H. who expressed, purified and delivered the protein; A.S. carried out initial measurements of the photocycle; A.P. carried out the measurements presented in this paper; The manuscript was written by A.P.; and commented and improved by A.S. and P.H. All authors have read and agreed to the published version of the manuscript.
Funding
This research received no external funding.
Acknowledgments
Alfons Penzkofer thanks Franz J. Gießibl, University of Regensburg, for his kind hospitality. The work was supported by the European Research Council (ERC, MERA project), the DFG Cluster of Excellence “Unifying Systems in Catalysis” EXC314, and the Gottfried Wilhelm Leibniz Prize to Peter Hegemann and Arita Silapetere. Peter Hegemann is supported by the Hertie Foundation.
Conflicts of Interest
The authors declare no conflict of interest.
Abbreviations
| Arch | Archaerhodopsin 3 from Halorubrum sodomense |
| FRET | Förster resonance energy transfer |
| GECI | Genetically encoded calcium indicator |
| GEVI | Genetically encoded voltage indicator |
| PRSB | Protonated retinal Schiff base |
| QuasAr | Quality superior to Arch |
| Ret_xxx | Retinal with absorption maximum approximately at xxx nm |
| RSB | Retinal Schiff base |
| Trp | Tryptophan |
| Tyr | Tyrosine |
| VSD | Voltage sensing domain |
Symbols
| Symbol | Unit | Meaning |
| Eex | Fluorescence excitation quantum distribution | |
| E′ex | cm−1 | Normalized fluorescence excitation quantum distribution |
| EF | nm−1 | Fluorescence emission quantum distribtion |
| I | W cm−2 | Intensity |
| Iexc | W cm−2 | Excitation intensity |
| N | cm−3 | Number density |
| gLED xxx nm | Spectral light distribution of LED xxx nm | |
| nph | cm−3 | Photon number density |
| t | fs, ps, ns, s, min, h, d | Time |
| texc | S | Exposure time |
| wsat | J cm−2 | Saturation energy density |
| Δ | Difference | |
| α | cm−1 | Attenuation coefficent |
| αa | cm−1 | Absorption coefficent |
| αs | cm−1 | Scattering coefficient |
| γ | Empirical scattering exponent | |
| δ | Difference | |
| ϑ | °C | Temperature |
| κ | Mole fraction | |
| λ | Nm | Wavelength |
| λexc | Nm | Excitation wavelength |
| λF | Nm | Fluorescence emission wavelength |
| λF,exc | Nm | Fluorescence excitation wavelength |
| λpr | Nm | Probe wavelength |
| ν | Hz | Frequency |
| cm−1 | Wavenumber | |
| σ | cm2 | Absorption cross-section |
| τF | ps, ns | Fluorescence lifetime |
| τrec | min, h | Recovery time constant |
| τrel | S | Relaxation time constant |
| τsat | S | Saturation time constant |
| ϕ | Quantum yield | |
| ϕcon | Quantum yield of photoconversion | |
| ϕF | Fluorescence quantum yield | |
| ϕiso | Quantum yield of photoisomerization | |
| ϕtherm | Quantum yielf of thermal conversion |
References
- Nakajima, R.; Jung, A.; Yoon, B.-J.; Baker, B.J. Optogenetic monitoring of synaptic activity with genetically encoded voltage indicators. Front. Synaptic Neurosci. 2016, 8, 1–9. [Google Scholar] [CrossRef] [PubMed] [Green Version]
- Xu, Y.; Zou, P.; Cohen, A.E. Voltage imaging with genetically encoded indicators. Curr. Opin. Chem. Biol. 2017, 39, 1–10. [Google Scholar] [CrossRef] [PubMed]
- Knöpfel, T.; Gallero-Salas, Y.; Song, C. Genetically encoded voltage indicators for large scale cortical imaging come of age. Curr. Opin. Chem. Biol. 2015, 27, 75–83. [Google Scholar] [CrossRef] [PubMed]
- Nguyen, C.; Upadhyay, H.; Murphy, M.; Borja, G.; Rozsahegyi, E.M.; Barnett, A.; Brookings, T.; McManus, O.B.; Werley, C.A. Simultanous voltage and calcium imaging and optogenetic stimulation with high sensitivity and a wide field of view. Biomed. Opt. Express 2019, 10, 789–806. [Google Scholar] [CrossRef] [PubMed]
- Bando, Y.; Sakamoto, M.; Kim, S.; Ayzenshtat, I.; Yuste, R. Comparative evaluation of genetically encoded voltage indicators. Cell Rep. 2019, 26, 802–813. [Google Scholar] [CrossRef] [PubMed] [Green Version]
- Kost, L.A.; Ivanova, V.O.; Balaban, P.M.; Lukyanov, K.A.; Nikitin, E.S.; Bogdanov, A.M. Red fluorescent genetically encoded voltage indicators with millisecond responsiveness. Sensors 2019, 19, 2982. [Google Scholar] [CrossRef] [PubMed] [Green Version]
- Bando, Y.; Grimm, C.; Cornejo, V.H.; Yuste, R. Genetic voltage indicators. BMC Biol. 2019, 17, 71. [Google Scholar] [CrossRef]
- Panzera, L.C.; Hoppa, M.B. Genetically encoded voltage indicators are illuminating subcellular physiology of the axon. Front. Cell. Neurosci. 2019, 13, 52. [Google Scholar] [CrossRef] [Green Version]
- Kralji, J.M.; Hochbaum, D.R.; Douglass, A.D.; Cohen, A.E. Electrical spiking in Escherichia coli probed with a fluorescent voltage-indicating protein. Science 2011, 333, 345–348. [Google Scholar] [CrossRef]
- Nadeau, J.L. Initial photophysical characterization of the proteorhodopsin optical proton sensor (PROPS). Front. Neurosci. 2015, 9, 315. [Google Scholar] [CrossRef] [Green Version]
- Tsytsarev, V.; Liao, L.-D.; Kong, K.V.; Liu, Y.-H.; Erzurumlu, R.S.; Olivo, M.; Nitish, N.V. Recent progress in voltage-sensitive dye imaging for neuroscience. J. Nanosci. Nanotechnol. 2014, 14, 4733–4744. [Google Scholar] [CrossRef] [PubMed]
- Abdelfattah, A.S.; Kawashima, T.; Singh, A.; Novak, O.; Liu, H.; Shuai, Y.; Huang, Y.-C.; Campagnola, L.; Seeman, S.C.; Yu, J.; et al. Bright and photostable chemigenetic indicators for extended in vivo voltage imaging. Science 2019, 364, 699–704. [Google Scholar] [CrossRef] [PubMed]
- Ortiz, G.; Liu, P.; Naing, S.H.H.; Muller, V.R.; Miller, E.W. Synthesis of sulfonated carbofluoresceins for voltage imaging. J. Am. Chem. Soc. 2019, 141, 6631–6638. [Google Scholar] [CrossRef]
- Mank, M.; Griesbeck, O. Genetically encoded calcium indicators. Chem. Rev. 2008, 108, 1550–1564. [Google Scholar] [CrossRef]
- Zhong, C.; Schleifenbaum, J. Genetically encoded calcium indicators: A new tool in renal hypertension research. Front. Med. 2019, 6, 128. [Google Scholar] [CrossRef] [Green Version]
- Siegel, M.S.; Isacoff, E.Y. A genetically encoded optical probe of membrane voltage. Neuron 1997, 19, 735–741. [Google Scholar] [CrossRef] [Green Version]
- Mutoh, H.; Akemann, W.; Knöpfel, T. Genetically engineered fluorescent voltage reporters. ACS Chem. Neurosci. 2012, 3, 585–592. [Google Scholar] [CrossRef] [Green Version]
- St-Pierre, F.; Chavarha, M.; Lin, M.Z. Design and sensing mechanisms of genetically encoded fluorescent voltage indicators. Curr. Opin. Chem. Biol. 2015, 27, 31–38. [Google Scholar] [CrossRef] [Green Version]
- Yi, B.; Kang, B.E.; Lee, S.; Braubach, S.; Baker, B.J. A dimeric fluorescent protein yields a bright, red-shifted GEVI capable of population signals in brain slice. Sci. Rep. 2018, 8, 15199. [Google Scholar] [CrossRef]
- Jin, L.; Han, Z.; Plasisa, J.; Wooltorton, J.R.A.; Cohen, L.B.; Pieribone, V.A. Single action potentials and subthreshold electrical events imaged in neurons with a novel fluorescent protein voltage probe. Neuron 2012, 75, 779–785. [Google Scholar] [CrossRef] [Green Version]
- Gong, Y. The evolving capabilities of rhodopsin-based genetically encoded voltage indicators. Curr. Opin. Chem. Biol. 2015, 27, 84–89. [Google Scholar] [CrossRef] [PubMed] [Green Version]
- Venkatachalam, V.; Brinks, D.; Maclaurin, D.; Hochbaum, D.R.; Kralj, J.M.; Cohen, A.E. Flash memory: Photochemical imprinting of neuronal action potentials onto a microbial rhodopsin. J. Am. Chem. Soc. 2014, 136, 2529–2537. [Google Scholar] [CrossRef] [PubMed]
- Hashemi, N.A.; Bergs, A.C.F.; Schüler, C.; Scheiwe, A.R.; Costa, W.S.; Bach, M.; Liewald, J.F.; Gottschalk, A. Rhodopsin-based voltage imaging tools for use in muscles and neurons of Caenorhabditis elegans. Proc. Natl. Acad. Sci. USA 2019, 116, 17051–17060. [Google Scholar] [CrossRef] [Green Version]
- Gong, Y.; Huang, C.; Li, J.Z.; Grewe, B.F.; Zhang, Y.; Eismann, S.; Schintzer, M.J. High-speed recording of neural spikes in awake mice and flies with a fluorescent voltage sensor. Science 2015, 350, 1361–1366. [Google Scholar] [CrossRef] [Green Version]
- Kannan, M.; Vasan, G.; Huang, C.; Haziza, S.; Li, J.Z.; Inan, H.; Schnitzer, M.J.; Pieribone, V.A. Fast, in vivo voltage imaging using red fluorescent indicator. Nat. Method 2018, 15, 1108–1116. [Google Scholar] [CrossRef]
- Hochbaum, D.R.; Zhao, Y.; Farhi, S.L.; Klapoetke, N.; Werley, C.A.; Kapoor, V.; Zou, P.; Kralj, J.M.; Maclaurin, D.; Smedemark-Margulies, N.; et al. All-optical electrophysiology in mammalian neurons using engineered microbial rhodopsins. Nat. Methods 2014, 11, 825–833. [Google Scholar] [CrossRef] [Green Version]
- Lou, S.; Adam, Y.; Weinstein, E.N.; Williams, E.; Williams, K.; Parot, V.; Kavokine, N.; Liberles, S.; Madisen, L.; Zeng, H.; et al. Genetically targeted all-optical electrophysiology with a transgenic Cre-dependent Optopatch mouse. J. Neurosci. 2016, 36, 11059–11073. [Google Scholar] [CrossRef]
- Adam, Y.; Kim, J.J.; Lou, S.; Zhao, Y.; Xie, M.E.; Brinks, D.; Wu, H.; Mostajo-Radji, M.A.; Kheifets, S.; Parot, V.; et al. Voltage imaging and optogenetics reveal behaviour-dependent changes in hippocampal dynamics. Nature 2019, 569, 413–417. [Google Scholar] [CrossRef] [Green Version]
- Kralj, J.M.; Douglass, A.D.; Hochbaum, D.R.; Maclaurin, D.; Cohen, A.E. Optical recording of action potentials in mammalian neurons using microbial rhodopsin. Nat. Methods 2012, 9, 90–95. [Google Scholar] [CrossRef] [Green Version]
- Gong, Y.; Li, J.Z.; Schnitzer, M.J. Enhanced Archaerhodopsin fluorescent protein voltage indicators. PLoS ONE 2013, 8, e66959. [Google Scholar] [CrossRef]
- Flytzanis, N.C.; Bedbrook, C.N.; Engqvist, M.K.M.; Xiao, C.; Chan, K.Y.; Sternberg, P.W.; Arnold, F.H.; Gradinaru, V. Archaerhodopsin variants with enhanced voltage-sensitive fluorescence in mammalian and Caenorhabditis elegans neurons. Nat. Commun. 2014, 5, 4894. [Google Scholar] [CrossRef] [Green Version]
- Piatkevich, K.D.; Jung, E.E.; Straub, C.; Linghu, C.; Park, D.; Suk, H.J.; Hochbaum, D.R.; Goodwin, D.; Pnevmatikakis, E.; Pak, N.; et al. A robotic multidimensional directed evolution approach applied to fluorescent voltage reporters. Nat. Chem. Biol. 2018, 14, 352–360. [Google Scholar] [CrossRef] [PubMed]
- Penzkofer, A.; Silapetere, A.; Hegemann, P. Absorption and emission spectroscopic investigation of the thermal dynamics of the Archaerhodopsin 3 based fluorescent voltage sensor QuasAr1. Int. J. Mol. Sci. 2019, 20, 4086. [Google Scholar] [CrossRef] [PubMed] [Green Version]
- Eichler, H.J.; Günter, P.; Pohl, D.W. Laser-Induced Dynamic Gratings; Springer: Berlin/Heidelberg, Germany, 1986; pp. 38–93. [Google Scholar]
- Käding, O.W.; Skurk, H.; Maznev, A.A.; Matthias, E. Transient thermal gratings at surfaces for thermal characterization of bulk materials and thin films. Appl. Phys. A 1995, 61, 253–261. [Google Scholar] [CrossRef]
- Zirak, P.; Penzkofer, A.; Lehmpfuhl, C.; Mathes, T.; Hegemann, P. Absorption and emission spectroscopic characterization of blue-light receptor Slr1694 from Synechocystis sp. PCC6803. J. Photochem. Photobiol. B Biol. 2007, 86, 22–34. [Google Scholar] [CrossRef]
- Ernst, O.P.; Lodowski, D.T.; Elstner, M.; Hegemann, P.; Brown, L.S.; Kandori, H. Microbial and animal rhodopsins: Structures, functions, and molecular mechanisms. Chem. Rev. 2014, 114, 126–163. [Google Scholar] [CrossRef]
- Penzkofer, A.; Hegemann, P.; Kateriya, S. Organic dyes in optogenetics. In Organic Lasers and Organic Photonics; Duarte, F.J., Ed.; IOP Publishing: Bristol, UK, 2018; pp. 13-1–13-114. [Google Scholar]
- Longstaff, C.; Calhoon, R.D.; Rando, R.R. Deprotonation of the Schiff base of rhodopsin is obligate in the activation of the G protein. Proc. Natl. Acad. Sci. USA 1986, 83, 4209–4213. [Google Scholar] [CrossRef] [Green Version]
- Lanyi, J.K.; Schobert, B. Crystallographic structure of the retinal and the protein after deprotonation of the Schiff base: The switch in the bacteriorhodopsin photocycle. J. Mol. Biol. 2002, 321, 727–737. [Google Scholar] [CrossRef]
- Kubli-Garfias, C.; Salazar-Salinas, K.; Perez-Angel, E.C.; Seminario, J.M. Light activation of the isomerization and deprotonation of the protonated Schiff base retinal. J. Mol. Model. 2011, 17, 2539–2547. [Google Scholar] [CrossRef]
- Lanyi, J.K. Bacteriorhodopsin. Annu. Rev. Physiol. 2004, 66, 665–688. [Google Scholar] [CrossRef]
- Strickler, S.J.; Berg, R.A. Relationship between absorption intensity and fluorescence lifetime of molecules. J. Chem. Phys. 1962, 37, 814–822. [Google Scholar] [CrossRef] [Green Version]
- Birks, J.B.; Dyson, D.J. The relations between the fluorescence and absorption properties of organic molecules. Proc. R. Soc. Lond. Ser. A 1963, 275, 135–148. [Google Scholar]
- Deshpande, A.V.; Beidoun, A.; Penzkofer, A.; Wagenblast, G. Absorption and emission spectroscopic investigation of cyanovinyldiethylaniline dye vapors. Chem. Phys. 1990, 142, 123–131. [Google Scholar] [CrossRef] [Green Version]
- Penzkofer, A.; Shirdel, J.; Zirak, P.; Breitkreuz, H.; Wolf, E. Protein aggregation studied by forward light scattering and transmission analysis. Chem. Phys. 2007, 342, 55–63. [Google Scholar] [CrossRef]
Figure 1.
(a) Development of absorption coefficient spectra of a QuasAr1 sample in pH 8 Tris buffer during light exposure with LED 590 nm with input excitation intensity of Iexc = 64.65 mW cm−2. The durations of light exposure are listed in the figure. The triple dotted curve named Ret_580 (texc = 0) in the wavelength range >310 nm shows the absorption coefficient contribution of Ret_580 to QuasAr1 before light exposure (taken from Figure 1 in [33]). The dashed triple-dotted curve named Residuals shows the absorption coefficient contribution of residual retinal isomers in QuasAr1 other than Ret_580 (taken from Figure 1 in [33]). The curve gLED 590 nm (λ) = SLED 590 nm (λ)/SLED 590 nm (λmax) shows the spectral distribution of the excitation light source LED 590 nm. The inset shows the temporal dependence of αa (620 nm) versus exposure time texc. The data points are fitted by with αa(0) = 1.554 cm−1, ΔαI = 0.436 cm−1, τsat,I = 0.015 min, ΔαII = 1.03 cm−1, and τsat,II = 8.65 min. (b) Absorption coefficient spectra of formed species of QuasAr1 in pH 8 Tris buffer due to light exposure with LED 590 nm of input intensity Iexc = 64.65 mW cm−2. The absorption contributions of Ret_580, αaRet_580 (λ, texc), and of the initial residuals, αa,Residuals(λ,0), from (a) are subtracted, i.e., . The approximate peak wavelength positions of the retinal isomers Ret_640, Ret_540, Ret_460, Ret_410, and Ret_370 are indicated at the bottom. The inset shows the temporal development of Δαa at λpr = 540 nm, 460 nm, 410 nm, and 370 nm versus exposure time texc.


Figure 2.
Attenuation coefficient spectra recovery of QuasAr1 in pH 8 Tris buffer after light exposure with LED 590 nm (input excitation intensity Iexc = 64.65 mW cm−2) for an exposure time of texc = 25 min (see Figure 1a). The durations of recovery trec are listed in the Figure. The attenuation coefficient spectra before exposure (texc = 0) and at end of exposure (texc = 25 min) are included. The inset shows the attenuation coefficient recovery α (trec) at λpr = 580 nm and 370 nm.

Figure 3.
(a) Absorption coefficient spectra recovery of QuasAr1 in pH 8 Tris buffer after light exposure with LED 590 nm (input excitation intensity Iexc = 64.65 mW cm−2) for an exposure time of texc = 25 min (see Figure 1a). Immediately after the end of exposure, fluorescence emission spectra were measured. The durations of recovery trec are listed in the figure. The absorption coefficient spectra before exposure (texc = 0) and at the end of exposure (texc = 25 min) are included. The inset shows the absorption coefficient recoveries αa(trec) at λpr = 580 nm and 370 nm. The data points are fitted by with αa (0,580 nm) = 0.22 cm−1, ΔαI(580 nm) = 0.71 cm−1, τrec,I(580 nm) = 1.52 h, ΔαII(580 nm) = 0.376 cm−1, τrec,II(580 nm) = 19.26 h, αa(0,370 nm) = 1.15 cm−1, ΔαI(370 nm) = −0.195 cm−1, τrec,I(370 nm) = 2.96 h, ΔαII(370 nm) = −0.358 cm−1, and τrec,II(370 nm) = 26.7 h. (b) Absorption coefficient difference spectra development of QuasAr1 in pH 8 Tris buffer after light exposure with LED 590 nm of input intensity Iexc = 64.65 mW cm−2 for 25 min. The inset shows the temporal development of Δαa at λpr = 640 nm, 540 nm, 460 nm, 410 nm, and 370 nm versus recovery time trec.


Figure 4.
Temporal absorption coefficient development of QuasAr1 in pH 8 Tris buffer at the probe wavelengths λpr = 580 nm (top part, peak absorption of Ret_580), 530 nm (middle part, near peak absorption of Ret_540), and 370 nm (bottom part, peak absorption of Ret_370) before, during, and after photoexcitation with LED 590 nm of excitation intensity Iexc = 64.65 mW cm−2 for a duration of texc = 1.5 s. The same sample was used. Immediately after measurement at λpr = 580 nm, the measurement was continued at λpr = 530 nm, and then, at λpr = 370 nm. In the top left subfigure, the data points during light exposure are fitted by with αa(0) = 2.34 cm−1, Δαa,I = 0.172 cm−1, τI = 116 ms, Δαa,II = 0.245 cm−1, and τII = 907 ms. A fit of the right part of the middle subfigure with gives αa(texc,end) = 1.284 cm−1, Δαa = 0.0425 cm−1, and τrel,Ret_540 = 37 s. A fit of the right part of the bottom subfigure with gives αa(texc,end) = 0.571 cm−1, Δαa = 0.017 cm−1, and τrel,Ret_640 = 19.3 s.

Figure 5.
Quantum yield of photoconversion ϕcon of Ret_580 of QuasAr1 in pH 8 Tris buffer to other retinal isomers during light exposure. (Top part) Photoexcitation with LED 590 nm using listed input light intensities (values derived from Figure 1a, Figures S1a and S4a). (Middle part) Photoexcitation with LED 530 nm using excitation intensity of Iexc = 114.2 mW cm−2 (values derived from Figure S6a). (Bottom part) Photoexcitation with He-Ne laser using Iexc = 15.56 mW cm−2 (values derived from Figure S10a). The curves in the insets are derived from the high time resolution absorption measurements (top part of Figure 4 for λexc = 590 nm, top part of Figure S9 for λexc = 530 nm, and top part of Figure S13 for λexc = 632.8 nm).

Figure 6.
Schemes of photocycle dynamics of retinal components Ret_580I (a) and Ret_580II (b) of QuasAr1 in pH 8 Tris buffer. IC, internal conversion and ISO, isomerization.
Figure 6.
Schemes of photocycle dynamics of retinal components Ret_580I (a) and Ret_580II (b) of QuasAr1 in pH 8 Tris buffer. IC, internal conversion and ISO, isomerization.

Figure 7.
Schematic reaction coordinate diagrams for Ret_580I (a) and Ret_580II (b) photocycles of QuasAr1 in pH 8 Tris buffer.
Figure 7.
Schematic reaction coordinate diagrams for Ret_580I (a) and Ret_580II (b) photocycles of QuasAr1 in pH 8 Tris buffer.


Table 1.
Photodynamics parameters of QuasAr1 in pH 8 Tris buffer.
| Parameter | Value | Comments |
|---|---|---|
| ≈0.41 | [33] | |
| ≈0.59 | [33] | |
| λF,max,Ret_580 (nm) | ≈740 | [33] |
| τF,SB,Ret_580 (ps) | ≈61.5 | [33] |
| (590 nm) | 0.056 | Figure 5 and Equation (S23) |
| (530 nm) | 0.023 | Figure 5 and Equation (S23) |
| (590 nm) | 0.00135 | Figure 5 and Equation (S36) |
| (590 nm) | ≈0.21 | Figure 5 and Equation (S25) |
| (530 nm) | ≈0.125 | Figure 5 and Equation (S25) |
| (590 nm) | ≈0.12 | Figure 5 and Equation (S37) |
| τrel,Ret_540 (s) | 39 ± 3 | Middle part of Figure 4 and Figure S9 |
| τrel,Ret_640 (s) | 17 ± 3 | Bottom part of Figure 4 and Figure S9 |
| (632.8 nm) (h) | ≈2.6 | Inset of Figure S12 for λpr = 580 nm (λexc = 632.8 nm and Iexc = 15.65 mW cm−2) |
| (530 nm) (h) | ≈0.9 | Inset of Figure S8 for λpr = 580 nm (λexc = 530 nm and Iexc = 114.2 mW cm−2) |
| (632.8 nm) (h) | ≈15 | Inset of Figure S12 for λpr = 580 nm (λexc = 632.8 nm and Iexc = 15.65 mW cm−2) |
| (530 nm) (h) | ≈8 | Inset of Figure S8 for λpr = 580 nm (λexc = 530 nm and Iexc = 114.2 mW cm−2) |
| (632.8 nm) | ≈0.38 | Figure S12 and Equation (S28) |
| (530 nm) | ≈0.42 | Figure S8 and Equation (S28) |
| (632.8 nm) | ≈0.62 | Figure S12 and Equation (S29) |
| (530 nm) | ≈0.58 | Figure S8 and Equation (S29) |
| (632.8 nm) | ≈0.43 | Figure S12 and Equation (S39) |
| (530 nm) | ≈0.64 | Figure S8 and Equation (S39) |
| (632.8 nm) | ≈0.57 | Figure S12 and Equation (S40) |
| (530 nm) | ≈0.36 | Figure S8 and Equation (S40) |
Abbreviations: , fraction of Ret_580I in Ret_580; , fraction of Ret_580II in Ret_580; λF,max,Ret_580, wavelength position of maximum fluorescence emission of Ret_580; τF,SB,Ret_580, Strickler-Berg based average fluorescence lifetime of Ret_580; , quantum yield of photoisomerization of Ret_580I; , quantum yield of photoisomerization of Ret_580II; , quantum yield of photoisomerization of Ret_540; , quantum yield of photoisomerization of Ret_640; τrel,Ret_540, relaxation time constant of Ret_540; τrel,Ret_640, relaxation time constant of Ret_640; recovery time constant of Ret_410 to Ret_580I; recovery time constant of Ret_370 to Ret_580II; , quantum yield of recovery of Ret_410 to Ret_580I; , quantum yield of recovery of Ret_370 to Ret_580II; , quantum yield of thermal conversion of Ret_410 to Ret_400; and , quantum yield of thermal conversion of Ret_370 to Ret_350.
© 2019 by the authors. Licensee MDPI, Basel, Switzerland. This article is an open access article distributed under the terms and conditions of the Creative Commons Attribution (CC BY) license (http://creativecommons.org/licenses/by/4.0/).
Share and Cite
MDPI and ACS Style
Penzkofer, A.; Silapetere, A.; Hegemann, P. Photocycle Dynamics of the Archaerhodopsin 3 Based Fluorescent Voltage Sensor QuasAr1. Int. J. Mol. Sci. 2020, 21, 160. https://0-doi-org.brum.beds.ac.uk/10.3390/ijms21010160
AMA Style
Penzkofer A, Silapetere A, Hegemann P. Photocycle Dynamics of the Archaerhodopsin 3 Based Fluorescent Voltage Sensor QuasAr1. International Journal of Molecular Sciences. 2020; 21(1):160. https://0-doi-org.brum.beds.ac.uk/10.3390/ijms21010160
Chicago/Turabian StylePenzkofer, Alfons, Arita Silapetere, and Peter Hegemann. 2020. "Photocycle Dynamics of the Archaerhodopsin 3 Based Fluorescent Voltage Sensor QuasAr1" International Journal of Molecular Sciences 21, no. 1: 160. https://0-doi-org.brum.beds.ac.uk/10.3390/ijms21010160
Note that from the first issue of 2016, this journal uses article numbers instead of page numbers. See further details here.