Article

Histone Deacetylase (HDAC) Gene Family in Allotetraploid Cotton and Its Diploid Progenitors: In Silico Identification, Molecular Characterization, and Gene Expression Analysis under Multiple Abiotic Stresses, DNA Damage and Phytohormone Treatments

by
Muhammad Imran
1,2,
Sarfraz Shafiq
1,3,*,
Muhammad Kashif Naeem
2,
Emilie Widemann
4,
Muhammad Zeeshan Munir
5,
Kevin B. Jensen
6 and
Richard R.-C. Wang
6,*
1
School of Life Sciences, Tsinghua University, Beijing 100084, China
2
State Key Laboratory of Plant Cell and Chromosome Engineering, Institute of Genetics and Developmental Biology, Chinese Academy of Sciences, Beijing 100101, China
3
Department of Environmental Sciences, COMSATS University Islamabad, Abbottabad Campus, Abbottabad 22060, Pakistan
4
Department of Biology, University of Western Ontario, 1151 Richmond St, London, ON N6A5B8, Canada
5
Beijing Advanced Innovation Center for Tree Breeding by Molecular Design, National Engineering Laboratory for Tree Breeding, Key Laboratory of Genetics and Breeding in Forest Trees and Ornamental Plants, College of Biological Sciences and Technology, Beijing Forestry University, Beijing 100083, China
6
Forage & Range Research, United States Department of Agriculture, Agricultural Research Service, Logan, UT 84322, USA
*
Authors to whom correspondence should be addressed.
Int. J. Mol. Sci. 2020, 21(1), 321; https://0-doi-org.brum.beds.ac.uk/10.3390/ijms21010321
Submission received: 4 December 2019 / Revised: 31 December 2019 / Accepted: 1 January 2020 / Published: 3 January 2020
(This article belongs to the Special Issue Abiotic Stress and Gene Networks in Plants 2020)

Abstract

:
Histone deacetylases (HDACs) play a significant role in a plant’s development and response to various environmental stimuli by regulating the gene transcription. However, HDACs remain unidentified in cotton. In this study, a total of 29 HDACs were identified in allotetraploid Gossypium hirsutum, while 15 and 13 HDACs were identified in Gossypium arboretum and Gossypium raimondii, respectively. Gossypium HDACs were classified into three groups (reduced potassium dependency 3 (RPD3)/HDA1, HD2-like, and Sir2-like (SRT) based on their sequences, and Gossypium HDACs within each subgroup shared a similar gene structure, conserved catalytic domains and motifs. Further analysis revealed that Gossypium HDACs were under a strong purifying selection and were unevenly distributed on their chromosomes. Gene expression data revealed that G. hirsutum HDACs were differentially expressed in various vegetative and reproductive tissues, as well as at different developmental stages of cotton fiber. Furthermore, some G. hirsutum HDACs were co-localized with quantitative trait loci (QTLs) and single-nucleotide polymorphism (SNPs) of fiber-related traits, indicating their function in fiber-related traits. We also showed that G. hirsutum HDACs were differentially regulated in response to plant hormones (abscisic acid (ABA) and auxin), DNA damage agent (methyl methanesulfonate (MMS)), and abiotic stresses (cold, salt, heavy metals and drought), indicating the functional diversity and specification of HDACs in response to developmental and environmental cues. In brief, our results provide fundamental information regarding G. hirsutum HDACs and highlight their potential functions in cotton growth, fiber development and stress adaptations, which will be helpful for devising innovative strategies for the improvement of cotton fiber and stress tolerance.

1. Introduction

Cotton is the most important crop worldwide that has contributed a lot for the textile industry through its natural and renewable fiber. Gossypium hirsutum is a principal source of commercial cotton production [1], and thus holds a significant value in the world economy. G. hirsutum, a natural allotetraploid (AADD, 2n = 4x = 52), originated approximately 1–2 million years ago from the interspecific hybridization between the diploid A genome Gossypium arboretum (AA, 2n = 2x = 26) and D genome Gossypium raimondii (DD, 2n = 2x = 26) [2,3]. In addition to its economic value, cotton is a model system for plant polyploidy, cell elongation and cell wall biosynthesis [4,5,6]. A fluctuating climate adversely affects cotton yield and fiber quality, and thus motivates us to explore the strategies that can combat environmental stresses and produce high quality fiber [7,8]. The available genomic data on G. hirsutum [9,10], G. arboretum [11] and G. raimondii [12] provide an excellent platform to identify the new candidate genes that can confer resistance to biotic and abiotic stresses, and produce high-quality fiber. Attempts have been made to identify different genes; however, the identification of epigenetic regulators in cotton and their involvement in fiber development and stress adaptation is very limited.
Plants use several epigenetic modifications, including post-transcriptional histone modifications and DNA methylation, to tightly govern the gene expression and phenotypic plasticity [13,14,15]. Histones are subjected to numerous covalent modifications, including acetylation, methylation, ubiquitination, and sumoylation, which impact the gene expression by recruiting the histone writers, erasers and readers [14]. Histone acetylation is the addition of an acetyl group to the N-terminal of histones, and is a mark of transcriptional activation in eukaryotes. Histone acetylation has been reported in different lysine residues of histones, e.g., H3 (K4, K9, K14, K18, K23, K27), H4 (K5, K8, K12, K16) and H2B (K5, K12, K15, K20) [16]. Histone deacetylases (HDACs) maintain the homeotic balance of histone acetylation by removing the acetyl group and are linked to transcriptional repression and gene silencing. HDACs are well conserved in different organisms, including human, yeast and plants, and are generally classified into three distinct groups in plants; the reduced potassium dependency 3 (RPD3/HDA1) superfamily, the HD2-like family, and the silent information regulator 2 (SIR2) family [17]. HD2-like family is plant specific. The number of HDAC genes are variable among different plants. For example; Arabidopsis thaliana [18] and rice (Oryza sativa) [19] contain 18 HDACs, soybean (Glycine max) contains 24 HDACs [20], Vitis vinifera contains 13 [21], litchi (Litchi chinensis Sonn. cv. Feizixiao) contains 11 [22], while maize (Zea mays) and tomato (Solanum lycopersicum) contain 15 HDACs [23,24].
In Arabidopsis, HDACs play an important role in the response to different stresses, as well as in plant development [18,25,26,27]. Arabidopsis HDA6 is involved in drought stress tolerance [28] and regulates the jasmonate-associated stress response [29,30]. The Athda9 mutant showed enhanced tolerance to salt and drought stress, indicating that HDA9 may act as a negative repressor of the plant’s stress response [31,32,33]. Overexpression of HD2D/C in Arabidopsis showed an increased tolerance to drought and salt stress [34,35]. In rice, overexpression of OsHDT701 also resulted in increased tolerance to drought and salt stress [36,37]. In contrast, overexpression of OsHDA705 in rice showed a decreased salt and abscisic acid (ABA) stress tolerance during seed germination [38]. After a short-day treatment, the transcriptional dynamics of the leaf and shoot apical meristem were compared in soybean [20], and the results showed that the expression of several HDACs was altered during the floral initiation process. For example; the expression of HD2 members Glyma12g30600.1 and Glyma12g09000.1 was decreased with a short-day treatment. In tomato, SlHDA1, SlHDA3 and SlHDA4, belonging to the RPD3/HDA1 family, were shown to interact with tomato agamous 1 (TAG1) and tomato MADS BOX 29 (TM29), which are associated with reproductive development [23]. These studies indicate the diversity and specificity of HDACs in plant stress response and development. Interestingly, HDACs from the HD2-like family interacts with the RPD3/HDA1 family members [39], suggesting that multiple HDACs participate in multi-protein complexes to regulate the gene expression. HDACs also interact with other epigenetics regulators, suggesting HDACs may act in combination with other chromatin regulators to landscape the transcription. For example, HDA6 interacts with DNA methyltransferase MET1 [40], histone demethylase Flowering Locus D (FLD) [41], and histone methyltransferases SUPPRESSOR OF VARIEGATION 3-9 HOMOLOG 4/5/6 (SUVH4/5/6) [27]. These studies highlight the importance of HDACs in gene expression regulation during plant development and in response to environmental stimuli. However, the identification and function of HDACs in cotton is yet to be investigated.
Here, we first identified HDACs from G. hirsutum, G. arboretum and G. raimondii, and then comprehensively analyzed them through the phylogenetic classification, gene structure and chromosomal location, domain organization, and the cis-regulatory elements in their promoters. In addition to these bioinformatics analyses, the gene expression patterns of G. hirsutum HDACs were studied during the different stages of fiber development, phytohormone treatment, and diverse abiotic stresses, including Zn and Cd metal stresses, cold, drought and salt. Thus, our comprehensive analysis provides a fundamental understanding of Gossypium HDACs in cotton growth, development and stress responses. This study will lead to a long-term improvement of cotton and will be useful for functional genomic studies on the regulation of histone acetylation in cotton.

2. Results

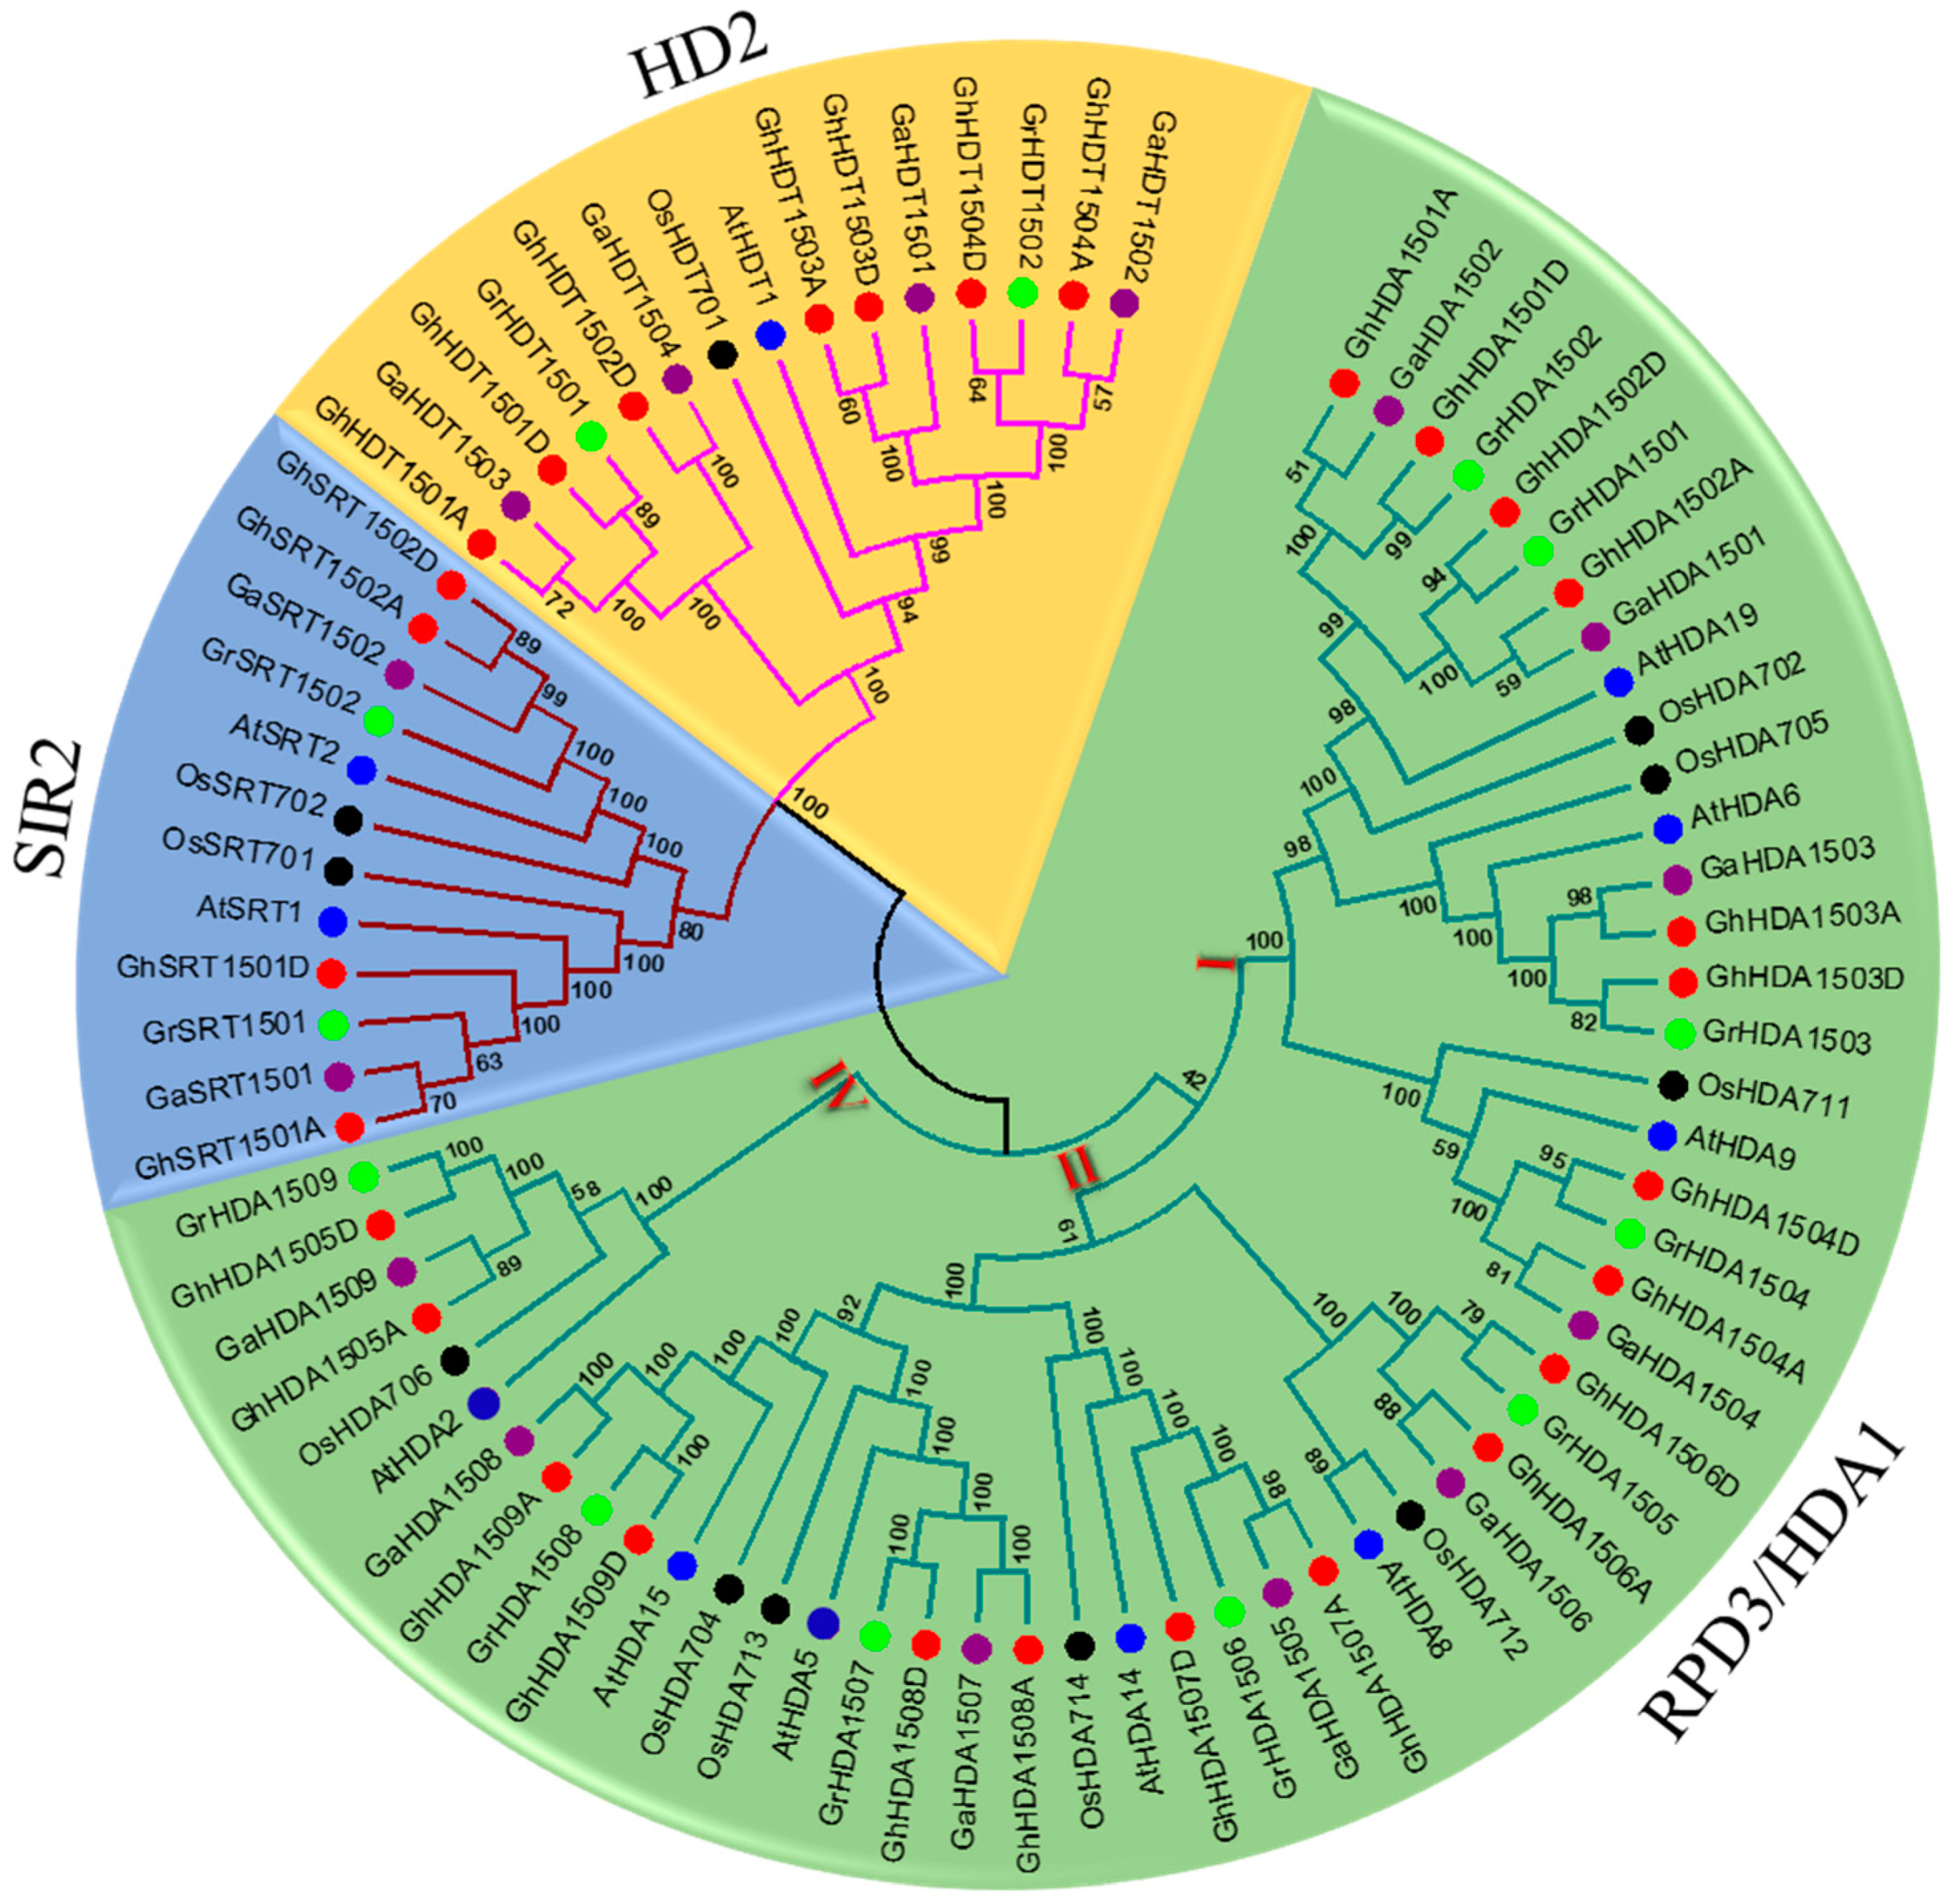
2.1. Identification and Phylogenetic Analysis of Gossypium HDAC

To identify the HDACs in the genomes of G. hirsutum, G. raimondii and G. arboretum, Arabidopsis query sequences were used to perform a systematic blast search. After verification using Pfam and InterProScan databases, a total of 29 G. hirsutum HDACs (GhHDACs), 15 G. arboretum HDACs (GaHDACs), and 13 G. raimondii HDACs (GrHDACs) were identified (Table S1). ExPASy was further used to analyze the properties of the identified HDACs. We found that the open reading frame (ORF) length of Gossypium HDACs ranged from 606–2004 bp, which encoded the polypeptides from 201–667 amino acids. In addition, the predicted molecular weight of Gossypium HDACs ranged from 21–75 kDa. In addition, the calculated pI values ranged from 4.32–8.96 (Table S1).
To determine the evolutionary relationship among the newly identified Gossypium HDACs (G. raimondii, G. arboretum and G. hirsutum), as well as with other species, an unrooted phylogenetic tree using MEGA 6.0 was generated. We used previously identified Arabidopsis [18] and rice [19] HDACs, in addition to newly identified 57 Gossypium HDACs, to generate the phylogenetic tree using the neighbor-joining (NJ) method (Figure 1). The phylogenetic results showed that Gossypium HDACs could be classified into three distinct classes (i.e., RPD3/HDA1, HD2-like, and Sir2-like (SRT), similar to Arabidopsis and rice. In addition, the RPD3/HDA1 class could also be divided into three distinct subgroups, class I for the RPD3 group, class II for the HDA1-like group, and class IV for the HDA2 group. We further found that the RPD3/HDA1, HD2-like, and SRT groups comprised both mono and dicot species, and the total number of genes in RPD3/HDA1 (52) was greater than the number of genes in the HD2-like (15) and SRT (12) subgroups. We also observed that the number of HDACs from each species was different within each group and Gossypium HDACs clustered closely to Arabidopsis in contrast with rice, indicating their close phylogenetic relationship with Arabidopsis. Nevertheless, their gene numbers were not similar within the group.

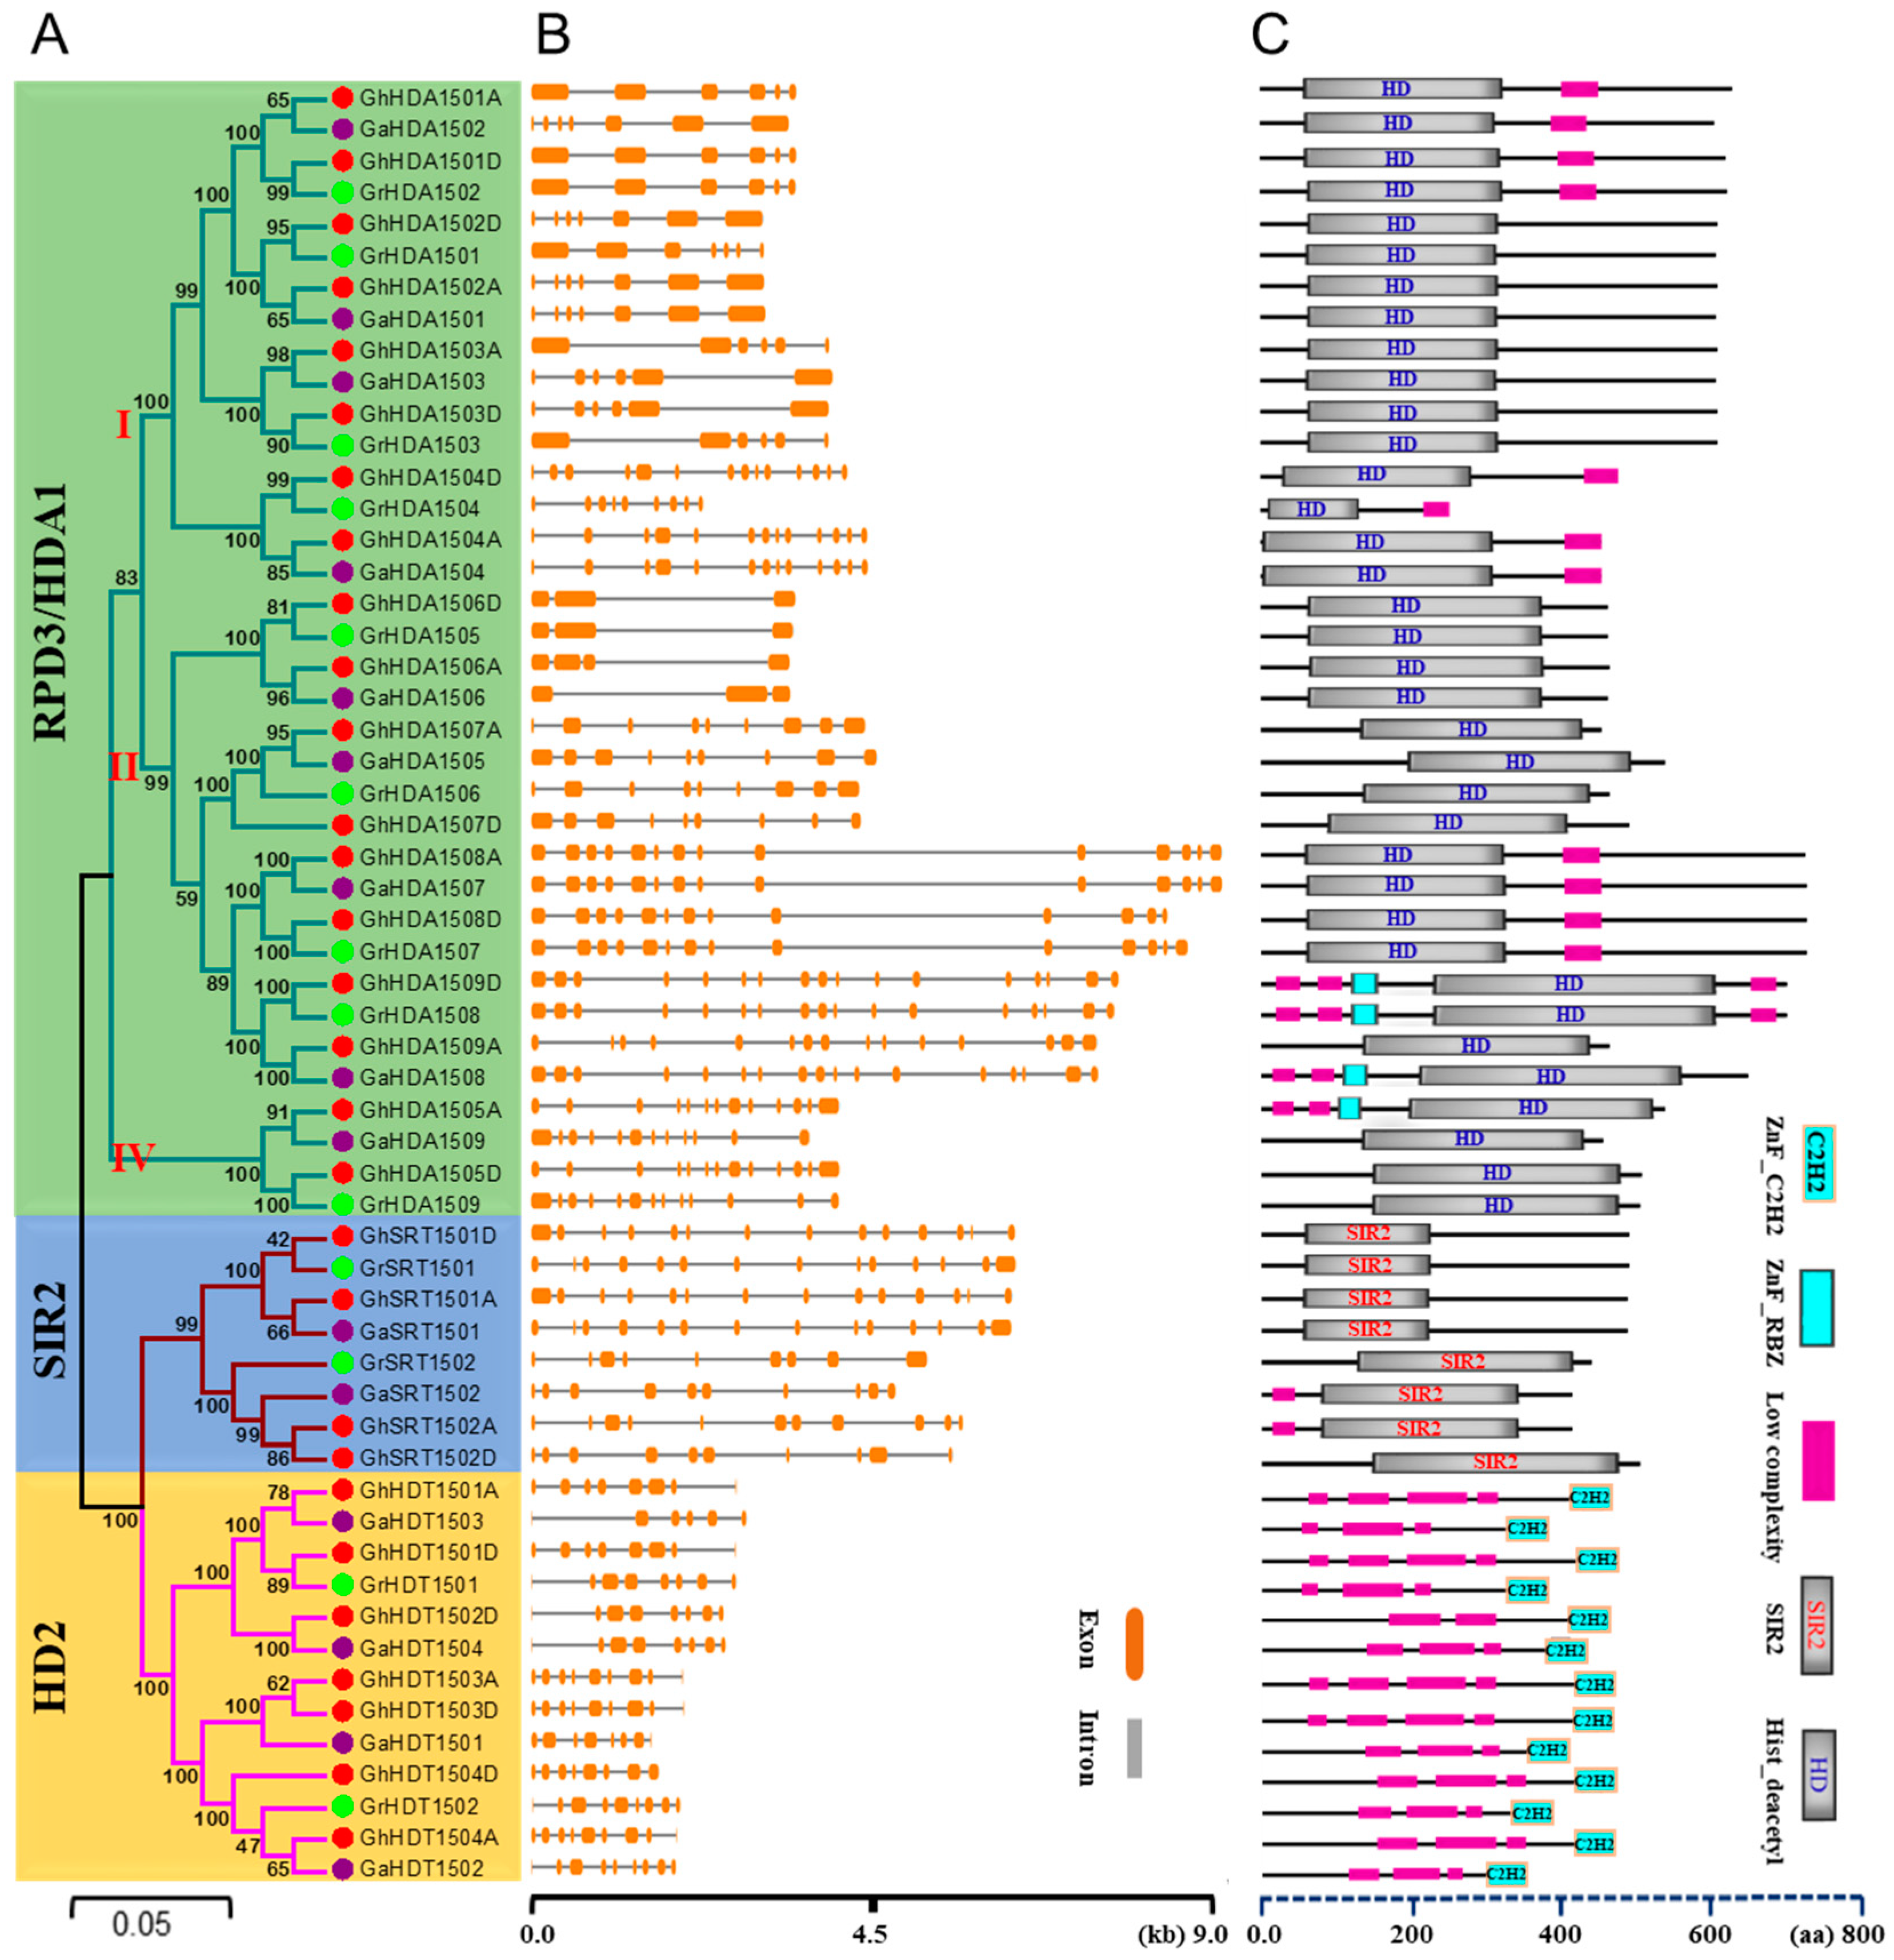
2.2. Phylogenetic Classification, Gene Structure, and Conserved Domain Analysis of Gossypium HDAC Genes

In order to confirm the subgroup classification and to determine the evolutionary relationship among the Gossypium HDACs, we generated another phylogenetic tree using the NJ method (Figure 2A). This phylogenetic analysis further confirmed the three distinct groups RPD3/HDA1, HD2-like, and SRT, as well as three subgroups of RPD3/HDA1 class in Gossypium HDACs. In G. raimondii and G. arboretum, SRT and RPD3/HDA1 groups contained two and nine members, respectively. However, G. arboretum contained four members of HD2-like, while G. raimondii contained only two members of HD2-like. Moreover, in G. hirsutum, RPD3/HDA1, SRT and HD2-like classes contained 18, 4, and 7 members, respectively. In G. hirsutum, the subgroups I, II and IV of RPD3/HDA1 contained eight, eight, and two members, respectively. In general, G. raimondii and G. arboretum had their orthologs in allotetraploid G. hirsutum.
We further analyzed the HDACs gene structure from G. hirsutum, G. raimondii, and G. arboretum (Figure 2B). Our results showed that RPD3/HDA1, HD2-like and SRT classes contained different numbers and lengths of exons/introns. Moreover, three distinct subgroups of RPD3/HDA1 also showed different numbers and lengths of intron/exons. For example, the number and length of intron/exons were greater in subgroup I of RPD3/HDA1 than that of HD2-like, as well as other subgroups of RPD3/HDA1. Thus, consistent with the phylogenetic analysis, the gene structure in terms of intron/exons was quite similar within the subgroup or different classes of Gossypium HDACs. Furthermore, the HDACs’ gene structure from G. raimondii and G. arboretum was largely similar to their orthologs in G. hirsutum.
To gain insight into the Gossypium HDACs’ putative functional diversification, a Multiple Expectation Maximization for Motif Elicitation (MEME) analysis was also performed and identified a total of eight conserved motifs in Gossypium HDACs (Figure S1). Then, we analyzed the domain organization of Gossypium HDACs (Figure 2C). The results showed that the RPD3/HDA1 class contained the conserved HD domain, and the SRT class contained the conserved SIR2 domain. Moreover, the HD2-like class contained the conserved C2H2 type zinc finger domain. In addition to conserved domains, some members of RPD3/HDA1 contained an additional zinc finger- Ran-binding domain (RBZ). In brief, HDACs from G. hirsutum, G. raimondii and G. arboretum contained a similar domain organization to that of their counterparts in Arabidopsis and rice.

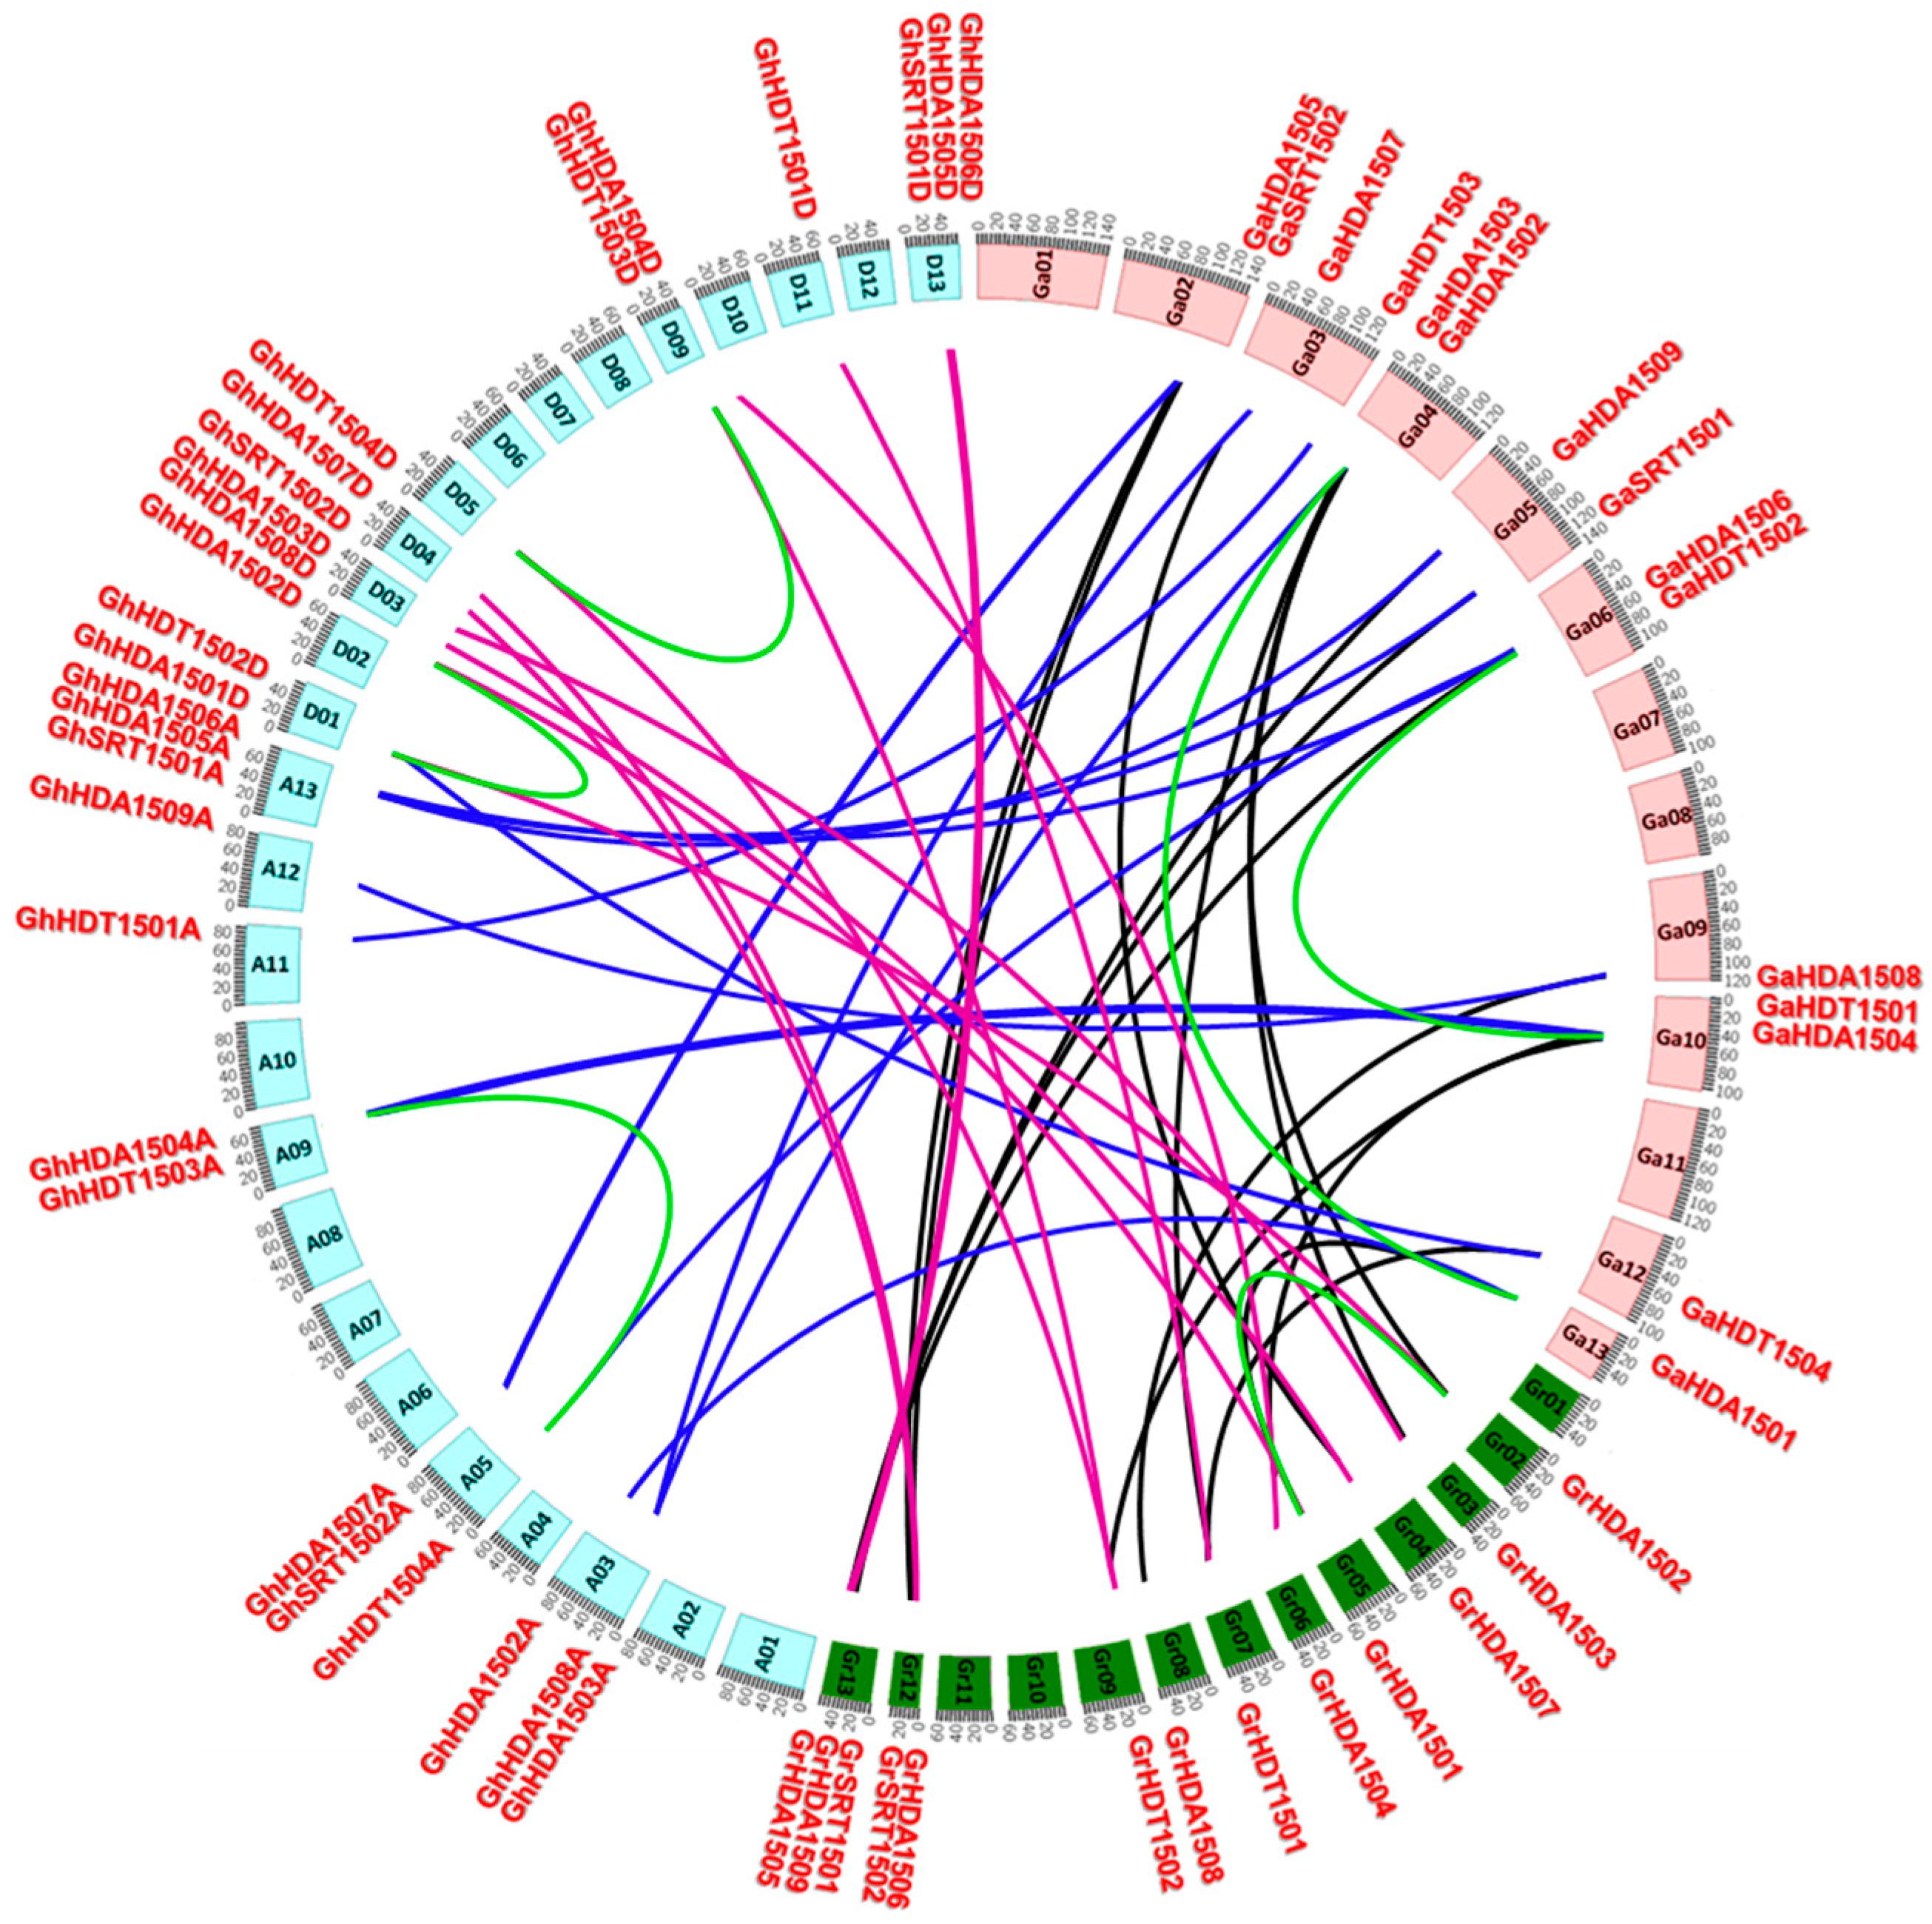
2.3. Genomic Localization and Gene Duplication Analysis of Gossypium HDACs

G. hirsutum HDACs were mapped to their corresponding chromosomes (Figure 3) and the results showed that Gossypium HDACs were unevenly distributed on their chromosomes. For example, a total of 29 G. hirsutum HDACs were physically located on 15 chromosomes and their distribution on each chromosome was also uneven. The RPD3/HDA1 group of G. hirsutum HDACs was localized on chromosomes 1, 2, 3, 4, 9 and 13, while the HD2-like group of G. hirsutum HDACs was localized on chromosomes 1, 5, 9 and 11. Furthermore, the SIR2 group of G. hirsutum HDACs localized on chromosomes 4 and 13. We also mapped HDACs from G. raimondii and G. arboretum to their chromosomes. The results showed that similar to G. hirsutum, G. raimondii and G. arboretum also contained uneven numbers of HDACs on their chromosomes. However, the HDACs of G. raimondii were evenly distributed on their chromosomes, in contrast to G. arboretum. Furthermore, we observed that RPD3/HDA1, HD2-like and SIR2 group members of HDACs were localized to different chromosomes in both diploids (G. raimondii and G. arboretum), as well as in the allotetraploid (G. hirsutum). For example, the HD2-like group member HDT1501 was localized on chromosome 11 in G. hirsutum, on chromosome 7 in G. raimondii, and on chromosome 10 in G. arboretum. We next investigated the gene duplication events in Gossypium HDACs and found three segmental duplications in G. hirsutum (GhHDA1501D/GhHDA1502D, GhHDT1503A/GhHDT1504A, GhHDT1504D/GhHDT1503D), found two segmental duplications in G. arboretum (GaHDA1501/GaHDA1502, GaHDT1502/GaHDT1501), and found one segmental duplication in G. raimondii (GrHDA1502/GrHDA1501). Furthermore, we also calculated the Ka/Ks ratio of each duplicated genes pair (Table S2), and found that the Ka/Ks ratio was less than 0.22 in all the duplicated genes of Gossypium HDACs. This indicates that the duplicated Gossypium HDACs were under strong purifying selection pressure.

2.4. Cis-Elements in the Promoter of G. hirsutum HDAC Genes

We next scanned the putative cis-elements in the promoter of G. hirsutum HDACs (1500 bp upstream of the transcription start site) in order to gain more insight into their function (Figure S2, Tables S3 and S4). The results revealed that G. hirsutum HDACs carry TATA and CAAT box core cis-elements, stress and development response elements, and phytohormones response elements. Although the RPD3/HDA1, HD2-like, and SRT groups shared a majority of cis-regulatory elements in their promoter, some of the cis-elements were found absent in certain groups. For example, Box-W1 (fungal elicitor responsive element), CAT box (cis-acting regulatory element related to meristem expression), GCN4 motif (cis-regulatory element involved in endosperm expression), and O2 site (cis-acting regulatory element involved in zein metabolism regulation) cis-element were absent in the SRT group of G. hirsutum HDACs. Similarly, the CGTCA motif (cis-acting regulatory element involved in MeJA-responsiveness) was only absent in the HD2-like group of G. hirsutum HDACs. We observed that the majority of cis-elements in the promoter of HDACs were conserved in the A and D genome of G. hirsutum. However, some of the G. hirsutum HDACs still differed in their cis-elements, e.g., GhHDA1506A/GhHDA1506D, highlighting the specific contribution of A or D genomes of G. hirsutum in regulating the particular response to different developmental and environmental cues.

2.5. Gene Expression Analysis

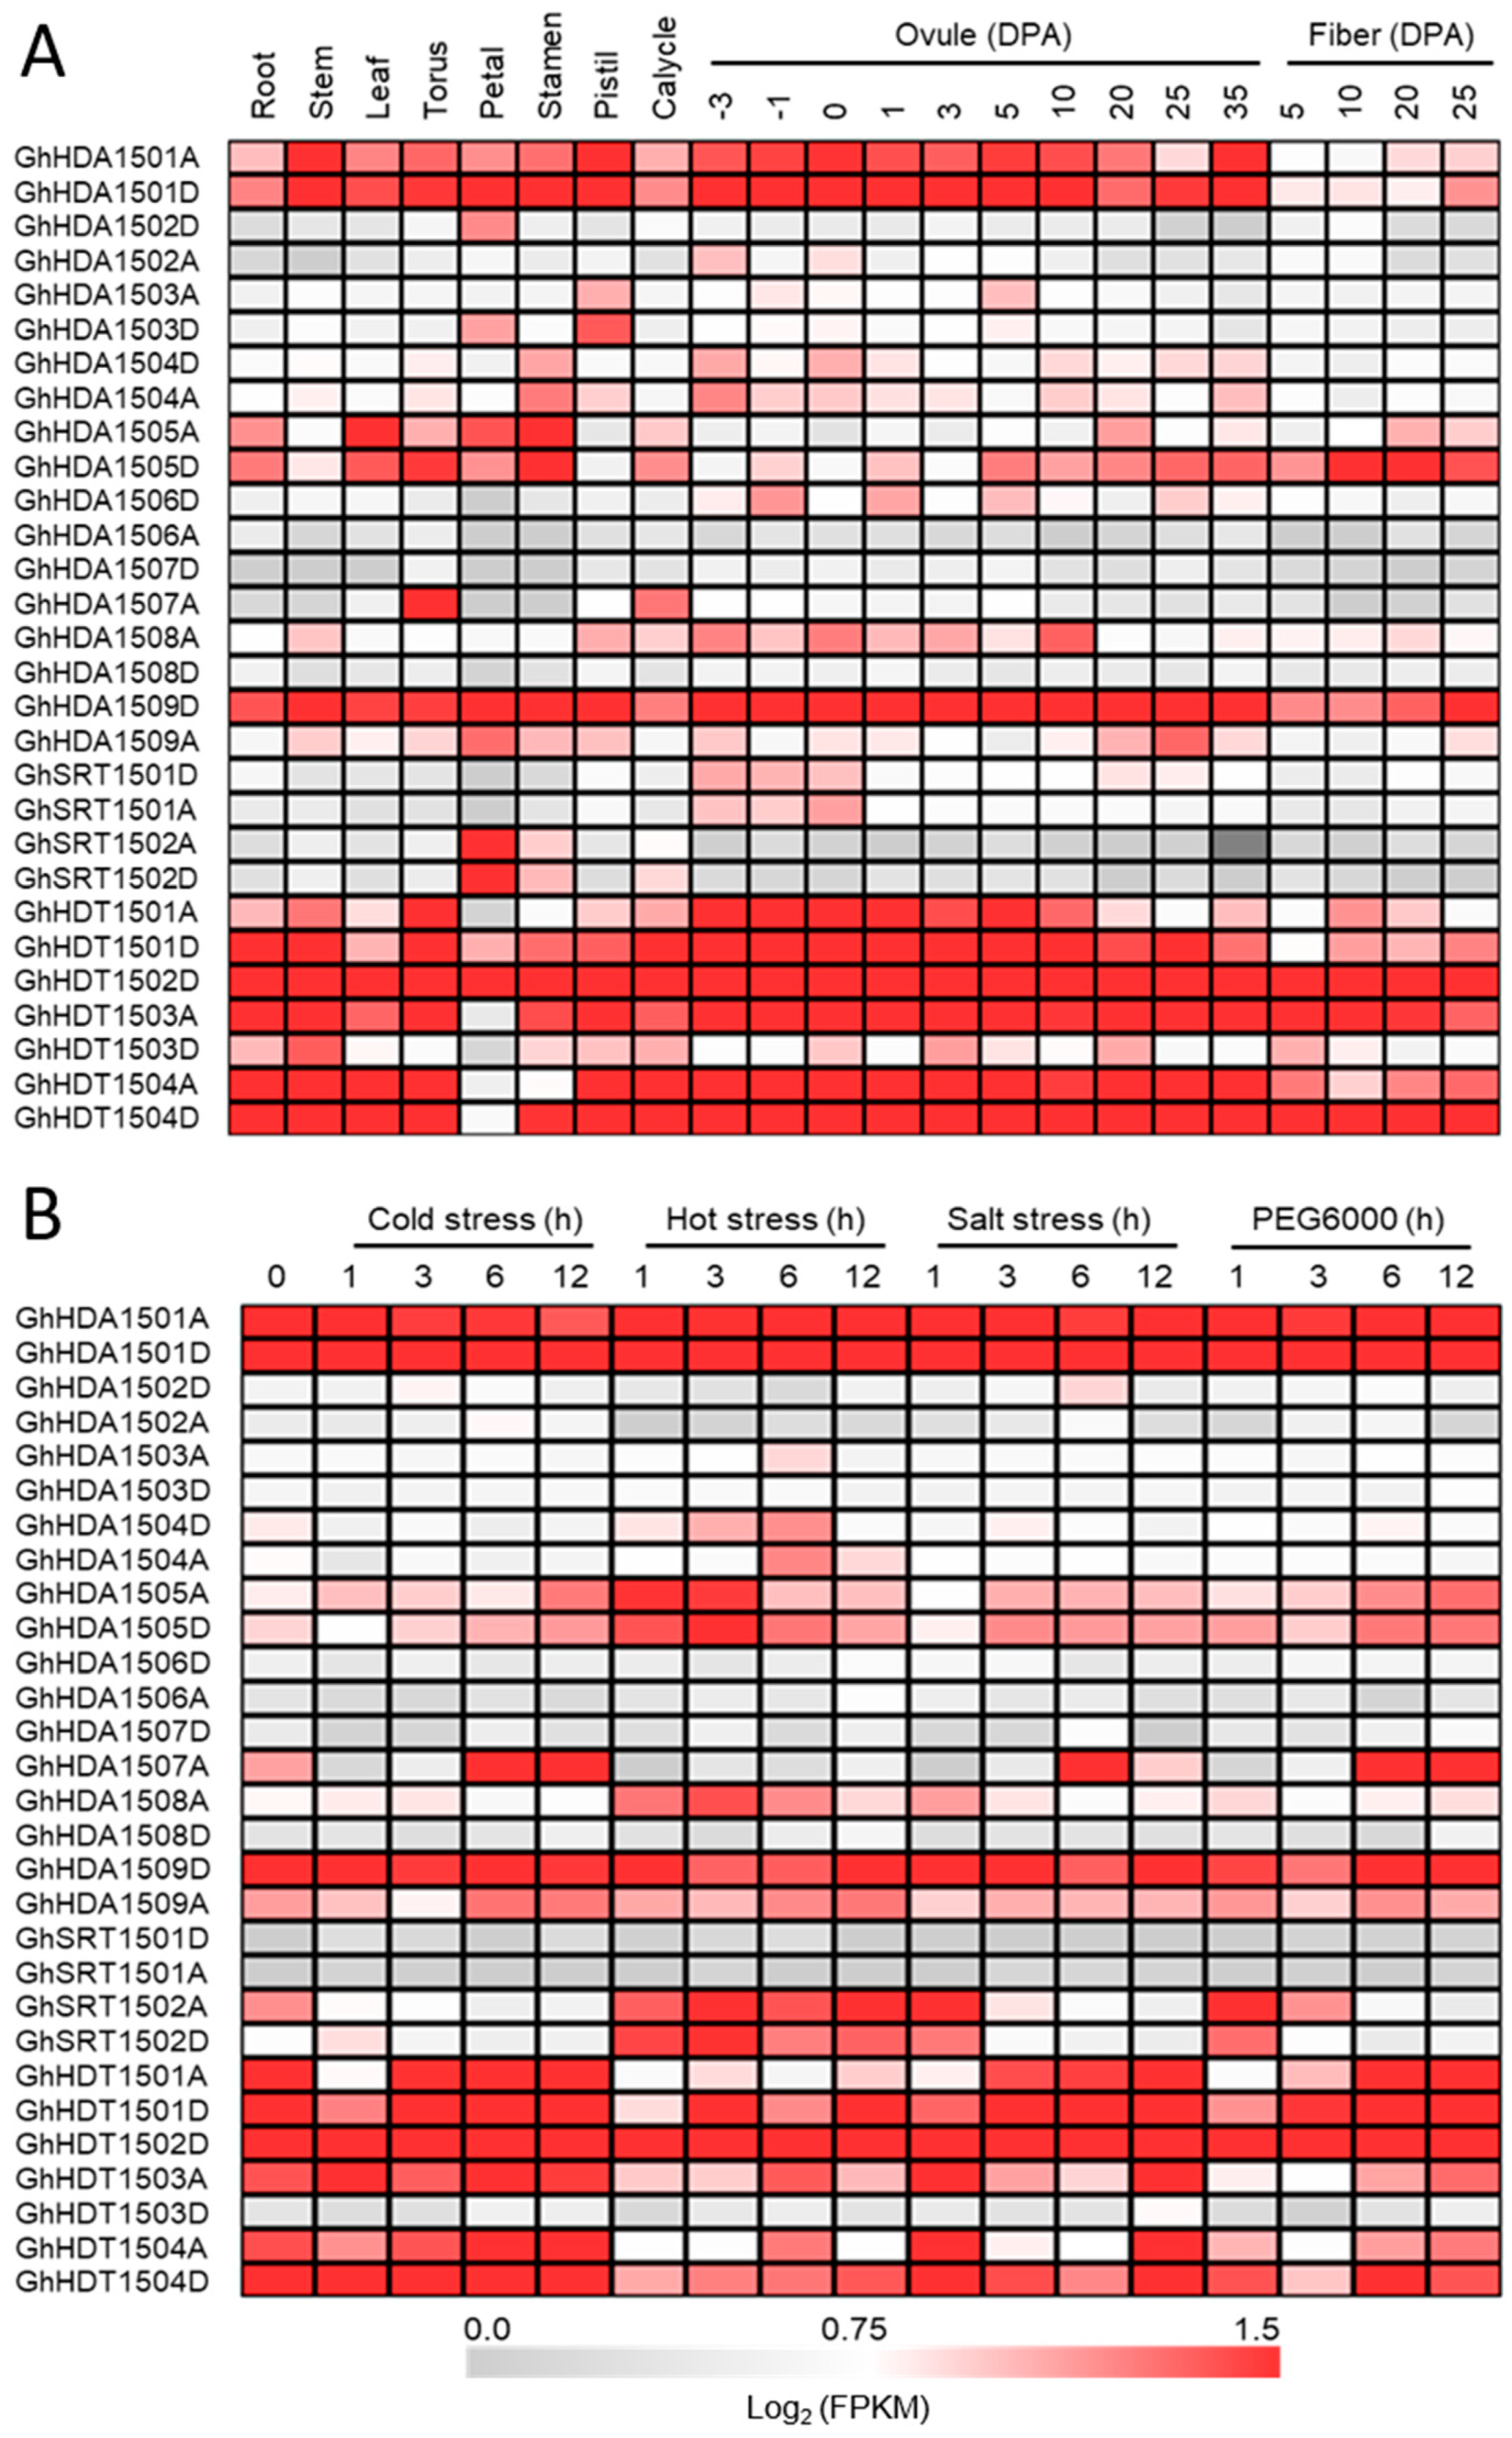
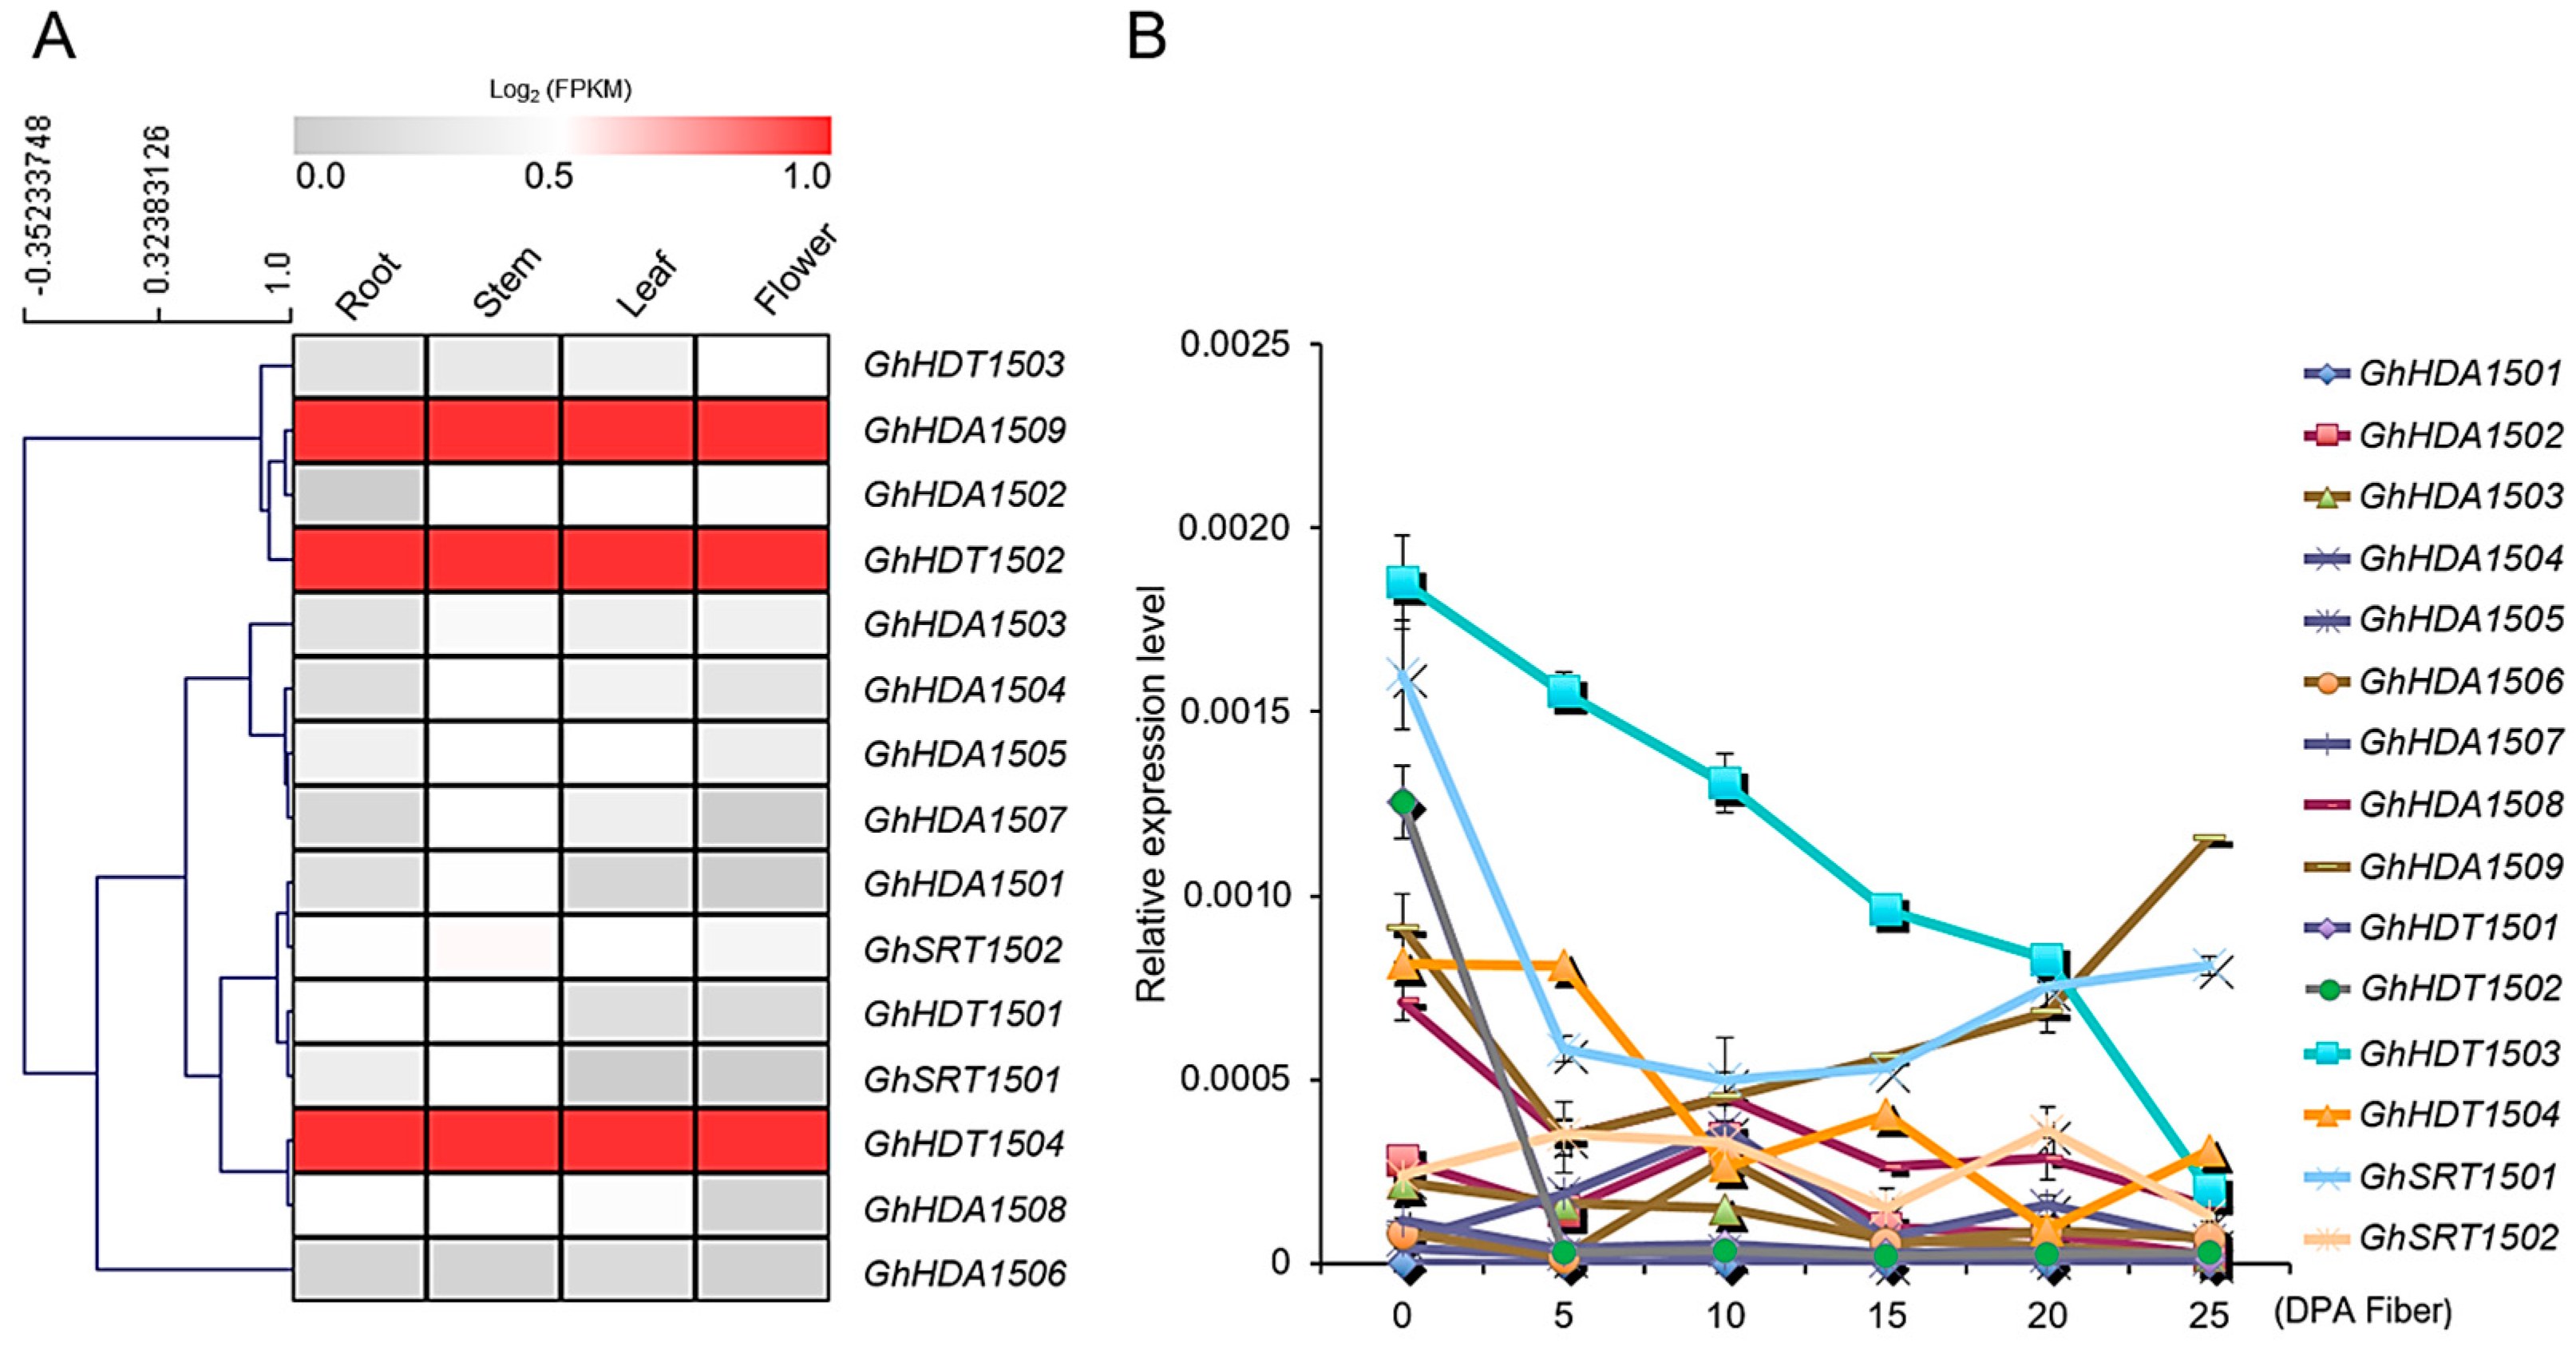
2.5.1. Expression Patterns of G. hirsutum HDACs in Different Tissues and Under Multiple Stresses

In order to unravel the possible physiological functions of HDACs in allotetraploid cotton, we next investigated the expression pattern of G. hirsutum HDACs in different tissues by analyzing the RNA-seq data (downloaded from NCBI) (Figure 4). RNA-seq analysis showed that all the G. hirsutum HDACs were differentially expressed in the vegetative tissues (leaf, root and stem), as well as reproductive tissues (torus, petal, stamen, pistil, calycle, and different stages of ovule development) (Figure 4A). However, some of the G. hirsutum HDACs were mainly expressed in reproductive tissues in contrast with vegetative tissues, e.g., GhSRT1502A/D. We also noticed that the expression of A and D genomes was also different in G. hirsutum, e.g., GhHDT1503A was highly expressed in all the vegetative and reproductive tissues in contrast with GhHDT1503D. These results suggest that the A and D genomes may jointly contribute for their functional role.
We next investigated the G. hirsutum HDACs expression at different time points of cotton cotyledon growth and root development (Figure S3). The results show that G. hirsutum HDACs were expressed or repressed at certain times of growth, indicating the dynamic role of G. hirsutum HDACs in cotton growth and development. For example, GhHDA1503A/D expression decreased with time for the seed cotyledon, while the expression of GhHDT1501A/D increased with time for root development. Because cotton encounters multiple abiotic stresses during development, we therefore analyzed the RNA-seq data of G. hirsutum HDACs in response to different stresses (Figure 4B). All members of the HD2-like group—GhSRT1502, GhHDA1509, GhHDA1505 and GhHDA1501—showed a dynamic expression in response to cold, heat, salt and PEG 6000 stress.

2.5.2. Validation of the Expression of G. hirsutum HDACs Genes Using qRT-PCR

Tissue-Specific Expression of GhHDAC Genes

We further validated the G. hirsutum HDACs expression in vegetative and reproductive tissues using qRT-PCR (Figure 5A). The mRNA similarity between the A and D genomes of allotetraploid cotton was extremely high; thus, we considered G. hirsutum GhHDAC-A and GhHDAC-D as one combination (GhHDAC) for qRT-PCR. We found that all the 15 G. hirsutum HDACs showed differential expression in the analyzed tissues, similar to RNA-seq. Furthermore, the expression of GhHDA1509 from the RPD3/HDA1 group, and GhHDT1502 and GhHDT1504 expression from the HD2-like group were found at the highest levels in all the tissues.

GhHDACs Expression Pattern at Different Fiber Developmental Stages

We next investigated the expression of G. hirsutum HDACs at different stages of fiber development (Figure 5B). Only GhHDT1502, GhHDT1503, GhHDT1504, GhHDA1509 and GhSRT1501 showed dynamic expression over the fiber development in contrast with other G. hirsutum HDACs. Among these five genes, the expression of HD2-like group members (GhHDT1502, GhHDT1503 and GhHDT1504) gradually decreased with the development stages (0–25 days post anthesis (DPA)). However, the expression of GhHDA1509 and GhSRT1501 decreased from 0–5 DPA and then increased from 5–25 DPA of fiber development. These results indicate the functional divergence among different groups of G. hirsutum HDACs in fiber development.
Then, we analyzed the RNA-seq data of G. hirsutum HDAC genes at different stages of fiber development to separate the contribution of A and D genomes in the allotetraploid G. hirsutum (Figure 4A) and found that some G. hirsutum HDACs members belonging to D genome were preferentially expressed over those in the A genome, e.g., GhHDA1509D expression was higher than that of GhHDA1509A. Our results indicate that G. hirsutum GhHDACs-A and GhHDACs-D might jointly play an important role in fiber development.

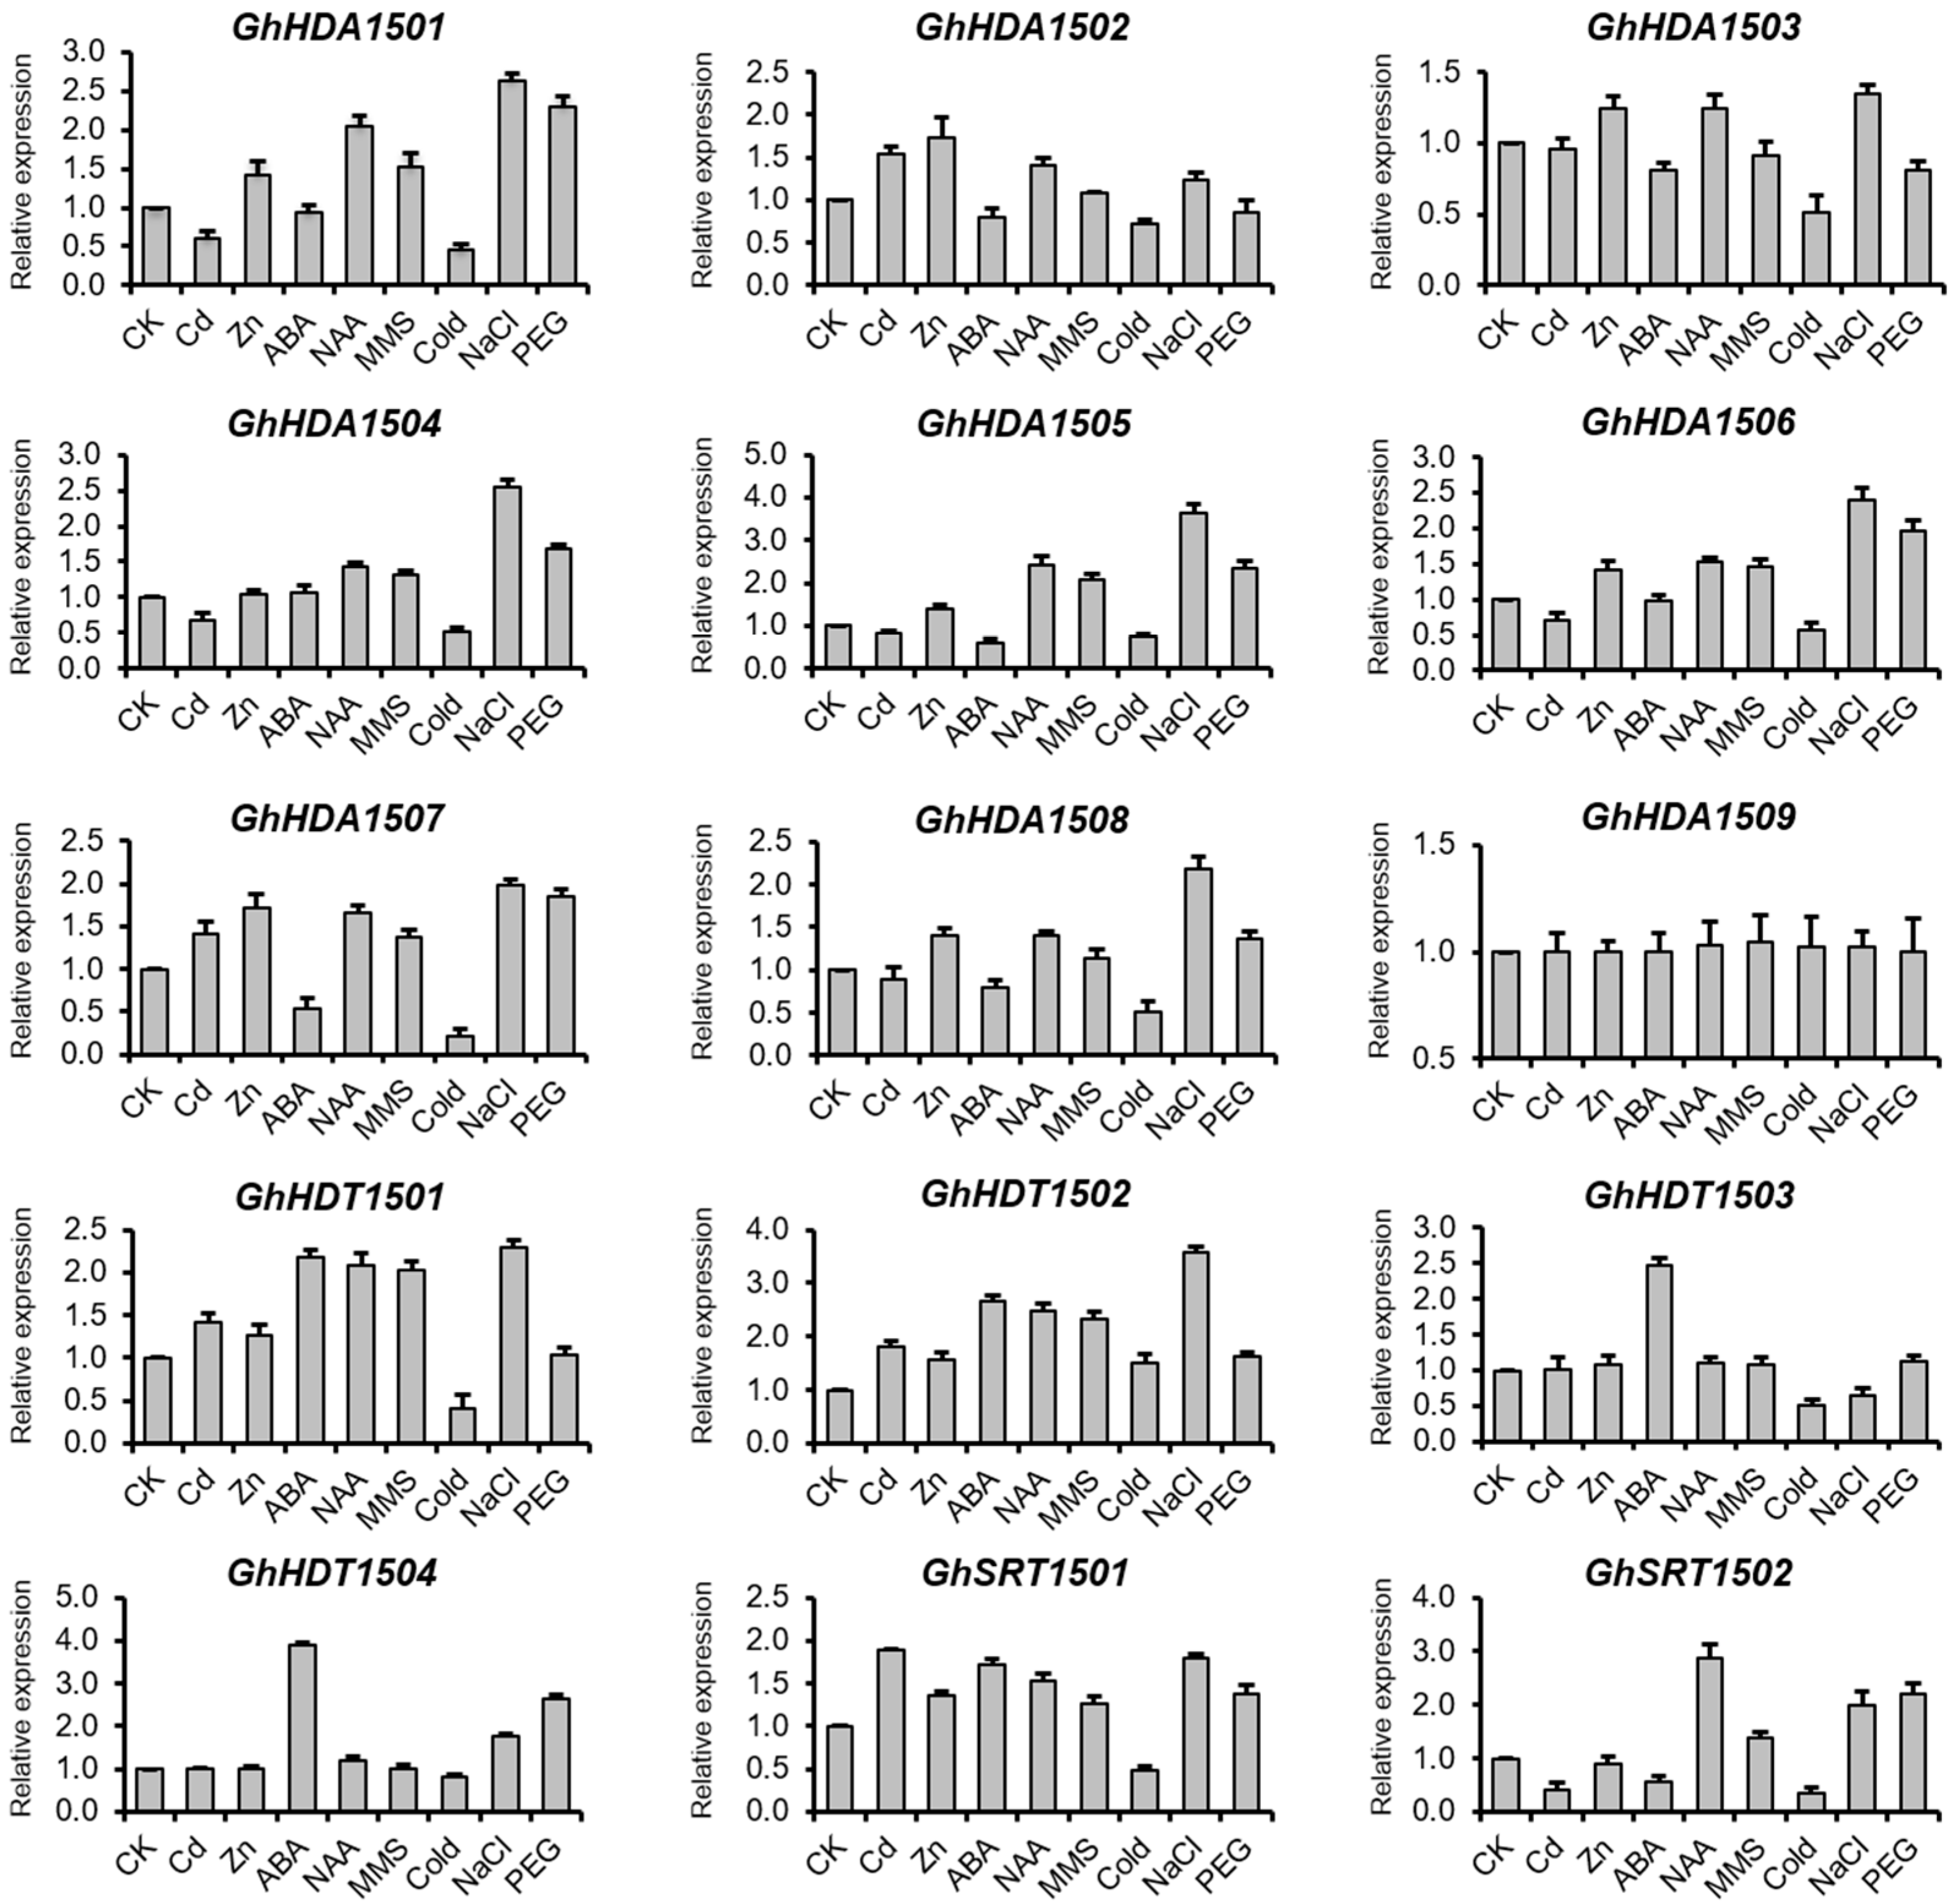
Expression of GhHDACs in Response to Phytohormones

Our putative cis-elements analysis in the promoter of G. hirsutum HDACs suggests that G. hirsutum HDACs could be regulated in response to hormones (Figure S2, Tables S3 and S4). Therefore, we investigated the expression of G. hirsutum HDACs in response to auxin and ABA (Figure 6). The results revealed that all G. hirsutum HDACs were differentially regulated in response to auxin and ABA, except GhHDA1509, which did not change relative to the control. In response to the ABA treatment, the expressions of GhHDA1502, GhHDA1503, GhHDA1505, GhHDA1507, GhHDA1508 and GhSRT1502 decreased while the expressions of GhHDT1501, GhHDT1502, GhHDT1503, GhHDT1504, and GhSRT1501 increased relative to the control. In response to the auxin treatment, the expressions of GhHDA1501, GhHDA1502, GhHDA1503, GhHDA1504, GhHDA1505, GhHDA1506, GhHDA1507, GhHDA1508, GhHDT1501, GhHDT1502, GhSRT1501, and GhSRT1502 increased, while the expressions of all other genes did not change relative to the control.

Expression of GhHDACs in Response to DNA Damage

We also investigated whether G. hirsutum HDACs expression was altered in response to DNA damage from methyl methanesulfonate (MMS) (Figure 6). The results showed that the expressions of GhHDA1501, GhHDA1504, GhHDA1505, GhHDA1506, GhHDA1507, GhHDT1501 and GhHDT1502 increased while the expression of other genes did not change relative to the control.

Expression of GhHDACs in Response to Abiotic Stresses

The putative cis-elements in the promoter suggest that G. hirsutum HDACs could also be regulated in response to abiotic stresses. We next investigated the expression of G. hirsutum HDACs in response to metal stress (Cd and Zn), salt stress (NaCl), cold, and drought stress (PEG 4000) using qRT-PCR (Figure 6). The results revealed that all G. hirsutum HDACs were differentially regulated in response to abiotic stresses, except GhHDA1509, which did not respond to any tested treatments. In response to Cd stress, the expressions of GhHDA1501, GhHDA1504, GhHDA1505, GhHDA1506 and GhSRT1502 decreased, while the expressions of GhHDA1502, GhHDA1507, GhHDT1501, GhHDT1502 and GhSRT1501 increased relative to the control. In response to Zn stress, the expressions of GhHDA1501, GhHDA1502, GhHDA1503, GhHDA1506, GhHDA1507, GhHDA1508, GhHDT1501, GhHDT1502 and GhSRT1501 increased, while the expressions of all other genes did not change relative to the control. These results indicate the specific regulation of G. hirsutum HDACs in response to different metal stresses. We next investigated the expression of G. hirsutum HDACs in response to some of the most common abiotic stresses, i.e., cold, salt, and drought. The results showed that in response to cold, the expressions of GhHDA1501, GhHDA1502, GhHDA1503, GhHDA1504, GhHDA1505, GhHDA1506, GhHDA1507, GhHDA1508, GhHDT1501, GhHDT1503, GhSRT1501 and GhSRT1502 decreased, while the expression of GhHDT1502 slightly increased. In response to salt treatment, the expression of GhHDT1503 slightly decreased, while the expressions of all other genes (except GhHDA1509) increased relative to the control. In response to drought stress, the expressions of GhHDA1501, GhHDA1504, GhHDA1505, GhHDA1506, GhHDA1507, GhHDA1508, GhHDT1502, GhHDT1504, GhSRT1501 and GhSRT1502 increased, while the expression of GhHDA1503 slightly decreased relative to the control.

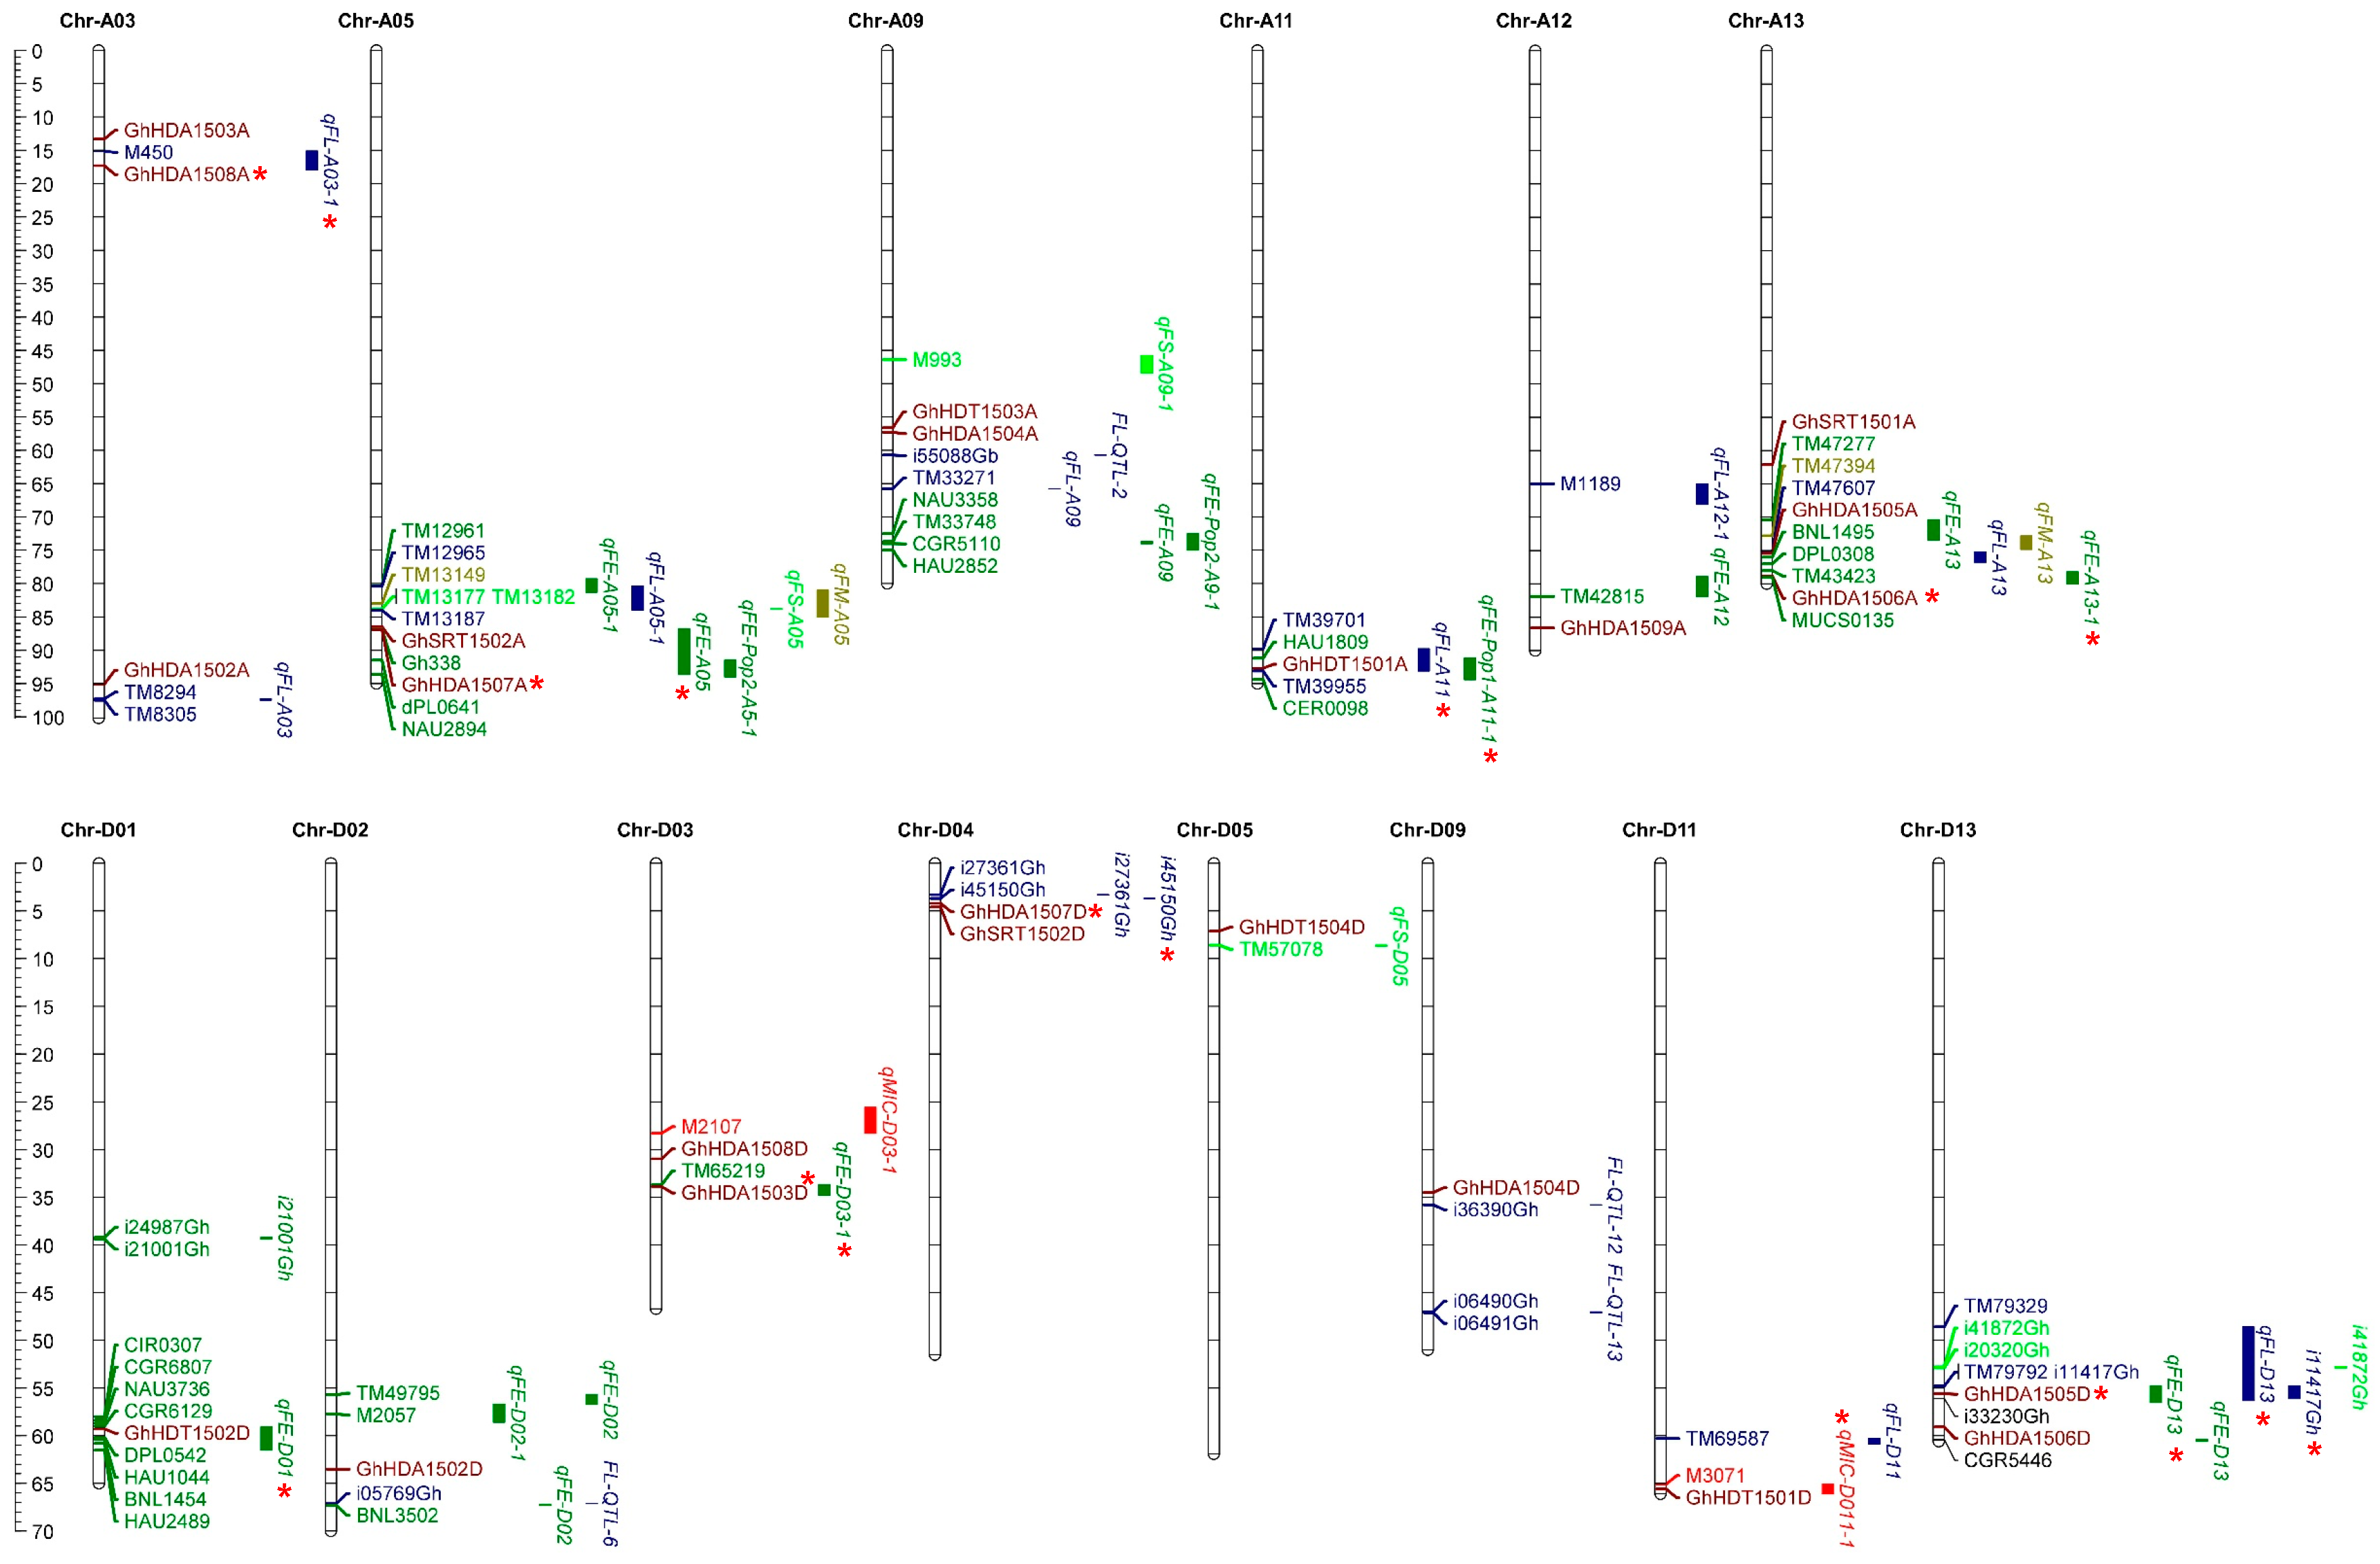
2.6. Co-Localization of GhHDACs with Quantitative Trait Loci and Single-Nucleotide Polymorphisms of Fiber-Related Traits

To further investigate the potential function of HDACs in fiber development, G. hirsutum HDACs were mapped to reported quantitative trait loci (QTLs) or natural variations (single-nucleotide polymorphisms (SNPs)) of fiber development, i.e., fiber length (FL), fiber elongation (FE), fiber micronaire (FM), fiber strength (FS), Micronaire (MIC), and fiber uniformity (FU) (Figure 7). From the A genome of G. hirsutum, only five genes were mapped inside the FE and FL QTLs: the GhHDA1508A gene was anchored in qFL-A03-1 on chromosome A-03; the GhHDA1507A gene resided within qFE-A05 on chromosome A-05; the GhHDT1501A gene was mapped inside the two QTLs, i.e., qFL-A11 and qFE-Pop1-A11-1 on chromosome A-11; while two genes, GhHDA1505A and GhHDA1506A, were mapped inside the QTLs qFL-A13 and qFE-A13-1, respectively. However, few HDACs from the A genome of G. hirsutum were localized in the proximity of different fiber development QTLs. This indicates that the A genome HDACs of G. hirsutum that co-localizes inside QTLs/SNPs may directly play an important role in fiber-related traits.
From the D genome of G. hirsutum, five genes were anchored inside the QTLs on five chromosomes: the GhHDT1502D gene was mapped inside the qFE-D01 on chromosome D-01; the GhHDA1503D gene was anchored in the qFE-D03-1 on chromosome D-03; GhHDA1507D was presented in the Linkage Disequilibrium (LD) region of the FL natural variation (i45150Gh) on chromosome D-04; GhHDT1501D resided in the MIC-QTL (qMIC-D011-1) on chromosome D-11; and GhHDA1505D was mapped to the three QTLs, i.e., qFE-D13, qFL-D13, and the natural variation of FL (i11417Gh). However, few HDACs from the D genome of G. hirsutum were localized in the proximity of fiber-related QTLs. Notably, GhHDT1501, GhHDA1505 and GhHDA1507 from both the A and D genomes of G. hirsutum were anchored with different fiber-related QTLs, indicating that both the A and D genomes of G. hirsutum jointly contributed to provide fiber-related traits. Furthermore, few HDACs (e.g., GhHDA1505D) were mapped inside the QTLs of more than one fiber trait, i.e., fiber elongation and fiber length QTLs. This indicates that G. hirsutum HDACs may play a comprehensive role in different traits of fiber development.

3. Discussion

Histone acetylation plays a key role in plant development and the response to various environmental stimuli by regulating the gene transcription [14]. However, the activity of histone acetyltransferases is balanced by the histone deacetylases, which specifically remove the acetylation to repress the transcription. However, HDACs have not been investigated yet and compared within three genomes of cotton. In this study, we revealed that Gossypium HDACs could be classified into three major subgroups; e.g., RPD3/HDA1, HD2-like, and SRT, similar to Arabidopsis and rice. Moreover, Gossypium HDACs also carried the functional catalytic domains and other conserved domains, as well as motifs similar to their counterparts in Arabidopsis and rice (Figure 2C and Figure S1). For example, the RPD3/HDA1 class contained the conserved HD domain, the SRT class contained the conserved the SIR2 domain, and the HD2-like class contained the conserved C2H2 type zinc finger domain (Figure 2C). Furthermore, Gossypium HDACs clustered closely to Arabidopsis (Figure 1). These observations indicate that Gossypium HDACs could be bona fide histone deacetylases similar to their Arabidopsis counterparts.
Tandem and segmental duplications contribute in generating new gene subfamilies in the evolution of genome and genetic systems [42]. G. hirsutum contained three segmental duplications (GhHDA1501D/GhHDA1502D, GhHDT1503A/GhHDT1504A, and GhHDT1504D/GhHDT1503D). Similarly, G. arboretum contained two segmental duplications (GaHDA1501/GaHDA1502 and GaHDT1502/GaHDT1501), and G. raimondii contained one segmental duplication (GrHDA1502/GrHDA1501) (Figure 3 and Table S2). Moreover, the Ka/Ks ratio suggests that duplicated genes did not diverge much during evolution (Table S2) and were likely to have functional conservation. This observation was partially validated by the overlapping expression of GhHDT1503 and GhHDT1504 in response to ABA treatments (Figure 6). Both GhHDT1503 and GhHDT1504 showed the strongest response to ABA treatment compared with all other tested treatments. However, the expression of GhHDT1504 increased in response to NaCl and PEG relative to the control, while the expression of GhHDT1503 decreased in response to NaCl (Figure 6). This indicates that these duplicated genes may have functional divergence in response to particular stimuli.
G. hirsutum is a principal source of commercial cotton production [1], and thus holds a significant value in the world economy. Interestingly, we observed that the expression of GhHDT1502, GhHDT1503, and GhHDT1504 gradually decreased with the different stages of cotton fiber development (0–25 DPA), suggesting the dynamic levels of histone acetylation mediated by G. hirsutum HDACs in cotton fiber development. Fiber development is also regulated by phytohormones, including abscisic acid, auxin, gibberellic acid, ethylene, and jasmonic acid [5,43,44,45,46]. Phytohormones have been reported to alter the chromatin structure through the regulation of chromatin modifiers [47], suggesting a potential crosstalk between phytohormones and histone acetylation. Indeed, the exogenous application of auxin has been shown to decrease the H3K9ac and H3K4ac levels at the KRP7 locus [48], while they have been shown to increase at the SKP2B promoter in Arabidopsis [49]. Our qRT-PCR results showed that ABA and auxin regulated the expression of some G. hirsutum HDACs relative to the control (Figure 6), indicating a change in histone acetylation levels in response to hormone treatment. Furthermore, these results also indicate the functional divergence and specific regulation of G. hirsutum HDACs in response to a particular phytohormone. For example, the expression of GhHDT1502, GhHDT1503 and GhHDT1504 was induced by the ABA treatment, while only the expression of GhHDT1503 was induced by the auxin treatment (Figure 6). This specific gene expression regulation of G. hirsutum HDACs could also be observed at the level of RPD3/HDA1, HD2-like, and SRT group members in response to phytohormones. For example, the expression of all the members of the HD2-like group (GhHDT1501, GhHDT1502, GhHDT1503 and GhHDT1503) and GhSRT1501 from the SRT group were increased in response to ABA relative to the control, while the expression of RPD3/HDA1 group did not change relative to the control (Figure 6). However, the chromatin modifiers may also regulate hormone signaling and pathways [47]. It has been shown that HDAC inhibitors repress the auxin distribution and accumulation in the root apex by promoting the PIN-FORMED 1 (PIN1) protein degradation [50,51], indicating a crosstalk between phytohormones and HDACs in plants. Together, our results highlight that G. hirsutum HDACs may play an important role in fiber development via phytohormones’ dependent and/or independent pathways. Further studies are required to investigate the crosstalk of HDACs with phytohormones in cotton and the underlying epigenetic mechanism of fiber development with respect to histone deacetylation.
Double-strand break (DSB)-inducing agents have been reported to alter the histone acetylation and methylation levels in mammals [52]. Furthermore, Sirtuin 6 (SIRT6), a human deacetylase, is one of the first factors recruited to double-strand breaks (DSBs), which later recruits a chromatin remodeler Sucrose Nonfermenting 2 Homolog (SNF2H) at the DSBs in order to ensure the proper functioning of the DNA damage repair machinery [53]. These results indicate the key role of HDACs in DNA damage and repair pathways. Our qRT-PCR results showed that the expression of GhHDA1501, GhHDA1504, GhHDA1505, GhHDA1506, GhHDA1507, GhHDT1501 and GhHDT1502 was increased relative to the control in response to MMS (Figure 6), indicating that these seven G. hirsutum HDACs may play an important role in DNA damage repair in cotton. However, further studies are required to investigate whether and how G. hirsutum HDACs are involved in DNA damage and repair pathways.
Histone deacetylases have been shown to participate in different abiotic stresses, including cold, salt, and drought [33,34,36,54]. For example, the Athda9 mutant showed enhanced tolerance to salt and drought stress [31,33], while the overexpression of HD2D/C showed increased tolerance to drought and salt stress in Arabidopsis [34,35]. Similarly in rice, the overexpression of OsHDT701 also resulted in increased tolerance to drought and salt stresses [36,38]. Furthermore, in maize, H3K9, H4K5 and H4K4 acetylation levels decreased in response to cold treatment, indicating a key role of HDACs in plant adaptation to stress responses [55]. Our qRT-PCR results indicated the specific and differential gene expression regulation of G. hirsutum HDACs in response to particular stresses (Figure 6), suggesting an important role of G. hirsutum HDACs in cotton’s adaptation to various abiotic stresses. Interestingly, HDACs from the HD2-like group were shown to interact with the RPD3/HDA1 family members in Arabidopsis [39]. Our qRT-PCR results showed that the expression of the majority of G. hirsutum HDACs from PRD3/HDA1, HD2-like and SRT groups was increased in response to NaCl and PEG (Figure 6), suggesting that multiple G. hirsutum HDACs might also work together in response to particular stimuli in cotton. AtHDA6 interacts with DNA methyltransferases MET1 [40], histone demethylase FLD [41], and histone methyltransferases SUVH4/5/6 [27], indicating that HDACs interact with other chromatin modifiers to regulate the gene expression. However, further studies are required to investigate whether and how G. hirsutum HDACs cooperate with other chromatin modifiers to control the gene expression involved in developmental processes and plant adaptation to environmental stimuli.
G. hirsutum HDACs, such as GhHDT1501-A and GhHDA1505-D, were co-localized with different fiber-related QTLs/SNPs (Figure 7), indicating their role in different traits of cotton fiber. Moreover, it further supports our previous conclusion that both the A and D genomes of G. hirsutum jointly contribute to different traits of cotton fiber. Interestingly, some G. hirsutum HDACs, such as GhHDT1502 that co-localized with QTL of fiber elongation, also showed strong expression in root, stem, leaves, and flower (Figure 5A). Moreover, GhHDT1502 also showed dynamic expression during different stages of fiber elongation (Figure 5B), and in response to phytohormones, metal stress, DNA damage, and abiotic stresses (Figure 6). This indicates the multifunctional roles of GhHDT1502 in cotton growth and development, fiber development, and in response to environmental stimuli. However, further investigations are required to systematically elucidate the function of all HDACs in cotton fiber development. Together, we propose that developmental and environmental cues regulate the expression of HDACs, which in turn remove the acetylation to suppress the gene transcription involved in various cellular and physiological processes of cotton. On the other hand, the expression of GhHATs was also significantly modulated under developmental and environmental cues [56], indicating the dynamic levels of histone acetylation. However, further comprehensive studies are required to elucidate the role of histone acetylation in different aspects of cotton plant development. In brief, our study highlighted the implication of G. hirsutum HDACs in phytohormones-mediated developmental processes and abiotic stress adaptation. In addition, this study also highlighted the potential role of G. hirsutum HDACs in DNA damage and repair in cotton. This study motivates investigation of the biological and cellular functions of each G. hirsutum HDAC in allotetraploid cotton, which will eventually lead to a long-term improvement of Gossypium fiber quality and abiotic stress tolerance.

4. Materials and Methods

4.1. Identification of the HDACs Gene Family

The data of three cotton species, G. raimondii (JGI, version), G. arboretum (BJI, version1.0) and G. hirsutum (NAU, version 1.1) were downloaded from the COTTONGEN (http://www.cottongen.org) [9,10,12]. The HDACs protein sequences from Arabidopsis and rice were downloaded from Phytozome (http://phytozome.jgi.doe.gov/pz/portal.html) and then used as queries in BLASTP searches [57] against the G. raimondii, G. arboretum and G. hirsutum genomes. Genes with E-values < 1.0 were selected, and redundant sequences were removed by following the previously published method [58]. Furthermore, InterProScan (http://www.ebi.ac.uk/interpro/search/sequence-search) was used to confirm the presence of the HDACs domain [59]. The physicochemical properties were predicted using ExPASy (http://cn.expasy.org/tools).

4.2. Chromosome Location and Duplication of HDACs

The loci of HDACs were deduced from the gff3-files of the cotton genome. The localization of HDAC genes on the chromosomes was visualized using the program Circos [60]. The duplication events of the HDACs gene and Ka/Ks were calculated using the previously published method [61]. The T = Ks/2λ equation was used to determine the duplication time and deviation of the HDAC gene pairs, assuming clock-like rates of (λ) 1.5 × 10⁻⁸ substitutions per synonymous site per year for cotton [62].

4.3. Phylogenetic Analyses

Multiple sequence alignment was performed for the full-length HDAC proteins using Clustal W with standard settings [63]. A neighbor-joining (NJ) phylogenetic tree was constructed using the full-length HDAC sequences from G. raimondii, G. arboretum and G. hirsutum in MEGA 6.0 [64], with p-distance and pairwise gap deletion parameters engaged. The bootstrap test was used with 1000 replicates to evaluate the statistical consistency of each node. To confirm the grades from the NJ method, the minimal-evolution method of MEGA 6.0 was utilized with 1000 replicates as well.

4.4. Gene Structure, Domain Composition and Cis-Element Analysis

To produce the exon-intron diagram, we used the BLAST method of both the CDS (CoDing Sequence) and genomic sequences for all the genes and displayed them using the online tool Gene Structure Display Server (http://gsds.cbi.pku.edu.cn) [65], and the NJ tree was constructed with MEGA6.0 as explained above. The deduced HDAC protein sequences of three cotton species were submitted to the online Multiple Expectation Maximization for Motif Elicitation (MEME) version 4.11.1 (http://meme-suite.org/tools/meme) [66], as previously described [58]. For the cis-element analysis in the promoter regions, the 1-kb upstream sequences were analyzed in the PlantCARE database (http://bioinformatics.psb.ugent.be/webtools/ plantcare/html/) [67].

4.5. Transcriptome Data Analysis and Gene Expression Heatmap

The raw data from the RNA-seq of G. hirsutum was downloaded from the NCBI Sequence Read Archive (SRA: PRJNA248163) to calculate the expression level. Tophat and cufflinks were utilized for the RNA-seq expression and fragmented per kilobase per million reads values were made uniform for gene expression. Finally, these values for the GhHDAC candidates were extracted from the total expression data and a heat map was generated using MeV 4.0 (http://www.tm4.org/) [68].

4.6. Plant Materials, Stress Treatments and qRT-PCR

The G. hirsutum cultivar “CRI35” was used for the gene expression analysis. All the sampled tissues obtained from cotton plants were grown under field condition with standard cultural practices to determine the expression analysis [58]. When the cotton plants were in full bloom (approximately 90 days after planting), we collected different cotton tissues, including roots, stems, leaves and flower. Cotton fibers were harvested at 0, 5, 10, 15, 20 and 25 days post anthesis (DPA). All of these samples were immediately frozen in liquid nitrogen and then stored at −80 °C. For hormonal stresses, cotton seeds were surface-sterilized and were allowed to germinate on moist paper. After 2 days of germination, the seedlings of same size were selected and exposed to NaCl (200 mM), polyethylene glycol 4000 (PEG 4000) (15%), cold (4 °C), methyl methanesulfonate (MMS) (250 ppm), auxin (naphthaleneacetic acid (NAA)) (10 μM), abscisic acid (ABA) (10 μM), ZnSO4 (1 mM), and CdCl2 (1 mM) for 24 h. All these samples were quickly frozen in liquid nitrogen and the total RNA was extracted from all cotton samples using the RNAprep Pure Plant kit (TIANGEN, Beijing, China). A total of 2 μg of RNA was used as the template and the first-strand cDNAs were synthesized using the SuperScript III (Invitrogen, Waltham, MA, USA). Quantitative real-time PCR (qRT-PCR) analysis was performed as described previously [69] by using the specific primers for each GhHDAC gene (Table S5). Cotton UBQ7 (UniProt accession number: AY189972) was used as an internal reference gene for normalization of the expression, and three biological replicates were performed for each sample. To calculate the relative expression levels, a comparative 2−ΔΔCT method was used [70]. The heat map for the gene expression profiles was generated with MeV 4.0 (http://www.tm4.org/) [68].

4.7. Co-Localization of HDACs with Fiber-Related QTLs

To identify the co-localized QTLs and SNPs for fiber-development-related traits, QTLs and their respective linked molecular markers were retrieved from the Cotton Gen website (https://www.cottongen.org). Molecular markers have genetic positions and to get the physical position information, the sequence of each marker was retrieved from Cotton Gen. Furthermore, the sequence of each marker was compared against G. hirsutum in BLAST, using the HAU genome in the cottonFDG website (https://cottonfgd.org/blast/). HDAC genes co-localized with QTLs were displayed on chromosomes along with the surrounding loci and QTLs by using mapchart software [71]. Genes identified inside the QTL or ≤500 kb away from an SNP were considered an anchored gene in QTL because the cotton LD decay was approximately 0.80 Mb [72].

Supplementary Materials

Supplementary materials can be found at https://0-www-mdpi-com.brum.beds.ac.uk/1422-0067/21/1/321/s1.

Author Contributions

Conceptualization, S.S.; formal analysis, M.I., S.S., M.K.N., E.W. and M.Z.M.; funding acquisition, S.S. and R.R.-C.W.; methodology, M.I.; writing—original draft, M.I. and S.S.; writing—review and editing, S.S., K.B.J. and R.R.-C.W. All authors have read and agreed to the published version of the manuscript.

Funding

This research was supported by a grant from Higher Education Commission of Pakistan (PD-IPFP/HRD/HEC/2013/1129).

Conflicts of Interest

The authors declare no conflict of interest.

References

  1. Cao, X. Whole genome sequencing of cotton—A new chapter in cotton genomics. Sci. China Life Sci. 2015, 58, 515–516. [Google Scholar] [CrossRef] [PubMed] [Green Version]
  2. Chen, Z.J.; Scheffler, B.E.; Dennis, E.; Triplett, B.A.; Zhang, T.; Guo, W.; Chen, X.; Stelly, D.M.; Rabinowicz, P.D.; Town, C.D.; et al. Toward sequencing cotton (Gossypium) genomes. Plant Physiol. 2007, 145, 1303–1310. [Google Scholar] [CrossRef] [PubMed] [Green Version]
  3. Wendel, J.F. New World tetraploid cottons contain Old World cytoplasm. Proc. Natl. Acad. Sci. USA 1989, 86, 4132–4136. [Google Scholar] [CrossRef] [PubMed] [Green Version]
  4. Ruan, Y.L.; Llewellyn, D.J.; Furbank, R.T. Suppression of sucrose synthase gene expression represses cotton fiber cell initiation, elongation, and seed development. Plant Cell 2003, 15, 952–964. [Google Scholar] [CrossRef] [Green Version]
  5. Shi, Y.H.; Zhu, S.W.; Mao, X.Z.; Feng, J.X.; Qin, Y.M.; Zhang, L.; Cheng, J.; Wei, L.P.; Wang, Z.Y.; Zhu, Y.X. Transcriptome profiling, molecular biological, and physiological studies reveal a major role for ethylene in cotton fiber cell elongation. Plant Cell 2006, 18, 651–664. [Google Scholar] [CrossRef] [Green Version]
  6. Qin, Y.M.; Zhu, Y.X. How cotton fibers elongate: A tale of linear cell-growth mode. Curr. Opin. Plant Biol. 2011, 14, 106–111. [Google Scholar] [CrossRef]
  7. Imran, M.; Shakeel, A.; Farooq, J.; Saeed, A.; Farooq, A.; Riaz, M. Genetic studies of fiber quality parameter and earliness related traits in upland cotton (Gossypium hirsutum L.). Adv. Agric. Bot. 2011, 3, 151–159. [Google Scholar]
  8. Imran, M.; Shakeel, A.; Azhar, F.; Farooq, J.; Saleem, M.; Saeed, A.; Nazeer, W.; Riaz, M.; Naeem, M.; Javaid, A. Combining ability analysis for within-boll yield components in upland cotton (Gossypium hirsutum L.). Genet. Mol. Res. 2012, 11, 2790–2800. [Google Scholar] [CrossRef]
  9. Li, F.; Fan, G.; Lu, C.; Xiao, G.; Zou, C.; Kohel, R.J.; Ma, Z.; Shang, H.; Ma, X.; Wu, J.; et al. Genome sequence of cultivated Upland cotton (Gossypium hirsutum TM-1) provides insights into genome evolution. Nat. Biotechnol. 2015, 33, 524–530. [Google Scholar] [CrossRef] [Green Version]
  10. Zhang, T.; Hu, Y.; Jiang, W.; Fang, L.; Guan, X.; Chen, J.; Zhang, J.; Saski, C.A.; Scheffler, B.E.; Stelly, D.M.; et al. Sequencing of allotetraploid cotton (Gossypium hirsutum L. acc. TM-1) provides a resource for fiber improvement. Nat. Biotechnol. 2015, 33, 531–537. [Google Scholar] [CrossRef] [Green Version]
  11. Li, F.; Fan, G.; Wang, K.; Sun, F.; Yuan, Y.; Song, G.; Li, Q.; Ma, Z.; Lu, C.; Zou, C.; et al. Genome sequence of the cultivated cotton Gossypium arboreum. Nat. Genet. 2014, 46, 567–572. [Google Scholar] [CrossRef] [PubMed] [Green Version]
  12. Wang, K.; Wang, Z.; Li, F.; Ye, W.; Wang, J.; Song, G.; Yue, Z.; Cong, L.; Shang, H.; Zhu, S.; et al. The draft genome of a diploid cotton Gossypium raimondii. Nat. Genet. 2012, 44, 1098–1103. [Google Scholar] [CrossRef] [PubMed]
  13. Patel, D.J.; Wang, Z. Readout of epigenetic modifications. Annu. Rev. Biochem. 2013, 82, 81–118. [Google Scholar] [CrossRef] [PubMed] [Green Version]
  14. Berr, A.; Shafiq, S.; Shen, W.H. Histone modifications in transcriptional activation during plant development. Biochim. Biophys. Acta 2011, 1809, 567–576. [Google Scholar] [CrossRef] [PubMed]
  15. Ho, L.; Crabtree, G.R. Chromatin remodelling during development. Nature 2010, 463, 474–484. [Google Scholar] [CrossRef] [PubMed]
  16. Peterson, C.L.; Laniel, M.A. Histones and histone modifications. Curr. Biol. CB 2004, 14, R546–R551. [Google Scholar] [CrossRef] [PubMed] [Green Version]
  17. Ekwall, K. Genome-wide analysis of HDAC function. Trends Genet. TIG 2005, 21, 608–615. [Google Scholar] [CrossRef]
  18. Hollender, C.; Liu, Z. Histone deacetylase genes in Arabidopsis development. J. Integr. Plant Biol. 2008, 50, 875–885. [Google Scholar] [CrossRef]
  19. Hu, Y.; Qin, F.; Huang, L.; Sun, Q.; Li, C.; Zhao, Y.; Zhou, D.X. Rice histone deacetylase genes display specific expression patterns and developmental functions. Biochem. Biophys. Res. Commun. 2009, 388, 266–271. [Google Scholar] [CrossRef]
  20. Liew, L.C.; Singh, M.B.; Bhalla, P.L. An RNA-seq transcriptome analysis of histone modifiers and RNA silencing genes in soybean during floral initiation process. PLoS ONE 2013, 8, e77502. [Google Scholar] [CrossRef] [Green Version]
  21. Aquea, F.; Timmermann, T.; Arce-Johnson, P. Analysis of histone acetyltransferase and deacetylase families of Vitis vinifera. Plant Physiol. Biochem. 2010, 48, 194–199. [Google Scholar] [CrossRef] [PubMed]
  22. Peng, M.; Ying, P.; Liu, X.; Li, C.; Xia, R.; Li, J.; Zhao, M. Genome-Wide Identification of Histone Modifiers and Their Expression Patterns during Fruit Abscission in Litchi. Front. Plant Sci. 2017, 8, 639. [Google Scholar] [CrossRef] [PubMed]
  23. Zhao, L.; Lu, J.; Zhang, J.; Wu, P.Y.; Yang, S.; Wu, K. Identification and characterization of histone deacetylases in tomato (Solanum lycopersicum). Front. Plant Sci. 2014, 5, 760. [Google Scholar] [CrossRef] [PubMed] [Green Version]
  24. Lusser, A.; Brosch, G.; Loidl, A.; Haas, H.; Loidl, P. Identification of maize histone deacetylase HD2 as an acidic nucleolar phosphoprotein. Science 1997, 277, 88–91. [Google Scholar] [CrossRef] [PubMed]
  25. Luo, M.; Liu, X.; Singh, P.; Cui, Y.; Zimmerli, L.; Wu, K. Chromatin modifications and remodeling in plant abiotic stress responses. Biochim. Biophys. Acta 2012, 1819, 129–136. [Google Scholar] [CrossRef] [PubMed]
  26. Luo, M.; Yu, C.W.; Chen, F.F.; Zhao, L.; Tian, G.; Liu, X.; Cui, Y.; Yang, J.Y.; Wu, K. Histone deacetylase HDA6 is functionally associated with AS1 in repression of KNOX genes in Arabidopsis. PLoS Genet. 2012, 8, e1003114. [Google Scholar] [CrossRef] [Green Version]
  27. Yu, C.W.; Tai, R.; Wang, S.C.; Yang, P.; Luo, M.; Yang, S.; Cheng, K.; Wang, W.C.; Cheng, Y.S.; Wu, K. HISTONE DEACETYLASE6 Acts in Concert with Histone Methyltransferases SUVH4, SUVH5, and SUVH6 to Regulate Transposon Silencing. Plant. Cell 2017, 29, 1970–1983. [Google Scholar] [CrossRef] [Green Version]
  28. Kim, J.M.; To, T.K.; Matsui, A.; Tanoi, K.; Kobayashi, N.I.; Matsuda, F.; Habu, Y.; Ogawa, D.; Sakamoto, T.; Matsunaga, S.; et al. Erratum: Acetate-mediated novel survival strategy against drought in plants. Nat. Plants 2017, 3, 17119. [Google Scholar] [CrossRef] [Green Version]
  29. Devoto, A.; Nieto-Rostro, M.; Xie, D.; Ellis, C.; Harmston, R.; Patrick, E.; Davis, J.; Sherratt, L.; Coleman, M.; Turner, J.G. COI1 links jasmonate signalling and fertility to the SCF ubiquitin-ligase complex in Arabidopsis. Plant J. 2002, 32, 457–466. [Google Scholar] [CrossRef] [Green Version]
  30. Zhu, Z.; An, F.; Feng, Y.; Li, P.; Xue, L.; A, M.; Jiang, Z.; Kim, J.M.; To, T.K.; Li, W.; et al. Derepression of ethylene-stabilized transcription factors (EIN3/EIL1) mediates jasmonate and ethylene signaling synergy in Arabidopsis. Proc. Natl. Acad. Sci. USA 2011, 108, 12539–12544. [Google Scholar] [CrossRef] [Green Version]
  31. Chen, X.; Lu, L.; Mayer, K.S.; Scalf, M.; Qian, S.; Lomax, A.; Smith, L.M.; Zhong, X. POWERDRESS interacts with HISTONE DEACETYLASE 9 to promote aging in Arabidopsis. Elife 2016, 5. [Google Scholar] [CrossRef] [PubMed]
  32. Kim, Y.J.; Wang, R.; Gao, L.; Li, D.; Xu, C.; Mang, H.; Jeon, J.; Chen, X.; Zhong, X.; Kwak, J.M.; et al. POWERDRESS and HDA9 interact and promote histone H3 deacetylation at specific genomic sites in Arabidopsis. Proc. Natl. Acad. Sci. USA 2016, 113, 14858–14863. [Google Scholar] [CrossRef] [PubMed] [Green Version]
  33. Zheng, Y.; Ding, Y.; Sun, X.; Xie, S.; Wang, D.; Liu, X.; Su, L.; Wei, W.; Pan, L.; Zhou, D.X. Histone deacetylase HDA9 negatively regulates salt and drought stress responsiveness in Arabidopsis. J. Exp. Bot. 2016, 67, 1703–1713. [Google Scholar] [CrossRef] [PubMed] [Green Version]
  34. Han, Z.; Yu, H.; Zhao, Z.; Hunter, D.; Luo, X.; Duan, J.; Tian, L. AtHD2D Gene Plays a Role in Plant Growth, Development, and Response to Abiotic Stresses in Arabidopsis thaliana. Front. Plant Sci. 2016, 7, 310. [Google Scholar] [CrossRef] [PubMed] [Green Version]
  35. Sridha, S.; Wu, K. Identification of AtHD2C as a novel regulator of abscisic acid responses in Arabidopsis. Plant J. 2006, 46, 124–133. [Google Scholar] [CrossRef] [PubMed]
  36. Ding, B.; Bellizzi Mdel, R.; Ning, Y.; Meyers, B.C.; Wang, G.L. HDT701, a histone H4 deacetylase, negatively regulates plant innate immunity by modulating histone H4 acetylation of defense-related genes in rice. Plant Cell 2012, 24, 3783–3794. [Google Scholar] [CrossRef] [Green Version]
  37. Zhao, J.; Zhang, J.; Zhang, W.; Wu, K.; Zheng, F.; Tian, L.; Liu, X.; Duan, J. Expression and functional analysis of the plant-specific histone deacetylase HDT701 in rice. Front. Plant Sci. 2014, 5, 764. [Google Scholar] [CrossRef] [Green Version]
  38. Zhao, J.; Li, M.; Gu, D.; Liu, X.; Zhang, J.; Wu, K.; Zhang, X.; Teixeira da Silva, J.A.; Duan, J. Involvement of rice histone deacetylase HDA705 in seed germination and in response to ABA and abiotic stresses. Biochem. Biophys. Res. Commun. 2016, 470, 439–444. [Google Scholar] [CrossRef]
  39. Luo, M.; Wang, Y.Y.; Liu, X.; Yang, S.; Wu, K. HD2 proteins interact with RPD3-type histone deacetylases. Plant Signal. Behav. 2012, 7, 608–610. [Google Scholar] [CrossRef] [Green Version]
  40. Liu, X.; Yu, C.W.; Duan, J.; Luo, M.; Wang, K.; Tian, G.; Cui, Y.; Wu, K. HDA6 directly interacts with DNA methyltransferase MET1 and maintains transposable element silencing in Arabidopsis. Plant Physiol. 2012, 158, 119–129. [Google Scholar] [CrossRef] [Green Version]
  41. Yu, C.W.; Liu, X.; Luo, M.; Chen, C.; Lin, X.; Tian, G.; Lu, Q.; Cui, Y.; Wu, K. HISTONE DEACETYLASE6 interacts with FLOWERING LOCUS D and regulates flowering in Arabidopsis. Plant Physiol. 2011, 156, 173–184. [Google Scholar] [CrossRef] [PubMed] [Green Version]
  42. Cannon, S.B.; Mitra, A.; Baumgarten, A.; Young, N.D.; May, G. The roles of segmental and tandem gene duplication in the evolution of large gene families in Arabidopsis thaliana. BMC Plant Biol. 2004, 4, 10. [Google Scholar] [CrossRef] [PubMed] [Green Version]
  43. Xiao, Y.H.; Li, D.M.; Yin, M.H.; Li, X.B.; Zhang, M.; Wang, Y.J.; Dong, J.; Zhao, J.; Luo, M.; Luo, X.Y.; et al. Gibberellin 20-oxidase promotes initiation and elongation of cotton fibers by regulating gibberellin synthesis. J. Plant Physiol. 2010, 167, 829–837. [Google Scholar] [CrossRef] [PubMed]
  44. Wang, L.; Zhu, Y.; Hu, W.; Zhang, X.; Cai, C.; Guo, W. Comparative Transcriptomics Reveals Jasmonic Acid-Associated Metabolism Related to Cotton Fiber Initiation. PLoS ONE 2015, 10, e0129854. [Google Scholar] [CrossRef] [PubMed] [Green Version]
  45. Samuel Yang, S.; Cheung, F.; Lee, J.J.; Ha, M.; Wei, N.E.; Sze, S.H.; Stelly, D.M.; Thaxton, P.; Triplett, B.; Town, C.D.; et al. Accumulation of genome-specific transcripts, transcription factors and phytohormonal regulators during early stages of fiber cell development in allotetraploid cotton. Plant J. 2006, 47, 761–775. [Google Scholar] [CrossRef] [PubMed] [Green Version]
  46. Zhang, M.; Zheng, X.; Song, S.; Zeng, Q.; Hou, L.; Li, D.; Zhao, J.; Wei, Y.; Li, X.; Luo, M.; et al. Spatiotemporal manipulation of auxin biosynthesis in cotton ovule epidermal cells enhances fiber yield and quality. Nat. Biotechnol. 2011, 29, 453–458. [Google Scholar] [CrossRef]
  47. Maury, S.; Sow, M.D.; Le Gac, A.L.; Genitoni, J.; Lafon-Placette, C.; Mozgova, I. Phytohormone and Chromatin Crosstalk: The Missing Link For Developmental Plasticity? Front. Plant Sci. 2019, 10, 395. [Google Scholar] [CrossRef]
  48. Anzola, J.M.; Sieberer, T.; Ortbauer, M.; Butt, H.; Korbei, B.; Weinhofer, I.; Mullner, A.E.; Luschnig, C. Putative Arabidopsis transcriptional adaptor protein (PROPORZ1) is required to modulate histone acetylation in response to auxin. Proc. Natl. Acad. Sci. USA 2010, 107, 10308–10313. [Google Scholar] [CrossRef] [Green Version]
  49. Manzano, C.; Ramirez-Parra, E.; Casimiro, I.; Otero, S.; Desvoyes, B.; De Rybel, B.; Beeckman, T.; Casero, P.; Gutierrez, C.; J, C.D.P. Auxin and epigenetic regulation of SKP2B, an F-box that represses lateral root formation. Plant Physiol. 2012, 160, 749–762. [Google Scholar] [CrossRef] [Green Version]
  50. Petricka, J.J.; Winter, C.M.; Benfey, P.N. Control of Arabidopsis root development. Annu. Rev. Plant Biol. 2012, 63, 563–590. [Google Scholar] [CrossRef] [Green Version]
  51. Nguyen, H.N.; Kim, J.H.; Jeong, C.Y.; Hong, S.W.; Lee, H. Inhibition of histone deacetylation alters Arabidopsis root growth in response to auxin via PIN1 degradation. Plant Cell Rep. 2013, 32, 1625–1636. [Google Scholar] [CrossRef] [PubMed]
  52. Li, L.; Wang, Y. Cross-talk between the H3K36me3 and H4K16ac histone epigenetic marks in DNA double-strand break repair. J. Biol. Chem. 2017, 292, 11951–11959. [Google Scholar] [CrossRef] [PubMed] [Green Version]
  53. Toiber, D.; Erdel, F.; Bouazoune, K.; Silberman, D.M.; Zhong, L.; Mulligan, P.; Sebastian, C.; Cosentino, C.; Martinez-Pastor, B.; Giacosa, S.; et al. SIRT6 recruits SNF2H to DNA break sites, preventing genomic instability through chromatin remodeling. Mol. Cell 2013, 51, 454–468. [Google Scholar] [CrossRef] [PubMed] [Green Version]
  54. Luo, M.; Cheng, K.; Xu, Y.; Yang, S.; Wu, K. Plant Responses to Abiotic Stress Regulated by Histone Deacetylases. Front. Plant Sci. 2017, 8, 2147. [Google Scholar] [CrossRef] [PubMed] [Green Version]
  55. Hu, Y.; Zhang, L.; Zhao, L.; Li, J.; He, S.; Zhou, K.; Yang, F.; Huang, M.; Jiang, L.; Li, L. Trichostatin A selectively suppresses the cold-induced transcription of the ZmDREB1 gene in maize. PLoS ONE 2011, 6, e22132. [Google Scholar] [CrossRef]
  56. Imran, M.; Shafiq, S.; Farooq, M.A.; Naeem, M.K.; Widemann, E.; Bakhsh, A.; Jensen, K.B.; Wang, R.-C. Comparative Genome-wide Analysis and Expression Profiling of Histone Acetyltransferase (HAT) Gene Family in Response to Hormonal Applications, Metal and Abiotic Stresses in Cotton. Int. J. Mol. Sci. 2019, 20, 5311. [Google Scholar] [CrossRef] [Green Version]
  57. Altschul, S.F.; Madden, T.L.; Schäffer, A.A.; Zhang, J.; Zhang, Z.; Miller, W.; Lipman, D.J. Gapped BLAST and PSI-BLAST: A new generation of protein database search programs. Nucleic Acids Res. 1997, 25, 3389–3402. [Google Scholar] [CrossRef] [Green Version]
  58. Imran, M.; Tang, K.; Liu, J.-Y. Comparative Genome-Wide Analysis of the Malate Dehydrogenase Gene Families in Cotton. PLoS ONE 2016, 11, e0166341. [Google Scholar] [CrossRef] [Green Version]
  59. Quevillon, E.; Silventoinen, V.; Pillai, S.; Harte, N.; Mulder, N.; Apweiler, R.; Lopez, R. InterProScan: Protein domains identifier. Nucleic Acids Res. 2005, 33, W116–W120. [Google Scholar] [CrossRef] [Green Version]
  60. Krzywinski, M.; Schein, J.; Birol, I.; Connors, J.; Gascoyne, R.; Horsman, D.; Jones, S.J.; Marra, M.A. Circos: An information aesthetic for comparative genomics. Genome Res. 2009, 19, 1639–1645. [Google Scholar] [CrossRef] [Green Version]
  61. Imran, M.; Liu, J.-Y. Genome-wide identification and expression analysis of the malate dehydrogenase gene family in Gossypium arboreum. Pak. J. Bot. 2016, 48, 1081–1090. [Google Scholar]
  62. Blanc, G.; Wolfe, K.H. Widespread paleopolyploidy in model plant species inferred from age distributions of duplicate genes. Plant Cell 2004, 16, 1667–1678. [Google Scholar] [CrossRef] [PubMed] [Green Version]
  63. Thompson, J.D.; Higgins, D.G.; Gibson, T.J. CLUSTAL W: Improving the sensitivity of progressive multiple sequence alignment through sequence weighting, position-specific gap penalties and weight matrix choice. Nucleic Acids Res. 1994, 22, 4673–4680. [Google Scholar] [CrossRef] [Green Version]
  64. Tamura, K.; Stecher, G.; Peterson, D.; Filipski, A.; Kumar, S. MEGA6: Molecular evolutionary genetics analysis version 6.0. Mol. Biol. Evol. 2013, 30, 2725–2729. [Google Scholar] [CrossRef] [Green Version]
  65. Guo, A.; Zhu, Q.; Chen, X.; Luo, J. GSDS: A gene structure display server. Yi Chuan Hered. 2007, 29, 1023–1026. [Google Scholar] [CrossRef]
  66. Bailey, T.L.; Williams, N.; Misleh, C.; Li, W.W. MEME: Discovering and analyzing DNA and protein sequence motifs. Nucleic Acids Res. 2006, 34, W369–W373. [Google Scholar] [CrossRef] [PubMed]
  67. Lescot, M.; Déhais, P.; Thijs, G.; Marchal, K.; Moreau, Y.; Van de Peer, Y.; Rouzé, P.; Rombauts, S. PlantCARE, a database of plant cis-acting regulatory elements and a portal to tools for in silico analysis of promoter sequences. Nucleic Acids Res. 2002, 30, 325–327. [Google Scholar] [CrossRef] [PubMed]
  68. Saeed, A.; Sharov, V.; White, J.; Li, J.; Liang, W.; Bhagabati, N.; Braisted, J.; Klapa, M.; Currier, T.; Thiagarajan, M. TM4: A free, open-source system for microarray data management and analysis. Biotechniques 2003, 34, 374–378. [Google Scholar] [CrossRef] [PubMed] [Green Version]
  69. Shafiq, S.; Chen, C.; Yang, J.; Cheng, L.; Ma, F.; Widemann, E.; Sun, Q. DNA Topoisomerase 1 prevents R-loop accumulation to modulate auxin-regulated root development in rice. Mol. Plant 2017, 10, 821–833. [Google Scholar] [CrossRef] [Green Version]
  70. Livak, K.J.; Schmittgen, T.D. Analysis of relative gene expression data using real-time quantitative PCR and the 2−ΔΔCT method. Methods 2001, 25, 402–408. [Google Scholar] [CrossRef]
  71. Voorrips, R.E. MapChart: Software for the graphical presentation of linkage maps and QTLs. J. Hered. 2002, 93, 77–78. [Google Scholar] [CrossRef] [PubMed] [Green Version]
  72. Sun, Z.; Wang, X.; Liu, Z.; Gu, Q.; Zhang, Y.; Li, Z.; Ke, H.; Yang, J.; Wu, J.; Wu, L.; et al. Genome-wide association study discovered genetic variation and candidate genes of fibre quality traits in Gossypium hirsutum L. Plant Biotechnol. J. 2017, 15, 982–996. [Google Scholar] [CrossRef] [PubMed] [Green Version]
Figure 1. Phylogenetic relationships of histone deacetylases (HDACs) from G. hirsutum, G. raimondii, G. arboretum, Arabidopsis thaliana and Oryza sativa. The unrooted phylogenetic tree was constructed with MEGA 6 using the neighbor-joining method and the bootstrap analysis was performed with 1000 replicates. The HDACs from G. hirsutum, G. raimondii, G. arboretum, Arabidopsis thaliana and Oryza sativa are marked with red, green, purple, blue and black dots, respectively. The branches of each subgroup are indicated in a specific color. RPD3: reduced potassium dependency 3, SIR2: silent information regulator 2.
Ijms 21 00321 g001
Figure 2. Phylogenetic relationships, gene structure analysis, and domain organization of HDACs in G. hirsutum, G. raimondii and G. arboretum. (A) The unrooted phylogenetic tree was constructed with MEGA 6 using the neighbor-joining method and the bootstrap analysis was performed with 1000 replicates. The HDACs from G. hirsutum, G. raimondii, and G. arboretum are marked with red, green, and purple dots, respectively. The branches of each subgroup are indicated in a specific color. (B) The intron-exon structure of HDACs from G. hirsutum, G. raimondii and G. arboretum. Orange boxes and grey lines represent exons and introns, respectively. (C) Domain organization of HDACs from G. hirsutum, G. raimondii and G. arboretum.
Ijms 21 00321 g002
Figure 3. Chromosomal distribution and gene duplication of HDACs in G. hirsutum, G. raimondii, and G. arboretum. The chromosome numbers are indicated in boxes and represented as A1–A13 and D1-D13 for G. hirsutum, Ga1–Ga13 for G. arboretum, and Gr1–Gr13 for G. raimondii. Segment duplication of the HDAC genes is represented using green, while blue and purple represent the orthologous gene pairs between tetraploids and diploids, and black lines represent the orthologous genes pairs between diploid species, respectively.
Ijms 21 00321 g003
Figure 4. Gene expression analysis of G. hirsutum HDACs in different tissues and at different stages of fiber development (A), and in response to cold (4 °C), heat (38 °C), salt (400 mM), and PEG 6000 (20%) stress (B) from RNA-seq. The illumina reads of RNA-seq data were retrieved from the NCBI SRA database. The color scale on the bottom of the heatmap indicates the FPKM (Fragments Per Kilobase of transcript per Million mapped reads)-normalized log2 transformed counts. DPA: days post anthesis.
Ijms 21 00321 g004
Figure 5. Gene expression validation of G. hirsutum HDACs using qRT-PCR in different tissues (A) and at different stages of fiber development (B). RNA from root, leaf, stem, flowers and different stages of fiber development were extracted and reverse transcribed. qRT-PCR was performed and the data was normalized to UBQ7. The relative gene expression in different tissues is presented in the heatmap. The data presented are the average of three biological replicates; the bar represents the standard deviation.
Ijms 21 00321 g005
Figure 6. Expression pattern of G. hirsutum HDACs in response to abiotic stresses and phytohormones. RNA from roots after 24 h of CK (control), cadmium (Cd), zinc (Zn), abscisic acid (ABA), auxin (NAA), DNA damage (methyl methanesulfonate (MMS)), cold, salt (NaCl), and drought (PEG 4000) was extracted and reverse transcribed. UBQ7 was used as an internal control for qRT-PCR. The data presented are the average of three biological replicates, where the bar represents the standard deviation.
Ijms 21 00321 g006
Figure 7. Distribution of co-localized HDACs on the chromosomes of the A and D genomes of G. hirsutum. The scale represents the physical position of genes and quantitative trait locus (QTL)-linked markers in megabases (Mb). QTLs and single-nucleotide polymorphisms (SNPs) related to fiber length (FL), fiber elongation (FE), fiber micronaire (FM), fiber strength (FS), and fiber uniformity (FU) are shown. Asterisks (*) indicate the G. hirsutum HDACs that were co-localized with QTLs/SNPs of different traits of fiber.
Ijms 21 00321 g007

