Article

Profiling of O-acetylated Gangliosides Expressed in Neuroectoderm Derived Cells

by
Sumeyye Cavdarli
1,2,
Nao Yamakawa
1,
Charlotte Clarisse
1,
Kazuhiro Aoki
3,
Guillaume Brysbaert
1,
Jean-Marc Le Doussal
2,
Philippe Delannoy
1,
Yann Guérardel
1 and
Sophie Groux-Degroote
1,*
1
Univ. Lille, CNRS, UMR 8576–UGSF-Unité de Glycobiologie Structurale et Fonctionnelle, F-59000 Lille, France
2
OGD2 Pharma, Institut de Recherche en Santé de l’Université de Nantes, 44007 Nantes, France
3
Complex Carbohydrate Research Center, University of Georgia, Athens, GA 30602, USA
*
Author to whom correspondence should be addressed.
Int. J. Mol. Sci. 2020, 21(1), 370; https://0-doi-org.brum.beds.ac.uk/10.3390/ijms21010370
Submission received: 22 November 2019 / Revised: 31 December 2019 / Accepted: 31 December 2019 / Published: 6 January 2020
(This article belongs to the Special Issue Gangliosides: Modes of Action and Cell Fates)

Abstract

:
The expression and biological functions of oncofetal markers GD2 and GD3 were extensively studied in neuroectoderm-derived cancers in order to characterize their potential as therapeutic targets. Using immunological approaches, we previously identified GD3, GD2, and OAcGD2 expression in breast cancer (BC) cell lines. However, antibodies specific for O-acetylated gangliosides are not exempt of limitations, as they only provide information on the expression of a limited set of O-acetylated ganglioside species. Consequently, the aim of the present study was to use structural approaches in order to apprehend ganglioside diversity in melanoma, neuroblastoma, and breast cancer cells, focusing on O-acetylated species that are usually lost under alkaline conditions and require specific analytical procedures. We used purification and extraction methods that preserve the O-acetyl modification for the analysis of native gangliosides by MALDI-TOF. We identified the expression of GM1, GM2, GM3, GD2, GD3, GT2, and GT3 in SK-Mel28 (melanoma), LAN-1 (neuroblastoma), Hs 578T, SUM 159PT, MDA-MB-231, MCF-7 (BC), and BC cell lines over-expressing GD3 synthase. Among O-acetylated gangliosides, we characterized the expression of OAcGM1, OAcGD3, OAcGD2, OAcGT2, and OAcGT3. Furthermore, the experimental procedure allowed us to clearly identify the position of the sialic acid residue that carries the O-acetyl group on b- and c-series gangliosides by MS/MS fragmentation. These results show that ganglioside O-acetylation occurs on both inner and terminal sialic acid residue in a cell type-dependent manner, suggesting different O-acetylation pathways for gangliosides. They also highlight the limitation of immuno-detection for the complete identification of O-acetylated ganglioside profiles in cancer cells.

1. Introduction

Gangliosides are acidic glycosphingolipid carrying one or several sialic acid residues located in lipid raft in which they play an important role in the regulation of cell signaling [1]. Their biosynthesis process has been well established as depicted in Figure 1 [2]. Indeed, lipid raft domains are microdomains from which major cellular pathways are engaged, not only in normal physiological conditions, but also under pathological conditions, such as neurodegenerative diseases or cancer. In neuroectoderm-derived cancers, gangliosides over-expression participates to tumor aggressiveness. For example, in MDA-MB-231 breast cancer cell line, GD2 over-expression increases tumorigenesis by activating c-Met receptor [3]. These properties led to the characterization of gangliosides as tumor associated carbohydrate antigens (TACA). GD3 and GD2 have been described as TACA and also oncofetal markers in melanoma, small cell lung carcinoma (SCLC), and neuroblastoma [4,5], and are potent targets for immunotherapy, especially GD2. Therapeutic antibodies developed against GD2 have been approved by the Food Drug Administration (FDA) as dinutuximab and European Medicine Agency (EMA) as qarziba for the treatment of high-risk pediatric neuroblastoma [6]. The standard care for neuroblastoma is the use of intense chemotherapy to achieve clinical remission. However, the complete remission of patients is hard to achieve and relapse occurs in 50% of cases. The use of anti-GD2 therapeutic antibodies for relapsing neuroblastoma has shown promising results in patients, but also severe side toxicities such as allodynia [6]. Indeed, GD2 expression is not exclusive to cancer cells, and peripheral nerve fibers are expressing GD2, which explains the downside effects. Interestingly, the use of an antibody targeting specifically the O-acetylated form of GD2 (OAcGD2) suggested that OAcGD2 expression is exclusive to cancer cells and tissues [7]. Terme et al. have shown that 8B6 antibody targeting OAcGD2 exhibits the same efficiency as anti-GD2 antibody without inducing allodynia [8]. Besides, O-acetylated GD2 has been shown to promote neuroblastoma growth in vitro, and in vivo [8,9]. Similarly, O-acetylated GD3 (OAcGD3) protects glioblastoma cells from GD3 induced mitochondrial apoptosis [10,11]. These properties exhibited by the O-acetylated forms of GD3 and GD2 pose them as valuable alternative therapeutic targets compared to their non-O-acetylated forms. However, there is very limited knowledge about ganglioside O-acetylation mechanisms. Previous studies using immunodetection analysis established that breast cancer cell lines displayed major expression of GD3, GD2, and OAcGD2, but not OAcGD3 [12]. Baumann and coworkers have previously reported that CASD1 was the only human sialyl-O-acetyltransferase (SOAT), and suggested it would act on the sialic acid donor CMP-Neu5Ac rather than on glycolipid itself [13]. The O-acetylation of gangliosides catalyzed by SOAT may occur on the hydroxyl residues of C4, C7, C8, or C9. In contrast, our work suggests that the OAcGD2 is generated directly from GD2 in breast cancer cells [12]. In order to get insights into the biosynthesis mechanisms underlying ganglioside O-acetylation process, we decided to establish the pattern of O-acetylated gangliosides of neuroectoderm-derived cell lines that express tumor-associated GD2 and GD3, with a special interest for OAcGD3 and OAcGD2.
Indeed, despite the biological relevance of O-acetylated GSL in cancer, very little is known about their distributions in cells and tissues and about their fine chemical structure, i.e., the position of the O-acetyl group(s), and which sialic acid residue is O-acetylated in di- or tri-sialylated ganglioside species. This is partly related to the fact that detection and analysis of O-acetylated gangliosides remain challenging due to the lability of the O-acetyl group using classical procedures and to the lack of specific antibodies that show minimal cross-reactivity with non-acetylated glycan moieties [14,15,16]. In this context, we established the expression patterns of gangliosides in neuroectoderm-derived cancers cells using mass spectrometry. To this end, we combined a purification and extraction procedure for native gangliosides analysis by MALDI-TOF, avoiding the loss of the O-acetyl modifications. GM1, GM2, GM3, GD2, GT2, and GT3 gangliosides have been identified in SK-Mel-28 melanoma cells, in LAN-1 neuroblastoma cells, in Hs 578T, SUM159PT, MDA-MB-231, MCF-7 BC cells, and in BC cell lines over-expressing GD3 synthase. Among O-acetylated gangliosides, we characterized the expression of OAcGM1, OAcGD3, OAcGD2, OAcGT3, OAcGT2. This method allowed us to identify the sialic acid residues carrying the O-acetyl groups on b- and c-series gangliosides by MS/MS fragmentation, giving us insights into the cellular O-acetylation mechanisms.

2. Results

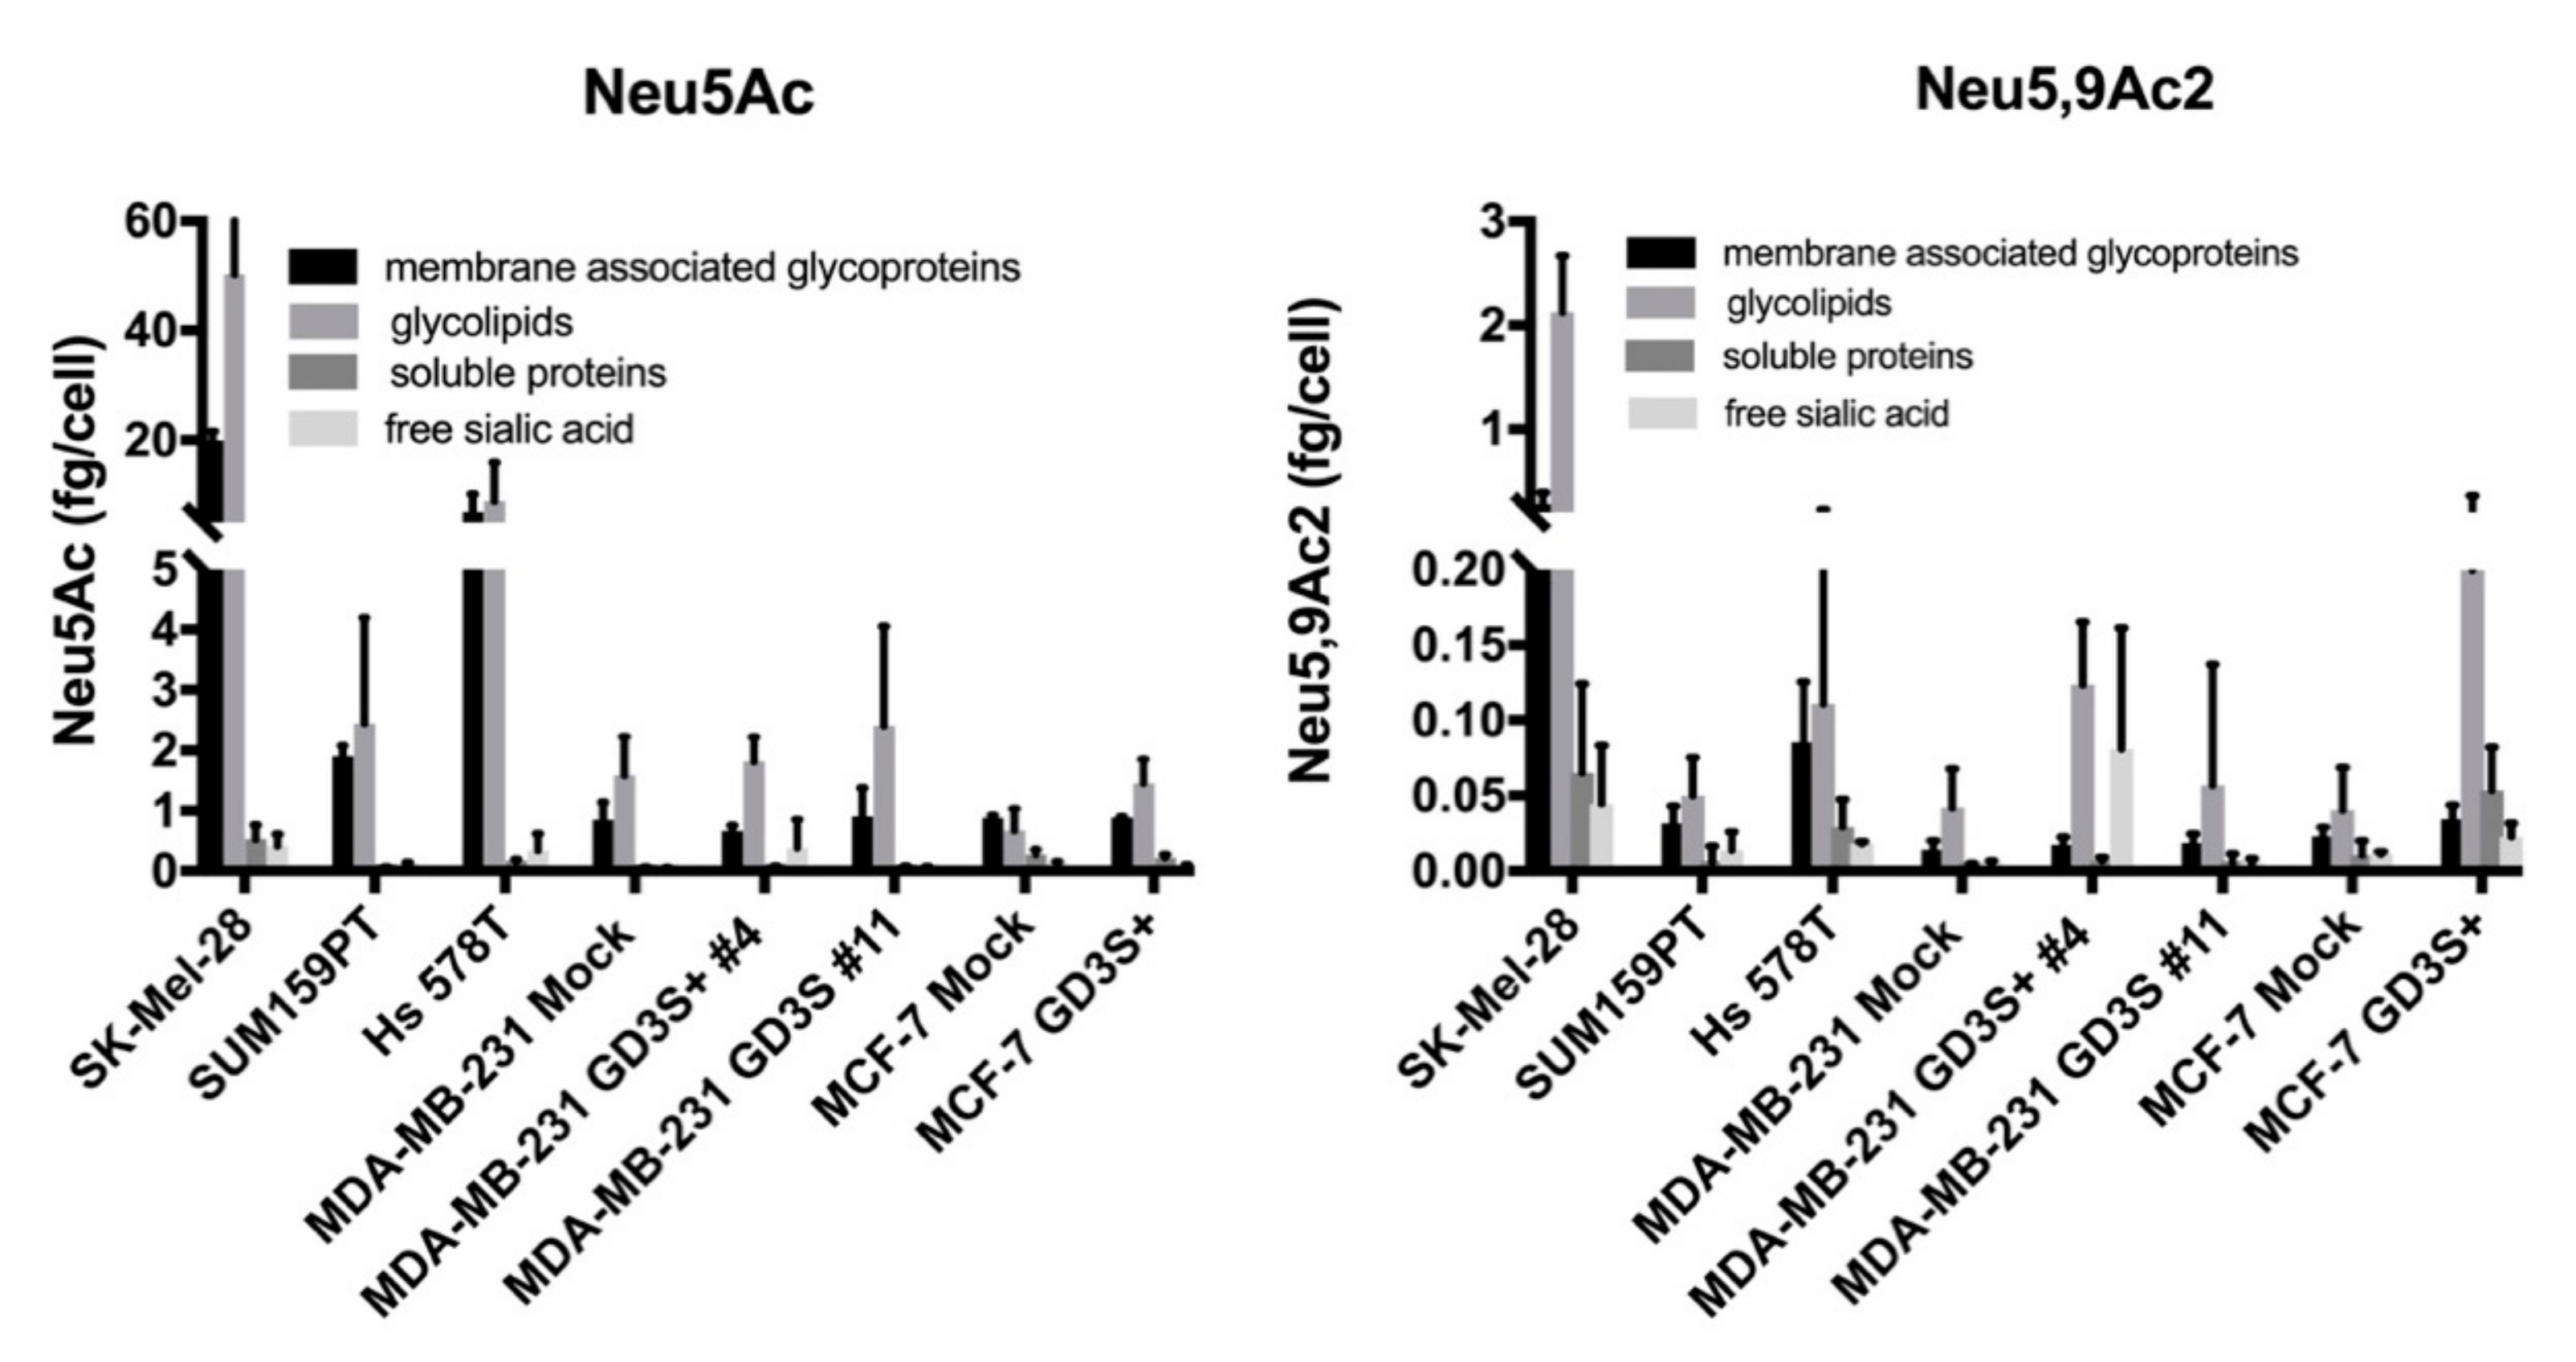
2.1. O-acetylated Sialic Acid Species Are Highly Expressed on Glycolipids in Cancer Cells

As previously described, we performed the quantification of sialic acid species in cancer cells using LC-ESI/MS analysis of DMB-Sia derivatives [12]. Our results suggest that the main O-acetylated sialic acid species expressed by these cells is Neu5,9Ac2. Here, we quantified the amounts of total sialic acid (Neu5Ac) and acetylated sialic acid (Neu5,9Ac2) in different cell fractions. Dried pellets were fractionated into membrane associated glycoproteins, soluble proteins, glycolipids, and free sialic acid before sialic acid extraction and DMB derivatization. As depicted in Figure 2, the amounts of Neu5Ac remain higher in all fractions compared to Neu5,9Ac2 levels, reaching 60 fg/cell and 3 fg/cell, respectively.
While the amounts of Neu5Ac and Neu5,9Ac2 were markedly cell-type dependent, the highest amount of sialic acid was quantified in the glycolipid fraction, except for the MDA-MB-231 GD3S+ clone #4, which exhibited high expression of Neu5,9Ac2 in the free sialic acid fraction. Besides the glycolipid fraction, the highest expression of Neu5,9Ac2 was detected in the membrane associated glycoprotein fraction for SK-MEL-28, MDA-MB-231 GD3S+ clones #4 and #11, MCF-7 GD3S+, progressively decreasing in Hs 578T, SUM159PT, MDA-MB-231, and MCF-7 (Figure 2). These results complete our previous study, confirming that GD3 synthase over-expression increases sialic acid O-acetylation. In order to supplement this approach and to identify the O-acetylated ganglioside species, native gangliosides extracted from all cell lines were analyzed by MALDI-QIT-TOF.

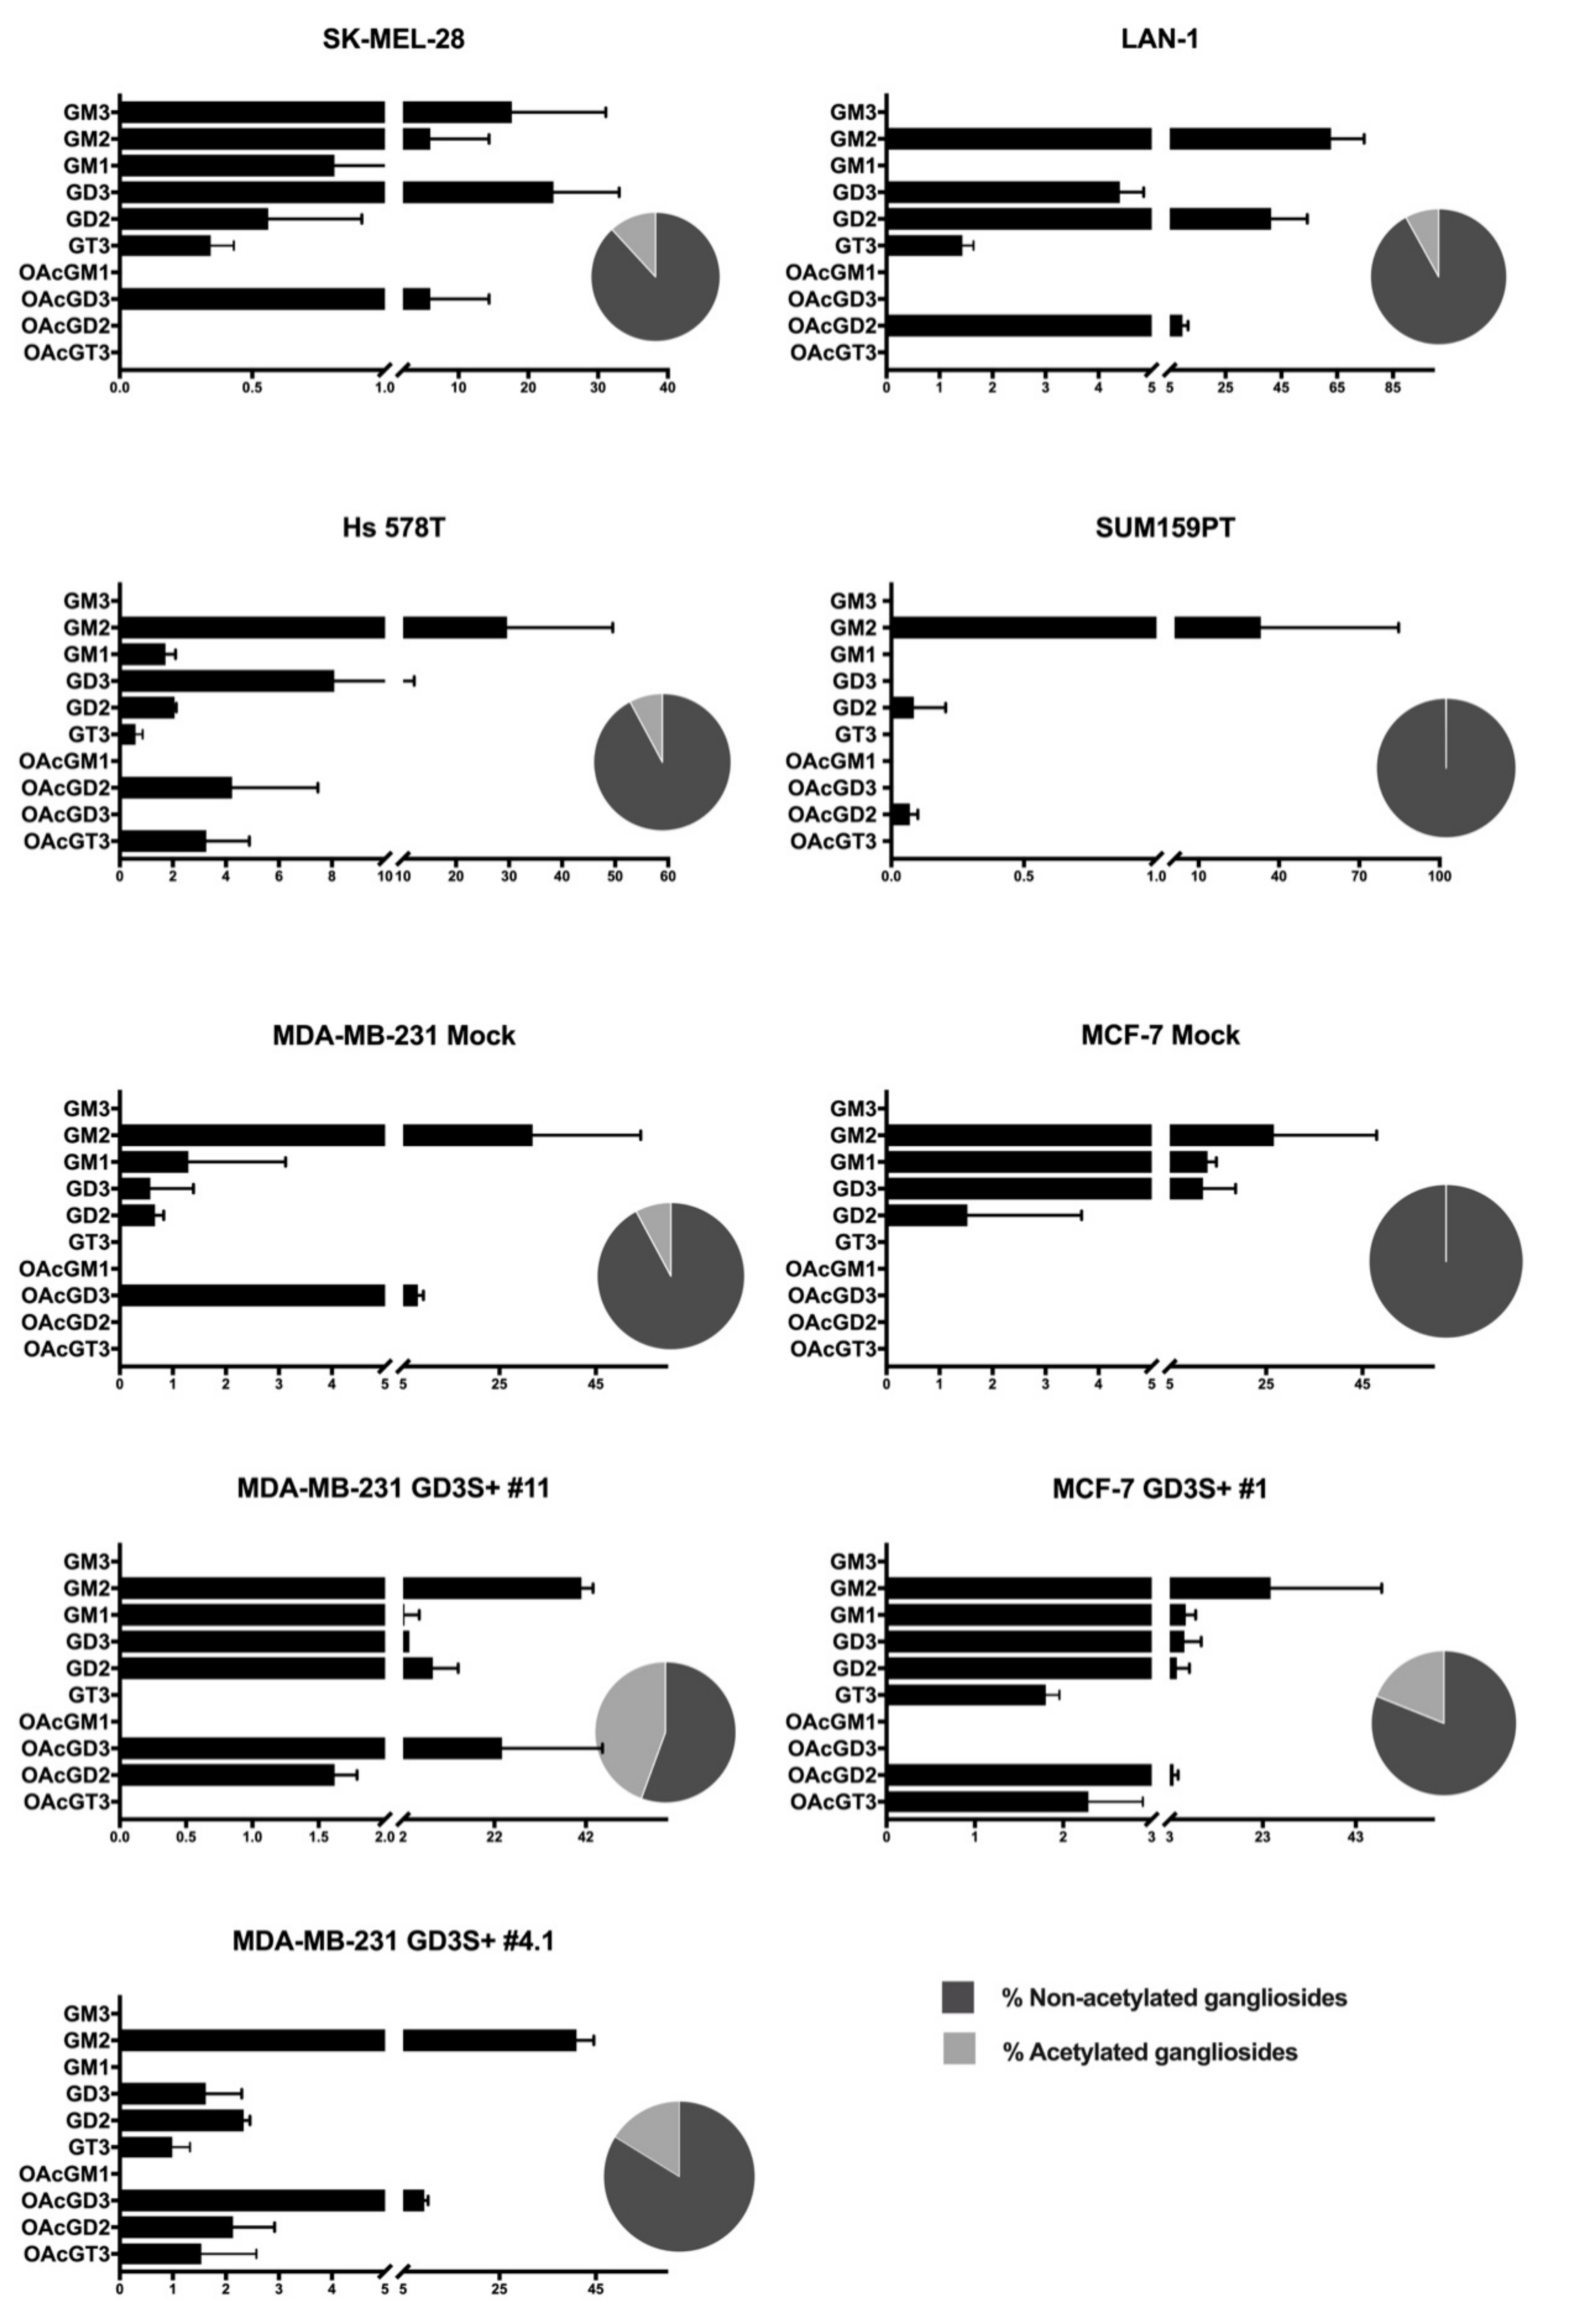
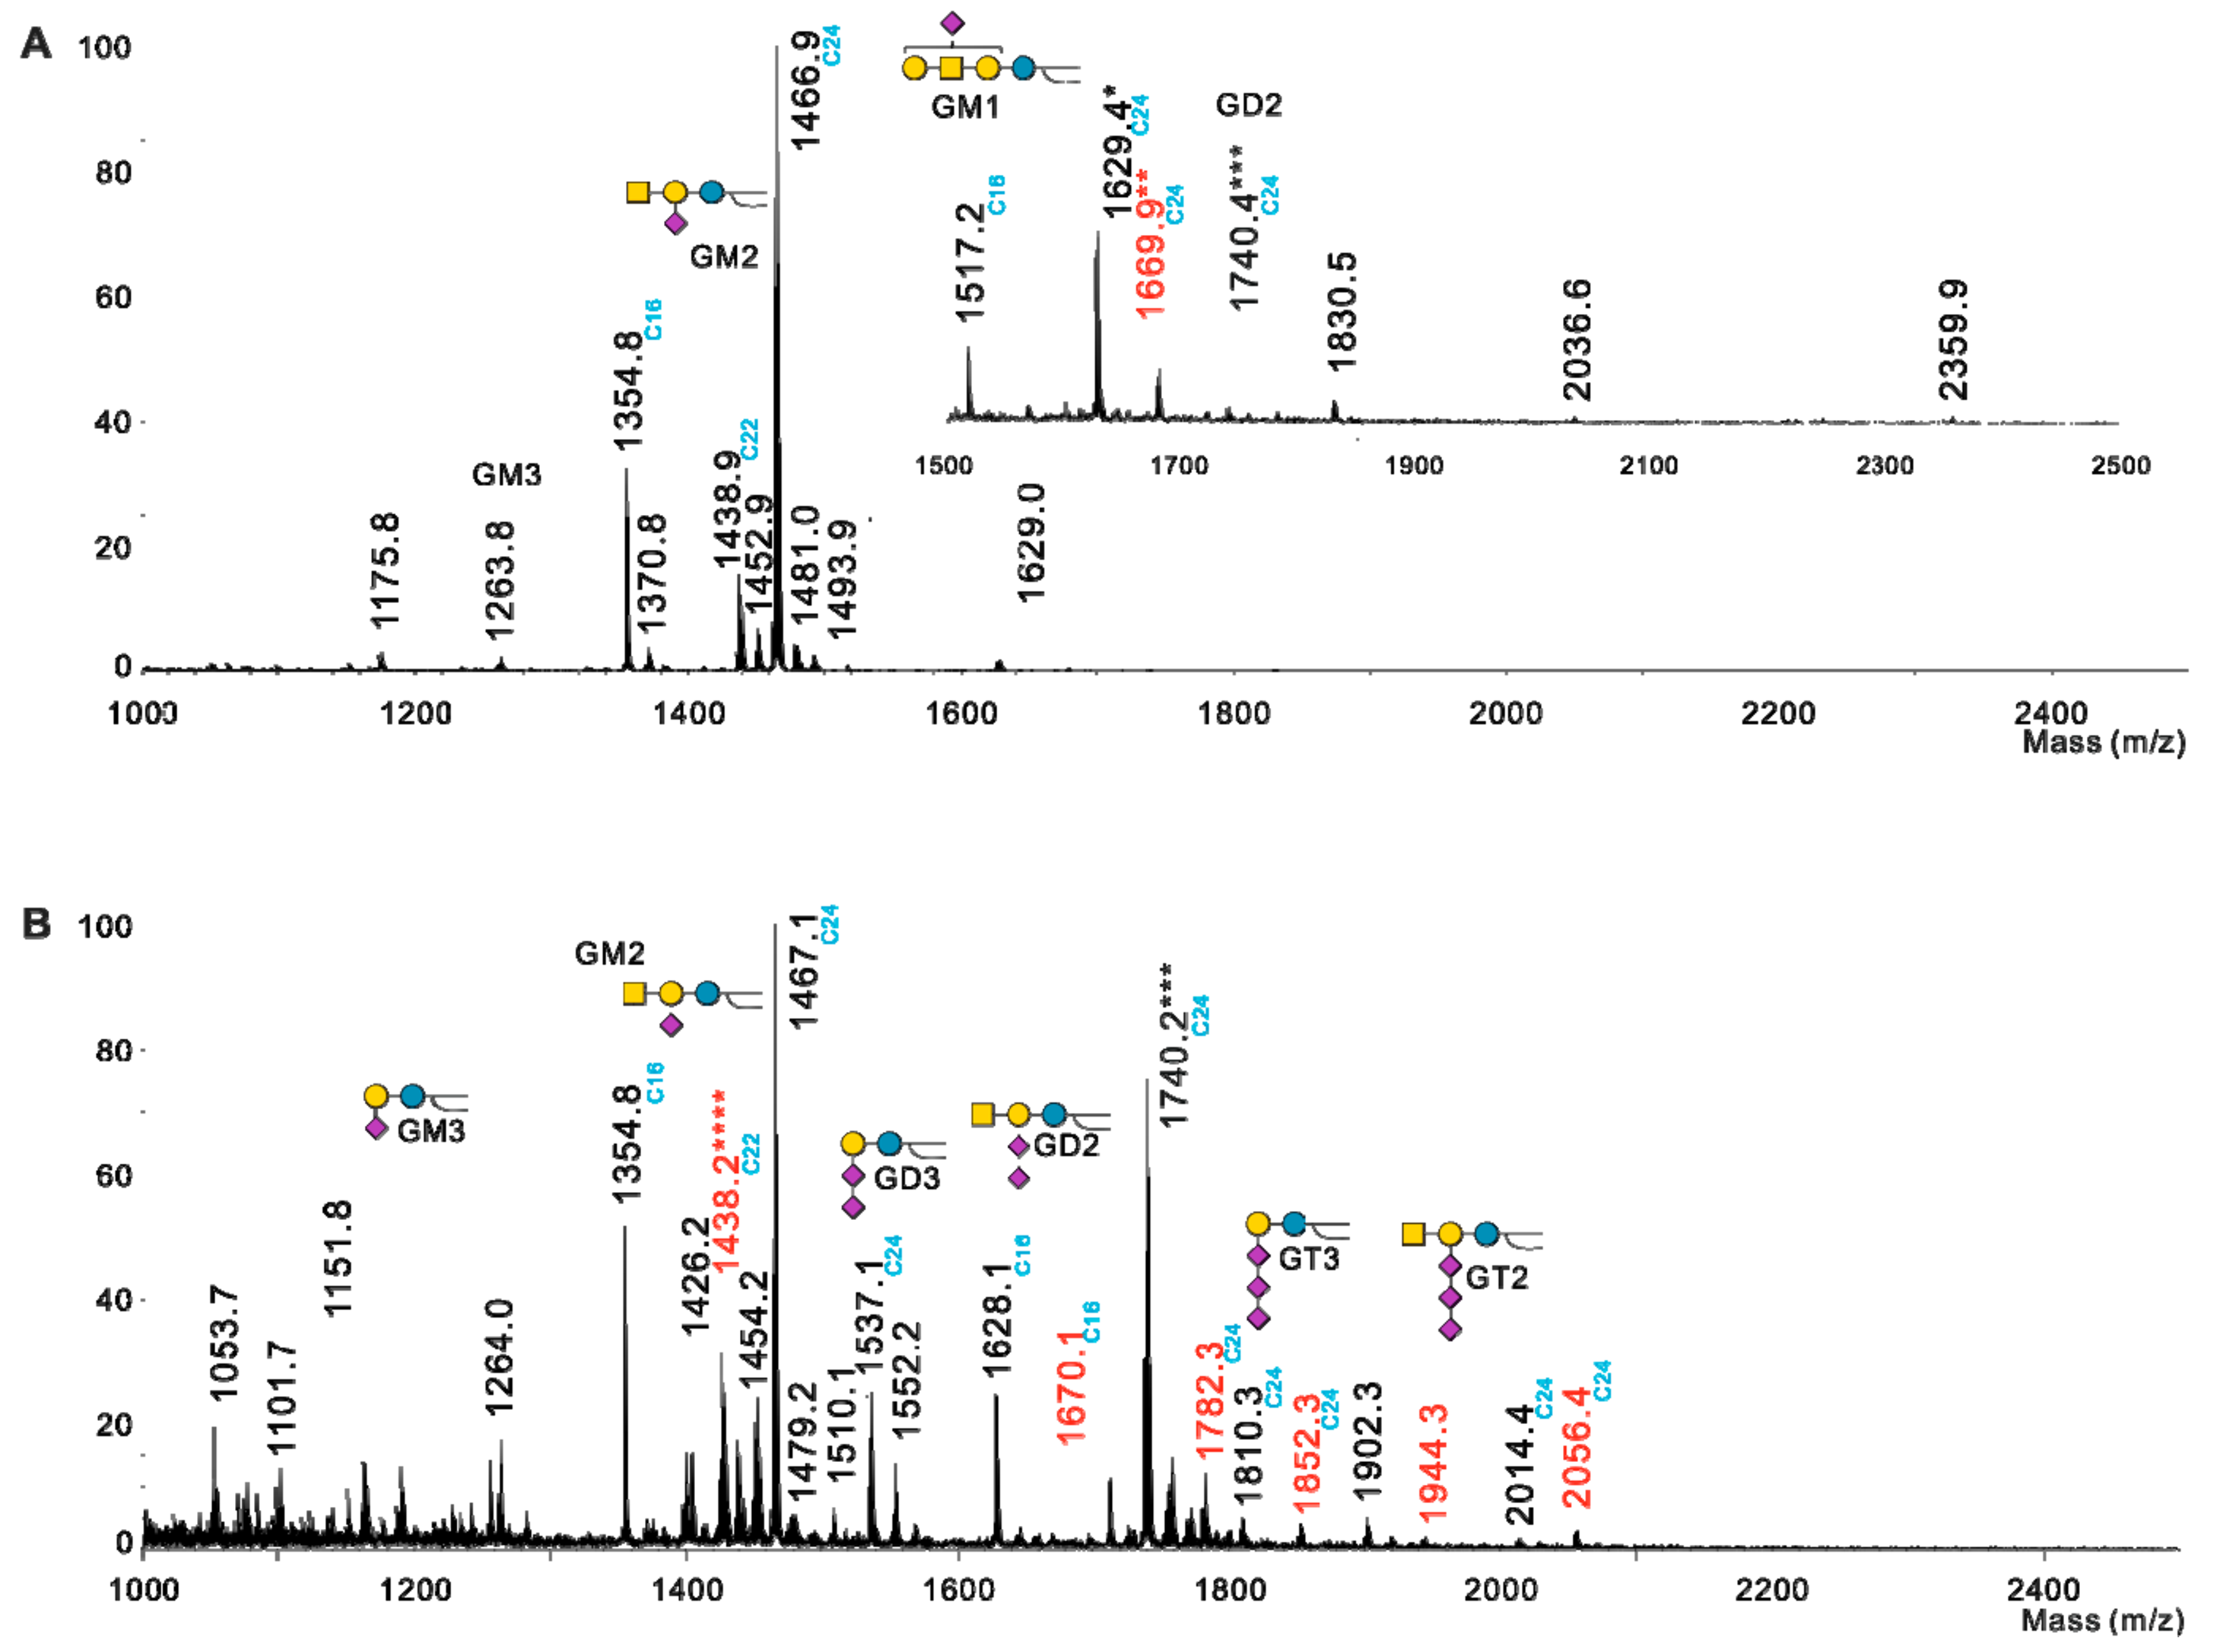
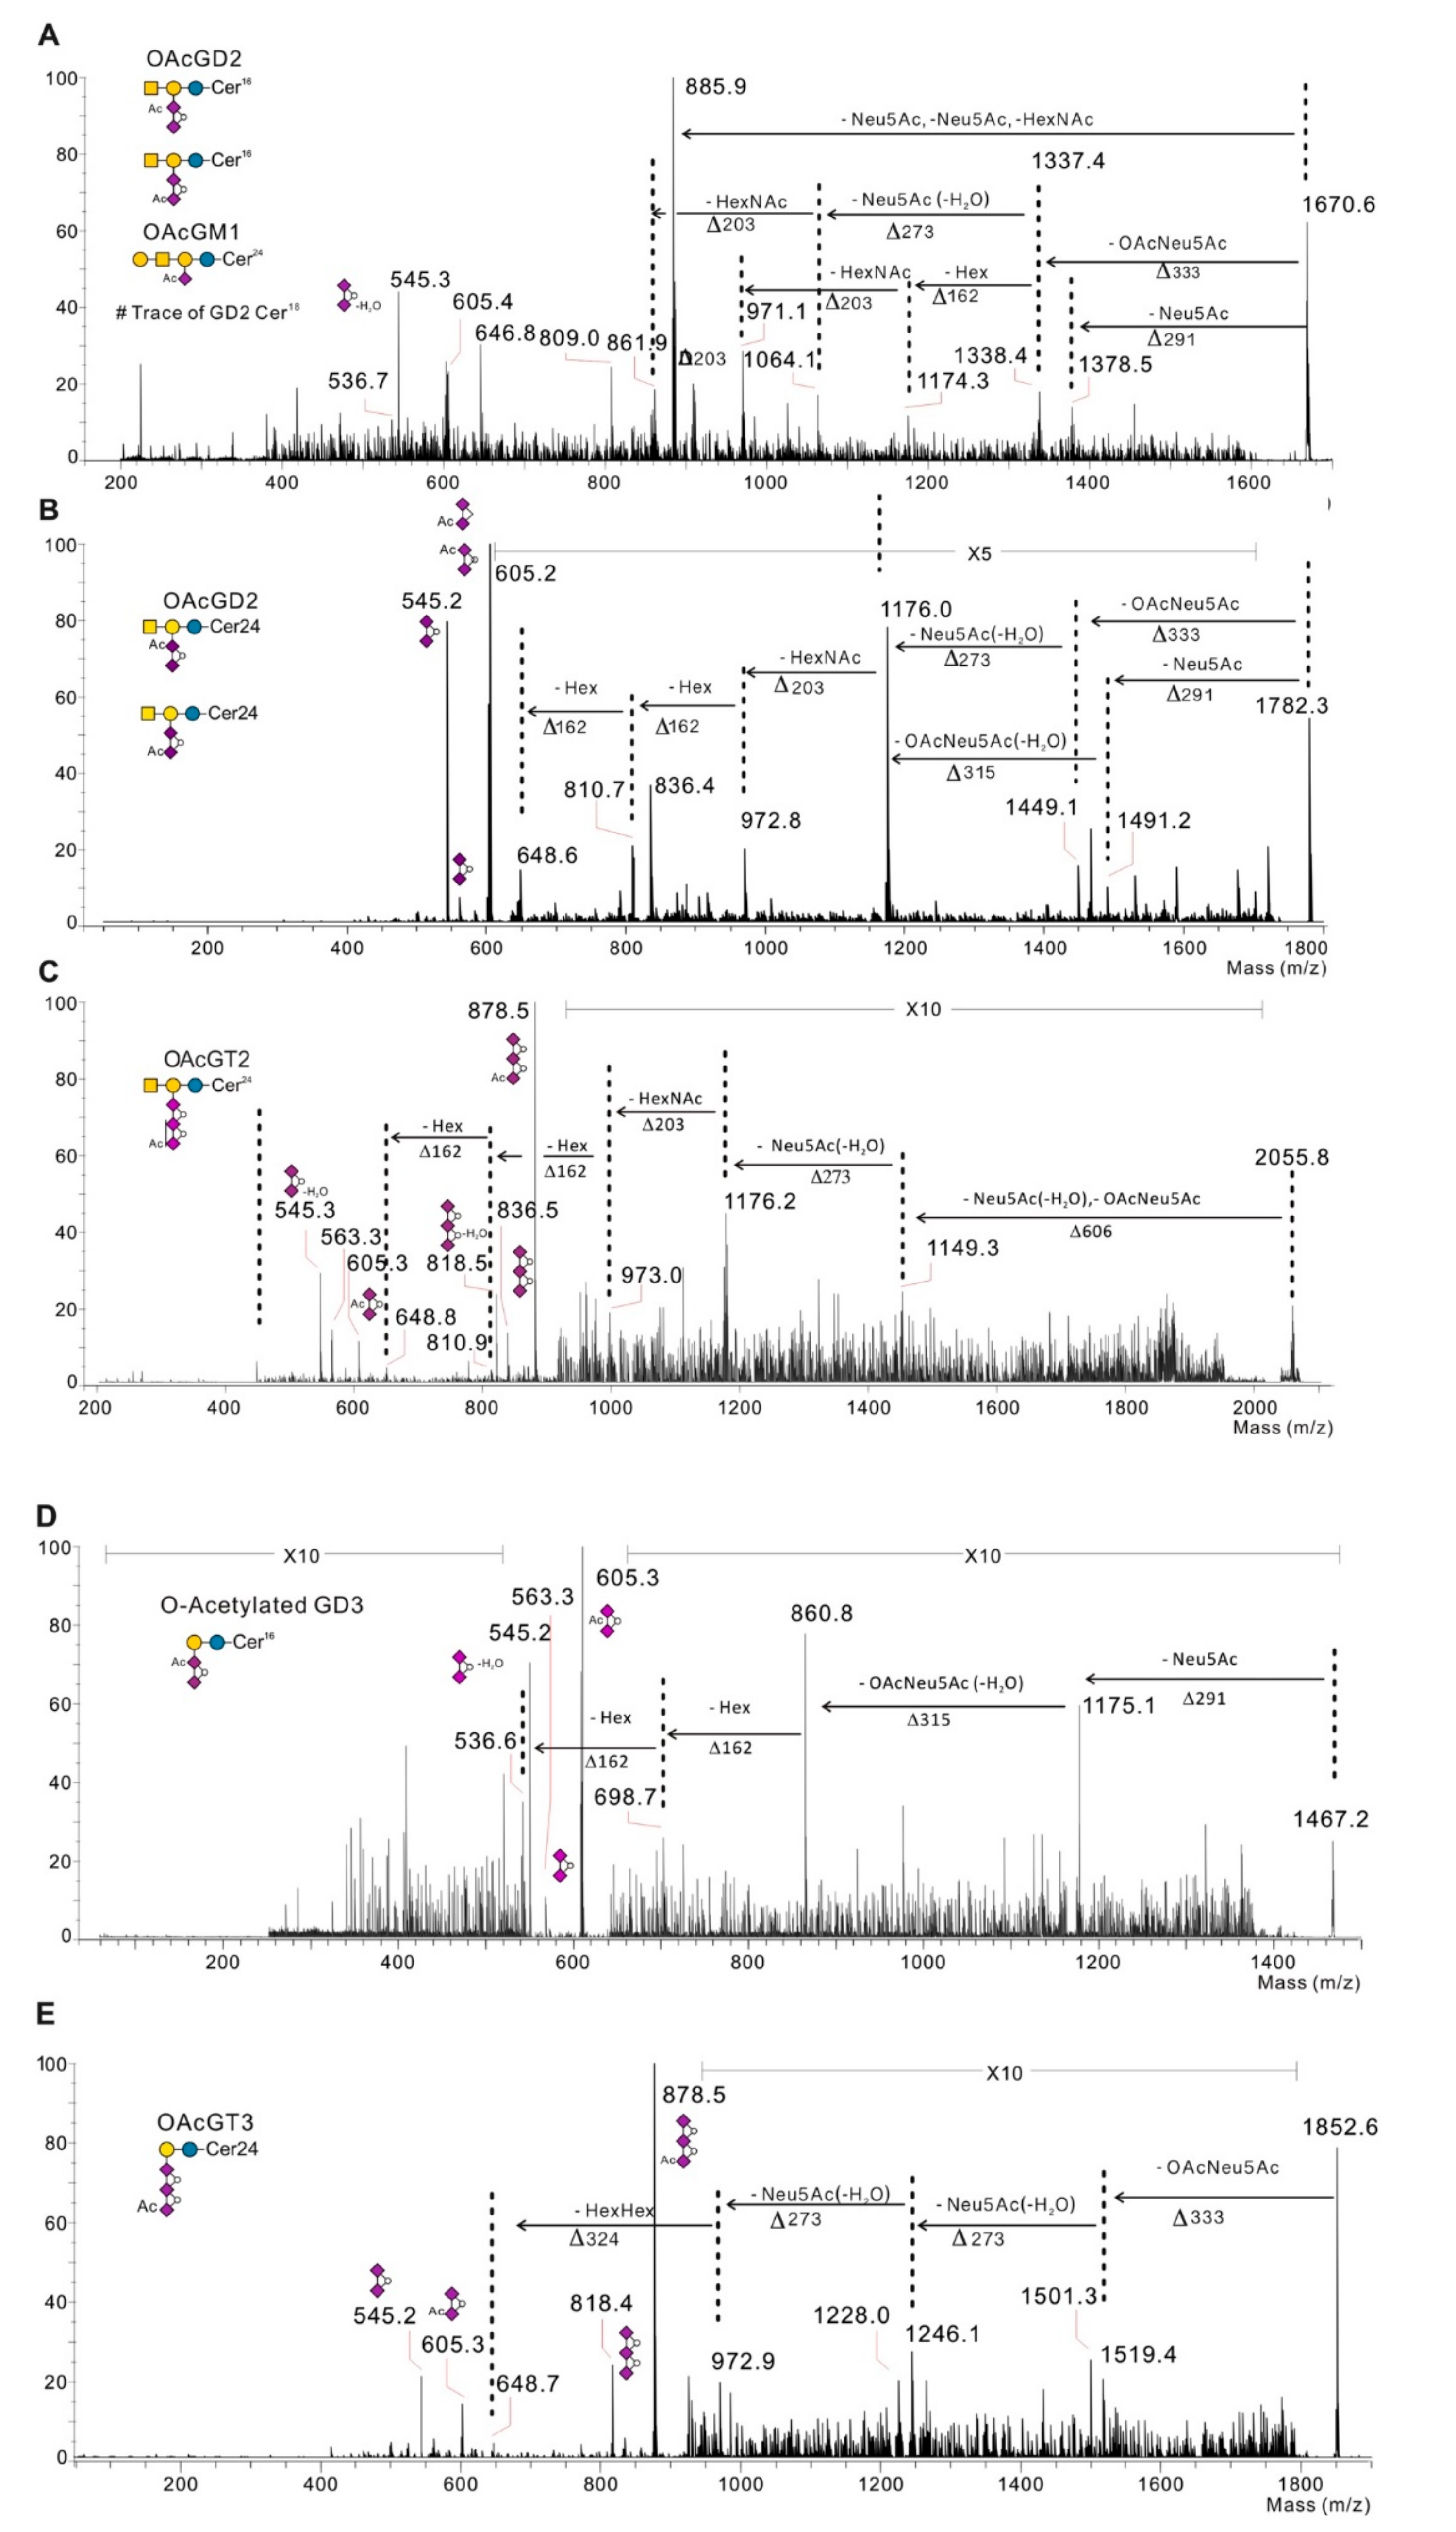
2.2. Profiling of O-acetylated Gangliosides in Breast Cancer, Melanoma, and Neuroblastoma Cell Lines

The detection of O-acetylated gangliosides by mass spectrometry is a challenging issue due to the loss of O-acetyl groups following chemical treatments usually performed to improve purification (mild saponification of non-ceramide lipids) or detection sensibility in mass spectrometry analysis (permethylation). Here, we used extraction and purification methods designed to preserve O-acetylation of GSL. Potentially O-acetylated GSL were extracted from dried pellets on eight different neuroectoderm-derived cell lines and analyzed in native forms by MALDI-QIT-TOF. Ganglioside expression patterns were established based on the calculated compositions of individual signals and further confirmed by MS/MS analyses. It is noteworthy that most di- and tri-sialylated GSL were observed mostly at m/z [M−H2O−H] and [M−2H2O−H] adducts, respectively (Table 1). MS/MS fragmentation analyses showed that dehydration of GSL resulted from the lactonization of oligosialic acids [17]. Examples of spectra obtained in Hs 578T and MDA-MB-231 GD3S+ clone #4 are presented in Figure 3. Mass spectra obtained for Hs 578T BC cell line led to the identification of GM3, GM2, GM1, OAcGM1, OAcGD2, and of trace amounts of GD2, OAcGD3, and OAcGT3 (Figure 3A). In MDA-MB-231 GD3S+ clone #4, GM3, GM2, GM1, GD3, GD2, GD1b, GT3, GT2, OAcGD3, OAcGD2, and OAcGT3 were detected (Figure 3B). These two cell lines exhibit similar expression patterns of gangliosides, but a cell-type dependent pattern of O-acetylated gangliosides species (Figure 3). These two cell lines exhibit similar expression patterns of gangliosides, but a cell-type dependent pattern of O-acetylated gangliosides species (Figure 3).
As depicted in Figure 4, MS/MS fragmentation has been performed for O-acetylated gangliosides so as to confirm signal identification, especially when one signal might correspond to two isobaric structures. Moreover, in the case of the identification of two species separately for one molecular ion by MS/MS fragmentation, the fragmentation allows the comparison of the relative amount of the two species characterized. For example, the fragmentation of the signal at m/z 1670 in Hs 578T confirmed the identification of the following two species: OAcGD2 (d18:1 Cer16:0) and OAcGM1 (d18:1 Cer24:0) (Figure 4A).
As depicted in Table 1, our results indicate that the pattern of ganglioside O-acetylation is not representative of neuroectoderm derived cancer cells, but is cell type-dependent, while the representative pattern of expressed gangliosides is similar between the different cell lines. Basically, GM1, GM2, GM3, and GD2 are expressed in all cell lines tested. GD3 is expressed in SK-Mel-28, LAN1, MDA-MB-231 GD3S+ clone #4 and #11. GT3 and GT2 are expressed in MDA-MB-231 GD3S+ clone #4 and #11. Regarding O-acetylated gangliosides species pattern in cancer cell lines, OAcGD2 is expressed in all cell lines except SK-Mel-28, MDA-MB-231, and MCF-7. OAcGD3 is expressed in SK-Mel-28, LAN-1, Hs 578T, MDA-MB-231 GD3S+ clone #11, and MCF-7 GD3S+ clone #1. OAcGT3 and OAcGT2 are in turn expressed in MDA-MB-231 GD3 synthase overexpressing clones (Figure 5). The method used here led us to estimate the structure of sphingoid base and fatty acid chain according to the m/z detected for all ganglioside species identified. Most gangliosides exhibit a ceramide moiety corresponding to the combination of a long chain base sphingosine d18:1 and a fatty acid chain composed mainly by C16 or C24. C14, C18, and C22 are detected as minor components in cells. MCF-7 cell line displays variations on ceramide moiety as mixture of different combinations of the sphingosine base d18:1 and a highly hydroxylated ceramide (Supplementary Figure S1). Besides, C16 and C18 fatty acids are saturated, whereas C24 is always present in its saturated and unsaturated form (data not shown).

2.3. O-acetylated Ganglioside Species Expression Increases in GD3 Synthase Overexpressing Clones

The relative amounts of the different ganglioside species were calculated by integrating the intensity of individual signals detected on MALDI-QIT-TOF mass spectra. The proportion of O-acetylated gangliosides was 1% in SUM159PT, 9% in MDA-MB-231 and MCF-7, 10% in LAN-1 and Hs 578T, and 12% in SK-Mel-28 (Figure 5). The highest amounts of O-acetylated gangliosides were observed in clones over-expressing GD3 synthase in a cell dependent manner: 18% in MDA-MB-231 GD3S+ clone #4, 22% in MCF-7 GD3S+, and 50% in MDA-MB-231 GD3S+ clone #11. In parallel, we observed that OAcGD3 was the most expressed O-acetylated ganglioside species compared to OAcGD2 and OAcGT3. OAcGD3 expression was quantified as 23.6% of total gangliosides in MDA-MB-231 GD3S+ clone #11, 9.5% in MDA-MB-231 GD3S+ clone #4, 9% in MDA-MB-231 mock, 5.9% in SK-MEL-28. OAcGD2 expression remains lower than OAcGD3 content in all cell lines.
Besides the diversity observed for the position of the O-acetyl group on sialic acid, the O-acetylated ganglioside species expressed is cell line-dependent. OAcGD3 is the only O-acetylated ganglioside expressed by SK-Mel-28, MDA-MB-231, while OAcGD2 is solely expressed in LAN-1 and SUM159PT cells. In the other cancer cell lines, different combinations of O-acetylated gangliosides species are detected: OAcGD2 and OAcGT3 are detected in Hs 578T and MCF-7 GD3S+. MDA-MB-231 clone #11 express both OAcGD3 and OAcGD2, whereas MDA-MB-231 clone #4 shows the additional expression of OAcGD3, OAcGD2, and OAcGT3. Interestingly, GD3 synthase over-expression in MDA-MB-231 does not result in the expression of the same O-acetylated species expressed by the two clones. Moreover, OAcGD2 was not detected in MDA-MB-231 and MCF-7, but only in their clones over-expressing GD3 synthase, with a respective 2 and 3 fold increase, confirming our previous results [12]. OAcGT3 was the O-acetylated ganglioside species present in lowest amounts and was mostly present in Hs 578T (3.2%) and MDA-MB-231 clone #4 (1.5%) (Figure 5). OAcGT2 expression was confirmed using MS/MS fragmentation in MDA-MB-231 GD3S+ clone #4. However, signals assigned for OAcGT2 were too weak and could not be included in the relative quantification process.

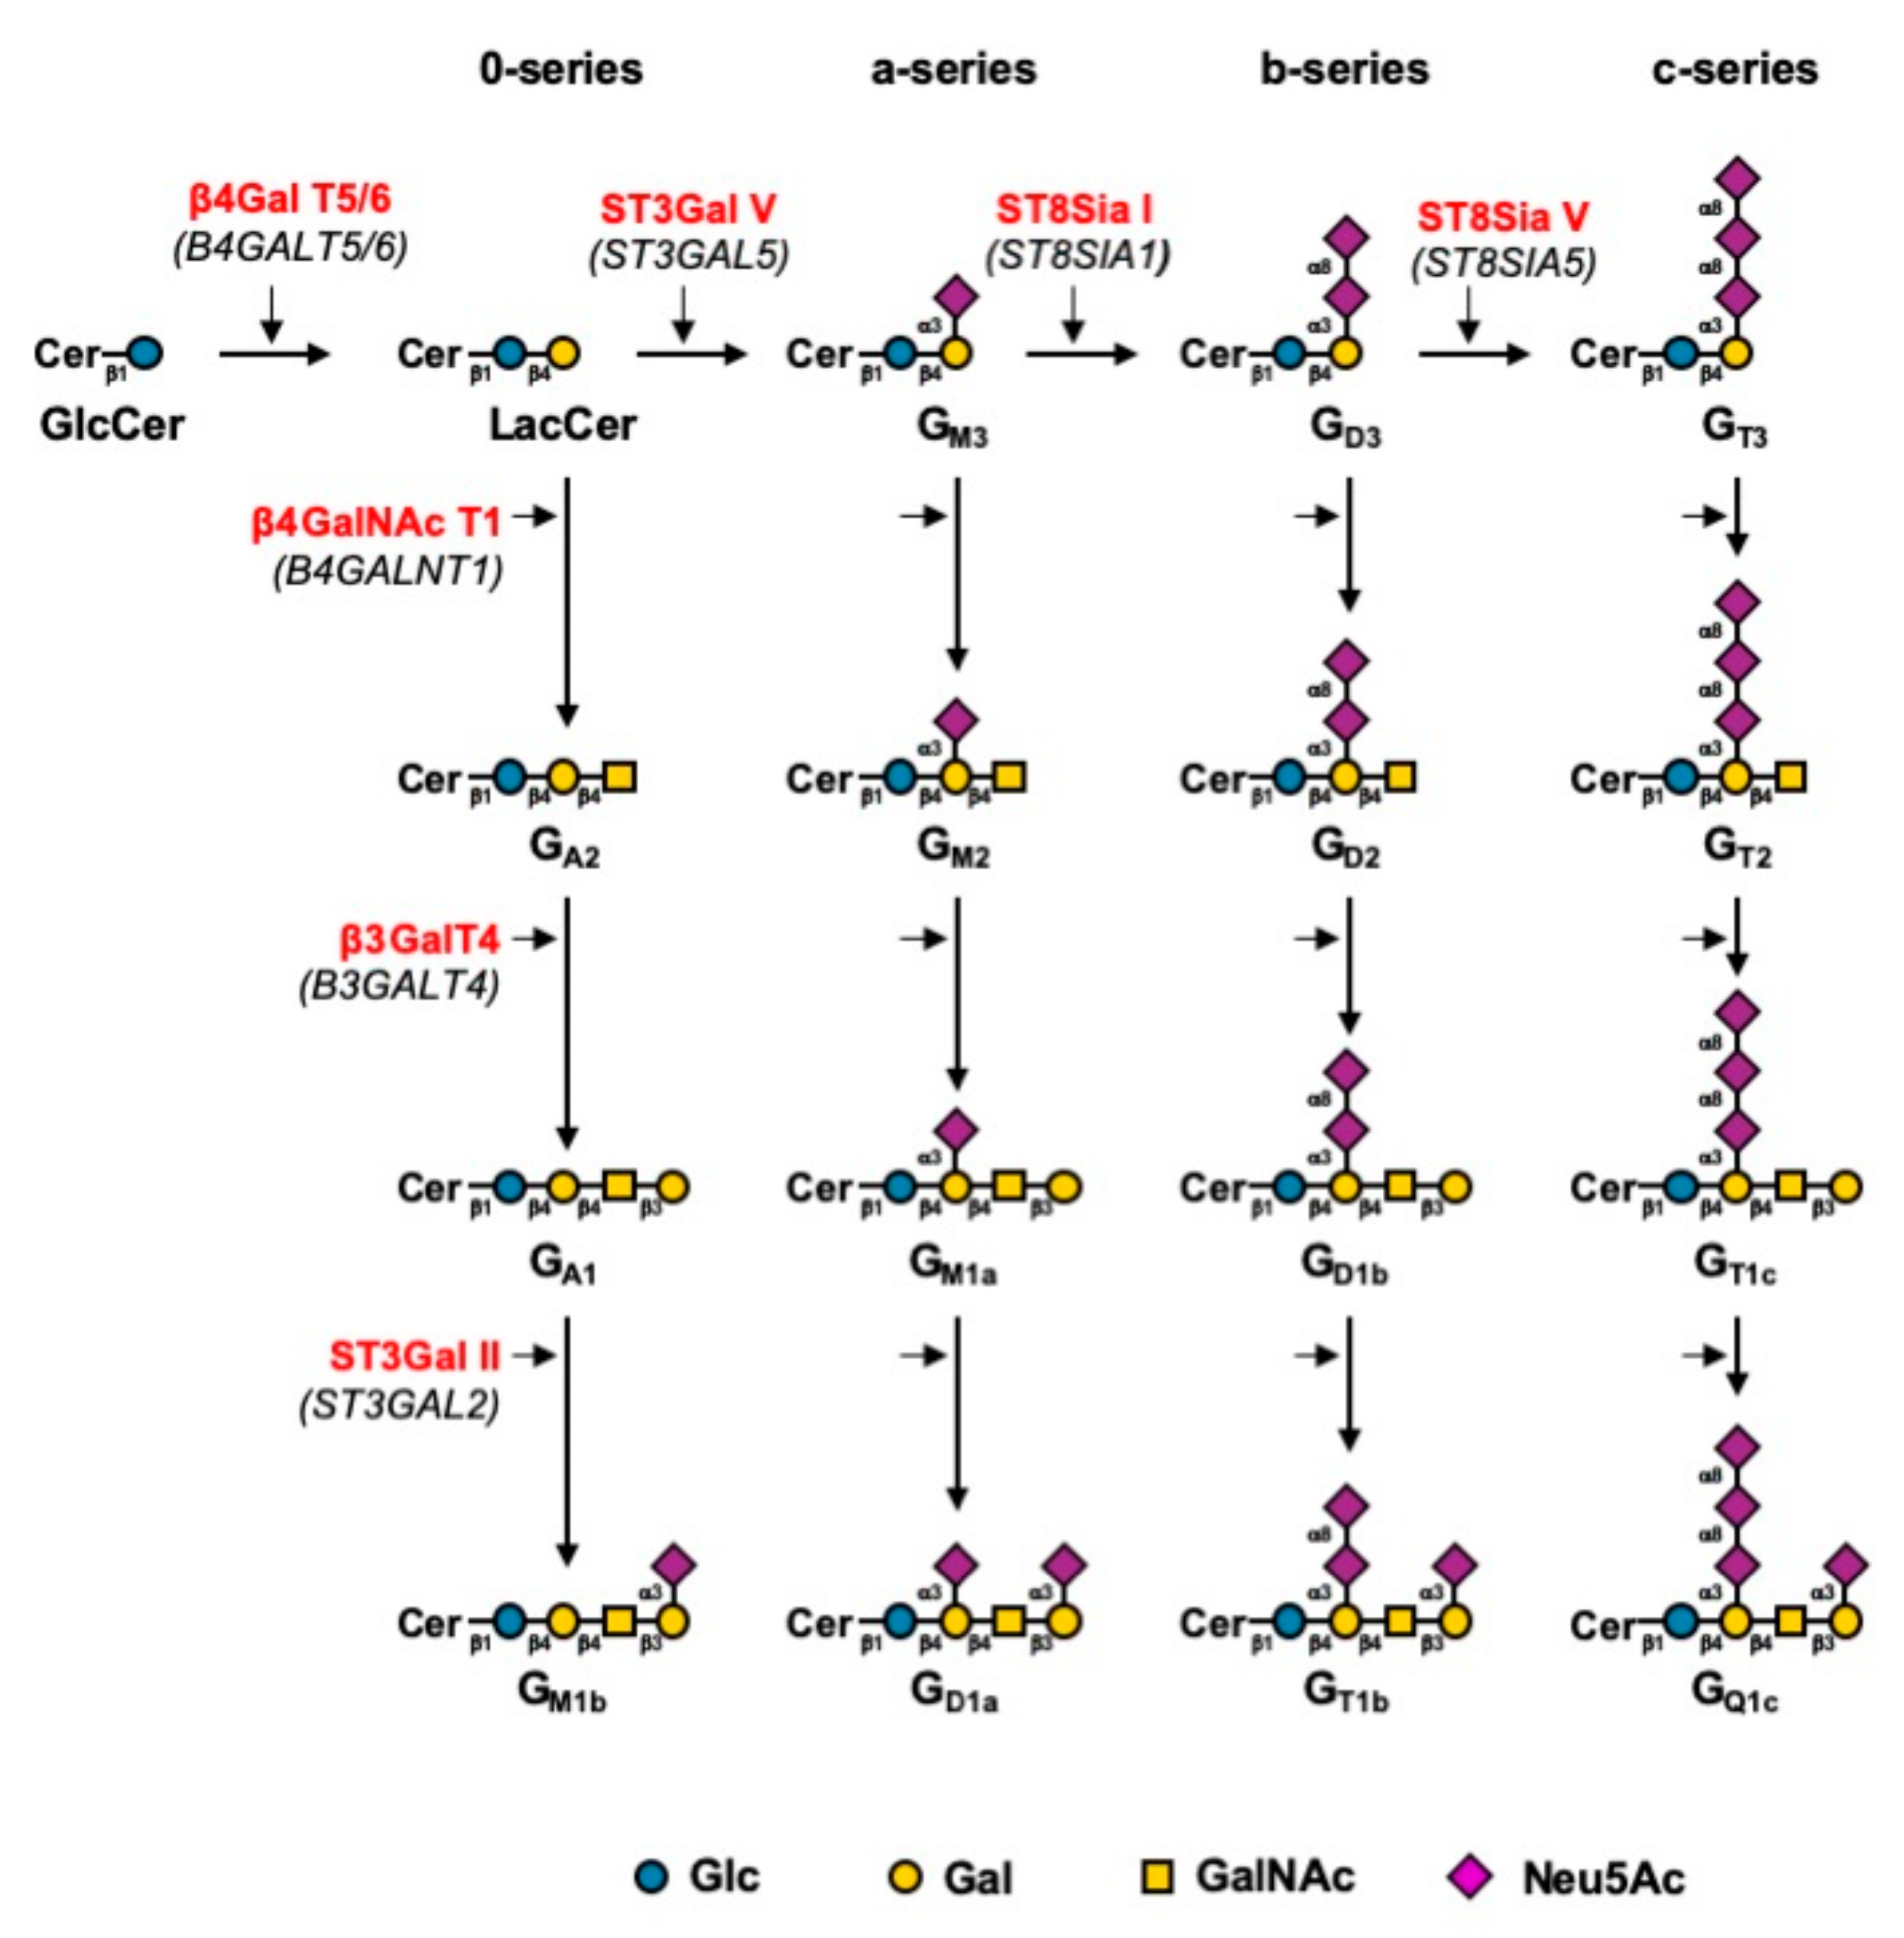
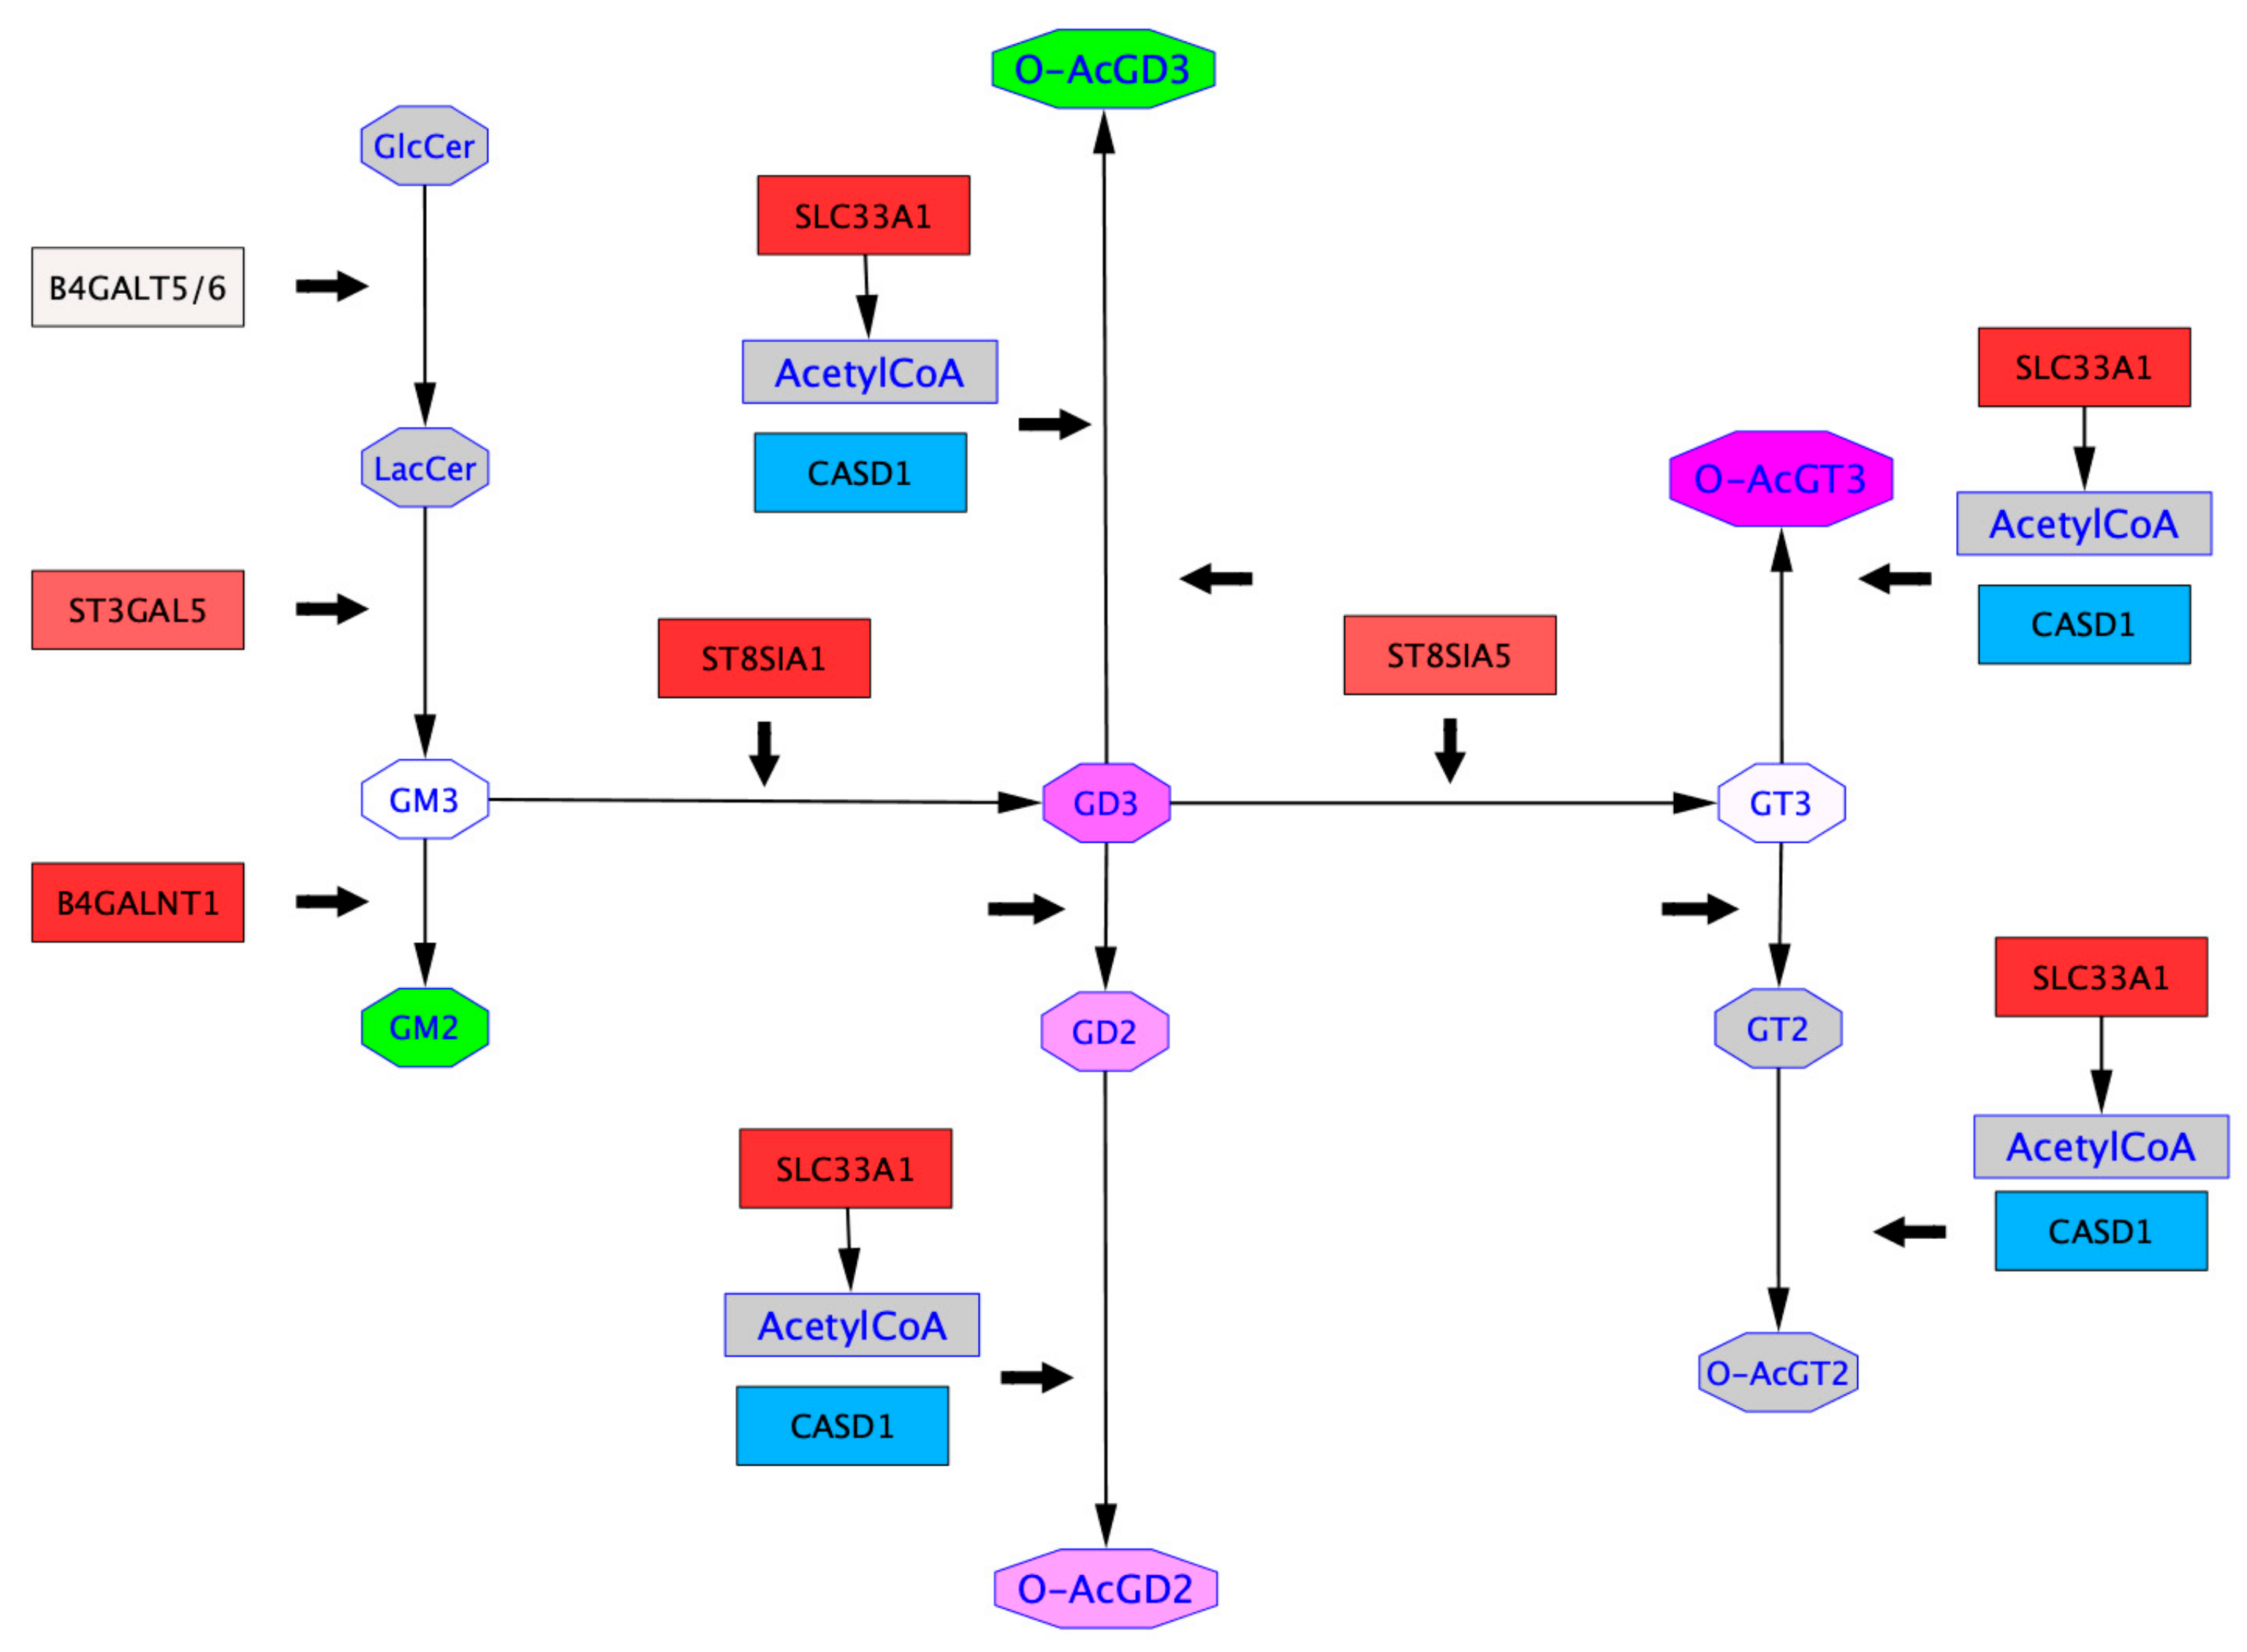
2.4. Mapping of GTs Gene Expression and Gangliosides Content on a Ganglioside Metabolism Patway

In order to get an insight on ganglioside expression and biosynthesis mechanisms in cancer cells, we performed in silico analysis. Differential expression of genes encoding GTs and gangliosides were mapped onto a subpart of “Ganglio-sphingolipid metabolism” pathway retrieved from WikiPathway in Hs 578T vs. MDA-MB-231 cells (Figure 6) and in MDA-MB-231 vs. MDA-MB-231 GD3S+ cells (Figure 7). These representations ensure the combination of GTs gene expression and ganglioside content obtained respectively by qPCR and MALDI-QIT-TOF in one biosynthetic scheme. Thus, gene expression of B4GALT6, ST3GAL5, ST8SIA1, B4GALNT1, and ST8SIA5 encoding GTs involved in gangliosides biosynthesis assessed by qPCR experiments in each cell line. Besides, SCL33A1 and CASD1 gene expression were analyzed by qPCR. These two genes were selected for their potential implication in ganglioside O-acetylation, respectively encoding the acetyl coenzyme 1 Golgi transporter and the only known human SOAT (Supplementary Figure S3). Our results highlight the upregulation of ST3GAL5, B4GALNT1, ST8SIA1, ST8SIA5, and SCL33A1, and the downregulation of CASD1 in Hs 578T compared to MDA-MB-231 (Figure 6). All genes assessed by qPCR were up-regulated in MDA-MB-231 GD3S+ vs. MDA-MB-231 (Figure 7). These results highlight the repression of CASD1 in Hs 578T compared to MDA-MB-231 cells, but the upregulation of CASD1 in MDA-MB-231 GD3S+ compared to MDA-MB-231 cells.
Ganglioside proportions defined by MALDI-QIT-TOF analysis were also mapped onto these pathways to represent the differential ganglioside expression in Hs 578T vs. MDA-MB-231, and in MDA-MB-231 GD3S+ vs. MDA-MB-231. The differential ganglioside expression analysis brings out the upregulation of OAcGD2 and OAcGT3 and the downregulation of OAcGD3 in Hs578T compared to MDA-MB-231. In contrast, the same analysis highlights the upregulation of OAcGT3, OAcGD3, and OAcGD2 in MDA-MB-231 GD3S+ vs. MDA-MB-231 (Figure 7). These analyses reveal the upregulation of GD3, GD2, and GT3 in both pathways. The levels of gangliosides upregulation in Hs578T vs. MDA-MB-231 are higher than those identified in MDA-MB-231 GD3S+ vs. MDA-MB-231 (Figure 6 and Figure 7). The combinatorial approach that we used allows to perceive the relationships between gangliosides expressed and GTs gene expression between two cell lines. In both cases (Hs 578T vs. MDA-MB-231, and MDA-MB-231 GD3S+ vs. MDA-MB-231), O-acetylated gangliosides appear to be upregulated independently of CASD1 expression variations between two cell lines, and in a substrate-dependent manner. O-acetylated ganglioside expression appears not only dependent on the expression level of enzymes involved in the biosynthesis of gangliosides, but also on substrate availability.

3. Discussion

For almost 50 years, profiling gangliosides expression in developmental and pathological conditions has been of high interest for their remarkable roles in oncogenesis and neurodegenerative diseases, in which gangliosides are considered as useful and promising diagnostic and prognostic tools, as well as targets for immunotherapy, especially in the field of neuroectoderm-related cancers (melanoma, neuroblastoma, small cell lung cancer) [20,21]. As an example, anti-GD2 clinical trials for neuroblastoma have confirmed the efficacy of anti-GD2 antibody immunotherapy for this rare but often lethal childhood cancer [22]. Different experimental approaches were developed to get more precise information about the structure of gangliosides from various biological samples. Basically, immunodetection methods and mass spectrometry are currently the major tools for ganglioside analysis. While immunodetection is based on in situ detection, mass spectrometry requires the extraction of gangliosides from biological samples before the analysis. Recently, the combination of these two detection methods has allowed a lot of progress regarding ganglioside profiling in sera [23,24], tissues [25], or cellular extracts [26]. Besides, O-acetylation of the sialic acid residues is one of the most common modifications of gangliosides and is sufficient to induce dramatic changes of physiopathological properties carried by the native non-O-acetylated gangliosides. For example, O-acetylation relocates GD3 from the mitochondria to the cell membrane, inducing the suppression of GD3 apoptotic effect in cancer cells [11,27,28]. Interestingly, targeting OAcGD2 rather than GD2 in cancer therapy seems to be a better option since OAcGD2 is exclusively expressed in cancer tissues [7].
The O-acetyl group is alkali labile, rendering it very difficult to handle for mass spectrometry analysis. Thus, immunodetection methods such as TLC, FACS, or immunocytochemistry followed by confocal microscopy were mainly used for the identification and quantification of O-acetylated gangliosides species [14]. Using the immunodetection methods mentioned above, we previously identified the expression of OAcGD2, but not OAcGD3 in BC cells [12]. However, the absence of OAcGD3 in BC cells was not confirmed in this work [12]. Indeed, native gangliosides extracted from the same cell lines were positive for OAcGD3 expression, indicating that the anti-OAcGD3 7H2 mouse IgG3 (Santa-Cruz biotechnology, Dallas, TX, USA) used in our previous study was not suitable for the identification of OAcGD3 by FACS as well as immunocytochemistry procedures. Besides the properties and specificity of anti-ganglioside antibodies, the accessibility of the target is also a major limitation since gangliosides are located in lipid rafts, surrounded by cholesterol and glycoproteins enhancing the steric hindrance, and the accessibility of gangliosides at the surface of BC cells may be an issue. Furthermore, antibodies targeting O-acetylated species may cross react and detect more than one species at a time like 493D4 [25], Jones antibody [29], A2B5 [30] targeting either OAcGD3/OAcGT3 either OAcGT2.
Brain tissue is the major biological material used for the analysis of O-acetylated ganglioside species. For example, OAcGT2 has been detected in cod brain by TLC and mass spectrometry combining mild alkaline treatment [31]. In bovine brain, OAcGD3 and OAcGT3 were identified as major acetylated species [25], and enhanced OAcGT3 was also identified in cultured glial cells [30]. OAcGD3 is also considered as an oncofetal marker in human melanoma [32]. The presence of OAcGD3 was also reported in tumors from neuroectodermal origin [33], childhood lymphoblastic leukemia [34], and glioblastoma [35]. The expression of O-acetylated gangliosides was poorly studied in breast cancer; a single article reports OAcGD3 and OAcGT3 expression in BC tissues using GMR2 and 493D4 mouse antibodies and TLC analysis [36]. However, some ambiguity remains because O-acetylated gangliosides analysis in cells and tissues was mostly performed using antibodies more or less specific of O-acetylated forms, some of them cross reacting with O-acetylated and non-O-acetylated ganglioside species. Here, OAcGM1, OAcGD3, OAcGD2, OAcGT2, OAcGT3 were identified as native gangliosides by mass spectrometry in neuroectoderm derived-cell lines. Besides, MS/MS fragmentation defined that O-acetylation occurs on both inner or terminal sialic acid residues. Furthermore, Neu5,9Ac2 was the main sialic acid species expressed among glycolipids, confirming our previous study [12]. O-acetylated gangliosides species were fully characterized in terms of ganglioside species and position of O-acetylated group on the sialic acid residues, revealing a cell-type dependent profile. Interestingly, clones over-expressing GD3 synthase showed an increased expression of complex non-acetylated and O-acetylated gangliosides, highlighting again the key role of GD3 synthase for b- and c-series gangliosides expression. Substrate availability is the second parameter, which drives O-acetylated gangliosides expression. If high amounts of precursor gangliosides are expressed, they can potentially serve for the biosynthesis of O-acetylated gangliosides.
O-acetylation of sialic acid is highly dependent on the balance between SOAT and Sialyl-O-acetyl-esterase (SIAE) activity. These activities are finely tuned processes, resulting in a cell type dependent pattern of O-acetylated gangliosides species. Recently, Mlinac et al. suggested that SIAE-induced deacetylation of GD3 increases medulloblastoma sensitivity to etoposide. The concept used in the paper was based on recovering the pro-apoptotic role of mitochondrial GD3 by deacetylation of OAcGD3. Besides, they showed a higher expression of SIAE in medulloblastoma compared to normal cerebellum [37]. These data seem contradictory, but they give an important insight on the complexity of the processes regulating the expression and the role of OAcGD3 and GD3 in cancer tissues. SOAT activity was closely related to O-acetylated gangliosides expression. Indeed, reduced SOAT activity decreased O-acetylated gangliosides, while increased SOAT activity upregulated O-acetylated gangliosides expression [38,39]. Despite all the attempts made for the purification of SOAT, a single human SOAT encoded by CASD1 has been identified [40]. CASD1 is Golgi spanning multimembrane protein, which induces the O-acetylation of CMP-sialic acid and is involved in GD3 O-acetylation [13]. Here, we show that O-acetylation of gangliosides is not dependent on the level of CASD1, but much more dependent on the availability of ganglioside substrate and acetyl-CoA availability as underlined by the acetyl-CoA transporter SLC33A1 upregulation, regardless of the BC cell lines. However, the validation of this concept would require transfection experiments to modulate the expression of SLC33A1 or CASD1 in these cell lines.
This work highlights the cell-type dependent pattern of O-acetylated gangliosides species expressed by neuroectoderm-derived cell lines. Performing similar analyses in normal and cancer tissues is the next essential step to determine to what extent specific O-acetylated gangliosides are tumor-specific antigens and promising targets for neuroectoderm-derived tumors immunotherapy.

4. Materials and Methods

4.1. Cell Culture

The human breast cancer cells Hs 578T, MDA-MB-231, MCF-7, SUM159PT, and the melanoma cell line SK-MEL-28 were obtained from the American Tissue Culture Collection (ATCC, Rockville, MD, USA). The neuroblastoma cell line LAN-1 was obtained by Deutsche Sammlung von Mikroorganismen und Zellkulturen Gmbh (DSMZ, Leibniz Institute, Braunschweig, Germany). LAN-1 cells were cultured and maintained in Rosewall Park Memorial Institute medium 1640 (RPMI) containing 10% heat-inactivated fetal calf serum, 2 mmol/L L-glutamine, and 100 units/mL penicillin-streptomycin. MCF-7 and MDA-MB-231 clones over-expressing GD3 synthase were obtained as described [41]. All BC cell lines and the melanoma cell line SK-MEL-28 were cultured as previously described [12].

4.2. RNA Extraction and Quantitative Real Time Polymerase Chain Reaction

The extraction of total RNA from different cell lines was performed using Nucleospin RNA II kit (Macherey-Nagel, Düren, Germany). Extracted RNA was quantified using DeNovix DS-11 spectophotometer (DeNovix Inc., Wilmington, DE, USA). Reverse transcription of purified RNA was performed using the Maxima First Strand cDNA Synthesis Kit (Thermo Fisher Scientific, Villeneuve d’Ascq, France) according to the protocol provided by the manufacturer. The oligonucleotide sequences (Eurogentec, Seraing, Belgium) used for PCR reactions are the following primer pairs: 5′-ctg-gga-gga-aac-tgg-cct-tc-3′ and 5′-agg-gct-gta-aca-cat-gag-cc-3′ (SCL33A1), 5′-gtg-gat-ttt-ctg-tgg-atc-c-3′ and 5′-aag-cgc-ttc-act-gct-acc-at-3′ (CASD1), 5′-tat-gtg-ctg-tca-gcg-tct-gct-3′ and 5′-aca-aag-aca-tcc-tct-aat-ggg-aga-a-3′ (B3GALT4), 5′-gtg-gat-ttt-ctg-tgg-cat-cc-3′ and 5′-aag-gcg-ttc-act-gct-acc-at-3′(ST8SIA5). PCR reactions were processed using Mx3005p Quantitative System (Stratagene, La Jolla, CA, USA) using 2X Brilliant SYBR Green qPCR Mastermix (Thermo Fisher Scientific, Villeneuve d’Ascq, France) in 300 nM of primers and 4 µL cDNA as previously described [12]. All experiments were performed in triplicate.

4.3. DMB Derivatization of Sialic Acids

Cells were suspended in PBS and centrifuged 15 min at 4000 rpm. Pellets were sequentially extracted by CHCl3/CH3OH (2/1; v/v) and CHCl3/CH3OH/H2O (1/2/0.8; v/v/v). Pellets contained membrane associated glycoproteins, whereas supernatants contained the ganglioside fractions. Supernatants were precipitated with ice cold 100% ethanol overnight and centrifuged 5 min at 10,000× g. Supernatants contained free sialic acids, whereas pellets contained soluble proteins [42]. Dried pellets of BC cell lines were hydrolyzed at 80 °C for 4 h in 4 M propionic acid and then precipitated in 4 volumes of 100% ethanol. Hydrolyzed sialic acids were subsequently coupled to 1,2-diamino-4,5-methylenedioxybenzene dihydrochloride (DMB). Samples were heated at 50 °C for 2 h in the dark in 7 mM DMB, 1 M β-mercaptoethanol, 18 mM sodium hydrosulfite in 5 mM acetic acid [43]. Sialic acids coupled to DMB (DMB-Sia) were then analyzed by LC-MS.

4.4. Quantitation Analysis of DMB-Sia on Micro-LC/ESI-MS3

Quantitative analyses were performed in positive ion mode on an amaZon speed ETD ion trap mass spectrometer equipped with the standard electrospray ionization (ESI) ion source and controlled by Hystar 3.2 software (Bruker Daltonics, Billerica, MA, USA). DMB-coupled sialic acid separation was achieved on micro LC system (Prominence LC-20AB, Shimadzu, Kyoto, Japan). 5 µL of samples were applied to the reversed-phase Luna C18-2 column (150 × 1.00 mm, 3 µm particles, Phenomenex, Torrance, CA, USA) with an isocratic elution of CH3CN/CH3OH/H2O (6/4/90; v/v/v) at a flow rate of 70 µL/min. The targeted MS3 scans for DMB-coupled sialic acid were performed using an ultrascan mode (26,000 amu/s). Data obtained for external standards run on the same time were used for estimation of DMB-Sia amounts in BC cell line our BC cell lines samples. Sialic acid species were identified by referring to elution positions and MS3 fragmentation of Neu5Ac and Neu5,9Ac2 standards. The reported values were based on signal area of the single ion chromatogram at the appropriate retention time [44].

4.5. Extraction of Native Gangliosides

Cell were suspended in PBS and centrifuged at 4000 rpm during 15 min. Pellets were extracted thrice by 2 volumes of CHCl3/CH3OH (2/1; v/v) and 1 volume CHCl3/CH3OH/H2O (1/2/0.8; v/v/v). Supernatants were collected and dried gently under N2 stream. Glycosphingolipids were separated from other lipids and from hydrophilic components on a tC18 cartridge Sep-Pak connected to QMA Sep-Pack cartridge (Waters, St Quentin Yvelines, France) equilibrated in CH3OH/CF3COOH/H2O (1/0.1/1; v/v/v) by extensive washing. Neutral glycosphingolipids were eluted in 2 volumes of CH3OH. Acidic glycosphingolipids were eluted twice in CH3OH/CH3COONH4 (1/1; v/v) within 0.05 M, 0.15 M, and 0.45 M CH3COONH4 sequentially in 1 volume each. Neutral and acidic glycosphingolipids were dried gently under N2 stream. Acidic glycosphingolipids were separated from ammonium acetate on a tC18 cartridges Sep-pack (Waters, St Quentin Yvelines, France) equilibrated in CH3OH/CF3COOH/H2O mixture (1/0.1/1; v/v/v) by extensive washing. Acidic glycosphingolipids were eluted in 2 volumes of CH3OH and dried under N2 stream before reconstitution in CHCl3/CH3OH (1/2; v/v) and analysis on MALDI-QIT-TOF.

4.6. Mass Spectrometry Analysis

Acidic glycosphingolipids were analyzed by an MALDI-QIT-TOF Shimadzu AXIMA Resonance mass spectrometer (Shimadzu Europe, Manchester, UK) in the negative mode. Samples were prepared by mixing directly on the target 0.5 µL of acidic glycosphingolipid sample with 0.5 µL 2′-4′-6′-trihydroxyacetophenone monohydrate matrix solution (0.5 M in EtOH) containing by 0.1 M hydrated di-ammonium hydrogen citrate mixture (2/1; v/v). The mid mode for a mass range m/z 1500–3000 was used and laser power was set to 100 2 shots each in 200 locations per spot.

4.7. In Silico Mapping of Glycosyltransferase Gene Expression and Ganglioside Species Quantification

The pathway was retrieved from WikiPathways [18] using the WikiPathways app [19] for Cytoscape [45], the “Ganglio Sphingolipid Metabolism” pathway for Homo sapiens was used as a basis. Only a subpart was conserved and enriched with some metabolites and genes. For each figure, qPCR data were mapped onto the genes of the pathway, calculating the log2 ratio of expression of one condition and a second one; colors vary from blue (≤ −2) to white (= 0) and red (≥ 2). Relative quantity amounts of gangliosides measured in MALDI-QIT-TOF mass spectroscopy were also mapped onto the gangliosides in the pathway, calculating the difference in signals between two conditions; colors vary from green (≤ −8) to white (= 0) and fuchsia (≥ 8).

Supplementary Materials

Supplementary Materials can be found at https://0-www-mdpi-com.brum.beds.ac.uk/1422-0067/21/1/370/s1.

Author Contributions

Conceptualization, S.C. and Y.G.; methodology, K.A., Y.G., G.B., and N.Y.; software, N.Y. and G.B.; validation, N.Y., Y.G., and P.D.; formal analysis, S.C. and C.C.; investigation, S.C.; resources, S.C. and C.C.; data curation, S.C.; writing—original draft preparation, S.C.; writing—review and editing, S.C., Y.G, S.G.-D., and P.D.; visualization, S.C. and N.Y.; supervision, S.G.-D. and P.D.; project administration, S.C.; funding acquisition, J.-M.L.D. All authors have read and agreed to the published version of the manuscript.

Funding

This research received no external funding.

Acknowledgments

We are indebted to the PAGés platform (Plateforme d’ Analyses des Glycoconjugués, CNRS, UMR 8576, UGSF, Université de Lille), F-59000 Lille, France for the use of mass spectrometry facilities.

Conflicts of Interest

The authors declare no conflict of interest.

Abbreviations

BCBreast Cancer
GlcCer Glucosylceramide
LacCer Lactosylceramide
LC-ESI/MSLiquid Chromatography Electrospray Ionisation/Mass Spectrometry
Neu5,9Ac29-O-acetyl-N-acetylneuraminic acid
OAcGD2O-acetylated GD2
OAcGD3O-acetylated GD3
RPLC-MSReverse-Phase Liquid Chromatography Mass Spectrometry
SCLCSmall Cell Lung Carcinoma
SOATSialyl-O-acetyltransferase
SIAESialyl-O-acetylesterase
TACATumor Associated Carbohydrate Antigen
TLCThin Layer Chromatography

References

  1. Hakomori, S. Aberrant glycosylation in cancer cell membranes as focused on glycolipids: Overview and perspectives. Cancer Res. 1985, 45, 2405–2414. [Google Scholar] [PubMed]
  2. Julien, S.; Bobowski, M.; Steenackers, A.; Le Bourhis, X.; Delannoy, P. How Do Gangliosides Regulate RTKs Signaling? Cells 2013, 2, 751–767. [Google Scholar] [CrossRef] [PubMed] [Green Version]
  3. Cazet, A.; Bobowski, M.; Rombouts, Y.; Lefebvre, J.; Steenackers, A.; Popa, I.; Guérardel, Y.; Le Bourhis, X.; Tulasne, D.; Delannoy, P. The ganglioside G(D2) induces the constitutive activation of c-Met in MDA-MB-231 breast cancer cells expressing the G(D3) synthase. Glycobiology 2012, 22, 806–816. [Google Scholar] [CrossRef] [PubMed] [Green Version]
  4. Yoshida, S.; Fukumoto, S.; Kawaguchi, H.; Sato, S.; Ueda, R.; Furukawa, K. Ganglioside G(D2) in small cell lung cancer cell lines: Enhancement of cell proliferation and mediation of apoptosis. Cancer Res. 2001, 61, 4244–4252. [Google Scholar] [PubMed]
  5. Furukawa, K.; Hamamura, K.; Aixinjueluo, W.; Furukawa, K. Biosignals modulated by tumor-associated carbohydrate antigens: Novel targets for cancer therapy. Ann. N. Y. Acad. Sci. 2006, 1086, 185–198. [Google Scholar] [CrossRef] [PubMed]
  6. Dhillon, S. Dinutuximab: First global approval. Drugs 2015, 75, 923–927. [Google Scholar] [CrossRef]
  7. Alvarez-Rueda, N.; Desselle, A.; Cochonneau, D.; Chaumette, T.; Clemenceau, B.; Leprieur, S.; Bougras, G.; Supiot, S.; Mussini, J.-M.; Barbet, J.; et al. A Monoclonal Antibody to O-Acetyl-GD2 Ganglioside and Not to GD2 Shows Potent Anti-Tumor Activity without Peripheral Nervous System Cross-Reactivity. PLoS ONE 2011, 6, e25220. [Google Scholar] [CrossRef] [Green Version]
  8. Terme, M.; Dorvillius, M.; Cochonneau, D.; Chaumette, T.; Xiao, W.; Diccianni, M.B.; Barbet, J.; Yu, A.L.; Paris, F.; Sorkin, L.S.; et al. Chimeric antibody c.8B6 to O-acetyl-GD2 mediates the same efficient anti-neuroblastoma effects as therapeutic ch14.18 antibody to GD2 without antibody induced allodynia. PLoS ONE 2014, 9, e87210. [Google Scholar] [CrossRef] [Green Version]
  9. Cochonneau, D.; Terme, M.; Michaud, A.; Dorvillius, M.; Gautier, N.; Frikeche, J.; Alvarez-Rueda, N.; Bougras, G.; Aubry, J.; Paris, F.; et al. Cell cycle arrest and apoptosis induced by O-acetyl-GD2-specific monoclonal antibody 8B6 inhibits tumor growth in vitro and in vivo. Cancer Lett. 2013, 333, 194–204. [Google Scholar] [CrossRef]
  10. Kniep, B.; Kniep, E.; Ozkucur, N.; Barz, S.; Bachmann, M.; Malisan, F.; Testi, R.; Rieber, E.P. 9-o-acetyl GD3 protects tumor cells from apoptosis. Int. J. Cancer 2006, 119, 67–73. [Google Scholar] [CrossRef]
  11. Malisan, F.; Franchi, L.; Tomassini, B.; Ventura, N.; Condò, I.; Rippo, M.R.; Rufini, A.; Liberati, L.; Nachtigall, C.; Kniep, B.; et al. Acetylation suppresses the proapoptotic activity of GD3 ganglioside. J. Exp. Med. 2002, 196, 1535–1541. [Google Scholar] [CrossRef] [PubMed] [Green Version]
  12. Cavdarli, S.; Dewald, J.H.; Yamakawa, N.; Guérardel, Y.; Terme, M.; Le Doussal, J.-M.; Delannoy, P.; Groux-Degroote, S. Identification of 9-o-acetyl-N-acetylneuraminic acid (Neu5,9Ac2) as main O-acetylated sialic acid species of GD2 in breast cancer cells. Glycoconj. J. 2019, 36, 79–90. [Google Scholar] [CrossRef] [PubMed]
  13. Baumann, A.-M.T.; Bakkers, M.J.G.; Buettner, F.F.R.; Hartmann, M.; Grove, M.; Langereis, M.A.; de Groot, R.J.; Mühlenhoff, M. 9-o-Acetylation of sialic acids is catalysed by CASD1 via a covalent acetyl-enzyme intermediate. Nat. Commun. 2015, 6, 7673. [Google Scholar] [CrossRef] [PubMed] [Green Version]
  14. Mandal, C.; Schwartz-Albiez, R.; Vlasak, R. Functions and Biosynthesis of O-Acetylated Sialic Acids. Top. Curr. Chem. 2015, 366, 1–30. [Google Scholar]
  15. Ravindranath, M.H.; Higa, H.H.; Cooper, E.L.; Paulson, J.C. Purification and characterization of an O-acetylsialic acid-specific lectin from a marine crab Cancer antennarius. J. Biol. Chem. 1985, 260, 8850–8856. [Google Scholar]
  16. Sharma, V.; Chatterjee, M.; Mandal, C.; Sen, S.; Basu, D. Rapid diagnosis of Indian visceral leishmaniasis using achatininH, a 9-O-acetylated sialic acid binding lectin. Am. J. Trop. Med. Hyg. 1998, 58, 551–554. [Google Scholar] [CrossRef]
  17. Sugiyama, E.; Hara, A.; Uemura, K.; Taketomi, T. Application of matrix-assisted laser desorption ionization time-of-flight mass spectrometry with delayed ion extraction to ganglioside analyses. Glycobiology 1997, 7, 719–724. [Google Scholar] [CrossRef]
  18. Slenter, D.N.; Kutmon, M.; Hanspers, K.; Riutta, A.; Windsor, J.; Nunes, N.; Mélius, J.; Cirillo, E.; Coort, S.L.; Digles, D.; et al. WikiPathways: A multifaceted pathway database bridging metabolomics to other omics research. Nucleic Acids Res. 2018, 46, D661–D667. [Google Scholar] [CrossRef]
  19. Kutmon, M.; Lotia, S.; Evelo, C.T.; Pico, A.R. WikiPathways App for Cytoscape: Making biological pathways amenable to network analysis and visualization. F1000Research 2014, 3, 152. [Google Scholar] [CrossRef]
  20. Krengel, U.; Bousquet, P.A. Molecular recognition of gangliosides and their potential for cancer immunotherapies. Front. Immunol. 2014, 5, 325. [Google Scholar] [CrossRef] [Green Version]
  21. Rabu, C.; McIntosh, R.; Jurasova, Z.; Durrant, L. Glycans as targets for therapeutic antitumor antibodies. Future Oncol. 2012, 8, 943–960. [Google Scholar] [CrossRef]
  22. Modak, S.; Cheung, N.-K.V. Disialoganglioside directed immunotherapy of neuroblastoma. Cancer Investig. 2007, 25, 67–77. [Google Scholar] [CrossRef]
  23. Fuller, M.; Duplock, S.; Hein, L.K.; Rigat, B.A.; Mahuran, D.J. Liquid chromatography/electrospray ionisation-tandem mass spectrometry quantification of GM2 gangliosides in human peripheral cells and plasma. Anal. Biochem. 2014, 458, 20–26. [Google Scholar] [CrossRef] [PubMed]
  24. Busch, C.M.; Desai, A.V.; Moorthy, G.S.; Fox, E.; Balis, F.M. A validated HPLC-MS/MS method for estimating the concentration of the ganglioside, GD2, in human plasma or serum. J. Chromatogr. B Anal. Technol. Biomed. Life Sci. 2018, 1102–1103, 60–65. [Google Scholar] [CrossRef]
  25. Zhang, G.; Ji, L.; Kurono, S.; Fujita, S.C.; Furuya, S.; Hirabayashi, Y. Developmentally regulated O-acetylated sialoglycans in the central nervous system revealed by a new monoclonal antibody 493D4 recognizing a wide range of O-acetylated glycoconjugates. Glycoconj. J. 1997, 14, 847–857. [Google Scholar] [CrossRef] [PubMed]
  26. Rossdam, C.; Konze, S.A.; Oberbeck, A.; Rapp, E.; Gerardy-Schahn, R.; von Itzstein, M.; Buettner, F.F.R. Approach for Profiling of Glycosphingolipid Glycosylation by Multiplexed Capillary Gel Electrophoresis Coupled to Laser-Induced Fluorescence Detection to Identify Cell-Surface Markers of Human Pluripotent Stem Cells and Derived Cardiomyocytes. Anal. Chem. 2019, 91, 6413–6418. [Google Scholar] [CrossRef] [Green Version]
  27. Kristal, B.S.; Brown, A.M. Apoptogenic ganglioside GD3 directly induces the mitochondrial permeability transition. J. Biol. Chem. 1999, 274, 23169–23175. [Google Scholar] [CrossRef] [Green Version]
  28. Sa, G.; Das, T.; Moon, C.; Hilston, C.M.; Rayman, P.A.; Rini, B.I.; Tannenbaum, C.S.; Finke, J.H. GD3, an overexpressed tumor-derived ganglioside, mediates the apoptosis of activated but not resting T cells. Cancer Res. 2009, 69, 3095–3104. [Google Scholar] [CrossRef] [PubMed] [Green Version]
  29. Constantine-Paton, M.; Blum, A.S.; Mendez-Otero, R.; Barnstable, C.J. A cell surface molecule distributed in a dorsoventral gradient in the perinatal rat retina. Nature 1986, 324, 459–462. [Google Scholar] [CrossRef]
  30. Farrer, R.G.; Quarles, R.H. GT3 and its O-acetylated derivative are the principal A2B5-reactive gangliosides in cultured O2A lineage cells and are down-regulated along with O-acetyl GD3 during differentiation to oligodendrocytes. J. Neurosci. Res. 1999, 57, 371–380. [Google Scholar] [CrossRef]
  31. Waki, H.; Masuzawa, A.; Kon, K.; Ando, S. A new O-acetylated trisialoganglioside, 9-o-acetyl GT2, in cod brain. J. Biochem. 1993, 114, 459–462. [Google Scholar] [CrossRef]
  32. Ravindranaths, M.H.; Paulson, J.C.; Irie, R.F. Human melanoma antigen O-acetylated ganglioside GD3 is recognized by Cancer antennarius lectin. J. Biol. Chem. 1988, 263, 2079–2086. [Google Scholar]
  33. Fahr, C.; Schauer, R. Detection of sialic acids and gangliosides with special reference to 9-O-acetylated species in basaliomas and normal human skin. J. Investig. Dermtol. 2001, 116, 254–260. [Google Scholar] [CrossRef] [Green Version]
  34. Mukherjee, K.; Chava, A.K.; Mandal, C.; Dey, S.N.; Kniep, B.; Chandra, S.; Mandal, C. O-acetylation of GD3 prevents its apoptotic effect and promotes survival of lymphoblasts in childhood acute lymphoblastic leukaemia. J. Cell. Biochem. 2008, 105, 724–734. [Google Scholar] [CrossRef]
  35. Birks, S.M.; Danquah, J.O.; King, L.; Vlasak, R.; Gorecki, D.C.; Pilkington, G.J. Targeting the GD3 acetylation pathway selectively induces apoptosis in glioblastoma. Neuro Oncol. 2011, 13, 950–960. [Google Scholar] [CrossRef] [PubMed] [Green Version]
  36. Marquina, G.; Waki, H.; Fernandez, L.E.; Kon, K.; Carr, A.; Valiente, O.; Perez, R.; Ando, S. Gangliosides expressed in human breast cancer. Cancer Res. 1996, 56, 5165–5171. [Google Scholar]
  37. Mlinac, K.; Fabris, D.; Vukelić, Z.; Rožman, M.; Heffer, M.; Bognar, S.K. Structural analysis of brain ganglioside acetylation patterns in mice with altered ganglioside biosynthesis. Carbohydr. Res. 2013, 382, 1–8. [Google Scholar] [CrossRef] [PubMed] [Green Version]
  38. Corfield, A.P.; Myerscough, N.; Warren, B.F.; Durdey, P.; Paraskeva, C.; Schauer, R. Reduction of sialic acid O-acetylation in human colonic mucins in the adenoma-carcinoma sequence. Glycoconj. J. 1999, 16, 307–317. [Google Scholar] [CrossRef] [PubMed]
  39. Shen, Y.; Kohla, G.; Lrhorfi, A.L.; Sipos, B.; Kalthoff, H.; Gerwig, G.J.; Kamerling, J.P.; Schauer, R.; Tiralongo, J. O-acetylation and de-o-acetylation of sialic acids in human colorectal carcinoma. Eur. J. Biochem. 2004, 271, 281–290. [Google Scholar] [CrossRef]
  40. Arming, S.; Wipfler, D.; Mayr, J.; Merling, A.; Vilas, U.; Schauer, R.; Schwartz-Albiez, R.; Vlasak, R. The human Cas1 protein: A sialic acid-specific O-acetyltransferase? Glycobiology 2011, 21, 553–564. [Google Scholar] [CrossRef] [Green Version]
  41. Cazet, A.; Groux-Degroote, S.; Teylaert, B.; Kwon, K.-M.; Lehoux, S.; Slomianny, C.; Kim, C.-H.; Le Bourhis, X.; Delannoy, P. GD3 synthase overexpression enhances proliferation and migration of MDA-MB-231 breast cancer cells. Biol. Chem. 2009, 390, 601–609. [Google Scholar] [CrossRef] [PubMed]
  42. Guérardel, Y.; Chang, L.-Y.; Fujita, A.; Coddeville, B.; Maes, E.; Sato, C.; Harduin-Lepers, A.; Kubokawa, K.; Kitajima, K. Sialome analysis of the cephalochordate Branchiostoma belcheri, a key organism for vertebrate evolution. Glycobiology 2012, 22, 479–491. [Google Scholar] [CrossRef] [PubMed] [Green Version]
  43. Klein, A.; Diaz, S.; Ferreira, I.; Lamblin, G.; Roussel, P.; Manzi, A.E. New sialic acids from biological sources identified by a comprehensive and sensitive approach: Liquid chromatography-electrospray ionization-mass spectrometry (LC-ESI-MS) of SIA quinoxalinones. Glycobiology 1997, 7, 421–432. [Google Scholar] [CrossRef] [PubMed] [Green Version]
  44. Sommer, U.; Herscovitz, H.; Welty, F.K.; Costello, C.E. LC-MS-based method for the qualitative and quantitative analysis of complex lipid mixtures. J. Lipid Res. 2006, 47, 804–814. [Google Scholar] [CrossRef] [Green Version]
  45. Shannon, P.; Markiel, A.; Ozier, O.; Baliga, N.S.; Wang, J.T.; Ramage, D.; Amin, N.; Schwikowski, B.; Ideker, T. Cytoscape: A software environment for integrated models of biomolecular interaction networks. Genome Res. 2003, 13, 2498–2504. [Google Scholar] [CrossRef]
Figure 1. Biosynthesis pathway for gangliosides [2]. Gangliosides are synthesized by stepwise addition of monosaccharides to GlcCer. Extension of GlcCer occurs through the action of the UDP-Gal: GlcCer β1,4-galactosyltransferase to make lactosylceramide (LacCer). The action of the GM3 synthase, GD3 synthase, and GT3 synthase leads to the biosynthesis of the precursors of a-, b-, and c-series gangliosides, respectively. The 0-series gangliosides are directly synthesized from LacCer. Elongation is performed by the sequential action of β4GalNAc T1, β3Gal T4, and the sialyltransferases ST3Gal II and ST8Sia V. Genes encoding the different glycosyltransferases involved are indicated in italics between brackets.
Ijms 21 00370 g001
Figure 2. Neu5Ac and Neu5,9Ac2 DMB-Sia derivatives quantification by LC-ESI/MS in different cell fractions. Cell pellets were fractionated into membrane associated glycoproteins, glycolipids, soluble proteins, and free sialic acid fractions and hydrolyzed by propionic acid. The extracted sialic acids were derivatized using DMB and injected into LC-ESI/MS for identification and quantification. The amounts of Neu5Ac and Neu5,9Ac2 were quantified by integrating the corresponding areas obtained using extracted ion chromatogram on DMB-Sia derivatives. Each bar represents the mean of three independent experiments.
Ijms 21 00370 g002
Figure 3. Gangliosides profiling by representative MS spectra in Hs 578T (A) and MDA-MB-231 GD3S+#4 (B). Ceramide consists mainly of d18:1 long chain base and C16, C18, C24 either/both saturated or/and saturated fatty acids. Red signals identify acetylated gangliosides species and black signals non-acetylated forms of gangliosides species. The nature of long fatty acid chain is indicated in blue on the spectra. * and *** indicates that GD2 Cer16 and OAcGT3Cer16 are respectively present in traces amount; ** indicates that signal corresponds to a mixture of OAcGM1Cer24 with OAcGD2Cer18; **** indicates that signal corresponds to a mixture of GM2 with OAcGD3. Gangliosides are depicted according to the following Ijms 21 00370 i001 Ceramide; Ijms 21 00370 i002 Galactose; Ijms 21 00370 i003 Glucose; Ijms 21 00370 i004 N-acetyl-galactosamine; Ijms 21 00370 i005 N-acetyl-neuraminic acid.
Ijms 21 00370 g003
Figure 4. Representative MS/MS fragmentation of the molecular ion corresponding to OAcGM1, OAcGD3, OAcGD2, OAcGT3, and OAcGT2. (A) MS/MS fragmentation of the molecular ion m/z 1670 in Hs 578T corresponding to OAcGM1 and OAcGD2 ganglioside. MS/MS fragmentation of the molecular ion m/z 1782 (B) m/z 2055 (C) respectively corresponding to OAcGD2 and OAcGT2 gangliosides in MDA-MB-231 GD3S + clone #4. (D) MS/MS fragmentation of the molecular ion m/z 1467 corresponding to OAcGD3 identified in SK-Mel-28. (E) MS/MS fragmentation of the molecular ion m/z 1852 corresponding to OAcGT3 identified in MDA-MB-231 GD3S+ clone #11. Gangliosides are indicated according to the following Ijms 21 00370 i001 Ceramide; Ijms 21 00370 i002 Galactose; Ijms 21 00370 i003 Glucose; Ijms 21 00370 i004 N-acetyl-galactosamine; Ijms 21 00370 i005 N-acetyl-neuraminic acid, ° dehydration Ac: O-acetyl group.
Ijms 21 00370 g004
Figure 5. Relative quantification of the global content of main ganglioside species by MALDI-QIT-TOF. Relative quantification of ganglioside content of the apex intensities (mV) of the peak assigned on MALDI-QIT-TOF spectra (n = 3). Total ganglioside content was normalized to 100 for each cell line. The relative amount of each species is calculated as the percentage of the total ganglioside content. Pie charts represent the percentage of total acetylated gangliosides (light grey) vs. non-acetylated (dark grey).
Ijms 21 00370 g005
Figure 6. Differential ganglioside metabolism pathways between Hs 578T and MDA-MB-231 breast cancer cells. Glycosyltransferase gene expression profile obtained by qPCR were mapped onto a subpart of the “Ganglio-sphingolipid metabolism” pathway from WikiPathways [18,19] based on the differential expression between two cell lines. In the squared nodes, colors vary from blue (≤ −2) to white (= 0) and red (≥ 2) to indicate the repression to the over-expression of the glycosyltransferase gene in Hs 578T compared to MDA-MB-231 cells (thick black arrows). Quantitative data concerning the relative amounts of gangliosides obtained by MALDI-QIT-TOF mass spectrometry were added to the pathway based on the comparison between Hs 578T and MDA-MB-231 cells. In the octagonal nodes, colors vary from green (≤ −8) to white (= 0) and fuchsia (≥ 8) to indicate a restraint to a rise of the amount of a given ganglioside based on the differences observed between the two cell lines. Grey color indicates the absence of any available quantitative data about the expression.
Ijms 21 00370 g006
Figure 7. Differential ganglioside metabolism pathways between MDA-MB-231 GD3S+ clone #4 and MDA-MB-231 breast cancer cells. Glycosyltransferase gene expression profile obtained by qPCR were mapped onto a subpart of the “Ganglio-sphingolipid metabolism” pathway from WikiPathways [18,19] based on the differential expression between two cell lines. In the squared nodes, colors vary from blue (≤ −2) to white (= 0) and red (≥ 2) to indicate the repression to the over-expression of the glycosyltransferase gene in MDA-MB-231 GD3S+ clone #4 compared to MDA-MB-231 cells (thick black arrows). Quantitative data concerning the relative amounts of gangliosides obtained by MALDI-QIT-TOF mass spectrometry were added to the pathway based on the comparison between MDA-MB-231 GD3S+ clone #4 and MDA-MB-231 cells. In the octagonal nodes, colors vary from green (≤ −8) to white (= 0) and fuchsia (≥ 8) to indicate a restraint to a rise of the amount of a given ganglioside based on the differences observed between the two cell lines. Grey color indicates the absence of any available quantitative data about the expression.
Ijms 21 00370 g007
Table 1. List of identified gangliosides in neuroectoderm derived cells. Monosylalylated GSL are observed at [M−H]. Di- and trisialylated GSL were mainly observed at m/z [M−H2O−H] and [M−2H2O−H]. √ indicates the presence of GSL, and √ T indicates that GSL is present in traces amount.
GSLFatty AcidsMonoisotopic Mass [M-H]-m/zLactonizationSK-Mel-28LAN-1SUM 159 PTHs 578T MDA-MB-231 MDA-MB-231 GD3S+ Clone #4MDA-MB-231 GD3S+ Clone #11MCF-7MCF-7 GD3S+
GM3C161151.7
C181179.7
C221235.8
C241263.8
GM2C161354.8
C181382.8
C221438.9
C241466.9
GM1C161516.8
C241629.0
LacNAcGM1C161882.0
GD3C161424.8-H2O
C161442.8
C181452.8-H2O
C221508.9-H2O
C241536.9-H2O
C241554.9
GD2C161628.9-H2O √T √T
C181671.9
C241740.0-H2O
GD1bC241902.1-H2O
GT3C241810.0-2H2O
GT2C242013.1-2H2O
OAcGM1C241671
OAcGD3C141438.8-H2O √T
C161466.8-H2O √T
C241578.9-H2O
OAcGD2C161670-2H2O
C241782-H2O
OAcGT3C161740.0-2H2O √T
C241852.0-2H2O
OAcGT2C242055.1

