Identification of Selective Novel Hits against Plasmodium falciparum Prolyl tRNA Synthetase Active Site and a Predicted Allosteric Site Using In Silico Approaches


Abstract
:
1. Introduction
2. Results and Discussion
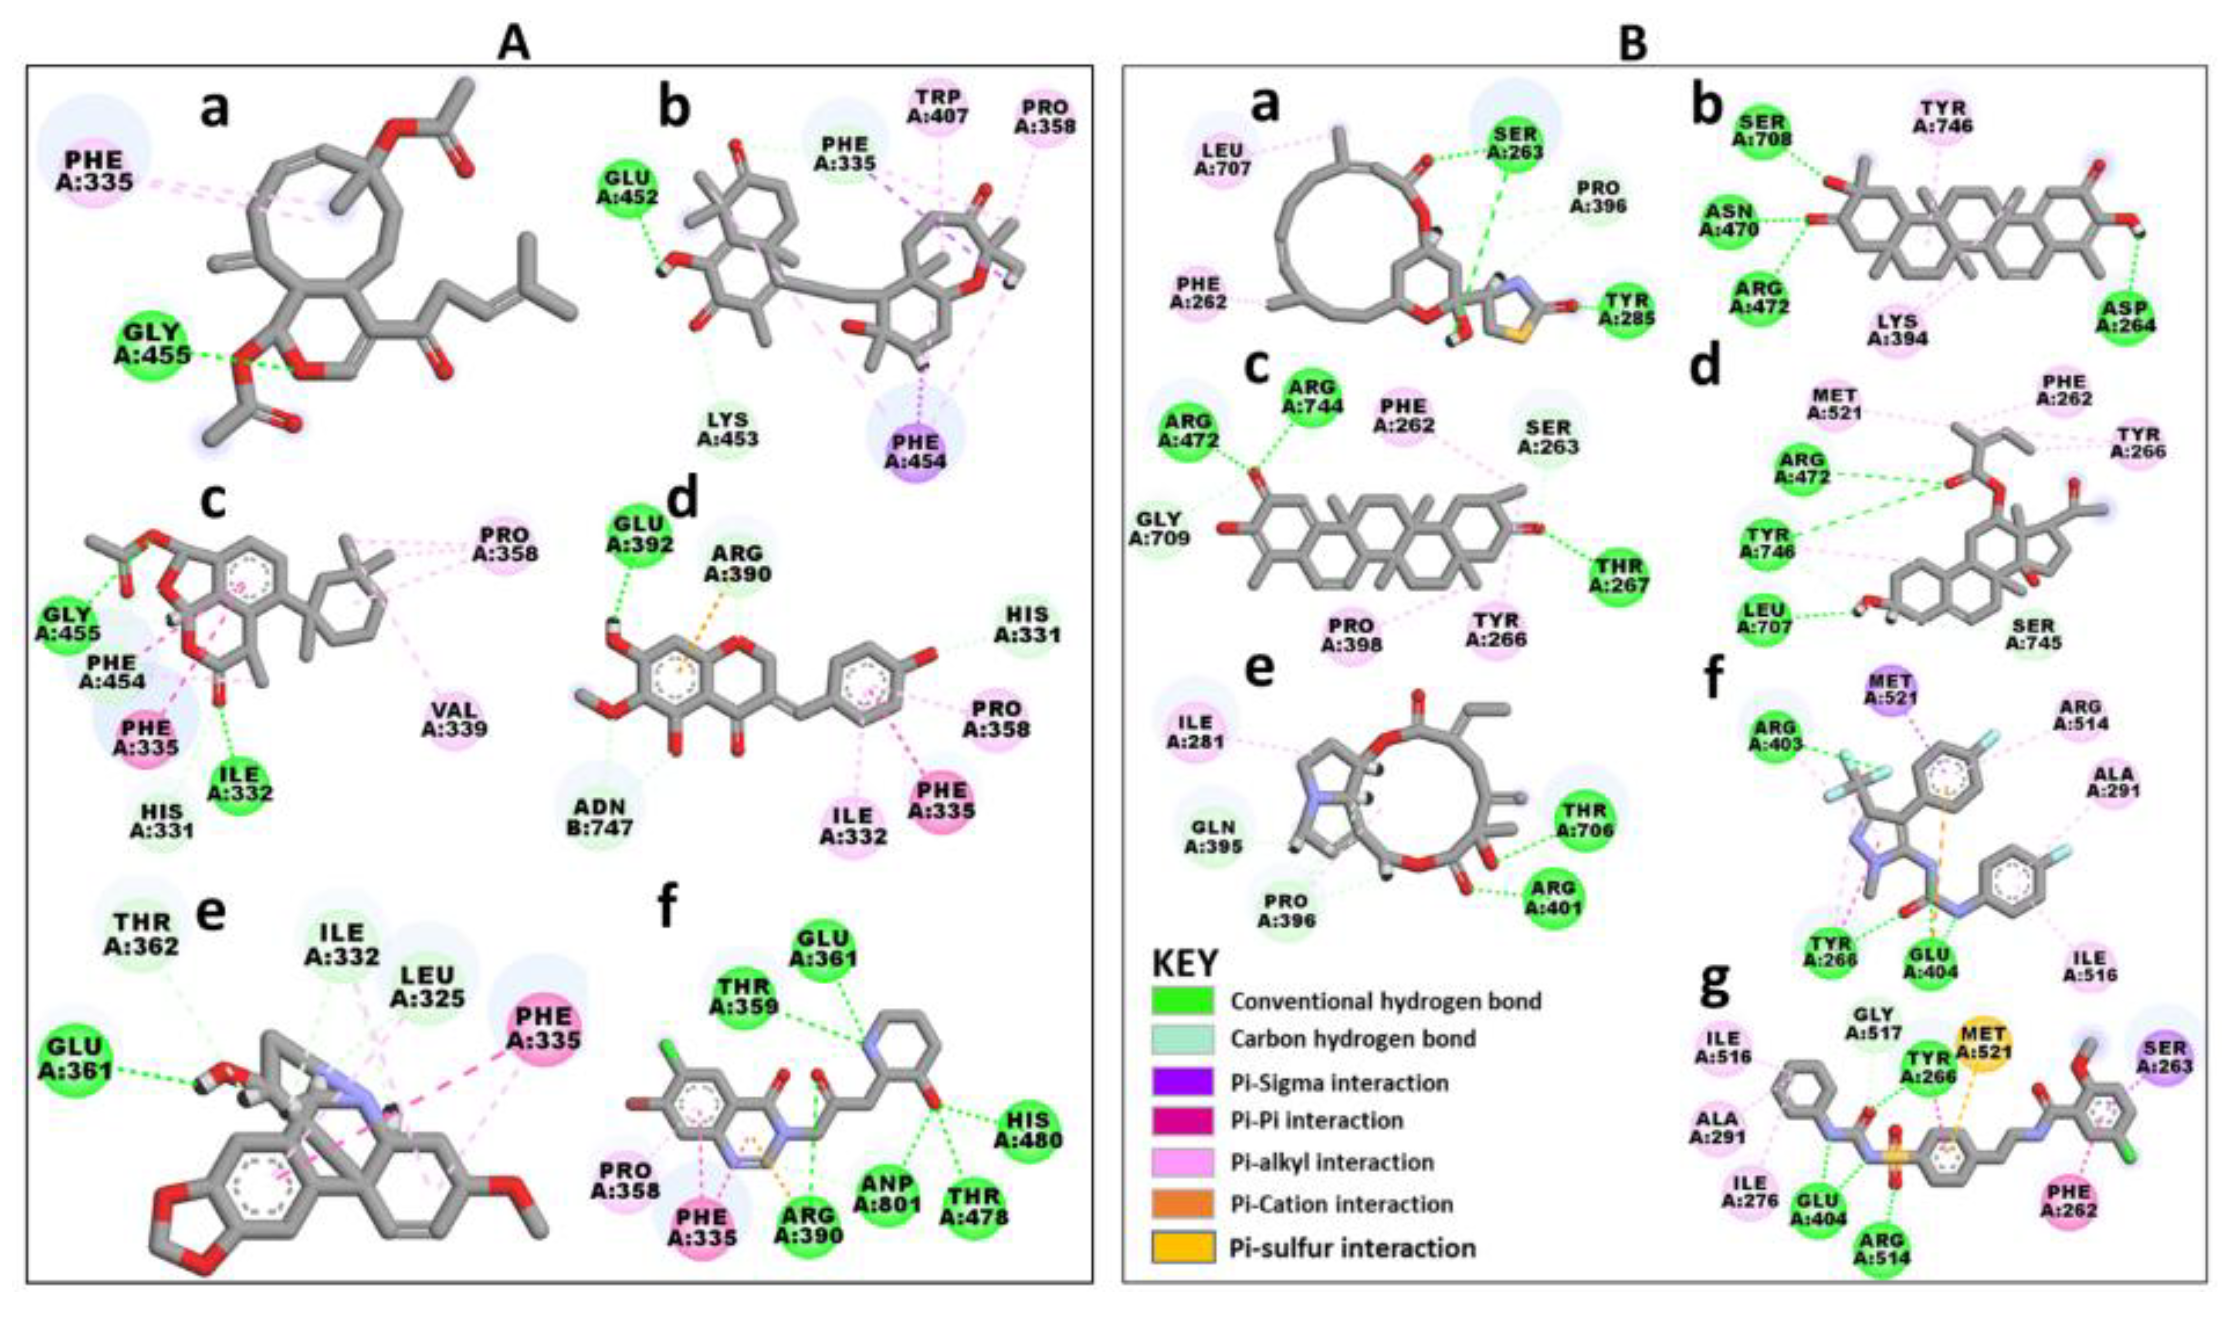
2.1. Five SANCDB Compounds Are Identified for PfProRS Active Site
2.2. Five Further SANCDB Compounds Are Identified for PfProRS Allosteric Site
2.3. Ligand Binding Modulates Global Protein Motions
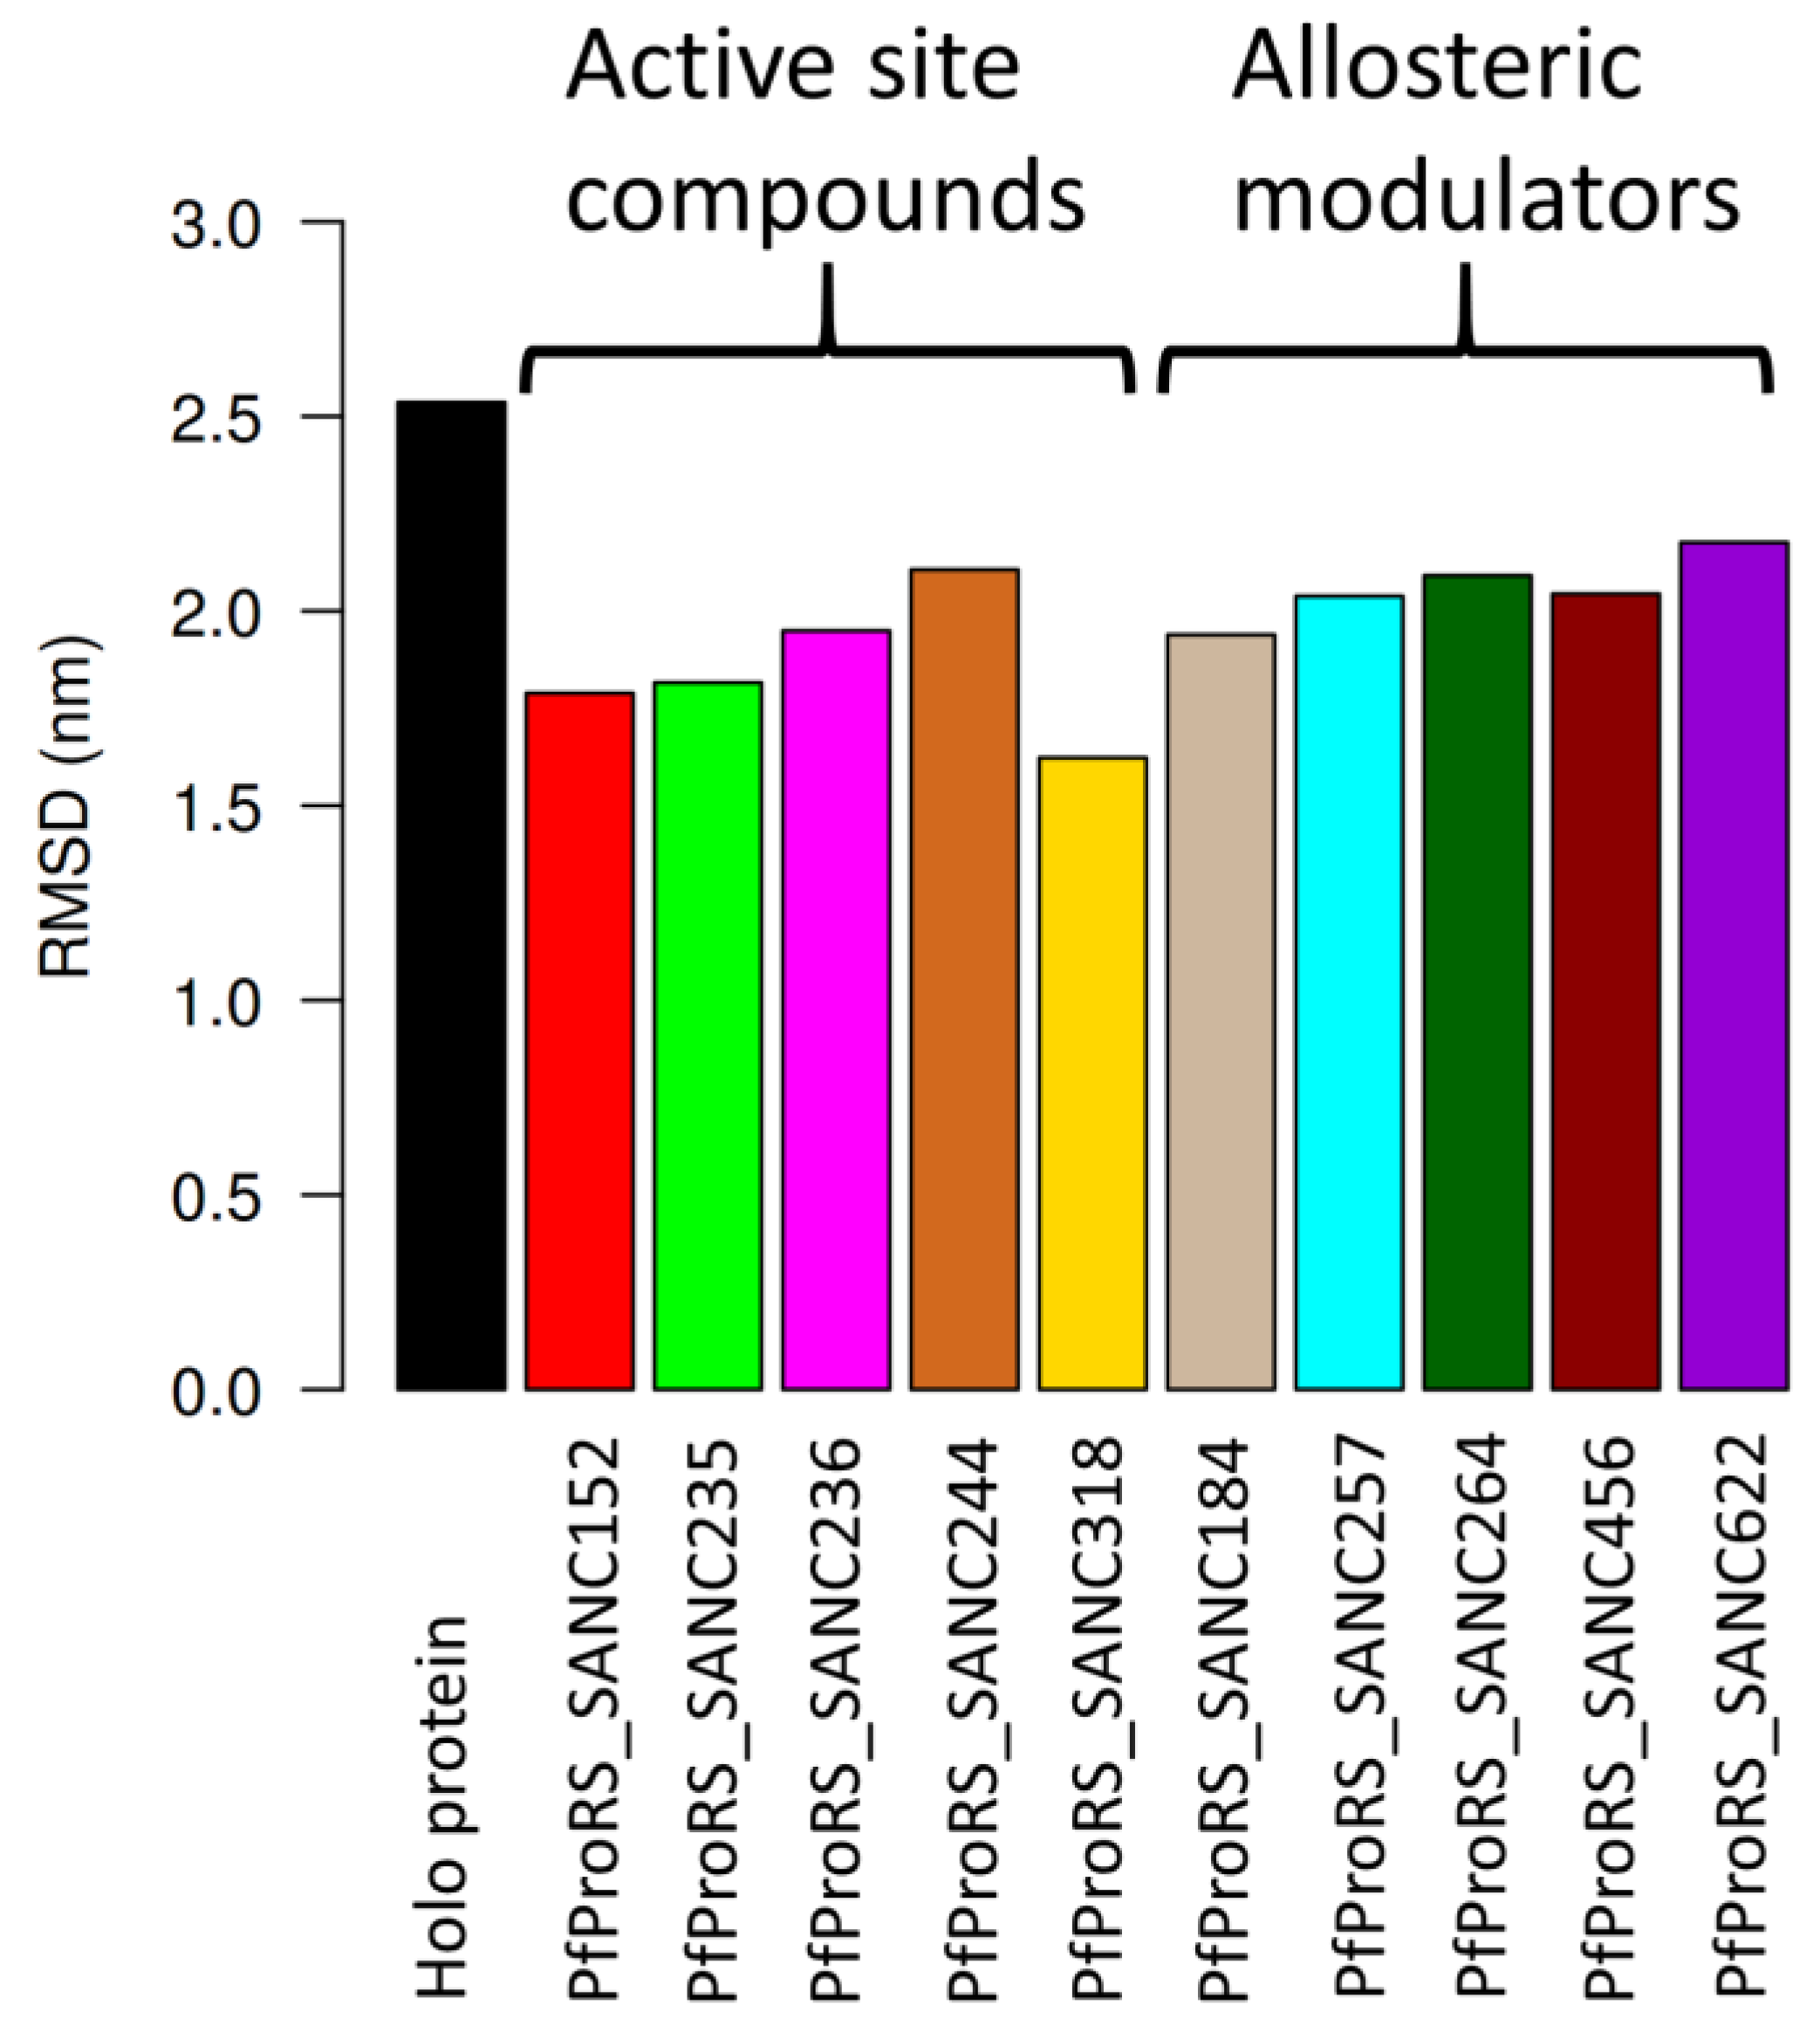
2.3.1. Root Mean Square Deviations (RMSD)
2.3.2. Ligand Binding Has No Effect on Protein Backbone Compactness
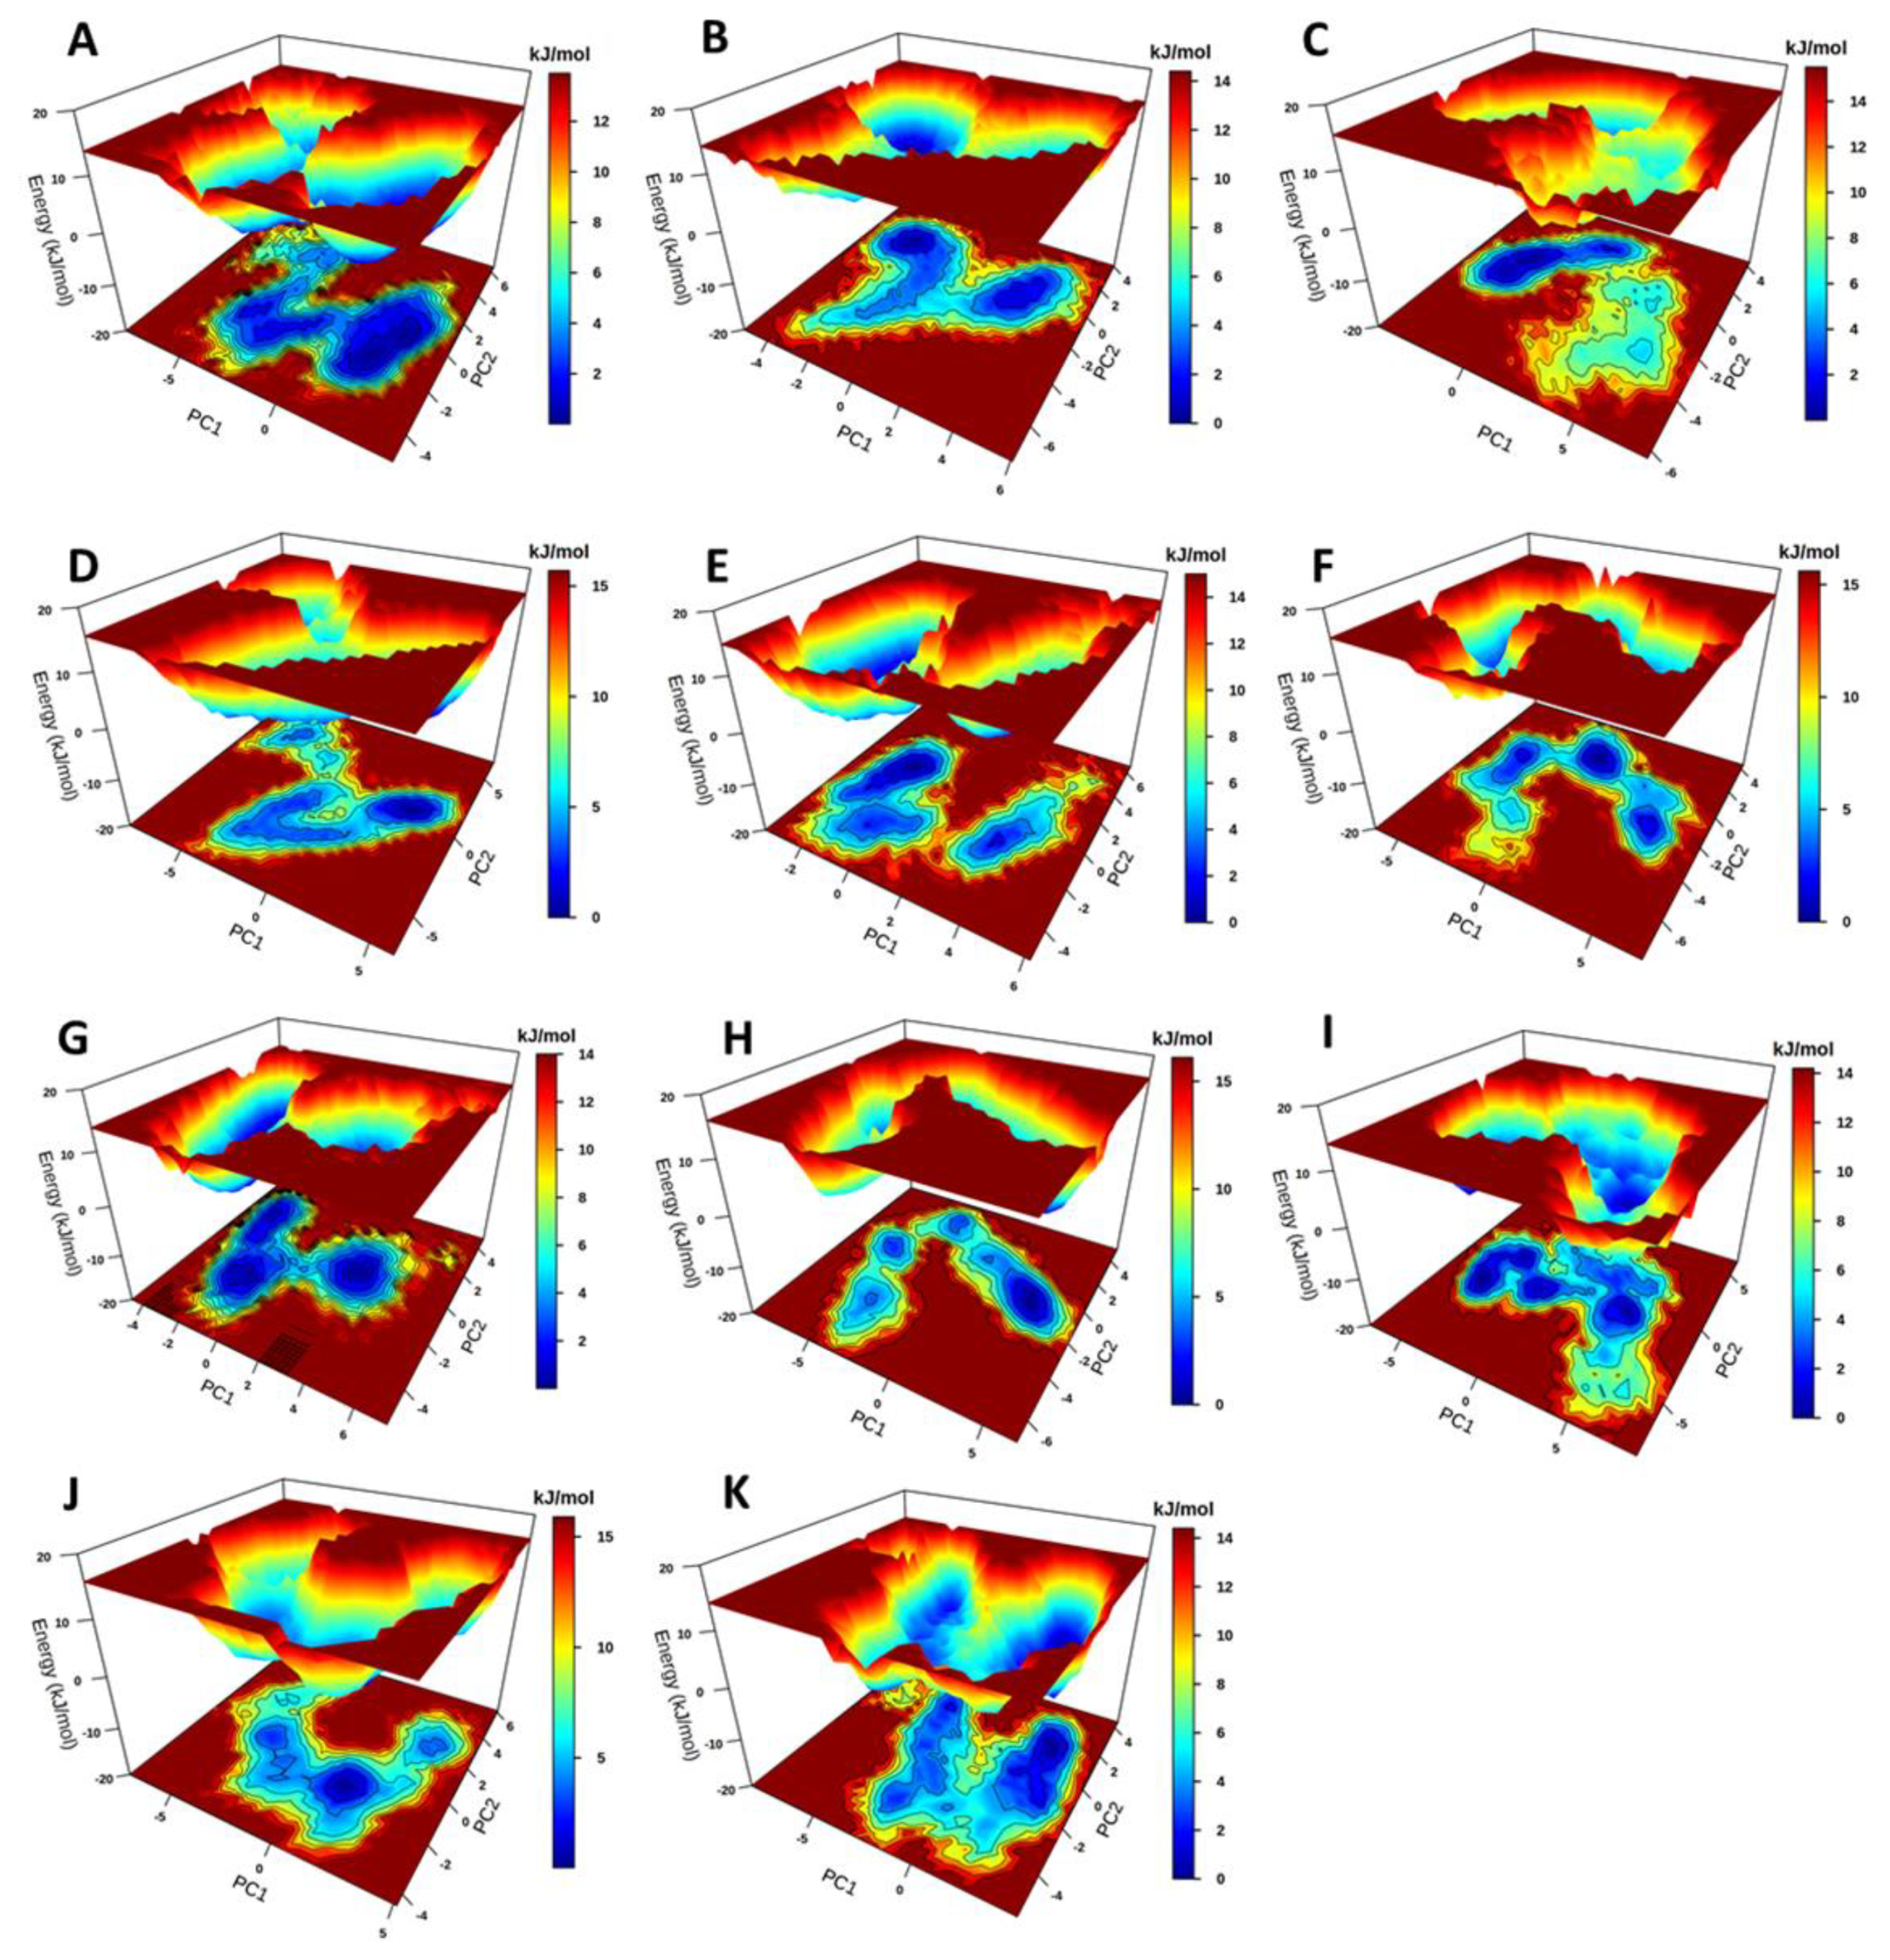
2.3.3. Principal Component Analysis and Free Energy Landscapes
2.4. Ligand Binding Modulates Local Protein Motions
2.4.1. Ligand Binding Modulates Residue Flexibility
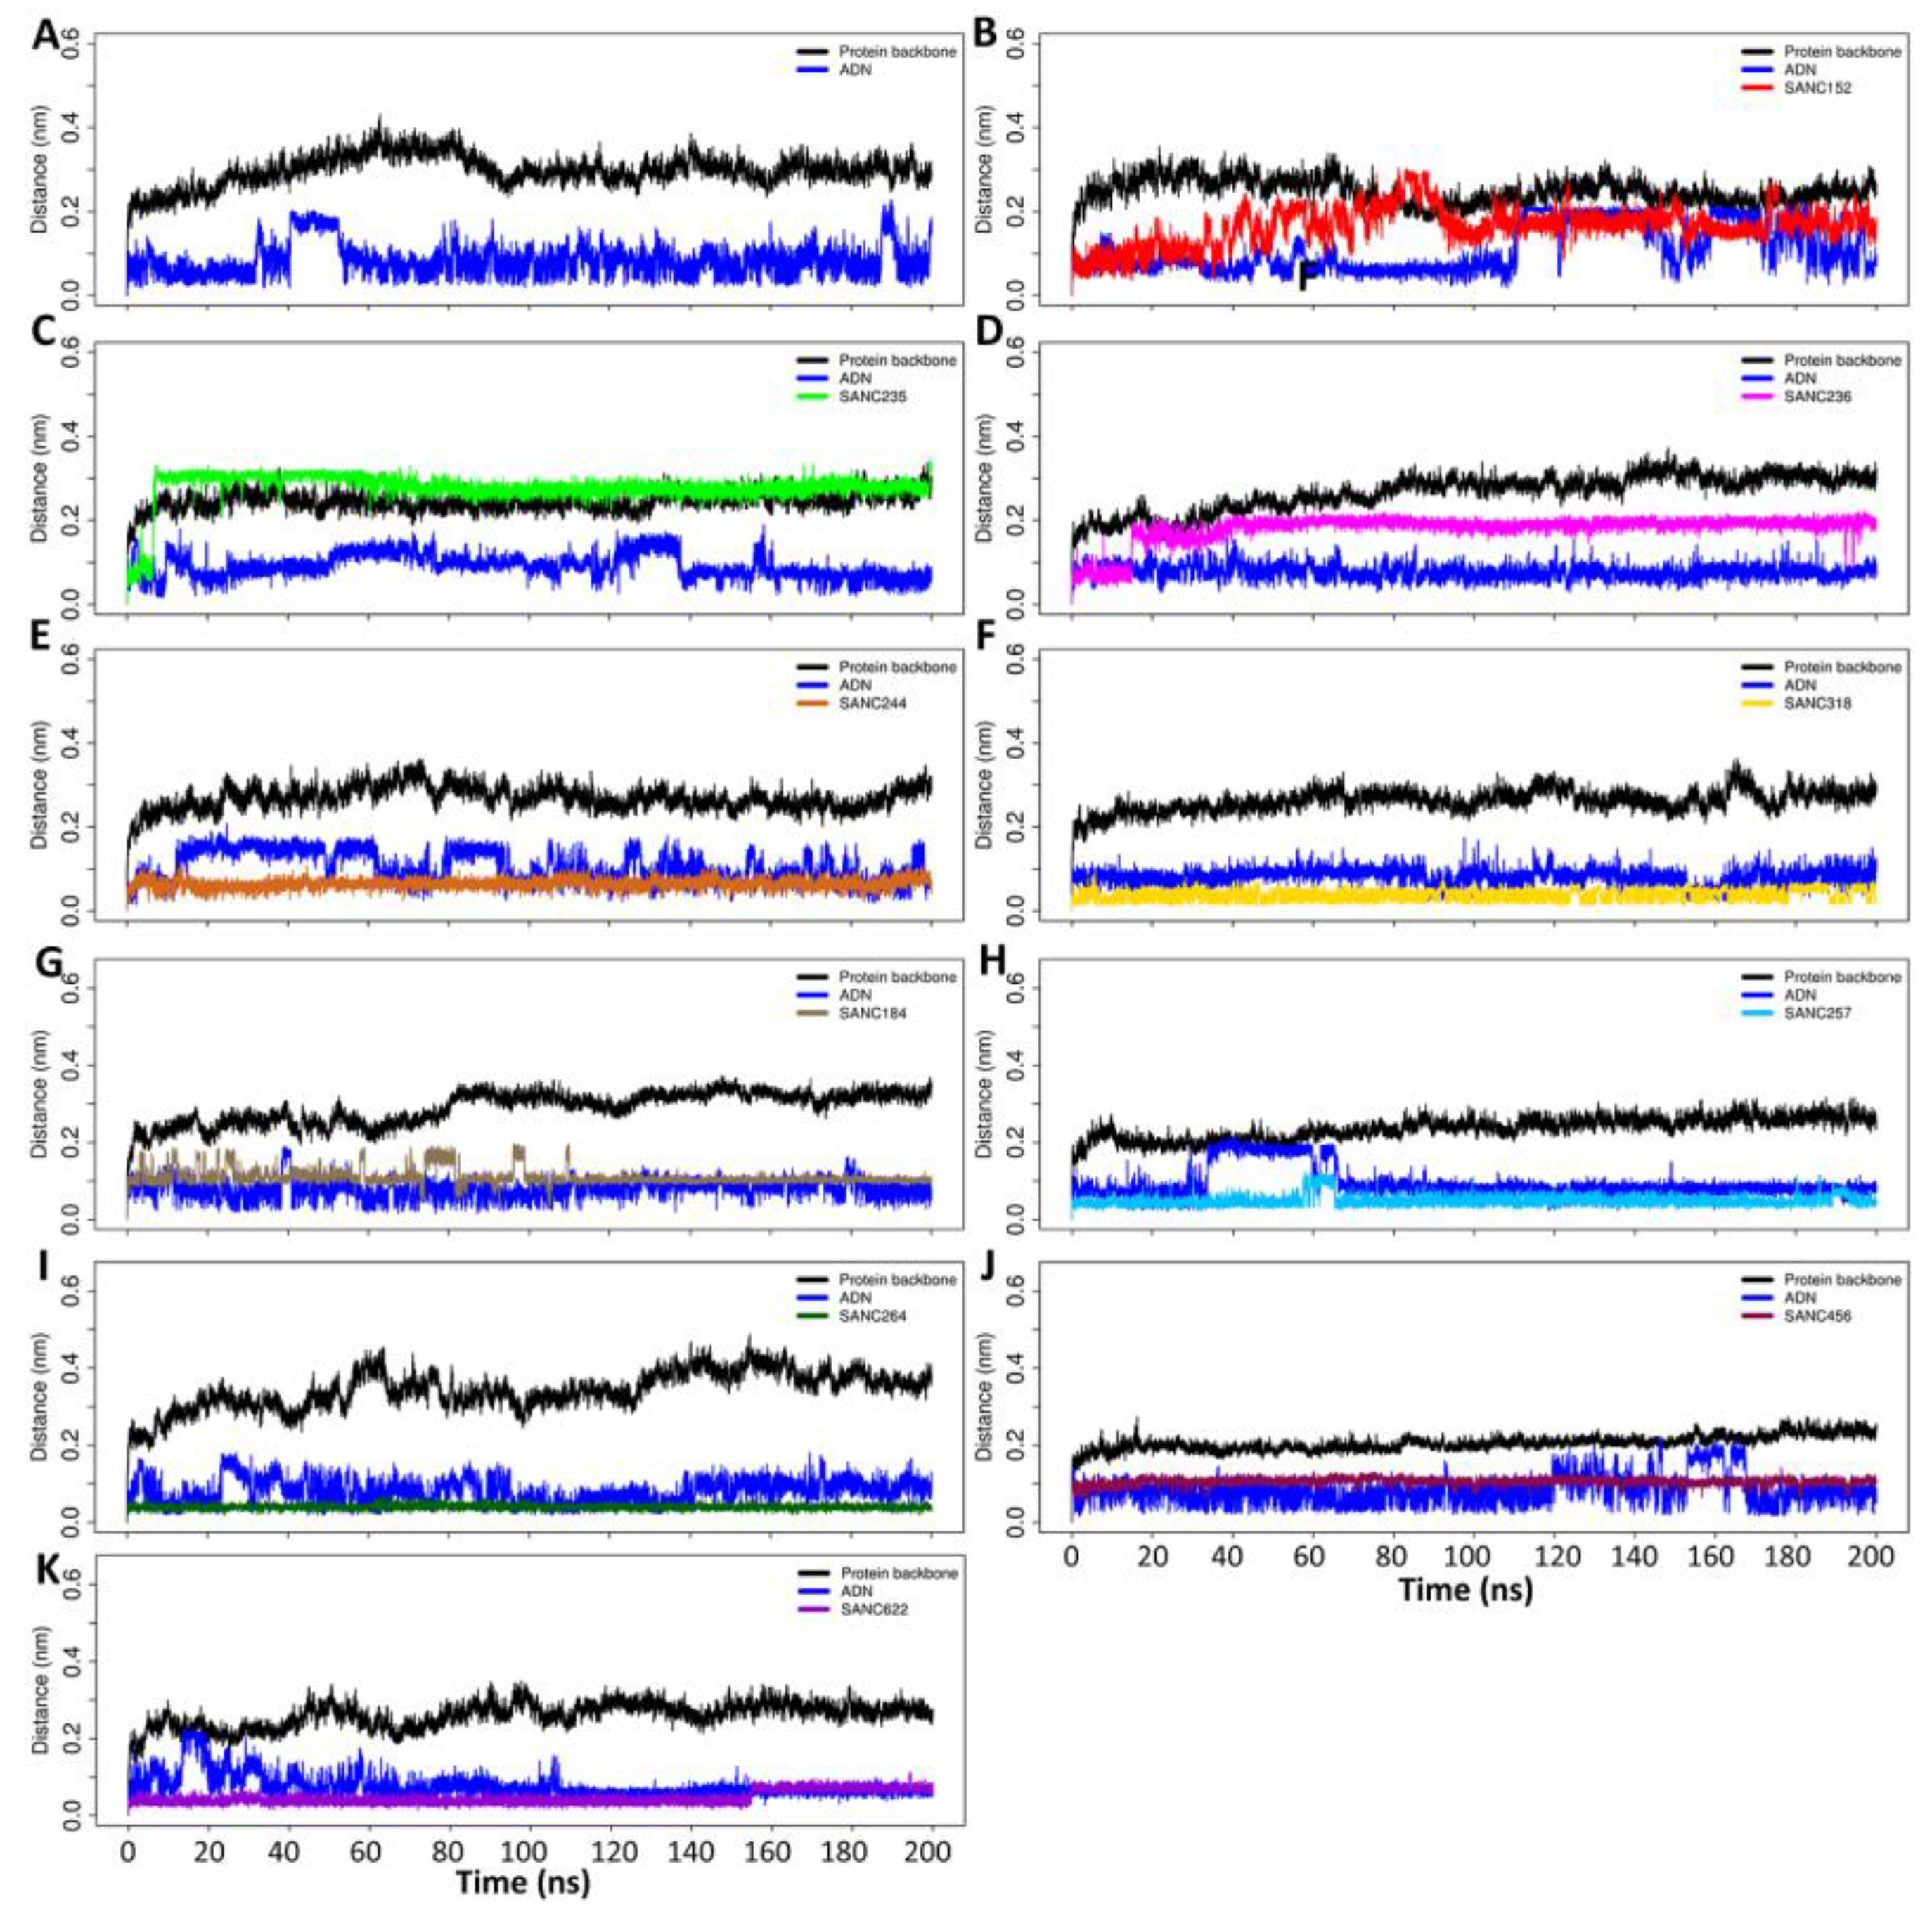
2.4.2. Evolution of Hydrogen Bond Interactions over the 200 ns Simulations
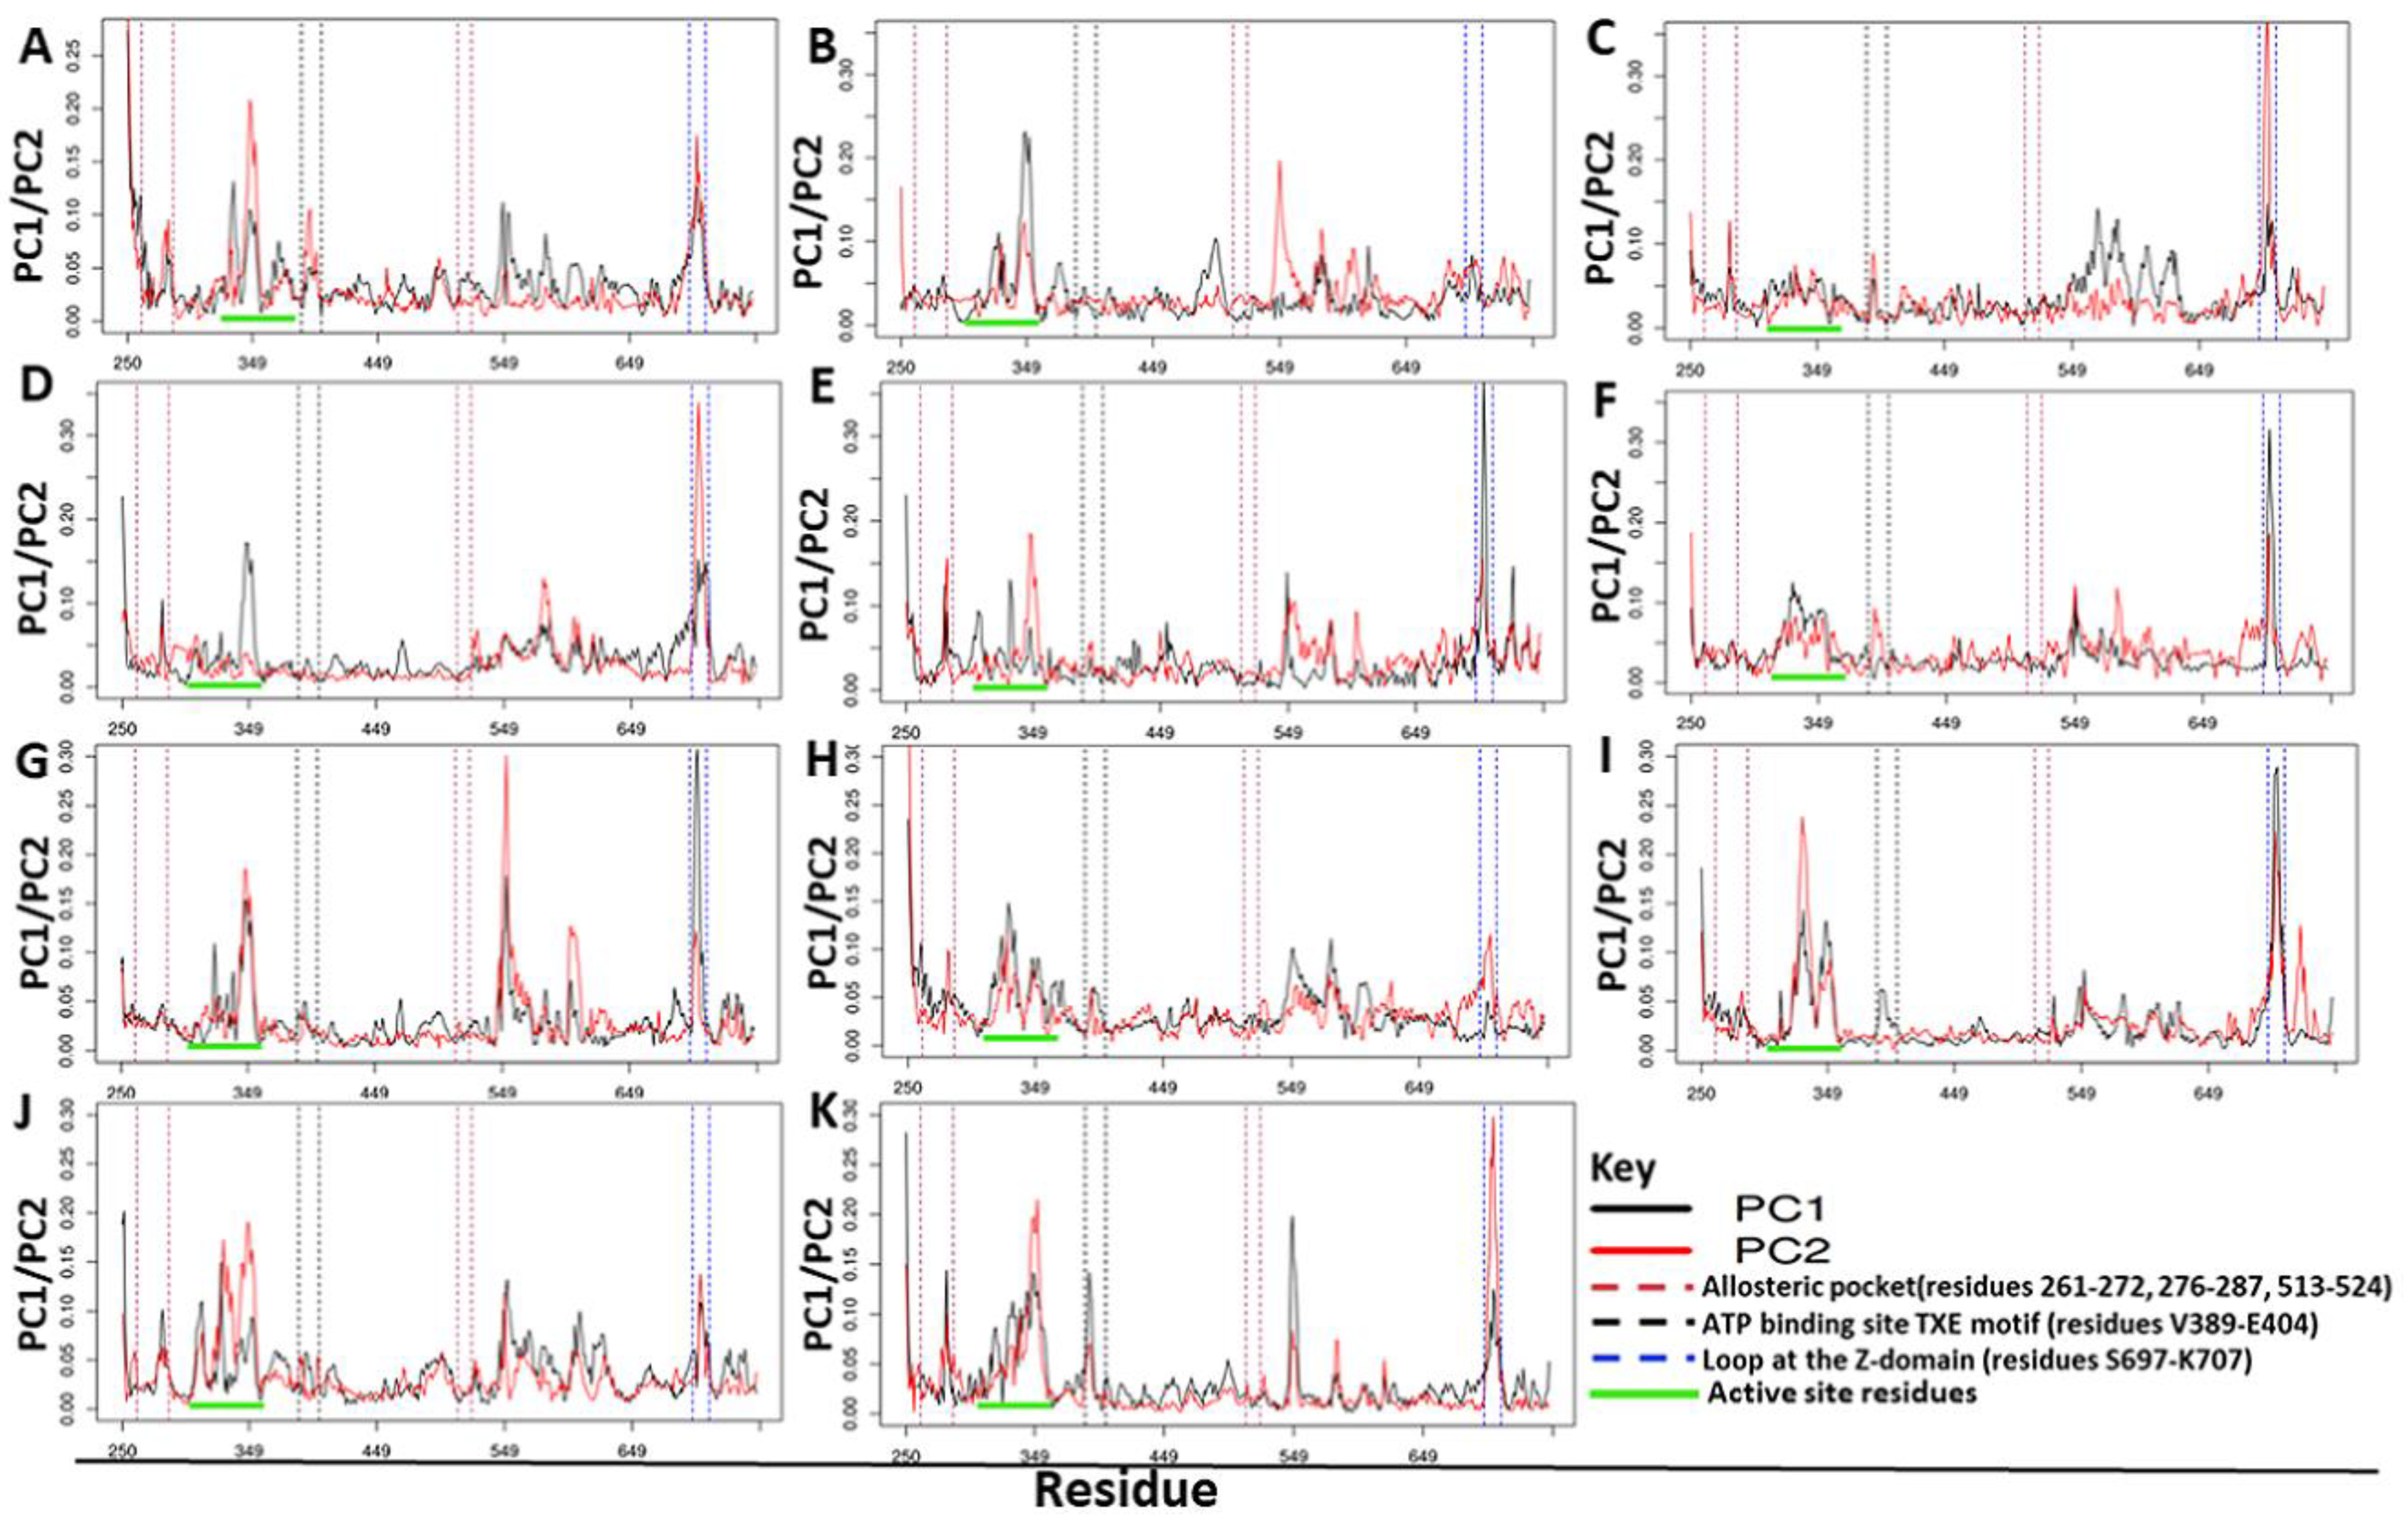
2.4.3. Residue Contribution to PC1 and PC2 Motions
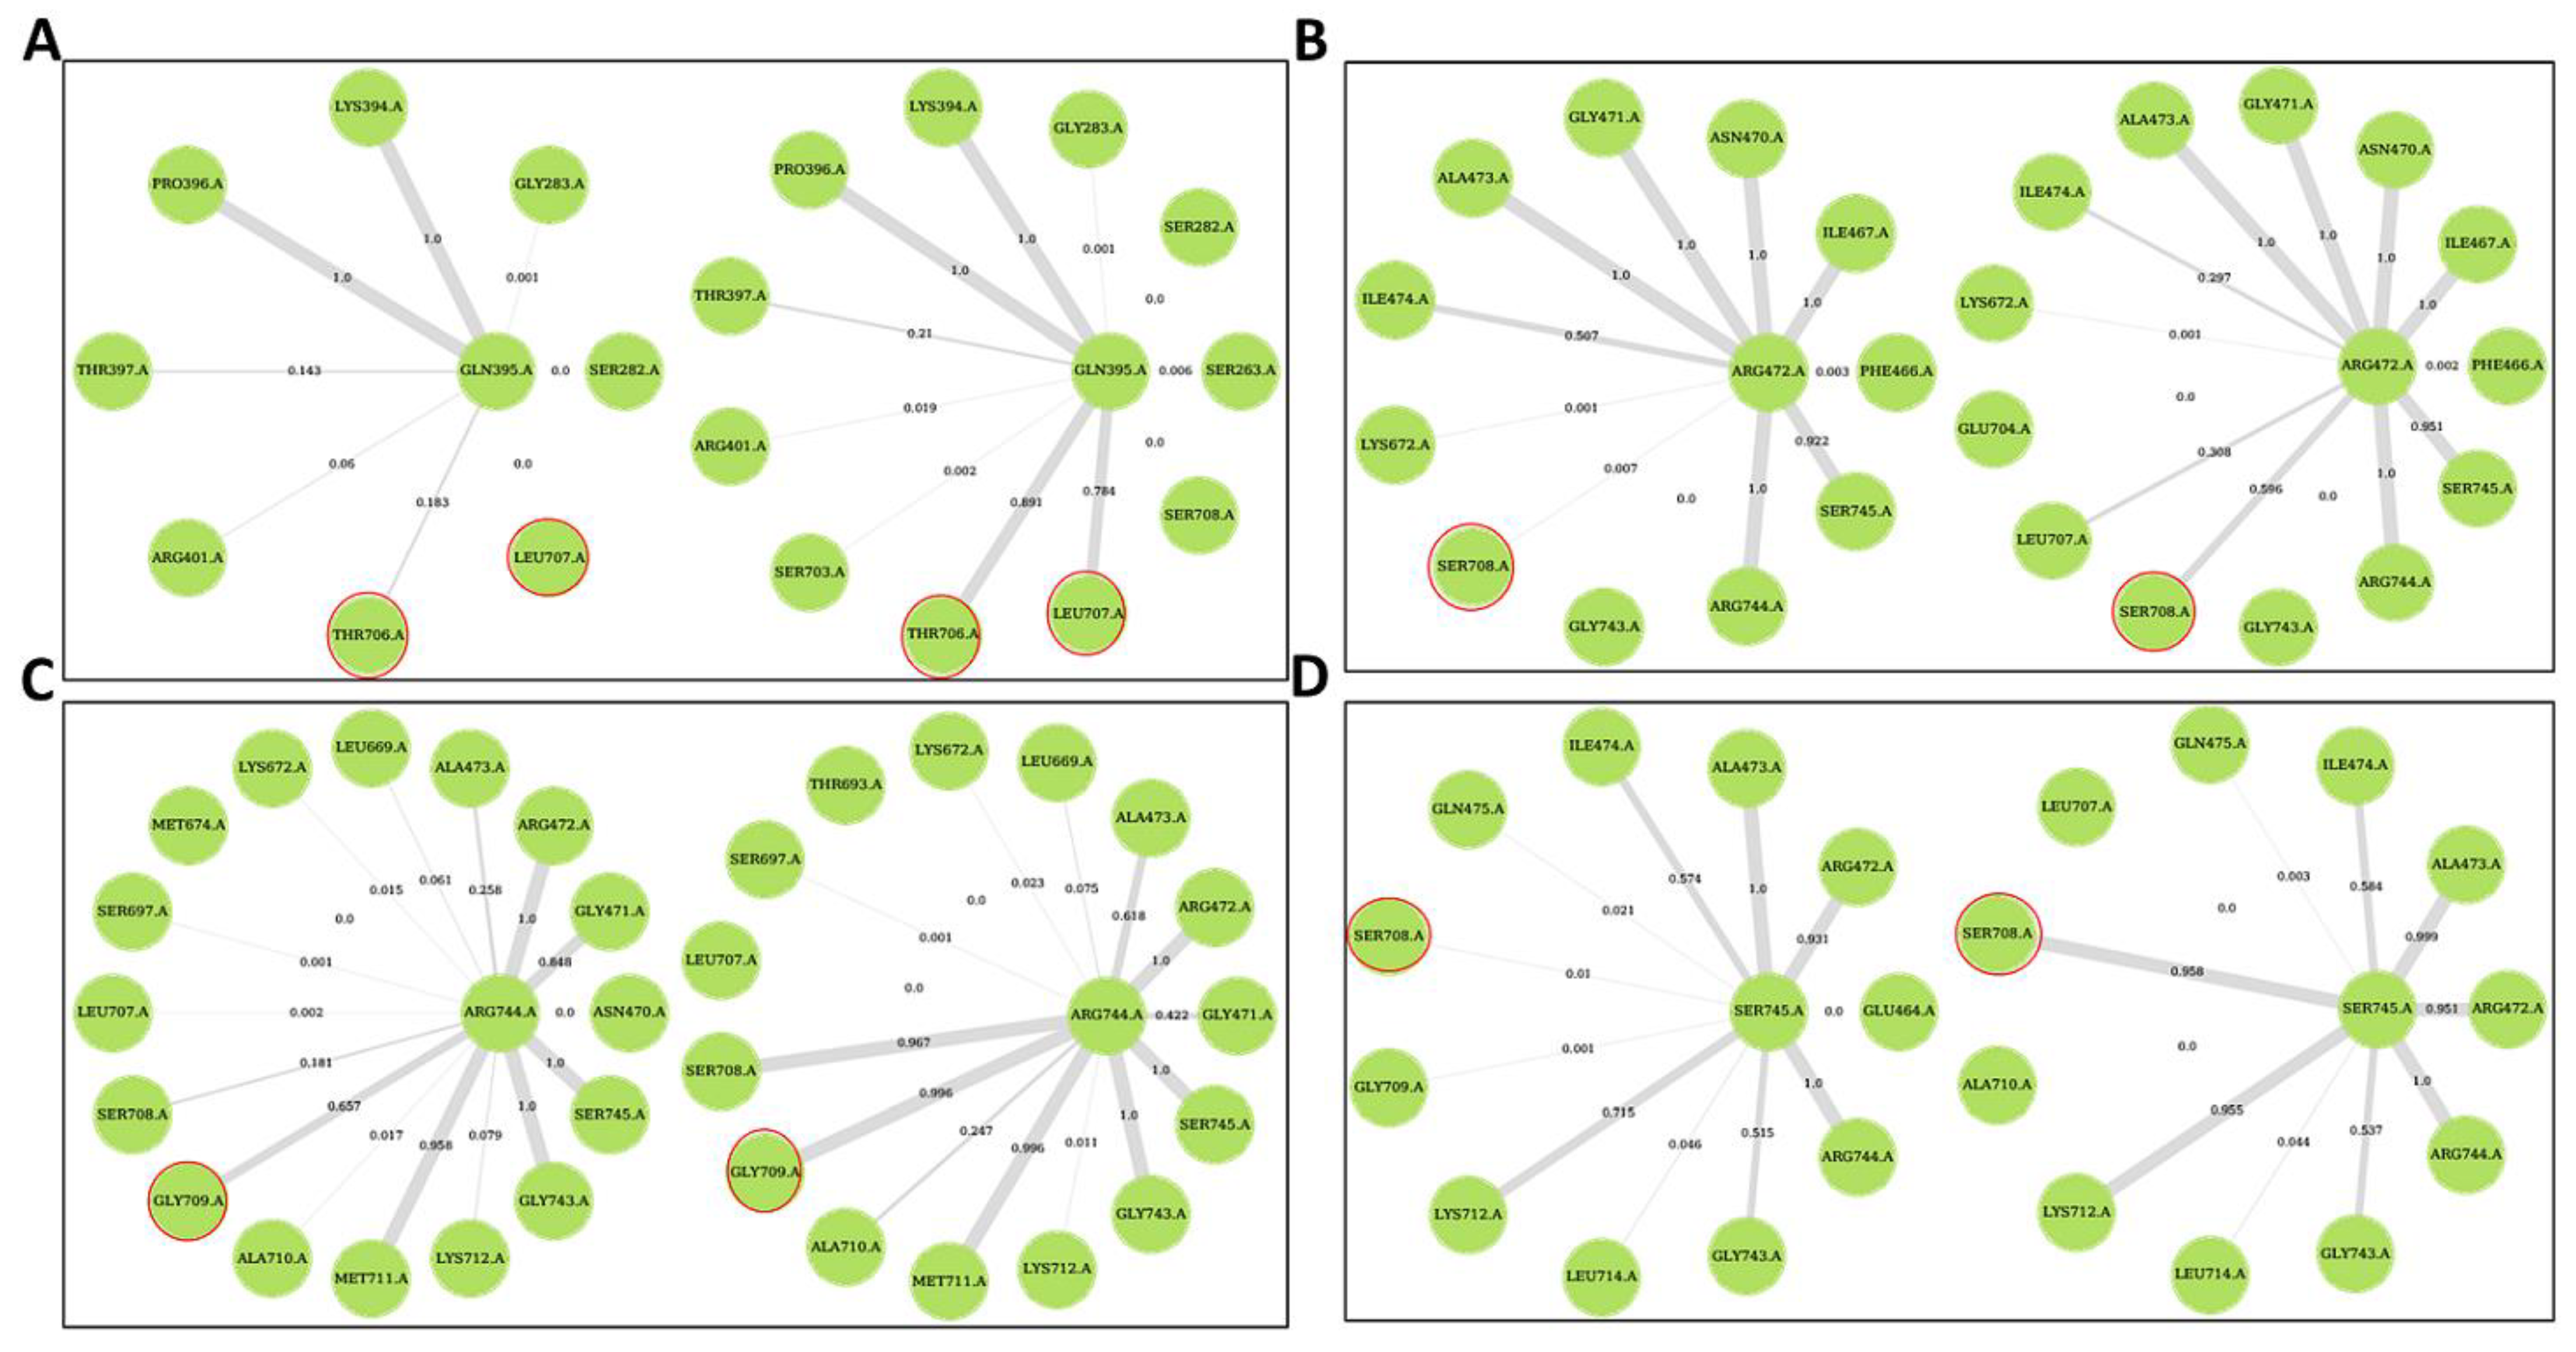
2.5. Ligand Binding Modulates Protein Communication
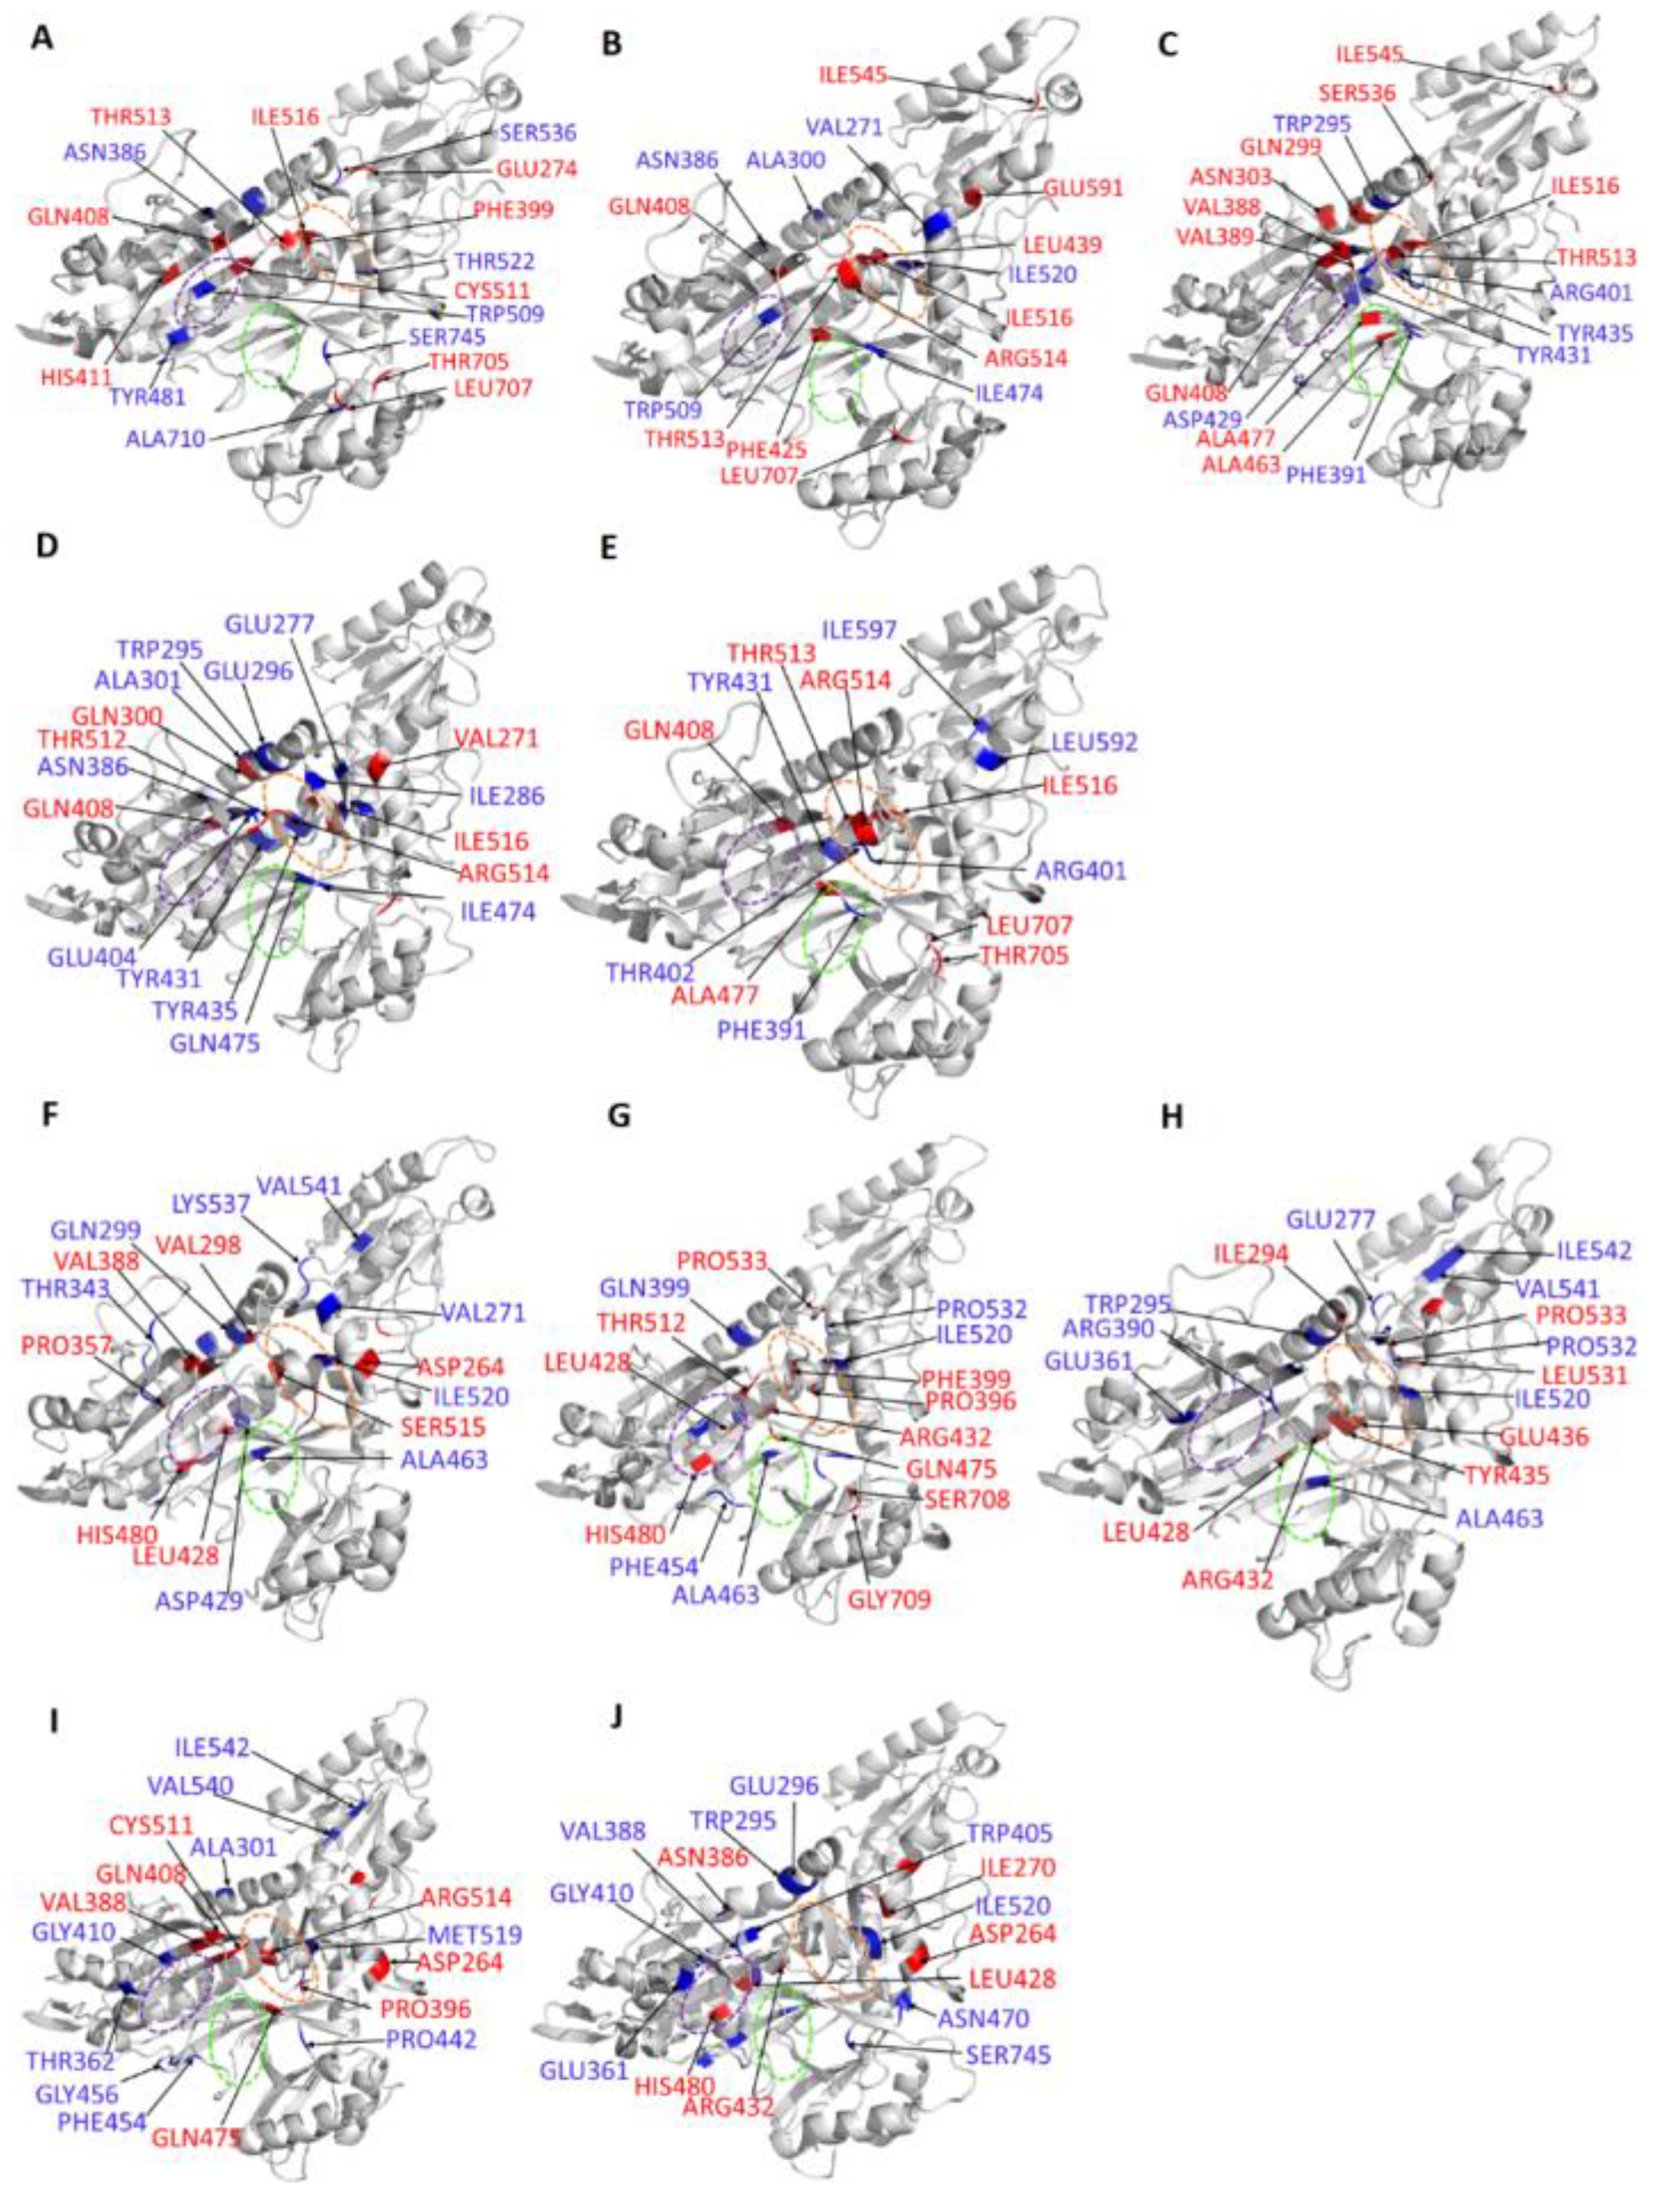
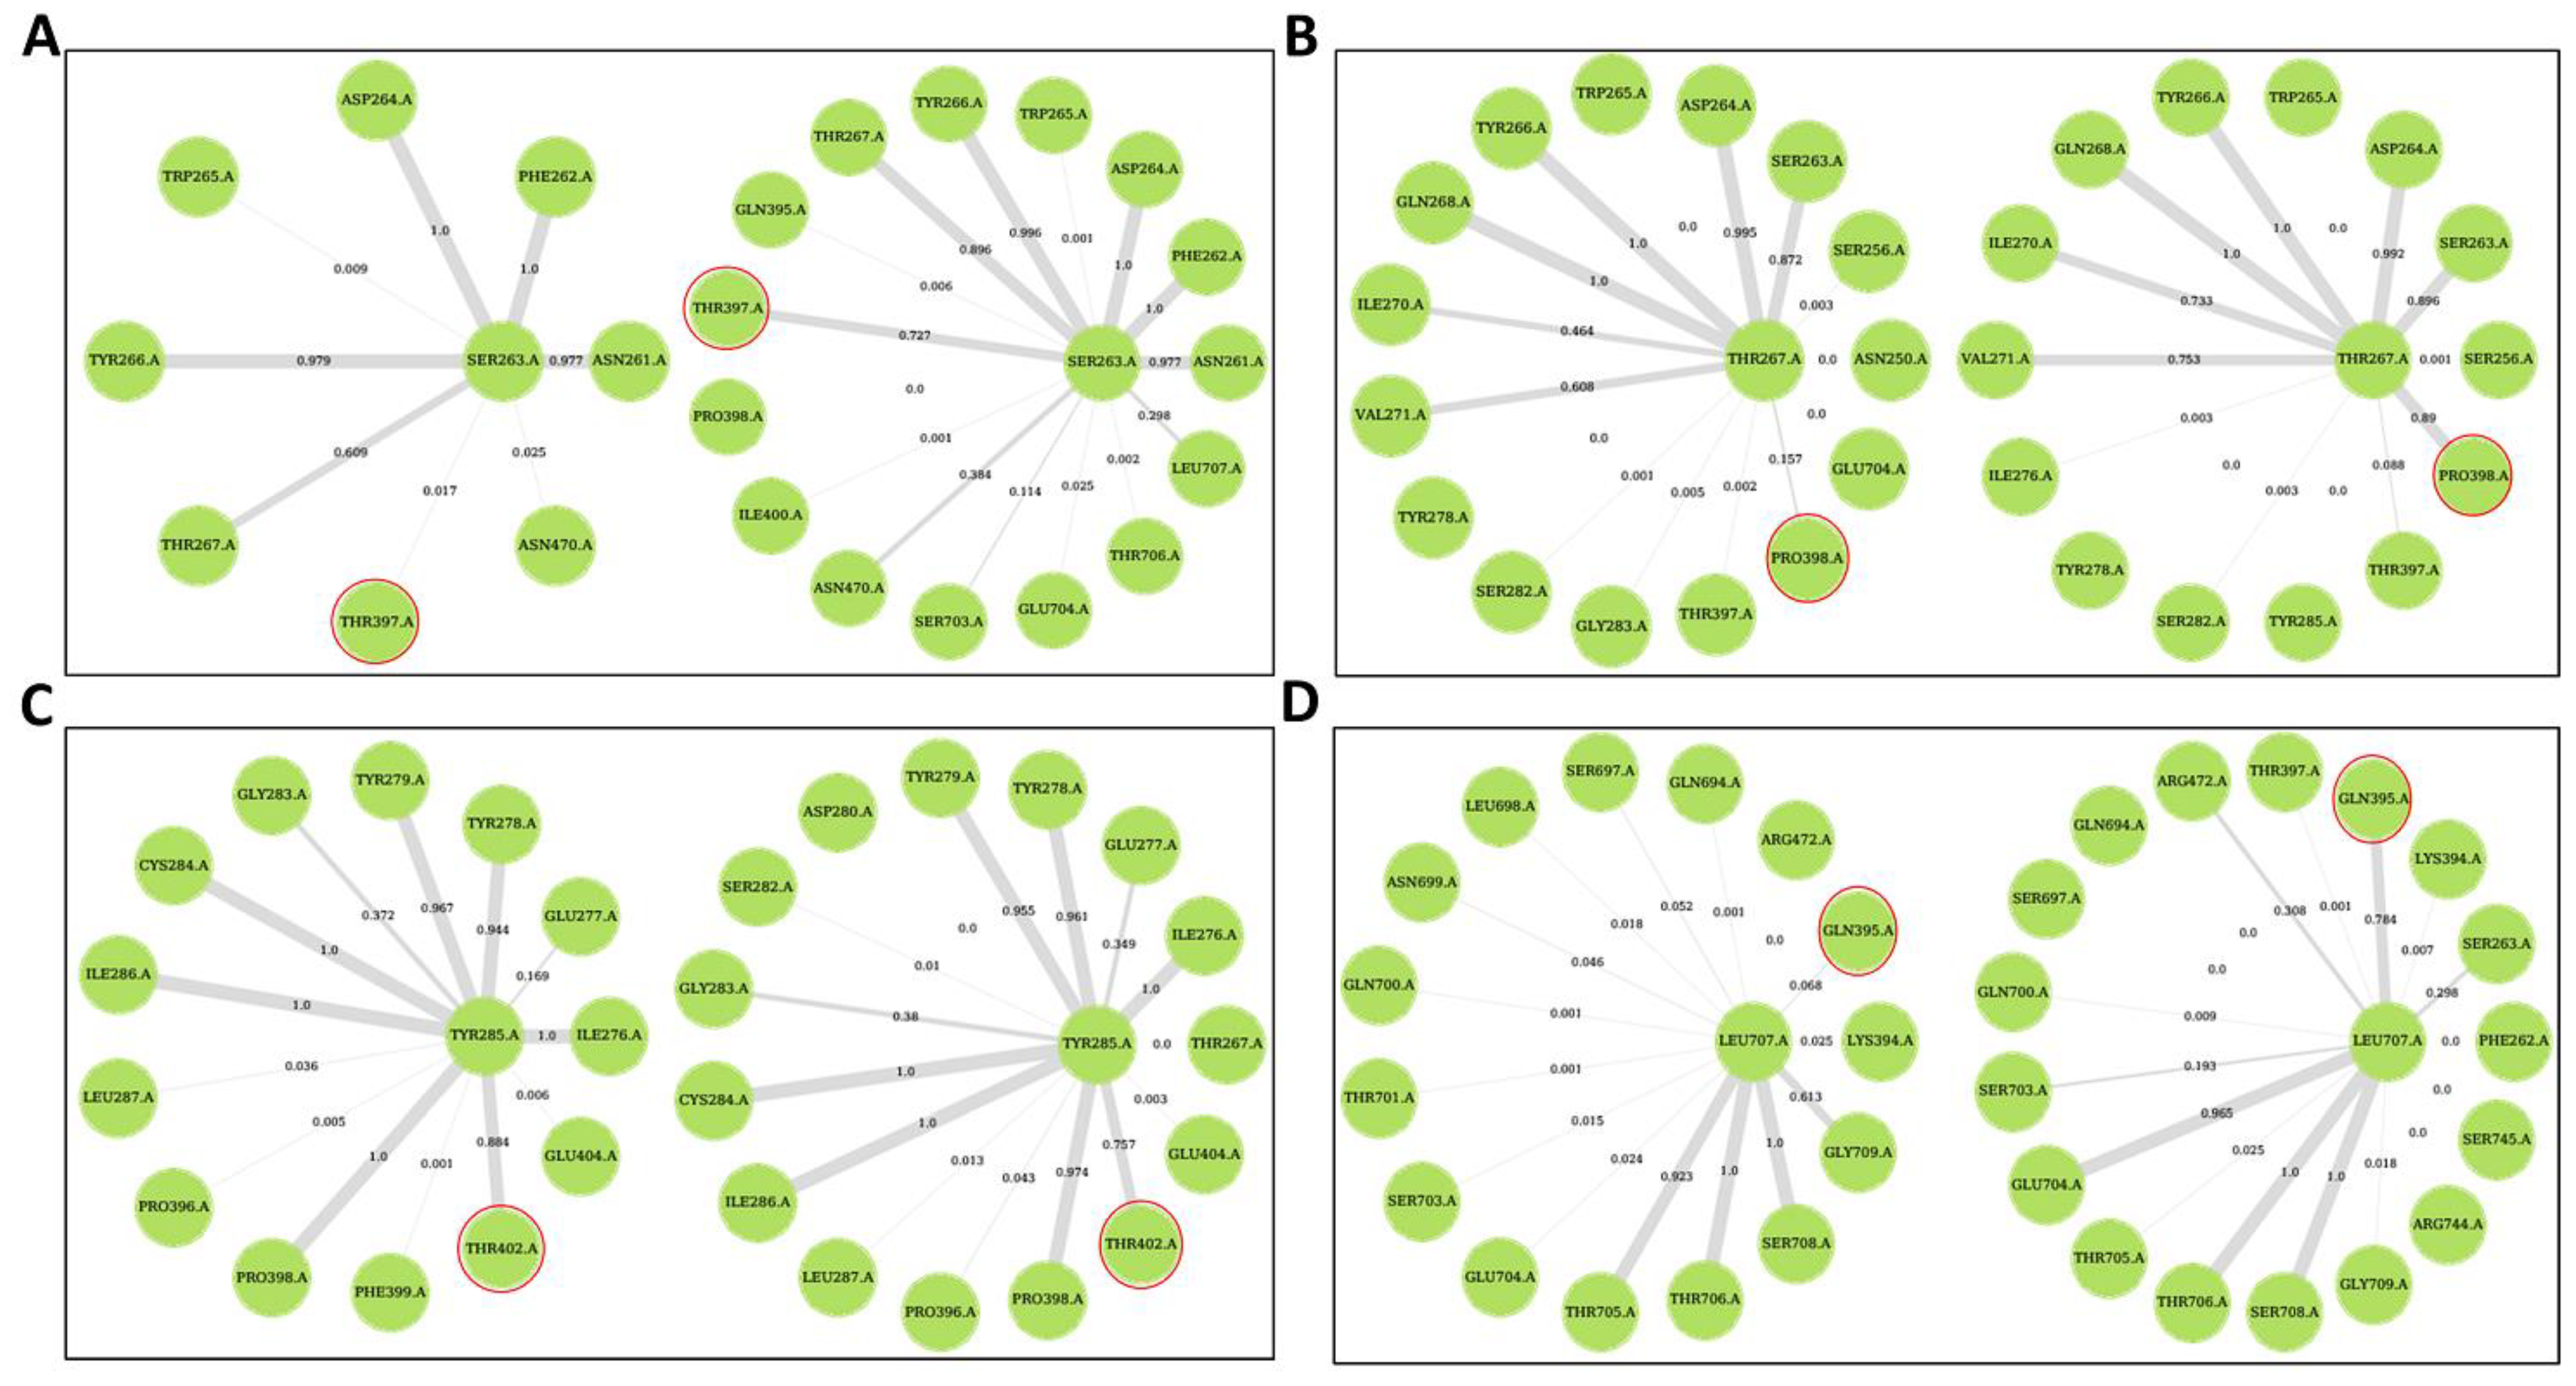
Allosteric Modulators Increase Contact Frequency between Allosteric and ATP Binding Site Residues
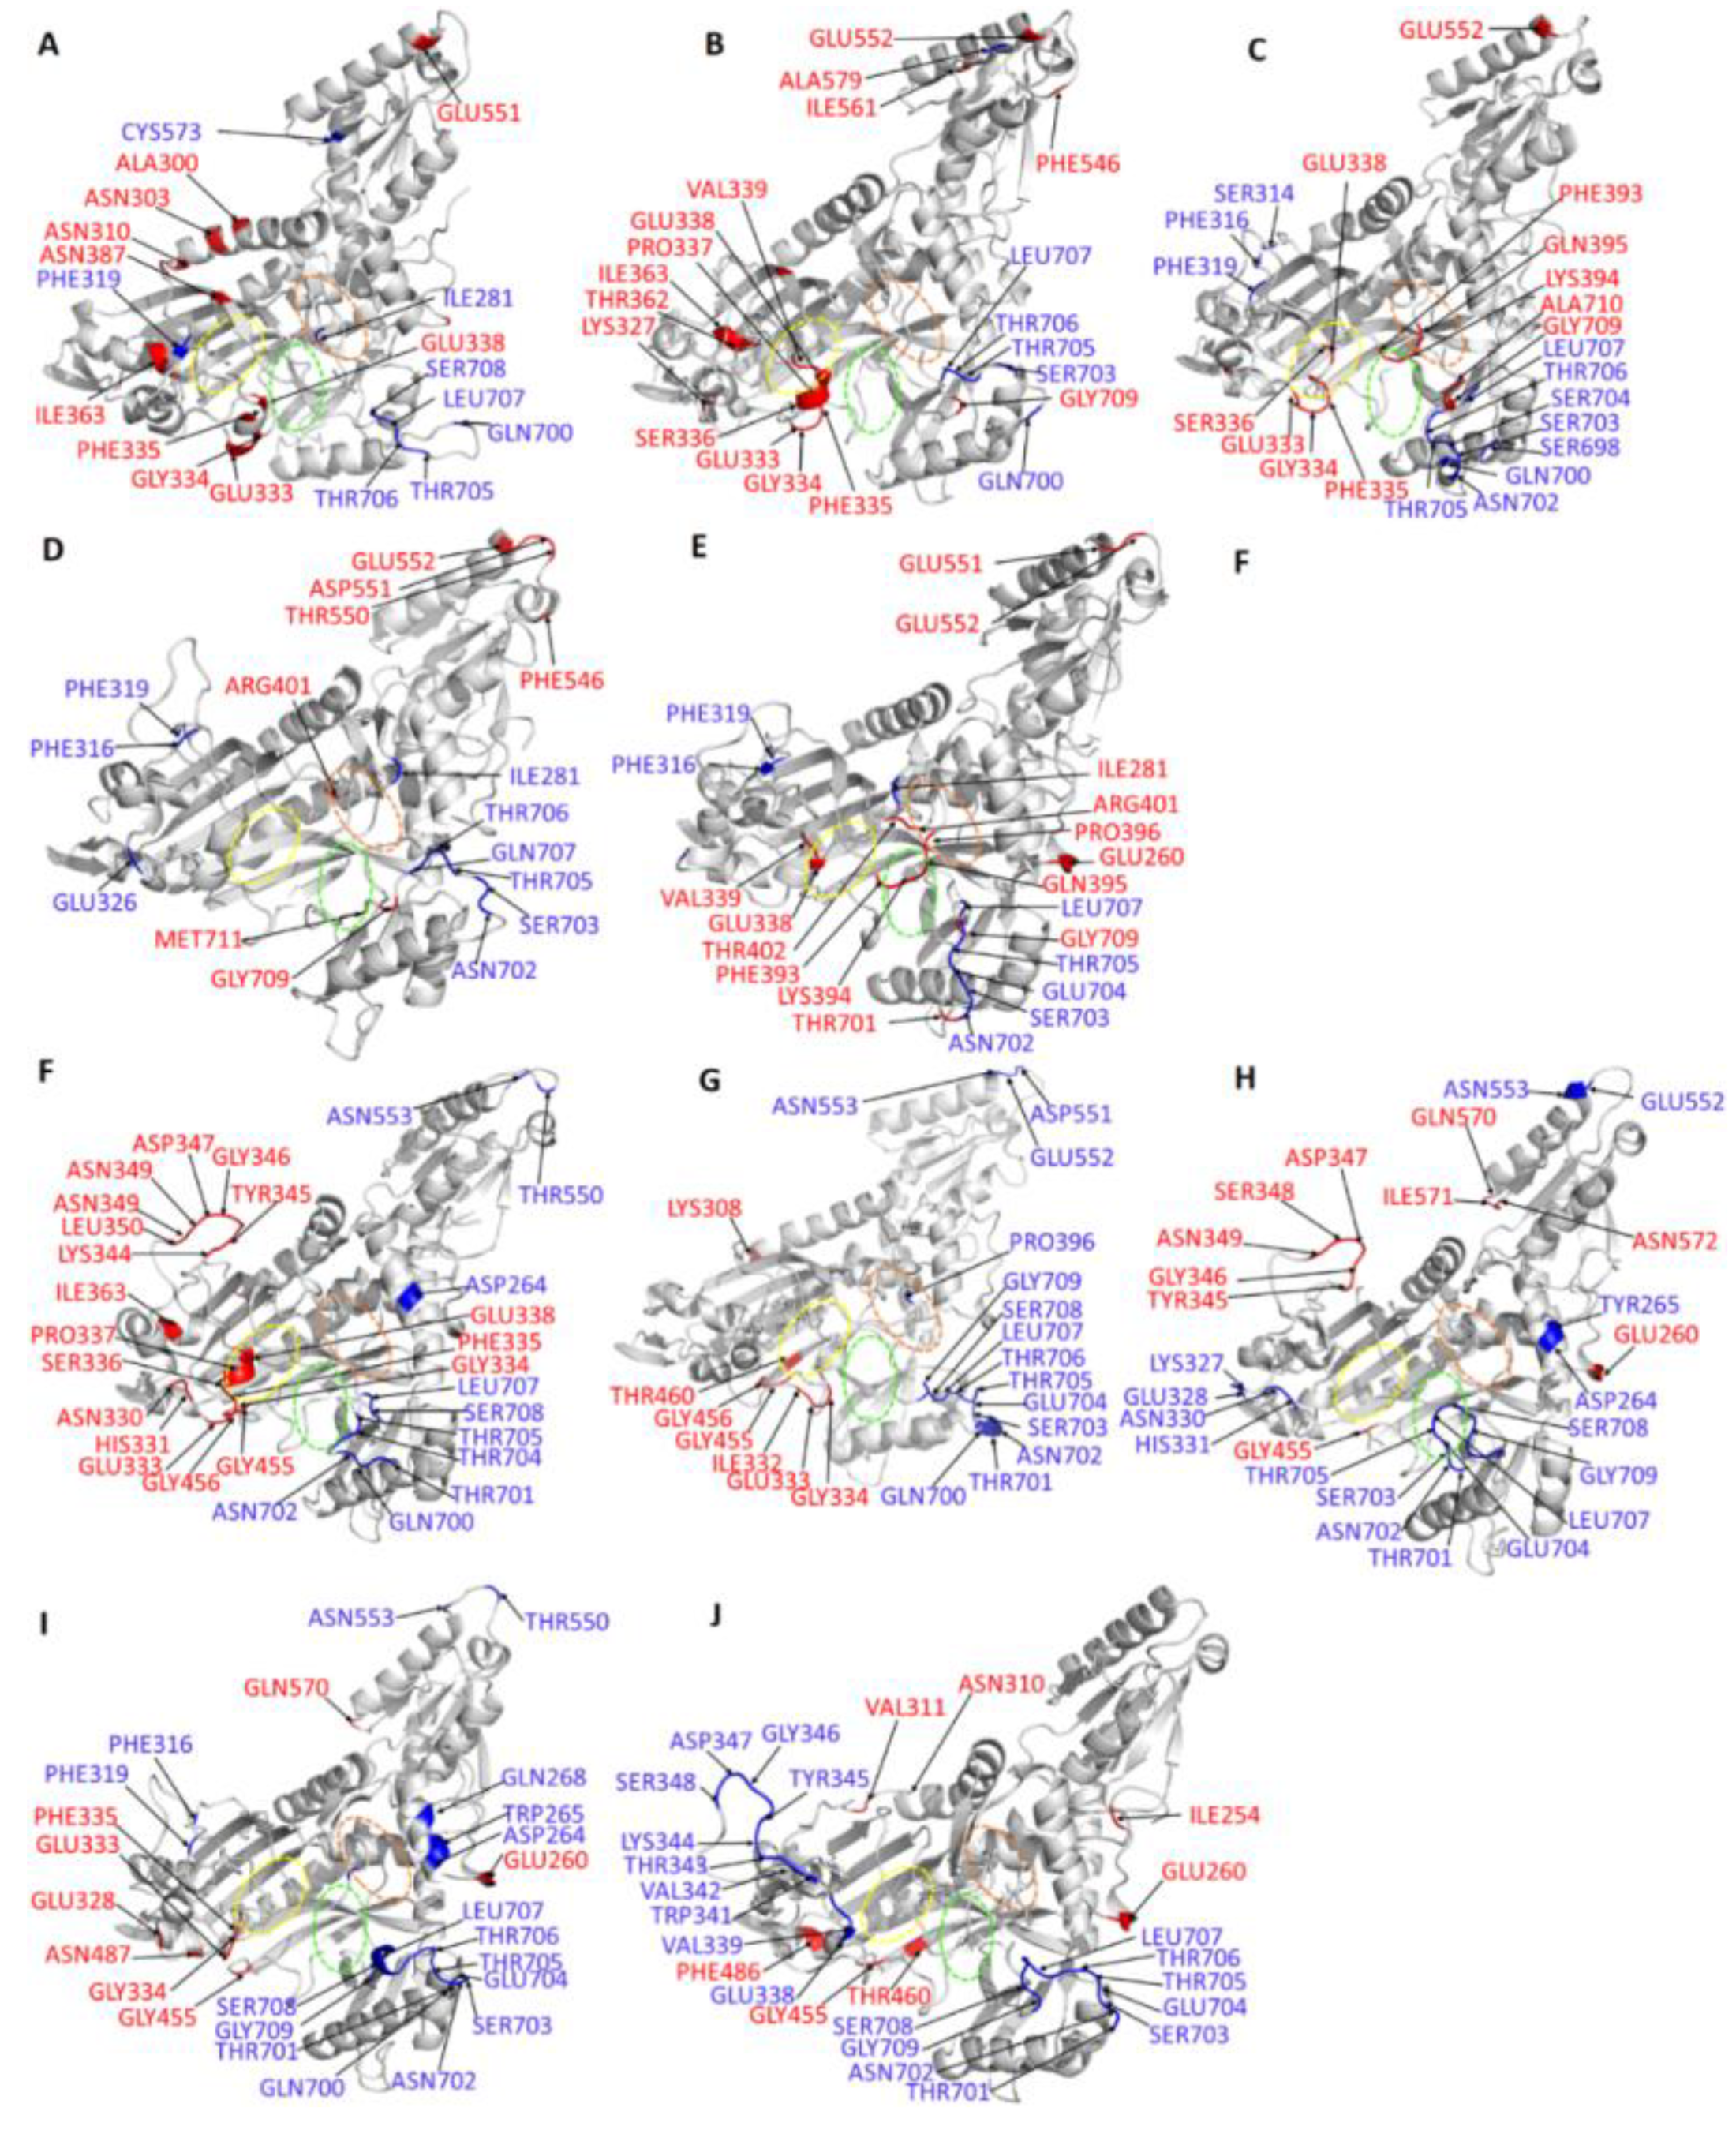
2.6. Selected Allosteric Modulators Affect PfProRS Function through Distortion of the ATP Binding Site
3. Methodology
3.1. Data Retrieval
3.2. Sequence Alignment
3.3. Homology Modelling
3.4. Molecular Docking
3.5. Molecular Dynamic Simulations
3.6. Dynamic Residue Network Analysis
3.7. Principal Component Analysis
4. Conclusions
Supplementary Materials
Author Contributions
Funding
Acknowledgments
Conflicts of Interest
Abbreviations
| CD | Catalytic Domain |
| ABD | Anticodon Binding Domain |
| NTD | N-terminal Domain; MD, Molecular Dynamics |
| DRN | Dynamic Residue Network |
| RMSD | Root mean square deviation |
| RMSF | Root mean square fluctuation |
| SANCDB | South African Natural Compound Database |
| MSA | Multiple sequence alignment |
| AND | Adenosine |
| PCA | Principal component analysis |
| FEL | Free energy landscape |
| aaRS | aminoacyl tRNA synthetase |
| ProRS | Prolyl tRNA synthetase |
References
- Herman, J.D.; Pepper, L.R.; Cortese, J.F.; Galinsky, K.; Zuzarte-luis, V.; Derbyshire, E.R.; Ribacke, U.; Lukens, A.K.; Santos, S.A.; Patel, V.; et al. The Cytoplasmic Prolyl-tRNA Synthetase of the Malaria Parasite is a Dual-Stage Target for Drug Development. Sci. Transl. Med. 2016, 7, 288ra77. [Google Scholar] [CrossRef] [PubMed] [Green Version]
- WHO. WHO | World Malaria Report 2018; WHO: Geneva, Switzerland, 2018. [Google Scholar]
- Tuteja, R. Malaria—An overview. FEBS J. 2007, 274, 4670–4679. [Google Scholar] [CrossRef] [Green Version]
- Soulard, V.; Bosson-Vanga, H.; Lorthiois, A.; Roucher, C.; Franetich, J.F.; Zanghi, G.; Bordessoulles, M.; Tefit, M.; Thellier, M.; Morosan, S.; et al. Plasmodium falciparum full life cycle and Plasmodium ovale liver stages in humanized mice. Nat. Commun. 2015, 6, 7690. [Google Scholar] [CrossRef] [PubMed] [Green Version]
- Fairhurst, R.M.; Nayyar, G.M.L.; Breman, J.G.; Hallett, R.; Vennerstrom, J.L.; Duong, S.; Ringwald, P.; Wellems, T.E.; Plowe, C.V.; Dondorp, A.M. Artemisinin-resistant malaria: Research challenges, opportunities, and public health implications. Am. J. Trop. Med. Hyg. 2012, 87, 231–241. [Google Scholar] [CrossRef] [PubMed]
- Ashley, E.A.; Phyo, A.P. Drugs in Development for Malaria. Drugs 2018, 78, 861–879. [Google Scholar] [CrossRef] [Green Version]
- Yeung, S.; Pongtavornpinyo, W.; Hastings, I.M.; Mills, A.J.; White, N.J. Antimalarial drug resistance, artemisinin-based combination therapy, and the contribution of modeling to elucidating policy choices. Am. J. Trop. Med. Hyg. 2004, 71, 179–186. [Google Scholar] [CrossRef]
- Sinha, S.; Medhi, B.; Sehgal, R. Challenges of drug-resistant malaria. Parasite 2014, 21, 61. [Google Scholar] [CrossRef] [Green Version]
- Sheik Amamuddy, O.; Veldman, W.; Manyumwa, C.; Khairallah, A.; Agajanian, S.; Oluyemi, O.; Verkhivker, G.M.; Tastan Bishop, Ö. Integrated computational approaches and tools for allosteric drug discovery. Int. J. Mol. Sci. 2020, 21, 847. [Google Scholar] [CrossRef] [Green Version]
- Kenakin, T.P.; Miller, L.J. Seven transmembrane receptors as shapeshifting proteins: The impact of allosteric modulation and functional selectivity on new drug discovery. Pharmacol. Rev. 2010, 62, 265–304. [Google Scholar] [CrossRef] [PubMed] [Green Version]
- Digby, G.J.; Conn, P.J.; Lindsley, C.W. Orthosteric- and allosteric-induced ligand-directed trafficking at GPCRs. Curr. Opin. Drug Discov. Dev. 2010, 13, 587–594. [Google Scholar]
- Hammond, A.S.; Rodriguez, A.L.; Townsend, S.D.; Niswender, C.M.; Gregory, K.J.; Lindsley, C.W.; Conn, P.J. Discovery of a novel chemical class of mGlu5 allosteric ligands with distinct modes of pharmacology. ACS Chem. Neurosci. 2010, 1, 702–716. [Google Scholar] [CrossRef] [PubMed]
- Jeffrey Conn, P.; Christopoulos, A.; Lindsley, C.W. Allosteric modulators of GPCRs: A novel approach for the treatment of CNS disorders. Nat. Rev. Drug Discov. 2009, 8, 41–54. [Google Scholar] [CrossRef] [PubMed] [Green Version]
- Bhatt, T.; Kapil, C.; Khan, S.; Jairajpuri, M.; Sharma, V.; Santoni, D.; Silvestrini, F.; Pizzi, E.; Sharma, A. A genomic glimpse of aminoacyl-tRNA synthetases in malaria parasite Plasmodium falciparum. BMC Genom. 2009, 10, 644. [Google Scholar] [CrossRef] [PubMed] [Green Version]
- Hoepfner, D.; McNamara, C.W.; Lim, C.S.; Studer, C.; Riedl, R.; Aust, T.; McCormack, S.L.; Plouffe, D.M.; Meister, S.; Schuierer, S.; et al. Selective and specific inhibition of the plasmodium falciparum lysyl-tRNA synthetase by the fungal secondary metabolite cladosporin. Cell Host Microbe. 2012, 11, 654–663. [Google Scholar] [CrossRef] [PubMed] [Green Version]
- Bhatt, T.K.; Khan, S.; Dwivedi, V.P.; Banday, M.M.; Sharma, A.; Chandele, A.; Camacho, N.; de Pouplana, L.R.; Wu, Y.; Craig, A.G.; et al. Malaria parasite tyrosyl-tRNA synthetase secretion triggers pro-inflammatory responses. Nat. Commun. 2011, 2, 530. [Google Scholar] [CrossRef] [PubMed] [Green Version]
- Hussain, T.; Yogavel, M.; Sharma, A. Inhibition of protein synthesis and malaria parasite development by drug targeting of methionyl-tRNA synthetases. Antimicrob. Agents Chemother. 2015, 59, 1856–1867. [Google Scholar] [CrossRef] [Green Version]
- Jackson, K.E.; Habib, S.; Frugier, M.; Hoen, R.; Khan, S.; Pham, J.S.; Pouplana, L.R.; de Royo, M.; Santos, M.A.S.; Sharma, A.; et al. Protein translation in Plasmodium parasites. Trends Parasitol. 2011, 27, 467–476. [Google Scholar] [CrossRef]
- Khan, S.; Garg, A.; Camacho, N.; Van Rooyen, J.; Kumar Pole, A.; Belrhali, H.; Ribas de Pouplana, L.; Sharma, V.; Sharma, A. Structural analysis of malaria-parasite lysyl-tRNA synthetase provides a platform for drug development. Acta Crystallogr. Sect. D Biol. Crystallogr. 2013, 69, 785–795. [Google Scholar] [CrossRef]
- Pham, J.S.; Dawson, K.L.; Jackson, K.E.; Lim, E.E.; Pasaje, C.F.A.; Turner, K.E.C.; Ralph, S.A. Aminoacyl-tRNA synthetases as drug targets in eukaryotic parasites. Int. J. Parasitol. Drugs Drug Resist. 2014, 4, 1–13. [Google Scholar] [CrossRef] [Green Version]
- Rajendran, V.; Kalita, P.; Shukla, H.; Kumar, A.; Tripathi, T. Aminoacyl-tRNA synthetases: Structure, function, and drug discovery. Int. J. Biol. Macromol. 2018, 111, 400–414. [Google Scholar] [CrossRef]
- Nakama, T.; Nureki, O.; Yokoyama, S. Structural Basis for the Recognition of Isoleucyl-Adenylate and an Antibiotic, Mupirocin, by Isoleucyl-tRNA Synthetase. J. Biol. Chem. 2001, 276, 47387–47393. [Google Scholar] [CrossRef] [PubMed] [Green Version]
- Ojo, K.K.; Ranade, R.M.; Zhang, Z.; Dranow, D.M.; Myers, J.B.; Choi, R.; Hewitt, S.N.; Edwards, T.E.; Davies, D.R.; Lorimer, D.; et al. Brucella melitensis Methionyl-tRNA-Synthetase (MetRS), a potential drug target for brucellosis. PLoS ONE 2016, 11, e0163641. [Google Scholar] [CrossRef] [PubMed]
- Cusack, S.; Hernandez, V.; Zhou, H.; Benkovic, S.J.; Tukalo, M.; Plattner, J.J.; Yaremchuk, A.; Rock, F.L.; Zhang, Y.-K.; Alley, M.R.K.; et al. An Antifungal Agent Inhibits an Aminoacyl-tRNA Synthetase by Trapping tRNA in the Editing Site. Science 2007, 316, 1759–1761. [Google Scholar]
- Nyamai, D.W.; Tastan Bishop, Ö. Aminoacyl tRNA synthetases as malarial drug targets: A comparative bioinformatics study. Malar. J. 2019, 18, 1–27. [Google Scholar] [CrossRef] [PubMed] [Green Version]
- Perona, J.J.; Hadd, A. Structural diversity and protein engineering of the aminoacyl-tRNA Synthetases. Biochemistry 2012, 51, 8705–8729. [Google Scholar] [CrossRef] [PubMed]
- O’Donoghue, P.; Luthey-Schulten, Z. On the Evolution of Structure in Aminoacyl-tRNA Synthetases. Microbiol. Mol. Biol. Rev. 2003, 67, 550–573. [Google Scholar] [CrossRef] [Green Version]
- Smith, T.F.; Hartman, H. The evolution of Class II Aminoacyl-tRNA synthetases and the first code. FEBS Lett. 2015, 589, 3499–3507. [Google Scholar] [CrossRef] [Green Version]
- Hewitt, S.N.; Dranow, D.M.; Horst, B.G.; Abendroth, J.A.; Forte, B.; Hallyburton, I.; Jansen, C.; Baragaña, B.; Choi, R.; Rivas, K.L.; et al. Biochemical and Structural Characterization of Selective Allosteric Inhibitors of the Plasmodium falciparum Drug Target, Prolyl-tRNA-synthetase. ACS Infect. Dis. 2017, 3, 34–44. [Google Scholar] [CrossRef] [Green Version]
- Guo, M.; Schimmel, P. Essential nontranslational functions of tRNA synthetases. Nat. Chem. Biol. 2013, 9, 145–153. [Google Scholar] [CrossRef] [Green Version]
- Jeong, E.J.; Hwang, G.S.; Kim, K.H.; Kim, M.J.; Kim, S.; Kim, K.S. Structural analysis of multifunctional peptide motifs in human bifunctional tRNA synthetase: Identification of RNA-binding residues and functional implications for tandem repeats. Biochemistry 2000, 39, 15775–15782. [Google Scholar] [CrossRef]
- Rho, S.B.; Lee, J.S.; Jeong, E.J.; Kim, K.S.; Kim, Y.G.; Kim, S. A multifunctional repeated motif is present in human bifunctional tRNA synthetase. J. Biol. Chem. 1998, 273, 11267–11273. [Google Scholar] [CrossRef] [Green Version]
- Son, J.; Lee, E.H.; Park, M.; Kim, J.H.; Kim, J.; Kim, S.; Jeon, Y.H.; Hwang, K.Y. Conformational changes in human prolyl-tRNA synthetase upon binding of the substrates proline and ATP and the inhibitor halofuginone. Acta Crystallogr. Sect. D Biol. Crystallogr. 2013, 69, 2136–2145. [Google Scholar] [CrossRef] [PubMed]
- Jain, V.; Kikuchi, H.; Oshima, Y.; Sharma, A.; Yogavel, M. Structural and functional analysis of the anti-malarial drug target prolyl-tRNA synthetase. J. Struct. Funct. Genom. 2014, 15, 181–190. [Google Scholar] [CrossRef] [PubMed]
- Beuning, P.J.; Musier-Forsyth, K. Species-specific Differences in Amino Acid Editing by Class II Prolyl-tRNA Synthetase. J. Biol. Chem. 2001, 276, 30779–30785. [Google Scholar] [CrossRef] [PubMed] [Green Version]
- Khan, S.; Sharma, A.; Jamwal, A.; Sharma, V.; Pole, A.K.; Thakur, K.K.; Sharma, A. Uneven spread of cis- and trans-editing aminoacyl-tRNA synthetase domains within translational compartments of P. falciparum. Sci. Rep. 2011, 1, 188. [Google Scholar] [CrossRef] [PubMed]
- Jain, V.; Yogavel, M.; Oshima, Y.; Kikuchi, H.; Touquet, B.; Hakimi, M.A.; Sharma, A. Structure of prolyl-tRNA synthetase-halofuginone complex provides basis for development of drugs against malaria and toxoplasmosis. Structure 2015, 23, 819–829. [Google Scholar] [CrossRef] [PubMed] [Green Version]
- Keller, T.L.; Zocco, D.; Sundrud, M.S.; Hendrick, M.; Edenius, M.; Yum, J.; Kim, Y.; Lee, H.; Cortese, J.F.; Wirth, D.; et al. Halofuginone and other febrifugine derivatives inhibit prolyl- tRNA synthetase. Nat. Chem. Boil. 2012, 8, 311–317. [Google Scholar] [CrossRef] [PubMed] [Green Version]
- Linder, M.R.; Heckeroth, A.R.; Najdrowski, M.; Daugschies, A.; Schollmeyer, D.; Miculka, C. (2R,3S)-(+)- and (2S,3R)-(-)-Halofuginone lactate: Synthesis, absolute configuration, and activity against Cryptosporidium parvum. Bioorganic Med. Chem. Lett. 2007, 17, 4140–4143. [Google Scholar] [CrossRef]
- Pines, M.; Phelps, R.; McGaha, T.; Kodera, T.; Spiera, H.; Bona, C. Effect of Halofuginone on the Development of Tight Skin (TSK) Syndrome. Autoimmunity 2002, 35, 277–282. [Google Scholar]
- Pines, M.; Nagler, A. Halofuginone: A novel antifibrotic therapy. Gen. Pharmacol. 1998, 30, 445–450. [Google Scholar] [CrossRef]
- Pines, M.; Snyder, D.; Yarkoni, S.; Nagler, A. Halofuginone to treat fibrosis in chronic graft-versus-host disease and scleroderma. Biol. Blood Marrow Transplant. 2003, 9, 417–425. [Google Scholar] [CrossRef] [Green Version]
- Elkin, M.; Ariel, I.; Miao, H.Q.; Nagler, A.; Pines, M.; De-Groot, N.; Hochberg, A.; Vlodavsky, I. Inhibition of bladder carcinoma angiogenesis, stromal support, and tumor growth by halofuginone. Cancer Res. 1999, 59, 4111–4118. [Google Scholar]
- Zhou, H.; Sun, L.; Yang, X.L.; Schimmel, P. ATP-directed capture of bioactive herbal-based medicine on human tRNA synthetase. Nature 2013, 494, 121–124. [Google Scholar] [CrossRef] [PubMed] [Green Version]
- Hatherley, R.; Brown, D.K.; Musyoka, T.M.; Penkler, D.L.; Faya, N.; Lobb, K.A.; Tastan Bishop, Ö. SANCDB: A South African natural compound database. J. Cheminform. 2015, 7, 29. [Google Scholar] [CrossRef] [PubMed] [Green Version]
- Westermaier, Y.; Barril, X.; Scapozza, L. Virtual screening: An in silico tool for interlacing the chemical universe with the proteome. Methods 2015, 71, 44–57. [Google Scholar] [CrossRef] [PubMed]
- Hooper, G.J.; Davies-Coleman, M.T. New Metabolites from the South African soft coral Capnella thyrsoidea. Tetrahedron 1995, 51, 9973–9984. [Google Scholar] [CrossRef]
- Whibley, C.E.; Keyzers, R.A.; Soper, A.G.; Davies-Coleman, M.T.; Samaai, T.; Hendricks, D.T. Antiesophageal cancer activity from Southern African marine organisms. Ann. N. Y. Acad. Sci. 2005, 1056, 405–412. [Google Scholar] [CrossRef]
- Dai, J.; Fishback, J.A.; Zhou, Y.D.; Nagle, D.G. Sodwanone and yardenone triterpenes from a South African species of the marine sponge Axinella inhibit hypoxia-inducible factor-1 (HIF-1) activation in both breast and prostate tumor cells. J. Nat. Prod. 2006, 69, 1715–1720. [Google Scholar] [CrossRef] [Green Version]
- Sidwell, W.T.L.; Tamm, C. The homo-isoflavones II. Isolation and structure of 4 tp-O-methyl-punctatin, autumnalin and 3,9-dihydro-autumnalin. Tetrahedron Lett. 1970, 11, 1578. [Google Scholar] [CrossRef]
- Elgorashi, E.E.; Stafford, G.I.; Van Staden, J. Acetylcholinesterase enzyme inhibitory effects of Amaryllidaceae alkaloids. Planta Med. 2004, 70, 260–262. [Google Scholar] [PubMed]
- Pika, J.; John Faulkner, D. Unusual chlorinated homo-diterpenes from the South African nudibranch Chromodoris hamiltoni. Tetrahedron 1995, 51, 8189–8198. [Google Scholar] [CrossRef]
- Yelani, T.; Hussein, A.A.; Meyer, J.J.M. Isolation and identification of poisonous triterpenoids from Elaeodendron croceum. Nat. Prod. Res. 2010, 24, 1418–1425. [Google Scholar] [CrossRef] [PubMed]
- van Heerden, F.R.; Marthinus Horak, R.; Maharaj, V.J.; Vleggaar, R.; Senabe, J.V.; Gunning, P.J. An appetite suppressant from Hoodia species. Phytochemistry 2007, 68, 2545–2553. [Google Scholar] [CrossRef] [PubMed]
- Liddell, J.R.; Logie, C.G. A re-investigation of the alkaloids of Senecio pterophorus. Phytochemistry 1993, 34, 1629–1631. [Google Scholar] [CrossRef]
- Penkler, D.L.; Atilgan, C.; Tastan Bishop, Ö. Allosteric Modulation of Human Hsp90α Conformational Dynamics. J. Chem. Inf. Model. 2018, 58, 383–404. [Google Scholar] [CrossRef] [Green Version]
- David, C.C.; Jacobs, D.J. Principal Component Analysis: A Method for Determining the Essential Dynamics of Proteins. In Protein Dynamics; Humana Press: Totowa, NJ, USA, 2014; Volume 1084, pp. 193–226. [Google Scholar]
- Sanyal, S.; Datta, S.; Hazra, M.; Dubey, R.C.; Hazra, S.; Paul, M.; Bharatiy, S.K.; Samantaray, D.; Mohapatra, S. In Silico Designing of an Industrially Sustainable Carbonic Anhydrase Using Molecular Dynamics Simulation. ACS Omega. 2016, 1, 1081–1103. [Google Scholar]
- Chaliotis, A.; Vlastaridis, P.; Mossialos, D.; Ibba, M.; Becker, H.D.; Stathopoulos, C.; Amoutzias, G.D. The complex evolutionary history of aminoacyl-tRNA synthetases. Nucleic Acids Res. 2016, 45, gkw1182. [Google Scholar] [CrossRef]
- Bates, P.A.; Kelley, L.A.; MacCallum, R.M.; Sternberg, M.J.E. Enhancement of protein modeling by human intervention in applying the automatic programs 3D-JIGSAW and 3D-PSSM. Proteins Struct. Funct. Genet. 2001, 45, 39–46. [Google Scholar] [CrossRef]
- Piovesan, D.; Minervini, G.; Tosatto, S.C.E. The RING 2.0 web server for high quality residue interaction networks. Nucleic Acids Res. 2016, 44, W367–W374. [Google Scholar] [CrossRef]
- del Sol, A.; Fujihashi, H.; Amoros, D.; Nussinov, R. Residue centrality, functionally important residues, and active site shape: Analysis of enzyme and non-enzyme families. Protein Sci. 2006, 15, 2120–2128. [Google Scholar] [CrossRef] [Green Version]
- Hu, G.; Yan, W.; Zhou, J.; Shen, B. Residue interaction network analysis of Dronpa and a DNA clamp. J. Theor. Biol. 2014, 348, 55–64. [Google Scholar] [CrossRef] [PubMed]
- Doncheva, N.T.; Klein, K.; Domingues, F.S.; Albrecht, M. Analyzing and visualizing residue networks of protein structures. Trends Biochem. Sci. 2011, 36, 179–182. [Google Scholar] [CrossRef] [PubMed]
- Vishveshwara, S.; Ghosh, A.; Hansia, P. Intra and Inter-Molecular Communications Through Protein Structure Network. Curr. Protein Pept. Sci. 2009, 10, 146–160. [Google Scholar] [CrossRef] [PubMed]
- Kimuda, M.P.; Laming, D.; Hoppe, H.C.; Tastan Bishop, Ö. Identification of Novel Potential Inhibitors of Pteridine Reductase 1 in Trypanosoma brucei via Computational Structure-Based Approaches and in Vitro Inhibition Assays. Molecules 2019, 24, 142. [Google Scholar] [CrossRef] [PubMed] [Green Version]
- Amusengeri, A.; Tastan Bishop, Ö. Discorhabdin N, a South African natural compound, for Hsp72 and Hsc70 allosteric modulation: Combined study of molecular modeling and dynamic residue network analysis. Molecules 2019, 24, 188. [Google Scholar] [CrossRef] [PubMed] [Green Version]
- Allain, A.; Chauvot De Beauchêne, I.; Langenfeld, F.; Guarracino, Y.; Laine, E.; Tchertanov, L. Allosteric pathway identification through network analysis: From molecular dynamics simulations to interactive 2D and 3D graphs. Faraday Discuss. 2014, 169, 303–321. [Google Scholar] [CrossRef] [PubMed] [Green Version]
- Del Sol, A.; Fujihashi, H.; Amoros, D.; Nussinov, R. Residues crucial for maintaining short paths in network communication mediate signaling in proteins. Mol. Syst. Biol. 2006, 2, 1–12. [Google Scholar] [CrossRef] [Green Version]
- Badalà, F.; Nouri-mahdavi, K.; Raoof, D.A. Structural and Energetic Basis of Allostery. Annu. Rev. Biophys. 2012, 41, 585–609. [Google Scholar]
- Ribeiro, A.A.S.T.; Ortiz, V. A Chemical Perspective on Allostery. Chem. Rev. 2016, 116, 6488–6502. [Google Scholar] [CrossRef]
- Tsai, C.J.; Ma, B.; Nussinov, R. Folding and binding cascades: Shifts in energy landscapes. Proc. Natl. Acad. Sci. USA 1999, 96, 9970–9972. [Google Scholar] [CrossRef] [Green Version]
- Bowerman, S. Detecting allosteric networks using molecular dynamics simulation. Methods Enzymol. 2017, 578, 429–447. [Google Scholar]
- Pruitt, K.D.; Tatusova, T.; Maglott, D.R. NCBI reference sequences (RefSeq): A curated non-redundant sequence database of genomes, transcripts and proteins. Nucleic Acids Res. 2007, 35, D61–D65. [Google Scholar] [CrossRef] [PubMed] [Green Version]
- The UniProt Consortium. UniProt: A hub for protein information. Nucleic Acids Res. 2015, 43, D204–D212. [Google Scholar] [CrossRef] [PubMed]
- Johnson, M.; Zaretskaya, I.; Raytselis, Y.; Merezhuk, Y.; McGinnis, S.; Madden, T.L. NCBI BLAST: A better web interface. Nucleic Acids Res. 2008, 36, W5–W9. [Google Scholar] [CrossRef] [PubMed]
- Henikoff, S.; Henikoff, J.G. Amino acid substitution matrices from protein blocks. Proc. Natl. Acad. Sci. USA 1992, 89, 10915–10919. [Google Scholar] [CrossRef] [PubMed] [Green Version]
- Berman, H.M.; Westbrook, J.; Feng, Z.; Gilliland, G.; Bhat, T.N.; Weissig, H.; Shindyalov, I.N.; Bourne, P.E. The Protein Data Bank. Nucleic Acids Res 2000, 28, 235–242. [Google Scholar] [CrossRef] [Green Version]
- Di Tommaso, P.; Moretti, S.; Xenarios, I.; Orobitg, M.; Montanyola, A.; Chang, J.M.; Taly, J.F.; Notredame, C. T-Coffee: A web server for the multiple sequence alignment of protein and RNA sequences using structural information and homology extension. Nucleic Acids Res. 2011, 39, W13–W17. [Google Scholar] [CrossRef]
- Pei, J.; Kim, B.H.; Grishin, N.V. PROMALS3D: A tool for multiple protein sequence and structure alignments. Nucleic Acids Res. 2008, 36, 2295–2300. [Google Scholar] [CrossRef] [PubMed]
- Pei, J.; Grishin, N.V. PROMALS3D: Multiple protein sequence alignment enhanced with evolutionary and three-dimensional structural information. Methods Mol. Biol. 2014, 1079, 263–271. [Google Scholar]
- Edgar, R.C. MUSCLE: Multiple sequence alignment with high accuracy and high throughput. Nucleic Acids Res. 2004, 32, 1792–1797. [Google Scholar] [CrossRef] [Green Version]
- Waterhouse, A.M.; Procter, J.B.; Martin, D.M.A.; Clamp, M.; Barton, G.J. Jalview version 2: A Multiple Sequence Alignment and Analysis Workbench. Bioinformatics 2009, 25, 1189–1191. [Google Scholar] [CrossRef] [PubMed] [Green Version]
- Fiser, A.; Šali, A. MODELLER: Generation and Refinement of Homology-Based Protein Structure Models. Methods Enzymol. 2003, 374, 461–491. [Google Scholar] [PubMed]
- Söding, J.; Biegert, A.; Lupas, A.N. The HHpred interactive server for protein homology detection and structure prediction. Nucleic Acids Res. 2005, 33, W244–W248. [Google Scholar] [CrossRef] [PubMed] [Green Version]
- Hatherineley, R.; Brown, D.K.; Glenister, M.; Tastan Bishop, Ö. PRIMO: An interactive homology modeling pipel. PLoS ONE 2016, 11, e0166698. [Google Scholar]
- Benkert, P.; Künzli, M.; Schwede, T. QMEAN server for protein model quality estimation. Nucleic Acids Res. 2009, 37, W510–W514. [Google Scholar] [CrossRef] [Green Version]
- Wiederstein, M.; Sippl, M.J. ProSA-web: Interactive web service for the recognition of errors in three-dimensional structures of proteins. Nucleic Acids Res. 2007, 35, W407–W410. [Google Scholar] [CrossRef] [Green Version]
- Eisenberg, D.; Lüthy, R.; Bowie, J.U. VERIFY3D: Assessment of protein models with three-dimensional profiles. Methods Enzymol. 1997, 277, 396–406. [Google Scholar]
- Cosconati, S.; Forli, S.; Perryman, A.L.; Harris, R.; Goodsell, D.S.; Olson, A.J. Virtual Screening with AutoDock: Theory and Practice. Expert Opin. Drug Discov. 2010, 5, 597–607. [Google Scholar] [CrossRef] [Green Version]
- Laskowski, R.A.; Swindells, M.B. LigPlot+: Multiple ligand-protein interaction diagrams for drug discovery. J. Chem. Inf. Model. 2011, 51, 2778–2786. [Google Scholar] [CrossRef]
- Trott, O.; Olson, A.J. AutoDock Vina. J. Comput. Chem. 2010, 31, 445–461. [Google Scholar]
- DeLano, W. Pymol: An open-source molecular graphics tool. CCP4 Newsl. Protein Crystallogr. 2002, 40, 82–92. [Google Scholar]
- San Diego: Accelrys Software Inc. Discovery Studio Modeling Environment, Release 3.5; San Diego: Accelrys Software Inc.: San Diego, CA, USA, 2012. [Google Scholar]
- Jayaram, B.; Singh, T.; Mukherjee, G.; Mathur, A.; Shekhar, S.; Shekhar, V. Sanjeevini: A freely accessible web-server for target directed lead molecule discovery. BMC Bioinform. 2012, 13 (Suppl. 1), S7. [Google Scholar] [CrossRef] [Green Version]
- Lipinski, C.A. Rule of five in 2015 and beyond: Target and ligand structural limitations, ligand chemistry structure and drug discovery project decisions. Adv. Drug Deliv. Rev. 2016, 101, 34–41. [Google Scholar] [CrossRef] [PubMed]
- Hess, B.; van der Spoel, D.; Lindahl, E.; Smith, J.C.; Shirts, M.R.; Bjelkmar, P.; Larsson, P.; Kasson, P.M.; Schulz, R.; Apostolov, R.; et al. GROMACS 4.5: A high-throughput and highly parallel open source molecular simulation toolkit. Bioinformatics 2013, 29, 845–854. [Google Scholar]
- Duan, Y.; Wu, C.; Chowdhury, S.; Lee, M.C.; Xiong, G.; Zhang, W.; Yang, R.; Cieplak, P.; Luo, R.; Lee, T.; et al. A point-charge force field for molecular mechanics simulations of proteins based on condensed-phase quantum mechanical calculations. J. Comput. Chem. 2003, 24, 1999–2012. [Google Scholar] [CrossRef] [PubMed]
- Sousa da Silva, A.W.; Vranken, W.F. ACPYPE—AnteChamber PYthon Parser interfacE. BMC Res. Notes 2012, 5, 367. [Google Scholar] [CrossRef] [Green Version]
- Mark, P.; Nilsson, L. Structure and Dynamics of the TIP3P, SPC, and SPC / E Water Models at 298 K. J. Phys. Chem. A 2001, 105, 9954–9960. [Google Scholar] [CrossRef]
- Jaidhan, B.J.; Apparao, P.S.R. Energy Minimization and Conformation Analysis of Molecules using Steepest Descent Method. Int. J. Comput. Sci. Inf. Technol. 2014, 5, 3525–3528. [Google Scholar]
- Hess, B.A. P-LINCS: Linear Constraint Solver for Molecular Simulation. J. Chem. Theory Comput. 2008, 4, 116–122. [Google Scholar] [CrossRef]
- Hess, B.; Bekker, H.; Berendsen, H.J.C.; Fraaije, J.G.E.M. LINCS: A Linear Constraint Solver for molecular simulations. J. Comput. Chem. 1997, 18, 1463–1472. [Google Scholar] [CrossRef]
- Darden, T.; York, D.; Pedersen, L. Particle mesh Ewald: An N⋅log(N) method for Ewald sums in large systems. J. Chem. Phys. 1993, 98, 10089. [Google Scholar] [CrossRef] [Green Version]
- Saito, H.; Nagao, H.; Nishikawa, K.; Kinugawa, K. Molecular collective dynamics in solid para-hydrogen and ortho-deuterium: The Parrinello-Rahman-type path integral centroid molecular dynamics approach. J. Chem. Phys. 2003, 119, 953–963. [Google Scholar] [CrossRef]
- Melchionna, S.; Ciccotti, G.; Holian, B.L. Hoover npt dynamics for systems varying in shape and size. Mol. Phys. 1993, 78, 533–544. [Google Scholar] [CrossRef]
- Roe, D.R.; Cheatham, T.E. PTRAJ and CPPTRAJ: Software for processing and analysis of molecular dynamics trajectory data. J. Chem. Theory Comput. 2013, 9, 3084–3095. [Google Scholar] [CrossRef] [PubMed]
- Penkler, D.L.; Atilgan, C.; Tastan Bishop, Ö.; Sheik Amamuddy, O.; Atilgan, A.R.; Ross, C.; Brown, D.K. MD-TASK: A software suite for analyzing molecular dynamics trajectories. Bioinformatics 2017, 33, 2768–2771. [Google Scholar]
- Haider, S.; Parkinson, G.N.; Neidle, S. Molecular dynamics and principal components analysis of human telomeric quadruplex multimers. Biophys. J. 2008, 95, 296–311. [Google Scholar] [CrossRef] [Green Version]


| Compound Information | Docking Binding Energy (kcal/mol) | |||
|---|---|---|---|---|
| Code Name | SANCDB ID | Chemical Name | PfProRS | HsProRS |
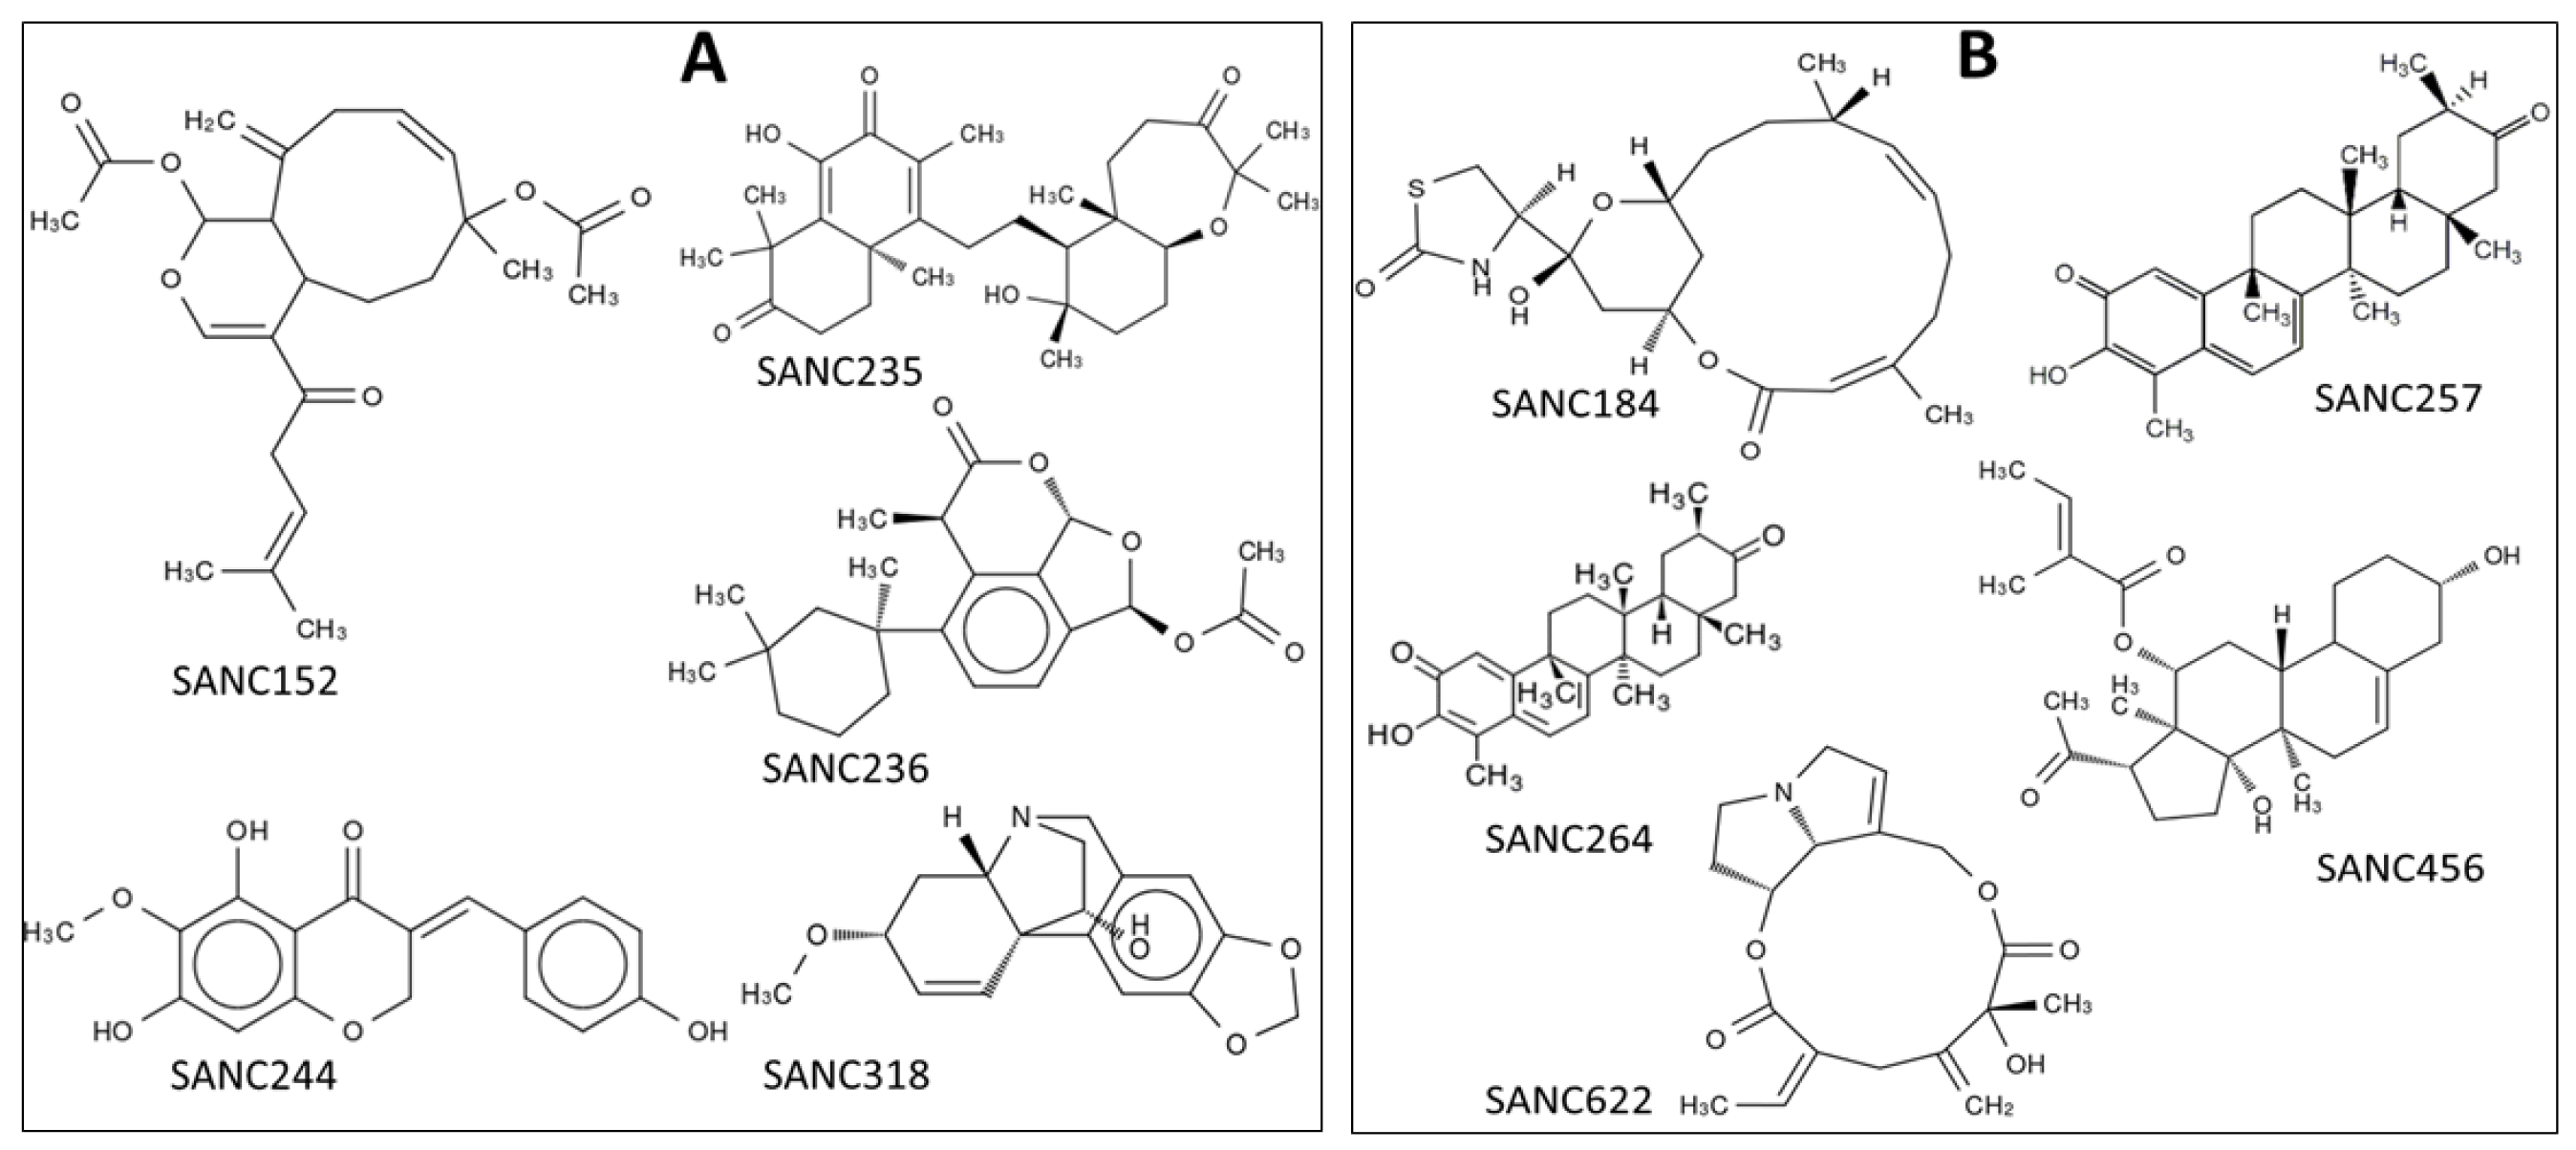
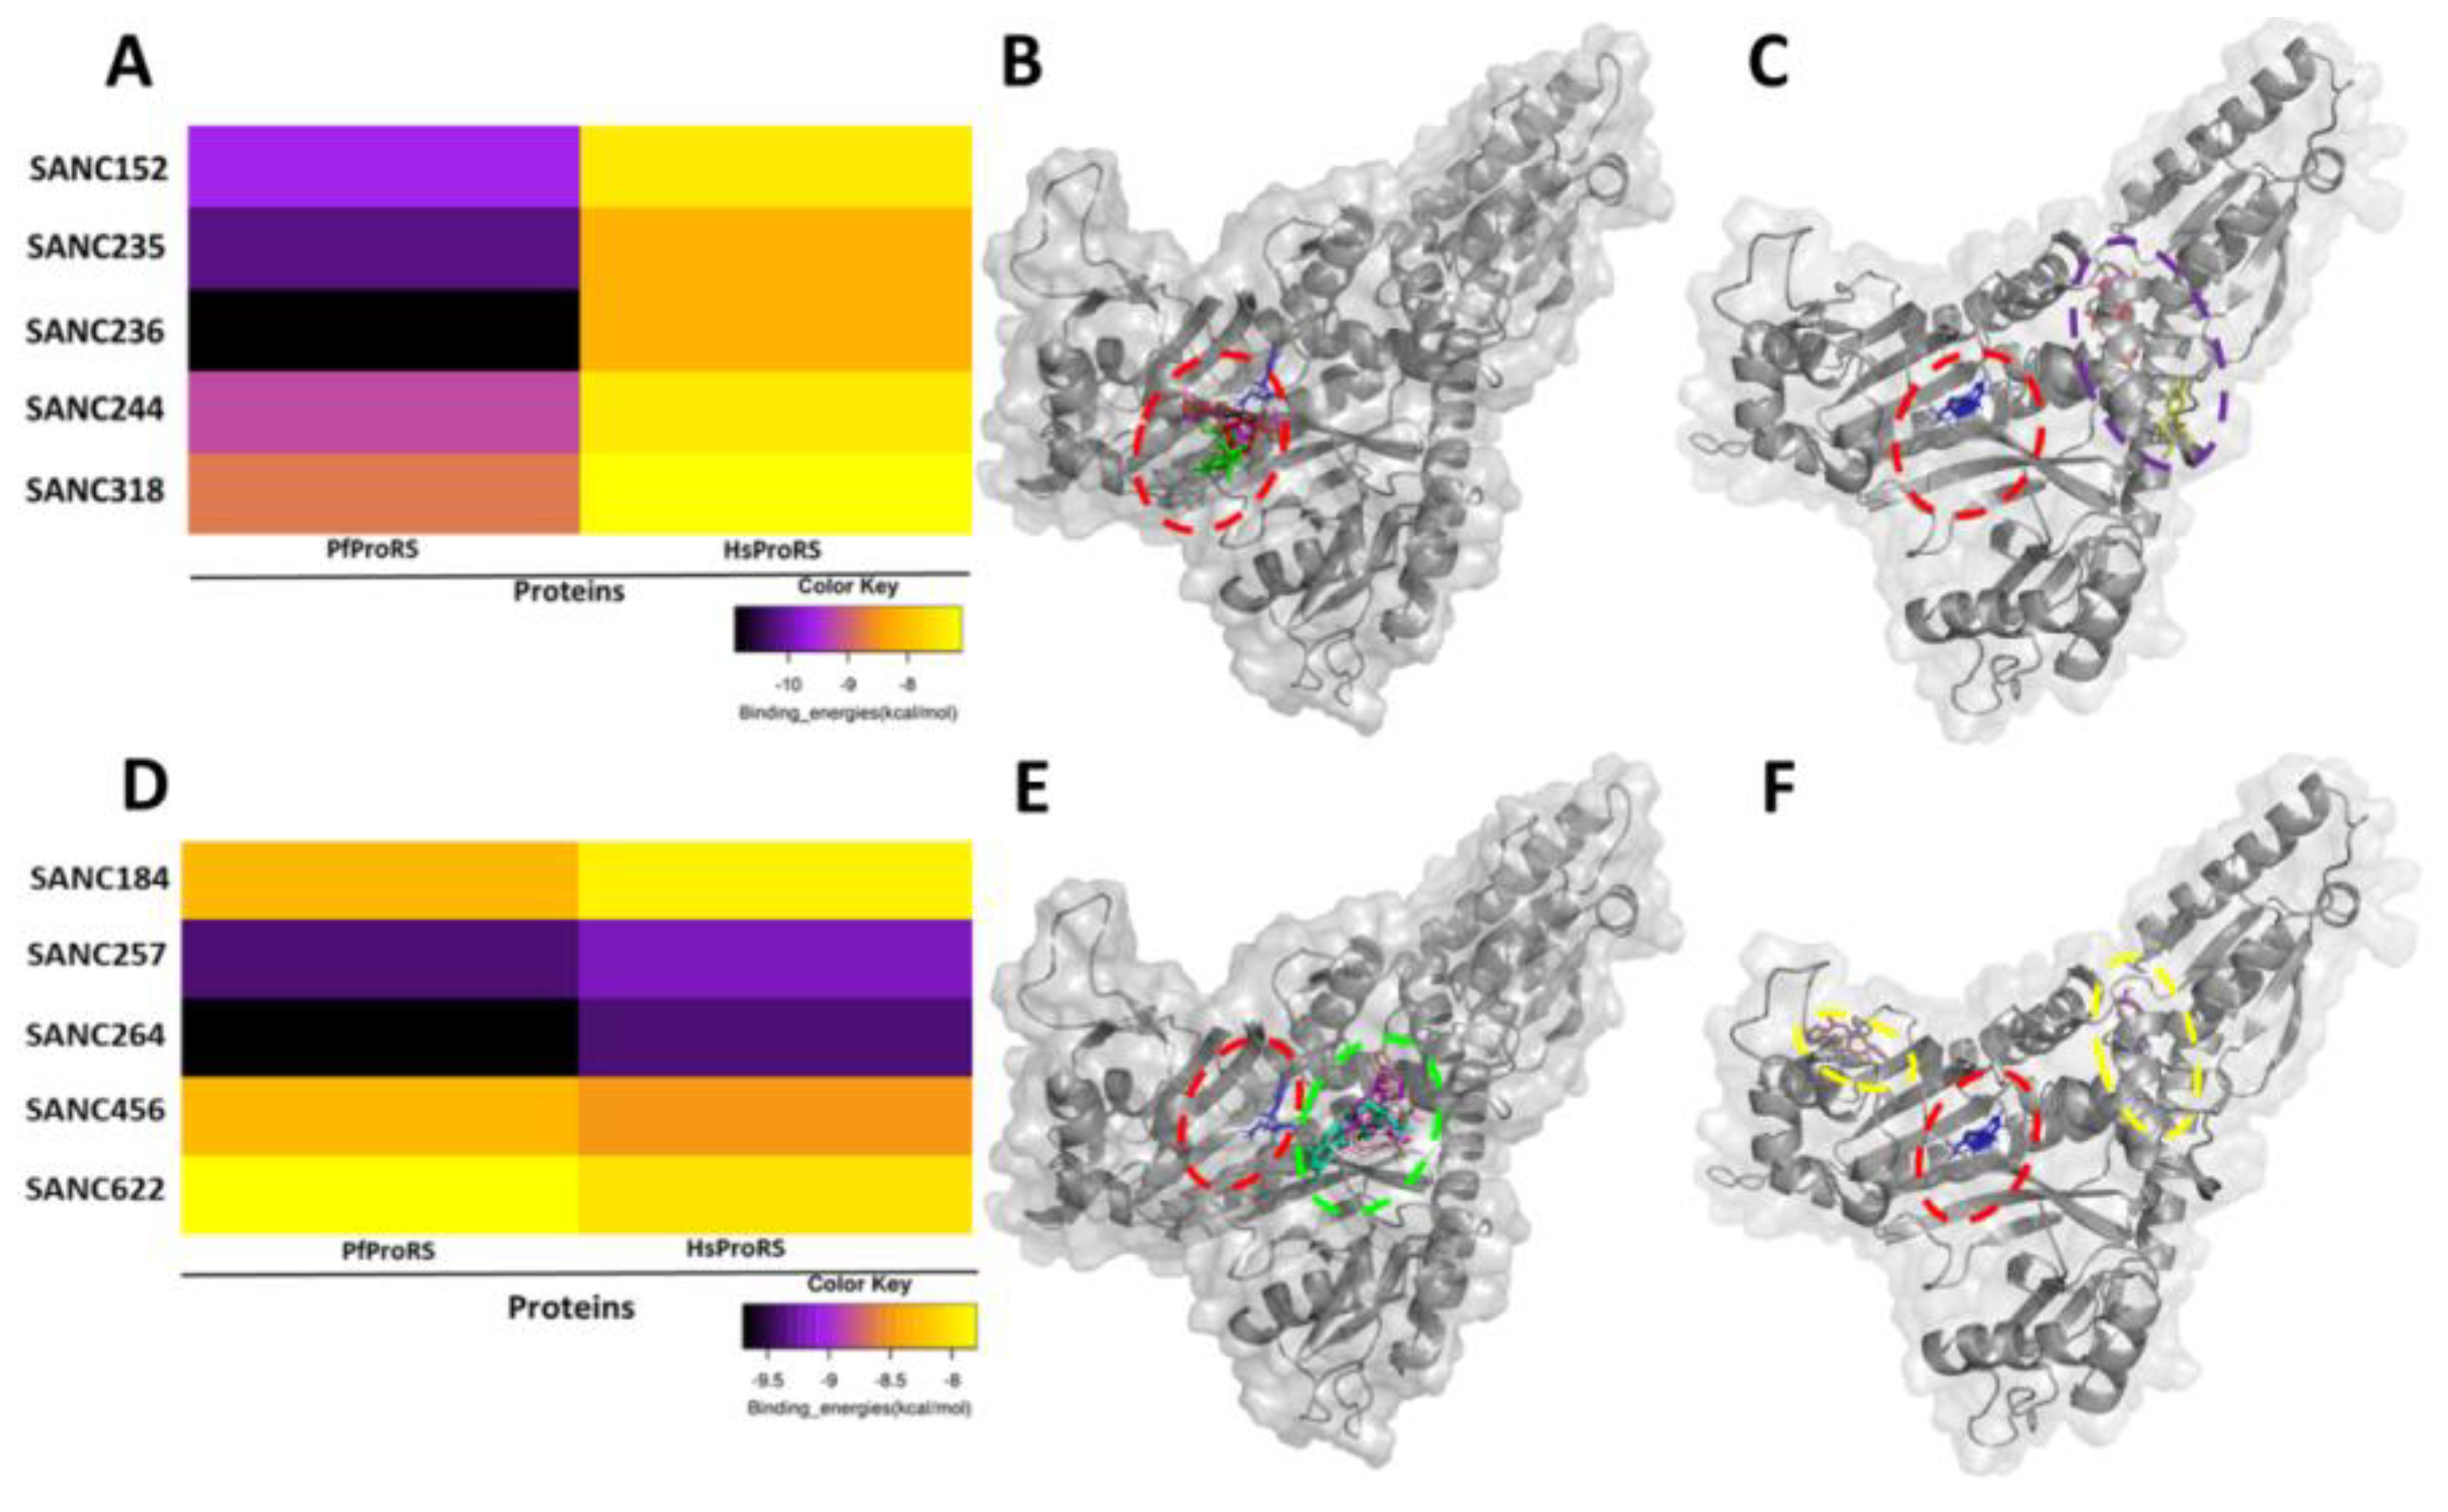
| SANC152 | SANC00152 | Tsitsixenicin D | −9.6 | −7.4 |
| SANC235 | SANC00235 | Sodwanone A | −10.2 | −8.2 |
| SANC236 | SANC00236 | Aplysulphurin-1 | −10.9 | −8.2 |
| SANC244 | SANC00244 | Eucomnalin | −9.2 | −7.4 |
| SANC318 | SANC00318 | Crinamine | −7.9 | −7.1 |
| SANC184 | SANC00184 | Latrunculin B | −8.3 | −7.9 |
| SANC257 | SANC00257 | 20-Hydroxy-20-epi-tingenone | −9.4 | −9.2 |
| SANC264 | SANC00264 | Tingenone | −9.7 | −9.4 |
| SANC456 | SANC00456 | Gordonoside A | −8.3 | −8.5 |
| SANC622 | SANC00622 | Seneciphylline | −7.8 | −8.0 |
| Protein Complex | RMSD Mean (nm) | % Difference (Holo Protein Less Ligand Complex) |
|---|---|---|
| PfProRS-ADN | 0.30 | 0.00 |
| PfProRS-SANC152 | 0.25 | 16.67 |
| PfProRS-SANC235 | 0.25 | 16.67 |
| PfProRS-SANC236 | 0.27 | 10.00 |
| PfProRS-SANC244 | 0.27 | 10.00 |
| PfProRS-SANC318 | 0.26 | 13.33 |
| PfProRS-SANC184 | 0.29 | 3.33 |
| PfProRS-SANC257 | 0.24 | 20.00 |
| PfProRS-SANC264 | 0.34 | −13.33 |
| PfProRS-SANC456 | 0.21 | 30.00 |
| PfProRS-SANC622 | 0.25 | 16.67 |
| PfProRS-halofuginone | 0.25 | 16.67 |
| PfProRS-glyburide | 0.28 | 6.67 |
| PfProRS-TCMDC124506 | 0.23 | 23.33 |
| HsProRS-ADN | 0.20 | 0.00 |
| HsProRS-SANC152 | 0.24 | −20.00 |
| HsProRS-SANC184 | 0.20 | 0.00 |
| HsProRS-SANC236 | 0.31 | −55.00 |
| HsProRS-SANC244 | 0.24 | −20.00 |
| HsProRS-SSANC257 | 0.21 | −4.50 |
| Protein-Ligand Complex | Residues with Significant Increase in Average BC for the Orthosteric Ligand Complexes | Residues with Significant Decrease in Average BC for the Orthosteric Ligand Complexes |
| PfProRS-SANC152 | 300, 745, 710, 299, 456, 386, 481, 536, 469, 362, 333, 509, 522, 454, 537 | 516, 408, 513, 707, 517, 274, 439, 514, 411, 705, 511, 389 |
| PfProRS-SANC235 | 300, 386, 271, 509, 456, 520, 474, 425 | 516, 513, 707, 408, 514, 545, 544, 530, 591, 594, 477, 439 |
| PfProRS-SANC236 | 431, 295, 435, 512, 406, 401, 440, 393, 402, 456, 429 | 408, 513, 516, 299, 463, 536, 477, 303, 388, 594, 545, 389 |
| PfProRS-SANC244 | 401, 295, 296, 286, 386, 300, 435, 532, 475, 407, 520, 519, 431, 474, 277, 294, 461, 297, 404 | 516, 514, 517, 408, 513, 299, 271, 594, 707, 512 |
| PfProRS-SANC318 | 474, 401, 402, 393, 431, 592, 597 | 408, 513, 516, 707, 477, 594, 596, 705, 319, 514 |
| Protein-Ligand Complex | Residues with Significant Increase in Average BC for the Allosteric Ligand Complexes | Residues with Significant Decrease in Average BC for the Allosteric Ligand Complexes |
| PfProRS-SANC184 | 299, 463, 303, 456, 537, 312, 536, 271, 442, 357, 641, 453, 343, 540, 509, 429, 520 | 513, 516, 388, 358, 440, 264, 515, 617, 480, 407, 428, 298 |
| PfProRS-SANC257 | 454, 532, 745, 520,299, 472, 456, 307, 509, 453, 463, 429, 481, 460, 540, 653, 657, 641 | 440, 708, 428, 432, 396, 475, 512, 399, 533, 617, 480, 593, 709, 270, 264, 436 |
| PfProRS-SANC264 | 295, 463, 537, 520, 532, 542, 277, 410, 540, 390, 595, 405, 307, 577, 361 | 440, 593, 428, 533, 514, 530, 436, 596, 435, 294, 432, 524 |
| PfProRS-SANC456 | 519, 745, 509, 454, 410, 442, 333, 456, 542, 362, 540, 300 | 514, 512, 511, 617, 264, 388, 432, 396, 593, 408, 708, 475 |
| PfProRS-SANC622 | 463, 520, 389, 410, 296, 361, 295, 521, 458, 460, 407, 745, 385, 641, 317, 470, 442, 429 | 593, 428, 386, 264, 432, 396, 270, 617, 298, 531, 480 |
| Protein-Ligand Complex | Residues with Significant Decrease in Average L in the Orthosteric Ligand Complexes | Residues with Significant Increase in Average L in the Orthosteric Ligand Complexes |
| PfProRS-SANC152 | 333, 260, 335, 363, 362, 310, 552, 308, 307, 334, 303, 386, 338, 311, 300, 309 | 705, 707, 706, 708, 281, 319, 699, 700, 573, 553, 349 |
| PfProRS-SANC235 | 552, 709, 338, 334, 335, 333, 327, 386, 337, 363, 362, 546, 336, 339 | 706, 707, 705, 579, 703, 700 |
| PfProRS-SANC236 | 552, 338, 333, 701, 339, 334, 335, 336, 337, 395, 709, 711, 332, 710, 393, 394 | 703,705, 707, 704, 706, 698, 319, 700, 702, 314, 316 |
| PfProRS-SANC244 | 550, 551, 709, 552, 401, 711, 546 | 707, 706, 703, 705, 349, 702, 368, 347, 700, 704 |
| PfProRS-SANC318 | 552, 709, 395, 260, 701, 396, 551, 393, 401, 338, 394, 259, 402, 339 | 705, 707, 703, 328, 704, 319, 316, 281, 702 |
| Protein- Ligand Complex | Residues with Significant Decrease in Average L in the Allosteric Ligand Complexes | Residues with Significant Increase in Average L in the Allosteric Ligand Complexes |
| PfProRS-SANC184 | 333, 349, 335, 334, 345, 347, 338, 348, 343, 350, 310, 344, 455, 337, 336, 456, 363, 331, 346, 330, 311 | 704, 701, 705, 702, 703, 707, 553, 700, 708, 264, 550 |
| PfProRS-SANC257 | 333, 455, 334, 456, 738, 332, 460, 457, 308 | 701, 702, 705, 708, 706, 704, 703, 709, 553, 552, 707,396, 700, 550 |
| PfProRS-SANC264 | 349, 347, 348, 346, 455, 345, 260, 572, 571, 570 | 704, 705, 708, 702, 703, 709, 701, 328, 553, 327, 330, 331, 707, 706, 552, 264, 265 |
| PfProRS-SANC456 | 260, 333, 334, 335, 328, 455, 485, 570 | 701, 708, 705, 702, 707, 706, 704, 709, 396, 316, 703, 553, 319, 550, 264, 265, 268, 700 |
| PfProRS-SANC622 | 260, 455, 310, 308, 254, 311, 486, 460 | 701, 702, 704, 706, 707, 703, 341, 708, 339, 319, 705, 338, 709, 346, 347, 342, 348, 343, 345, 344 |
© 2020 by the authors. Licensee MDPI, Basel, Switzerland. This article is an open access article distributed under the terms and conditions of the Creative Commons Attribution (CC BY) license (http://creativecommons.org/licenses/by/4.0/).
Share and Cite
Nyamai, D.W.; Tastan Bishop, Ö. Identification of Selective Novel Hits against Plasmodium falciparum Prolyl tRNA Synthetase Active Site and a Predicted Allosteric Site Using In Silico Approaches. Int. J. Mol. Sci. 2020, 21, 3803. https://0-doi-org.brum.beds.ac.uk/10.3390/ijms21113803
Nyamai DW, Tastan Bishop Ö. Identification of Selective Novel Hits against Plasmodium falciparum Prolyl tRNA Synthetase Active Site and a Predicted Allosteric Site Using In Silico Approaches. International Journal of Molecular Sciences. 2020; 21(11):3803. https://0-doi-org.brum.beds.ac.uk/10.3390/ijms21113803
Chicago/Turabian StyleNyamai, Dorothy Wavinya, and Özlem Tastan Bishop. 2020. "Identification of Selective Novel Hits against Plasmodium falciparum Prolyl tRNA Synthetase Active Site and a Predicted Allosteric Site Using In Silico Approaches" International Journal of Molecular Sciences 21, no. 11: 3803. https://0-doi-org.brum.beds.ac.uk/10.3390/ijms21113803