Powdery Mildew-Induced Hormonal and Photosynthetic Changes in Barley Near Isogenic Lines Carrying Various Resistant Genes

 ,
,  ,
, 
Abstract
:1. Introduction
2. Results and Discussion
2.1. Appearance of Disease Symptoms
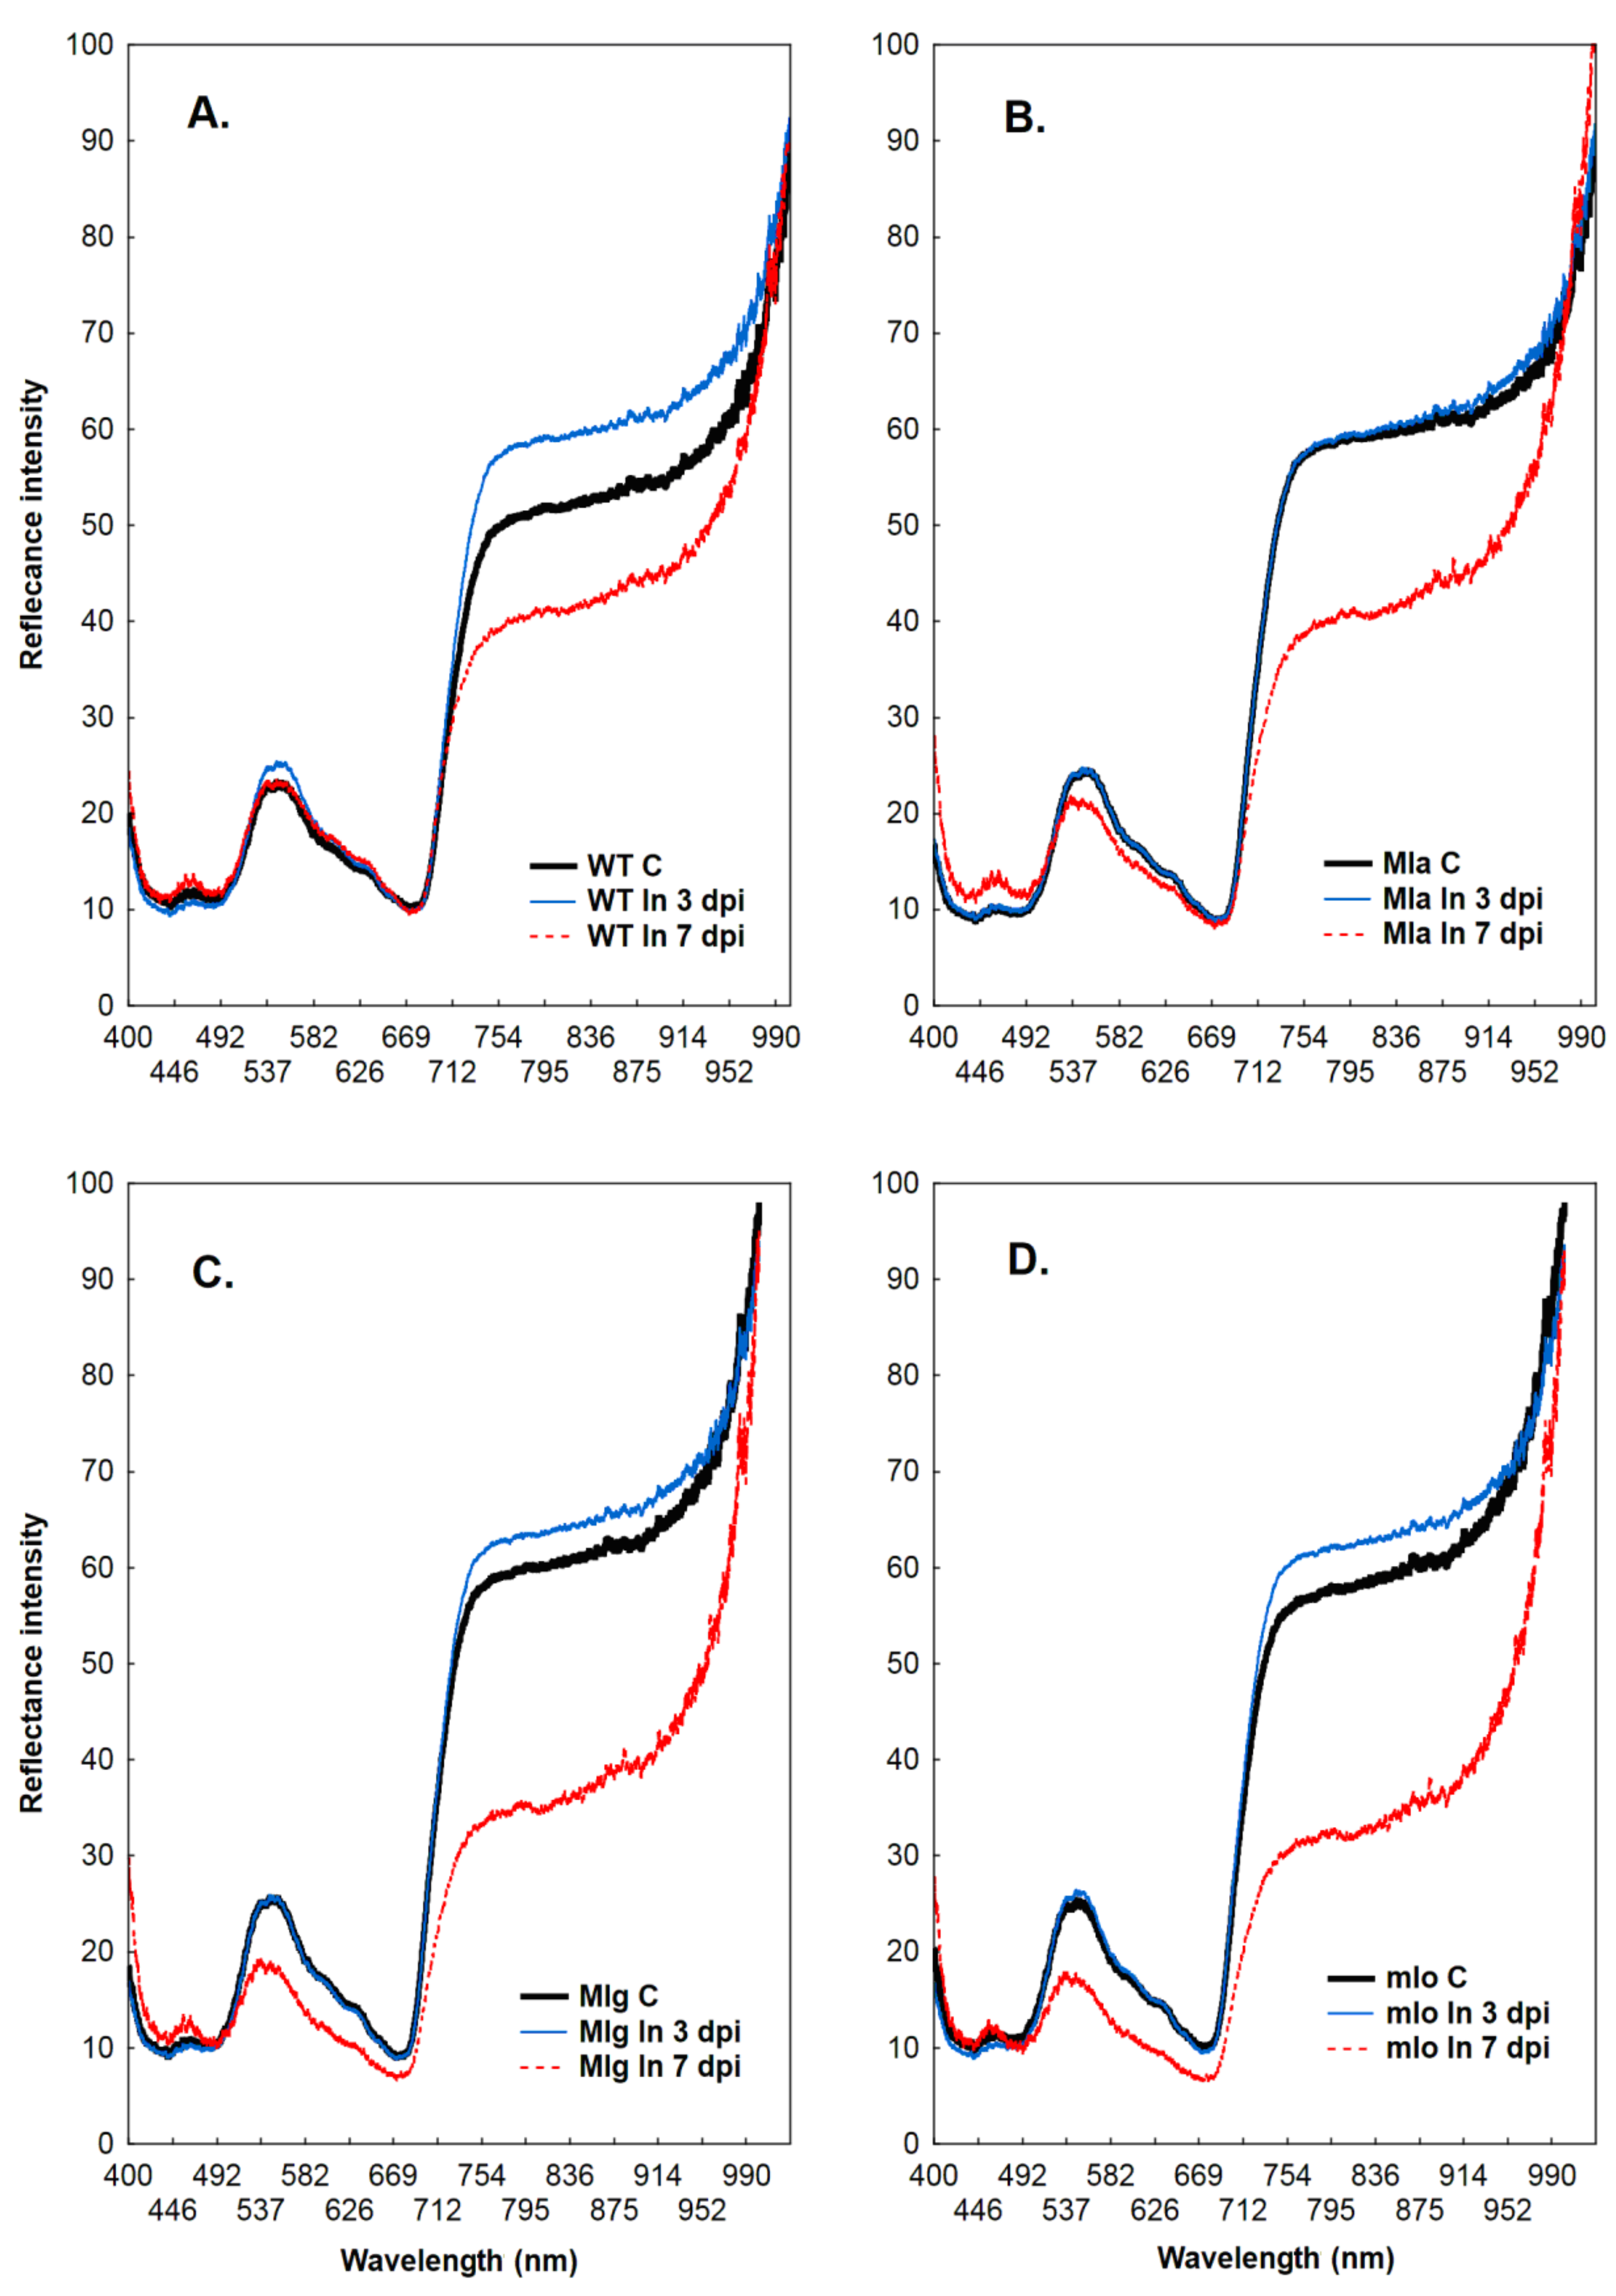
2.2. Measurements of Leaf Reflectance
2.3. Fast Kinetics of Chlorophyll a Fluorescence
2.4. Leaf Hormonal Homeostasis after Powdery Mildew Infection
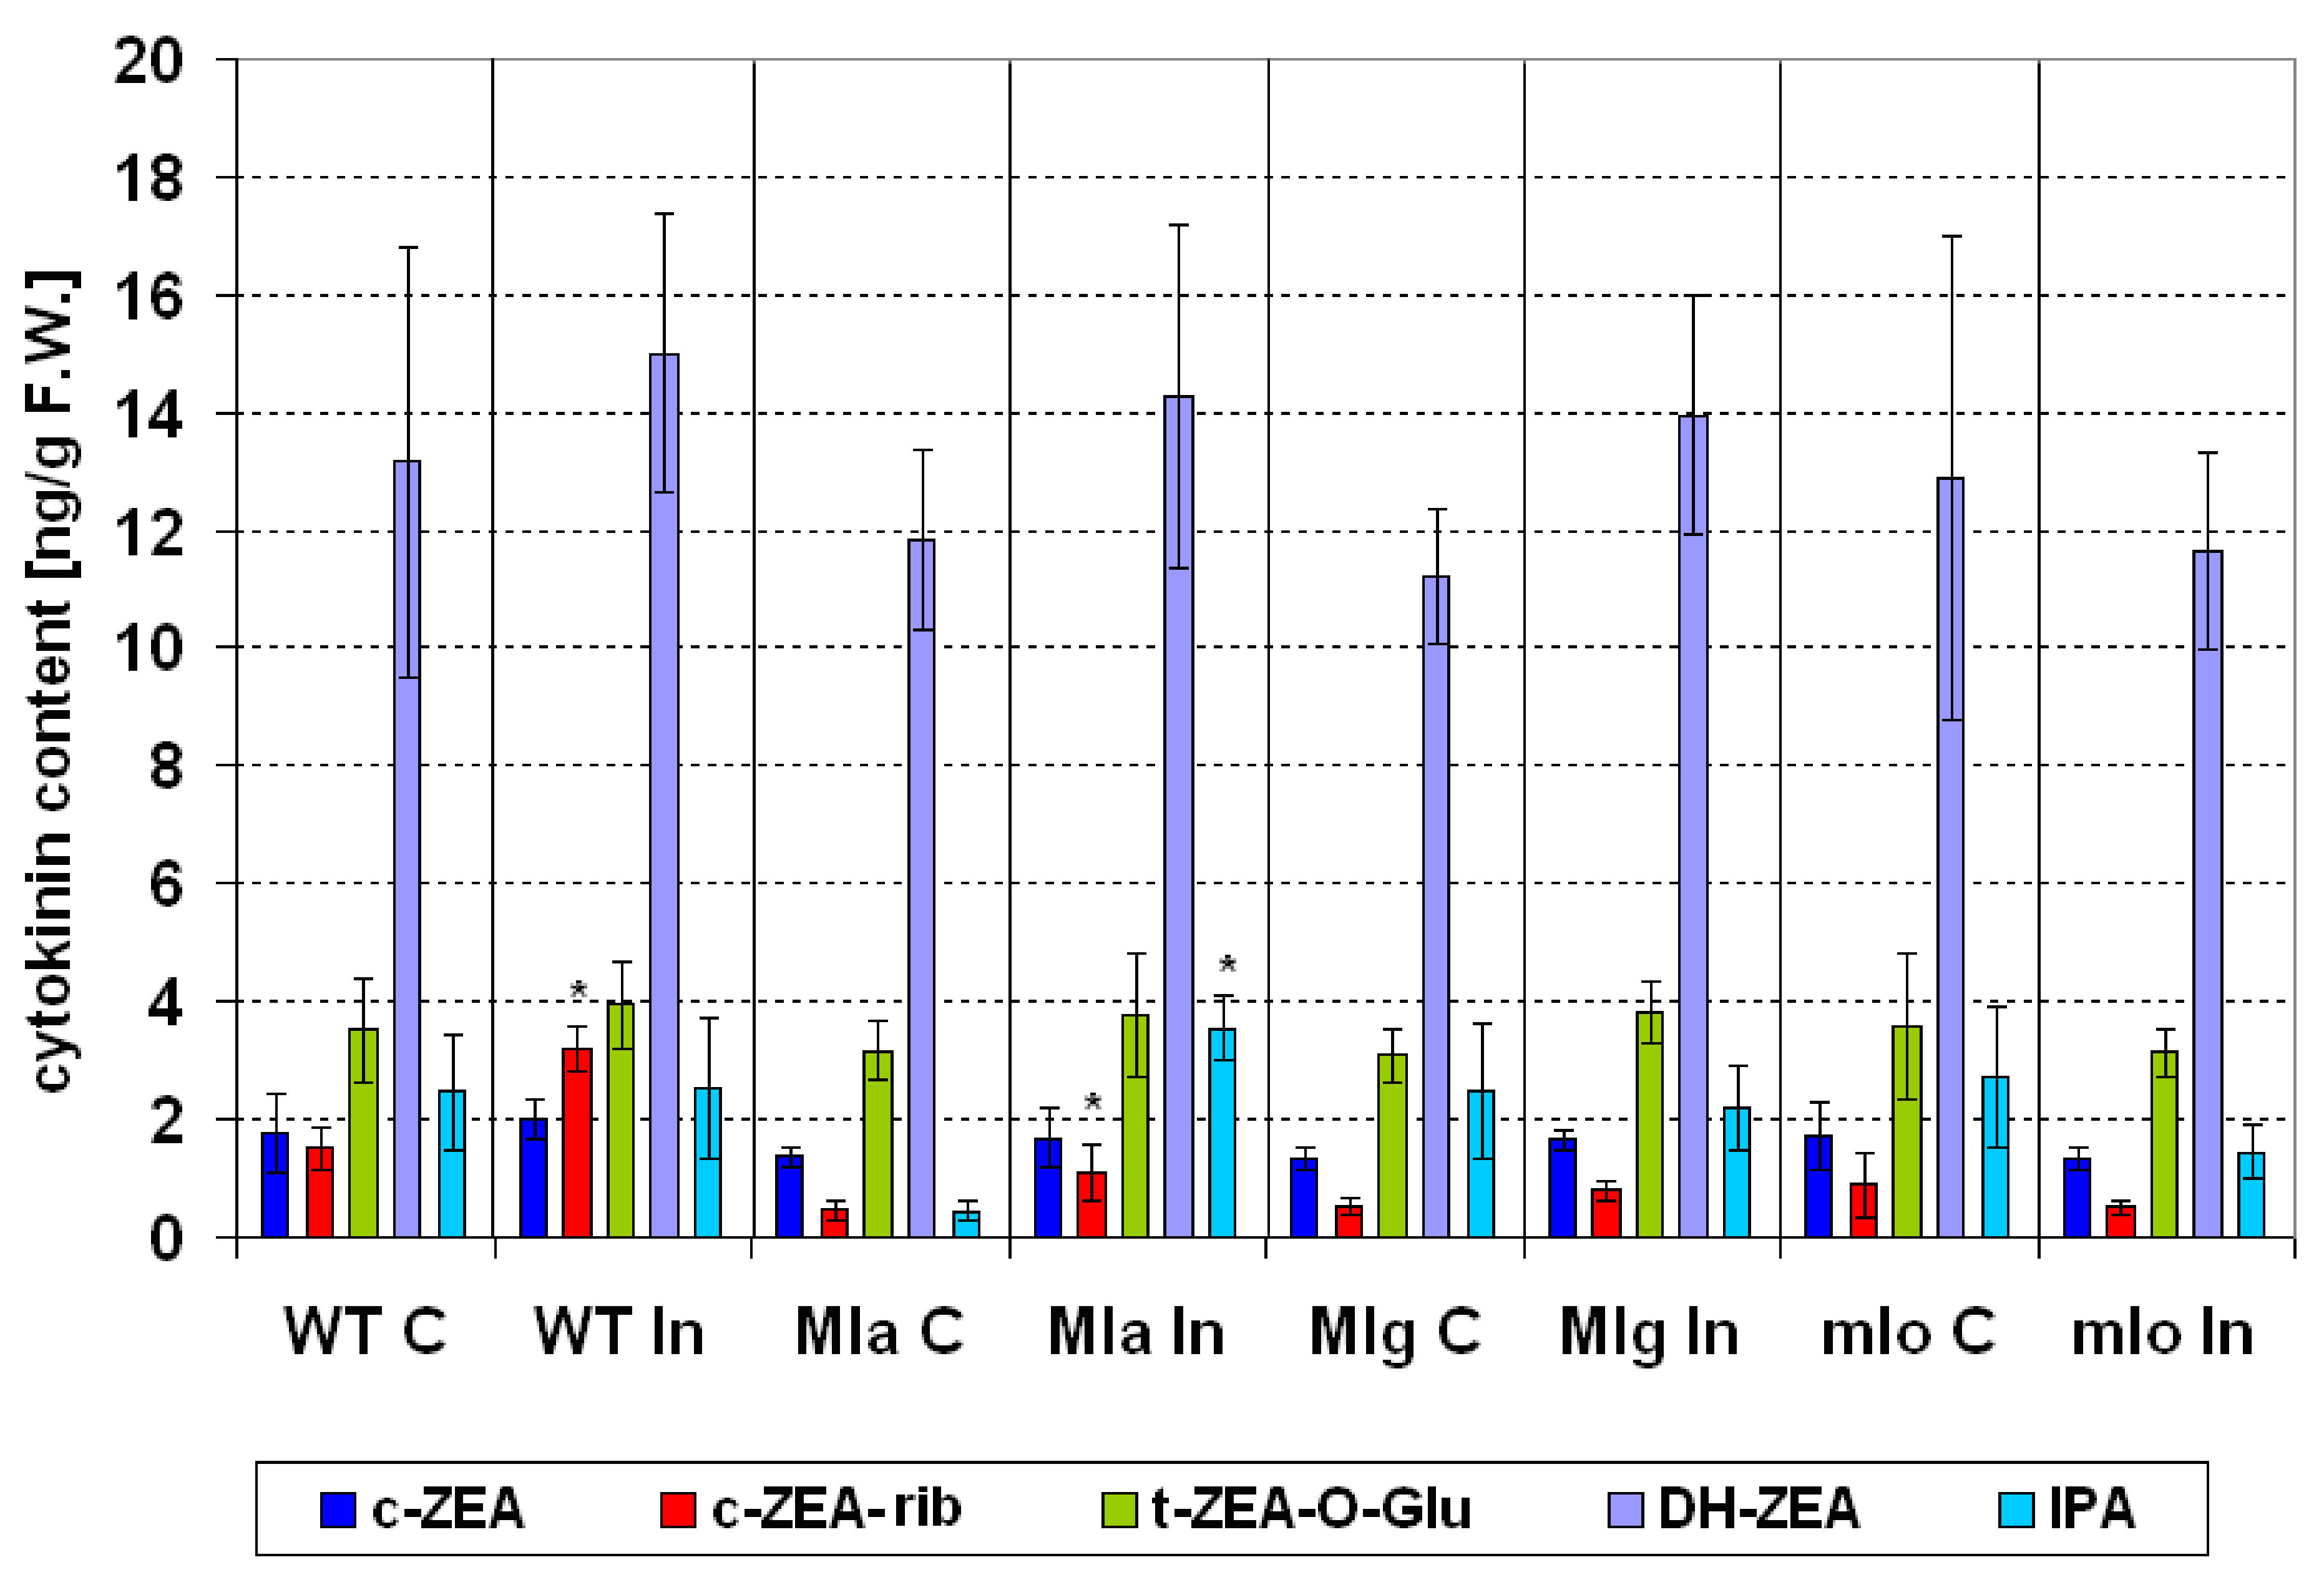
2.4.1. Cytokinins
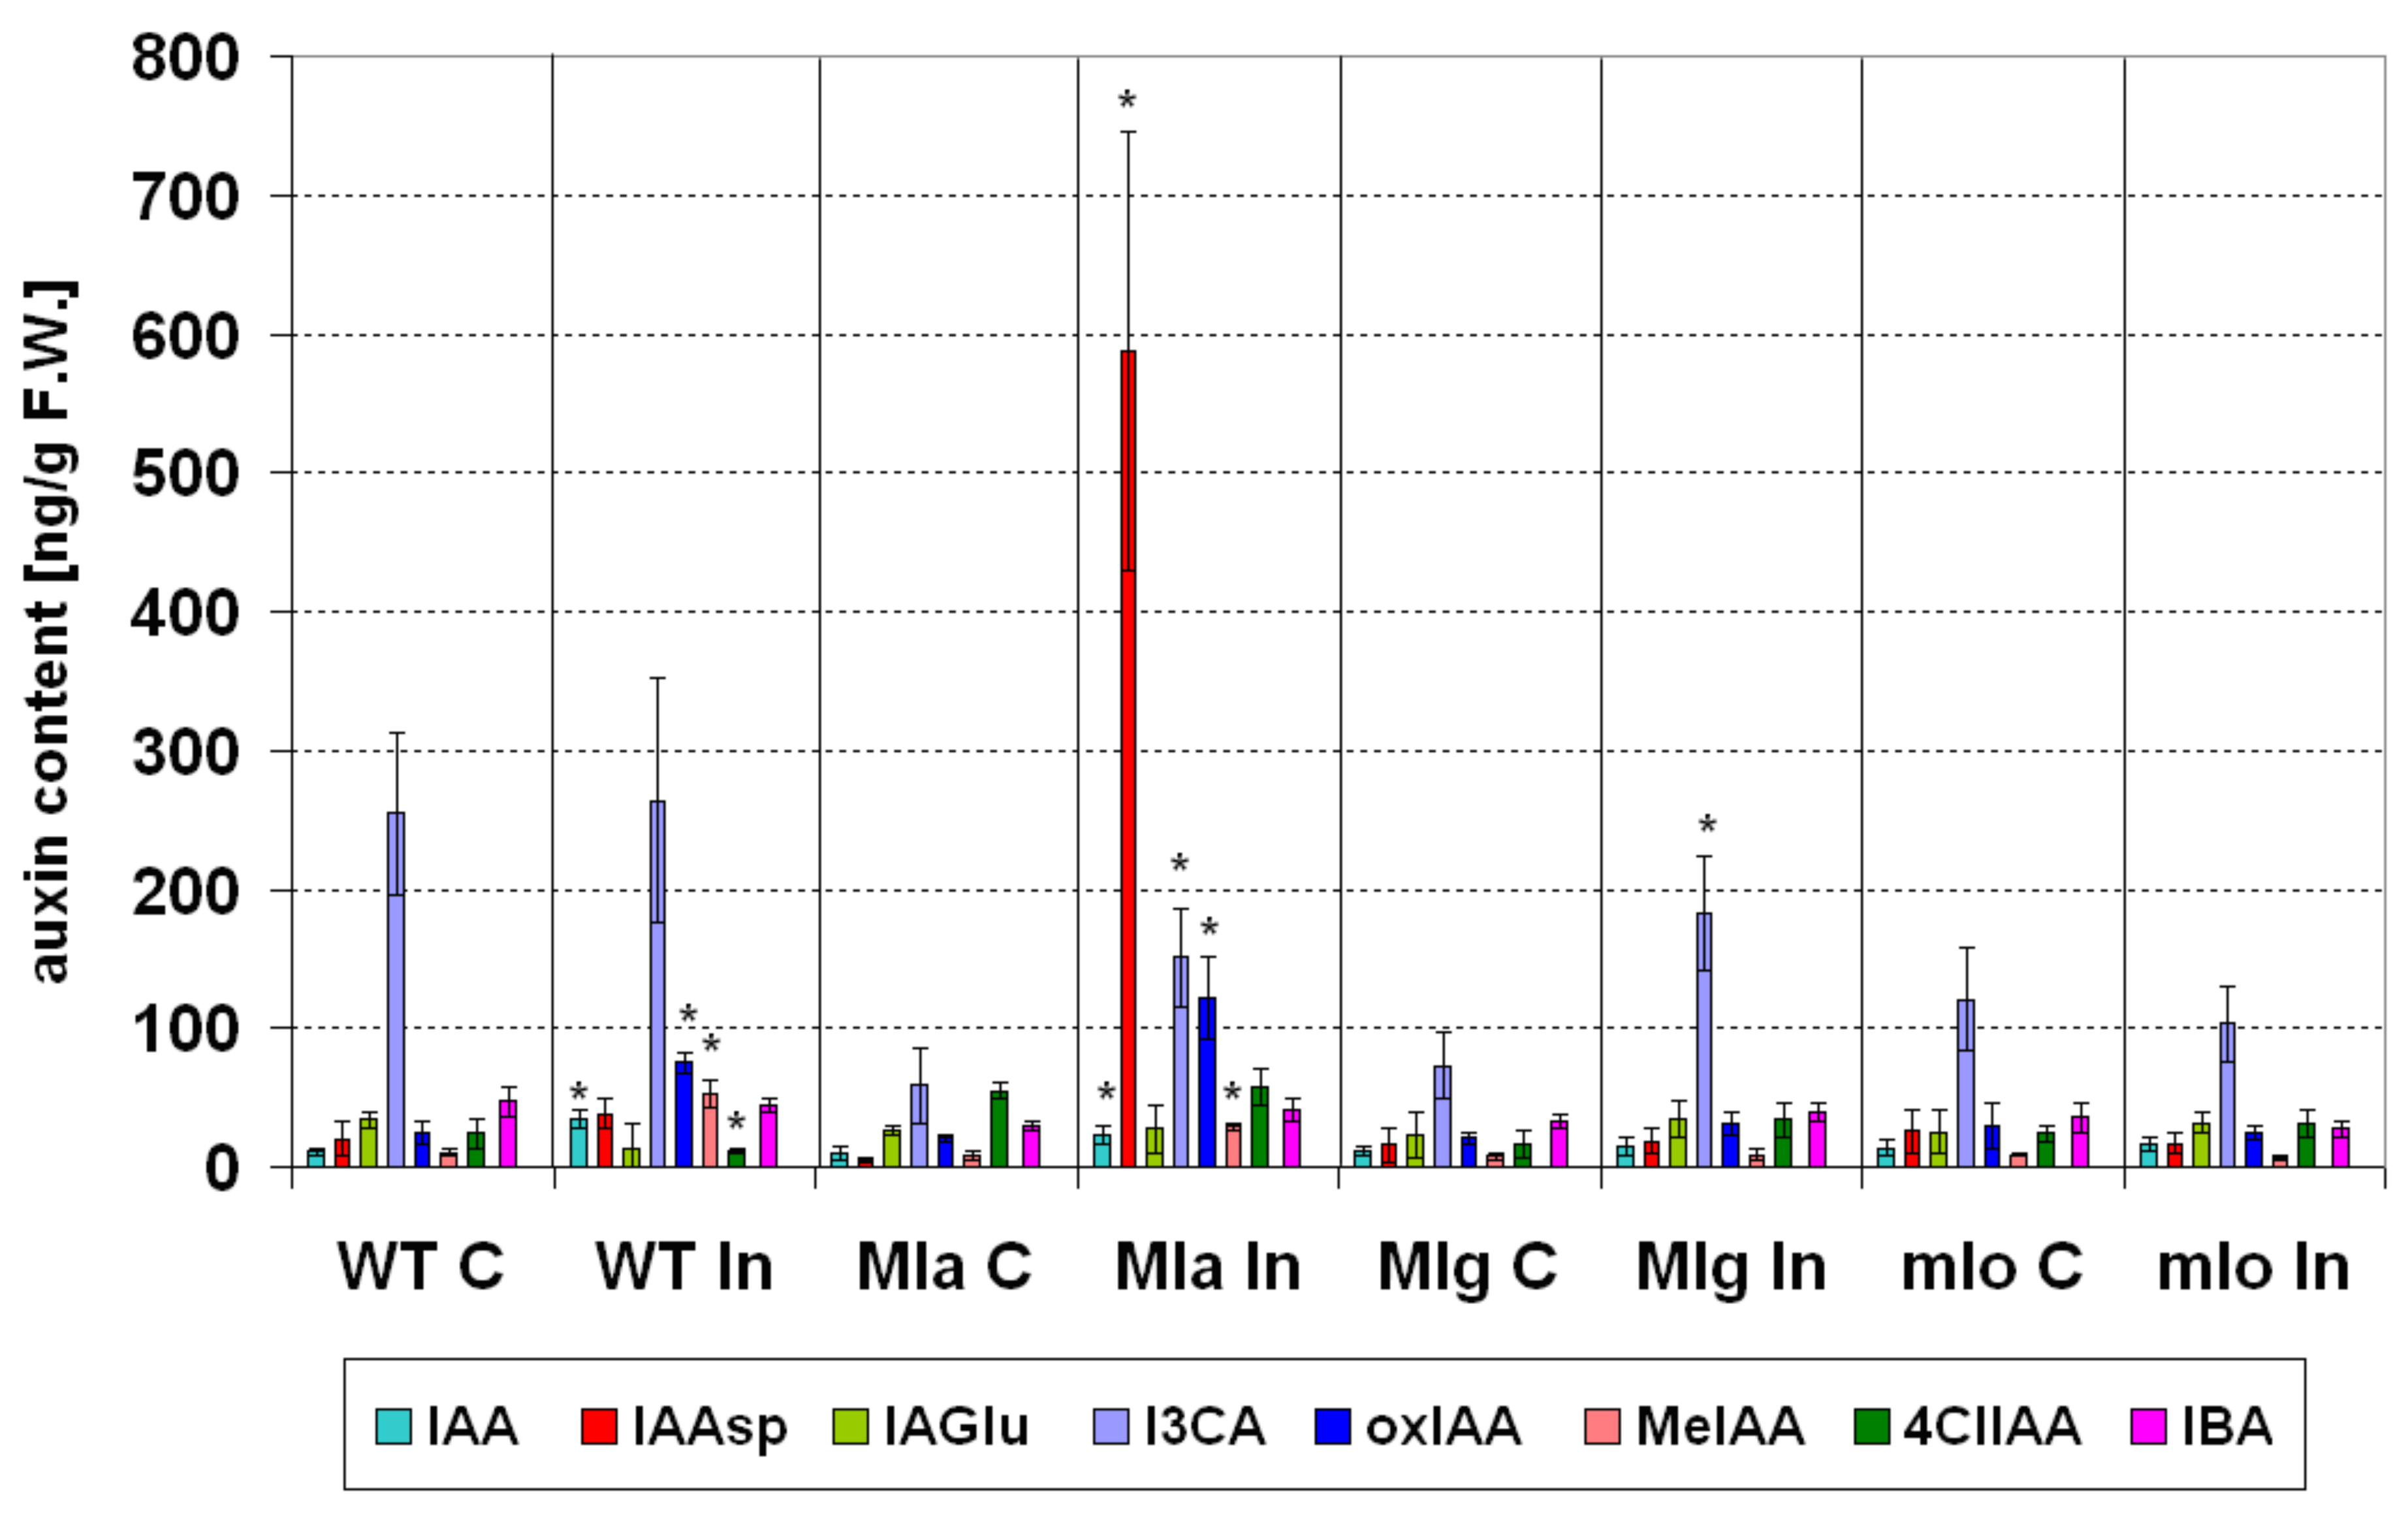
2.4.2. Auxins
2.4.3. Gibberellins
2.4.4. Stress Hormones
2.5. Concluding Remarks
3. Material and Methods
3.1. Plant Material and Experimental Design
3.2. Measurements of Leaf Reflectance and Reflection Parameters
3.3. Fast Kinetics of Chlorophyll A Fluorescence
3.4. Hormonal Assays
3.5. Statistical Calculations
Supplementary Materials
Author Contributions
Funding
Acknowledgments
Conflicts of Interest
References
- Dreiseitl, A. Heterogeneity of Powdery Mildew Resistance Revealed in Accessions of the ICARDA Wild Barley Collection. Front. Plant Sci. 2017, 8, 9. [Google Scholar] [CrossRef]
- Tratwal, A.; Bocianowski, J. Blumeria graminis f. sp. hordei virulence frequency and the powdery mildew incidence on spring barley in the Wielkopolska province. J. Plant Prot. Res. 2014, 54, 28–35. [Google Scholar] [CrossRef]
- Chaure, P.; Gurr, S.J.; Spanu, P. Stable transformation of Erysiphe graminis an obligate biotrophic pathogen of barley. Nat. Biotechnol. 2000, 18, 205–207. [Google Scholar] [CrossRef] [PubMed]
- Tucker, M.A.; Jayasena, K.; Ellwood, S.R.; Oliver, R.P. Pathotype variation of barley powdery mildew in Western Australia. Australas. Plant Pathol. 2013, 42, 617–623. [Google Scholar] [CrossRef] [Green Version]
- Jørgensen, J.H.; Wolfe, M. Genetics of Powdery Mildew Resistance in Barley. Crit. Rev. Plant Sci. 1994, 13, 97–119. [Google Scholar] [CrossRef]
- Huckelhoven, R. Hypersensitive Cell Death and Papilla Formation in Barley Attacked by the Powdery Mildew Fungus Are Associated with Hydrogen Peroxide but Not with Salicylic Acid Accumulation. Plant Physiol. 1999, 119, 1251–1260. [Google Scholar] [CrossRef] [PubMed] [Green Version]
- Ames, N.; Dreiseitl, A.; Steffenson, B.J.; Muehlbauer, G.J. Mining wild barley for powdery mildew resistance. Plant Pathol. 2015, 64, 1396–1406. [Google Scholar] [CrossRef] [Green Version]
- Büschges, R.; Hollricher, K.; Panstruga, R.; Simons, G.; Wolter, M.; Frijters, A.; van Daelen, R.; van der Lee, T.; Diergaarde, P.; Groenendijk, J.; et al. The Barley Mlo Gene: A Novel Control Element of Plant Pathogen Resistance. Cell 1997, 88, 695–705. [Google Scholar] [CrossRef] [Green Version]
- Kinizios, S.; Jahoor, A.; Fischbeck, G. Powdery-mildew-resistance genes Mla29 and Mla32 in H. spontaneum derived winter-barley lines. Plant Breed. 1995, 114, 265–266. [Google Scholar] [CrossRef]
- Harrach, B.D.; Fodor, J.; Pogany, M.; Preuss, J.; Barna, B. Antioxidant, ethylene, and membrane leakage responses to powdery mildew infection of near-isogenic barley lines with various types of resistance. Eur. J. Plant Pathol. 2007, 121, 21–33. [Google Scholar] [CrossRef]
- Barna, B.; Harrach, B.D.; Viczián, O.; Fodor, J. Heat induced susceptibility of barley lines with various types of resistance genes to powdery mildew. Acta Phytopathol. Entomol. Hung. 2014, 49, 177–188. [Google Scholar] [CrossRef]
- Tatagiba, S.D.; da Matta, F.M.; Rodrigues, F. Ávila Leaf Gas Exchange and Chlorophyll a Fluorescence Imaging of Rice Leaves Infected with Monographella albescens. Phytopathology 2015, 105, 180–188. [Google Scholar] [CrossRef] [PubMed] [Green Version]
- Rios, J.A.; Aucique-Pérez, C.E.; Cruz, M.F.A.; Morais, L.E.; da Matta, F.M.; Rodrigues, F.A. Alteration of photosynthetic performance and source-sink relationships in wheat plants infected by Pyricularia oryzae. Plant Pathol. 2017, 66, 1496–1507. [Google Scholar] [CrossRef]
- Takahashi, H.; Ehara, Y.; Hirano, H. A protein in the oxygen-evolving complex in the chloroplast is associated with symptom expression on tobacco leaves infected with cucumber mosaic virus strain Y. Plant Mol. Boil. 1991, 16, 689–698. [Google Scholar] [CrossRef]
- Takahashi, H. Research Notes Changes in the Activity and the Polypeptide Composition of the Oxygen-Evolving Complex in Photosystem II of Tobacco Leaves Infected with Cucumber Mosaic Virus Strain Y. Mol. Plant-Microbe Interact. 1992, 5, 269. [Google Scholar] [CrossRef]
- Pérez-Bueno, M.L.; Rahoutei, J.; Sajnani, C.; García-Luque, I.; Barón, M. Proteomic analysis of the oxygen-evolving complex of photosystem II under biotec stress: Studies on Nicotiana benthamiana infected with tobamoviruses. Proteomics 2004, 4, 418–425. [Google Scholar] [CrossRef]
- Peñuelas, J.; Filella, I.; Biel, C.; Serrano, L.; Savé, R. The reflectance at the 950–970 nm region as an indicator of plant water status. Int. J. Remote. Sens. 1993, 14, 1887–1905. [Google Scholar] [CrossRef]
- Peñuelas, J.; Baret, F.; Filella, I. Semi-empirical indices to assess carotenoids/chlorophyll a ratio from leaf spectra reflectance. Photosynthetica 1995, 31, 221–230. [Google Scholar]
- Peñuelas, J.; Filella, I.; Gamon, J.A. Assessment of photosynthetic radiation-use efficiency with spectral reflectance. New Phytol. 1995, 131, 291–296. [Google Scholar] [CrossRef]
- Carter, G.A.; Knapp, A.K. Leaf optical properties in higher plants: Linking spectral characteristics to stress and chlorophyll concentration. Am. J. Bot. 2001, 88, 677–684. [Google Scholar] [CrossRef] [Green Version]
- Wang, L.-F.; Wang, M.; Zhang, Y. Effects of powdery mildew infection on chloroplast and mitochondrial functions in rubber tree. Trop. Plant Pathol. 2014, 39, 242–250. [Google Scholar] [CrossRef] [Green Version]
- Avalos, J.; Nordzieke, S.; Parra, O.; Pardo-Medina, J.; Carmen Limón, M. Carotenoid production by filamentous fungi and yeasts. In Biotechnology of Yeasts and Filamentous Fungi; Sibirny, A., Ed.; Springer: Cham, Switzerland, 2017; pp. 225–279. [Google Scholar]
- Avalos, J.; Limón, M.C. Biological roles of fungal carotenoids. Curr. Genet. 2014, 61, 309–324. [Google Scholar] [CrossRef] [PubMed]
- Peñuelas, J.; Isla, R.; Filella, I.; Araus, J.L. Visible and Near-Infrared Reflectance Assessment of Salinity Effects on Barley. Crop. Sci. 1997, 37, 198–202. [Google Scholar] [CrossRef]
- Janeczko, A.; Saja, D.; Dziurka, M.; Gullner, G.; Kornaś, A.; Skoczowski, A.; Gruszka, D.; Barna, B. Brassinosteroid deficiency caused by the mutation of the HvDWARF gene influences the reactions of barley to powdery mildew. Physiol. Mol. Plant Pathol. 2019, 108, 101438. [Google Scholar] [CrossRef]
- Goodman, R.N.; Kiraly, Z.; Wood, K.R. The Biochemistry and Physiology of Plant Disease; University of Missouri Press: Columbia, MO, USA, 1986; p. 433. [Google Scholar]
- Gamon, J.A.; Peñuelas, J.; Field, C. A narrow-waveband spectral index that tracks diurnal changes in photosynthetic efficiency. Remote. Sens. Environ. 1992, 41, 35–44. [Google Scholar] [CrossRef]
- Gamon, J.A.; Serrano, L.; Surfus, J.S. The photochemical reflectance index: An optical indicator of photosynthetic radiation use efficiency across species, functional types, and nutrient levels. Oecologia 1997, 112, 492–501. [Google Scholar] [CrossRef]
- Evain, S.; Flexas, J.; Moya, I. A new instrument for passive remote sensing: 2. Measurement of leaf and canopy reflectance changes at 531 nm and their relationship with photosynthesis and chlorophyll fluorescence. Remote Sens. Environ. 2004, 91, 175–185. [Google Scholar] [CrossRef]
- Rahimzadeh-Bajgiran, P.; Munehiro, M.; Omasa, K. Relationships between the photochemical reflectance index (PRI) and chlorophyll fluorescence parameters and plant pigment indices at different leaf growth stages. Photosynth. Res. 2012, 113, 261–271. [Google Scholar] [CrossRef]
- Krezhova, D.; Dikova, B.; Maneva, S. Ground based hyperspectral remote sensing for disease detection of tobacco plants. Bulg. J. Agric. Sci. 2014, 20, 1142–1150. [Google Scholar]
- Kalaji, H.M.; Kalaji, H.M.; Oukarroum, A.; Brestic, M.; Zivcak, M.; Samborska, I.A.; Cetner, M.; Łukasik, I.; Goltsev, V.; Ladle, R.J. Chlorophyll a fluorescence as a tool to monitor physiological status of plants under abiotic stress conditions. Acta Physiol. Plant. 2016, 38, 102. [Google Scholar] [CrossRef] [Green Version]
- Kuckenberg, J.; Tartachnyk, I.; Noga, G. Temporal and spatial changes of chlorophyll fluorescence as a basis for early and precise detection of leaf rust and powdery mildew infections in wheat leaves. Precis. Agric. 2008, 10, 34–44. [Google Scholar] [CrossRef]
- Brugger, A.; Kuska, M.T.; Mahlein, A.-K. Impact of compatible and incompatible barley—Blumeria graminis f.sp. hordei interactions on chlorophyll fluorescence parameters. J. Plant Dis. Prot. 2017, 125, 177–186. [Google Scholar] [CrossRef]
- Barón, M.; Rahoutei, J.; Lázaro, J.J.; García Luque, I. Photosystem II response to biotic and abiotic stress. In Photosynthesis from Light to Biosphere; Mathis, P., Ed.; Kluwer Academic Publishers: The Hague, The Netherlands, 1995; Volume 4, pp. 897–901. [Google Scholar]
- Gonçalves, M.C.; Vega, J.; Oliveira, J.G.; Gomes, M.M.A. Sugarcane yellow leaf virus infection leads to alterations in photosynthetic efficiency and carbohydrate accumulation in sugarcane leaves. Fitopatol. Bras. 2005, 30, 10–16. [Google Scholar] [CrossRef]
- Rys, M.; Juhász, C.; Surówka, E.; Janeczko, A.; Saja, D.; Tóbiás, I.; Skoczowski, A.; Barna, B.; Gullner, G. Comparison of a compatible and an incompatible pepper-tobamovirus interaction by biochemical and non-invasive techniques: Chlorophyll a fluorescence, isothermal calorimetry and FT-Raman spectroscopy. Plant Physiol. Biochem. 2014, 83, 267–278. [Google Scholar] [CrossRef] [Green Version]
- Skoczowski, A.; Janeczko, A.; Gullner, G.; Tóbiás, I.; Kornas, A.; Barna, B. Response of brassinosteroid-treated oilseed rape cotyledons to infection with the wild type and HR-mutant of Pseudomonas syringae or with P. fluorescence. J. Therm. Anal. Calorim. 2010, 104, 131–139. [Google Scholar] [CrossRef]
- Janeczko, A.; Tobias, I.; Skoczowski, A.; Dubert, F.; Gullner, G.; Barna, B. Progesterone moderates damage in Arabidopsis thaliana caused by infection with Pseudomonas syringae or P. fluorescens. Boil. Plant. 2013, 57, 169–173. [Google Scholar] [CrossRef]
- Robert-Seilaniantz, A.; Navarro, L.; Bari, R.; Jones, J.D. Pathological hormone imbalances. Curr. Opin. Plant Boil. 2007, 10, 372–379. [Google Scholar] [CrossRef]
- Bari, R.; Jones, J.D. Role of plant hormones in plant defence responses. Plant Mol. Boil. 2008, 69, 473–488. [Google Scholar] [CrossRef]
- Denancé, N.; Sánchez-Vallet, A.; Goffner, D.; Molina, A. Disease resistance or growth: The role of plant hormones in balancing immune responses and fitness costs. Front. Plant Sci. 2013, 4, 155. [Google Scholar] [CrossRef] [Green Version]
- Pál, M.; Kovács, V.; Vida, G.; Szalai, G.; Janda, T. Changes induced by powdery mildew in the salicylic acid and polyamine contents and the antioxidant enzyme activities of wheat lines. Eur. J. Plant Pathol. 2012, 135, 35–47. [Google Scholar] [CrossRef]
- Han, X.; Kahmann, R. Manipulation of Phytohormone Pathways by Effectors of Filamentous Plant Pathogens. Front. Plant Sci. 2019, 10, 822. [Google Scholar] [CrossRef] [PubMed] [Green Version]
- Walters, D.R.; McRoberts, N. Plants and biotrophs: A pivotal role for cytokinins? Trends Plant Sci. 2006, 11, 581–586. [Google Scholar] [CrossRef] [PubMed]
- Hwang, I.; Sheen, J.; Muller, B. Cytokinin Signaling Networks. Annu. Rev. Plant Boil. 2012, 63, 353–380. [Google Scholar] [CrossRef] [PubMed] [Green Version]
- Vizárová, G. Changes in the Level of Endogenous Cytokinins of Barley during the Development of Powdery Mildew. J. Phytopathol. 1979, 95, 329–341. [Google Scholar] [CrossRef]
- Pogany, M.; Harrach, B.; Bozsó, Z.; Künstler, A.; Janda, T.; von Rad, U.; Vida, G.; Veisz, O. Cold hardening protects cereals from oxidative stress and necrotrophic fungal pathogenesis. Open Life Sci. 2016, 11, 78–85. [Google Scholar] [CrossRef] [Green Version]
- Barna, B.; Smigocki, A.C.; Baker, J.C. Transgenic Production of Cytokinin Suppresses Bacterially Induced Hypersensitive Response Symptoms, and Increases Antioxidative Enzyme Levels in Nicotiana spp. Phytopathology 2008, 98, 1242–1247. [Google Scholar] [CrossRef] [Green Version]
- Ljung, K.; Hull, A.K.; Kowalczyk, M.; Marchant, A.; Celenza, J.; Cohen, J.D.; Sandberg, G. Biosynthesis, conjugation, catabolism, and homeostasis of indole-3-acetic acid in Arabidopsis thaliana. Plant Mol. Boil. 2002, 50, 309–332. [Google Scholar] [CrossRef]
- Yin, C.; Park, J.-J.; Gang, D.R.; Hulbert, S.H. Characterization of a Tryptophan 2-Monooxygenase Gene from Puccinia graminis f. sp. tritici Involved in Auxin Biosynthesis and Rust Pathogenicity. Mol. Plant-Microbe Interact. 2014, 27, 227–235. [Google Scholar] [CrossRef] [Green Version]
- Abdel-Aty, A.S. Fungicidal activity of indole derivatives against some plant pathogenic fungi. J. Pestic. Sci. 2010, 35, 431–440. [Google Scholar] [CrossRef]
- Kulkarni, G.B.; Sanjeevkumar, S.; Kirankumar, B.; SantoshKumar, M.; Karegoudar, T. Indole-3-Acetic Acid Biosynthesis in Fusarium delphinoides Strain GPK, a Causal Agent of Wilt in Chickpea. Appl. Biochem. Biotechnol. 2013, 169, 1292–1305. [Google Scholar] [CrossRef]
- Yang, Y.; Xu, R.; Ma, C.J.; Vlot, A.C.; Klessig, D.F.; Pichersky, E. Inactive Methyl Indole-3-Acetic Acid Ester Can Be Hydrolyzed and Activated by Several Esterases Belonging to the AtMES Esterase Family of Arabidopsis. Plant Physiol. 2008, 147, 1034–1045. [Google Scholar] [CrossRef] [PubMed] [Green Version]
- Pěnčík, A.; Simonovik, B.; Petersson, S.V.; Hényková, E.; Simon, S.; Greenham, K.; Zhang, Y.; Kowalczyk, M.; Estelle, M.; Zazimalova, E.; et al. Regulation of auxin homeostasis and gradients in Arabidopsis roots through the formation of the indole-3-acetic acid catabolite 2-oxindole-3-acetic acid. Plant Cell 2013, 25, 3858–3870. [Google Scholar] [CrossRef] [PubMed] [Green Version]
- González-Lamothe, R.; el Oirdi, M.; Brisson, N.; Bouarab, K. The Conjugated Auxin Indole-3-Acetic Acid–Aspartic Acid Promotes Plant Disease Development. Plant Cell 2012, 24, 762–777. [Google Scholar] [CrossRef] [PubMed]
- Kramer, E.M.; Ackelsberg, E.M. Auxin metabolism rates and implications for plant development. Front. Plant Sci. 2015, 6, 150. [Google Scholar] [CrossRef] [Green Version]
- Ludwig-Müller, J.; Epstein, E.; Hilgenberg, W. Auxin-conjugate hydrolysis in Chinese cabbage: Characterization of an amidohydrolase and its role during infection with clubroot disease. Physiol. Plant. 1996, 97, 627–634. [Google Scholar] [CrossRef]
- Gamir, J.; Pastor, V.; Cerezo, M.; Flors, V. Identification of indole-3-carboxylic acid as mediator of priming against Plectosphaerella cucumerina. Plant Physiol. Biochem. 2012, 61, 169–179. [Google Scholar] [CrossRef]
- Reinecke, D.M. 4-Chloroindole-3-acetic acid and plant growth. Plant Growth Regul. 1999, 27, 3–13. [Google Scholar] [CrossRef]
- Chanclud, E.; Morel, J.-B. Plant hormones: A fungal point of view. Mol. Plant Pathol. 2016, 17, 1289–1297. [Google Scholar] [CrossRef]
- De Vleesschauwer, D.; van Buyten, E.; Satoh, K.; Balidion, J.; Mauleon, R.; Choi, I.-R.; Vera-Cruz, C.; Kikuchi, S.; Höfte, M. Brassinosteroids antagonize gibberellin- and salicylate-mediated root immunity in rice. Plant Physiol. 2012, 158, 1346–1833. [Google Scholar] [CrossRef] [Green Version]
- Bosch, M.; Wright, L.; Gershenzon, J.; Wasternack, C.; Hause, B.; Schaller, A.; Stintzi, A. Jasmonic acid and its precursor 12-oxophytodienoic acid control different aspects of constitutive and induced herbivore defenses in tomato. Plant Physiol. 2014, 166, 396–410. [Google Scholar] [CrossRef] [Green Version]
- Guerreiro, A.; Figueiredo, J.; Silva, M.S.; Figueiredo, A. Linking Jasmonic Acid to Grapevine Resistance against the Biotrophic Oomycete Plasmopara viticola. Front. Plant Sci. 2016, 7, 103. [Google Scholar] [CrossRef] [PubMed] [Green Version]
- Hadi, M.R.; Balali, G.R. The effect of salicylic acid on the reduction of Rizoctonia solani damage in the tubers of marfona potato cultivar. Am-Euras. J. Agric. Environ. Sci. 2010, 7, 492–496. [Google Scholar]
- Silverman, P.; Seskar, M.; Kanter, D.; Schweizer, P.; Métrauz, J.-P.; Raskin, I. Salicylic-acid in rice—Biosynthesis, conjugation, and possible role. Plant Physiol. 1995, 108, 633–639. [Google Scholar] [CrossRef] [Green Version]
- Patkar, R.N.; I Benke, P.; Qu, Z.; Chen, Y.Y.C.; Yang, F.; Swarup, S.; Naqvi, N.I. A fungal monooxygenase-derived jasmonate attenuates host innate immunity. Nat. Methods 2015, 11, 733–740. [Google Scholar] [CrossRef] [PubMed]
- Schuman, M.C.; Meldau, S.; Gaquerel, E.; Diezel, C.; McGale, E.; Greenfield, S.; Baldwin, I.T. The Active Jasmonate JA-Ile Regulates a Specific Subset of Plant Jasmonate-Mediated Resistance to Herbivores in Nature. Front. Plant Sci. 2018, 9, 787. [Google Scholar] [CrossRef] [PubMed] [Green Version]
- Burla, B.; Pfrunder, S.; Nagy, R.; Francisco, R.D.B.; Lee, Y.; Martinoia, E. Vacuolar transport of abscisic acid glucosyl ester is mediated by ATP-binding cassette and proton-antiport mechanisms in Arabidopsis. Plant Physiol. 2013, 163, 1446–1458. [Google Scholar] [CrossRef] [PubMed] [Green Version]
- Chen, Y.-J.; Perera, V.; Christiansen, M.W.; Holme, I.B.; Gregersen, P.; Grant, M.; Collinge, D.B.; Lyngkjær, M.F. The barley HvNAC6 transcription factor affects ABA accumulation and promotes basal resistance against powdery mildew. Plant Mol. Boil. 2013, 83, 577–590. [Google Scholar] [CrossRef]
- Gururani, M.; Mohanta, T.K.; Bae, H. Current Understanding of the Interplay between Phytohormones and Photosynthesis under Environmental Stress. Int. J. Mol. Sci. 2015, 16, 19055–19085. [Google Scholar] [CrossRef] [Green Version]
- Huckelhoven, R.; Trujillo, M.; Kogel, K.-H. Mutations in Ror1 and Ror2 genes cause modification of hydrogen peroxide accumulation in mlo-barley under attack from the powdery mildew fungus. Mol. Plant Pathol. 2000, 1, 287–292. [Google Scholar] [CrossRef]
- Janeczko, A.; Dziurka, M.; Gullner, G.; Kocurek, M.; Rys, M.; Saja, D.; Skoczowski, A.; Tóbiás, I.; Kornas, A.; Barna, B. Comparative studies of compatible and incompatible pepper-Tobamovirus interactions and the evaluation of effects of 24-epibrassinolide. Photosynthetica 2018, 56, 763–775. [Google Scholar] [CrossRef] [Green Version]
- Gitelson, A.A.; Zur, Y.; Chivkunova, O.B.; Merzlyak, M.N. Assessing Carotenoid Content in Plant Leaves with Reflectance Spectroscopy. Photochem. Photobiol. 2002, 75, 272. [Google Scholar] [CrossRef]
- Strasser, R.J.; Srivastava, A.; Tsimilli-Michael, M. The fluorescence transient as a tool to characterize and screen photosynthetic samples. In Probing Photosynthesis: Mechanisms, Regulation and Adaptation; Yunus, M., Pathre, U., Mohanty, P., Eds.; Taylor and Francis: London, UK, 2000; pp. 445–483. [Google Scholar]
- Dziurka, M.; Janeczko, A.; Juhász, C.; Gullner, G.; Oklestkova, J.; Novak, O.; Saja, D.; Skoczowski, A.; Tóbiás, I.; Barna, B. Local and systemic hormonal responses in pepper leaves during compatible and incompatible pepper-tobamovirus interactions. Plant Physiol. Biochem. 2016, 109, 355–364. [Google Scholar] [CrossRef] [PubMed]
- Dobrev, P.I.; Kamínek, M. Fast and efficient separation of cytokinins from auxin and abscisic acid and their purification using mixed-mode solid-phase extraction. J. Chromatogr. A 2002, 950, 21–29. [Google Scholar] [CrossRef]


© 2020 by the authors. Licensee MDPI, Basel, Switzerland. This article is an open access article distributed under the terms and conditions of the Creative Commons Attribution (CC BY) license (http://creativecommons.org/licenses/by/4.0/).
Share and Cite
Saja, D.; Janeczko, A.; Barna, B.; Skoczowski, A.; Dziurka, M.; Kornaś, A.; Gullner, G. Powdery Mildew-Induced Hormonal and Photosynthetic Changes in Barley Near Isogenic Lines Carrying Various Resistant Genes. Int. J. Mol. Sci. 2020, 21, 4536. https://0-doi-org.brum.beds.ac.uk/10.3390/ijms21124536
Saja D, Janeczko A, Barna B, Skoczowski A, Dziurka M, Kornaś A, Gullner G. Powdery Mildew-Induced Hormonal and Photosynthetic Changes in Barley Near Isogenic Lines Carrying Various Resistant Genes. International Journal of Molecular Sciences. 2020; 21(12):4536. https://0-doi-org.brum.beds.ac.uk/10.3390/ijms21124536
Chicago/Turabian StyleSaja, Diana, Anna Janeczko, Balázs Barna, Andrzej Skoczowski, Michał Dziurka, Andrzej Kornaś, and Gábor Gullner. 2020. "Powdery Mildew-Induced Hormonal and Photosynthetic Changes in Barley Near Isogenic Lines Carrying Various Resistant Genes" International Journal of Molecular Sciences 21, no. 12: 4536. https://0-doi-org.brum.beds.ac.uk/10.3390/ijms21124536