Functional Expression of Adenosine A3 Receptor in Yeast Utilizing a Chimera with the A2AR C-Terminus


1
Department of Chemical and Biomolecular Engineering, Tulane University, 6823 St Charles Ave, New Orleans, LA 70118, USA
2
Department of Chemical Engineering, Carnegie Mellon University, 5000 Forbes Ave, Pittsburgh, PA 15213, USA
*
Author to whom correspondence should be addressed.
Int. J. Mol. Sci. 2020, 21(12), 4547; https://0-doi-org.brum.beds.ac.uk/10.3390/ijms21124547
Submission received: 7 June 2020
/
Revised: 21 June 2020
/
Accepted: 24 June 2020
/
Published: 26 June 2020
(This article belongs to the Special Issue Targeting the Untargeted Proteome: From Structure-Based Inhibitor Discovery to Chemical Biology and Beyond)
Abstract
:The adenosine A3 receptor (A3R) is the only adenosine receptor subtype to be overexpressed in inflammatory and cancer cells and therefore is considered a novel and promising therapeutic target for inflammatory diseases and cancer. Heterologous expression of A3R at levels to allow biophysical characterization is a major bottleneck in structure-guided drug discovery efforts. Here, we apply protein engineering using chimeric receptors to improve expression and activity in yeast. Previously we had reported improved expression and trafficking of the chimeric A1R variant using a similar approach. In this report, we constructed chimeric A3/A2AR comprising the N-terminus and transmembrane domains from A3R (residues 1–284) and the cytoplasmic C-terminus of the A2AR (residues 291–412). The chimeric receptor showed approximately 2-fold improved expression with a 2-fold decreased unfolded protein response when compared to wild type A3R. Moreover, by varying culture conditions such as initial cell density and induction temperature a further 1.7-fold increase in total receptor yields was obtained. We observed native-like coupling of the chimeric receptor to Gai-Gpa1 in engineered yeast strains, activating the downstream, modified MAPK pathway. This strategy of utilizing chimeric receptor variants in yeast thus provides an exciting opportunity to improve expression and activity of “difficult-to-express” receptors, expanding the opportunity for utilizing yeast in drug discovery.
1. Introduction
The adenosine A3R was the last of the four subtypes to be discovered and was the only subtype that was deorphanized after clone identification [1]. The receptor is expressed in multiple human organs including lung, kidney and brain, and interestingly, A3R expression is upregulated in cancers and inflammatory conditions [2,3,4]. As adenosine levels also increase in these conditions/diseases, therapeutic intervention targeting A3R offers promising treatment potential [5]. Until recently, because of the “two-fold nature of A3R signaling”, understanding whether activation of the receptor provided protective or harmful effect was a major challenge for therapeutic development [1]. Currently, clinical trials for treatment of rheumatoid arthritis, plaque psoriasis, non-alcoholic steatohepatitis and hepatocellular carcinoma via agonist targeting of the A3 receptors is underway [6,7,8,9,10]. Structure-guided drug discovery will further aid in understanding of the receptor and developing highly selective drugs that minimize adverse events [6,11].
The yeast S. cerevisiae is a microbial eukaryotic host uniquely positioned to produce functional GPCRs and to characterize downstream signaling. For example, functional GPCRs have been purified from S. cerevisiae [12,13,14] and human GPCRs can signal upon ligand binding via an engineered MAPK response pathway [15,16,17] enabling identification of novel drug candidates [18]. In addition, yeast have been utilized to study GPCR-Gα protein interactions [19,20] and the effect of receptor dimerization on signaling responses [21].
Receptor–receptor chimeras have been utilized to investigate the role of domains in ligand recognition, Gα protein and β-arrestin binding events, and subsequent signaling responses [22,23]. The ligand binding or downstream signaling activity of A3R in yeast has been tested previously, but with no measurable activity [24,25]. The adenosine A2A receptor (A2AR) shows exceptional expression and trafficking to the plasma membrane in yeast [14,24], unlike its closely related family member A3R. In this report, we utilize chimeric receptor protein engineering to produce active A3R receptor in yeast. Previously, we have observed improved trafficking to the plasma membrane, and improved yields of native-like active receptor for A1R chimeric receptor variants by utilizing the A2AR C-terminus [26]. Similarly, by using a human/rat chimeric tachykinin 2 receptor, we observed improved functional levels of the receptor in yeast [27]. Here, we employ a similar strategy to improve the expression and obtain active receptor for A3R variants.
2. Results
2.1. Construction of an A3/A2AR Chimera to Aid in Receptor Expression
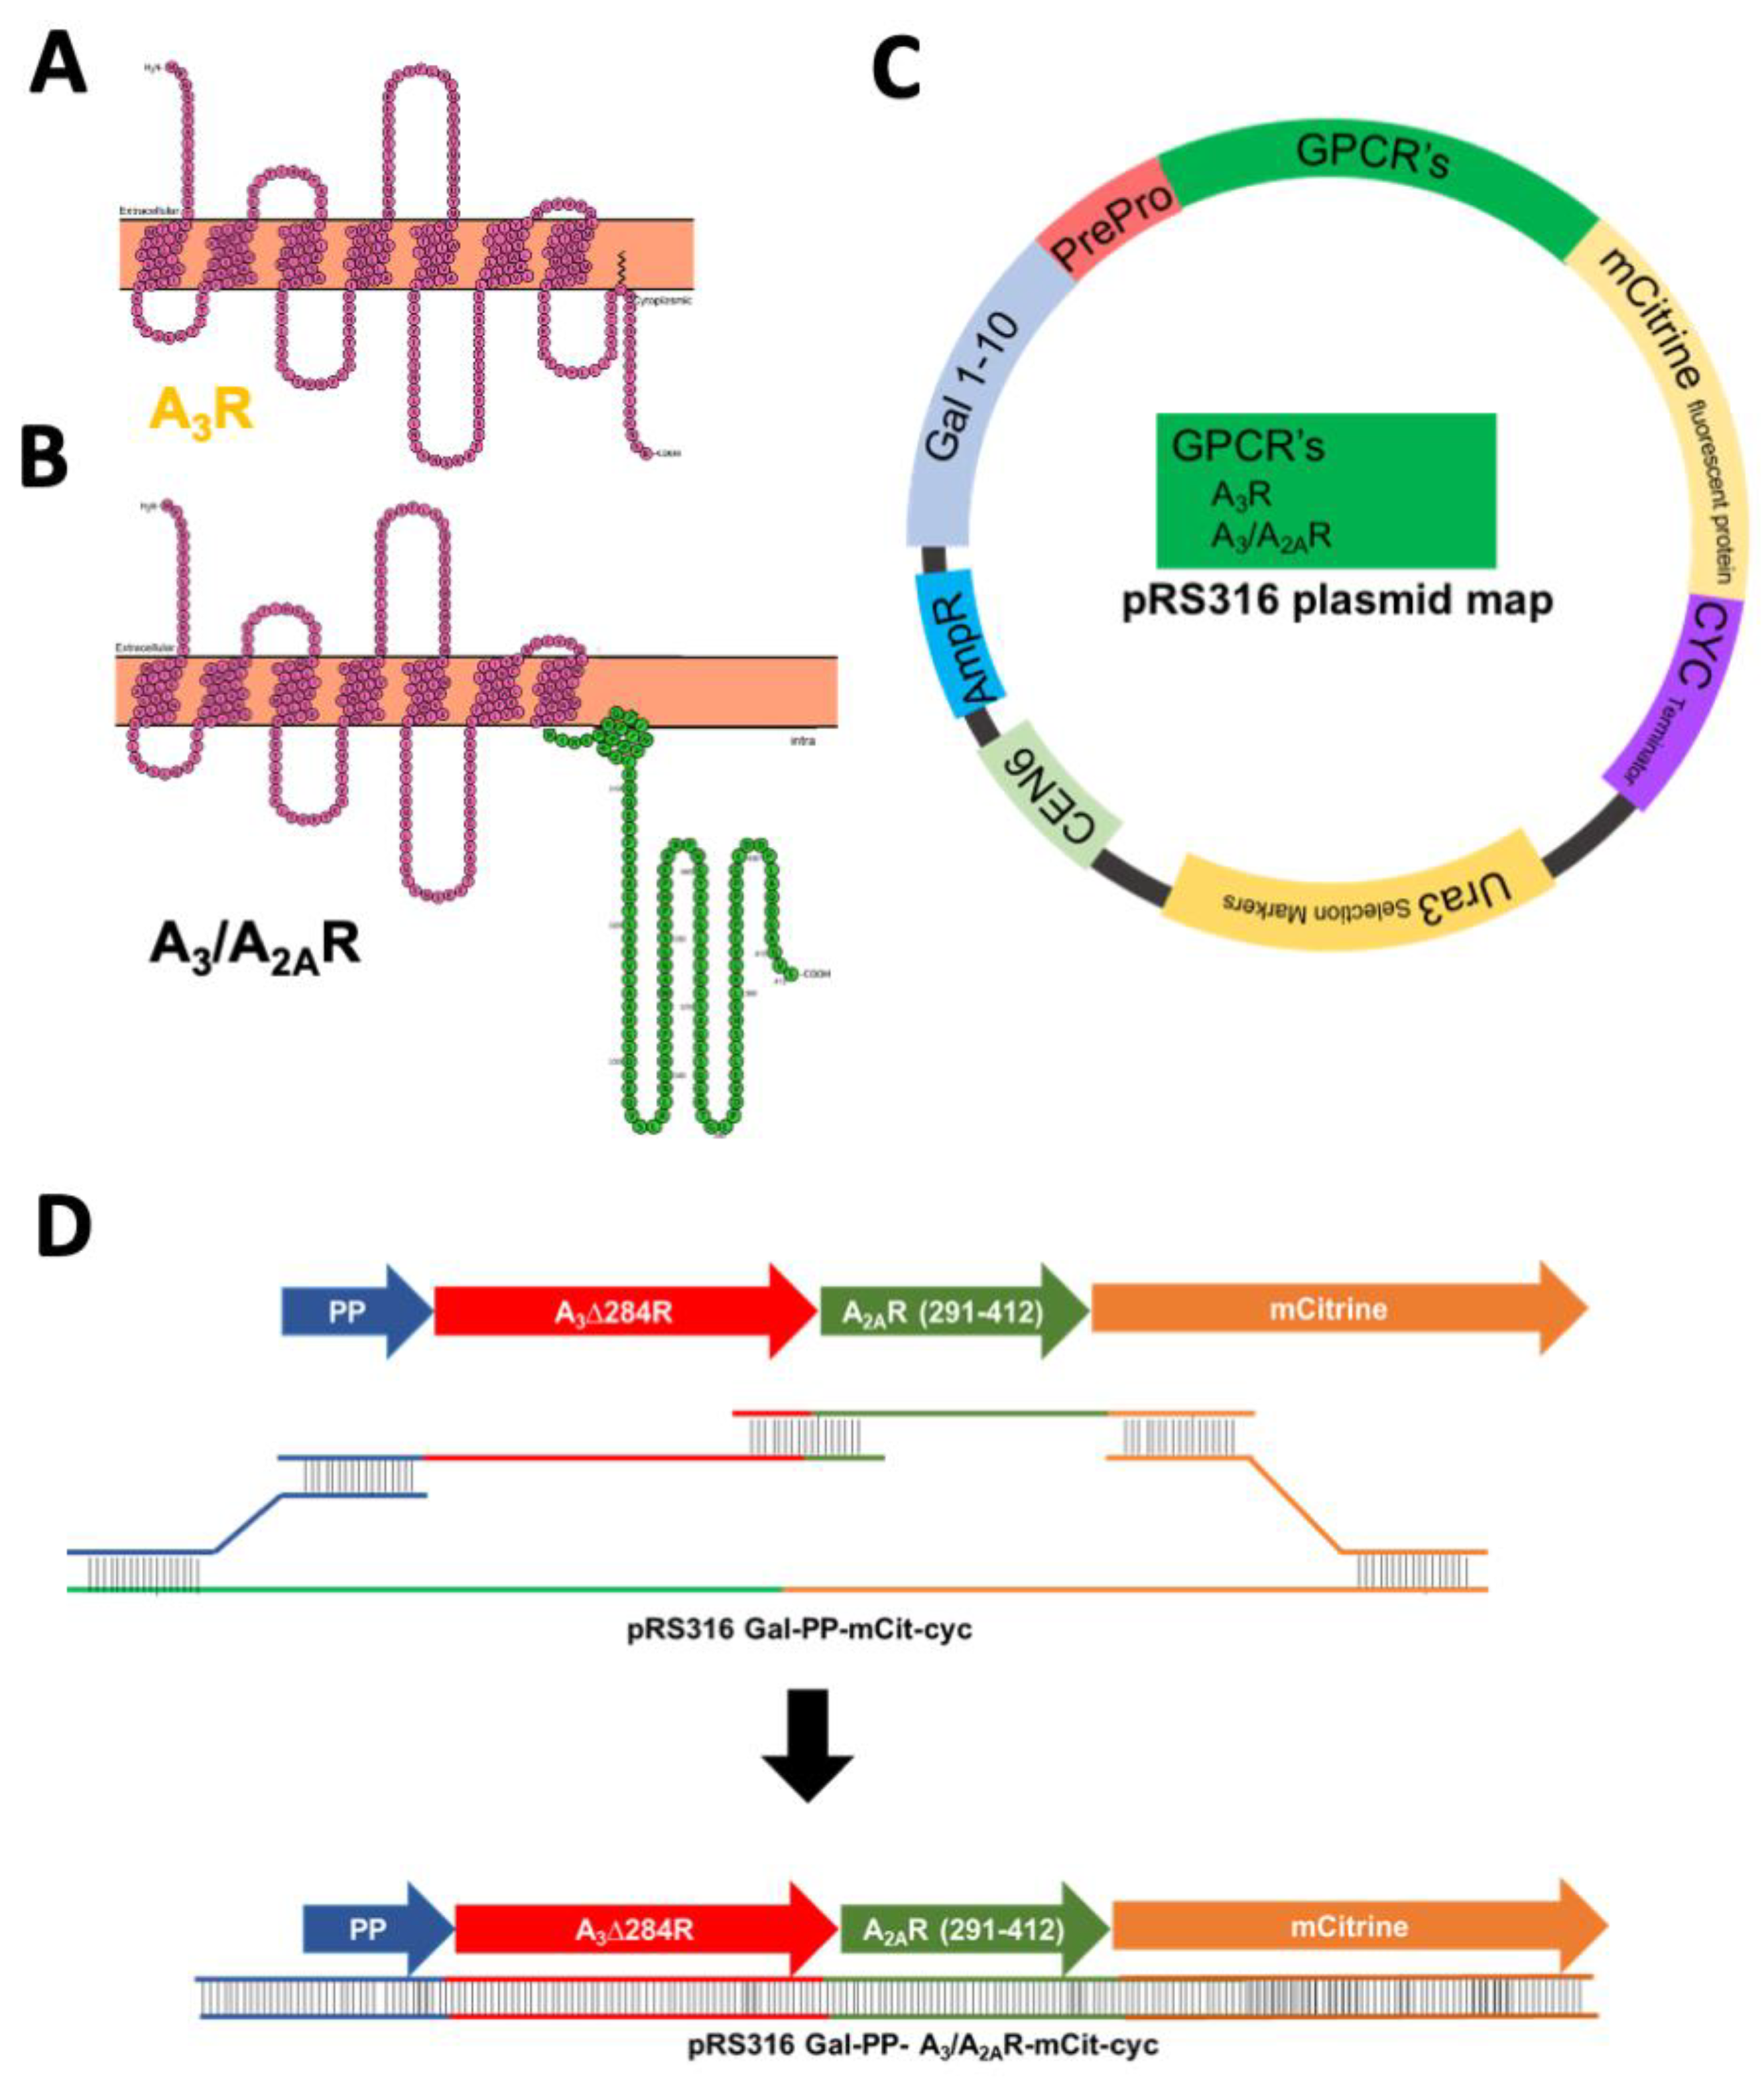
Recombinant expression of the human A3R in yeast has previously resulted in protein that is incapable of binding to its ligand or producing downstream activation [24,25]. On the other hand, the adenosine A2AR shows exceptional expression and efficient trafficking to the plasma membrane in yeast [24]. Furthermore, active A2AR has been purified from yeast and utilized for resolving a high-resolution crystal structure [28]. Other adenosine receptors A1R, A3R, and A2BR, do not show this proper trafficking in yeast, though they are membrane-integrated [24]. One major difference between A2AR and other adenosine receptor subtypes is the remarkably long cytoplasmic carboxy-terminus (C-terminus) of 120 amino acids. We hypothesize that this long A2AR C-terminus contains motifs that aid in efficient active receptor expression. Notably, for example, the C-terminus of A2AR contains two D/E-X-D/E motifs (located at residues 330 and 382) that would facilitate interaction with the COPII endoplasmic reticulum exit machinery [29], which is absent in A3R (Figure S1). Previously, a similar A1/A2AR chimera of A1R (1–290) and A2AR C-terminus (291–412) showed improved total and functional yields in yeast [26]. Note that both A1R and A2AR contain an arginine residue at 291. Although A3R contains a palmitoylation site at position 303, a similar site is present in A1R and was not included in that design, without negative impact. Therefore, to utilize these motifs and any other potential positive interactions from the A2AR C-terminus we constructed a chimeric A3/A2AR containing the N-terminus and transmembrane domains of A3R (residues 1–284) and the cytoplasmic A2AR C-terminal tail (291–412, Figure 1A,B). It should be noted that the chimeric variant was designed to contain helix 8 of A2AR.
The wild-type and chimeric receptor variants were assembled in yeast expression plasmids via homologous recombination (Figure 1C,D). To minimize the effect of plasmid copy number variation on the analysis of receptor expression, a CEN-ARS episomal centromeric plasmid (pRS316) was utilized as a template [30]. The strong, inducible galactose promoter GAL1–10 was used to express the receptor variants [31]. A leader peptide was added before the amino-terminus (N-terminus) of each receptor to aid in endoplasmic reticulum targeting of the GPCR [32]. Furthermore, each receptor expression construct contained a C-terminal mCitrine fluorescent protein to facilitate detection of receptor expression and trafficking. As homologous recombination with overlapping sequences was utilized to assemble the receptor variants in the plasmid, no linker was required between the leader peptide and the receptor, and the receptor and the mCitrine fluorescent protein.
2.2. Improved Expression Using the Chimeric A3/A2AR
Yeast cells were transformed with pRS316 vectors containing the A3 receptor variants, as described in Materials and Methods. Receptor expression was induced by growing transformed cells in galactose-containing media. No significant changes in growth were observed in recombinant cells expressing either of two receptor variants—wild-type human A3R and the A3/A2AR chimera. Twenty-four hours after galactose induction, cells expressing C-terminal mCitrine-tagged receptor variants were harvested for Western blot analysis (Figure 2A) to determine receptor expression. Lysates of cells expressing the receptor variants showed a prominent band at the expected MW for the full-length receptor, with no significant degradation products observed. Note that A3/A2AR has a reduced mobility (corresponding to a higher molecular weight of ~55 kDa) than the wild-type A3R (MW ~ 45kDa) due to the addition of the longer A2AR C-terminus. These data indicate that the cells are capable of producing full-length receptor variants and that the mCitrine fluorescence can serve as an appropriate surrogate for monitoring and optimizing receptor expression and tracking receptor trafficking.
Whole cell mCitrine fluorescence was monitored over time as an indirect measure of total receptor yields. The whole cell fluorescence was monitored for 72 h following galactose induction (Figure 2B). Both the wild-type and chimeric variant showed maximal expression at 18 h post galactose induction, but with different maximal fluorescence levels. The chimeric A3/A2AR (~4000 AU) showed approximately two-fold higher maximal mCitrine fluorescence levels than the wild-type receptor (~2050 AU). This higher fluorescence value suggests improved expression of the chimeric receptor as compared to the wild-type A3 receptor. Interestingly, after expression reached its highest value, the chimeric variant showed a slower loss of the chimeric receptor compared with that of the wild-type receptor. The total cellular productivity was determined as the area under the curve from 0 to 72 h. We observed significantly higher productivity for chimeric A3/A2AR 1.8 × 10⁵ AU (1.6–1.9 × 10⁵ AU, 95% CI) as compared with the wild-type A3R 8.0 × 10⁴ AU (7.3–8.8 × 10⁴ AU, 95% CI), representing an over two-fold improvement in total productivity. Taken together, these results for improved and sustained expression of the chimeric variant suggest that the presence of the A2AR C-terminus aids in expression of the receptor and may reduce protein turnover.
2.3. Decreased Unfolded Protein Response for the Chimeric A3/A2AR
The chaperone Kar2p/BiP binds to nascent secretory and membrane proteins as they enter the endoplasmic reticulum (ER) and aids in proper folding (Figure S2). Heterologous protein expression can result in increased cell stress due to the increased protein within the ER, leading to activation of the unfolded protein response (UPR) pathway [33,34,35]. Kar2p/BiP levels are upregulated as part of UPR activation [33,34,35]. We showed previously [24] that cells expressing human A3R had an increased UPR as compared with A2AR. To investigate the effect of chimeric A3/A2AR expression on the unfolded stress response, Kar2p/BiP levels were measured in cells expressing the two A3 receptor variants via Western blot analysis (Figure 3A). Quantification of Western blot results from four biological replicates showed two-fold lower Kar2p/BiP levels in cells expressing the A3/A2AR variant as compared to the wild-type A3 receptor (Figure 3B). This result suggests that the presence of the A2AR C-terminus reduces the UPR stress associated with recombinant receptor expression, possibly contributing to higher receptor expression.
2.4. Increasing Chimeric Receptor Expression by Varying Culture Conditions
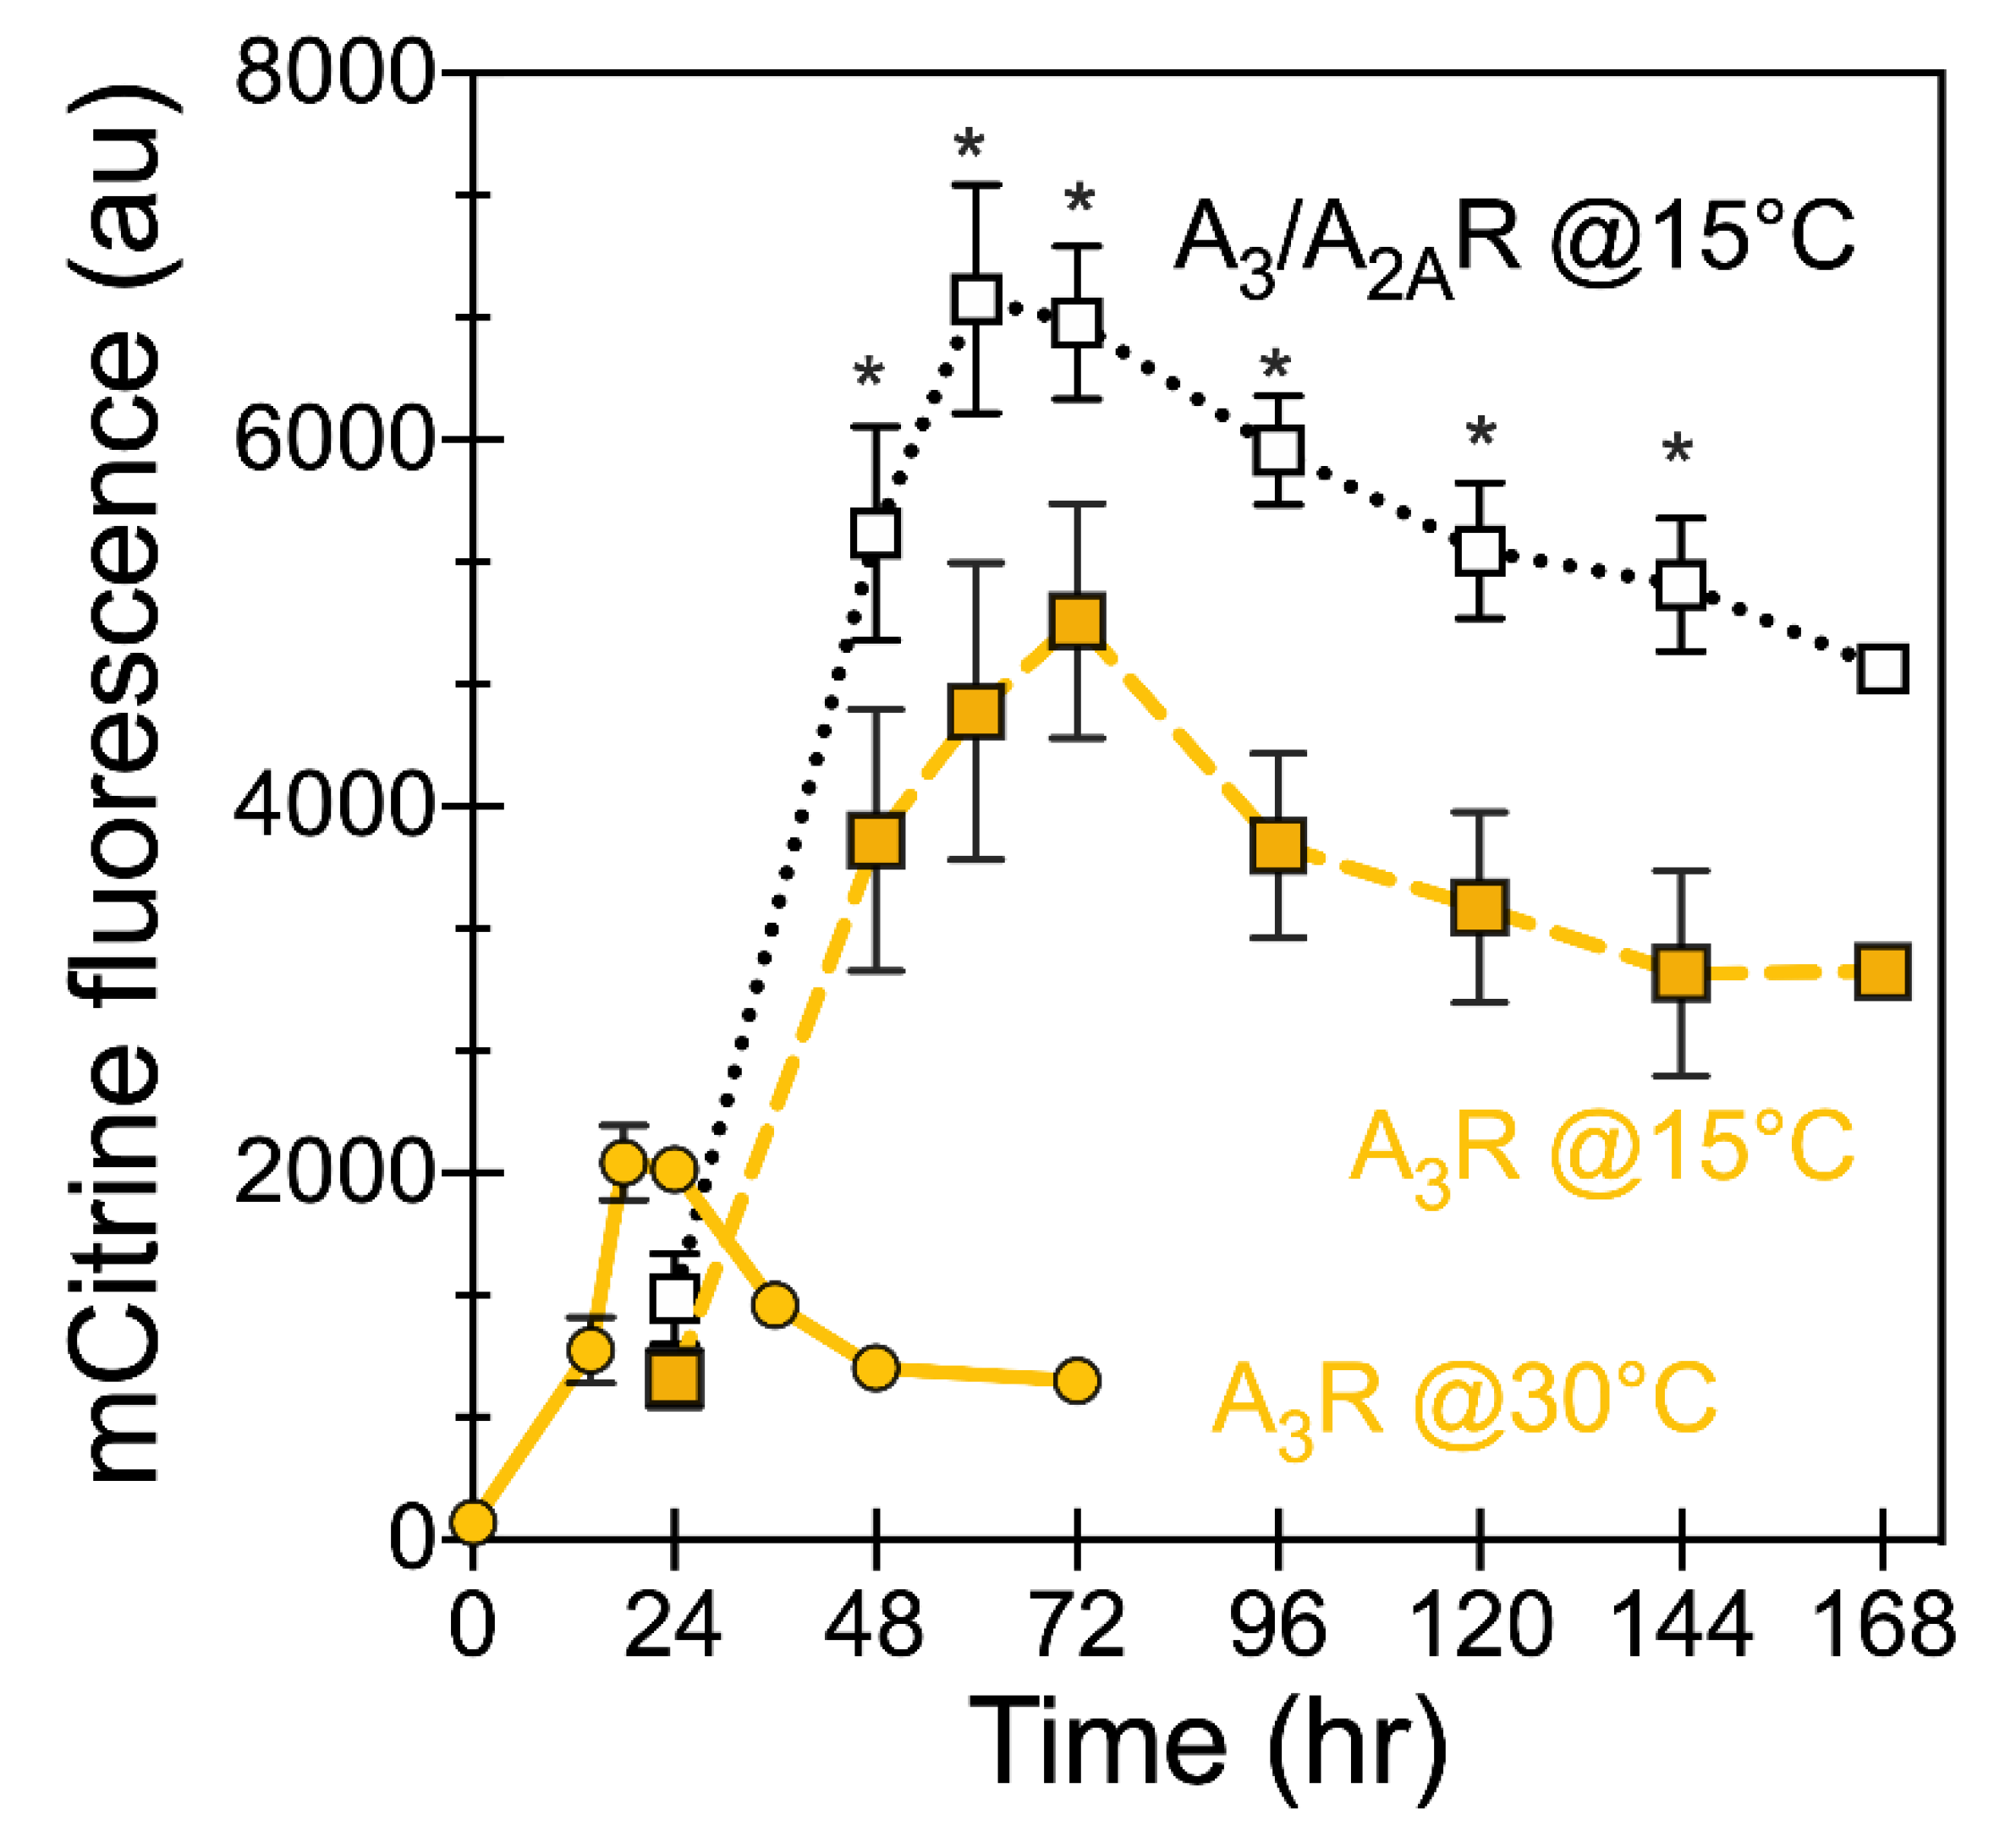
Changes in the culture conditions can lead to further improvement of receptor expression [36,37]. Previously, we have shown that varying the initial cell density at the time of galactose induction and induction temperature during protein expression had a significant impact on the total receptor yields of “difficult-to-express” receptors like A1R [26]. Here, we investigated these conditions for improving total receptor yields of A3/A2AR. Preliminary data showed mCitrine fluorescence levels for both of the receptor variants were approximately 25% higher when expression was induced at a ten-fold higher initial cell density of 5 OD600/mL. We further investigated the impact of lowering the induction temperature from 30 to 15 °C using an initial cell density of 5 OD600/mL on receptor expression (Figure 4, dashed lines). Expression of either of the receptors under these conditions resulted in higher mCitrine fluorescence levels, and the chimeric A3/A2AR showed around 2.4-fold improvement in fluorescent levels as compared with wild-type A3R grown at 15 °C at its highest point (~48 h), and approximately 3.5-fold higher than wild-type A3R grown at 30 °C. The total productivity (over the time course) based on total fluorescence was also higher for the chimera—5.2 × 10⁵ AU (4.6–5.9 × 10⁵ AU 95%CI) for the A3/A2AR as compared with 3.6 × 10⁵ AU (2.7–4.4 × 10⁵ AU, 95% CI) for the wild-type A3R. Interestingly, the A3/A2AR chimera showed a sustained expression at longer times as compared with the wild-type receptor, similar to our observation from induction at 30 °C. Taken together, by utilizing higher initial cell density and lower induction temperature we obtained significantly improved total receptor yields.
2.5. Improved Receptor Trafficking to the Plasma Membrane
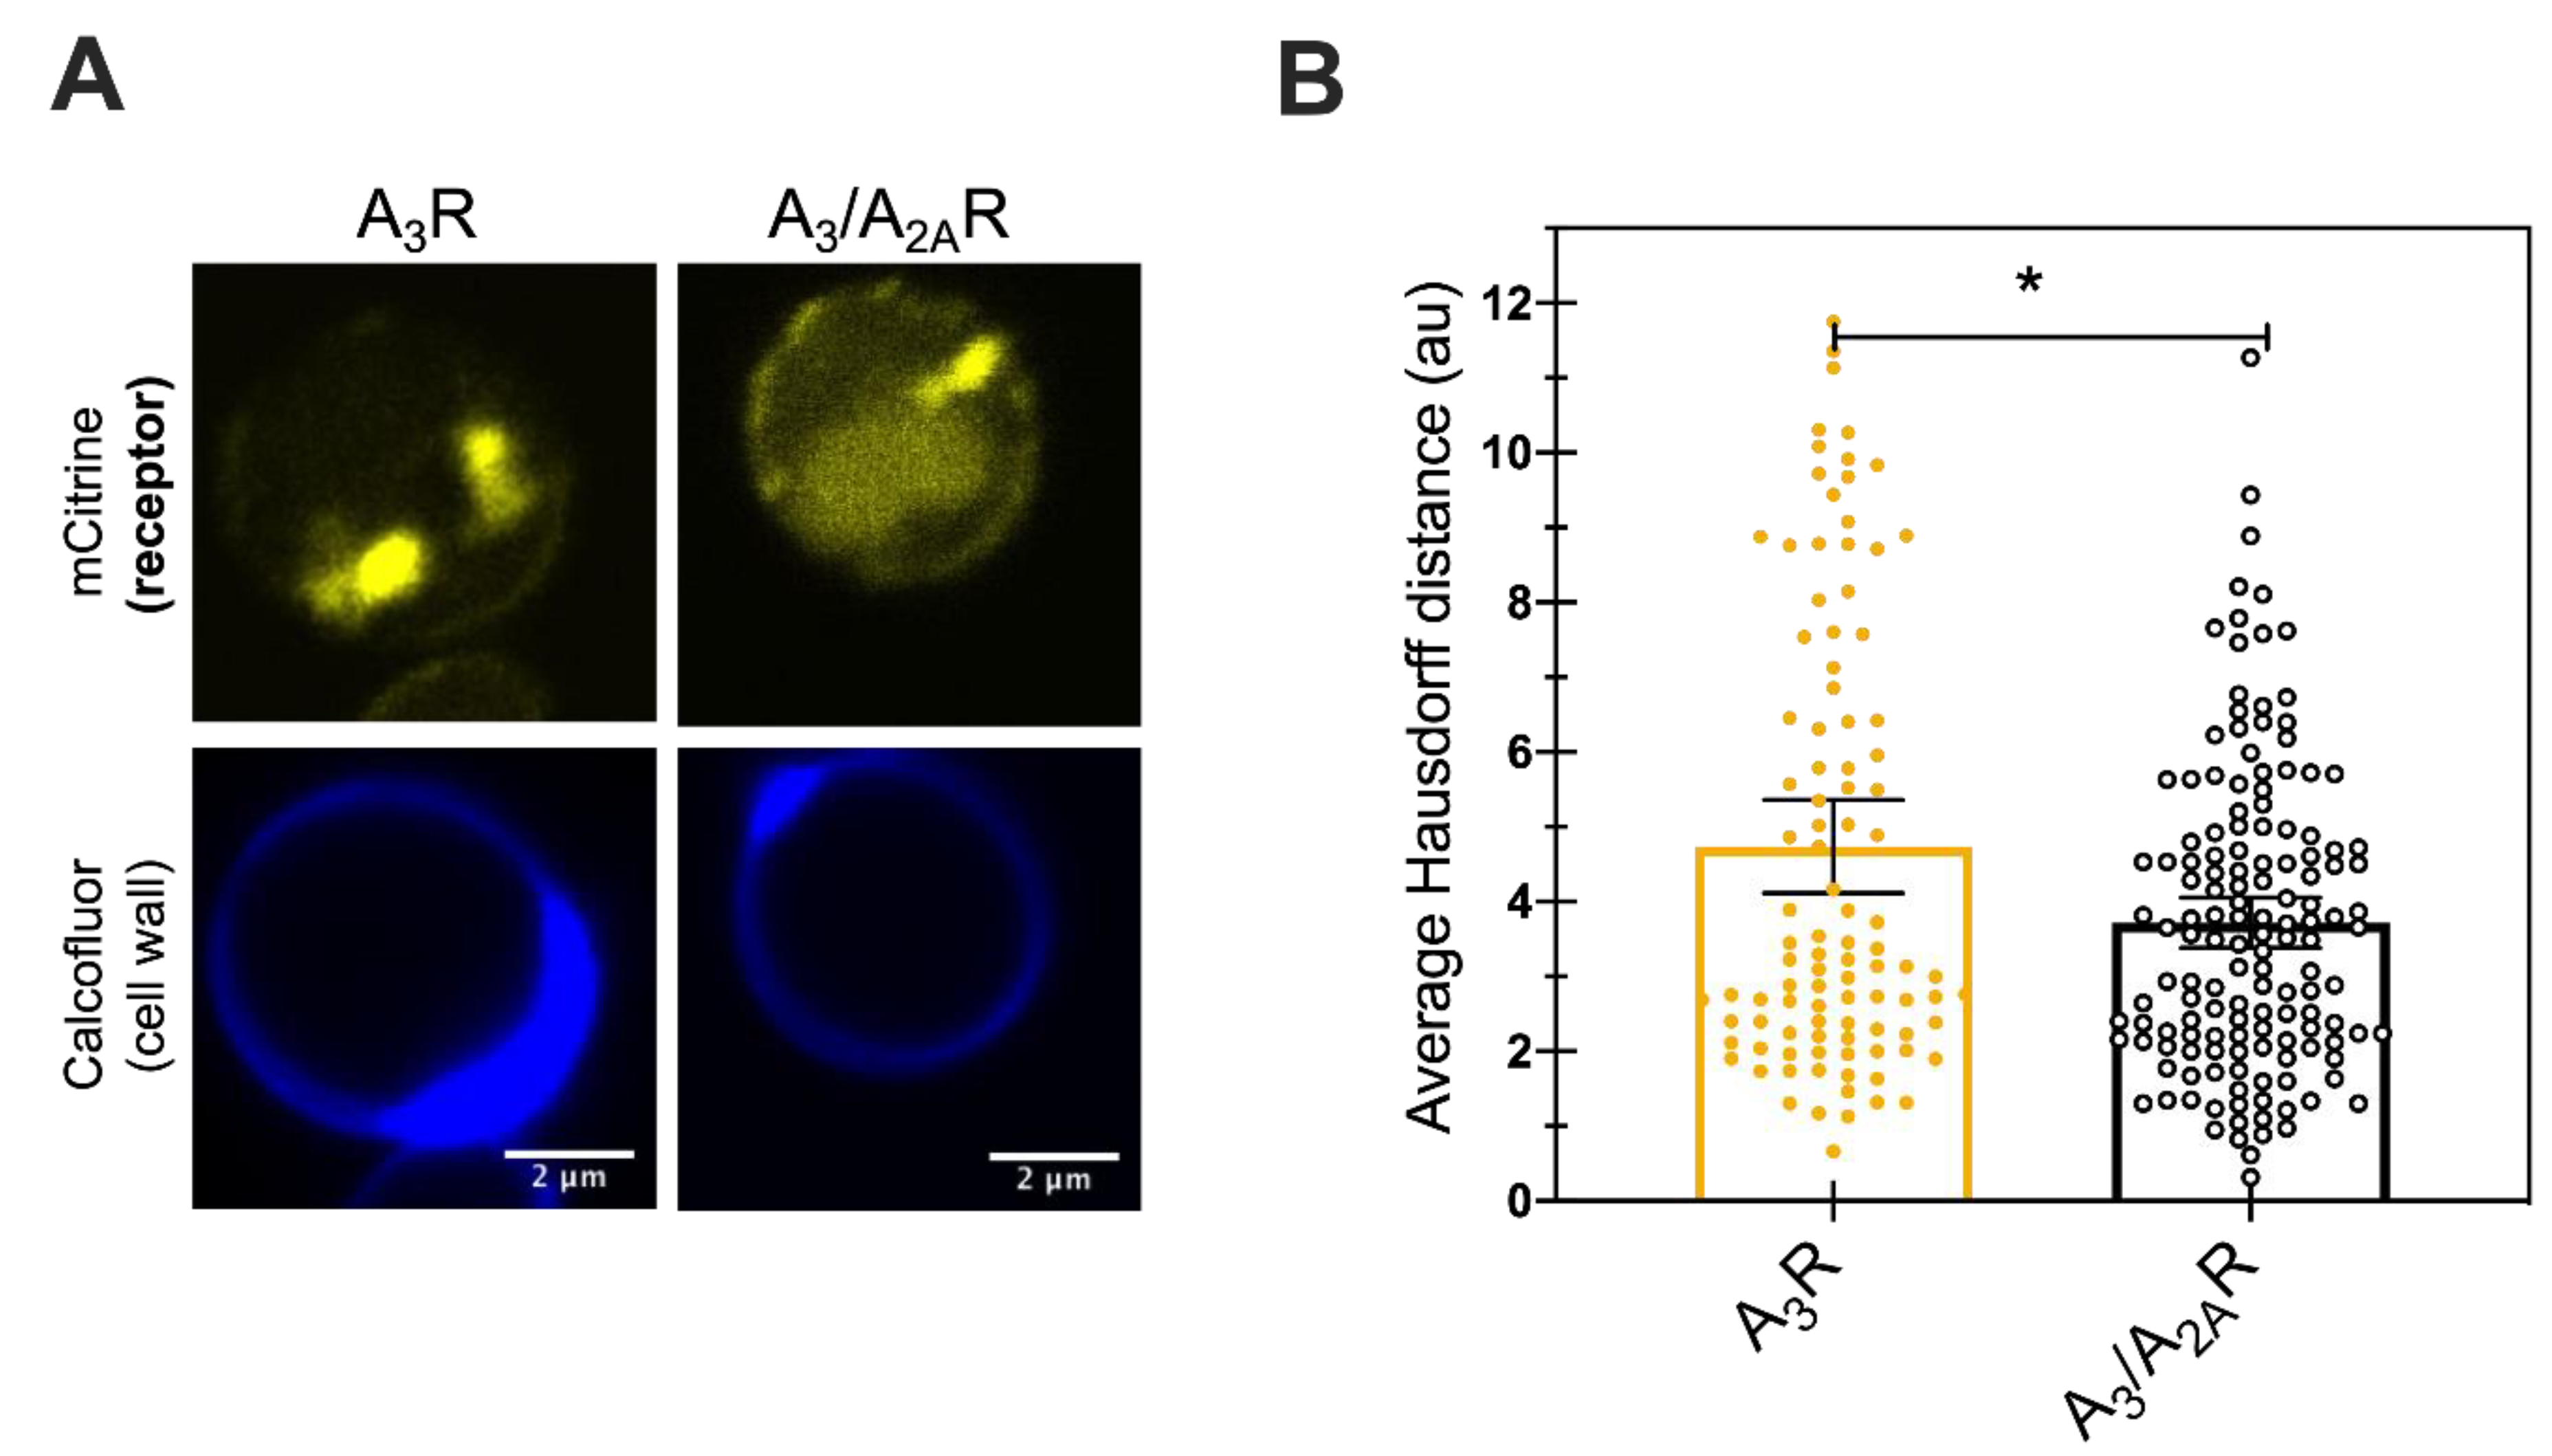
To investigate whether the reduced UPR and improved A3/A2AR expression was a result of improved trafficking of the receptor to the plasma membrane that may be correlated with functional receptor, live cell imaging was performed. Receptor localization within the cells was determined by detecting both mCitrine (as a proxy for the C-terminal mCitrine tagged receptor location) and the fluorescent stain calcofluor, which binds to chitin in the cell wall and helps visualize the cell periphery. Figure 5A shows representative confocal micrographs for cells expressing either of the two receptors. Both showed mCitrine fluorescence predominantly inside the cells with some expression localized near the cell periphery. We quantified the results using an in-house tool that quantifies the average Hausdorff distance for individual cells [38]. The average Hausdorff distance between the pixels of mCitrine and Calcofluor stain for all mCitrine pixels was calculated for more than 100 individual cells (Figure 5B). A small number for the Hausdorff distance indicates a minimal distance between the protein and the cell periphery, indicating efficient plasma membrane trafficking of the receptor. Here, we observed Hausdorff distances of 4.7 (4.1–5.4 AU, 95%CI) for A3R and of 3.7 AU (3.4–4.0 AU, 95% CI) for A3/A2AR. The significantly lower Hausdorff distance for chimeric receptor variant suggests improved trafficking of the receptor to the plasma membrane. Previous studies from our laboratory had reported a Hausdorff distance of less than two arbitrary units for membrane-associated, well-trafficked receptors like A2AR and the yeast mating receptor (Ste2R) [26]. Taken together, this result suggests that the addition of the A2AR C-terminus improved receptor trafficking, but that there is still room for further improvement in the plasma membrane trafficking of the receptors.
2.6. Chimeric A3/A2A Receptor Was Capable of Downstream Signaling Activity in Yeast
To test whether the receptor chimeras were capable of producing native-like downstream signaling, engineered yeast strains were utilized. Yeast contains a native GPCR-mediated MAPK pheromone response pathway that has been modified to study the downstream signaling behavior of human receptors [17,39]. To obtain the proper interaction of mammalian GPCRs with the yeast Gα protein (Gpa1p), these cells express a hybrid yeast/human Gα protein. These hybrid Gα proteins contain five amino acid residues from the relevant human Gα protein that enables them to couple with a human GPCR [17,39]. Further modification was performed on these strains to obtain an easily measurable fluorescence-based response as previously described [40]. These modified strains express an mCherry fluorescent protein under control of the Fus1 promoter, which is upregulated upon receptor activation by ligand binding. Therefore, an increase in mCherry fluorescence serves as an downstream reporter of ligand-mediated receptor activation.
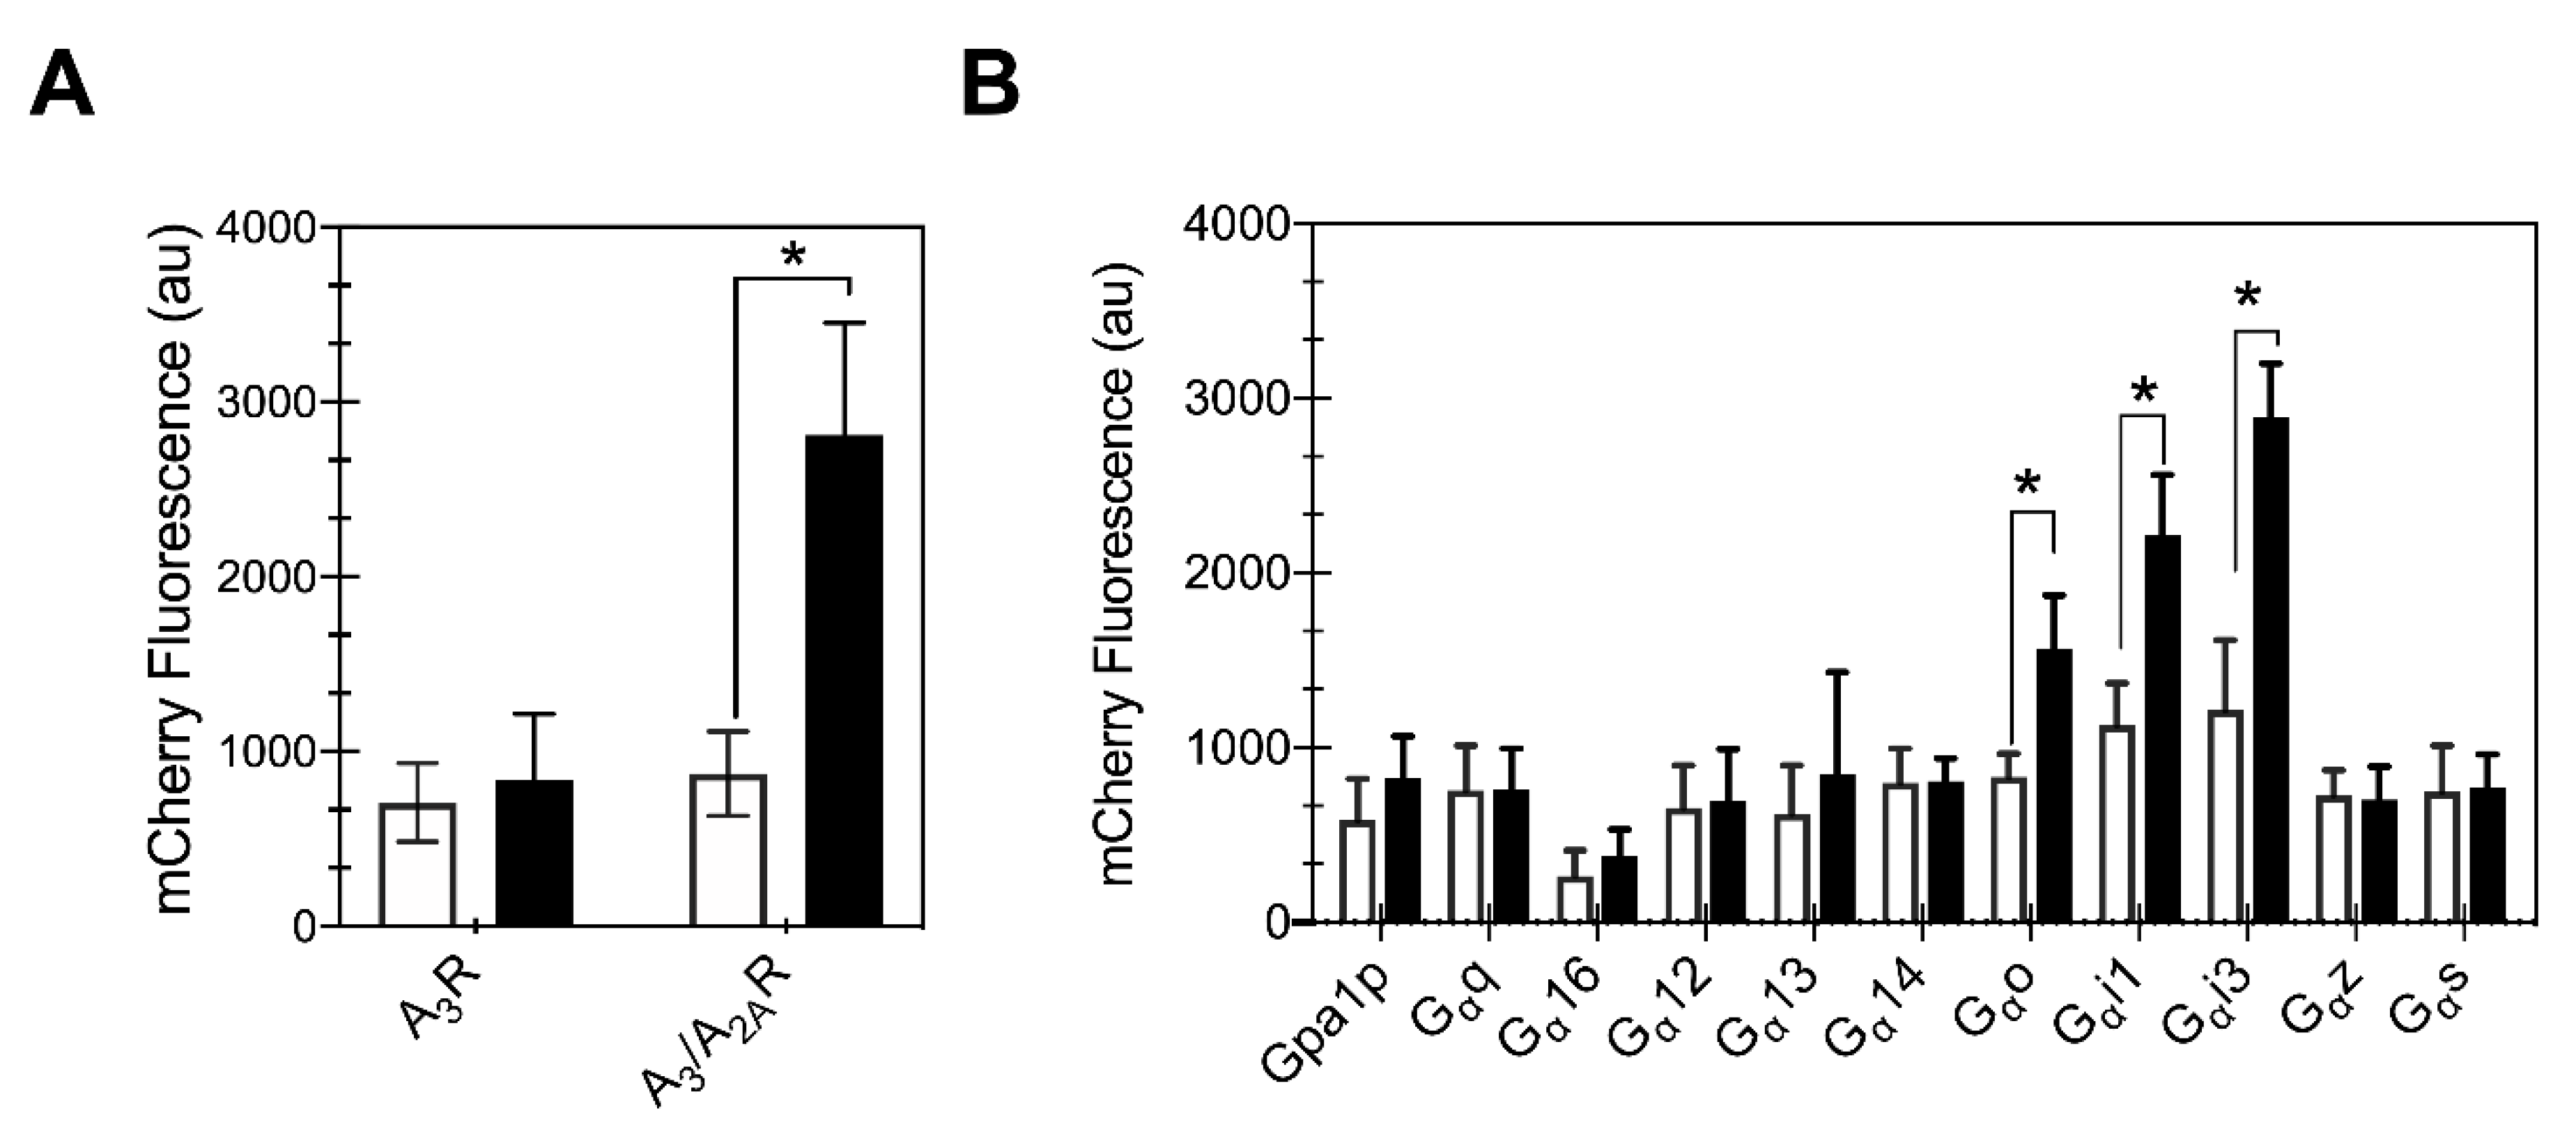
Activation of A3R in mammalian cells results in a decrease in cyclic adenosine monophosphate (cAMP) levels via its interaction with inhibitory Gαi/o proteins. Consequently, a strain expressing the yeast/human Gαi1 protein (CY13393) was utilized to study the downstream signaling response of the receptors. After 24 h of galactose induction, cells expressing either of the two receptors were stimulated by addition of 100 μM 5′-N-ethylcarboxamidoadenosine (NECA), a high affinity non-selective adenosine receptor agonist, and whole cell mCherry fluorescence was measured (Figure 6A). As a control to determine basal activation, cells were exposed to an equivalent volume of DMSO. The A3/A2AR chimera showed a significant increase in mCherry fluorescence in agonist-treated cells compared to the DMSO control (p < 0.01, Student’s t-test), while wild-type A3R showed no increase in mCherry fluorescence relative to the DMSO control. This result for wild-type receptor is consistent with a previous study that reported that A3R was incapable of producing downstream signaling in yeast [25]. The A3/A2AR chimera activation of downstream signaling suggests that the presence of A2AR C-terminus aids trafficking of folded receptor that is competent to bind to the ligand and produce native-like downstream signaling.
2.7. Chimeric Receptor Shows Preferential Coupling with the Inhibitory Gα Protein Family
To determine whether the chimeric receptor signaling in yeast reflects the G protein binding preferences of the native A3 receptor in mammalian cells, we tested the A3/A2AR chimera activity in a set of 11 yeast strains representing the GPCR-Gα interaction landscape (Table 1). The A3/A2AR chimera showed a ligand-mediated mCherry fluorescence in strains expressing hybrid Gαo, Gαi1 and Gαi3 proteins, i.e., the inhibitory Gα protein subtypes (Figure 6B). Note that the ligand-mediated Gαi1-related response for MMY23 is slightly lower than that reported for the CY13393 (Figure 6A,B), as this set of strains shows overall lower activation, but enables effective comparison of different Gα proteins. We have previously described the specificity of A2AR coupling in yeast to Gαs protein, and the promiscuous Gαz, which is consistent with previous reports from Knight et al. [18]. Interestingly, we did not observe increased mCherry fluorescence in cells expressing hybrid Gαs protein, as might be expected if the C-terminus of A2AR C-terminus affected the coupling specificity of the chimeric receptor. Taken together, we find that the chimeric A3/A2AR has native-like downstream coupling preferences for the Gα proteins.
3. Discussion
Obtaining high levels of A3R expression has been a major bottleneck for biophysical characterization and high-resolution crystallography. Previously, we utilized chimeric protein engineering of A1R in yeast to improve the secretory trafficking and obtained higher active receptor yields. Here, a similar strategy was utilized to improve the expression of surface localized and functional A3R. We observed that the A3/A2AR chimera had improved total receptor yields (approximately 2-fold higher) with reduced UPR stress as compared with wild-type A3R expression. The A3/A2AR chimera showed sustained expression, similar to our previous studies of A1/A2AR, suggesting the A2AR C-terminus may aid in reducing protein turnover [26], by an as yet unknown mechanism. The A3/A2AR chimera showed improved trafficking to the plasma membrane as compared with the wild-type A3 receptor. Surprisingly, both the A3/A2AR chimera and wild-type A3R showed inefficient receptor trafficking to the cell surface, as most of the receptor appeared to be localized inside the cells compared to the well trafficked A2AR described previously [24]. This was unexpected as our previous studies of A1/A2AR and A2B/A2AR showed improved receptor localization at the plasma membrane [26,41].
Further improvement in total receptor yields was achieved by varying culture conditions such as initial cell density and induction temperature. Receptor expression via the galactose promoter depends on the galactose level in the media. As the cells utilize galactose as a carbon and energy source, galactose is consumed during growth and its level drops over the culture time-course. Therefore, starting with higher initial cell density can result in higher protein yields [26]. Here, we observed a similar increase in total receptor yields when starting at a higher cell density (5 OD600/mL as compared to 0.5 OD600/mL). Moreover, lowering the induction temperature to 15 °C resulted in a further improvement of total yields, which is consistent with previous reports where similar improvements were observed for membrane proteins including GPCRs [36,42]. Overall, these changes in culture conditions combined with protein engineering resulted in a greater than four-fold higher receptor yield compared with wild-type A3R.
Downstream signaling of adenosine receptors A1R, A2AR and A2BR in yeast has been studied extensively [18,19,43,44,45]. To date, the downstream signaling of A3R has never been observed in yeast, which has been attributed primarily to inactivity of the recombinantly expressed receptor [24,25]. To the best of our knowledge, this is the first study to report active A3R, as observed by downstream signaling activation in the engineered yeast, which provides an exciting opportunity to screen for novel ligands targeting the A3R in the microbial yeast system.
4. Materials and Methods
4.1. Cell and Culture Conditions
Saccharomyces cerevisiae strains used in this study are summarized in Table 1. BY4741 (MATa his3Δ1 leu2Δ0 met15Δ0 ura3Δ0) was used for protein expression and trafficking experiments. Engineered yeast strains were obtained from Simon Dowell (Glaxo Smith Kline, Stevenage, UK) and the Broach laboratory (Pennsylvania State University) and were further modified to study receptor-mediated downstream signaling [40]. The parental yeast strains were grown in YPD media (2% bacto peptone, 2% glucose, 1% yeast extract). Yeast cells were transformed using lithium chloride [43]. After plasmid transformation, cells were grown in synthetic media (2% dextrose (SD) or galactose (SG), 0.67% yeast nitrogen base, 4.2 g/L citric acid and 14.7 g/L sodium citrate at pH 5.4) supplemented with amino acids and essential nutrients as per Burke et al. [46]. Uracil was omitted from synthetic media (SD-ura or SG-ura) to select for plasmid-containing cells. Individual colonies were selected and grown in culture tubes for expression studies and in 48-well plates (Cat # 353047, Corning Inc., Corning, NY, USA) for MAPK response experiments. Cells were cultured at 30 or 15 °C, as indicated, at 275 rpm. Cell growth was monitored by measuring optical density at 600 nm (OD600) using a Nanodrop 2000 (ThermoFisher Scientific, Waltham, MA, USA). E. coli strain DH5α was used for amplifying yeast expression plasmids. E. coli were grown in Luria–Bertani media supplemented with 100 μg/mL ampicillin at 37 °C at 250 rpm.
4.2. Plasmid Construction
The A3R receptor variants were subcloned into yeast expression plasmids using homologous recombination in yeast [47]. A list of primers utilized for this cloning are described in Table 2. The CEN-ARS plasmid (pRS316) [30] containing a galactose (pGAL1–10) promoter, a N-terminal pre-pro leader sequence (PP) [32], receptor, and C-terminal mCitrine fluorescent protein and the CYC1 terminator (CYC1t) was utilized to express receptor variants for this study and its construction was previously described [40]. The pre-pro leader sequence aids in targeting the receptor to the plasma membrane via the secretory pathway [32]. The PCR-amplified receptor fragments and EagI linearized plasmid were combined at 4:1 molar ratios and transformed into yeast via the lithium chloride transformation protocol [48]. Transformants verified by colony PCR were miniprepped and transformed into E. coli using a standard heat shock protocol. All plasmids were sequenced to confirm the correct gene sequence (Genewiz, Plainfield, NJ, USA).
4.3. Whole Cell Fluorescence Assay
Receptor expression was determined by measuring the fluorescence intensity of mCitrine-tagged receptor. The mCitrine fluorescent intensity was collected at excitation and emission wavelengths of 510 and 540 nm, respectively using a BioTek Synergy H1 microplate reader (Winooski, VT, USA). For mCitrine fluorescence measurements, liquid cultures of cells expressing mCitrine-tagged receptors were removed and transferred to a 96-well plate (100 μL/well) at varying time points. Experiments were performed in triplicate for three independent biological replicates. Mean and standard deviation were reported.
4.4. Western Blotting
Western blotting was performed as previously described [26]. Briefly, cell pellets (10 OD600) were resuspended in 250 μL lysis buffer (10% glycerol, 50 mM sodium phosphate monobasic and 300 mM sodium chloride at pH 8) supplemented with cOmplete EDTA-free protease inhibitor cocktails (Roche, Indianapolis, IN, USA). An equal volume (250 μL) of 0.5 mm zirconia/silica beads (BioSpec, Bartlesville, OK, USA) was added to the cells and lysed using a BeadBug homogenizer (Benchmark Scientific, Edison, NJ, USA). Cells were lysed for 4 cycles of 30 s with 1-minute rest on ice. Three parts cell lysate was mixed with one part 4X laemmli sample buffer (Biorad, Hercules, CA, USA) supplemented with β-mercaptoethanol. One OD600 equivalent of cell lysate was loaded per well. Rabbit polyclonal to Kar2p/BiP was produced and purified from rabbit serum, as per previously published protocol [49]. The mCitrine tagged receptors and Kar2p/BiP protein were detected using primary rabbit anti-GFP antibody (Abcam #ab6556, Cambridge, MA, USA) and rabbit polyclonal anti-BiP antibody, respectively. Primary antibody was added at 1:3000 dilution in 5% milk dissolved in Tris-buffered saline with Tween20 (20 mM Tris, 150 mM NaCl and 0.1% Tween 20, pH 7.4; TBST) followed by Alexa568 donkey anti-rabbit secondary antibody (Invitrogen, Carlsbad, CA, USA) at 1:3000 dilution in TBST buffer. Blots were imaged using a BioSpectrum imager (UVP, Upland, CA, USA). For quantifying BiP expression levels, experiments were performed in duplicates for three biological replicates. Rectangular selection tool in Image J was used to calculate integrated fluorescent signal intensities for the Kar2p/BiP band on the gels.
4.5. Confocal Microscope
Live cells imaging was performed to determine receptor trafficking to the plasma membrane. The C-terminal mCitrine tagged receptors were imaged 24 h after galactose induction using a Nikon A1 laser-scanning confocal microscope. Calcoflour White M2R (Cat # F3543, Sigma Aldrich, St Louis, MO, USA), a stain that binds to chitin in the yeast cell wall was used to label the cell periphery. Excitation and emission settings of 405 nm and 450/50 nm and 513 nm and 535/15 nm were utilized to image Calcofluor stain and mCitrine fluorescent protein, respectively. Two to four images were collected for each receptor variant from four different biological replicates. Individual cells were cropped and analyzed using an in-house ImageJ plugin. The plugin calculates the average Hausdorff distance between mCitrine and Calcofluor pixels for each mCitrine pixel as previously described [26,38]. The analysis was performed for at least 100 individual cells.
4.6. Pheromone Response Signaling
The downstream signaling activity of receptors was determined in engineered yeast strains as previously described [50]. Upon ligand-mediated receptor activation, the cells produce mCherry fluorescent protein via a modified MAPK response pathway. Single colonies were picked from freshly made transformants and grown overnight in 400 µL or 1mL SD-ura media in 48-well or 24-well plates (Falcon 353047 and 353078, Corning, NY, USA), respectively, at 30 °C and 275 rpm. Receptor expression was induced by transferring twelve µL of overnight culture into 400 µL SG-ura media supplemented with 0.125% glucose. This small glucose addition aids in cell growth of the engineered yeast strains without repressing the galactose promoter, as previously described [31,51]. After 24 h of galactose induction, ligand was added to activate receptor signaling. In each well of a 48-well plate, 380 µL of fresh SG-ura media, 12 µL of overnight culture, and 8 µL of 5 mM 5′-N-ethylcarboxamidoadenosine (NECA, solubilized in dimethyl sulfoxide; Tocris, Minneapolis, MN, USA) or dimethyl sulfoxide (DMSO, added as a control) was added and incubated at 30 °C and 275 rpm. The resulting concentration of NECA in the assay was 100 µM, which is well above the KD, but consistent with other yeast studies of adenosine receptor signaling [39]. After 24 h of incubation with ligand, the resulting liquid culture was transferred to three replicate wells (100 µL per well) of a 96-well plate (Costar 3915, Corning, NY, USA). Fluorescence intensity was measured using the BioTek Synergy H1 microplate reader (Winooski, VT, USA) maintained at 30 °C. Excitation and emission settings of 580 nm and 615 nm were used to determine mCherry fluorescence. Experiments were performed at least in biological duplicates from three independent transformants, for a total of six independent colonies.
Supplementary Materials
The following are available online at https://0-www-mdpi-com.brum.beds.ac.uk/1422-0067/21/12/4547/s1.
Author Contributions
Conceptualization, A.S.R. and A.R.J.; methodology and formal analysis, A.R.J.; writing—original draft preparation, A.R.J.; writing—review and editing, A.S.R.; project administration and funding acquisition, A.S.R. All authors have read and agreed to the published version of the manuscript.
Funding
This research was supported in part by the Catherine and Henry Boh Endowment (Tulane University).
Acknowledgments
The authors thank James Broach (Pennsylvania State University) and Simon Dowell (Glaxo Smith Kline, UK) for providing Gpa1-human Gα chimera yeast strains.
Conflicts of Interest
The authors declare no conflict of interest.
Abbreviations
| A3/A2AR | Chimeric receptor comprised of N-terminus and transmembrane domains from A3R (residues 1–284) and the cytoplasmic C-terminus of the A2AR (residues 291–412) |
| A3R | Adenosine A3 receptor |
| DMSO | Dimethyl sulfoxide |
| NECA | 5′-N-ethylcarboxamidoadenosine |
| PP | Pre-pro |
References
- Borea, P.A.; Varani, K.; Vincenzi, F.; Baraldi, P.G.; Tabrizi, M.A.; Merighi, S.; Gessi, S. The A3 adenosine receptor: History and perspectives. Pharmacol. Rev. 2015, 67, 74–102. [Google Scholar] [CrossRef] [PubMed] [Green Version]
- Borea, P.A.; Gessi, S.; Merighi, S.; Vincenzi, F.; Varani, K. Pharmacology of Adenosine Receptors: The State of the Art. Physiol. Rev. 2018, 98, 1591–1625. [Google Scholar] [CrossRef] [PubMed]
- Jacobson, K.A.; Merighi, S.; Varani, K.; Borea, P.A.; Baraldi, S.; Aghazadeh Tabrizi, M.; Romagnoli, R.; Baraldi, P.G.; Ciancetta, A.; Tosh, D.K.; et al. A3 Adenosine Receptors as Modulators of Inflammation: From Medicinal Chemistry to Therapy. Med. Res. Rev. 2017. [Google Scholar] [CrossRef]
- Borea, P.A. A3 Adenosine Receptors from Cell Biology to Pharmacology and Therapeutics; Springer: Dordrecht, The Netherlands, 2010; p. xv. 322p. [Google Scholar]
- Fredholm, B.B.; AP, I.J.; Jacobson, K.A.; Klotz, K.N.; Linden, J. International Union of Pharmacology. XXV. Nomenclature and classification of adenosine receptors. Pharmacol. Rev. 2001, 53, 527–552. [Google Scholar] [PubMed]
- Jacobson, K.A.; Tosh, D.K.; Jain, S.; Gao, Z.G. Historical and Current Adenosine Receptor Agonists in Preclinical and Clinical Development. Front. Cell. Neurosci. 2019, 13, 124. [Google Scholar] [CrossRef] [Green Version]
- Fishman, P.; Bar-Yehuda, S.; Liang, B.T.; Jacobson, K.A. Pharmacological and therapeutic effects of A3 adenosine receptor agonists. Drug Discov. Today 2012, 17, 359–366. [Google Scholar] [CrossRef] [Green Version]
- Fishman, P.; Salhab, A.; Cohen, S.; Amer, J.; Itzhak, I.; Barer, F.; Safadi, R. The anti-inflammatory and anto-fibrogenic effects of namodenoson in NAFLD/NASH animal models. J. Hepatol. 2018, 68, S349–S350. [Google Scholar] [CrossRef]
- Stemmer, S.M.; Benjaminov, O.; Medalia, G.; Ciuraru, N.B.; Silverman, M.H.; Bar-Yehuda, S.; Fishman, S.; Harpaz, Z.; Farbstein, M.; Cohen, S.; et al. CF102 for the Treatment of Hepatocellular Carcinoma: A Phase I/II, Open-Label, Dose-Escalation Study. Oncologist 2013, 18, 25–26. [Google Scholar] [CrossRef] [PubMed]
- David, M.; Gospodinov, D.K.; Gheorghe, N.; Mateev, G.S.; Rusinova, M.V.; Hristakieva, E.; Solovastru, L.G.; Patel, R.V.; Giurcaneanu, C.; Hitova, M.C.; et al. Treatment of Plaque-Type Psoriasis With Oral CF101: Data from a Phase II/III Multicenter, Randomized, Controlled Trial. J. Drugs Dermatol. 2016, 15, 931–938. [Google Scholar] [PubMed]
- Baltos, J.A.; Paoletta, S.; Nguyen, A.T.; Gregory, K.J.; Tosh, D.K.; Christopoulos, A.; Jacobson, K.A.; May, L.T. Structure-Activity Analysis of Biased Agonism at the Human Adenosine A3 Receptor. Mol. Pharmacol. 2016, 90, 12–22. [Google Scholar] [CrossRef] [PubMed] [Green Version]
- Lundstrom, K.; Wagner, R.; Reinhart, C.; Desmyter, A.; Cherouati, N.; Magnin, T.; Zeder-Lutz, G.; Courtot, M.; Prual, C.; Andre, N.; et al. Structural genomics on membrane proteins: Comparison of more than 100 GPCRs in 3 expression systems. J. Struct. Funct. Genom. 2006, 7, 77–91. [Google Scholar] [CrossRef] [PubMed]
- Naranjo, A.N.; McNeely, P.M.; Katsaras, J.; Robinson, A.S. Impact of purification conditions and history on A2A adenosine receptor activity: The role of CHAPS and lipids. Protein Expr. Purif. 2016, 124, 62–67. [Google Scholar] [CrossRef] [PubMed] [Green Version]
- O’Malley, M.A.; Lazarova, T.; Britton, Z.T.; Robinson, A.S. High-level expression in Saccharomyces cerevisiae enables isolation and spectroscopic characterization of functional human adenosine A2a receptor. J. Struct. Biol. 2007, 159, 166–178. [Google Scholar]
- Fowlkes, D.M.C.H.; Broach, J.R.P.; Manfredi, J.P.O.; Paul, J.I.N.; Trueheart, J.S.N.; Klein, C.A.O.; Murphy, A.J.M.M. Yeast Cells Expressing Modified G Proteins and Methods of Use Therefor. U.S. Patent US19970946298, 7 October 1997. [Google Scholar]
- King, K.; Dohlman, H.G.; Thorner, J.; Caron, M.G.; Lefkowitz, R.J. Control of yeast mating signal transduction by a mammalian beta 2-adrenergic receptor and Gs alpha subunit. Science 1990, 250, 121–123. [Google Scholar] [CrossRef] [PubMed]
- Brown, A.J.; Dyos, S.L.; Whiteway, M.S.; White, J.H.; Watson, M.A.; Marzioch, M.; Clare, J.J.; Cousens, D.J.; Paddon, C.; Plumpton, C.; et al. Functional coupling of mammalian receptors to the yeast mating pathway using novel yeast/mammalian G protein alpha-subunit chimeras. Yeast 2000, 16, 11–22. [Google Scholar] [CrossRef]
- Knight, A.; Hemmings, J.L.; Winfield, I.; Leuenberger, M.; Frattini, E.; Frenguelli, B.G.; Dowell, S.J.; Lochner, M.; Ladds, G. Discovery of Novel Adenosine Receptor Agonists That Exhibit Subtype Selectivity. J. Med. Chem. 2016, 59, 947–964. [Google Scholar] [CrossRef] [Green Version]
- Stewart, G.D.; Valant, C.; Dowell, S.J.; Mijaljica, D.; Devenish, R.J.; Scammells, P.J.; Sexton, P.M.; Christopoulos, A. Determination of adenosine A1 receptor agonist and antagonist pharmacology using Saccharomyces cerevisiae: Implications for ligand screening and functional selectivity. J. Pharmacol. Exp. Ther. 2009, 331, 277–286. [Google Scholar] [CrossRef] [Green Version]
- Liu, R.; Groenewoud, N.J.; Peeters, M.C.; Lenselink, E.B.; AP, I.J. A yeast screening method to decipher the interaction between the adenosine A2B receptor and the C-terminus of different G protein alpha-subunits. Purinergic Signal. 2014, 10, 441–453. [Google Scholar] [CrossRef] [Green Version]
- Nakamura, Y.; Takemoto, N.; Ishii, J.; Kondo, A. Simultaneous method for analyzing dimerization and signaling of G-protein-coupled receptor in yeast by dual-color reporter system. Biotechnol. Bioeng. 2014, 111, 586–596. [Google Scholar] [CrossRef]
- Bhattacharya, S.; Youkey, R.L.; Ghartey, K.; Leonard, M.; Linden, J.; Tucker, A.L. The allosteric enhancer PD81,723 increases chimaeric A1/A2A adenosine receptor coupling with Gs. Biochem. J. 2006, 396, 139–146. [Google Scholar] [CrossRef] [Green Version]
- Tucker, A.L.; Jia, L.G.; Holeton, D.; Taylor, A.J.; Linden, J. Dominance of G(s) in doubly G(s)/G(i)-coupled chimaeric A(1)/A(2A) adenosine receptors in HEK-293 cells. Biochem. J. 2000, 352, 203–210. [Google Scholar] [CrossRef]
- O’Malley, M.A.; Mancini, J.D.; Young, C.L.; McCusker, E.C.; Raden, D.; Robinson, A.S. Progress toward heterologous expression of active G-protein-coupled receptors in Saccharomyces cerevisiae: Linking cellular stress response with translocation and trafficking. Protein Sci. 2009, 18, 2356–2370. [Google Scholar] [CrossRef] [PubMed] [Green Version]
- Knight, A. A Systems Pharmacology Approach to the Adenosine A1 Receptor. Ph.D. Thesis, University of Warick, Coventry, UK, 2015. [Google Scholar]
- Jain, A.R.; Stradley, S.H.; Robinson, A.S. The A2aR C-terminus provides improved total and active expression yields for adenosine receptor chimeras. AIChE J. 2018, 64, 4297–4307. [Google Scholar] [CrossRef]
- Jain, A.R.; Britton, Z.T.; Markwalter, C.E.; Robinson, A.S. Improved ligand-binding- and signaling-competent human NK2R yields in yeast using a chimera with the rat NK2R C-terminus enable NK2R-G protein signaling platform. Protein Eng. Des. Sel. 2019, 32, 459–469. [Google Scholar] [CrossRef]
- Hauser, A.S.; Chavali, S.; Masuho, I.; Jahn, L.J.; Martemyanov, K.A.; Gloriam, D.E.; Babu, M.M. Pharmacogenomics of GPCR Drug Targets. Cell 2018, 172, 41–54. [Google Scholar] [CrossRef] [Green Version]
- Nufer, O.; Guldbrandsen, S.; Degen, M.; Kappeler, F.; Paccaud, J.P.; Tani, K.; Hauri, H.P. Role of cytoplasmic C-terminal amino acids of membrane proteins in ER export. J. Cell. Sci. 2002, 115, 619–628. [Google Scholar]
- Sikorski, R.S.; Hieter, P. A system of shuttle vectors and yeast host strains designed for efficient manipulation of DNA in Saccharomyces cerevisiae. Genetics 1989, 122, 19–27. [Google Scholar] [PubMed]
- Bitter, G.A.; Egan, K.M. Expression of interferon-gamma from hybrid yeast GPD promoters containing upstream regulatory sequences from the GAL1-GAL10 intergenic region. Gene 1988, 69, 193–207. [Google Scholar] [CrossRef]
- Arnold, C.E.; Parekh, R.N.; Yang, W.; Wittrup, K.D. Leader peptide efficiency correlates with signal recognition particle dependence in Saccharomyces cerevisiae. Biotechnol. Bioeng. 1998, 59, 286–293. [Google Scholar] [CrossRef]
- Kimata, Y.; Kimata, Y.I.; Shimizu, Y.; Abe, H.; Farcasanu, I.C.; Takeuchi, M.; Rose, M.D.; Kohno, K. Genetic evidence for a role of BiP/Kar2 that regulates Ire1 in response to accumulation of unfolded proteins. Mol. Biol. Cell. 2003, 14, 2559–2569. [Google Scholar] [CrossRef] [Green Version]
- Rose, M.D.; Misra, L.M.; Vogel, J.P. KAR2, a karyogamy gene, is the yeast homolog of the mammalian BiP/GRP78 gene. Cell 1989, 57, 1211–1221. [Google Scholar] [CrossRef]
- Young, C.L.; Yuraszeck, T.; Robinson, A.S. Decreased secretion and unfolded protein response upregulation. Methods Enzym. 2011, 491, 235–260. [Google Scholar]
- Wedekind, A.; O’Malley, M.A.; Niebauer, R.T.; Robinson, A.S. Optimization of the human adenosine A2a receptor yields in Saccharomyces cerevisiae. Biotechnol. Prog. 2006, 22, 1249–1255. [Google Scholar] [CrossRef]
- Attrill, H.; Harding, P.J.; Smith, E.; Ross, S.; Watts, A. Improved yield of a ligand-binding GPCR expressed in E. coli for structural studies. Protein Expr. Purif. 2009, 64, 32–38. [Google Scholar] [CrossRef]
- Naranjo, A.N.; Chevalier, A.; Cousins, G.D.; Ayettey, E.; McCusker, E.C.; Wenk, C.; Robinson, A.S. Conserved disulfide bond is not essential for the adenosine A2A receptor: Extracellular cysteines influence receptor distribution within the cell and ligand-binding recognition. Biochim. Biophys. Acta 2015, 1848, 603–614. [Google Scholar] [CrossRef] [Green Version]
- Liu, R.; Wong, W.; AP, I.J. Human G protein-coupled receptor studies in Saccharomyces cerevisiae. Biochem. Pharmacol. 2016, 114, 103–115. [Google Scholar] [CrossRef]
- Jain, A.R. G Protein-Coupled Receptor Expression and Signaling in Yeast: Design and Optimization of Host/Protein Platform for Therapeutic Development. Ph.D. Thesis, Tulane University, Ann Arbor, MI, USA, 2019. [Google Scholar]
- Britton, Z.T. Novel Approaches to the Expression and Purification of G Protein-Coupled Receptors; University of Delaware, ProQuest Dissertations Publishing: Ann Arbor, MI, USA, 2012; UMI 3526401. [Google Scholar]
- Bjorkskov, F.B.; Krabbe, S.L.; Nurup, C.N.; Missel, J.W.; Spulber, M.; Bomholt, J.; Molbaek, K.; Helix-Nielsen, C.; Gotfryd, K.; Gourdon, P.; et al. Purification and functional comparison of nine human Aquaporins produced in Saccharomyces cerevisiae for the purpose of biophysical characterization. Sci. Rep. 2017, 7, 16899. [Google Scholar] [CrossRef] [Green Version]
- Peeters, M.C.; Wisse, L.E.; Dinaj, A.; Vroling, B.; Vriend, G.; Ijzerman, A.P. The role of the second and third extracellular loops of the adenosine A1 receptor in activation and allosteric modulation. Biochem. Pharmacol. 2012, 84, 76–87. [Google Scholar] [CrossRef]
- Bertheleme, N.; Singh, S.; Dowell, S.J.; Hubbard, J.; Byrne, B. Loss of constitutive activity is correlated with increased thermostability of the human adenosine A2A receptor. Br. J. Pharmacol. 2013, 169, 988–998. [Google Scholar] [CrossRef] [Green Version]
- Mundell, S.J.; Kelly, E. Evidence for co-expression and desensitization of A2a and A2b adenosine receptors in NG108-15 cells. Biochem. Pharmacol. 1998, 55, 595–603. [Google Scholar] [CrossRef]
- Burke, D.; Dawson, D.; Stearns, T. Cold Spring Harbor Laboratory. In Methods in Yeast Genetics: A Cold Spring Harbor Laboratory Course Manual, 2000 ed.; Cold Spring Harbor Laboratory Press: Plainview, NY, USA, 2000; p. xvii. 205p. [Google Scholar]
- Ito, K.; Sugawara, T.; Shiroishi, M.; Tokuda, N.; Kurokawa, A.; Misaka, T.; Makyio, H.; Yurugi-Kobayashi, T.; Shimamura, T.; Nomura, N.; et al. Advanced method for high-throughput expression of mutated eukaryotic membrane proteins in Saccharomyces cerevisiae. Biochem. Biophys. Res. Commun. 2008, 371, 841–845. [Google Scholar] [CrossRef] [PubMed]
- Gietz, R.D.; Woods, R.A. Transformation of yeast by lithium acetate/single-stranded carrier DNA/polyethylene glycol method. Methods Enzym. 2002, 350, 87–96. [Google Scholar]
- Young, C.L. Interrogation of Quality Control Mechanisms and Protein Trafficking in Saccharomyces Cerevisiae; University of Delaware, ProQuest Dissertations Publishing: Ann Arbor, MI, USA, 2012; UMI 3543550. [Google Scholar]
- McNeely, P.M. Receptor-Receptor, Ligand, and Membrane Interactions of the Adenosine A2a Receptor. Ph.D. Thesis, University of Delaware, Ann Arbor, MI, USA, 2016. [Google Scholar]
- McNeely, P.M.; Naranjo, A.N.; Forsten-Williams, K.; Robinson, A.S. A2AR Binding Kinetics in the Ligand Depletion Regime. Slas Discov. 2017, 22, 166–175. [Google Scholar] [CrossRef] [PubMed] [Green Version]
Figure 1.
Snake plot for full-length human wild-type A3R (A) and chimeric A3/A2AR (B), where individual circles represent amino acids. Transmembrane helices are evident in the solid orange-colored representation of the plasma membrane. (C) Plasmid map for yeast expression vector pRS316-GAL1–10-PP-receptor-mCit-cyct. Each receptor construct contains the GAL1–10 promoter [31], an N-terminal leader sequence (PrePro [32], PP) to aid in ER trafficking, and a C-terminal mCitrine fluorescent protein (mCit) to aid in detection of receptor levels. (D) Schematic for homologous recombination strategy to generate chimeric A3/A2AR construct in yeast expression plasmids.

Figure 2.
Chimeric A3/A2AR shows higher total expression levels than A3R in BY4741. (A) Representative Western blot image for cell lysates of C-terminal mCitrine-tagged receptors expressed in BY4741, 24 h post-galactose induction. One OD600 equivalent of whole cell lysates was loaded per well. The protein was detected using an anti-GFP antibody (see Section 4); Precision Plus Protein WesternC Standard (BioRad, Hercules, CA, USA) was used as a standard to enable molecular weight estimation. Full-length human A3 and chimeric A3/A2A receptors at expected MW of 45 and 55 kDa, respectively, are identified with arrows. No cleaved mCitrine tag was observed. (B) Receptor expression as a function of time, following galactose induction, by monitoring whole cell mCitrine fluorescence (arbitrary units, AU) as a surrogate marker for total receptor levels. Yellow filled circles represent data for A3R, whereas black open circles represent A3/A2AR. Data points are the average of at least 3 biological replicates; lines are a guide for the eye. Error bars represent the standard error from the average. Data points significantly different from A3R are indicated with * (p-value < 0.05 using Student’s t-test).
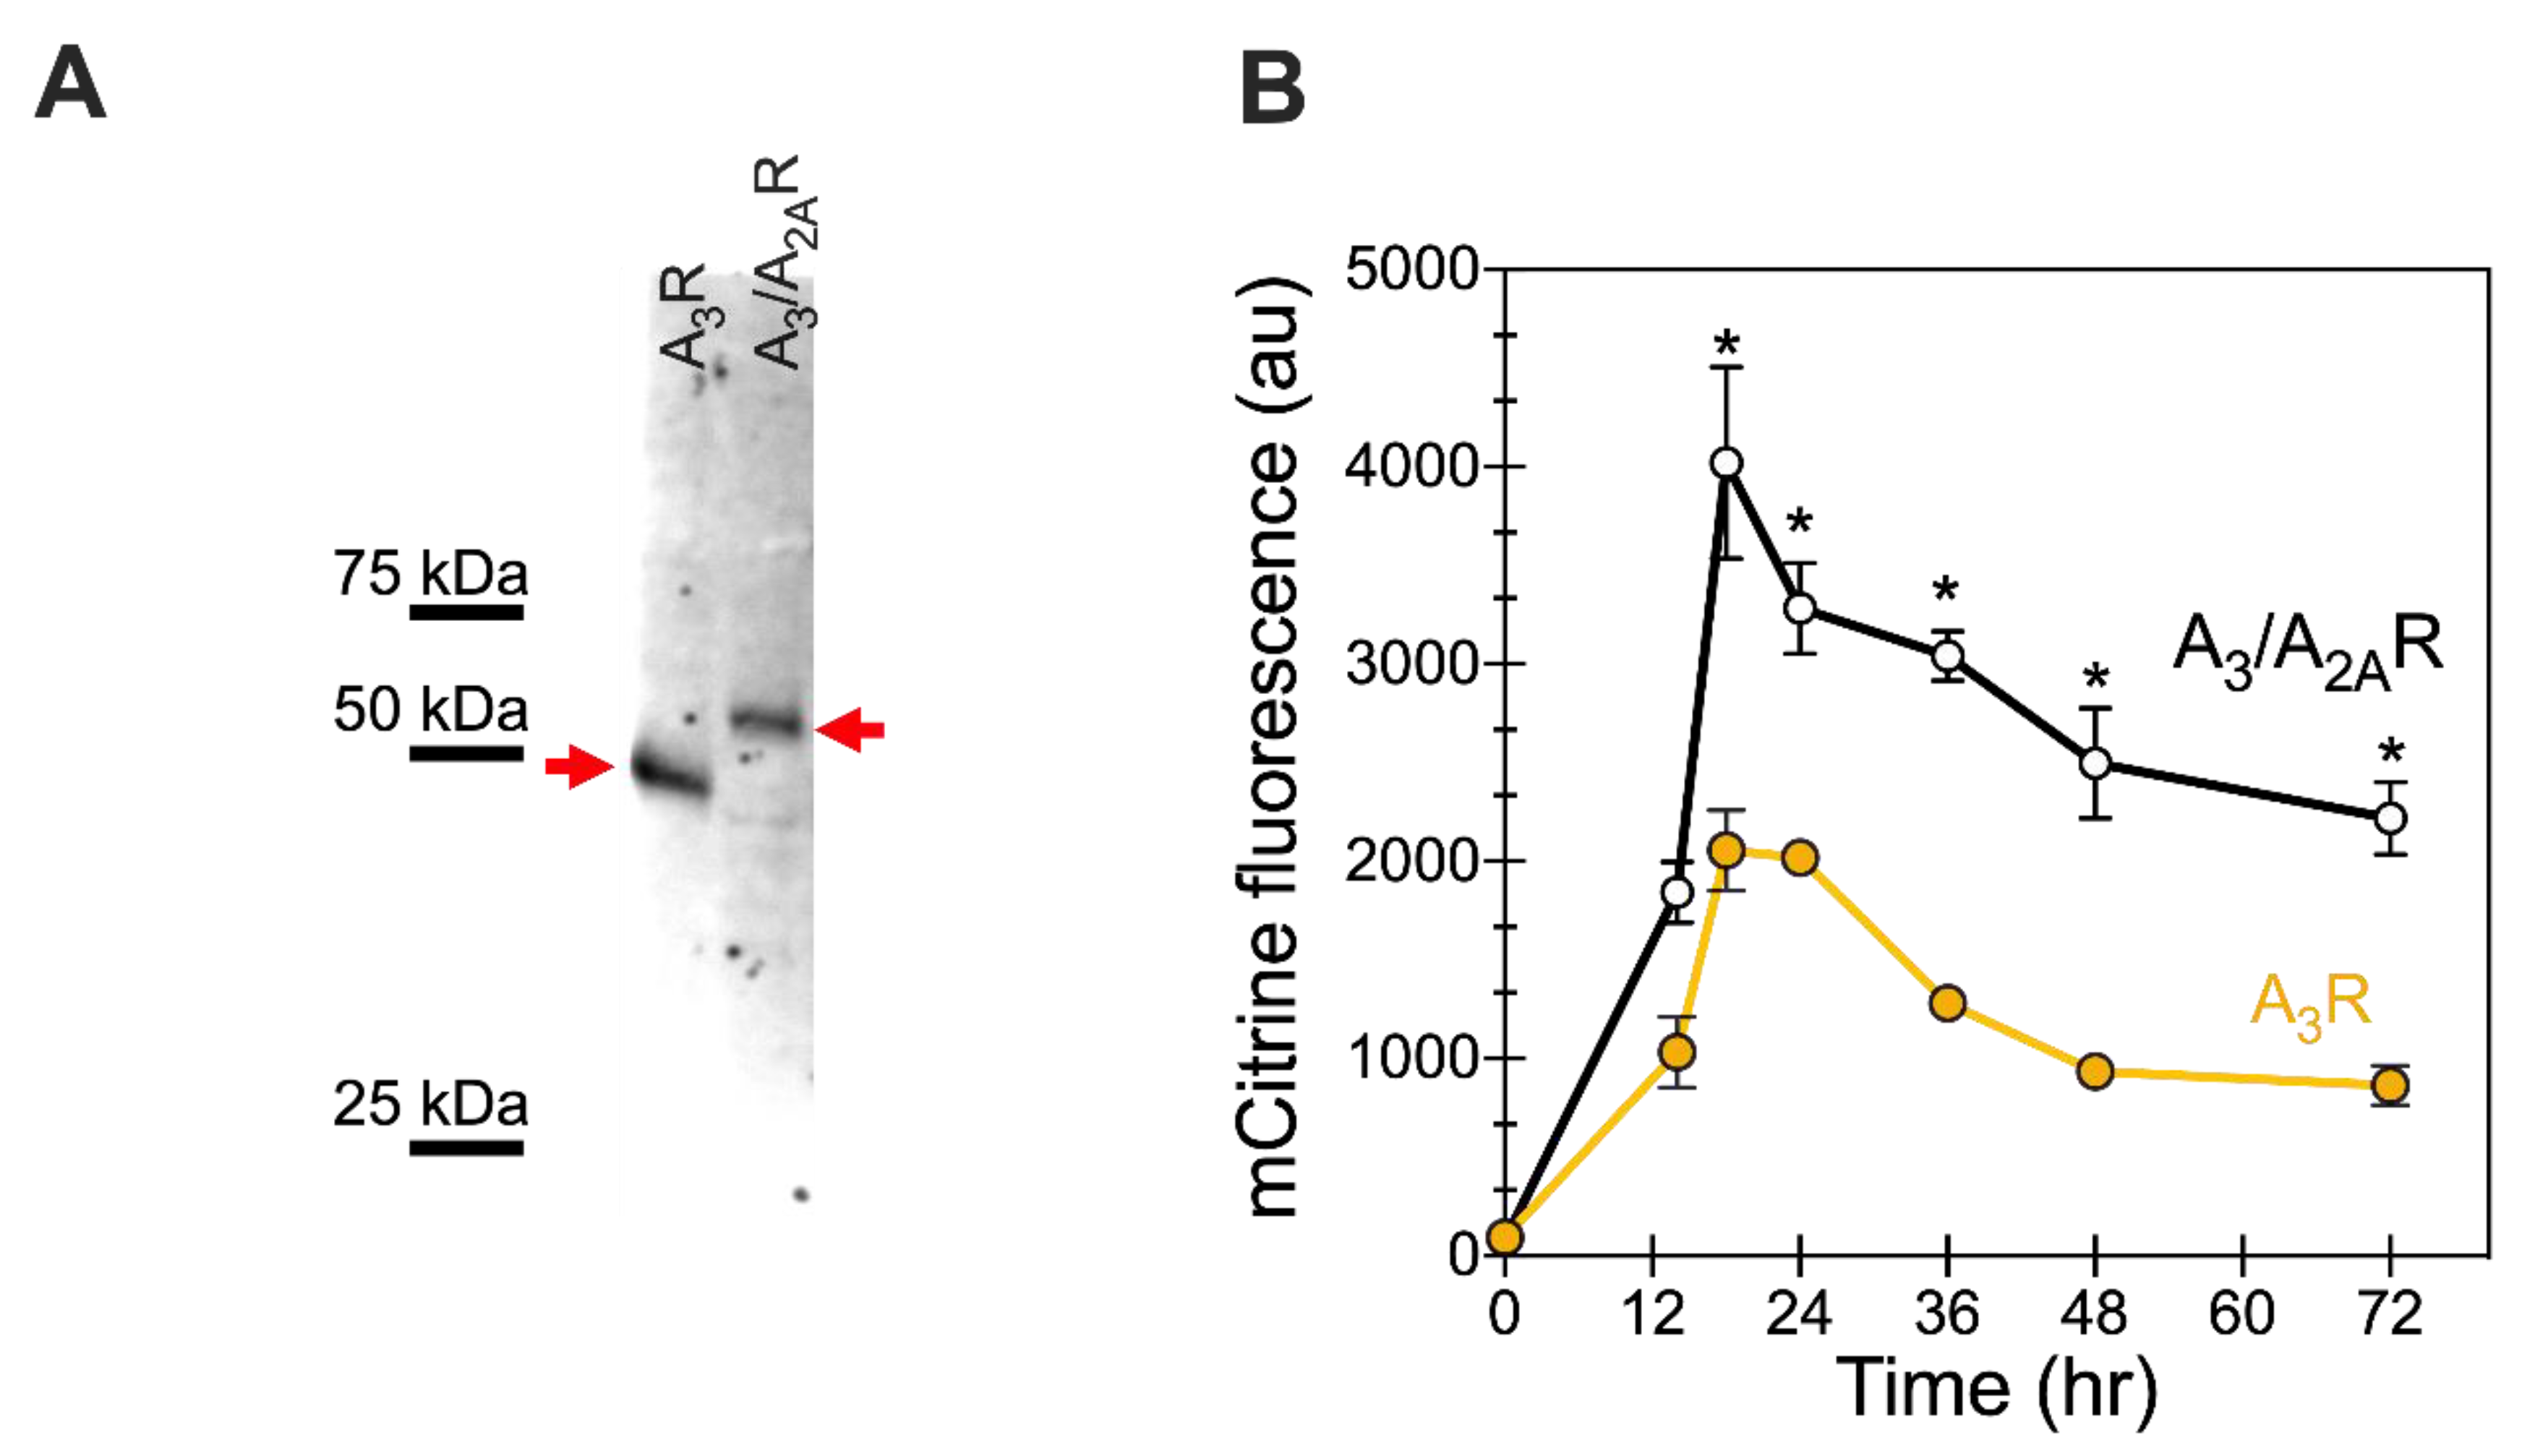
Figure 3.
BiP/Kar2 expression was reduced in cells expressing the chimeric A3/A2AR as compared with wild-type A3R. (A) Representative Western blot of BiP/Kar2 expression levels in recombinant yeast cells. One prominent band (arrow) is observed at the expected MW for BiP/Kar2 of approximately 78 kDa. One OD600 equivalent of whole cell lysates were loaded per well. Precision Plus Protein WesternC Standard (BioRad) was used to enable molecular weight estimation. (B) Quantification of the average integrated band intensities for BiP/Kar2 levels in A3R-expressing cell lines from western blot images, divided by BiP levels on the same western in A3/A2AR-expressing cells to yield the fold change. Note this normalization results in no error bars for A3/A2AR data. Experiments were performed for at least four independent biological replicates; error bars represent the 95% confidence interval.

Figure 4.
Improving receptor expression by growth at higher initial cell density (5 OD600/mL) and induction temperature of 15 °C. Whole cell mCitrine fluorescence was monitored by cells growing in defined media (SG-ura). Yellow-filled circles (30 °C) and squares (15 °C) denote A3R, whereas black open squares are A3/A2AR at 15 °C. Data points represent the average of at least 5 biological replicates; lines are a guide for the eye. Error bars represent the standard error of the mean value. Data points significantly different from A3R at 15 °C are indicated with * (p-value < 0.05 using Student’s t-test).

Figure 5.
Small improvement in trafficking of chimera to the plasma membrane (A) Representative live-cell confocal microscopy images showing receptor localization of the mCitrine tagged receptors expressed in BY4741. Calcofluor stain was used to label the cell wall. Scale bar indicates 2 µm. (B) Quantification of the average Hausdorff distance for at least a hundred individual cells (points) per receptor. Bars show the mean, with error bars representing the 95% confidence interval. Student’s t-test was performed to determine significant difference between the two values. * represents p-value < 0.05.

Figure 6.
Chimeric receptor signals downstream in yeast upon ligand binding. (A) Chimeric A3/A2AR receptor signaling in the presence of agonist (100 μM NECA, filled bars) compared with control (DMSO, open bars) is significant, whereas wild-type A3R shows no detectable signaling. Both signals were measured in engineered yeast (CY13393) expressing the Gpa1p-human Gαi1 chimera and the indicated receptor. (B) A3/A2AR chimera is activated with native-like coupling to hybrid Gαi/o proteins. Results obtained for engineered yeast strains with human/yeast G protein chimeras described previously [17]. The average of three independent transformants performed in duplicates is shown; error bars represent the 95% CI. * represents p-value < 0.05 using Student’s t-test.


| Yeast Strain | G Protein | Last 5 Amino Acids at C-Terminus | Equivalent Human Gα |
|---|---|---|---|
| MMY12, BY4741 | Gpa1 | KIGIICOOH | GPA1 (yeast) |
| MMY14, CY13397 | Gpa1-Gαq(5) | EYNLVCOOH | GNAQ, GNA11 |
| MMY16, CY13395 | Gpa1-Gα16(5) | EINLLCOOH | GNA15, GNA16 |
| MMY19 | Gpa1-Gα12(5) | DIMLQCOOH | GNA12 |
| MMY20 | Gpa1-Gα13(5) | QLMLQCOOH | GNA13 |
| MMY21 | Gpa1-Gα14(5) | EFNLVCOOH | GNA14 |
| MMY22 | Gpa1-Gαo(5) | GCGLYCOOH | GNAO |
| MMY23, CY13393 | Gpa1-Gαi1(5) | DCGLFCOOH | GNAI1, GNAI2, GNAT1, GNAT2, GNAT3 |
| MMY24 | Gpa1-Gαi3(5) | ECGLYCOOH | GNAI3 |
| MMY25 | Gpa1-Gαz(5) | YIGLCCOOH | GNAZ |
| MMY28, CY13399 | Gpa1-Gαs(5) | QYELLCOOH | GNAS, GNAL |
Table 2.
List of primers used in this study.
| Primer Name | Sequence | Receptor Variants |
|---|---|---|
| PP_A3_F | CGGTTCCGCTGCAGAAGGCTCTTTGGACAAGAGAGAAGCTATGCCCAACAACAGCACTGC | A3R and A3/A2AR |
| A3_mCit_R | TTGGGACAACACCAGTGAATAATTCTTCACCTTTAGACATCTCAGAATTCTTCTCAATGC | A3R |
| A3_A2A_F | CCATGATGAACCCTATCGTCTATGCCTATCGTATCCGCGAGTTCCGCCAGACCTTCCGCA | A3/A2AR |
| A3_A2A_R | TGCGGAAGGTCTGGCGGAACTCGCGGATACGATAGGCATAGACGATAGGGTTCATCATGG | A3/A2AR |
| A2A_mCit_R | TTGGGACAACACCAGTGAATAATTCTTCACCTTTAGACATGGACACTCCTGCTCCATCCT | A3/A2AR |
© 2020 by the authors. Licensee MDPI, Basel, Switzerland. This article is an open access article distributed under the terms and conditions of the Creative Commons Attribution (CC BY) license (http://creativecommons.org/licenses/by/4.0/).
Share and Cite
MDPI and ACS Style
Jain, A.R.; Robinson, A.S. Functional Expression of Adenosine A3 Receptor in Yeast Utilizing a Chimera with the A2AR C-Terminus. Int. J. Mol. Sci. 2020, 21, 4547. https://0-doi-org.brum.beds.ac.uk/10.3390/ijms21124547
AMA Style
Jain AR, Robinson AS. Functional Expression of Adenosine A3 Receptor in Yeast Utilizing a Chimera with the A2AR C-Terminus. International Journal of Molecular Sciences. 2020; 21(12):4547. https://0-doi-org.brum.beds.ac.uk/10.3390/ijms21124547
Chicago/Turabian StyleJain, Abhinav R., and Anne S. Robinson. 2020. "Functional Expression of Adenosine A3 Receptor in Yeast Utilizing a Chimera with the A2AR C-Terminus" International Journal of Molecular Sciences 21, no. 12: 4547. https://0-doi-org.brum.beds.ac.uk/10.3390/ijms21124547
Note that from the first issue of 2016, this journal uses article numbers instead of page numbers. See further details here.