Rounding up the Usual Suspects: Assessing Yorkie, AP-1, and Stat Coactivation in Tumorigenesis


1
School of Biosciences, Cardiff University, Cardiff CF103AX, UK
2
Department of Biological Sciences, Sam Houston State University, Huntsville, TX 77341, USA
*
Authors to whom correspondence should be addressed.
Int. J. Mol. Sci. 2020, 21(13), 4580; https://0-doi-org.brum.beds.ac.uk/10.3390/ijms21134580
Submission received: 2 June 2020
/
Revised: 16 June 2020
/
Accepted: 18 June 2020
/
Published: 27 June 2020
(This article belongs to the Special Issue Basic and Translational Models of Cooperative Oncogenesis)
Abstract
:Can hyperactivation of a few key signaling effectors be the underlying reason for the majority of epithelial cancers despite different driver mutations? Here, to address this question, we use the Drosophila model, which allows analysis of gene expression from tumors with known initiating mutations. Furthermore, its simplified signaling pathways have numerous well characterized targets we can use as pathway readouts. In Drosophila tumor models, changes in the activities of three pathways, Jun N-terminal Kinase (JNK), Janus Kinase/Signal Transducer and Activator of Transcription (JAK/STAT), and Hippo, mediated by AP-1 factors, Stat92E, and Yorkie, are reported frequently. We hypothesized this may indicate that these three pathways are commonly deregulated in tumors. To assess this, we mined the available transcriptomic data and evaluated the activity levels of eight pathways in various tumor models. Indeed, at least two out of our three suspects contribute to tumor development in all Drosophila cancer models assessed, despite different initiating mutations or tissues of origin. Surprisingly, we found that Notch signaling is also globally activated in all models examined. We propose that these four pathways, JNK, JAK/STAT, Hippo, and Notch, are paid special attention and assayed for systematically in existing and newly developed models.
1. Introduction
1.1. Studying Tumorigenesis in Drosophila is Fast, Cheap, and Effective
Drosophila imaginal discs, larval precursors of adult epithelial tissues, are outstanding models of epithelial tumorigenesis. Experiments in this system have contributed enormously to our molecular and mechanistic understanding of cancer and to the development of treatments [1,2,3]. This contribution ranged from mapping downstream effectors of cancer inducing mutations to understanding synergistic interactions between driver mutations to building avatars for personalized drug screening [4,5,6]. For example, the Hippo tumor suppressor pathway was first discovered in flies [7,8,9]. The nuclear effectors of this pathway, Yorkie (Yki) in Drosophila, Yes Associated Protein (YAP) and Transcriptional Co-activator with a PDZ-binding Domain (TAZ) in mammals, are now established oncogenes [10,11]. Likewise, many components and signaling mechanisms of other pathways involved in cancer, such as Wnt (Wingless in Drosophila), Bone Morphogenetic Protein (BMP), Notch (N), Epidermal Growth Factor Receptor (EGFR)/Ras, Insulin, Janus Kinase/Signal Transducer and Activator of Transcription (JAK/STAT), and Jun N-terminal kinase (JNK), were delineated using fly genetics [12,13,14,15,16,17,18,19,20]. It is important to note that all these cancer pathways have developmental roles as well ranging from cell fate specification to regeneration. They all contribute to regulation of basic cellular processes, such as proliferation, cell growth, and apoptosis. To help the non-expert, we list the key pathway components and targets in Table 1 with a color code, where green is used for pro-growth/cancer and red for anti-growth factors.
In 2005, the Cagan Lab published a Drosophila model of multiple endocrine neoplasia type 2 (MEN2). They used an active form of the Ret-kinase found in patients and expressed it constitutively in larval eye discs [21]. This model was utilized to map downstream effectors and for pharmacological screening, leading to an effective, Food and Drug Administration-approved treatment for the disease within 6 years of the initial publication [22,23]. This approach has now been taken to the next level for personalized medicine, where 5–15 driver mutations from a patient are introduced into a fly avatar. These genetically personalized fruit flies are then used for drug screening [24]. This method has already proven to work and helped a patient with metastatic colorectal cancer [4]. These examples highlight the speed and power of Drosophila genetics for basic and translational cancer research.
1.2. Cooperation between Different Signaling Pathways Is a Hallmark of Tumorigenesis
Most tumors initiate as the result of multiple mutations arising, which synergistically cooperate to transform normal cells to a tumor fate, conferring proliferative potential, invasive potential, and resistance to cell death, among other characteristics [25,26]. Even in the rare cases where a single mutation has the ability to transform a cell, this is achieved by misregulation of multiple downstream signaling pathways. For example, the dominant mutations in the Ret receptor tyrosine kinase activate the Ras/ERK, Src, and JNK pathways [21]. Another example is the larval discs that are homozygous mutants for apical-basal polarity determinants scribble (scrib) or discs-large (dlg), which form neomorphic masses [27,28]. Transformation of these mutant discs is owing to critical changes that activate JNK and Yki, leading to excess production of the JAK/STAT ligands Unpaireds (Upds) [29]. Finally, mutations in the epigenetic silencers of the Polycomb Repressive Complex 1 (PRC1) cause excess growth when the mutant clones are allowed to occupy the whole disc using the eyFLP-cell lethal system [30]. Notably, some PRC1 components have redundant functions in growth and single mutants may not always yield overgrowth [30]. Therefore, double mutant combinations were utilized; Psc-Su(z)2 chromosome is a deletion that lacks two PRC1 components, Posterior sex combs (Psc) and Suppressor of zeste 2 (Su(z)2), as well as an uncharacterized, non-conserved gene [30]. Similarly, the polyhomeotic (ph) locus is duplicated and contains proximal and distal transcription units, ph-p and ph-d, respectively [31]. The allele used to generate the ph tumors contains mutations in both ph-p and ph-d genes [32]. The activities of different pathways were screened in PRC1 complex mutants and the JAK/STAT pathway was found to be highly and consistently induced [30]. Accordingly, the Upd ligands were shown to be direct targets of Polycomb silencing [30]. Another study found a requirement for Notch signaling in ph eye disc tumors [33]. The ph tumors also activated the JNK pathway [34]. Therefore, deregulation of multiple signaling pathways is a common feature of tumor formation.
In 2003, ground-breaking work by Richardson and Xu labs initiated the field of cooperative tumorigenesis in Drosophila [35,36]. Unbiased genetic screens revealed apical-basal polarity loss as a cooperating factor with activated Ras and N mutations [35,36]. Paradoxically, if mutations in scrib or dlg genes arise in a patch of cells, the surrounding wild-type cells effectively eliminate the mutant cells, via a process known as cell competition. For recent and excellent reviews of this process, see [37,38,39,40]. However, if these scrib mutations in patches are combined with activated Ras or Notch, the outcome is aggressive and metastatic tumors [35,36]. With its clonal nature, this model more closely mimics the human condition. Genetics and transcriptomics revealed that JNK, JAK/STAT, and Yki are the drivers of tumorigenesis in RasV12 + scrib- tumors [41,42,43,44,45,46]. We set out to determine whether these three pathways, or others, are commonly deregulated in Drosophila tumors of different initiating mutations.
2. Background and Approach
Is There a Common Signaling Signature of Tumorigenesis?
Since 2003, many labs have generated new combinations of genetic aberrations that drive tumor formation, ranging from combined defects in major signaling pathways to lysosome or mitochondrial dysfunction, or utilized the concept of cooperative oncogenesis to screen for novel synergistic interactions (for recent, comprehensive reviews, see [2,37]). Each study looked into the authors’ favorite pathways and biological processes; nevertheless, common features are evident. For example, the JNK, JAK/STAT, and Hippo signaling pathways were very frequently mentioned, leading us to question if their co-activation is truly a common feature underlying development of diverse tumors, or simply a bias in the assays used. However, as noted above, deregulation of many of the developmental signaling pathways has been implicated in tumor formation. Thus, to determine if a specific subset of pathways is consistently activated across diverse tumor types, creating a common tumorigenic signaling state, we performed a meta-analysis using available transcriptomic datasets of Drosophila tumors. We assessed the activity levels of JNK, JAK/STAT, Hippo, Decapentaplegic (Dpp), Hedgehog (Hh), Wingless (Wg), Notch, and EGFR/Ras pathways in tumors by surveying expression levels for selected, validated targets for each pathway. It is important to look at multiple readouts to assess pathway activity as the transcription of each gene can be and often is regulated by multiple pathways. To acknowledge this caveat, we highlighted the target genes that are known to be targets of multiple pathways in cyan in the figures.
Notably, only a few of the Drosophila tumor models have been subjected to transcriptomic analysis. We compiled data from four cooperative tumorigenesis models, two single mutants that lead to transformation, and two PRC1 tumors. We also included transcriptomic data from warts (wts) mutants, and Notch intracellular domain (NICD) expressing discs representing hyperplastic overgrowth conditions.
We mined the transcriptomic data available for the following genotypes:
- (1)
- (2)
- scrib mutant wing discs, data from [29]. Dlg and Scrib act together in a complex and scrib mutant wing discs phenocopy dlg mutants, about 70% of all genes that are differentially expressed in dlg mutant wing discs are also differentially expressed in scrib discs; 311 upregulated and 263 downregulated genes [29].
- (3)
- (4)
- N + scrib-: A microarray analysis was performed on N + scrib- tumors revealing common as well as unique changes compared with RasV12 + scrib- tumors in the eye [43]. These tumors express NICD in scrib- mitotic clones. Transcriptomes of wing discs with N + scrib- tumors were also published recently [50]. N + scrib- tumors are neoplastic in nature.
- (5)
- Abrupt + scrib-: The zinc finger transcription factor Abrupt was identified as a scrib cooperating oncogene in a screen [51]. Ectopic Abrupt expression has no discernable phenotypes on differentiation and gives the cells a slight growth advantage, whereas Abrupt overexpression in scrib- cells maintains cells in a progenitor-like state and prevents the formation of photoreceptors. Eye discs with such cells are severely overgrown and neoplastic [51,52].
- (6)
- (7)
- polyhomeotic (ph) mutants (ph-p and ph-d double), member of the PRC1, which often display a loss of polarity along with overgrowth [33]. Clones can be invasive, and display cooperative tumorigenesis with RasV12 [33]. A small proportion of animals with ph clones in the eye can reach adulthood and display overgrown eyes [33,53].
- (8)
- capicua, warts (cic, wts) double mutants: Cic is the transcriptional repressor of EGFR/Ras signaling [54]. The Ras/Raf/MAPK Kinase (MEK) cascade culminates in activation of Mitogen-Activated Protein Kinase (MAPK), which targets Cic for degradation, allowing target gene induction [55]. Wts kinase acts in the Hippo pathway [49,56,57,58,59,60]. In wts mutants, Yki is stabilized and can accumulate in the nucleus and help induce expression of genes that drive cell growth (such as Myc), proliferation (e.g., Cyclin E), as well as conferring apoptotic resistance via induction of Diap1 [7,8,61]. Hippo signaling controls the transcriptional output of the Ras pathway and their mutual disruption, as in cic,wts mutants, causes synergistic overgrowth in larval discs [54]. Such discs stay hyperplastic and lose apical-basal polarity only at the very late stages [54]. We have data for day 5 (prior to overgrowth) and with overgrown, heavily folded day 9 discs [54].
- (9)
- wts mutants at day 5 and day 9, data from [54]. These discs are hyperplastic owing to overactivation of Yki.
- (10)
- NICD-overexpressing wing discs display hyperplastic overgrowth, data from [50].
We exclusively used datasets generated from imaginal disc tissue where the fold change in tumor versus a wild-type control was available. The only exception to this rule is the ph tumor dataset; in this study, the tissue was subjected to Fluorescence-Activated Cell Sorting (FACS) prior to RNA-sequencing and the fold changes in tumor cells labeled with Green Fluorescent Protein (GFP) were reported against the neighboring GFP− cells [53]. We reported expression values in the figures below as fold change in log2 (log2FC) compared with controls. As we are using these values as proxies for pathway activity, we are reporting all values that are differentially expressed (p < 0.05) without a fold change (FC) threshold. The published ph dataset used a very stringent cut-off (padj < 0.01), and thus values for many genes were not available, shown in dark grey in the figures. Finally, the various datasets are annotated to different releases of the Drosophila genome. When genes of interest were not found, attempts were made to query all known synonyms, but we cannot preclude that some genes may have been missed owing to the annotation differences.
3. Analysis/Results
3.1. Tumors Cause Delayed Pupariation and Loss of Cell Fate Specification
Notably, a phenotype shared between all the conditions assessed in this analysis is the heavily delayed pupariation, which manifests as giant larvae. This phenotype is known to be caused by excess Drosophila insulin-like peptide 8 (Dilp8) production [62]. Dilp8 secreted from discs acts remotely on the central brain to delay the transition to the pupal stage. As such, larval life is extended, in some cases indefinitely, giving the tumors more time to grow [63,64]. Among the conditions we re-analyzed, dilp8 induction was consistently very strong, with the exception of the ph tumors, ranging from 3.23-fold in RasV12 + scrib- leg discs to an over 1000-fold induction in RasV12 + scrib- wing discs (Figure 1). dilp8 is a verified Yki/Sd target gene, but it can also be induced by JNK or JAK/STAT activation [63,64,65]. Notably, in cases where Yki is not activated, such as in Psc-Su(z)2 mutants, dilp8 is still heavily induced, showing that it can be induced independently of Yki activation (Figure 1).
Another common feature across various tumors is the loss of cell fate specification. In eye tumors, defects in photoreceptor differentiation can be easily revealed by Embryonic Lethal Abnormal Vision (ELAV) staining; such defects were reported for RasV12 + scrib-, Ab + scrib-, cic,wts, and ph tumors [45,51,53,54]. We analyzed the expressions of the fate determinants for the eye (twin of eyeless, toy; eyeless, ey: eyes absent, eya; sine oculis, so; dachshund, dac; ELAV; atonal, ato; homothorax, hth; teashirt, tsh; senseless, sens;) and the wing tissue (hth; tsh; sens; Distalless, Dll; vestigial, vg; nubbin, nub). Neoplastic tumors and PRC1 tumors showed significant downregulation of corresponding fate determinants (Figure 1, yellow and blue boxes). These changes were less pronounced in wts mutant and NICD overexpressing wing discs, as well as in cic,wts mutant discs (Figure 1). The antenna and the leg tumors showed a signature similar to that of the eye tumors. Thus, we observe that not only is differentiation lost (ato, sens, ELAV), but much of the early tissue identity program is also downregulated during or as a result of neoplastic tumor formation in both wing and eye discs (Figure 1). We then investigated the activity of different signaling pathways to assess if common processes are activated to block development and promote tumorigenesis.
3.2. Inactivation of Hippo, Dpp, Hh, Wg, and Activation of JNK, JAK/STAT, and Notch Are Commonly Seen in Tumors
EGFR/Ras pathway: Notably, two of the four cooperative tumorigenesis models are based on activation of the EGFR/Ras pathway, and as expected, transcriptional feedback regulators of this pathway Argos (Aos), Sprouty (Sty), and Sulfated (Sulf1) were significantly induced in RasV12 + scrib- and cic,wts tumors (Figure 2). In addition to the negative feedback regulators of the pathway and its transcription factor Pointed (Pnt), all of which are direct Cic targets, we included the newly identified Cic target genes Ecdysone receptor (EcR), EGF spitz (spi), and Leucine-rich tendon-specific protein (Lrt) in our analysis [54]. EGFR/Ras activity was largely unaffected in the Abrupt + scrib-, scrib, and dlg tumors. The pathway activity was lowered in the N + scrib- and ph eye tumors. Thus, EGFR pathway activation is a specific feature of a subset of tumors.
Dpp, Hh, and Wg pathways: The activities of each of these developmental pathways were very low in all tumor models examined, with a few notable exceptions. The shutdown of these pathways is likely to reflect defects in differentiation, known to occur in these tumors [51,53,54] (Figure 1).
For the Dpp pathway, all the target genes displayed are induced upon Dpp activation with the exception of brinker (brk), which is shut down by Dpp signaling [66,67]. Therefore, induction of brk transcription indicates low Dpp activity. On the basis of upregulation of this gene, Dpp signaling is markedly reduced in RasV12 + scrib- and cic,wts tumors (Figure 3). Curiously, Dpp signaling is high in ph eye disc tumors (Figure 3). Strikingly, we noticed that the secreted BMP antagonist short gastrulation (sog) [68,69] was upregulated in the RasV12 + scrib- transcriptomes. We queried this across the tumor transcriptomes and found a strong correlation between sog expression and Dpp pathway activity. We found that sog is upregulated in all tumors assayed, except ph, where it is strongly downregulated (log2FC = −4.16). Therefore, sog upregulation offers a potential mechanistic explanation for the observed downregulation of Dpp activity levels. Interestingly, sog transcript levels are not changed and the Dpp activity is low in the Psc/Su(z)2 wing tumors; this difference to ph tumors may be owing to different tissue types.
For the Hedgehog pathway, most pathway members/targets assessed were lower or unchanged in tumors, suggesting there may be little flux through this pathway in tumors. A notable exception is the upregulation of dpp ligand expression in scrib, dlg, and PRC1 tumors. It is not clear at this level of analysis if dpp expression in these cells is dependent on Hh signaling or induced by a different factor.
Similarly, the activity of the Wg pathway is downregulated in most of the tumors assayed except the PRC1 tumors and NICD-expressing discs. Wg expression is known to be regulated by N signaling [70,71]. In the PRC1 tumors, Wg signaling is likely induced in the presence of excess ligand production (Wg, Wnt4, and Wnt6), highlighting another difference between PRC1 tumors and the others we analyzed.
Our analysis supports the idea that, in most neoplastic tumors, normal developmental signaling is not functioning. However, it highlights that the PRC1 tumors may be largely different from the more neoplastic tumors assessed. Interestingly, Torres et al. performed a hierarchical clustering between ph tumor transcriptomes and other known normal and tumor transcriptomes. This analysis demonstrated that the ph tumors were more similar to embryonic signatures rather than other tumors (e.g., RasV12 + scrib-), which were very dissimilar from embryonic signatures [53].
Hippo pathway: Despite the impressive overgrowth phenotypes of hippo mutant imaginal discs, the involvement of the Hippo signaling pathway is not assayed for consistently in tumor models. Only one out of every four papers that deal with tumor models reported on Hippo activity levels. The first member of the Hippo cascade, Warts (Wts) kinase, was described as a tumor suppressor in flies in the 1990s [72,73]. Wts stayed as an orphan kinase until the discovery of Salvador and Hippo in the early 2000s [49,56,57,58,59,60,74]. Since then, the Hippo signaling cascade has well reached adulthood and has proven itself as a key regulator of cell division and stemness in many contexts [9,10,11,75,76]. Yki is the main transcriptional mediator of this tumor suppressor pathway. Inactivation of the Hippo pathway leads to activation of Yki and subsequent tissue growth [77]. Yki localization is linked to pathway activity. Yki can accumulate in the nucleus only after the Hippo pathway is shut down [77]. Therefore, subcellular Yki localization and sensitivity to yki gene dosage are good assays for testing involvement of the Hippo pathway. It is trickier to interpret experiments where yki-RNAi is shown to suppress tumor growth as yki-RNAi prevents proliferation of normal cells as well. In addition to Yki localization, other good readouts for Yki activity in imaginal discs are expanded(ex)-lacZ, Diap1-lacZ, and the bantam sensor [57,78,79,80]. In RNA-seq experiments, the target genes ex, kibra, and dilp8 are particularly robust readouts, whereas CycE, Myc, and Diap1 are upregulated more mildly, about 1.5-fold in wts mutant discs (Figure 4 and Figure 9). Notably, high levels of F-actin are a well characterized and potent activator of Yki [81,82]. Therefore, tumors where actin accumulation was observed may have higher Yki activity [51,52,83,84,85,86].
In our meta-analysis of sequenced tumors, Yki target genes were expressed in all tumors at levels similar to those observed in wts mutants, except for the PRC1 tumors. As wts loss leads to constitutive Yki activation, this should represent a strong induction of validated targets. In RasV12 + scrib- tumors, Yki activation was less obvious in eye disc tumors compared with other tissues (Figure 4). Thus, Yki activation is a broad, but not ubiquitous phenomenon in tumors. In light of this, it is possible to speculate that Yki activation status in a tumor may be a potent way to stratify tumors that activate distinct sets of pathways to promote their growth. Tumors that do not activate Yki may become neoplastic via a different mechanism and may behave quite differently from those that do activate Yki.
JNK pathway: The JNK pathway is stimulated by the Tumor Necrosis Factor (TNF)-type ligand Eiger binding to its receptors Wengen and Grindelwald, which activate a MAP kinase cascade that ultimately phosphorylates the downstream Jun-kinase Basket (Bsk) [87,88,89,90,91,92]. Bsk in turn activates numerous AP-1 and AP-1 related b-Zip transcription factors. In Drosophila tumors, the b-Zip transcription factors Jra, Kay, Atf-3, Pdp1, and Irbp18 have been implicated as potential effectors [41,43,44,50,93,94].
JNK pathway activity is well monitored in tumors; 30 out of 40 recent papers we analyzed across various tumor models directly assayed for JNK activity in their models and with good reason. JNK signaling is activated in response to stress and tumor formation is no doubt a source of stress for the tumor initiating cell and its neighbors [17,18]. Whereas JNK activation can be anticipated in the presence of tumors, the outcome of JNK activation is not easily predicted. One of the JNK target genes, Matrix metalloproteinase 1 (Mmp1), can lead to basement membrane degradation, and hence is associated with invasive behavior [44]. Moreover, JNK activation in a cell can induce autonomous and cell non-autonomous proliferation via induction of the Upd ligands [19]. Finally, it can also induce autonomous cell death via induction of the pro-apoptotic gene reaper (rpr) [19].
In our analysis of the literature, we observed that the outcome of JNK signaling in tumors can be as diverse as cellular responses to it. For comprehensive reviews of pro- and anti-tumorigenic roles of JNK signaling, see [19] and [95]; however, we will briefly summarize some highlights here. JNK induction is commonly a contributing factor to tumor growth and metastasis, as co-expression of a dominant-negative version of JNK (Bsk-DN) can suppress tumor growth and invasion in RasV12 + scrib- and N + scrib- tumors [44,46,48]. In ph tumors, co-expression of Bsk-DN reduces the volume of mutant clones [34]. Similarly, JNK activity is induced and co-expression of Bsk-DN can suppress tumorigenesis in Ras + Pico [96], Ras + Src [83,97], and activated N + Src [98] models. However, in some tumors, tumor growth and invasive potential can be uncoupled from each other. In Ab + scrib- tumors, co-expression of Bsk-DN suppresses the invasive behavior, but not the tumor growth [51]. In contrast, the tumors are even larger owing to an extended larval life, but have a more hyperplastic appearance [51]. Therefore, it is possible to achieve excessive overgrowth independently of JNK, however, invasive behavior is tightly linked to high JNK activity.
Finally, we came across two other studies where JNK activation may have a tumor suppressive quality because co-expression of Bsk-DN actually enhances the overgrowth observed; that is, eyeful tumors [99] and the polyploid tumors formed by cooperation between cytokinesis failure and activated Ras or Yki expression [100]. Therefore, the outcome of JNK activation is very much context-dependent. Many other studies reported JNK induction in their respective tumor models, but did not assess the nature of JNK contribution.
The JNK pathway was globally induced in all tumors and hyperplastic discs that were subjected to transcriptomics (Figure 5). This induction is rather strong and clear in all tumors with the notable exception of the cic,wts tumors at day 5 (Figure 5). At this stage, cic,wts discs are only slightly overgrown and retain their apical-basal polarity. Mmp1 and upd1–3 ligands are further induced at day 9 cic,wts tumors, but this induction is still relatively mild compared with other tumors and more similar to JNK activity levels in wts mutant discs. Therefore, JNK activity seems to increase over time in the cic, wts model. The same trend was also observed in the RasV12 + scrib- eye tumors [42]. As more single cell sequencing data emerges, it will be interesting to see if this trend is biologically relevant, or if it is simply a reflection of the shifted ratio of tumor to normal cells in older tumor samples in bulk RNA-seq experiments. If it is biologically relevant, it will be interesting to find if this is a general trend for all tumors and whether there is a threshold of JNK activity where invasive behavior can be initiated. We observe that JNK activation is a common feature, but with conflicting outcomes. Thus, we advocate that pathway activity be assessed, but also blocked in tumors going forward to assess if JNK has pro-tumorigenic or tumor suppressing functions in each context. Increased data points may paint a clearer picture of how the tumor context or progression correlates with JNK function.
JAK/STAT pathway: The workings of the JAK/STAT pathway are relatively simple. The interleukin (IL)6 type ligands Upd1 (that is, os), Upd2, and Upd3 bind to their receptor Domeless, which stimulates its dimerization and activation of the associated Janus Kinase (Jak) molecule Hopscotch (Hop). Hop, in turn, phosphorylates the sole Stat ortholog in Drosophila, Stat92E [20]. Activation of Stat92E promotes the growth, proliferation, invasion, and survival of tumor cells [41,42,45,101]. The ligands upd1, 2, and 3 are often upregulated in tumors, whereas the other pathway components are not differentially expressed [29,41].
JAK/STAT activity can be assessed by expression of its best studied target gene, Suppressor of Cytokine Signaling at 36E (Socs36E) in various contexts [42,65,102,103,104]. Socs36E acts as a feedback inhibitor of the pathway and can be used to test the contribution of JAK/STAT activity to tumors. Co-expression of UAS-Socs36E can suppress PRC1 tumors [30], overgrowth of dlg homozygous mutant discs [29], and the Hippo/Ras synergy [54]. Likewise, Davie et al. demonstrated that null mutations in Stat92E strongly suppressed the excessive growth of RasV12 + scrib- eye tumors [42]. Finally, introducing heterozygosity for Stat92E into the tumor background reduced the size of Psc-Su(z)2 eye tumors [30]. Thus, in all reported cases, excess JAK/STAT activity contributes to tumor growth. Ptp61F, a protein tyrosine phosphatase, is another negative regulator and transcriptional target of the pathway [42,105,106]. Interestingly, Socs36E and Ptp61F are already broadly upregulated in tumors, leading us to speculate that the aggressive phenotypes observed would be more severe if these genes were mutated or downregulated.
Several other direct targets of the pathway have been identified and verified by the Bach Lab over the years, including chronologically inappropriate morphogenesis (chinmo), cap-n-collar (cnc), lamina ancestor (lama), Zn finger homeodomain 2 (zfh2), NADPH oxidase (Nox), Keap1 I (Keap1), and pannier (pnr) [65,101,107,108]. Among these, Nox, Keap1, and pnr are negatively regulated by the pathway and thus are shown in bold and traced in red (Figure 6). CG1572 was identified as an effector of the pathway in hematopoietic tumors [104]. terribly reduced optic lobes (trol), which encodes a Perlecan, is regulated by the pathway in multiple tissues [42,107]. Finally, an embryonic target gene dorsal (dl) was identified as a likely direct Stat92E target gene and had more accessible chromatin in RasV12 + scrib- eye tumors and Upd overexpressing eye discs [42,109]. In agreement with the published results, these selected target genes indicated increased JAK/STAT activity in nearly all tumor models examined as well as the hyperplastic wts mutant, and NICD-expressing discs (Figure 6). In the case of scrib, Ab tumors, about half of the target genes indicate pathway activation, whereas the rest strongly argue the opposite, preventing us from reaching a verdict.
Our analysis was also inconclusive in ph tumors despite higher levels of Upds, but these tumors are known to have high JAK/STAT activity [30,34]. Previous studies have shown that tumor produced Upds stimulate JAK/STAT signaling in the neighboring cells [19,45,110]. In the ph dataset, gene expression in tumor cells was compared to that of non-tumor neighbors [53], which likely also have high JAK/STAT activity. Thus, this approach may have filtered out the differential expression of Stat target genes. Upds are transcriptional targets of JNK signaling, thus JNK activation should cause activation of JAK/STAT signaling. Indeed, this seems to be the case, with the exception of the Ab + scrib- model, where many JNK targets are induced, but not the Upds (Figure 5). This observation was rather surprising considering that Yki and JNK are both active in this tumor, and Upd3 is a known cooperative target of these pathways [29,51]. However, as noted above, JNK’s function in Ab + scrib- tumors is pro-invasive, but not pro-growth. As JAK/STAT signaling is a potent pro-growth pathway, it is possible that this model, in which we observe an uncoupling of JNK + Yki from JAK/STAT activation, could be an important system in which to gain further insights into cross talk between these pathways in tumors. It would be interesting to examine if the upd promoter regions are accessible in these tumors. Therefore, why the JAK/STAT pathway is not activated in this tumor is quite interesting, but the mechanism remains unknown.
Notch pathway: Activation of Dpp, Hh, and Wg pathways as well as EGFR or N signaling can induce cell proliferation and hyperplastic tissue growth, apart from and in addition to their roles in differentiation. The amount of growth that can be induced is especially impressive upon N activation [71]. However, what regulates the switch between differentiation and proliferation control is often poorly understood. In the case of Ras signaling, co-activation of Yki was proposed to shift the balance towards proliferation [54]. Pathways involved in cell fate specification in imaginal discs, Dpp, Hh, and Wg showed overall lower activity in tumors (Figure 3). On the contrary and to our surprise, we find that N signaling seems to be activated in all tumors examined (Figure 7). This is less clear from our target analysis in the case of the ph tumors (Figure 7), however, Notch activation was experimentally validated in these tumors [33,34].
In Drosophila, Notch activation has been identified as being able to cooperate with both the loss of scribble or the activation of Src to promote tumor development [48,50,98]. Src activation synergizes with N in inducing hyperplastic growth in eye and wing discs, and leads to JNK activation [98]. In combination with scrib loss, N activation leads to neoplastic and invasive tumors [48]. bHLH transcription factors deadpan (dpn) and the Enhancer of Split (E(spl)) genes are the best characterized and direct target genes for N during differentiation, however, these canonical N targets are sometimes downregulated in N induced tumors [71,98]. Indeed, in N + scrib- tumors, only 3 out of 13 of these bHLH factors were induced (Figure 7). Expression of E(spl) genes was broadly downregulated in diverse tumor types (Figure 7). Ho et al. reported that Src can inhibit transcription of E(spl) genes [98]. Thus, we also checked Src levels, but overall found them to be lower in tumors (Figure 7). Therefore, reduced E(spl) transcription is not owing to higher Src levels in these tumors.
N signaling is peculiar as the receptor N is also the transcription factor of the pathway. Upon ligand binding, N undergoes a series of cleavages and its intracellular domain, NICD, translocates into the nucleus. N forms a complex with Suppressor of Hairless (Su(H)) and Mastermind, to induce transcription of Notch-responsive genes [14,111]. The Bray lab mapped Su(H) binding sites genome wide and asked which genes were induced upon N activation in Drosophila cells and in wing disc tumors, defining additional direct N target genes [71,112]. Instead of the canonical N target genes, a whole set of other genes was induced during N hyperplasia; 58 genes were commonly induced in NICD and Su(H) expressing overgrown discs and had Su(H) binding in their vicinity [71]. Of these 58, 9 representative target genes (Serrate, Ser; Kank; zormin; fruitless, fru; CG6191; CG3835; CG18507; pickled eggs, pigs; and jitterbug, jbug) are shown in Figure 7. The rate-limiting enzyme in glycolysis, Lactate dehydrogenase encoded by ImpL3/Ldh, was also shown to be a direct N target placing glucose metabolism downstream of N activity, and hence was included in our analysis [113]). These ten readouts were broadly activated in all the tumors assessed as well as in wts mutant discs and NICD-expressing discs (Figure 7). We noted that about 20% of N targets in tumors are also high confidence Yki/Sd targets [41,71]. These included target genes that are regulated by both the Hippo and JNK pathways: chinmo, ftz-f1, upd2, and upd3 loci. These loci are some of the most highly and consistently upregulated genes across tumors we assessed, raising the possibility that Notch activation also contributes to promoting the robust upregulation of these important genes. Clearly, these results indicate that there remains much to be discovered about the role of Notch signaling in these tumors, and its possible relationships with AP-1, Stat, and Yorkie dependent gene expression.
3.3. A Set of Transcription Factors Is Commonly Upregulated in Tumors
From the available transcriptomics studies, several transcription factors have also been identified as key regulators of tumor progression/gene expression primarily downstream of these pathways. We decided to also query these transcription factors to see if their upregulation was a common feature. Thus, we examined the expression of selected AP-1 transcription factors (Kay, Atf3, Irbp18, Jra, Pdp1), Myc, Ftz-f1, Ets-21C, Chinmo, Abrupt, and the repressor Cic (Figure 8). Interestingly, cic was downregulated in most tumors to a similar degree as it was by mutation in the cic,wts model. ftz-f1, an ortholog of the human orphan nuclear receptor 5A (NR5A), was mildly to strongly upregulated in nearly every model. Atf3 and Pdp1 were also notably upregulated as well as Ets21C and chinmo. The broad upregulation of these factors may suggest that they bear further investigation in other emerging models as each has orthologs that have been implicated in human tumorigenesis.
Finally, we also analyzed the expression of apoptosis and cell cycle regulators in the tumor models. In agreement with the literature, wts and cic,wts mutant discs had higher levels of the anti-apoptotic gene Diap1 and lower levels of the pro-apoptotic gene reaper (rpr), protecting them from cell death (Figure 9) [8,114]. Furthermore, CycE and String (Stg), rate limiting factors in cell cycle, were induced in wts and cic,wts discs, leading to excess cell divisions (Figure 9) [9]. NICD expressing discs behaved similarly (Figure 9). The other tumors seemed to have overall higher expression of the pro-apoptotic genes and reduced levels of the cell cycle genes, which appeared counterintuitive given their proliferating state (Figure 9). High rpr expression can be attributed to JNK activity, however, regulation of grim in RasV12 + scrib- tumors begs for further attention, as it was consistently induced in all four tissues (Figure 9). The upregulation of these regulators of apoptosis may be relevant to the “undead” phenomenon of sublethal caspase activation reported in Ras-dependent tumors [97,115]. Alternatively, this may reflect cell death induction in either the tumor or neighboring cells. Future single-cell experiments may be able to better differentiate the role of these genes and the apoptotic pathways in the growth or restraint of the tumor, as this analysis cannot differentiate autonomous versus non-autonomous gene induction and is limited by the single time point.
4. Discussion and Conclusions
In the quest to develop better therapeutic approaches, there has been a push towards personalized medicine based on patients’ mutational status. The use of sophisticated statistical and computational analyses of genomic data from human tumors revealed large numbers of candidate genes and variants. While this has yielded some clear gains, it is often tough to interpret this big cancer data and to translate it to improved patient care [116]. The way forward will be paved by functional studies in experimental models to reveal the biological significance of the newly identified variants [117]. Here, we sought to determine if tumors with different known initiating mutations share common cell biology in the form of signal pathway activity. If so, this may indicate that unique mutational signatures converge on common signaling states to create tumors. By identifying common core signaling states, tumors may be stratified for potential treatment with novel inhibitor combinations. Owing to its demonstrated successes as an initial discovery platform as well as a translational model for tumor therapies, insights from Drosophila will continue to be informative in the age of personalized cancer medicine.
We observe in our meta-analysis that, while not a rule, Hippo pathway is inactivated, whereas Notch, JNK, and STAT signaling pathways are frequently co-activated in Drosophila tumors (Figure 10). It is already known that co-activation of Yki and JNK can synergistically activate upd expression, leading to Stat activation [29]. It would be interesting to know if there is additional cross-regulation between the pathways, which could lead to a self-sustaining circuit in tumors that makes them independent of initiating mutations once the circuit of JNK/Yki/Stat is established.
We were surprised to discover that the data we analyzed supported that the Notch pathway is also commonly activated in different models. To our knowledge, it is not known if Notch signaling is important for the growth or invasive properties of most of the tumors assessed in this study, or how it would become activated in, for example, RasV12 + scrib- or cic,wts tumors. Furthermore, interaction of N with Yki or Stat in tumors has been little explored, potentially opening new avenues of investigation and insights into the altered signaling milieu of tumors. This finding highlights the strength and merit of these kinds of meta-analyses.
While activation of Yki, JAK/STAT, and JNK is commonly observed in tumors, deregulation of all three simultaneously is not an obligate scenario. As noted, PRC1 tumors did not activate Yki, whereas upregulation of Upds and JAK/STAT induction is uniquely missing in Ab + scrib- tumors. Our analysis suggests that the ph tumors activate Dpp and Wg pathways, unique among the tumors assessed. This tumor also showed a signature that was quite similar to normal embryonic gene expression, representing a very different kind of tumor [53]. Overall, with the frequent exception of the ph tumors, the key factors induced are chinmo, Ets21C, ftz-f1, Atf3, and Pdp1, forming a common tumor signature found across tumors with different initiating mutations (Figure 8). Further documentation of which tumors do or do not rely on the Yki/Stat/AP-1 axis could yield a new broader way to stratify tumors. In turn, it is possible this insight could lead to simplified or more effective treatment strategies.
Author Contributions
F.H. and M.A. have designed the study and performed the data analysis. F.H. wrote the original draft and M.A. has edited. All authors have read and agreed to the published version of the manuscript.
Funding
F.H. has been supported by a Swiss National Science Foundation professorship grant (PP00P3_179075) and by the Ser Cymru II programme, which is part-funded by Cardiff University and the European Regional Development Fund through the Welsh Government (80762-CU186). M.A. has been supported by the Roland Black Endowed Assistant Professorship (SHSU).
Acknowledgments
We are grateful to Vincent Dion (Cardiff University), Anne-Kathrin Classen (University of Freiburg), Georg Halder (KU Leuven), and the members of the Hamaratoglu Lab for comments on the manuscript. We thank Andreas Bergmann (UMass Medical School, Worcester, MA) for helpful discussion of the apoptotic regulator data, and Mirka Uhlirova (University of Cologne) for providing additional values. Special thanks to Jelle Jacobs (IMP, Vienna) for his help with access to datasets and for his comments on the manuscript. We are grateful to Shinya Yamamoto (BCM, Houston, TX) for providing a Notch hotline.
Conflicts of Interest
The authors declare no conflict of interest. The funders had no role in the design of the study; in the collection, analyses, or interpretation of data; in the writing of the manuscript, or in the decision to publish the results.
References
- Sonoshita, M.; Cagan, R.L. Modeling Human Cancers in Drosophila. Curr. Top. Dev. Biol. 2017, 121, 287–309. [Google Scholar]
- Richardson, H.E.; Portela, M. Modelling Cooperative Tumorigenesis in Drosophila. Biomed. Res. Int. 2018, 2018, 4258387. [Google Scholar] [CrossRef] [Green Version]
- Herranz, H.; Eichenlaub, T.; Cohen, S.M. Cancer in Drosophila: Imaginal Discs as a Model for Epithelial Tumor Formation. Curr. Top. Dev. Biol. 2016, 116, 181–199. [Google Scholar] [PubMed]
- Bangi, E.; Ang, C.; Smibert, P.; Uzilov, A.V.; Teague, A.G.; Antipin, Y.; Chen, R.; Hecht, C.; Gruszczynski, N.; Yon, W.J.; et al. A personalized platform identifies trametinib plus zoledronate for a patient with KRAS-mutant metastatic colorectal cancer. Sci. Adv. 2019, 5, eaav6528. [Google Scholar] [CrossRef] [PubMed] [Green Version]
- Sonoshita, M.; Scopton, A.P.; Ung, P.M.U.; Murray, M.A.; Silber, L.; Maldonado, A.Y.; Real, A.; Schlessinger, A.; Cagan, R.L.; Dar, A.C. A whole-animal platform to advance a clinical kinase inhibitor into new disease space. Nat. Methods 2018, 14, 291–298. [Google Scholar] [CrossRef] [PubMed]
- Bangi, E.; Murgia, C.; Teague, A.G.; Sansom, O.J.; Cagan, R.L. Functional exploration of colorectal cancer genomes using Drosophila. Nat. Commun. 2016, 7, 13615. [Google Scholar] [CrossRef] [PubMed]
- Harvey, K.F.; Tapon, N. The Salvador–Warts–Hippo pathway—An emerging tumour-suppressor network. Nat. Rev. Cancer 2007, 7, 182–191. [Google Scholar] [CrossRef] [PubMed]
- Pan, D. Hippo signaling in organ size control. Genes Dev. 2007, 21, 886–897. [Google Scholar] [CrossRef] [PubMed] [Green Version]
- Halder, G.; Johnson, R.L. Hippo signaling: Growth control and beyond. Development 2011, 138, 9–22. [Google Scholar] [CrossRef] [Green Version]
- Zanconato, F.; Cordenonsi, M.; Piccolo, S. YAP/TAZ at the Roots of Cancer. Cancer Cell 2016, 29, 783–803. [Google Scholar] [CrossRef]
- Harvey, K.F.; Zhang, X.; Thomas, D.M. The Hippo pathway and human cancer. Nat. Rev. Cancer 2013, 13, 246–257. [Google Scholar] [CrossRef] [PubMed]
- Jenny, F.H.; Basler, K. Powerful Drosophila screens that paved the wingless pathway. Fly (Austin) 2014, 8, 218–225. [Google Scholar] [CrossRef] [PubMed] [Green Version]
- Hamaratoglu, F.; Affolter, M.; Pyrowolakis, G. Dpp/BMP signaling in flies: From molecules to biology. Semin. Cell Dev. Biol. 2014, 32, 128–136. [Google Scholar] [CrossRef] [Green Version]
- Yamamoto, S.; Schulze, K.L.; Bellen, H.J. Introduction to Notch signaling. Methods Mol. Biol. 2014, 1187, 1–14. [Google Scholar] [PubMed]
- Casci, T.; Freeman, M. Control of EGF receptor signalling: Lessons from fruitflies. Cancer Metastasis Rev. 1999, 18, 181–201. [Google Scholar] [CrossRef] [PubMed]
- Oldham, S.; Hafen, E. Insulin/IGF and target of rapamycin signaling: A TOR de force in growth control. Trends Cell Biol. 2003, 13, 79–85. [Google Scholar] [CrossRef]
- Davis, R.J. Signal transduction by the JNK group of MAP kinases. Cell 2000, 103, 239–252. [Google Scholar] [CrossRef] [Green Version]
- Weitzman, J.B. Quick guide. Jnk. Curr. Biol. 2000, 10, R290. [Google Scholar] [CrossRef] [Green Version]
- Pinal, N.; Calleja, M.; Morata, G. Pro-apoptotic and pro-proliferation functions of the JNK pathway of Drosophila: Roles in cell competition, tumorigenesis and regeneration. Open Biol. 2019, 9, 180256. [Google Scholar] [CrossRef] [Green Version]
- Herrera, S.C.; Bach, E.A. JAK/STAT signaling in stem cells and regeneration: From. Development 2019, 146, dev167643. [Google Scholar] [CrossRef] [PubMed] [Green Version]
- Read, R.D.; Goodfellow, P.J.; Mardis, E.R.; Novak, N.; Armstrong, J.R.; Cagan, R.L. A Drosophila model of multiple endocrine neoplasia type 2. Genetics 2005, 171, 1057–1081. [Google Scholar] [CrossRef] [PubMed] [Green Version]
- Thornton, K.; Kim, G.; Maher, V.E.; Chattopadhyay, S.; Tang, S.; Moon, Y.J.; Song, P.; Marathe, A.; Balakrishnan, S.; Zhu, H.; et al. Vandetanib for the Treatment of Symptomatic or Progressive Medullary Thyroid Cancer in Patients with Unresectable Locally Advanced or Metastatic Disease: U.S. Food and Drug Administration Drug Approval Summary. Clin. Cancer Res. 2012, 18, 3722–3730. [Google Scholar] [CrossRef] [PubMed] [Green Version]
- Dar, A.C.; Das, T.K.; Shokat, K.; Cagan, R.L. Chemical genetic discovery of targets and anti-targets for cancer polypharmacology. Nature 2012, 486, 80–84. [Google Scholar] [CrossRef] [PubMed] [Green Version]
- Kasai, Y.; Cagan, R. Drosophila as a tool for personalized medicine: A primer. Per Med. 2010, 7, 621–632. [Google Scholar] [CrossRef] [Green Version]
- Hanahan, D.; Weinberg, R.A. Hallmarks of cancer: The next generation. Cell 2011, 144, 646–674. [Google Scholar] [CrossRef] [PubMed] [Green Version]
- Sanchez-Vega, F.; Mina, M.; Armenia, J.; Chatila, W.K.; Luna, A.; La, K.C.; Dimitriadoy, S.; Liu, D.L.; Kantheti, H.S.; Saghafinia, S.; et al. Oncogenic Signaling Pathways in The Cancer Genome Atlas. Cell 2018, 173, 321–337.e10. [Google Scholar] [CrossRef] [Green Version]
- Bryant, P.J.; Schmidt, O. The genetic control of cell proliferation in Drosophila imaginal discs. J. Cell Sci. Suppl. 1990, 13, 169–189. [Google Scholar] [CrossRef] [Green Version]
- Humbert, P.; Russell, S.; Richardson, H. Dlg, Scribble and Lgl in cell polarity, cell proliferation and cancer. Bioessays 2003, 25, 542–553. [Google Scholar] [CrossRef]
- Bunker, B.D.; Nellimoottil, T.T.; Boileau, R.M.; Classen, A.-K.; Bilder, D. The transcriptional response to tumorigenic polarity loss in Drosophila. eLife 2015, 4, 4. [Google Scholar] [CrossRef]
- Classen, A.K.; Bunker, B.D.; Harvey, K.F.; Vaccari, T.; Bilder, D. A tumor suppressor activity of Drosophila Polycomb genes mediated by JAK-STAT signaling. Nat. Genet. 2009, 41, 1150–1155. [Google Scholar] [CrossRef] [Green Version]
- Hodgson, J.W.; Cheng, N.N.; Sinclair, D.A.; Kyba, M.; Randsholt, N.B.; Brock, H.W. The polyhomeotic locus of Drosophila melanogaster is transcriptionally and post-transcriptionally regulated during embryogenesis. Mech. Dev. 1997, 66, 69–81. [Google Scholar] [CrossRef]
- Dura, J.-M.; Randsholt, N.B.; Deatrick, J.; Erk, I.; Santamaria, P.; Freeman, J.; Freeman, S.J.; Weddell, D.; Brock, H.W. A complex genetic locus, polyhomeotic, is required for segmental specification and epidermal development in D. melanogaster. Cell 1987, 51, 829–839. [Google Scholar] [CrossRef]
- Martinez, A.M.; Schuettengruber, B.; Sakr, S.; Janic, A.; Gonzalez, C.; Cavalli, G. Polyhomeotic has a tumor suppressor activity mediated by repression of Notch signaling. Nat. Genet. 2009, 41, 1076–1082. [Google Scholar] [CrossRef] [PubMed]
- Beira, J.V.; Torres, J.; Paro, R. Signalling crosstalk during early tumorigenesis in the absence of Polycomb silencing. PLoS Genet. 2018, 14, e1007187. [Google Scholar] [CrossRef]
- Brumby, A.M.; Richardson, H.E. Scribble mutants cooperate with oncogenic Ras or Notch to cause neoplastic overgrowth in Drosophila. EMBO J. 2003, 22, 5769–5779. [Google Scholar] [CrossRef]
- Pagliarini, R.A.; Xu, T. A genetic screen in Drosophila for metastatic behavior. Science 2003, 302, 1227–1231. [Google Scholar] [CrossRef]
- Fahey-Lozano, N.; La Marca, J.E.; Portela, M.; Richardson, H.E. Drosophila Models of Cell Polarity and Cell Competition in Tumourigenesis. Adv. Exp. Med. Biol. 2019, 1167, 37–64. [Google Scholar]
- Ohsawa, S. Elimination of oncogenic cells that regulate epithelial homeostasis in Drosophila. Dev. Growth Differ. 2019, 61, 337–342. [Google Scholar] [CrossRef] [Green Version]
- Merino, M.M.; Levayer, R.; Moreno, E. Survival of the Fittest: Essential Roles of Cell Competition in Development, Aging, and Cancer. Trends Cell Biol. 2016, 26, 776–788. [Google Scholar] [CrossRef]
- Morata, G.; Calleja, M. Cell competition and tumorigenesis in the imaginal discs of Drosophila. Semin. Cancer Biol. 2020, 63, 19–26. [Google Scholar] [CrossRef]
- Atkins, M.; Potier, D.; Romanelli, L.; Jacobs, J.; Mach, J.; Hamaratoglu, F.; Aerts, S.; Halder, G. An Ectopic Network of Transcription Factors Regulated by Hippo Signaling Drives Growth and Invasion of a Malignant Tumor Model. Curr. Biol. 2016, 26, 2101–2113. [Google Scholar] [CrossRef] [PubMed] [Green Version]
- Davie, K.; Jacobs, J.; Atkins, M.; Potier, D.; Christiaens, V.; Halder, G.; Aerts, S. Discovery of Transcription Factors and Regulatory Regions Driving In Vivo Tumor Development by ATAC-seq and FAIRE-seq Open Chromatin Profiling. PLoS Genet. 2015, 11, e1004994. [Google Scholar] [CrossRef] [PubMed] [Green Version]
- Külshammer, E.; Mundorf, J.; Kilinc, M.; Frommolt, P.; Wagle, P.; Uhlirova, M. Interplay among Drosophila transcription factors Ets21c, Fos and Ftz-F1 drives JNK-mediated tumor malignancy. Dis. Model Mech. 2015, 8, 1279–1293. [Google Scholar] [CrossRef] [PubMed] [Green Version]
- Uhlirova, M.; Bohmann, D. JNK- and Fos-regulated Mmp1 expression cooperates with Ras to induce invasive tumors in Drosophila. EMBO J. 2006, 25, 5294–5304. [Google Scholar] [CrossRef] [PubMed]
- Wu, M.; Pastor-Pareja, J.C.; Xu, T. Interaction between Ras(V12) and scribbled clones induces tumour growth and invasion. Nature 2010, 463, 545–548. [Google Scholar] [CrossRef] [Green Version]
- Igaki, T.; Pagliarini, R.A.; Xu, T. Loss of cell polarity drives tumor growth and invasion through JNK activation in Drosophila. Curr. Biol. 2006, 16, 1139–1146. [Google Scholar] [CrossRef] [Green Version]
- Bilder, D.; Li, M.; Perrimon, N. Cooperative regulation of cell polarity and growth by Drosophila tumor suppressors. Science 2000, 289, 113–116. [Google Scholar] [CrossRef] [Green Version]
- Doggett, K.; Turkel, N.; Willoughby, L.F.; Ellul, J.; Murray, M.J.; Richardson, H.E.; Brumby, A.M. BTB-Zinc Finger Oncogenes Are Required for Ras and Notch-Driven Tumorigenesis in Drosophila. PLoS ONE 2015, 10, e0132987. [Google Scholar] [CrossRef] [Green Version]
- Pantalacci, S.; Tapon, N.; Leopold, P. The Salvador partner Hippo promotes apoptosis and cell-cycle exit in Drosophila. Nat. Cell Biol. 2003, 5, 921–927. [Google Scholar] [CrossRef]
- Logeay, R.; Géminard, C.; Lassus, P.; Héron-Milhavet, L.; Profile, V.O.; Fischer, B.; Bray, S.J.; Colinge, J.; Djiane, A. Loss of epithelial polarity redirects Notch signaling and triggers a Xrp1 response during neoplastic growth in Drosophila. BioRxiv 2020. [Google Scholar]
- Turkel, N.; Sahota, V.K.; Bolden, J.E.; Goulding, K.R.; Doggett, K.; Willoughby, L.F.; Blanco, E.; Martin-Blanco, E.; Corominas, M.; Ellul, J.; et al. The BTB-zinc finger transcription factor abrupt acts as an epithelial oncogene in Drosophila melanogaster through maintaining a progenitor-like cell state. PLoS Genet. 2013, 9, e1003627. [Google Scholar] [CrossRef] [PubMed] [Green Version]
- Turkel, N.; Portela, M.; Poon, C.; Li, J.; Brumby, A.M.; Richardson, H.E. Cooperation of the BTB-Zinc finger protein, Abrupt, with cytoskeletal regulators in Drosophila epithelial tumorigenesis. Biol. Open 2015, 4, 1024–1039. [Google Scholar] [CrossRef] [PubMed] [Green Version]
- Torres, J.; Monti, R.; Moore, A.L.; Seimiya, M.; Jiang, Y.; Beerenwinkel, N.; Beisel, C.; Beira, J.V.; Paro, R. A switch in transcription and cell fate governs the onset of an epigenetically-deregulated tumor in Drosophila. eLife 2018, 7, e32697. [Google Scholar] [CrossRef] [PubMed] [Green Version]
- Pascual, J.; Jacobs, J.; Sansores-Garcia, L.; Natarajan, M.; Zeitlinger, J.; Aerts, S.; Halder, G.; Hamaratoglu, F. Hippo Reprograms the Transcriptional Response to Ras Signaling. Dev. Cell 2017, 42, 667–680. [Google Scholar] [CrossRef] [Green Version]
- Jiménez, G.; Shvartsman, S.Y.; Paroush, Z. The Capicua repressor—A general sensor of RTK signaling in development and disease. J. Cell Sci. 2012, 125, 1383–1391. [Google Scholar] [CrossRef] [Green Version]
- Udan, R.S.; Kango-Singh, M.; Nolo, R.; Tao, C.; Halder, G. Hippo promotes proliferation arrest and apoptosis in the Salvador/Warts pathway. Nat. Cell Biol. 2003, 5, 914–920. [Google Scholar] [CrossRef]
- Wu, S.; Huang, J.; Dong, J.; Pan, D. hippo encodes a Ste-20 family protein kinase that restricts cell proliferation and promotes apoptosis in conjunction with salvador and warts. Cell 2003, 114, 445–456. [Google Scholar] [CrossRef] [Green Version]
- Tapon, N.; Harvey, K.F.; Bell, D.W.; Wahrer, K.C.; Schiripo, T.A.; Haber, D.A.; Hariharan, I.K. salvador Promotes Both Cell Cycle Exit and Apoptosis in Drosophila and Is Mutated in Human Cancer Cell Lines. Cell 2002, 110, 467. [Google Scholar] [CrossRef] [Green Version]
- Harvey, K.F.; Pfleger, C.M.; Hariharan, I.K. The Drosophila Mst ortholog, hippo, restricts growth and cell proliferation and promotes apoptosis. Cell 2003, 114, 457–467. [Google Scholar] [CrossRef] [Green Version]
- Jia, J.; Zhang, W.; Wang, B.; Trinko, R.; Jiang, J. The Drosophila Ste20 family kinase dMST functions as a tumor suppressor by restricting cell proliferation and promoting apoptosis. Genes Dev. 2003, 17, 2514–2519. [Google Scholar] [CrossRef] [Green Version]
- Neto-Silva, R.M.; de Beco, S.; Johnston, L.A. Evidence for a growth-stabilizing regulatory feedback mechanism between Myc and Yorkie, the Drosophila homolog of Yap. Dev. Cell. 2010, 19, 507–520. [Google Scholar] [CrossRef] [PubMed] [Green Version]
- Gontijo, A.M.; Garelli, A. The biology and evolution of the Dilp8-Lgr3 pathway: A relaxin-like pathway coupling tissue growth and developmental timing control. Mech. Dev. 2018, 154, 44–50. [Google Scholar] [CrossRef] [PubMed]
- Colombani, J.; Andersen, D.S.; Léopold, P. Secreted peptide Dilp8 coordinates Drosophila tissue growth with developmental timing. Science 2012, 336, 582–585. [Google Scholar] [CrossRef] [PubMed]
- Boone, E.; Colombani, J.; Andersen, D.S.; Léopold, P. The Hippo signalling pathway coordinates organ growth and limits developmental variability by controlling dilp8 expression. Nat. Commun. 2016, 7, 13505. [Google Scholar] [CrossRef]
- Sitaram, P.; Lu, S.; Harsh, S.; Herrera, S.C.; Bach, E.A. Next-Generation Sequencing Reveals Increased Anti-oxidant Response and Ecdysone Signaling in STAT Supercompetitors in. G3 (Bethesda) 2019, 9, 2609–2622. [Google Scholar] [CrossRef] [Green Version]
- Muller, B.; Hartmann, B.; Pyrowolakis, G.; Affolter, M.; Basler, K. Conversion of an extracellular Dpp/BMP morphogen gradient into an inverse transcriptional gradient. Cell 2003, 113, 221–233. [Google Scholar] [CrossRef] [Green Version]
- Pyrowolakis, G.; Hartmann, B.; Muller, B.; Basler, K.; Affolter, M. A simple molecular complex mediates widespread BMP-induced repression during Drosophila development. Dev. Cell. 2004, 7, 229–240. [Google Scholar] [CrossRef] [Green Version]
- Ferguson, E.L.; Anderson, K.V. Localized enhancement and repression of the activity of the TGF-beta family member, decapentaplegic, is necessary for dorsal-ventral pattern formation in the Drosophila embryo. Genes Dev. 1992, 114, 583–597. [Google Scholar]
- Francois, V.; Solloway, M.; O’Neill, J.W.; Emery, J.; Bier, E. Dorsal-ventral patterning of the Drosophila embryo depends on a putative negative growth factor encoded by the short gastrulation gene. Genes Dev. 1994, 8, 2602–2616. [Google Scholar] [CrossRef] [Green Version]
- Rulifson, E.J.; Blair, S.S. Notch regulates wingless expression and is not required for reception of the paracrine wingless signal during wing margin neurogenesis in Drosophila. Development 1995, 121, 2813–2824. [Google Scholar]
- Djiane, A.; Krejci, A.; Bernard, F.; Fexova, S.; Millen, K.; Bray, S.J. Dissecting the mechanisms of Notch induced hyperplasia. EMBO J. 2013, 32, 60–71. [Google Scholar] [CrossRef] [Green Version]
- Justice, R.W.; Zilian, O.; Woods, D.F.; Noll, M.; Bryant, P.J. The Drosophila tumor suppressor gene warts encodes a homolog of human myotonic dystrophy kinase and is required for the control of cell shape and proliferation. Genes Dev. 1995, 9, 534–546. [Google Scholar] [CrossRef] [Green Version]
- Xu, T.; Wang, W.; Zhang, S.; Stewart, R.A.; Yu, W. Identifying tumor suppressors in genetic mosaics: The Drosophila lats gene encodes a putative protein kinase. Development 1995, 121, 1053–1063. [Google Scholar] [PubMed]
- Kango-Singh, M.; Nolo, R.; Tao, C.; Verstreken, P.; Hiesinger, P.R.; Bellen, H.J.; Halder, G. Shar-pei mediates cell proliferation arrest during imaginal disc growth in Drosophila. Development 2002, 129, 5719–5730. [Google Scholar] [CrossRef] [PubMed] [Green Version]
- Richardson, H.E.; Portela, M. Tissue growth and tumorigenesis in Drosophila: Cell polarity and the Hippo pathway. Curr. Opin. Cell Biol. 2017, 48, 1–9. [Google Scholar] [CrossRef]
- Fulford, A.; Tapon, N.; Ribeiro, P.S. Upstairs, downstairs: Spatial regulation of Hippo signalling. Curr. Opin. Cell Biol. 2018, 51, 22–32. [Google Scholar] [CrossRef]
- Huang, J.; Wu, S.; Barrera, J.; Matthews, K.; Pan, D. The Hippo signaling pathway coordinately regulates cell proliferation and apoptosis by inactivating Yorkie, the Drosophila Homolog of YAP. Cell 2005, 122, 421–434. [Google Scholar] [CrossRef] [PubMed] [Green Version]
- Hamaratoglu, F.; Willecke, M.; Kango-Singh, M.; Nolo, R.; Hyun, E.; Tao, C.; Jafar-Nejad, H.; Halder, G. The tumour-suppressor genes NF2/Merlin and Expanded act through Hippo signalling to regulate cell proliferation and apoptosis. Nat. Cell Biol. 2006, 8, 27–36. [Google Scholar] [CrossRef]
- Nolo, R.; Morrison, C.M.; Tao, C.; Zhang, X.; Halder, G. The bantam microRNA is a target of the hippo tumor-suppressor pathway. Curr. Biol. 2006, 16, 1895–1904. [Google Scholar] [CrossRef] [PubMed] [Green Version]
- Thompson, B.J.; Cohen, S.M. The Hippo pathway regulates the bantam microRNA to control cell proliferation and apoptosis in Drosophila. Cell 2006, 126, 767–774. [Google Scholar] [CrossRef] [Green Version]
- Lucas, E.P.; Khanal, I.; Gaspar, P.; Fletcher, G.C.; Polesello, C.; Tapon, N.; Thompson, B.J. The Hippo pathway polarizes the actin cytoskeleton during collective migration of Drosophila border cells. J. Cell Biol. 2013, 201, 875–885. [Google Scholar] [CrossRef] [PubMed] [Green Version]
- Sansores-Garcia, L.; Bossuyt, W.; Wada, K.; Yonemura, S.; Tao, C.; Sasaki, H.; Halder, G. Modulating F-actin organization induces organ growth by affecting the Hippo pathway. EMBO J. 2011, 30, 2325–2335. [Google Scholar] [CrossRef] [PubMed] [Green Version]
- Poon, C.L.C.; Brumby, A.M.; Richardson, H.E. Cooperates with Oncogenic. Int. J. Mol. Sci. 2018, 19. [Google Scholar]
- Rudrapatna, V.A.; Bangi, E.; Cagan, R.L. A Jnk-Rho-Actin remodeling positive feedback network directs Src-driven invasion. Oncogene 2014, 33, 2801–2806. [Google Scholar] [CrossRef] [Green Version]
- Pallavi, S.K.; Ho, D.M.; Hicks, C.; Miele, L.; Artavanis-Tsakonas, S. Notch and Mef2 synergize to promote proliferation and metastasis through JNK signal activation in Drosophila. EMBO J. 2012, 31, 2895–2907. [Google Scholar] [CrossRef] [PubMed] [Green Version]
- Gupta, R.P.; Bajpai, A.; Sinha, P. Selector genes display tumor cooperation and inhibition in. Biol. Open 2017, 6, 1581–1591. [Google Scholar] [CrossRef] [Green Version]
- Moreno, E.; Yan, M.; Basler, K. Evolution of TNF signaling mechanisms: JNK-dependent apoptosis triggered by Eiger, the Drosophila homolog of the TNF superfamily. Curr. Biol. 2002, 12, 1263–1268. [Google Scholar] [CrossRef] [Green Version]
- Sluss, H.K.; Han, Z.; Barrett, T.; Davis, R.J.; Ip, Y.T. A JNK signal transduction pathway that mediates morphogenesis and an immune response in Drosophila. Genes Dev. 1996, 10, 2745–2758. [Google Scholar] [CrossRef] [Green Version]
- Igaki, T.; Kanda, H.; Yamamoto-Goto, Y.; Kanuka, H.; Kuranaga, E.; Aigaki, T.; Miura, M. Eiger, a TNF superfamily ligand that triggers the Drosophila JNK pathway. EMBO J. 2002, 21, 3009–3018. [Google Scholar] [CrossRef]
- Andersen, D.S.; Colombani, J.; Palmerini, V.; Chakrabandhu, K.; Boone, E.; Röthlisberger, M.; Toggweiler, J.; Basler, K.; Mapelli, M.; Hueber, A.-O.; et al. The Drosophila TNF receptor Grindelwald couples loss of cell polarity and neoplastic growth. Nature 2015, 522, 482–486. [Google Scholar] [CrossRef]
- Kanda, H.; Igaki, T.; Kanuka, H.; Yagi, T.; Miura, M. Wengen, a member of the Drosophila tumor necrosis factor receptor superfamily, is required for Eiger signaling. J. Biol. Chem. 2002, 277, 28372–28375. [Google Scholar] [CrossRef] [PubMed] [Green Version]
- Riesgo-Escovar, J.R.; Jenni, M.; Fritz, A.; Hafen, E. The Drosophila Jun-N-terminal kinase is required for cell morphogenesis but not for DJun-dependent cell fate specification in the eye. Genes Dev. 1996, 10, 2759–2768. [Google Scholar] [CrossRef] [PubMed] [Green Version]
- Donohoe, C.D.; Csordás, G.; Correia, A.; Jindra, M.; Klein, C.; Habermann, B.; Uhlirova, M. Atf3 links loss of epithelial polarity to defects in cell differentiation and cytoarchitecture. PLoS Genet. 2018, 14, e1007241. [Google Scholar] [CrossRef] [PubMed]
- Zhou, J.; Edgar, B.A.; Boutros, M. ATF3 acts as a rheostat to control JNK signalling during intestinal regeneration. Nat. Commun. 2017, 8, 14289. [Google Scholar] [CrossRef] [PubMed] [Green Version]
- La Marca, J.E.; Richardson, H.E. Two-Faced: Roles of JNK Signalling During Tumourigenesis in the. Front. Cell Dev. Biol. 2020, 8, 42. [Google Scholar] [CrossRef] [PubMed] [Green Version]
- Taylor, E.; Alqadri, N.; Dodgson, L.; Mason, D.; Lyulcheva, E.; Messina, G.; Bennett, D. MRL proteins cooperate with activated Ras in glia to drive distinct oncogenic outcomes. Oncogene 2017, 36, 4311–4322. [Google Scholar] [CrossRef] [Green Version]
- Hirabayashi, S.; Baranski, T.J.; Cagan, R.L. Transformed Drosophila cells evade diet-mediated insulin resistance through wingless signaling. Cell 2013, 154, 664–675. [Google Scholar] [CrossRef] [Green Version]
- Ho, D.M.; Pallavi, S.K.; Artavanis-Tsakonas, S. The Notch-mediated hyperplasia circuitry in Drosophila reveals a Src-JNK signaling axis. Elife 2015, 4, e05996. [Google Scholar] [CrossRef]
- Bossuyt, W.; De Geest, N.; Aerts, S.; Leenaerts, I.; Marynen, P.; Hassan, B.A. The atonal proneural transcription factor links differentiation and tumor formation in Drosophila. PLoS Biol. 2009, 7, e40. [Google Scholar] [CrossRef]
- Gerlach, S.U.; Eichenlaub, T.; Herranz, H. Yorkie and JNK Control Tumorigenesis in Drosophila Cells with Cytokinesis Failure. Cell Rep. 2018, 23, 1491–1503. [Google Scholar] [CrossRef]
- Flaherty, M.S.; Salis, P.; Evans, C.J.; Ekas, L.A.; Marouf, A.; Zavadil, J.; Banerjee, U.; Bach, E.A. chinmo Is a Functional Effector of the JAK/STAT Pathway that Regulates Eye Development, Tumor Formation, and Stem Cell Self-Renewal in Drosophila. Dev. Cell 2010, 18, 556–568. [Google Scholar] [CrossRef] [PubMed] [Green Version]
- Stec, W.; Vidal, O.; Zeidler, M.P. Drosophila SOCS36E negatively regulates JAK/STAT pathway signaling via two separable mechanisms. Mol. Biol. Cell. 2013, 24, 3000–3009. [Google Scholar] [CrossRef]
- Callus, B.A.; Mathey-Prevot, B. SOCS36E, a novel Drosophila SOCS protein, suppresses JAK/STAT and EGF-R signalling in the imaginal wing disc. Oncogene 2002, 21, 4812–4821. [Google Scholar] [CrossRef] [Green Version]
- Bina, S.; Wright, V.M.; Fisher, K.H.; Milo, M.; Zeidler, M.P. Transcriptional targets of Drosophila JAK/STAT pathway signalling as effectors of haematopoietic tumour formation. EMBO Rep. 2010, 11, 201–207. [Google Scholar] [CrossRef] [Green Version]
- Müller, P.; Kuttenkeuler, D.; Gesellchen, V.; Zeidler, M.P.; Boutros, M. Identification of JAK/STAT signalling components by genome-wide RNA interference. Nature 2005, 436, 871–875. [Google Scholar]
- Baeg, G.H.; Zhou, R.; Perrimon, N. Genome-wide RNAi analysis of JAK/STAT signaling components in Drosophila. Genes Dev. 2005, 19, 1861–1870. [Google Scholar] [CrossRef] [Green Version]
- Flaherty, M.S.; Zavadil, J.; Ekas, L.A.; Bach, E.A. Genome-wide expression profiling in the Drosophila eye reveals unexpected repression of notch signaling by the JAK/STAT pathway. Dev. Dyn. 2009, 238, 2235–2253. [Google Scholar] [CrossRef] [Green Version]
- Ayala-Camargo, A.; Ekas, L.A.; Flaherty, M.S.; Baeg, G.H.; Bach, E.A. The JAK/STAT pathway regulates proximo-distal patterning in Drosophila. Dev. Dyn. 2007, 236, 2721–2730. [Google Scholar] [CrossRef]
- Lopes, E.S.; Araujo, H.M. The maternal JAK/STAT pathway of Drosophila regulates embryonic dorsal-ventral patterning. Braz. J. Med. Biol. Res. 2004, 37, 1811–1818. [Google Scholar] [CrossRef] [Green Version]
- Chen, C.L.; Schroeder, M.C.; Kango-Singh, M.; Tao, C.; Halder, G. Tumor suppression by cell competition through regulation of the Hippo pathway. Proc. Natl. Acad. Sci. USA 2012, 109, 484–489. [Google Scholar] [CrossRef] [Green Version]
- Artavanis-Tsakonas, S.; Rand, M.D.; Lake, R.J. Notch signaling: Cell fate control and signal integration in development. Science 1999, 284, 770–776. [Google Scholar] [CrossRef] [PubMed] [Green Version]
- Krejcí, A.; Bernard, F.; Housden, B.E.; Collins, S.; Bray, S.J. Direct response to Notch activation: Signaling crosstalk and incoherent logic. Sci. Signal. 2009, 2, ra1. [Google Scholar] [CrossRef]
- Slaninova, V.; Krafcikova, M.; Perez-Gomez, R.; Steffal, P.; Trantirek, L.; Bray, S.J.; Krejci, A. Notch stimulates growth by direct regulation of genes involved in the control of glycolysis and the tricarboxylic acid cycle. Open Biol. 2016, 6, 150155. [Google Scholar] [CrossRef]
- Zhang, W.; Cohen, S.M. The Hippo pathway acts via p53 and microRNAs to control proliferation and proapoptotic gene expression during tissue growth. Biol. Open. 2013, 2, 822–828. [Google Scholar] [CrossRef] [Green Version]
- Perez, E.; Lindblad, J.L.; Bergmann, A. Tumor-promoting function of apoptotic caspases by an amplification loop involving ROS, macrophages and JNK in Drosophila. eLife 2017, 6, 6. [Google Scholar] [CrossRef]
- Letai, A. Functional precision cancer medicine-moving beyond pure genomics. Nat. Med. 2017, 23, 1028–1035. [Google Scholar] [CrossRef]
- Bangi, E. Strategies for Functional Interrogation of Big Cancer Data Using Drosophila Cancer Models. Int. J. Mol. Sci. 2020, 21, 3754. [Google Scholar] [CrossRef]
Figure 1.
Expression levels of dilp8 and cell fate determinants in various tumor models. Samples were grouped according to their tissue of origin. Genes that act in the retinal determination network and their downstream effectors are highlighted in yellow, whereas genes required for cell fate determination in the wing are highlighted in blue. Three genes with developmental roles in both tissues are highlighted in green. Gene expression is displayed as fold change in log2 (log2FC) compared with controls. Color coding corresponds to a heatmap with a scale from −5 (dark red, downregulation) to 5 (dark green, upregulation). The midpoint, 0, is white. Light grey cells represent non-significant changes with p ≥ 0.05. Cells are shown in dark grey if the gene was not found in the datasets owing to different cut-offs used by different groups. Abbreviations: Insulin like peptide 8, Ilp8; twin of eyeless, toy; eyeless, ey; eyes absent, eya; sine oculis, so; dachshund, dac; Embryonic Lethal Abnormal Vision, ELAV; atonal, ato; homothorax, hth; teashirt, tsh; senseless, sens; Distalless, Dll; vestigial, vg; nubbin, nub).

Figure 2.
Epidermal growth factor receptor (EGFR)/Ras activation is not a prerequisite for tumor formation. Light purple highlights the transcription factors of the pathway. Note that pnt is a transcription factor and also a transcriptional target of the pathway. Gene expression is displayed in log2FC. Color coding corresponds to a heatmap with a scale from −5 (dark red, downregulation) to 5 (dark green, upregulation). Light grey cells represent non-significant changes with p ≥ 0.05. Dark grey: the gene was not found in the dataset. n.e. = not expressed, the gene was in the data, but showed 0 reads. Abbreviations: Sulfated, Sulf1; Ecdysone receptor, EcR spitz, spi; argos, aos; sprouty, sty; Leucine-rich tendon-specific protein, Lrt; pointed, pnt.

Figure 3.
Tumors display a trend of overall suppression of Dpp, Hh, and Wg pathways. The target genes that are suppressed by the pathway are shown in bold, and pathway inhibitors are shown in red. Light purple highlights the transcription factors of each pathway. brk meets all three criteria. In the case of the Hh and Wg pathways, the ligands are also shown and highlighted in light purple, their expression is not necessarily regulated by their own pathway, but their excess production can activate their respective pathway. dpp is a transcriptional target of Hh signaling and is shown in that section. Gene expression is displayed in log2FC. Color coding corresponds to a heatmap with a scale from −5 (dark red, downregulation) to 5 (dark green, upregulation). Light grey cells represent non-significant changes with p ≥ 0.05. Dark grey: the gene was not found in the dataset. n.e. = not expressed, the gene was in the data, but showed 0 reads. Abbreviations: Daughters against Dpp, Dad; Dorsocross 1-3, Doc1-3; bag of marbles, bam; crossveinless-2, cv-2; brinker, brk; Mothers against Dpp, Mad; Medea, Med; short gastrulation, sog; knot, kn; collier, coll; cut, ct; naked, nkd; arrow, arr; Drosophila T cell factor, dTCF; pangolin, pan; armadillo, arm.

Figure 4.
Yorkie activation contributes to tumorigenesis in models with polarity loss. Light purple highlights the nuclear factors of the pathway. Target genes that are known to also be regulated by other pathways are highlighted in cyan. Gene expression is displayed in log2FC. Color coding corresponds to a heatmap with a scale from −5 (dark red) to 5 (dark green). Light grey cells represent non-significant changes with p ≥ 0.05. Dark grey: the gene was not found in the dataset. Abbreviations: Insulin like peptide 8, Ilp8; diminutive, dm; expanded, ex; warts, wts; division abnormally delayed, dally; scalloped, sd; yorkie, yki.

Figure 5.
Activation of JNK is a common feature of all tumor models analyzed. Light purple highlights nuclear factors of the JNK pathway. Target genes that are known to also be regulated by other pathways are highlighted in cyan. Gene expression is displayed in log2FC. Color coding corresponds to a heatmap with a scale from −5 (dark red) to 5 (dark green). Light grey cells represent non-significant changes with p ≥ 0.05. Dark grey: the gene was not found in the dataset. n.e. = not expressed, the gene was in the data, but showed 0 reads. Abbreviations: ftz transcription factor 1, ftz-f1; cheerio, cher; outstretched, os; Ets at 21C, Ets21c; Paxillin, Pax; kayak, kay; Activating transcription factor 3, Atf3; CCAATT Enhancer Binding Protein Gamma, CEBPG; Inverted repeat binding protein 18, Irbp18; Jun-related antigen, Jra; PAR-domain protein 1, Pdp1.

Figure 6.
Most tumors have high levels of JAK/STAT activity. The target genes that are suppressed by the pathway are shown in bold, and pathway inhibitors are shown in red. Light purple highlights the transcription factor of the pathway. Gene expression is displayed in log2FC. Color coding corresponds to a heatmap with a scale from −5 (dark red) to 5 (dark green). Light grey cells represent non-significant changes with p ≥ 0.05. Dark grey: the gene was not found in the dataset. Abbreviations: Suppressor of Cytokine Signaling at 36E, Socs36E; Protein tyrosine phosphatase 61F, Ptp61F; chronologically inappropriate morphogenesis, chinmo; cap-n-collar, cnc; lamina ancestor, lama; Zn finger homeodomain 2, zfh2; terribly reduced optic lobes, trol; dorsal, dl; NADPH oxidase, Nox; Keap1, Keap1; and pannier, pnr.

Figure 7.
E (spl) genes are downregulated, whereas the other N target genes are induced in tumors. Light purple highlights the nuclear factors the pathway. Genes highlighted in cyan are predicted Yki/Sd targets [41]. Gene expression is displayed in log2FC. Color coding corresponds to a heatmap with a scale from −5 (dark red) to 5 (dark green). Light grey cells represent non-significant changes with p > 0.05. Dark grey: the gene was not found in the datasets. Abbreviations: Enhancer of split, E(spl); deadpan, dpn; Serrate, Ser; fruitless, fru; D-2-hydroxyglutaric acid dehydrogenase, D2hgdh; pickled eggs, pigs; jitterbug, jbug; Lactate dehydrogenase, Ldh; C-terminal Src kinase, Csk.

Figure 8.
Expression of select transcription factors (TFs) across tumors. Gene expression is displayed in log2FC. Color coding corresponds to a heatmap with a scale from −5 (dark red) to 5 (dark green). Light grey cells represent non-significant changes with p ≥ 0.05. Dark grey: the gene was not found in the datasets. n.e. = not expressed, the gene was in the data, but showed 0 reads. Abbreviations: ftz transcription factor 1, ftz-f1; diminutive, dm; Ets at 21C, Ets21c; chronologically inappropriate morphogenesis, chinmo; kayak, kay; Activating transcription factor 3, Atf3; CCAATT Enhancer Binding Protein Gamma, CEBPG; Inverted repeat binding protein 18, Irbp18; Jun-related antigen, Jra; PAR-domain protein 1, Pdp1; abrupt, ab; capicua, cic.

Figure 9.
Expression of genes involved in apoptosis and cell cycle across tumors. Gene expression is displayed in log2FC. Color coding corresponds to a heatmap with a scale from −5 (dark red) to 5 (dark green). Light grey cells represent non-significant changes with p ≥ 0.05. Dark grey: the gene was not found in the datasets. Abbreviations: head involution defective, hid; repear, rpr; thread, th; string, stg; Cyclin A, CycA; E2F transcription factor 1, E2f1.

Figure 10.
Overall summary of pathway activity across tumors. Yellow boxes indicate that the data were either inconclusive or there was no significant change in pathway activity based on target gene expression levels. White background indicates low confidence as the conclusion was based on a single data point.


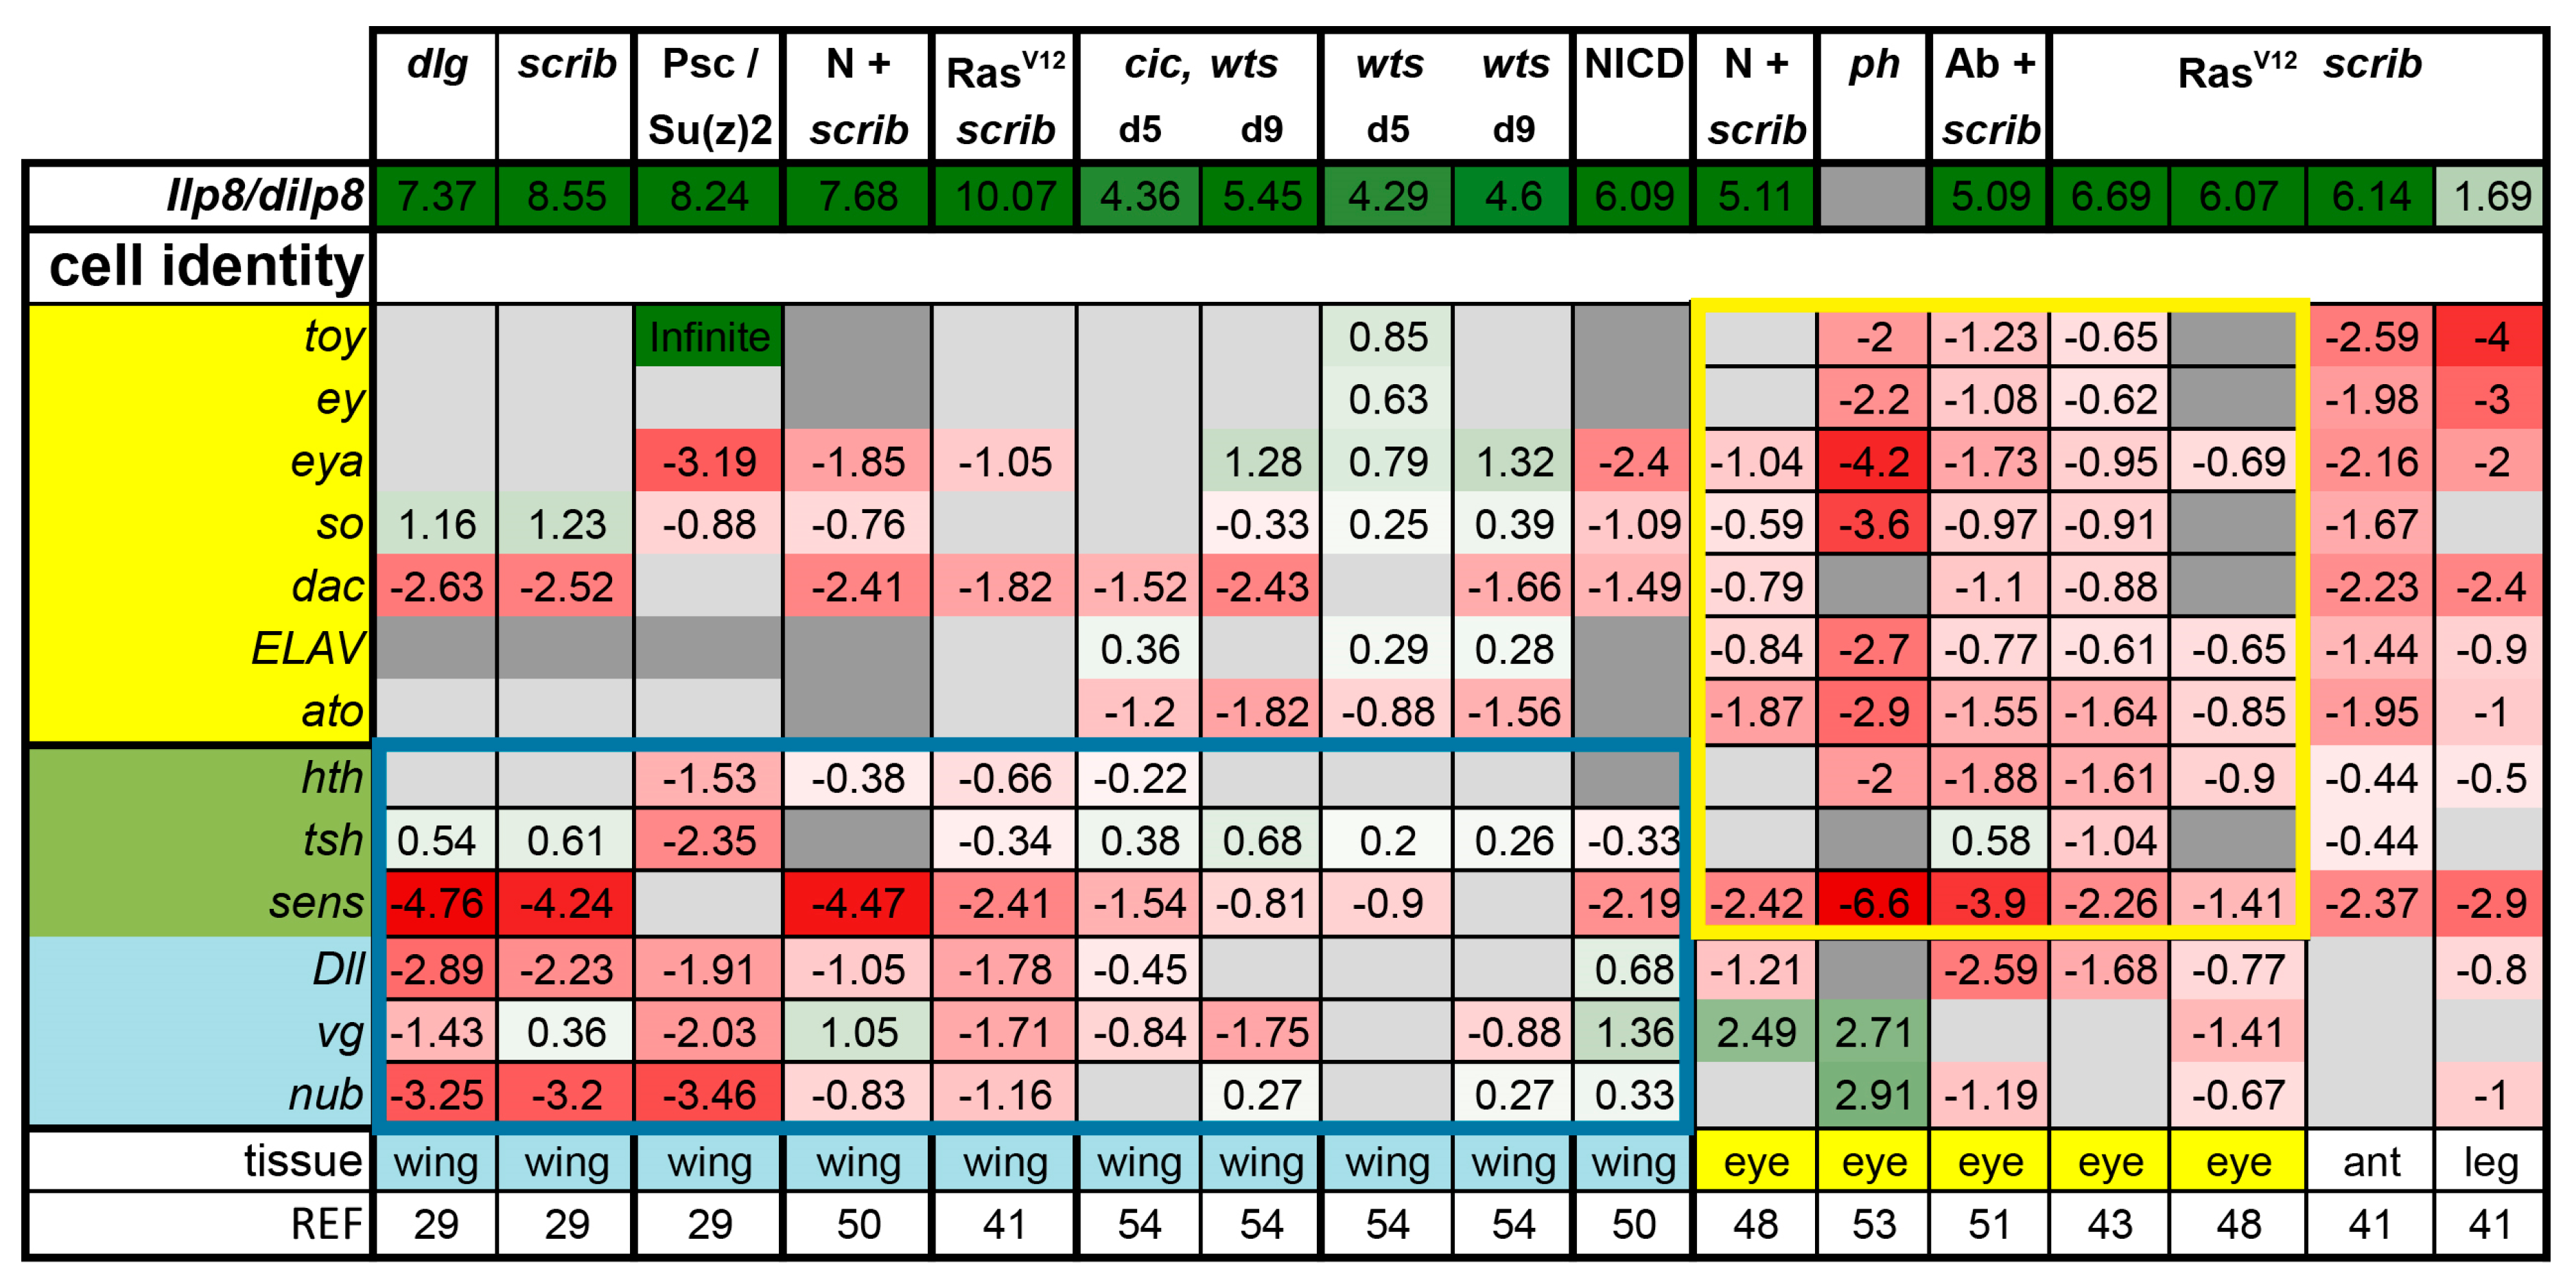
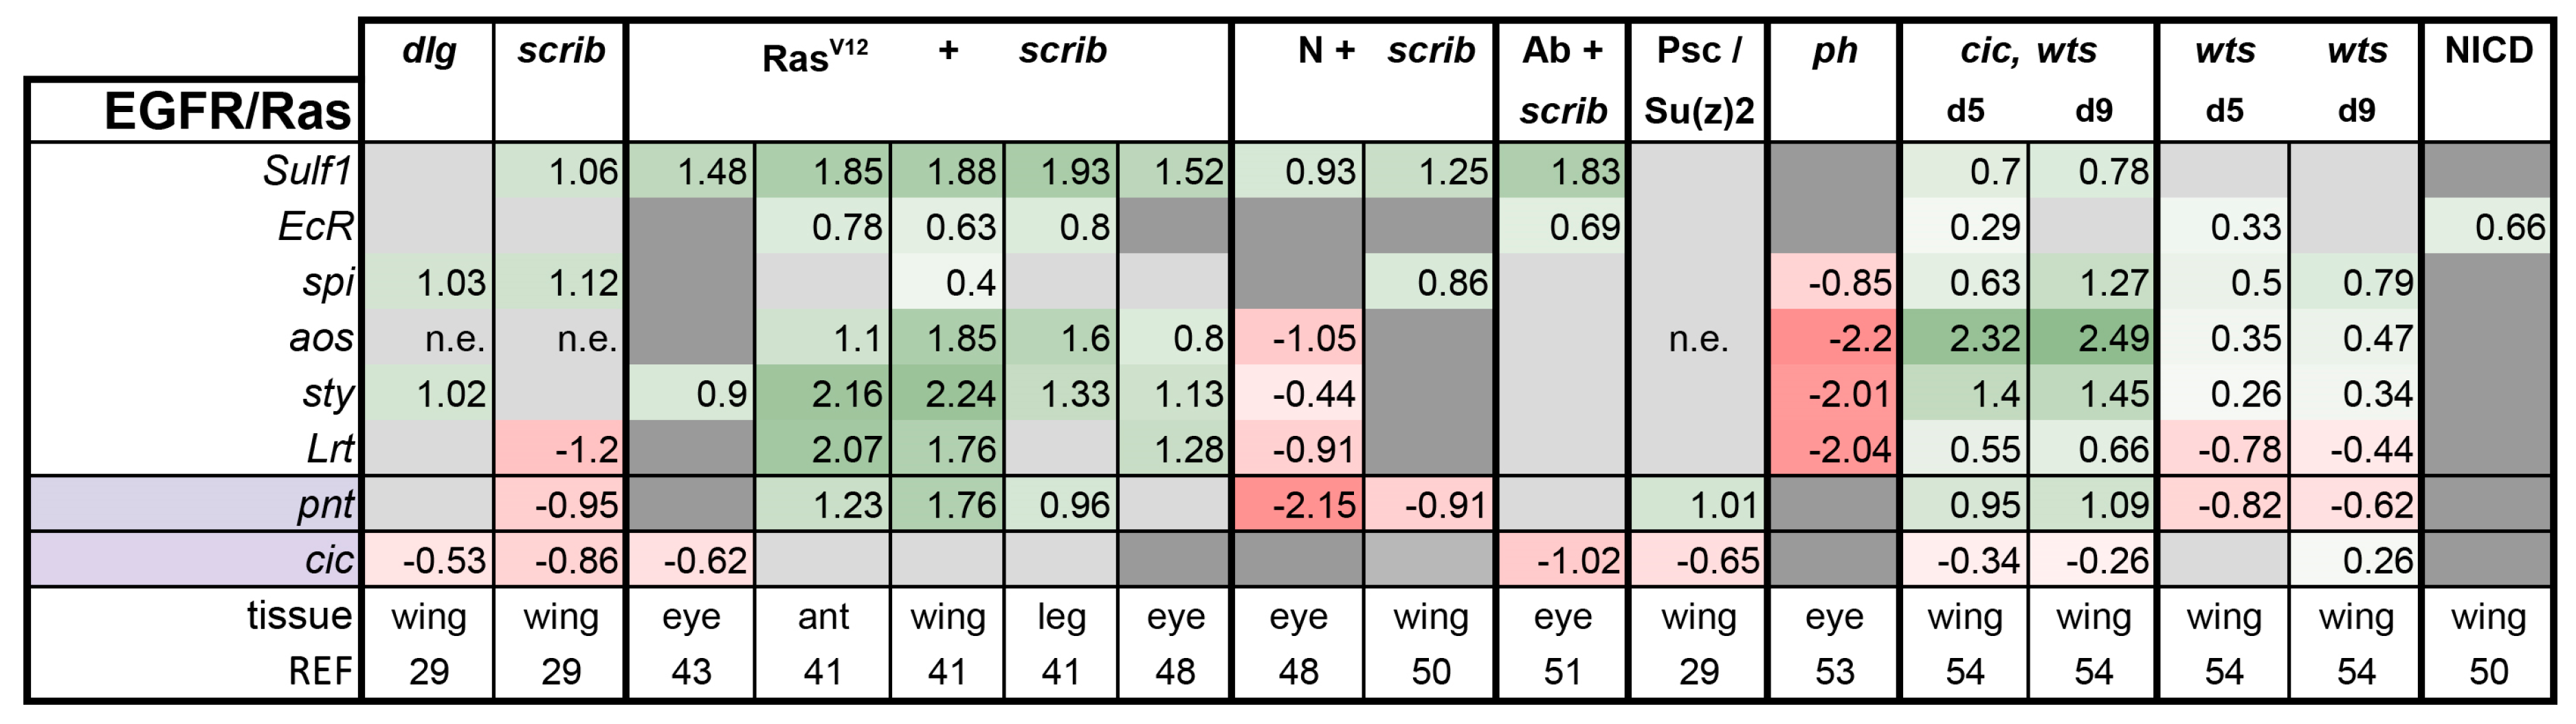
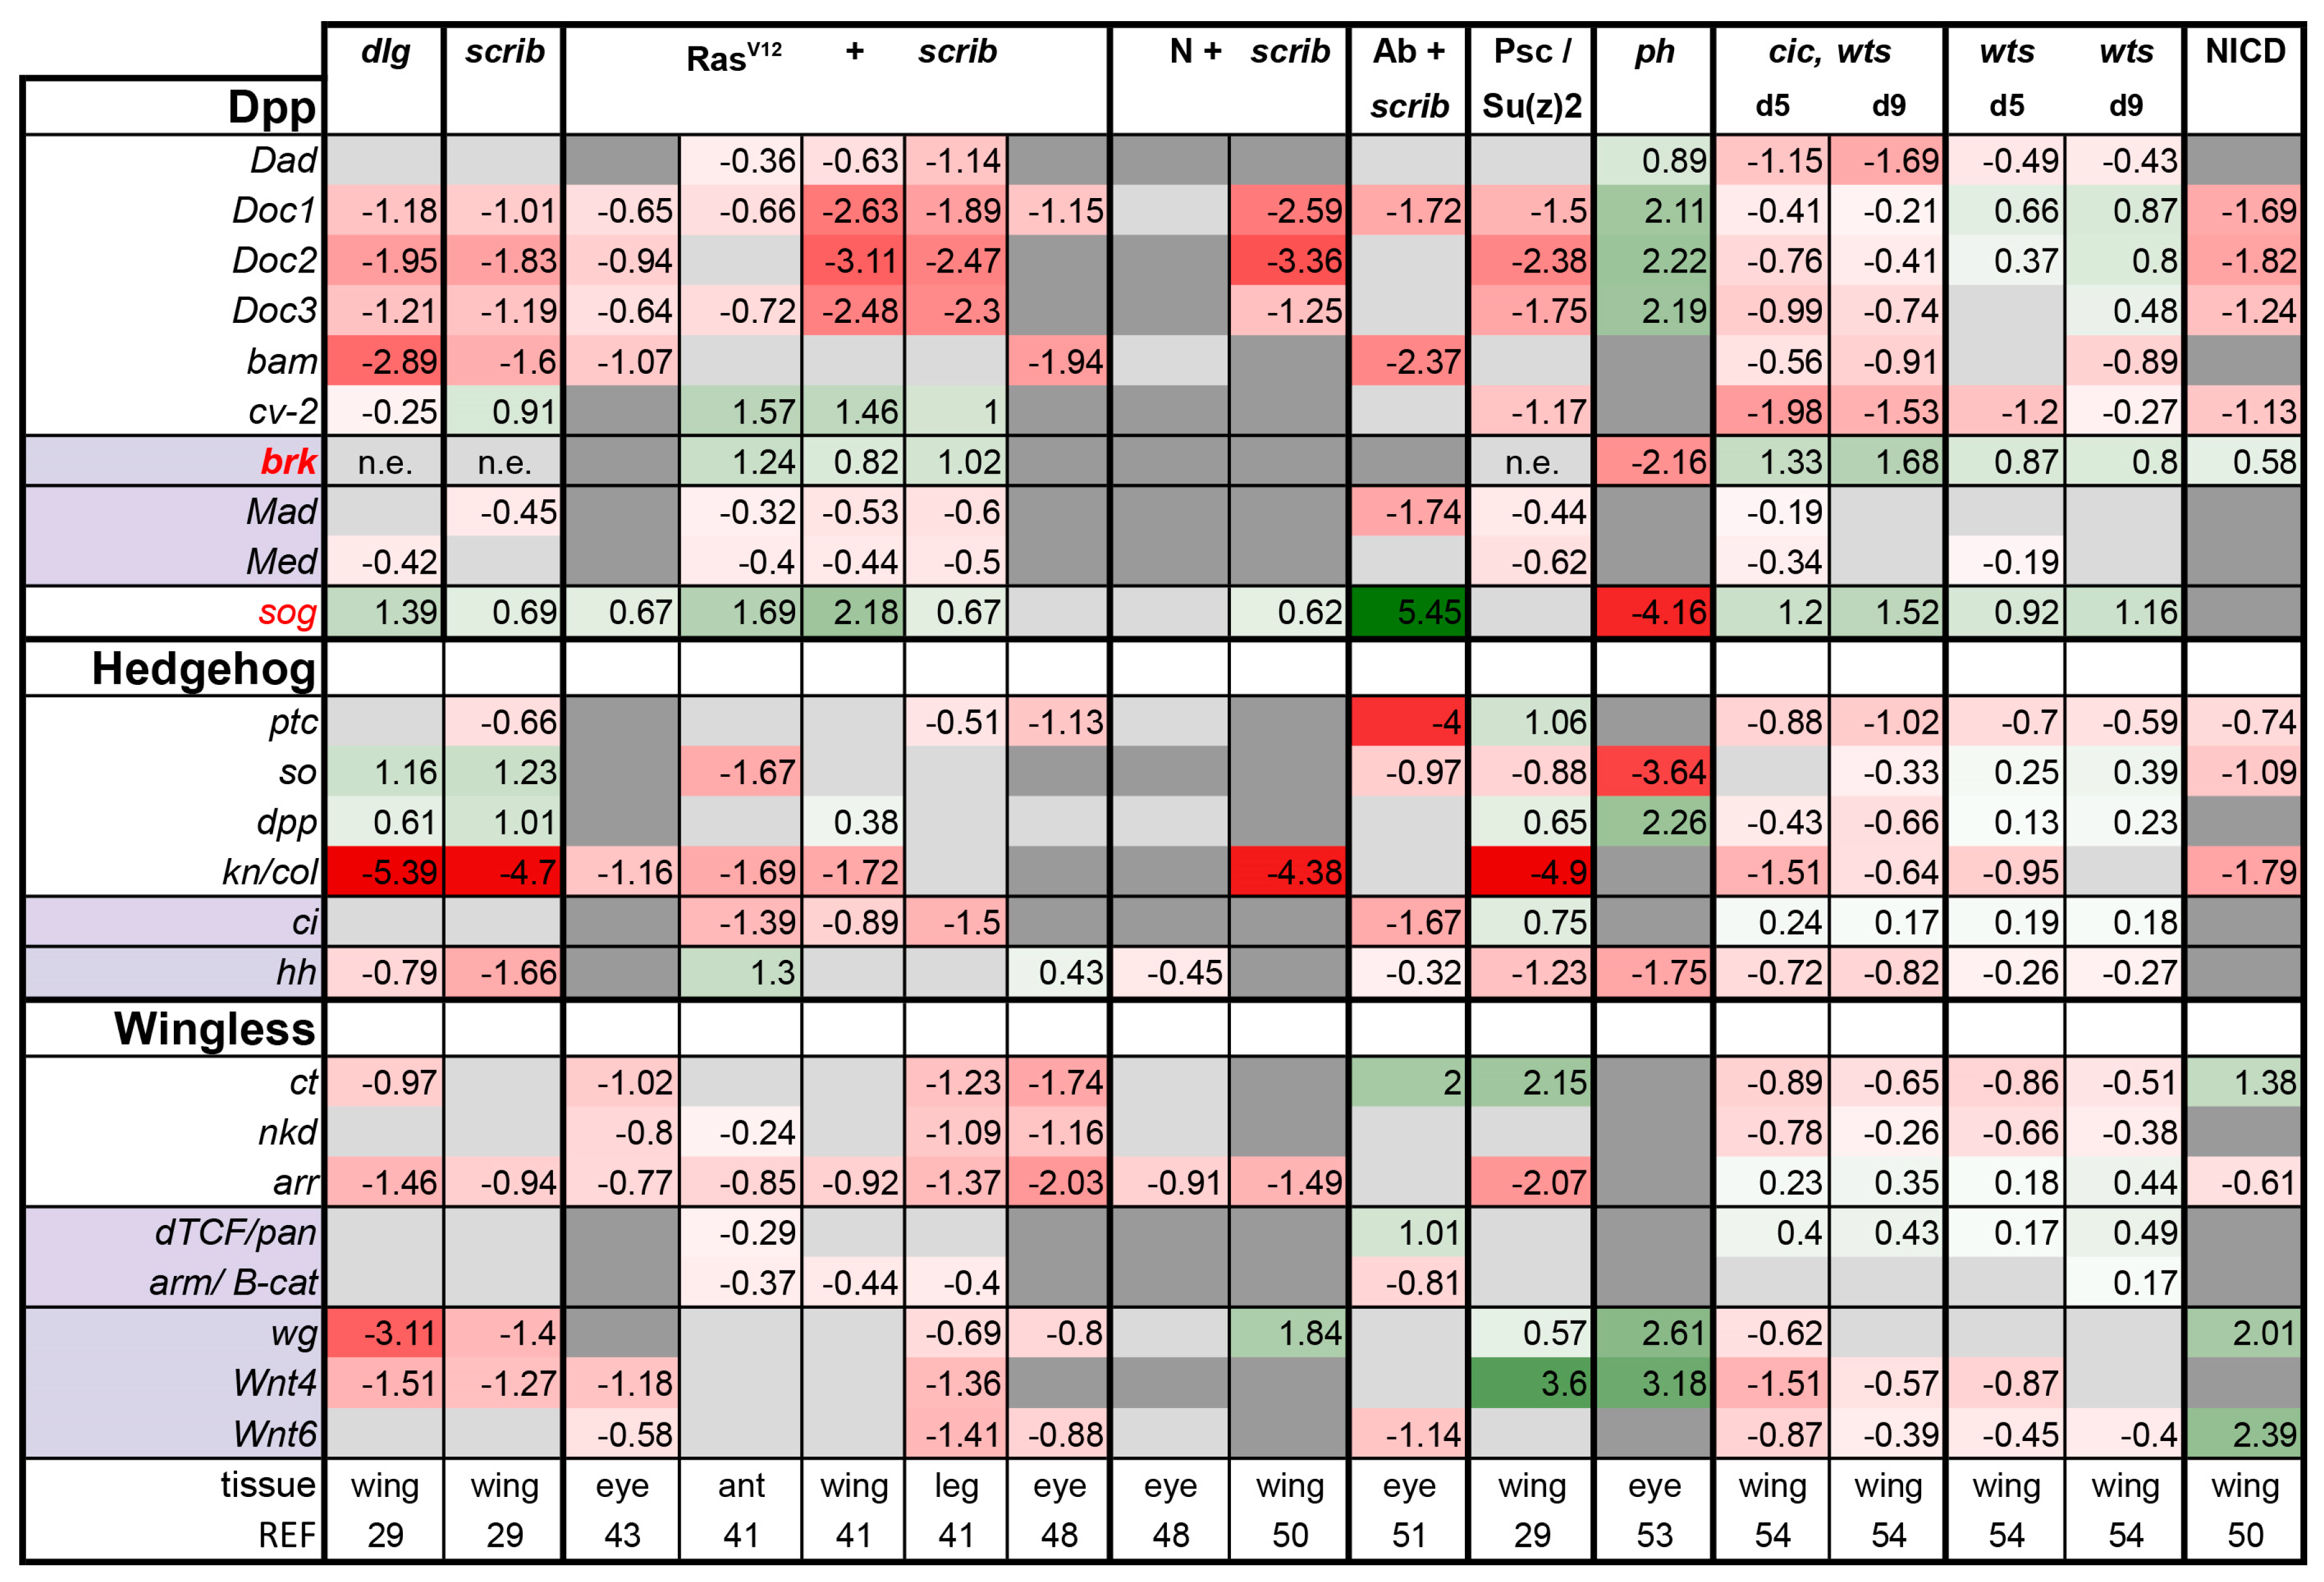
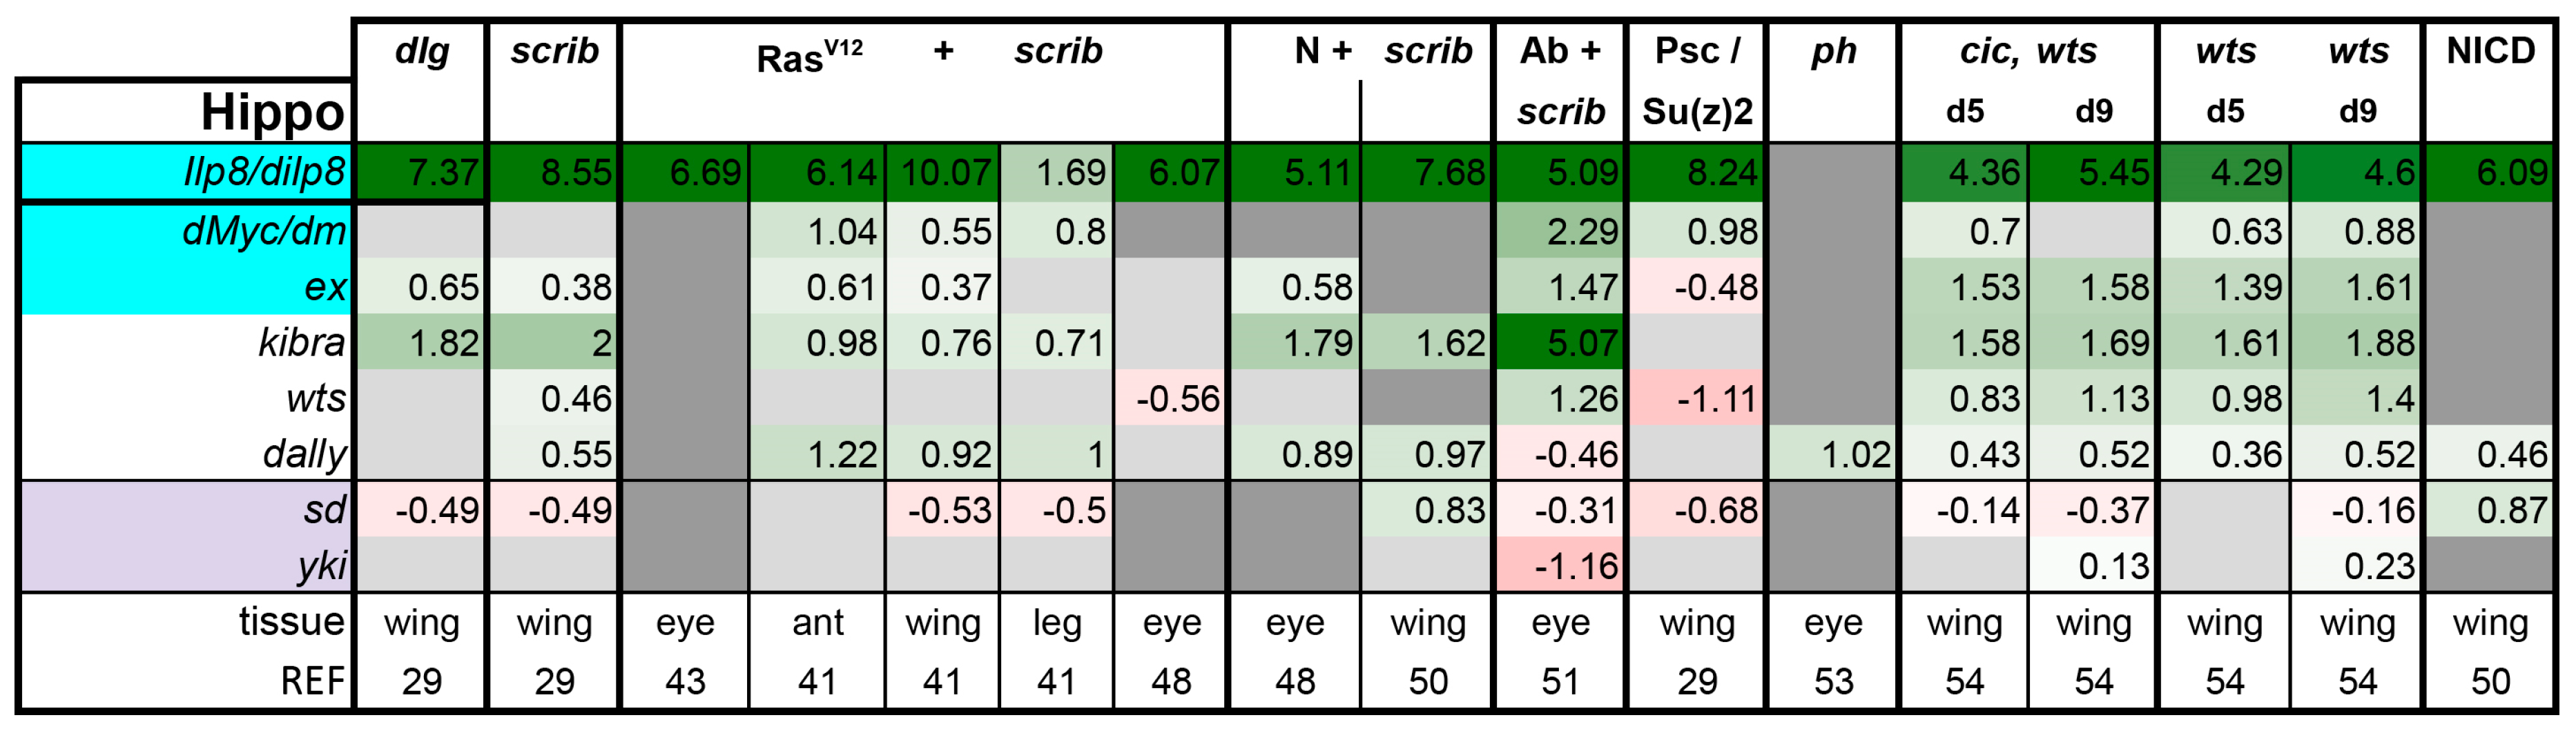
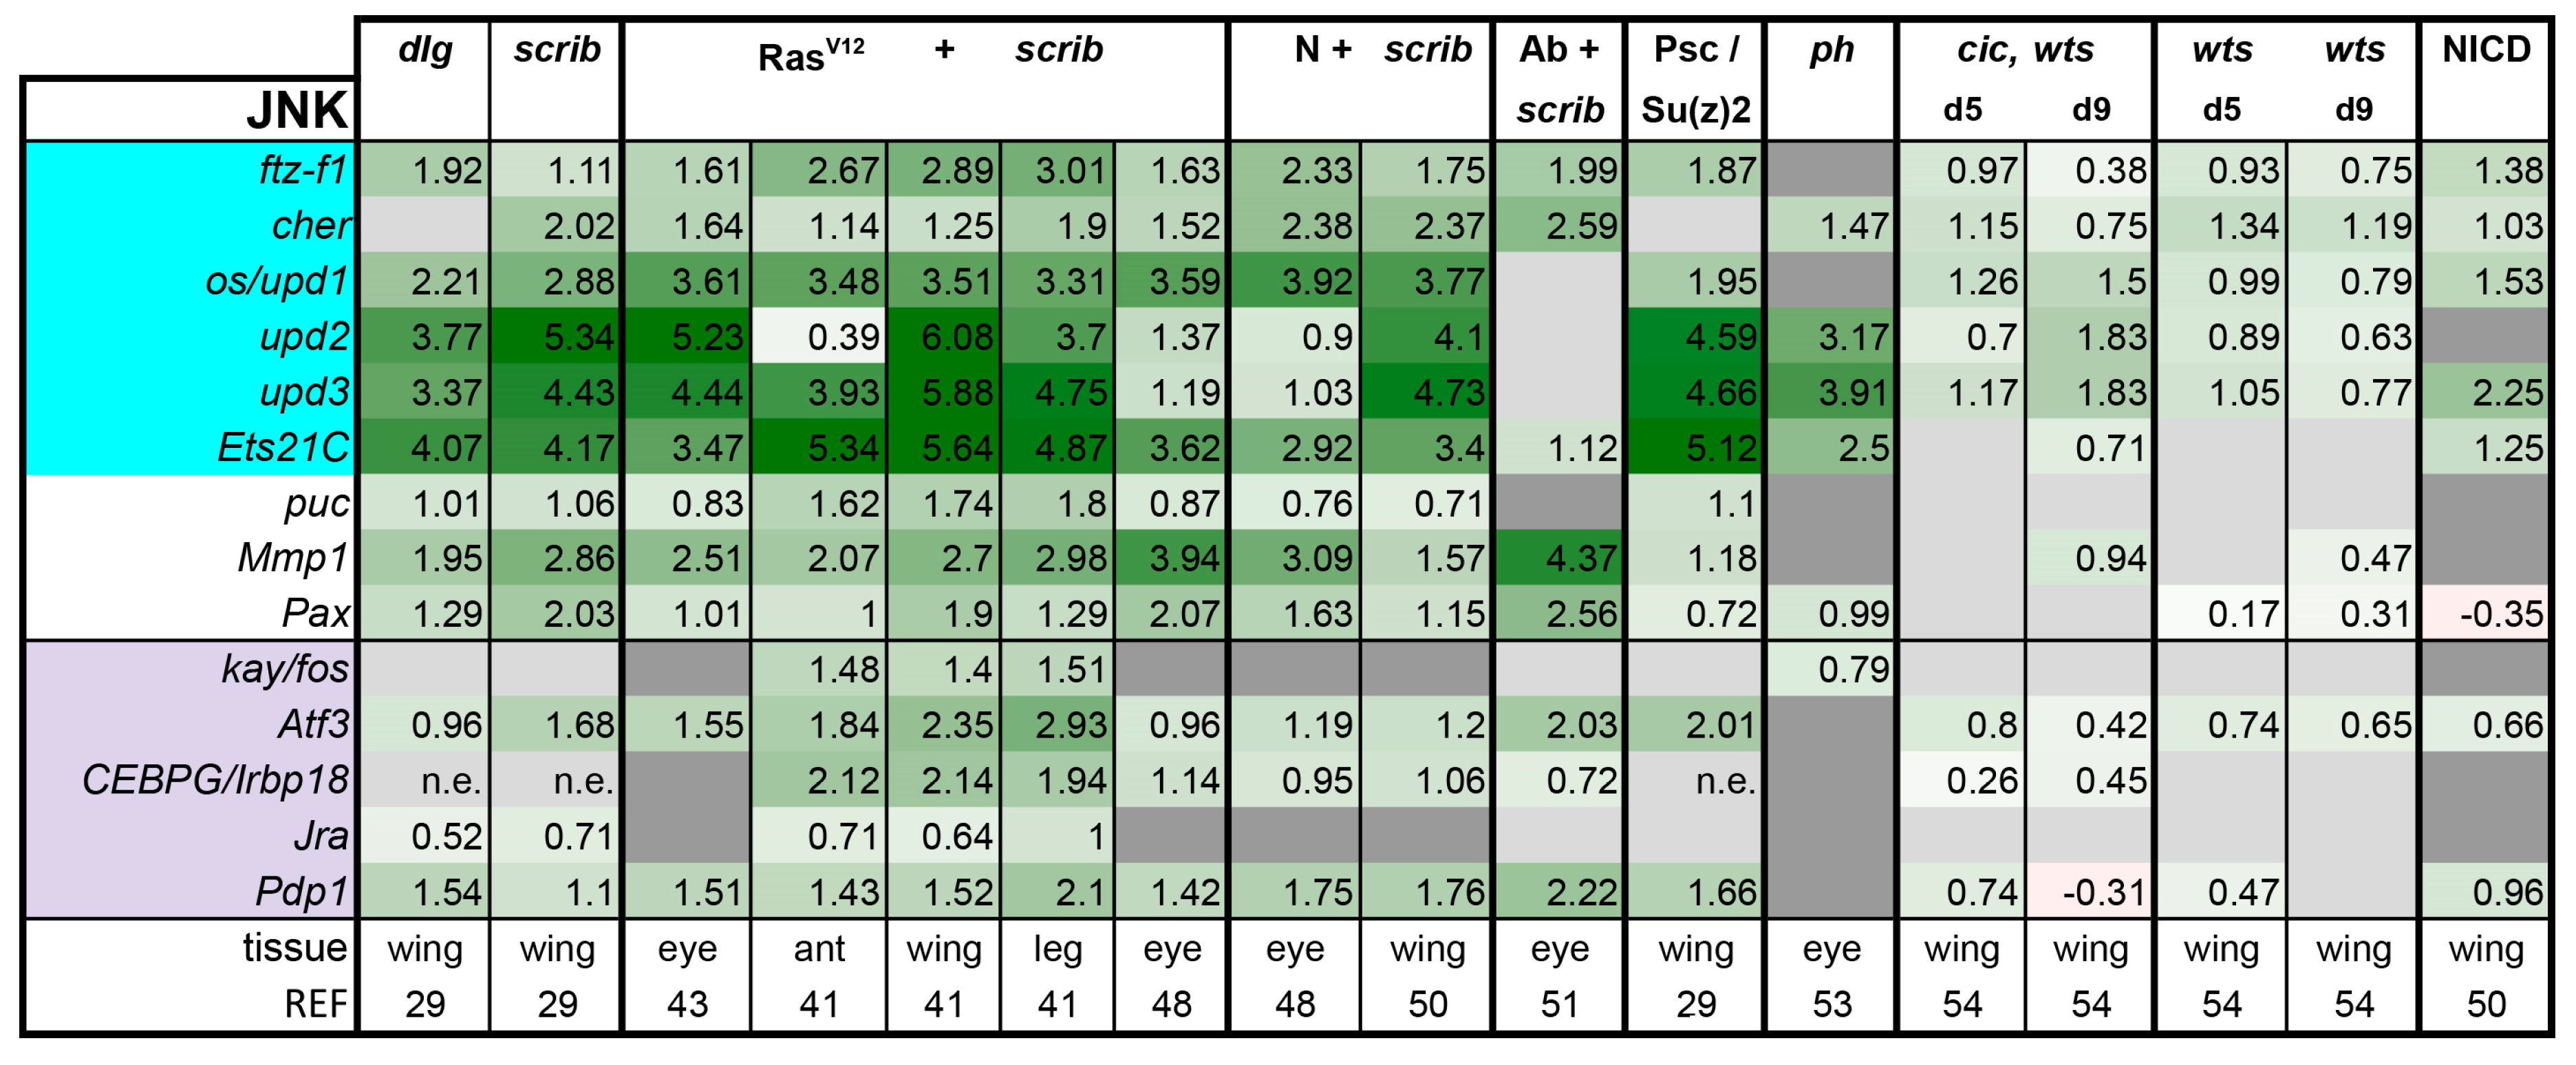
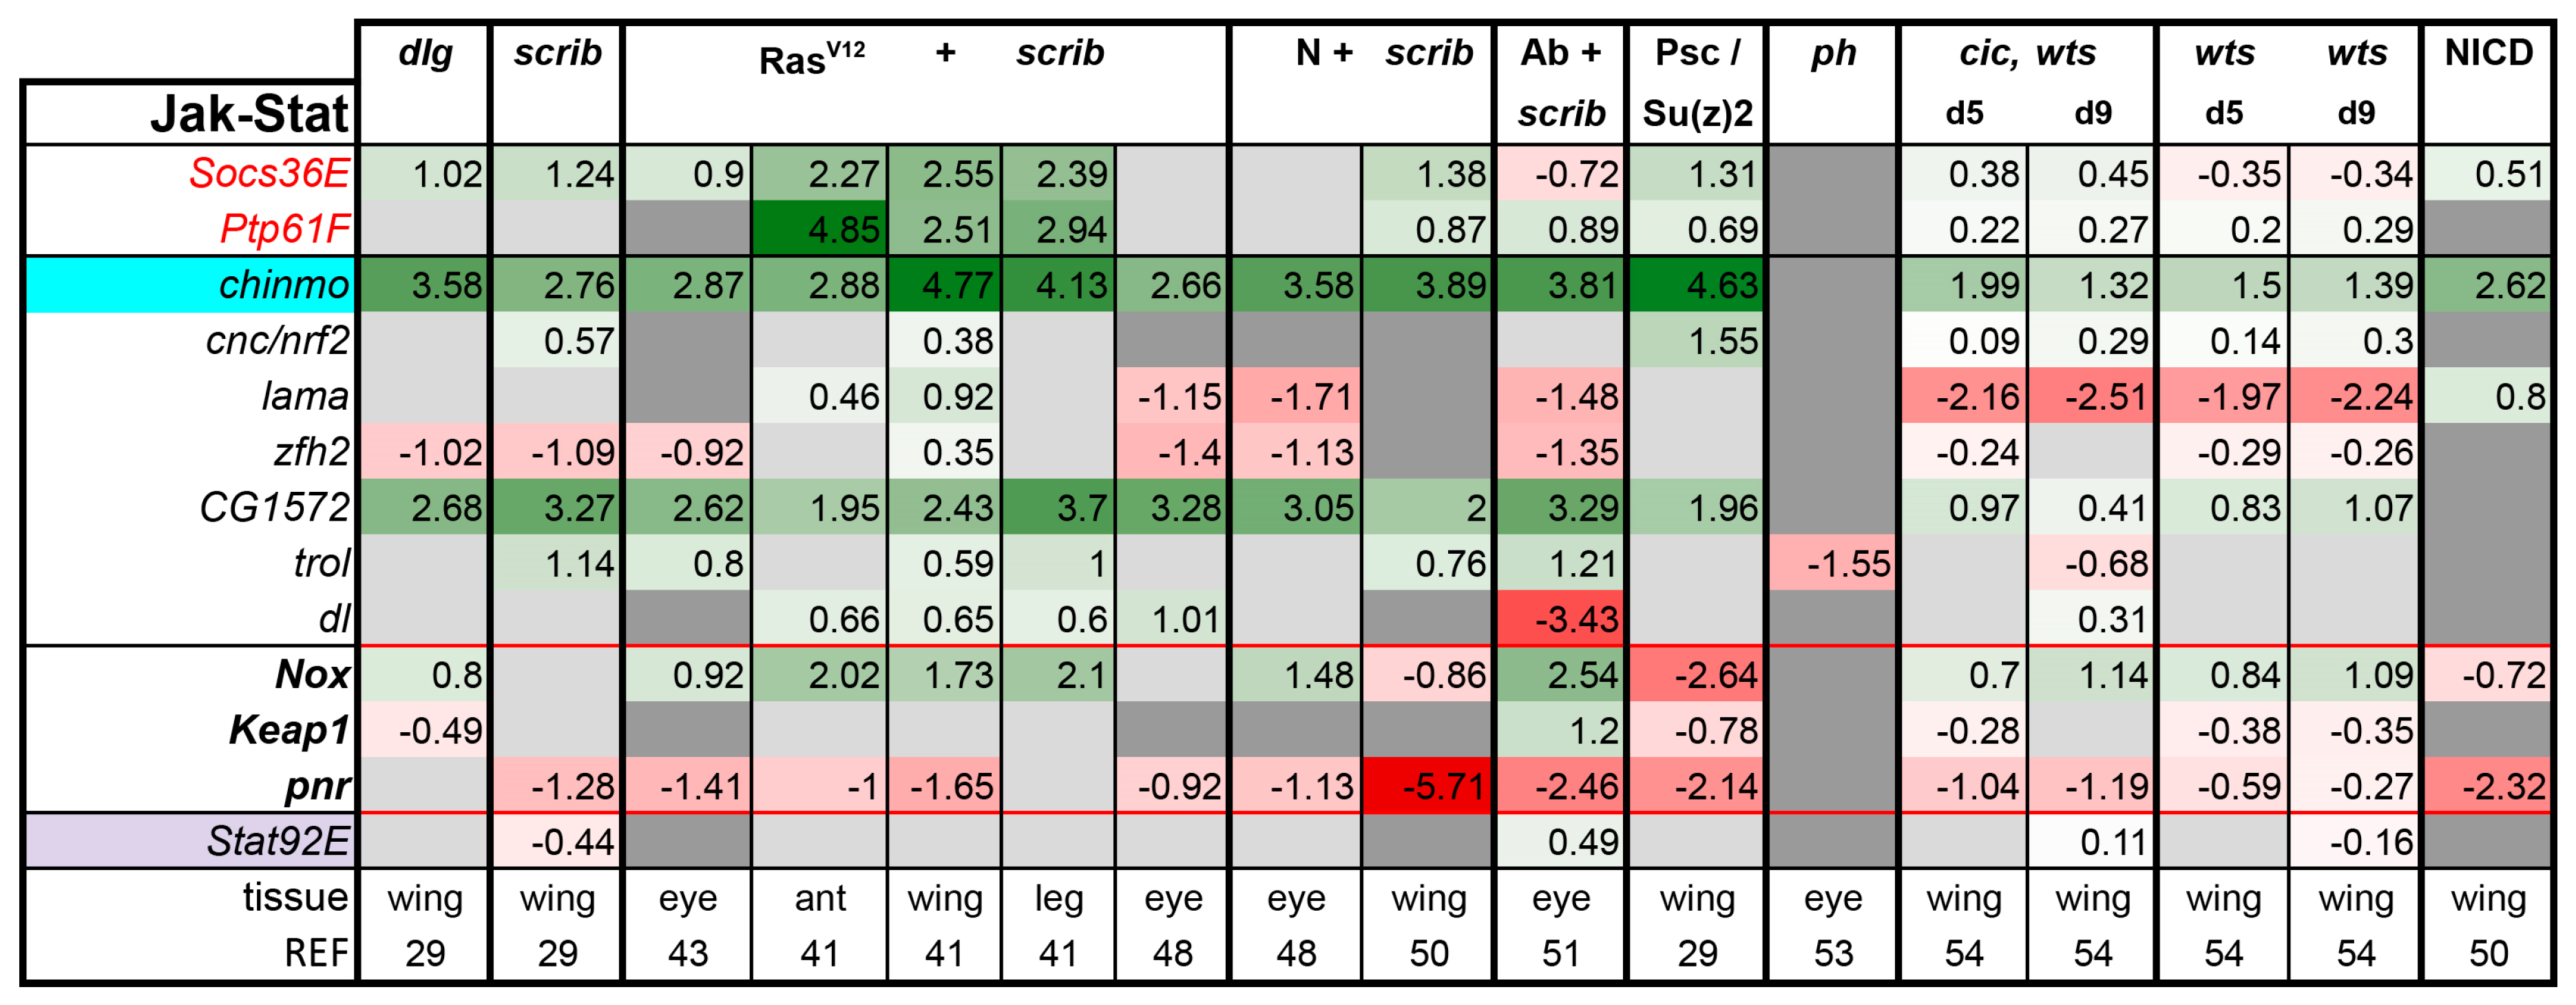
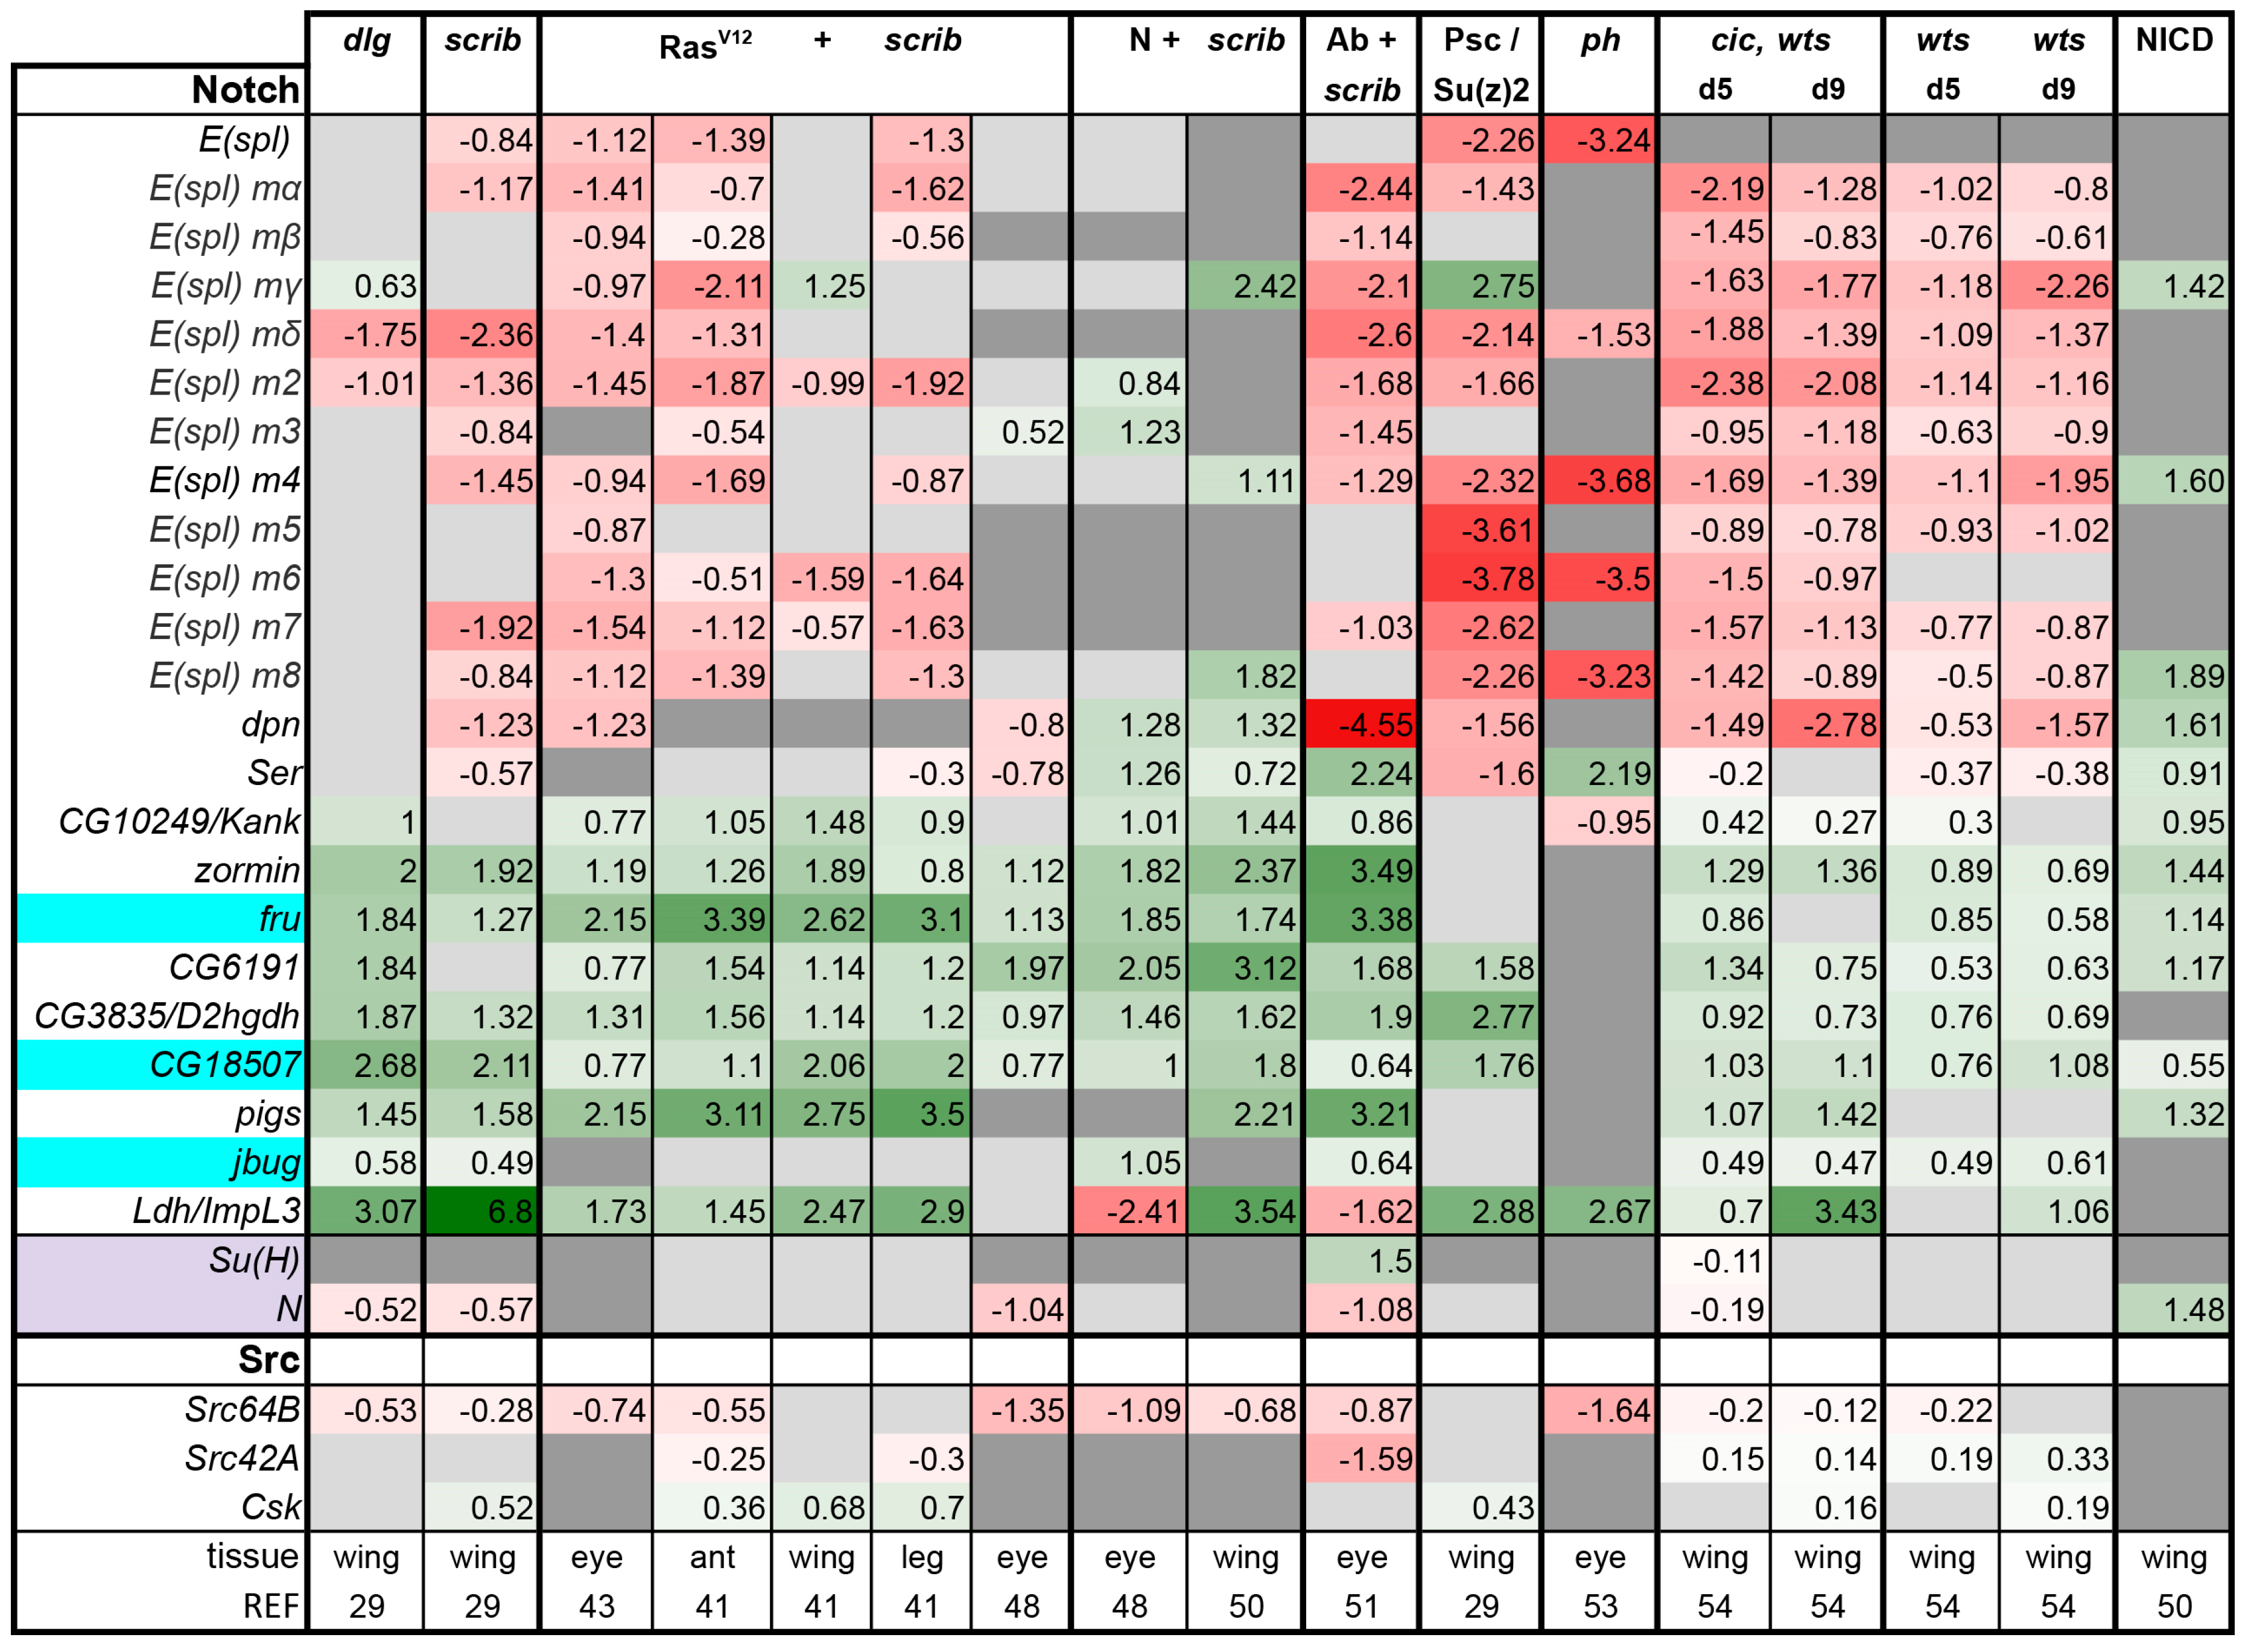
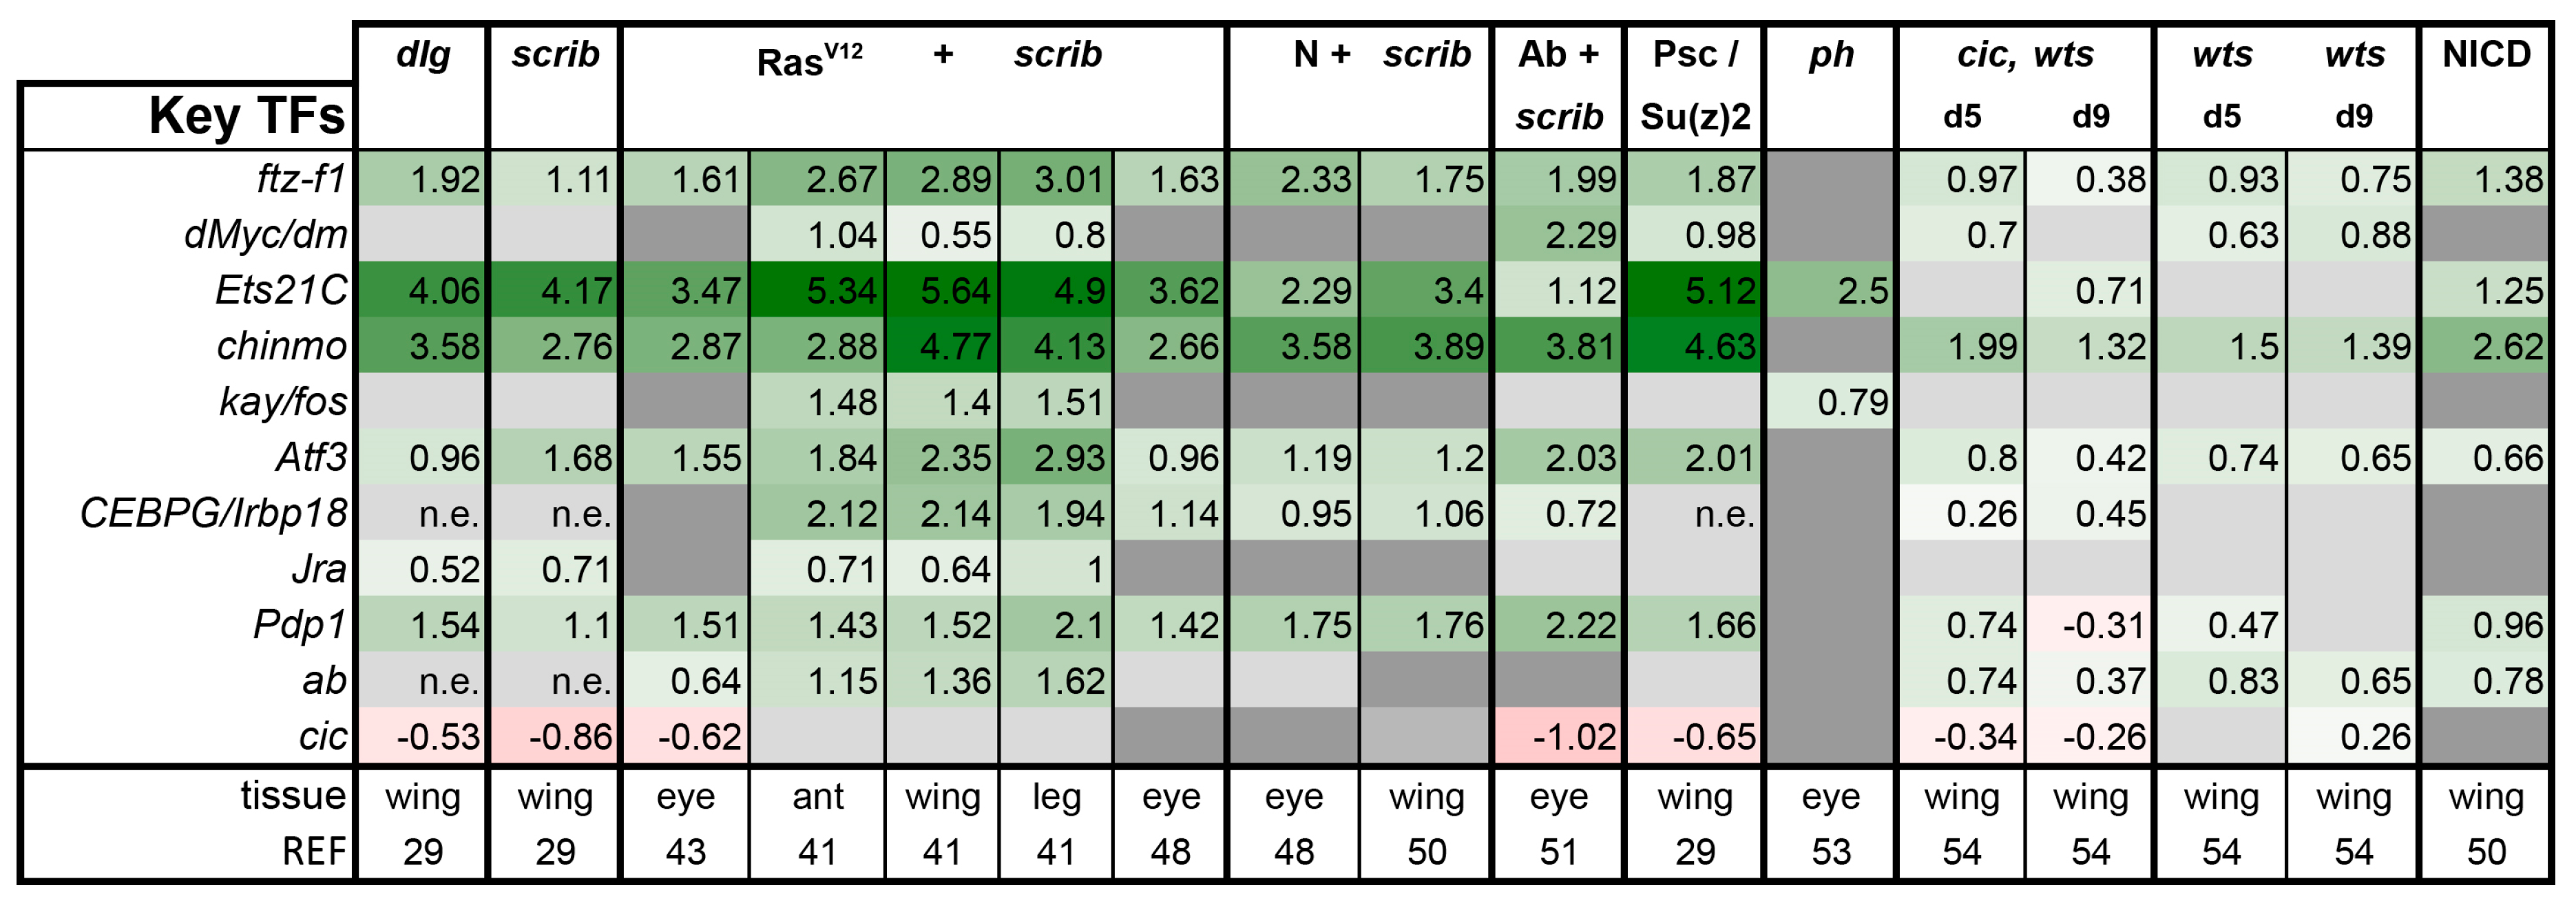
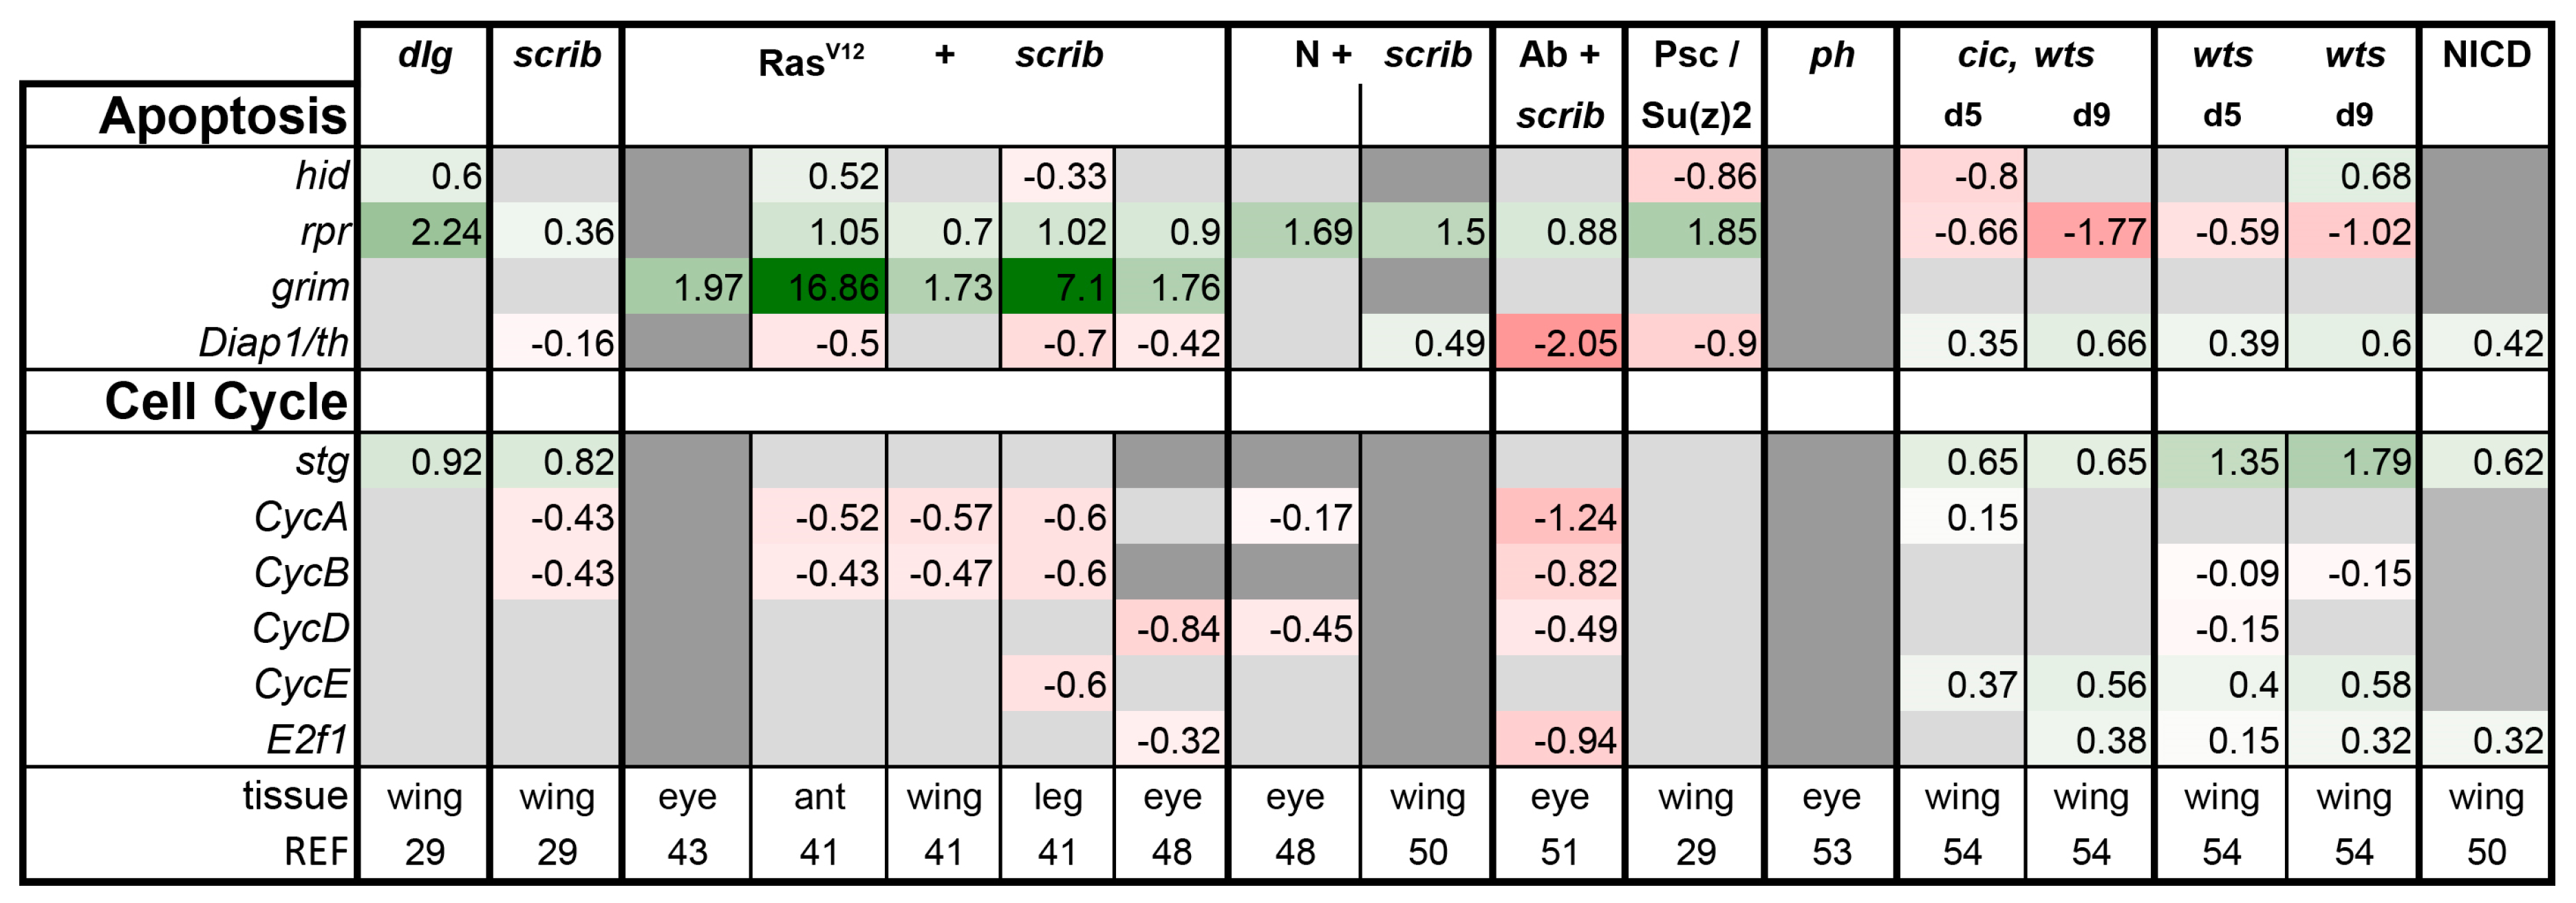
Table 1.
Common pathway members and their activity read-outs. A brief introduction of the key players of the pathways that were examined in this work. EGFR, Epidermal Growth Factor Receptor; Dpp, Decapentaplegic; Hh, Hedgehog; Wg, Wingless; JNK, Jun N-terminal Kinase; Jak/Stat, Janus Kinase/Signal Transducer and Activator of Transcription; Spi, Spitz; Vn, Vein; MAPK, Mitogen-Activated Protein Kinase; Cic, Capicua; Pnt, Pointed; Aop, Anterior Open; ERK, Extracellular Signal-Regulated Kinase; D, Delta; Ser, Serrate; Su(H), Suppressor of Hairless; Mam, Mastermind; E(spl), Enhancer of split; NRE, Notch Response Element; NICD, Notch Intracellular Domain; Tkv, Thickveins; Put, Punt; Mad, Mothers against Dpp; Med, Medea; Brk, Brinker; Shn, Schnurri; Dad, Daughters against Dpp; Sal, Spalt; Omb, Optomotor Blind; Ptc, Patched; Smo; Smoothened; Ci, Cubitus interruptus; Arr, Arrow; Dsh, Dishevelled; Sgg, Shaggy; Arm, Armadillo; βcat, Beta-catenin; dTCF, Drosophila T-cell Factor/Pangolin; Nkd, Naked; Egr, Eiger; Grnd, Grindelwald; Wgn, Wengen; Hep, Hemipterous; Bsk, Basket; Kay, Kayak; Jra, Jun-related antigen; Atf3, Activating transcription factor 3; Irbp18, Inverted repeat binding protein 18 kDa; CEBPG, CCAAT Enhancer Binding Protein Gamma; Pdp1, PAR-domain protein 1; puc, puckered; Mmp1; Matrix Metalloproteinase 1; TRE, Transcription Response Element; Upds, Unpaireds; Dome, Domeless; Hop, Hopscotch; Ds, Dachsous; Crb, Crumbs; Wts, Warts; Yki, Yorkie; Sd, Scalloped; Ex, Expanded; Diap1, Drosophila inhibitor of apoptosis protein 1; Ban, Bantam.
| Pathway | EGFR/Ras | Notch | Dpp | Hh | Wg | JNK | Jak/Stat | Hippo |
|---|---|---|---|---|---|---|---|---|
| Ligand | Spi, Vn | D, Ser | Dpp | Hh | Wg | Egr | Upds | Ds |
| Receptor | EGFR | N | Tkv, Put | Ptc, Smo | Arr, Fz | Grnd, Wgn | Dome | Fat, Crb |
| Key Players | Ras, Raf, MAPK | Dsh, Sgg, Axin, APC | Hep, Bsk/JNK | Hop (Jak) | Hpo, Wts | |||
| Nuclear Factors | Cic, Pnt, Yan/Aop | N, Su(H), Mam | Mad, Med, Brk, Shn | Ci | Arm/βcat, dTCF | Kay, Jra, Atf3, Irbp18/ CEBPG, Pdp1 | Stat-92E | Yki Sd |
| Activity Assays | anti-dp-ERK anti-Cic pnt-lacZ aos-lacZ cic-GFP | E(spl)m8-lacZ NRE-EGFP Su(H)-lacZ anti-NICD | dad-GFP brk-GFP anti-P-Mad anti-Sal anti-Omb anti-Brk | anti-Ptc dpp-lacZ ptc-lacZ | anti-Cut nkd-lacZ arr-lacZ | puc-lacZ anti-Mmp1 anti-P-JNK TRE-dsRed | 10X STAT-GFP anti-P-STAT | ex-lacZ diap1-lacZ ban-GFP anti-Ex Yki::GFP |
The color coding indicates the positive (green) or negative (red) effect of the protein on tissue growth if known.
© 2020 by the authors. Licensee MDPI, Basel, Switzerland. This article is an open access article distributed under the terms and conditions of the Creative Commons Attribution (CC BY) license (http://creativecommons.org/licenses/by/4.0/).
Share and Cite
MDPI and ACS Style
Hamaratoglu, F.; Atkins, M. Rounding up the Usual Suspects: Assessing Yorkie, AP-1, and Stat Coactivation in Tumorigenesis. Int. J. Mol. Sci. 2020, 21, 4580. https://0-doi-org.brum.beds.ac.uk/10.3390/ijms21134580
AMA Style
Hamaratoglu F, Atkins M. Rounding up the Usual Suspects: Assessing Yorkie, AP-1, and Stat Coactivation in Tumorigenesis. International Journal of Molecular Sciences. 2020; 21(13):4580. https://0-doi-org.brum.beds.ac.uk/10.3390/ijms21134580
Chicago/Turabian StyleHamaratoglu, Fisun, and Mardelle Atkins. 2020. "Rounding up the Usual Suspects: Assessing Yorkie, AP-1, and Stat Coactivation in Tumorigenesis" International Journal of Molecular Sciences 21, no. 13: 4580. https://0-doi-org.brum.beds.ac.uk/10.3390/ijms21134580
Note that from the first issue of 2016, this journal uses article numbers instead of page numbers. See further details here.