Molecular Cytogenomic Characterization of the Murine Breast Cancer Cell Lines C-127I, EMT6/P and TA3 Hauschka


Abstract
:1. Introduction
2. Results
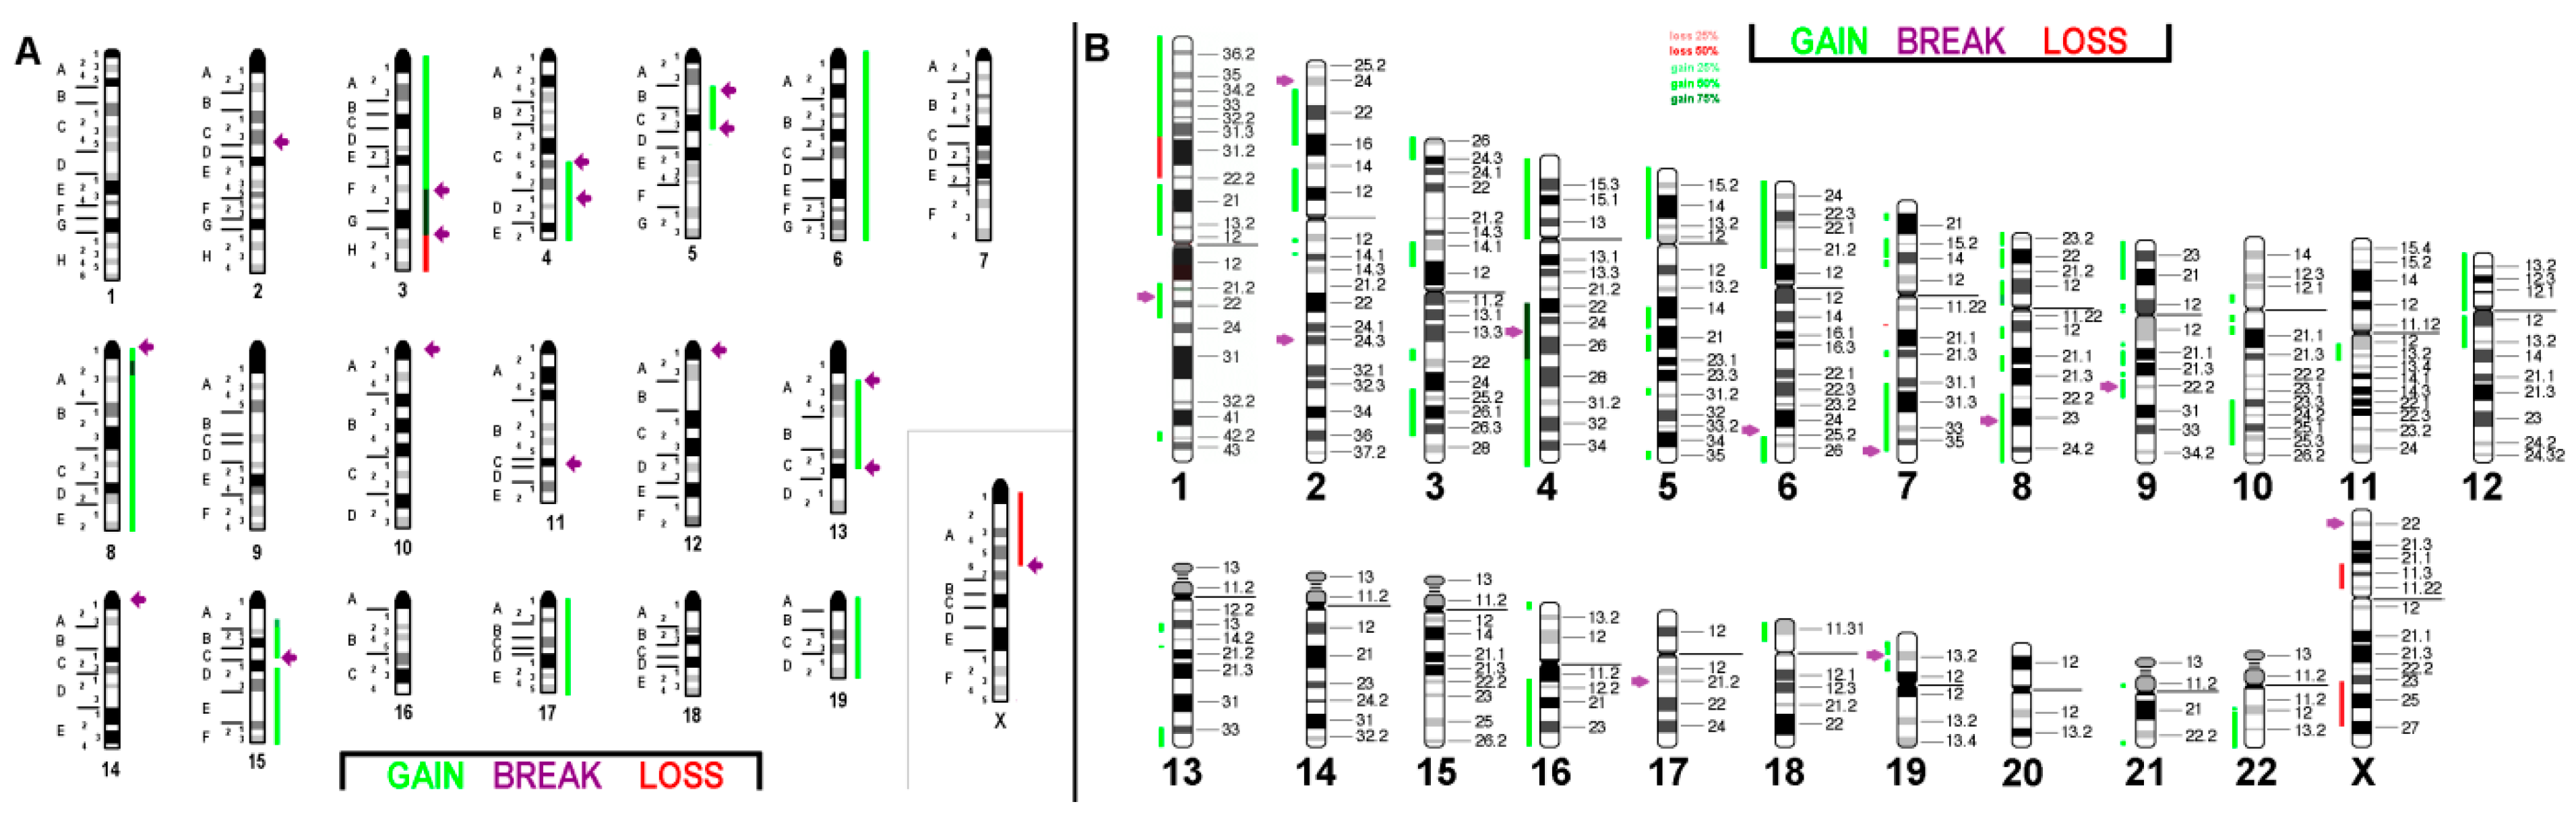
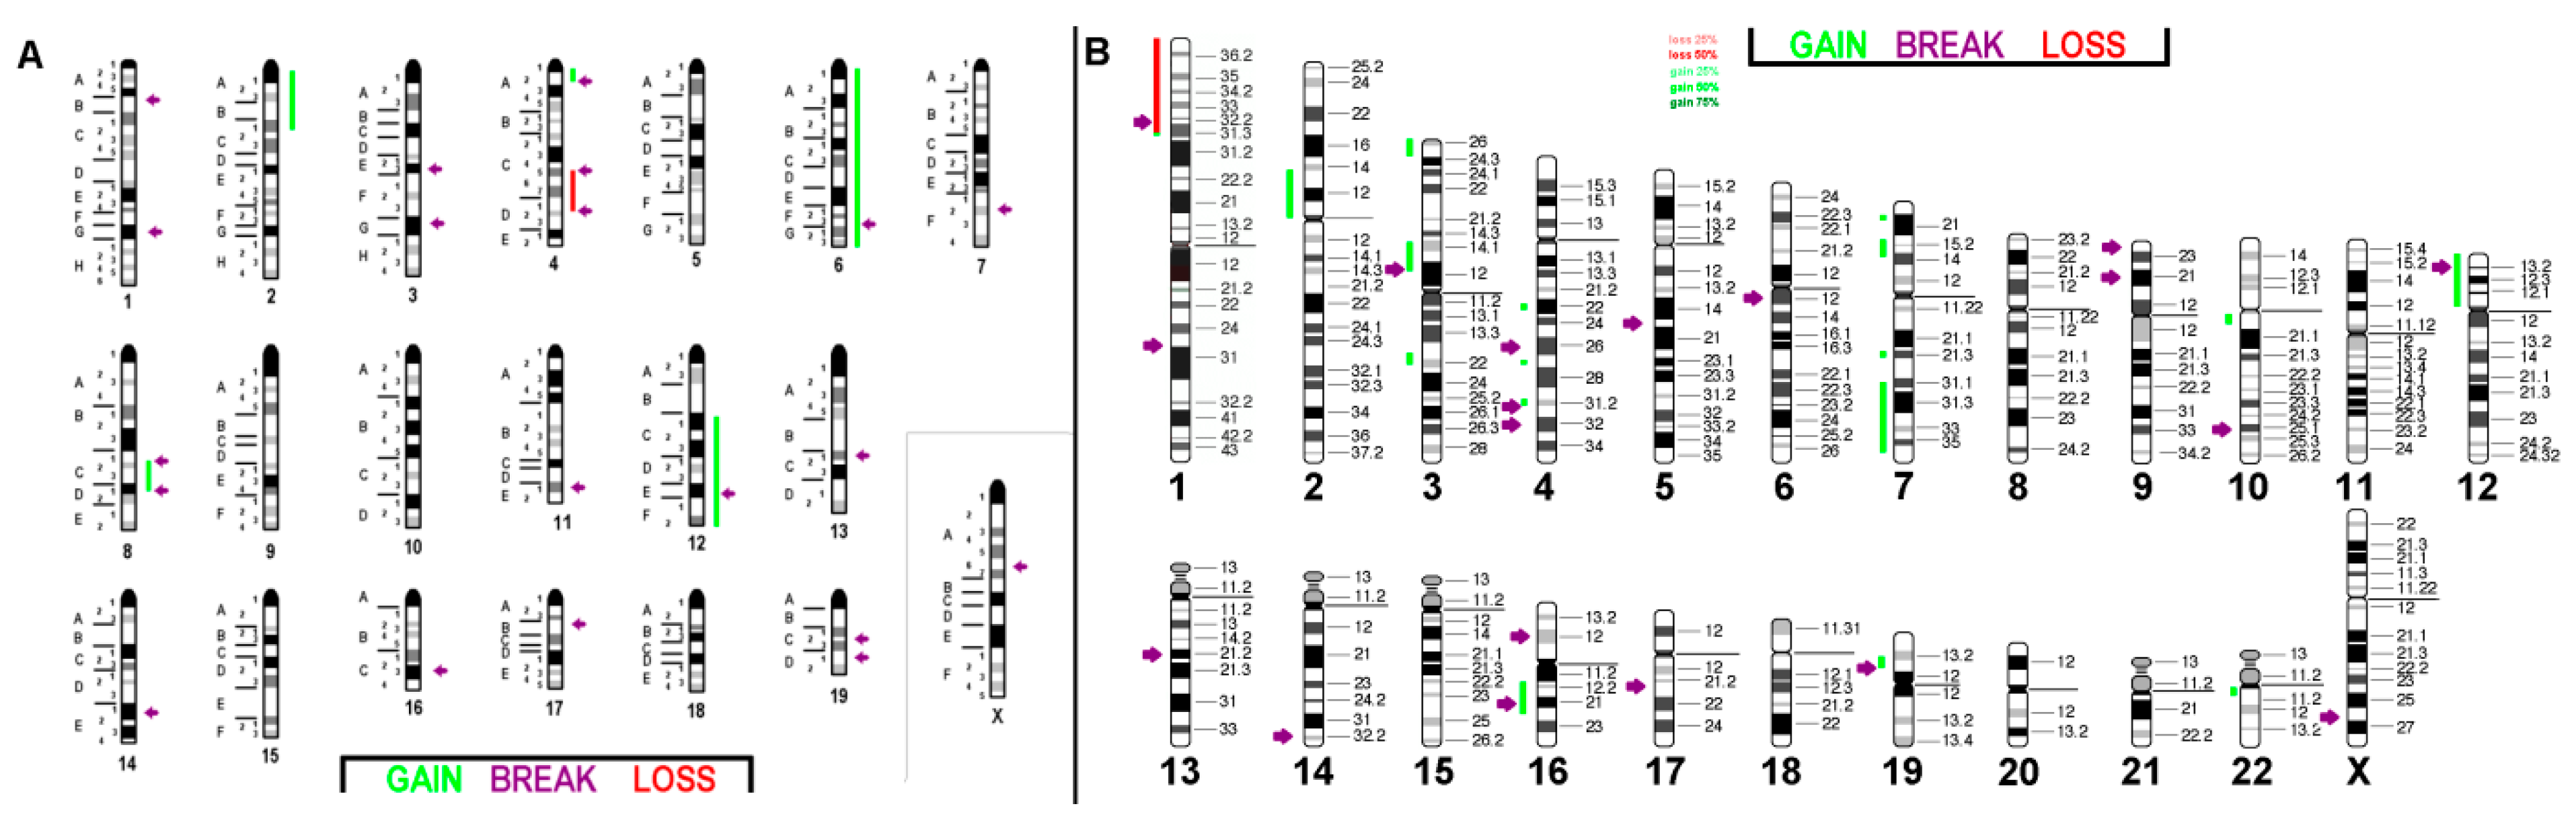
2.1. FISH Results
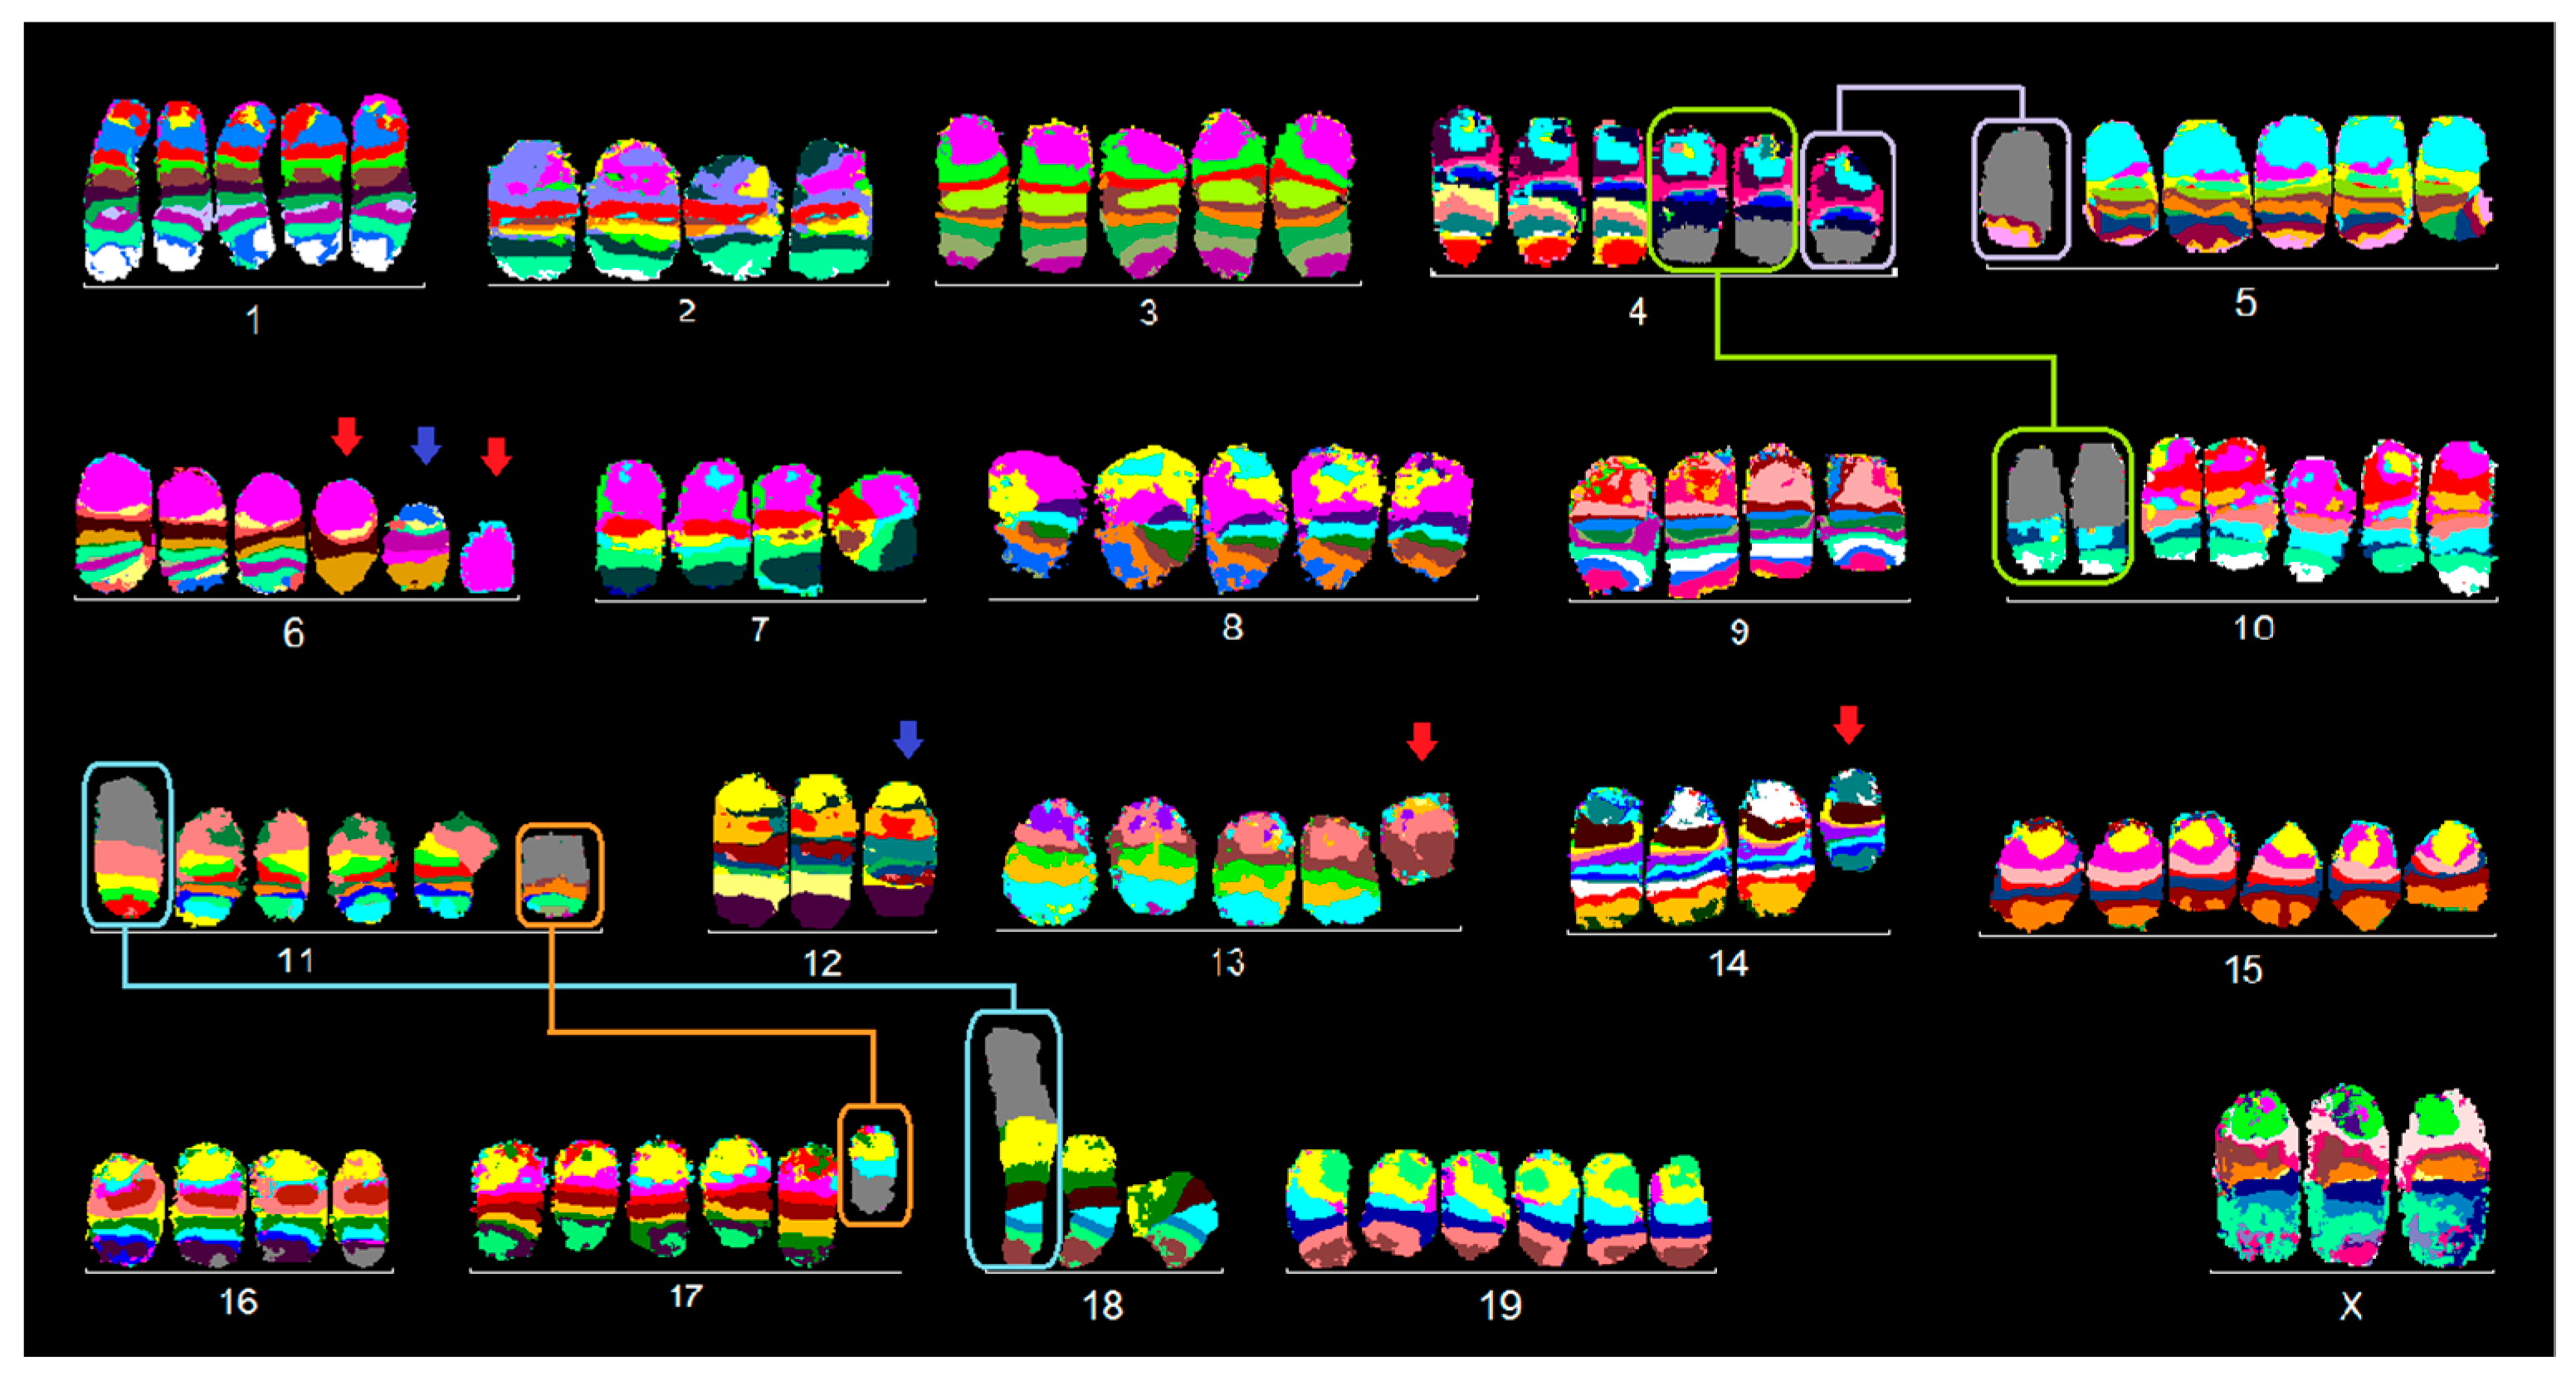
2.1.1. C-127I
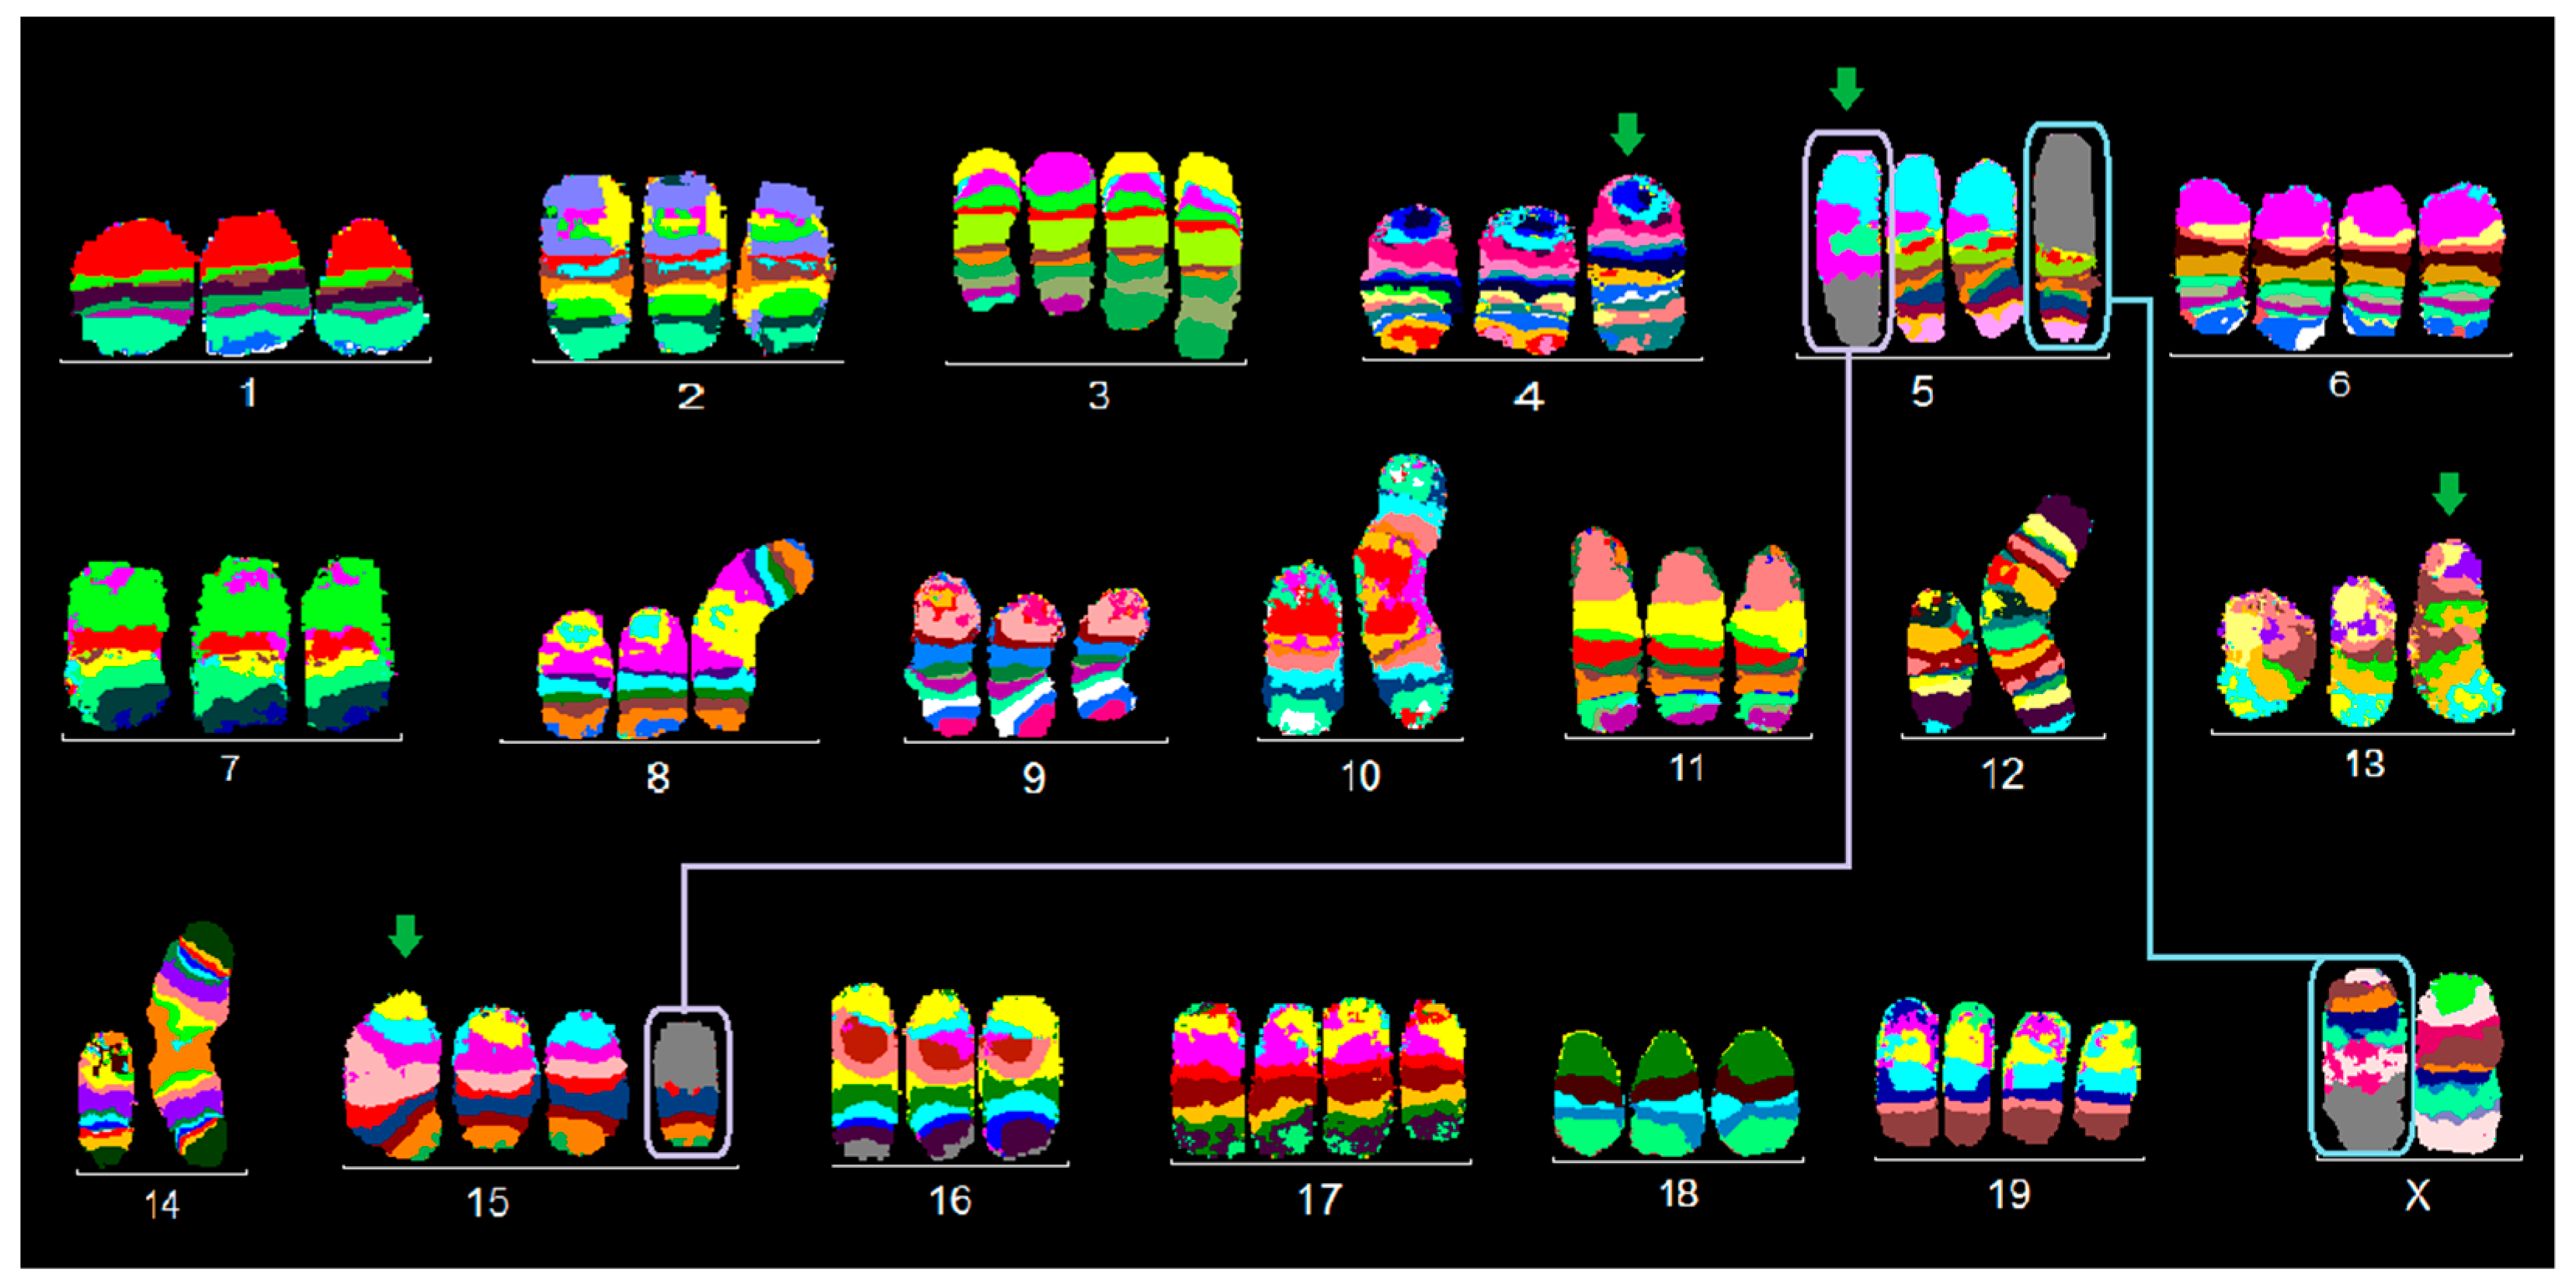
2.1.2. EMT6/P
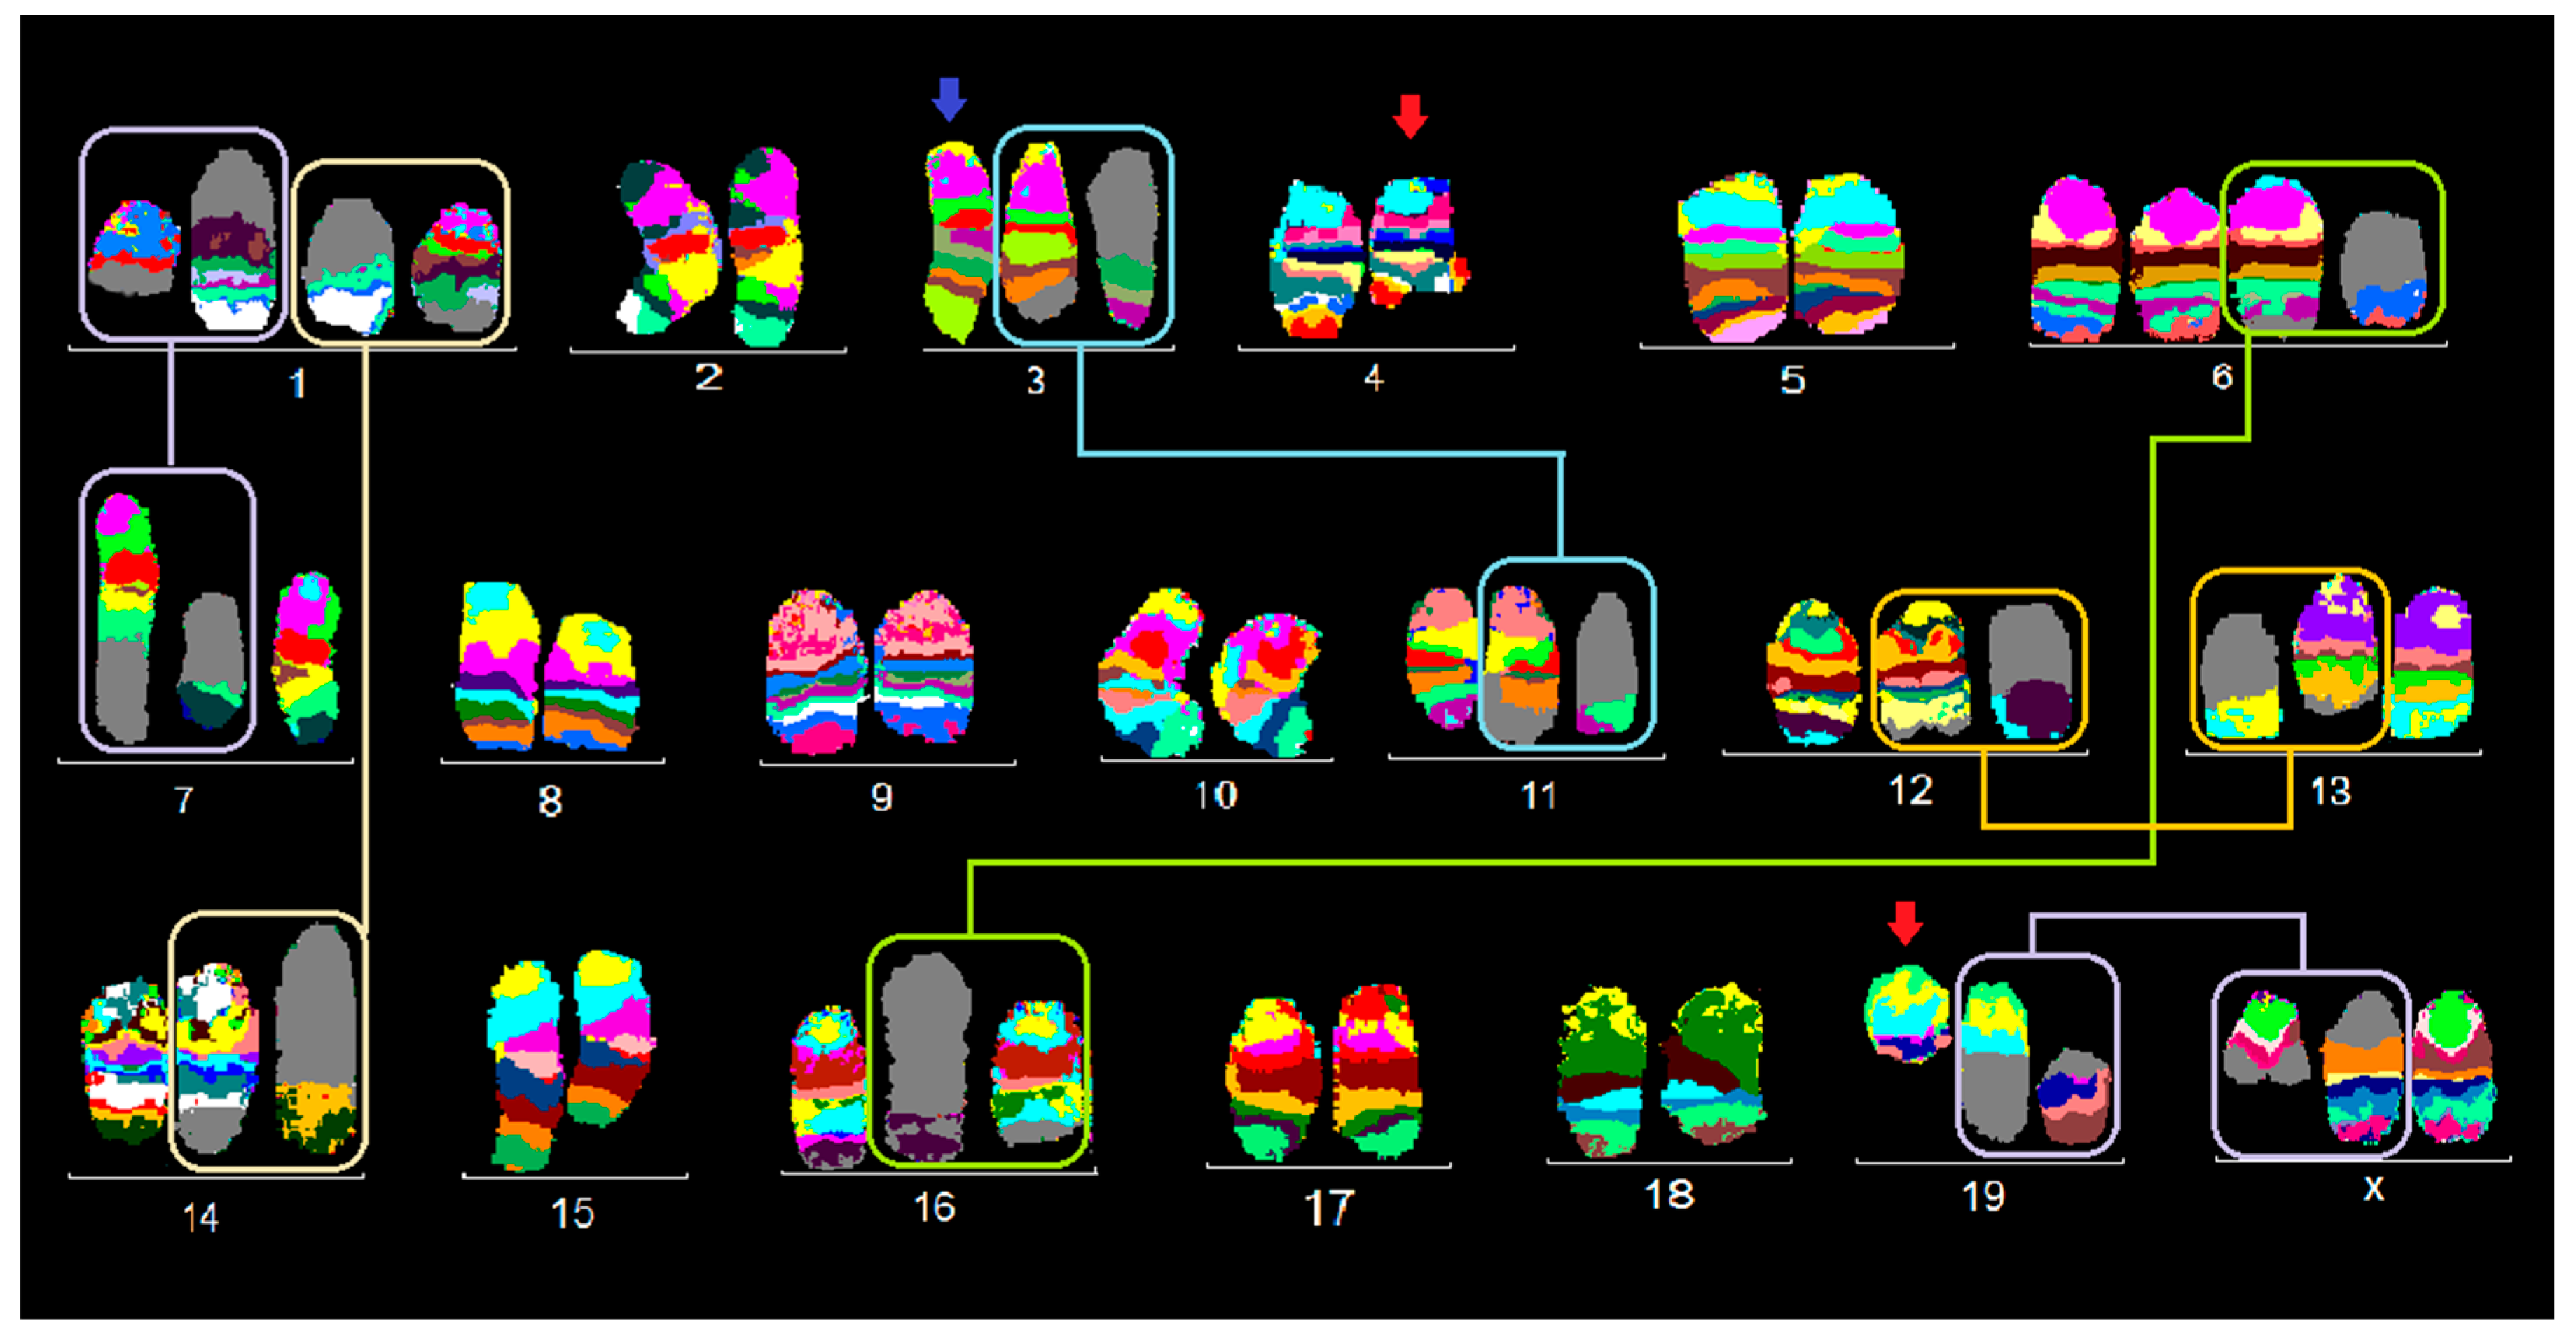
2.1.3. TA3 Hauschka
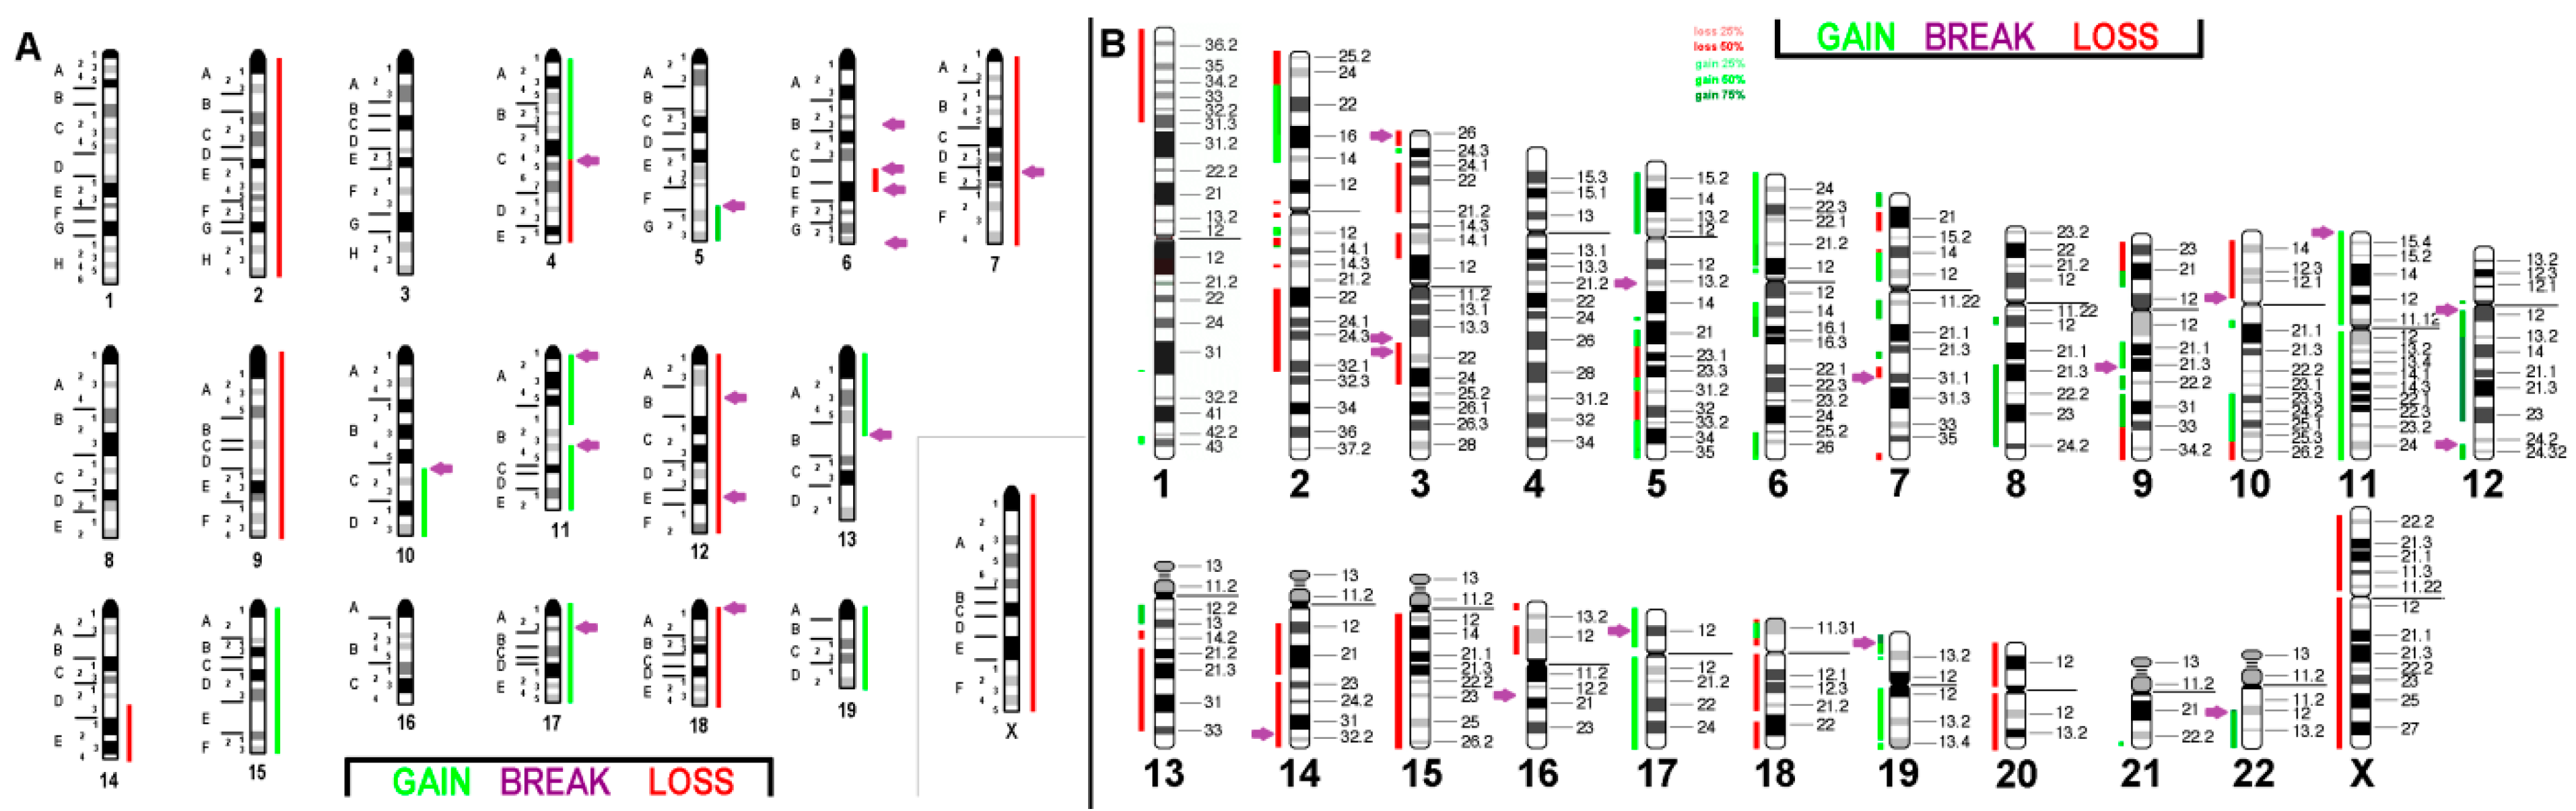
2.2. aCGH Results
2.3. Comparison with Literature
3. Discussion
4. Materials and Methods
4.1. Cell Lines
4.2. Molecular Cytogenetics
4.3. Data Analysis
Supplementary Materials
Author Contributions
Funding
Acknowledgments
Conflicts of Interest
Abbreviations
| aCGH | array comparative genomic hybridization |
| BC | breast cancer |
| CNV | copy number variant |
| EGFR | epidermal growth factor receptor |
| ER | estrogen receptor |
| FISH | fluorescence in situ hybridization |
| HER-2 | human epidermal growth factor receptor-2 |
| ICM | immunohistochemical markers |
| ISCN | International System for Human Cytogenomic Nomenclature |
| mcb | murine multicolor banding |
| mFISH | multicolor-fluorescence in situ hybridization |
| PR | progesterone receptor |
| wcp | whole chromosome painting |
References
- Karbownik, A.; Sobańska, K.; Płotek, W.; Grabowski, T.; Klupczynska, A.; Plewa, S.; Grześkowiak, E.; Szałek, E. The influence of the coadministration of the p-glycoprotein modulator elacridar on the pharmacokinetics of lapatinib and its distribution in the brain and cerebrospinal fluid. Invest. New Drugs 2020, 38, 574–583. [Google Scholar] [CrossRef] [PubMed] [Green Version]
- Okaly, G.V.; Panwar, D.; Lingappa, K.B.; Kumari, P.; Anand, A.; Kumar, P.; Chikkalingaiah, M.H.; Kumar, R.V. FISH and HER2/neu equivocal immunohistochemistry in breast carcinoma. Indian J. Cancer 2019, 56, 119–123. [Google Scholar] [CrossRef]
- Raihan, J.; Ahmad, U.; Yong, Y.K.; Eshak, Z.; Othman, F.; Ideris, A. Regression of solid breast tumours in mice by Newcastle disease virus is associated with production of apoptosis related-cytokines. BMC Cancer 2019, 19, 315. [Google Scholar] [CrossRef] [Green Version]
- Ye, Y.; Qiu, T.H.; Kavanaugh, C.; Green, J.E. Molecular mechanisms of breast cancer progression: Lessons from mouse mammary cancer models and gene expression profiling. Breast Dis. 2004, 19, 69–82. [Google Scholar] [CrossRef] [PubMed]
- Richardson, M.E.; Chong, H.; Mu, W.; Conner, B.R.; Hsuan, V.; Willett, S.; Lam, S.; Tsai, P.; Pesaran, T.; Chamberlin, A.C.; et al. DNA breakpoint assay reveals a majority of gross duplications occur in tandem reducing VUS classifications in breast cancer predisposition genes. Genet. Med. 2019, 21, 683–693. [Google Scholar] [CrossRef] [Green Version]
- Tang, M.E.; Varadan, V.; Kamalakaran, S.; Zhang, M.Q.; Dimitrova, N.; Hicks, J. Major chromosomal breakpoint intervals in breast cancer co-localize with differentially methylated regions. Front. Oncol. 2012. [Google Scholar] [CrossRef] [Green Version]
- Kikuchi-Koike, R.; Nagasaka, K.; Tsuda, H.; Ishii, Y.; Sakamoto, M.; Kikuchi, Y.; Fuku, S.; Miyagawa, Y.; Hiraike, H.; Kobayashi, T.; et al. Array comparative genomic hybridization analysis discloses chromosome copy number alterations as indicators of patient outcome in lymph node-negative breast cancer. BMC. Cancer. 2019, 19, 521. [Google Scholar] [CrossRef] [PubMed] [Green Version]
- Dai, X.; Li, T.; Bai, Z.; Yang, Y.; Liu, X.; Zhan, J.; Shi, B. Breast cancer intrinsic subtype classification, clinical use and future trends. Am. J. Cancer Res. 2015, 5, 2929–2943. [Google Scholar]
- Tang, P.; Tse, G.M. Immunohistochemical surrogates for molecular classification of breast carcinoma: A 2015 update. Arch. Pathol. Lab. Med. 2016, 140, 806–814. [Google Scholar] [CrossRef] [Green Version]
- Kondov, B.; Milenkovikj, Z.; Kondov, G.; Peterusevska, G.; Baseska, N.; Tolevska, N.; Ivkovski, L.J. Retention of approximal guiding plane surfaces in removable partial skeletal prosthesis. Open Access Maced. J. Med. Sci. 2018, 6, 1120–1125. [Google Scholar] [CrossRef] [Green Version]
- Fragomeni, S.M.; Sciallis, A.; Jeruss, J.S. Molecular subtypes and local-regional control of breast cancer. Surg. Oncol. Clin. N. Am. 2018, 27, 95–120. [Google Scholar] [CrossRef] [PubMed]
- Chen, X.; Pei, Z.; Peng, H.; Zheng, Z. Exploring the molecular mechanism associated with breast cancer bone metastasis using bioinformatic analysis and microarray genetic interaction network. Medcine 2018, 97, e12032. [Google Scholar] [CrossRef] [PubMed]
- Yersal, O.; Barutca, S. Biological subtypes of breast cancer: Prognostic and therapeutic implications. World J. Clin. Oncol. 2014, 5, 412–424. [Google Scholar] [CrossRef]
- Mazo, C.; Kearns, C.; Mooney, C.; Gallagher, W.M. Clinical decision support systems in breast cancer: A systematic review. Cancers 2020, 12, 369. [Google Scholar] [CrossRef] [Green Version]
- Kalimutho, M.; Nones, K.; Srihari, S.; Duijf, P.H.G.; Waddell, N.; Khanna, K.K. Patterns of Genomic Instability in Breast Cancer. Trends. Pharm. Sci. 2019, 40, 198–211. [Google Scholar] [CrossRef] [PubMed]
- Lima, Z.S.; Ghadamzadeh, M.; Arashloo, F.T.; Amjad, G.; Ebadi, M.R.; Younesi, L. Recent advances of therapeutic targets based on the molecular signature in breast cancer: Genetic mutations and implications for current treatment paradigms. J. Hematol. Oncol. 2019, 12, 38. [Google Scholar] [CrossRef]
- Wronski, A.; Arendt, L.M.; Kuperwasser, C. Humanization of the mouse mammary gland. Methods. Mol. Bio. 2015, 1293, 173–186. [Google Scholar] [CrossRef]
- Jones, R.A.; Moorehead, R.A. Integrative analysis of copy number and gene expression data identifies potential oncogenic drivers that promote mammary tumor recurrence. Genes Chromosomes Cancer 2019, 58, 381–391. [Google Scholar] [CrossRef]
- Osborne, C.; Wilson, P.; Tripathy, D. Oncogenes and tumor suppressor genes in breast cancer: Potential diagnostic and therapeutic applications. Oncologist 2004, 9, 361–377. [Google Scholar] [CrossRef]
- Rhode, H.; Liehr, T.; Kosyakova, N.; Rincic, M.; Azawi, S.S.H. Molecular cytogenetic characterization of two murine colorectal cancer cell lines. OBM Genet. 2018, 2, 037. [Google Scholar] [CrossRef]
- Liehr, T.; Starke, H.; Heller, A.; Kosyakova, N.; Mrasek, K.; Gross, M.; Karst, C.; Glaser, M.; Fickelscher, I.; Kuechler, A.; et al. Multicolor fluorescence in situ hybridization (FISH) applied to FISH-banding. Cytogenet. Genome Res. 2006, 114, 240–244. [Google Scholar] [CrossRef] [PubMed]
- Lowy, D.R.; Rands, E.; Scolnick, E.M. Helper-independent transformation by unintegrated Harvey sarcoma virus DNA. J. Virol. 1978, 26, 291–298. [Google Scholar] [CrossRef] [PubMed] [Green Version]
- Twentyman, P.R.; Fox, N.E.; Wright, K.A.; Workman, P.; Broadhurst, M.J.; Martin, J.A.; Bleehen, N.M. The in vitro effects and cross-resistance patterns of some novel anthracyclines. Br. J. Cancer 1986, 53, 585–594. [Google Scholar] [CrossRef] [PubMed] [Green Version]
- Hauschka, T.S. Cell population studies on mouse ascites tumors. Trans. N. Y. Acad. Sci. 1953, 16, 64–73. [Google Scholar] [CrossRef] [PubMed]
- Hall, J.M.; Zuppan, P.J.; Anderson, L.A.; Huey, B.; Carter, C.; King, M. Oncogenes and human breast cancer. Am. J. Hum. Genet. 1989, 44, 577–584. [Google Scholar]
- Oliveira, A.M.; Ross, J.S.; Fletcher, J.A. Tumor suppressor genes in breast cancer. Am. J. Clin. Pathol. 2005, 124, S16–S28. [Google Scholar] [CrossRef]
- Horlings, H.M.; Lai, C.; Nuyten, D.S.A.; Halfwerk, H.; Kristel, P.; van Beers, E.; Joosse, S.A.; Klijn, C.; Nederlof, P.M.; Reinders, M.J.T.; et al. Integration of DNA copy number alterations and prognostic gene expression signatures in breast cancer patients. Clin. Cancer Res. 2010, 16, 651–663. [Google Scholar] [CrossRef] [Green Version]
- Lebok, P.; Roming, M.; Kluth, M.; Koop, C.; Özden, C.; Taskin, B.; Hussein, K.; Lebeau, A.; Witzel, I.; Wölber, L.; et al. p16 overexpression and 9p21 deletion are linked to unfavorable tumor phenotype in breast cancer. Oncotarget 2016, 7, 81322–81331. [Google Scholar] [CrossRef] [Green Version]
- Lawrenson, K.; Kar, S.; McCue, K.; Kuchenbaeker, K.; Michailidou, K.; Tyrer, J.; Beesley, J.; Ramus, S.J.; Li, Q.; Delgado, M.K.; et al. Functional mechanisms underlying pleiotropic risk alleles at the 19p13.1 breast-ovarian cancer susceptibility locus. Nat. Commun. 2016, 7, 12675. [Google Scholar] [CrossRef] [PubMed] [Green Version]
- Cheng, T.H.T.; Thompson, D.J.; O’Mara, T.A.; Painter, J.N.; Glubb, D.M.; Flach, S.; Lewis, A.; French, J.D.; Freeman-Mills, L.; Church, D.; et al. Five endometrial cancer risk loci identified through genome-wide association analysis. Nat. Genet. 2016, 48, 667–674. [Google Scholar] [CrossRef]
- Couch, F.J.; Gaudet, M.M.; Antoniou, A.C.; Ramus, S.J.; Kuchenbaecker, K.B.; Soucy, P.; Beesley, J.; Chen, X.; Wang, X.; Kirchhoff, T.; et al. Consortium of Investigators of Modifiers of BRCA1/2. Common variants at the 19p13.1 and ZNF365 loci are associated with ER subtypes of breast cancer and ovarian cancer risk in BRCA1 and BRCA2 mutation carriers. Cancer Epidemiol. Biomark Prev. 2012, 21, 645–657. [Google Scholar] [CrossRef] [PubMed] [Green Version]
- de Kock, L.; Geoffrion, D.; Rivera, B.; Wagener, R.; Sabbaghian, N.; Bens, S.; Ellezam, B.; Soglio, D.B.; Ordóñez, J.; Sacharow, S.; et al. Multiple DICER1-related tumors in a child with a large interstitial 14q32 deletion. Genes Chromosomes Cancer 2018, 57, 223–230. [Google Scholar] [CrossRef] [PubMed]
- Lupicki, K.; Elifio-Espostio, S.; Fononseca, A.S.; Weber, S.H.; Sugita, B.; Langa, B.C.; Pereira, S.R.F.; Govender, D.; Panieri, E.; Hiss, D.C.; et al. Patterns of copy number alterations in primary breasttumors of South African patients and their impacton functional cellular pathways. Int. J. Oncol. 2018, 53, 2745–2757. [Google Scholar] [CrossRef] [Green Version]
- Antoniou, A.C.; Kuchenbaecker, K.B.; Soucy, P.; Beesley, J.; Chen, X.; McGuffog, L.; Lee, A.; Barrowdale, D.; Healey, S. Common variants at 12p11, 12q24, 9p21, 9q31.2 and in ZNF365 are associated with breast cancer risk for BRCA1 and/or BRCA2 mutation carriers. Breast Cancer Res. 2012, 14, R33. [Google Scholar] [CrossRef]
- Huret, J.-L.; Ahmad, M.; Arsaban, M.; Bernheim, A.; Cigna, J.; Desangles, F.; Guignard, J.C.; Jacquemot-Perbal, M.-C.; Labarussias, M.; Leberre, V.; et al. Atlas of genetics and cytogenetics in oncology and haematology in 2013. Nucleic. Acids. Res. 2013, 41, D920–D924. [Google Scholar] [CrossRef]
- Kubicova, E.; Trifonov, V.; Borovecki, F.; Liehr, T.; Rincic, M.; Kosyakova, N.; Hussein, S.S. First molecular cytogenetic characterization of murine malignant mesothelioma cell line AE17 and in silico translation to the human genome. Curr. Bioinform. 2017, 12, 11–18. [Google Scholar] [CrossRef]
- Leibiger, C.; Kosyakova, N.; Mkrtchyan, H.; Glei, M.; Trifonov, V.; Liehr, T. First molecular cytogenetic high resolution characterization of the NIH 3T3 cell line by murine multicolor banding. J. Histochem. Cytochem. 2013, 61, 306–312. [Google Scholar] [CrossRef] [Green Version]
- Steinacker, R.; Liehr, T.; Kosyakova, N.; Rincic, M.; Azawi, SS. Molecular cytogenetic characterization of two murine cancer cell lines derived from salivary gland. Biol. Commun. 2018, 63, 243–255. [Google Scholar] [CrossRef]
- Guja, K.; Liehr, T.; Rincic, M.; Kosyakova, N.; Hussein Azawi, S.S. Molecular cytogenetic characterization identified the murine B-cell lymphoma cell line A-20 as a model for sporadic Burkitt’s lymphoma. J. Histochem. Cytochem. 2017, 65, 669–677. [Google Scholar] [CrossRef] [PubMed] [Green Version]
- Inic, Z.; Zegarac, M.; Inic, M.; Markovic, I.; Kozomara, Z.; Djurisic, I.; Inic, I.; Pupic, G.; Jancic, S. Difference between luminal and luminal B subtypes according to Ki-67, tumor size, and progesterone receptor negativity providing prognostic information. Clin. Med. Insights Oncol. 2014, 8, 107–111. [Google Scholar] [CrossRef] [Green Version]
- Levan, A.; Biesele, J.J. Role of chromosomes in cancerogenesis.; as studied in serial tissue culture of mammalian cells. Ann. N. Y. Acad Sci. 1958, 71, 1022–1053. [Google Scholar] [CrossRef]
- Tan, Z.; Chu, D.Z.V.; Chan, Y.J.A.; Lu, Y.E.; Rancati, G. Mammalian cells undergo endoreduplication in response to lactic acidosis. Sci. Rep. 2018, 8, 2890. [Google Scholar] [CrossRef] [PubMed] [Green Version]
- Kasai, F.; Hirayama, N.; Ozawa, M.; Iemura, M.; Kohara, A. Changes of heterogeneous cell populations in the Ishikawa cell line during long-term culture: Proposal for an in vitro clonal evolution model of tumor cells. Genomics 2016, 107, 259–266. [Google Scholar] [CrossRef] [PubMed]
- Mc Granahan, N.; Swanton, C. Clonal heterogeneity and tumor evolution: Past, present, and the future. Cell 2017, 168, 613–628. [Google Scholar] [CrossRef]
- Hyman, E.; Kauraniemi, P.; Hautaniemi, S.; Wolf, M.; Mousses, S.; Rozenblum, E.; Ringnér, M.; Sauter, G.; Monni, O.; Elkahloun, A.; et al. Impact of DNA amplification on gene expression patterns in breast cancer. Cancer Res. 2002, 62, 6240–6245. [Google Scholar]
- Xie, H.; Rachakonda, P.S.; Heidenreich, B.; Nagore, E.; Sucker, A.; Hemminki, K.; Schadendorf, D.; Kumar, R. Mapping of deletion breakpoints at the CDKN2A locus in melanoma: Detection of MTAP-ANRIL fusion transcripts. Oncotarget 2016, 7, 16490–16504. [Google Scholar] [CrossRef] [Green Version]
- Liu, Y.; Walavalkar, N.M.; Dozmorov, M.G.; Rich, S.S.; Civelek, M.; Guertin, M.J. Identification of breast cancer associated variants that modulate transcription factor binding. PLoS Genet. 2017, 13, e1006761. [Google Scholar] [CrossRef]
- McGowan-Jordan, J.; Simons, A.; Schmid, M. (Eds.) International System for Human Cytogenomic Nomenclature 2016 (ISCN 2016); Karger: Basel, Switzerland; Unionville, MO, USA, 2016. [Google Scholar]


| Molecular Subtype | ER | PR | HER2 |
|---|---|---|---|
| luminal A | + | + | − |
| luminal B | + | + | − |
| luminal B | + | + | + |
| HER-2+ | − | − | + |
| triple negative or basal-like | − | − | − |
| Oncogenes and | Gene Loci in Human | |||
|---|---|---|---|---|
| Tumor Suppressor Genes | C-127I | EMT6/P | TA3 Hauschka | |
| NRAS | 1p22 or p13 | gain | gain | no CNV |
| MSH2 | 2p22 | gain | gain | no CNV |
| RAF1 | 3p25 | gain | gain | gain |
| RARβ2 | 3p24 | no CNV | no CNV | no CNV |
| MLH1 | 3p21 | loss | no CNV | no CNV |
| APC | 5q21 | gain | gain | no CNV |
| MYB | 6q22-q23 | gain | no CNV | no CNV |
| IGFII-R | 6q26 | gain | gain | no CNV |
| MYC | 8q24 | gain | gain | no CNV |
| CDKN2A (p16INK4) | 9p21 | loss | gain | loss |
| PTEN 10q23 | 10q23 | gain | gain | no CNV |
| HRAS | 11p15.5 | loss | no CNV | no CNV |
| ATM | 11q22 | gain | no CNV | no CNV |
| CCND1 | 11q13 | gain | gain | no CNV |
| INT2 | 11q13 | loss | gain | no CNV |
| CDKN1B (p27kip1) | 12p13 | no CNV | gain | gain |
| KRAS2 | 12p12.1 | no CNV | gain | gain |
| BRCA2 | 13q12 | gain | no CNV | no CNV |
| RB1 | 13q14 | loss | no CNV | no CNV |
| CDH1 (E-cadherin) | 16q22 | no CNV | no CNV | gain |
| TP53 (p53) | 17p13 | gain | no CNV | no CNV |
| ERBB2 | 17q21 | gain | gain | gain |
| BRCA1 | 17q21 | gain | no CNV | no CNV |
| SERPINB5 (maspin) | 18q21 | loss | no CNV | no CNV |
| STK11 (LKB1) | 19p13 | gain | gain | gain |
| SUM of concordance in CNVs of potentially affected regions | 17/21 | 10/21 | 7/21 | |
| Breakpoint Acc. to Human Genome | Human BC | C-127I | EMT6/P | TA3 Hauschka |
|---|---|---|---|---|
| 1p33 | + | − | + | − |
| 1p13.2 | − | − | + | − |
| 1q25.3 | + | − | − | + |
| 2p23.3 | − | − | + | − |
| 2q31.3 | + | − | + | − |
| 3p26.1 | + | + | − | − |
| 3p12.3 | + | − | − | + |
| 3q14.1 | − | + | − | − |
| 3q21.3 | + | + | − | − |
| 4p12 | − | − | + | − |
| 4q22.3 | + | − | + | − |
| 4q26 | + | − | − | + |
| 4q31.23 | + | − | − | + |
| 4q32.2 | − | − | − | + |
| 5p14.2 | + | − | + | − |
| 5q13.2 | + | + | − | − |
| 5q14.3 | + | − | + | − |
| 5q15 | − | − | − | + |
| 6q12 | + | − | − | + |
| 6q25.2 | − | − | + | − |
| 7p14.1 | − | − | + | − |
| 7q31.1 | − | + | − | − |
| 7q36.2 | − | − | + | − |
| 8q23.3 | + | − | + | − |
| 8q24.22 | + | − | + | − |
| 9p24.2 | + | − | − | + |
| 9p21 | + | + | + | + |
| 10p11.21 | + | + | − | − |
| 10q25.1 | − | − | − | + |
| 11p15.5 | + | + | − | − |
| 12p13.2 | − | − | − | + |
| 12q12.1 | + | + | − | − |
| 12q24.31 | + | + | − | − |
| 13q21.2 | + | − | − | + |
| 14q32 | + | + | − | + |
| 16p12.3 | − | − | − | + |
| 16q13.3 | + | + | − | − |
| 16q21 | − | − | − | + |
| 17p12 | + | + | − | − |
| 17q21 | + | − | + | − |
| 19p13.1 | + | + | + | + |
| 20q13.3 | + | + | − | − |
| 22q12.2 | + | + | − | − |
| Xp22.2 | − | − | + | − |
| Xq23.2 | − | − | − | + |
| SUM of concordance | 27/45 | 19/45 | 18/45 |
| DNA Changes in BC Subtypes | Human BC | C-127I | EMT6/P | TA4 Hauschka |
|---|---|---|---|---|
| HER2+ | ||||
| 17q11.1~12 | gain | gain | no CNV | no CNV |
| 17q21.31~23.2 | gain | gain | no CNV | no CNV |
| SUM of concordance | 2/2 | 0/2 | 0/2 | |
| Basal-like tumors | ||||
| 4p15.31 | loss | no CNV | gain | no CNV |
| 5q12.3~13.2 | loss | no CNV | no CNV | no CNV |
| 5q33.1 | loss | loss | no CNV | no CNV |
| 6p12.3 | gain | gain | gain | no CNV |
| 6p21.1~23 | gain | gain | gain | no CNV |
| 8q24.21~24.22 | gain | gain | gain | no CNV |
| 10p12.33~14 | gain | loss | no CNV | no CNV |
| 10q23.33 | loss | no CNV | no CNV | no CNV |
| 12q13.13~13.3 | loss | gain | gain | no CNV |
| 15q15.1 | loss | loss | no CNV | no CNV |
| 15q21.1 | loss | loss | no CNV | no CNV |
| SUM of concordance | 6/11 | 3/11 | 0/11 | |
| luminal A | ||||
| 1q21.3~44 | gain | no CNV | gain | no CNV |
| 16p13.12~13.13 | gain | no CNV | no CNV | no CNV |
| 16q11.2~13 | loss | no CNV | gain | gain |
| 16q22.1-24.1 | loss | no CNV | gain | no CNV |
| SUM of concordance | 0/4 | 1/4 | 0/4 | |
| luminal B | ||||
| 1p31.3 | loss | loss | loss | loss |
| 8p21.2~23.1 | loss | no CNV | gain | no CNV |
| 17q23.2 | gain | gain | no CNV | no CNV |
| SUM of concordance | 2/3 | 1/3 | 1/3 |
© 2020 by the authors. Licensee MDPI, Basel, Switzerland. This article is an open access article distributed under the terms and conditions of the Creative Commons Attribution (CC BY) license (http://creativecommons.org/licenses/by/4.0/).
Share and Cite
Azawi, S.; Liehr, T.; Rincic, M.; Manferrari, M. Molecular Cytogenomic Characterization of the Murine Breast Cancer Cell Lines C-127I, EMT6/P and TA3 Hauschka. Int. J. Mol. Sci. 2020, 21, 4716. https://0-doi-org.brum.beds.ac.uk/10.3390/ijms21134716
Azawi S, Liehr T, Rincic M, Manferrari M. Molecular Cytogenomic Characterization of the Murine Breast Cancer Cell Lines C-127I, EMT6/P and TA3 Hauschka. International Journal of Molecular Sciences. 2020; 21(13):4716. https://0-doi-org.brum.beds.ac.uk/10.3390/ijms21134716
Chicago/Turabian StyleAzawi, Shaymaa, Thomas Liehr, Martina Rincic, and Mattia Manferrari. 2020. "Molecular Cytogenomic Characterization of the Murine Breast Cancer Cell Lines C-127I, EMT6/P and TA3 Hauschka" International Journal of Molecular Sciences 21, no. 13: 4716. https://0-doi-org.brum.beds.ac.uk/10.3390/ijms21134716