Article

Transcriptomic Profile of Primary Culture of Skeletal Muscle Cells Isolated from Semitendinosus Muscle of Beef and Dairy Bulls

1
Department of Human Nutrition, Institute of Human Nutrition Sciences, Warsaw University of Life Sciences - SGGW, Nowoursynowska 159C, 02-776 Warsaw, Poland
2
Department of Physiological Sciences, Institute of Veterinary Medicine, Warsaw University of Life Sciences - SGGW, Nowoursynowska 159, 02-776 Warsaw, Poland
*
Author to whom correspondence should be addressed.
Int. J. Mol. Sci. 2020, 21(13), 4794; https://0-doi-org.brum.beds.ac.uk/10.3390/ijms21134794
Submission received: 1 June 2020 / Revised: 30 June 2020 / Accepted: 2 July 2020 / Published: 7 July 2020
(This article belongs to the Section Molecular Genetics and Genomics)

Abstract

:
The aim of the study was to identify differences in the transcriptomic profiles of primary muscle cell cultures derived from the semitendinosus muscle of bulls of beef breeds (Limousin (LIM) and Hereford (HER)) and a dairy breed (Holstein-Friesian (HF)) (n = 4 for each breed). Finding a common expression pattern for proliferating cells may point to such an early orientation of the cattle beef phenotype at the transcriptome level of unfused myogenic cells. To check this hypothesis, microarray analyses were performed. The analysis revealed 825 upregulated and 1300 downregulated transcripts similar in both beef breeds (LIM and HER) and significantly different when compared with the dairy breed (HF) used as a reference. Ontological analyses showed that the largest group of genes were involved in muscle organ development. Muscle cells of beef breeds showed higher expression of genes involved in myogenesis (including erbb-3, myf5, myog, des, igf-1, tgfb2) and those encoding proteins comprising the contractile apparatus (acta1, actc1, myh3, myh11, myl1, myl2, myl4, tpm1, tnnt2, tnnc1). The obtained results confirmed our hypothesis that the expression profile of several groups of genes is common in beef breeds at the level of proliferating satellite cells but differs from that observed in typical dairy breeds.

1. Introduction

It is known that different cattle breeds are characterized by a different structure and physiology of skeletal muscles. Beef breeds such as the late-maturing Limousin (LIM) and the early-maturing Hereford (HER) are expected to express differences in the amount of muscle and adipose tissue in the carcass relative to the typical dairy breed such as the Holstein-Friesian (HF). It still remains unknown as to which genes determine the interracial differences in the rate of growth and metabolism of the muscle tissue [1].
Literature data indicate that the ratio of skeletal muscles to the weight of carcass increases in the early period of bulls’ life and decreases from the sixth month due to additional deposition of the adipose tissue and connective tissue. However, around a 15-fold increase in the muscle mass occurs in this period [1,2]. It has been demonstrated that between 180 and 300 days of life the highest daily muscle tissue growth is observed, which is approximately 400 g per day, followed by a decrease. In addition, in the same period, a slow increase in the mass of adipose tissue is observed, which is approximately 100 g per day [2,3].
Satellite cells are small, undifferentiated, mononuclear precursor cells of the skeletal muscles found in adult individuals and involved in adaptive processes of growth, repair, and regeneration of the muscle tissue in the postnatal period [4,5,6]. Under physiological conditions, the satellite cells present in mature skeletal muscles remain quiescent until their activation (e.g., via muscle tissue injury) and constitute a pool of primary cells enabling the repair and regeneration of damaged muscle fibers as well as increasing muscle mass in the postnatal period [7,8,9]. In the postnatal period, the number of muscle fibers remains unchanged, while an intensive growth of muscle mass occurs as a result of fusion of satellite cells located directly at the growing muscles fibers. It has been determined that the majority of cell nuclei in muscle fibers of adult mammals originate from myoblasts, which were formed as a result of satellite cell divisions in the postnatal period [10]. The satellite cell proliferation process taking place in the juvenile growth period is highly important as it enables elongation of muscle fibers. Muscle growth occurring through hypertrophy in the postnatal period is primarily associated with an increase in the amount of nuclear DNA through the constant attachment of satellite cells to the growing muscle fibers. The increased amount of DNA in muscle fiber cells is responsible for the intensification of the protein synthesis process, which is followed by hypertrophy of the maturing muscle fibers [11].
Satellite cells are characterized by expression of the paired box transcription factor 7 (Pax7), required for the survival of satellite cells and prevention of premature differentiation of myogenic progenitor cells [12,13]. It turns out that Pax7 overexpression inhibits myogenesis through inhibition of MyoD expression and induction of myogenin, preventing the differentiation of muscle cells [12,14]. Determination and differentiation pathways are controlled by the MyoD family of myogenic regulatory factors (MRFs), including myogenic factor 5 (MYF5), myoblast determination protein 1 (MYOD), myogenin (MYOG), and myogenic regulatory factor 4 (MRF4), which coordinate with the myocyte enhancer factor-2 family factors to synergistically activate the transcription of genes specific for muscles through recruitment of the chromatin remodeling protein [15].
The aim of the study was to identify differences in transcriptomic profiles of primary muscle cell cultures of cattle breeds of varying performance. Our research hypothesis assumed that the differences in the cattle muscle phenotype are determined already at the transcriptome level of proliferating myogenic cells, which are the source of myoblasts fusing with muscle fibers during their growth and maturation. Better understanding of the factors responsible for the development of muscle tissue, as well as determination of the genes of key importance from the standpoint of the myogenesis process and muscle maturation, will enable determination of those responsible for greater growths of muscle tissue in bulls of beef breeds.

2. Results

2.1. Course of In Vitro Primary Culture of Muscle Cells

2.1.1. Primary Skeletal Muscle Cell Culture

The microscopic observation of a continuous primary culture of muscle cells isolated from semitendinosus muscle collected from bulls of three cattle breeds, revealed on days 6, 10, and 14 of culture the differences in the rate and progress of cell division between the studied beef breeds (LIM and HER) and the dairy breed (HF). A higher number of proliferating muscle cells was observed in the culture of beef breeds (Figure S1).

2.1.2. Differentiation Culture

On individual days of differentiation, considerably more intense formation of myotubes was observed in beef breeds compared to dairy breed. On the second day of differentiation, myoblasts aligned longitudinally, assumed a fusiform shape, and began to adhere to each other in beef breeds, indicating the start of the cell fusion into myotubes, whereas in the dairy breed, no elongated myoblasts were present. In the case of the culture of LIM and HER breeds, myotubes formed as a result of myoblasts fusion were perceptible already from the fourth day of differentiation, whereas the myotube formation in the HF breed can be only observed on the sixth day of differentiation (Figure S2). Previously published research performed on a similar primary skeletal muscle cell culture derived from the same individuals showed statistically significantly higher numbers of myotubes in beef breeds in comparison to the dairy breed [16].
The presence of a myosin heavy chain (MyHC) was determined in randomly selected cultures of cattle muscle cells, which is a marker of myogenic differentiation. Photographs taken using confocal microscope after six days of muscle cell differentiation (Figure S3) showed clearly formed multinucleated myotubes in individuals of the LIM, HER, and HF breeds, as well as the presence of myosin heavy chains in the myotubes. In addition, a higher number and greater size of myotubes were observed in beef breeds than in the dairy breed (Figure S3).

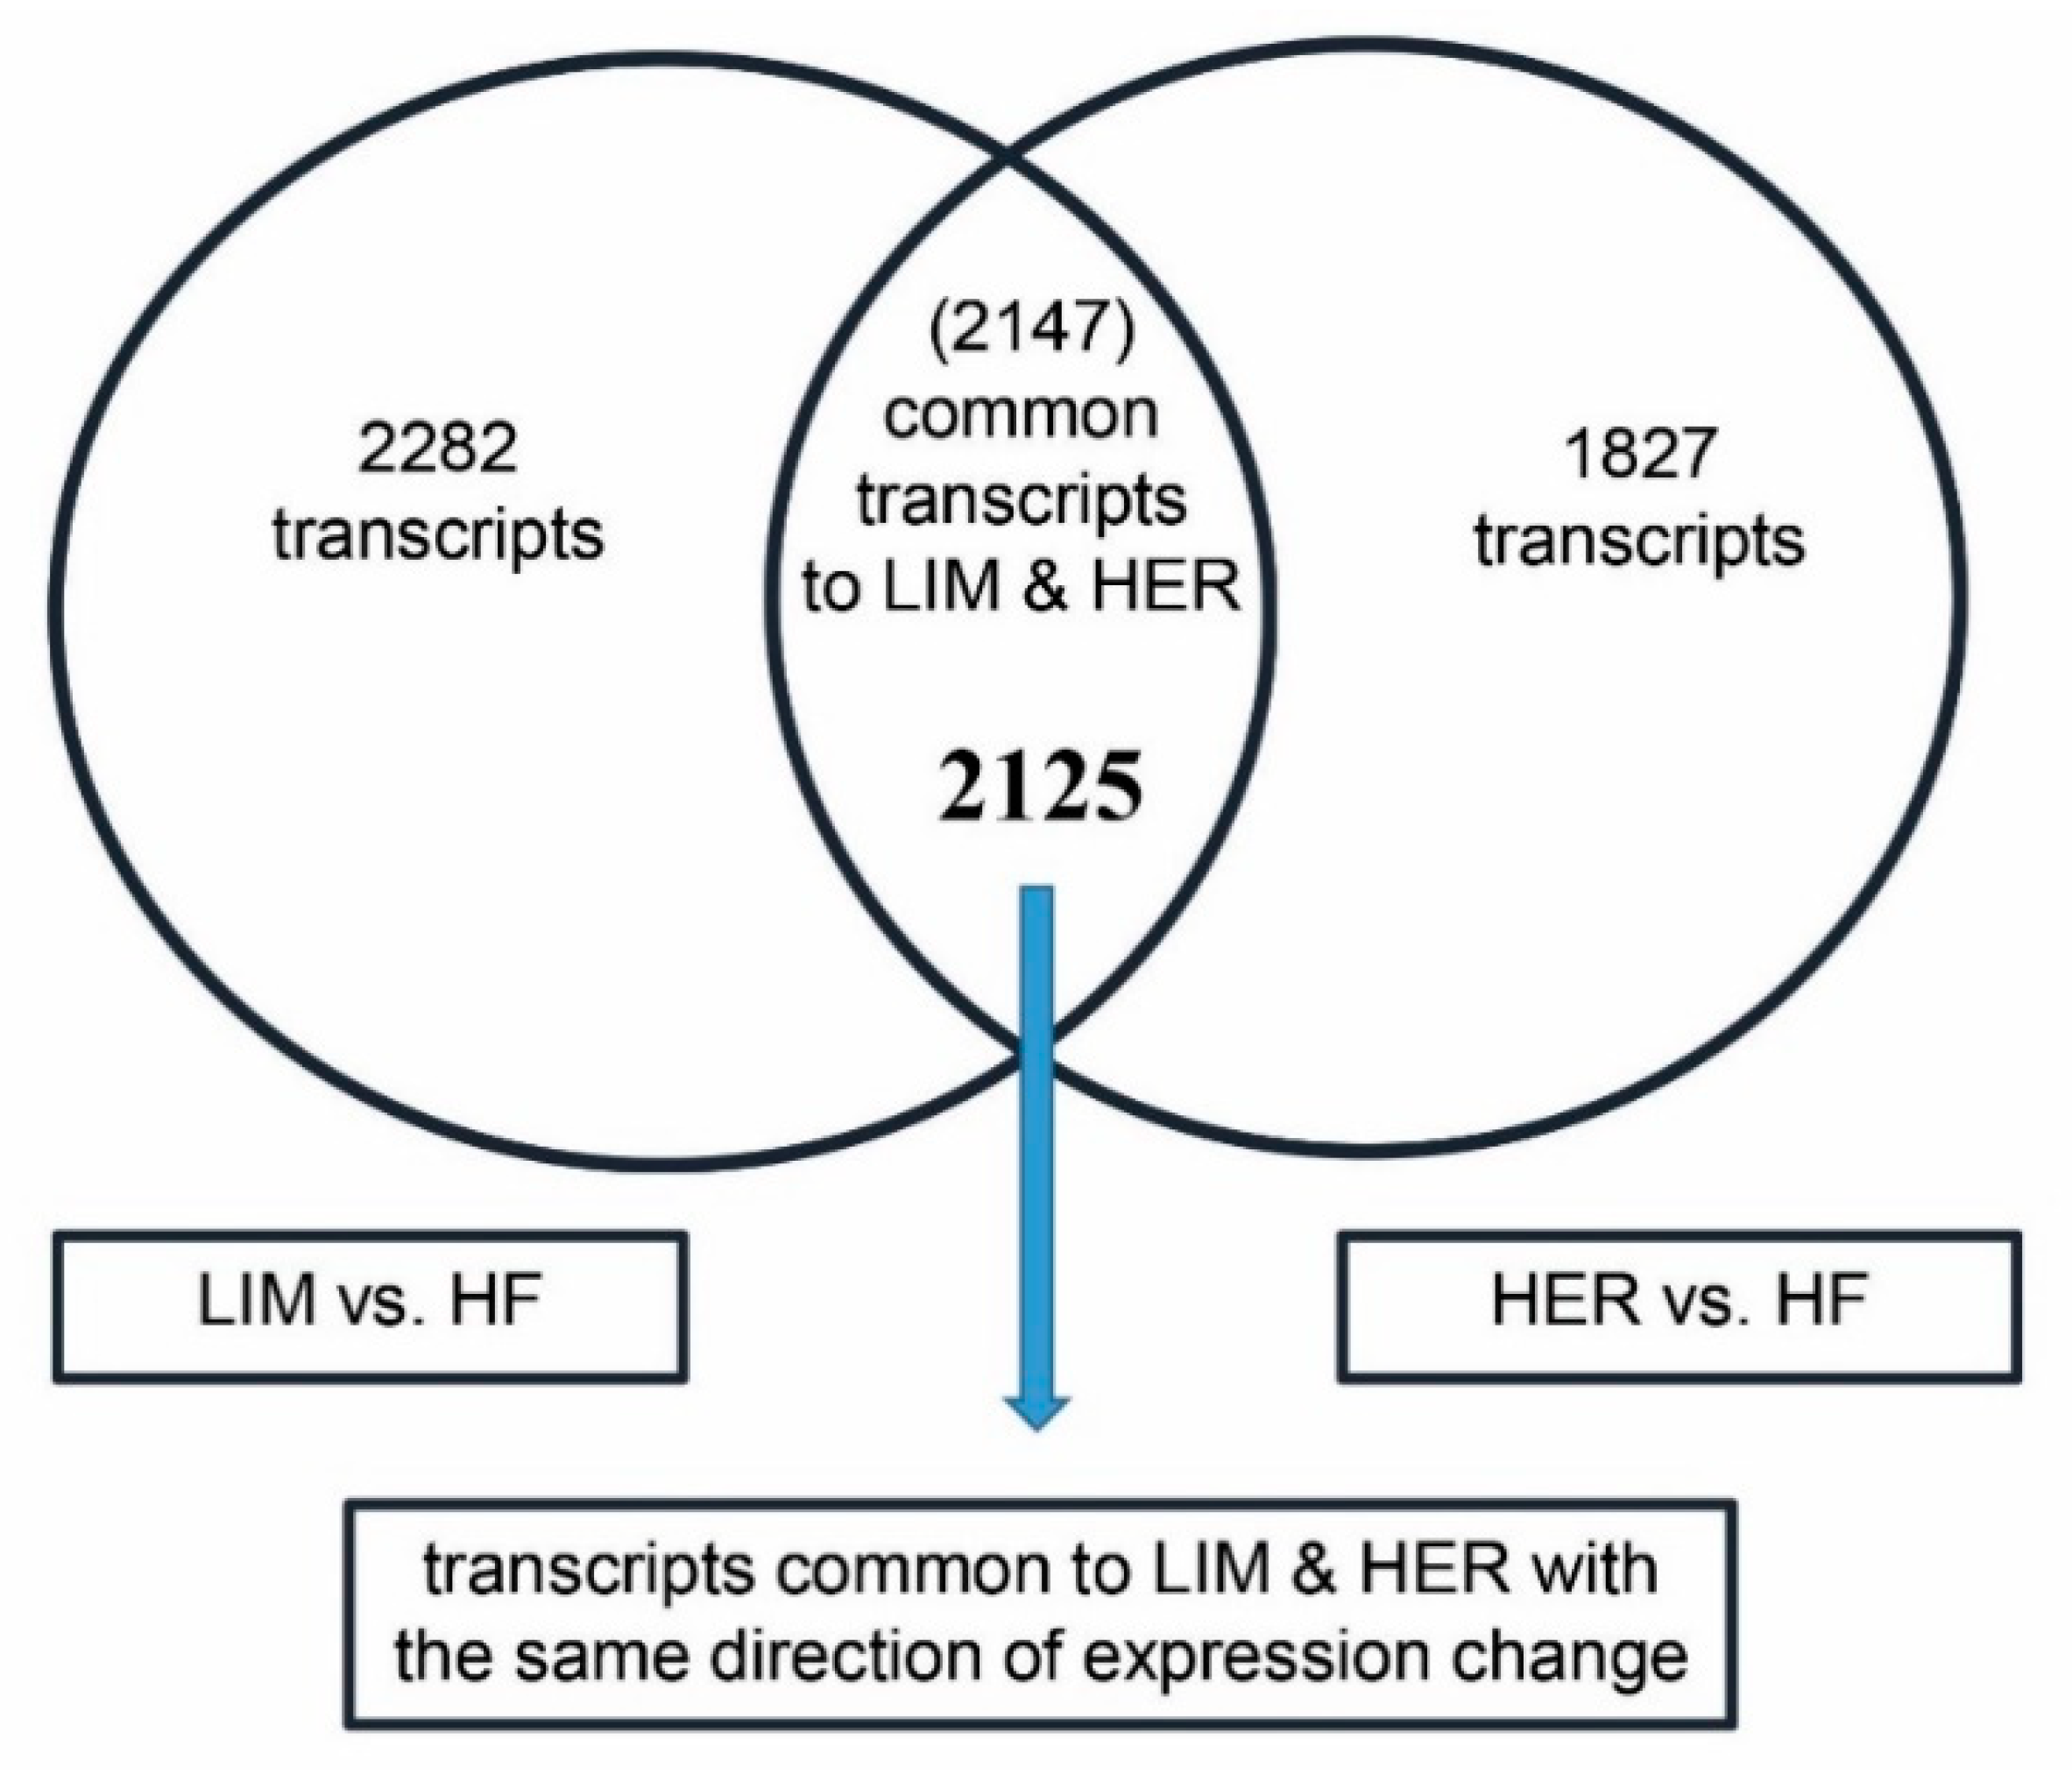
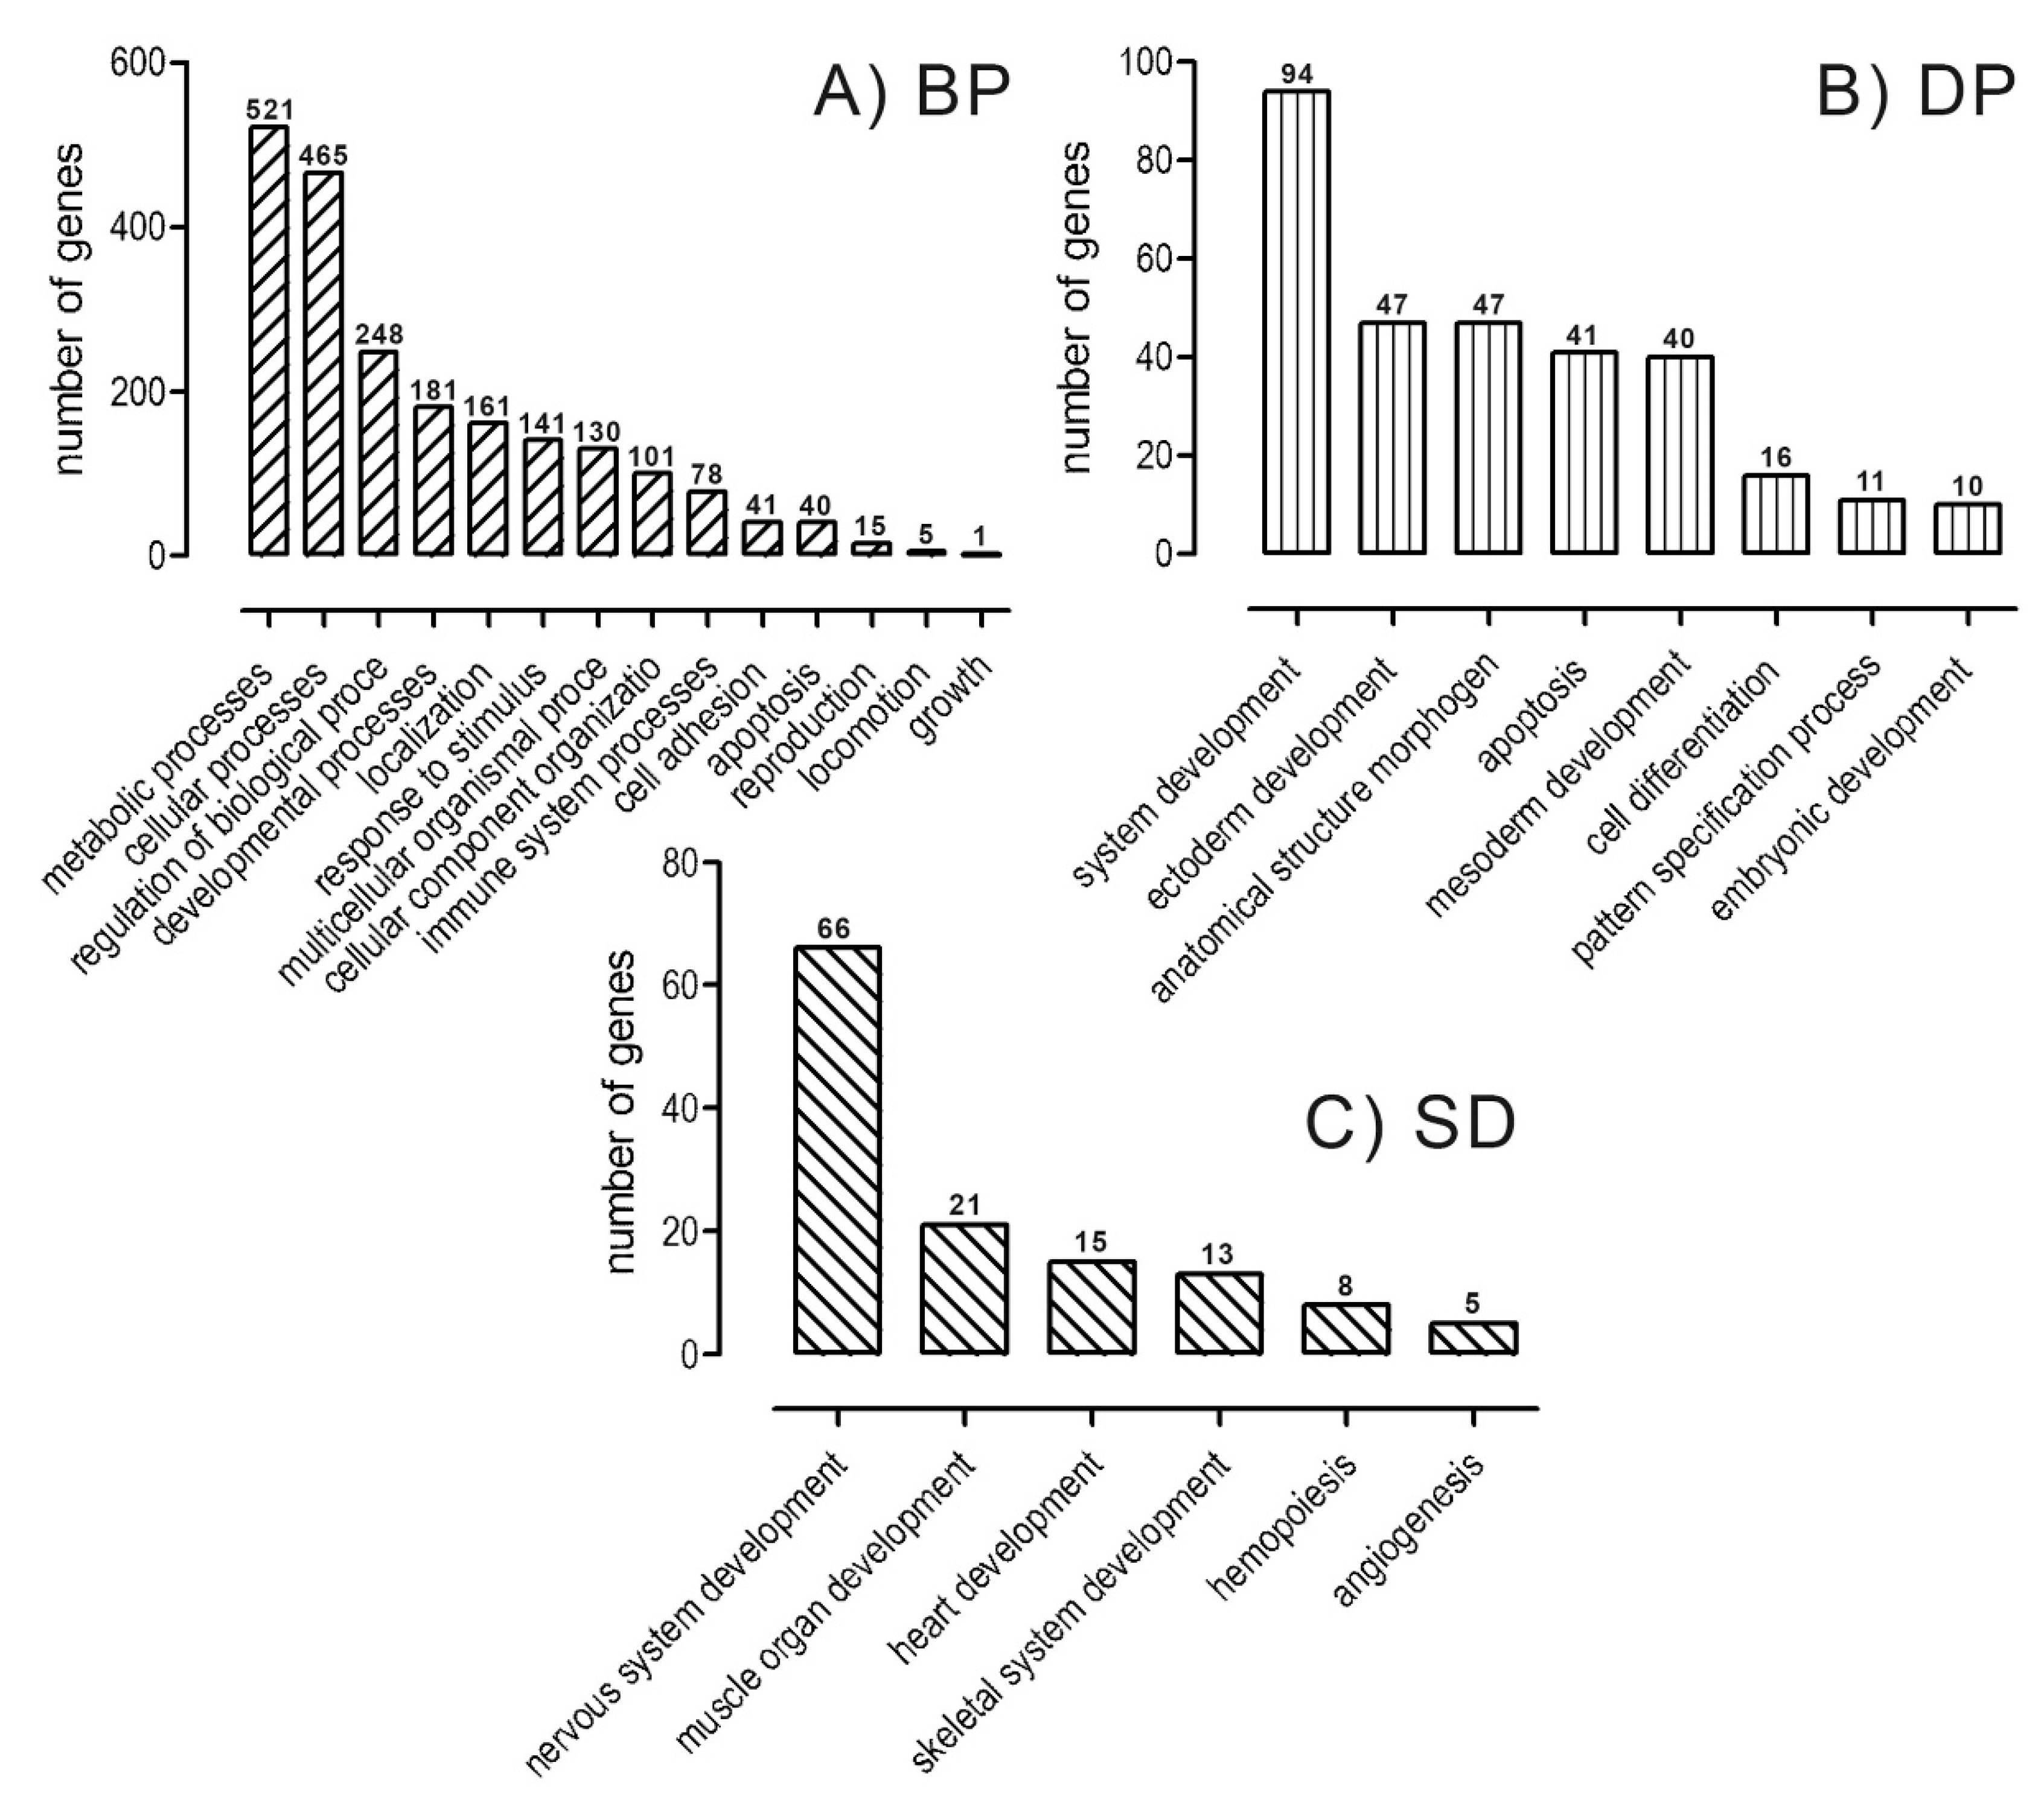
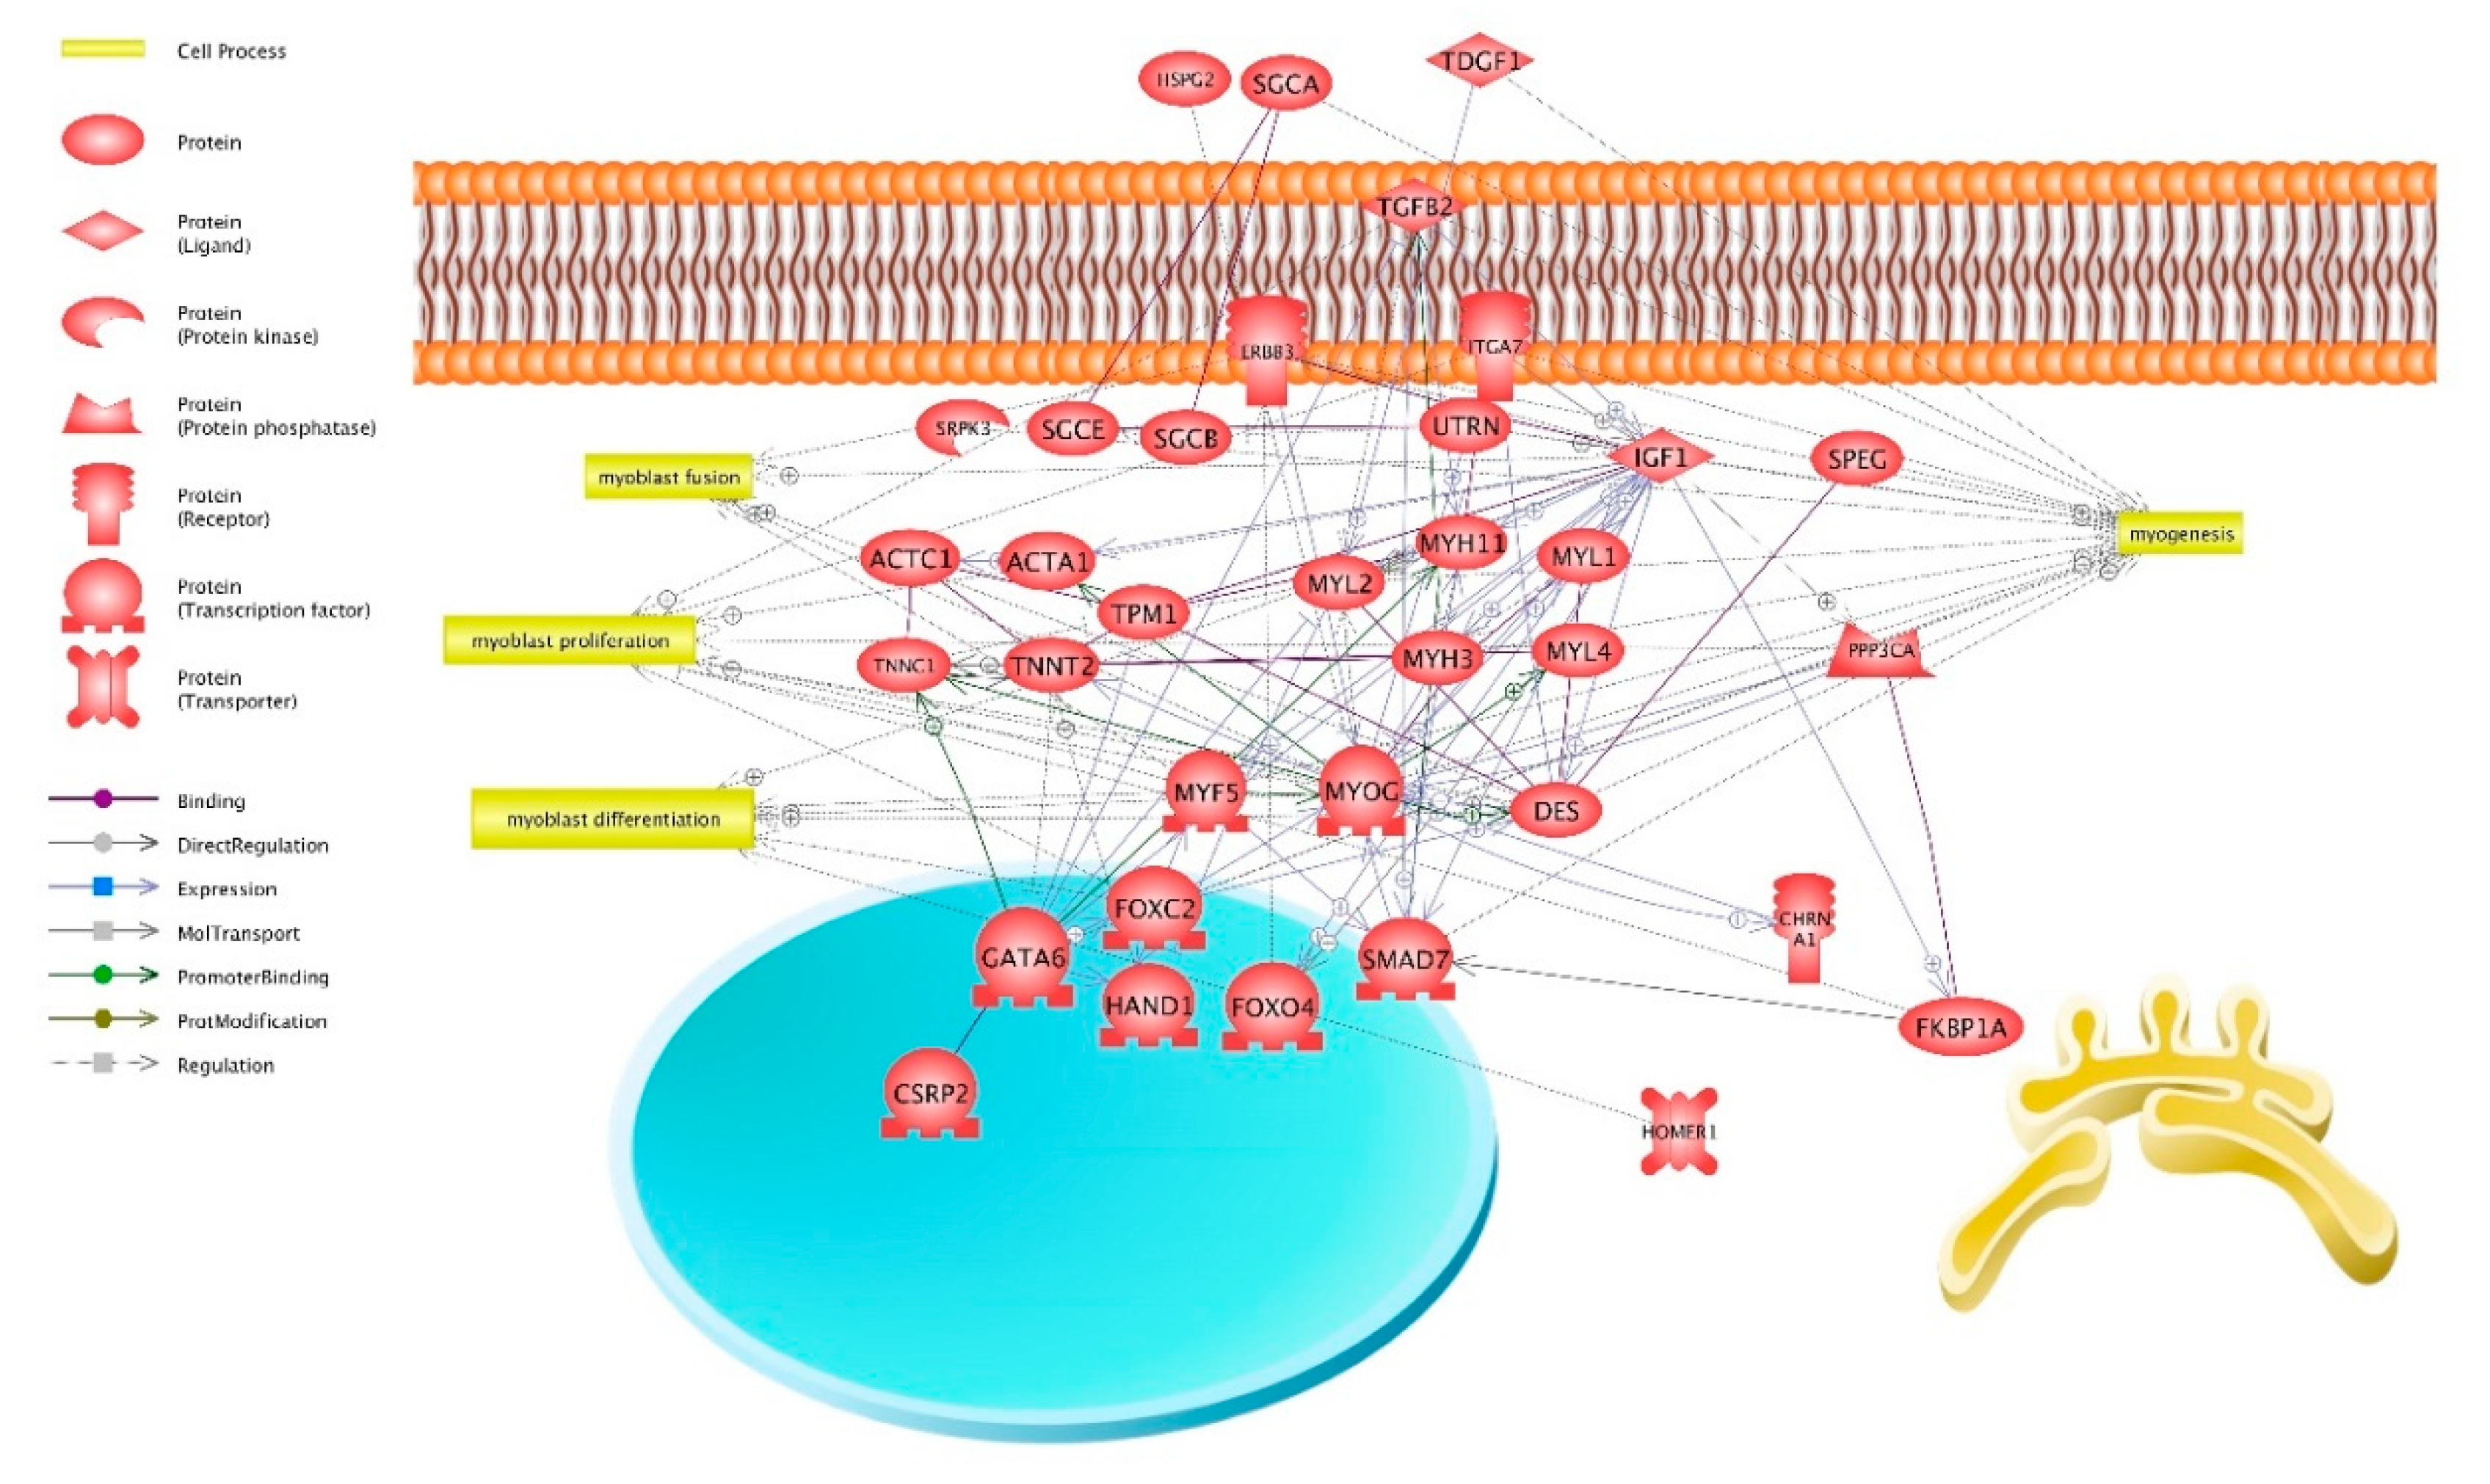
2.2. Transcriptomic and Ontological Analysis

The transcriptomic analysis allowed identification of 2147 common transcripts for muscle cells of beef breeds relative to the dairy breed, with statistically significant differences in expression (p ≤ 0.05; FC ≥ 1.3). A total of 2125 common transcripts, showing expression change in the same direction in both beef breeds, were selected for further analyses (Figure 1). Such a selection criterion will enable identification of the key genes involved in myogenesis regulation in beef cattle, thus enabling determination of the genes conditioning the cattle phenotype with greater muscle mass growth. Of the 2125 identified transcripts, 825 were characterized by greater expression and 1300 by lower expression in the case of LIM and HER bulls, relative to HF bulls. Finally, the subsequent ontological analyses took into account all nonduplicated genes common for beef breeds (1413), with the same direction of expression change, the expression of which was subject to at least a 1.3-fold change in both comparisons.
Analysis of the identified common genes (1413) was performed to determine their involvement in biological processes. Ontological analysis demonstrated that the genes which had significant change in their expression are associated with 14 biological processes (Figure 2A), 8 developmental processes (Figure 2B), and 6 system developments (Figure 2C). The process associated with muscle organ development was represented by 21 genes (Table S1).
In addition, an ontological analysis assigned the common genes identified from proliferating muscle cells of beef breed bulls to 601 biological processes (p ≤ 0.05; Pathway Studio). Table S2 demonstrates only those biological processes that are associated with the skeletal muscle organ development and additionally includes processes occurring in smooth and cardiac muscles.
For a better and more detailed understanding of the processes, with which the genes common for LIM and HER are associated, an additional, supplementary ontological analysis was performed (Database for Annotation, Visualization, and Integrated Discovery—DAVID) and assigned the selected common genes to 10 biological processes associated with muscle development, enabling a more detailed interpretation of the results (Table S3).
Further analyses took into account the group of genes common for LIM and HER breeds which were assigned by the DAVID to the process associated with muscle organ development. This process was represented by a group of 43 genes presented in Table 1.
A network of relationships of the identified genes common for LIM and HER was created showing intergene interactions and their classification to the following biological processes linked to muscle organ development: myogenesis (17 genes), myoblast proliferation (9), myoblast differentiation (6), and myoblast fusion (5) (Figure 3).

2.3. Result Verification with the Use of qPCR Method
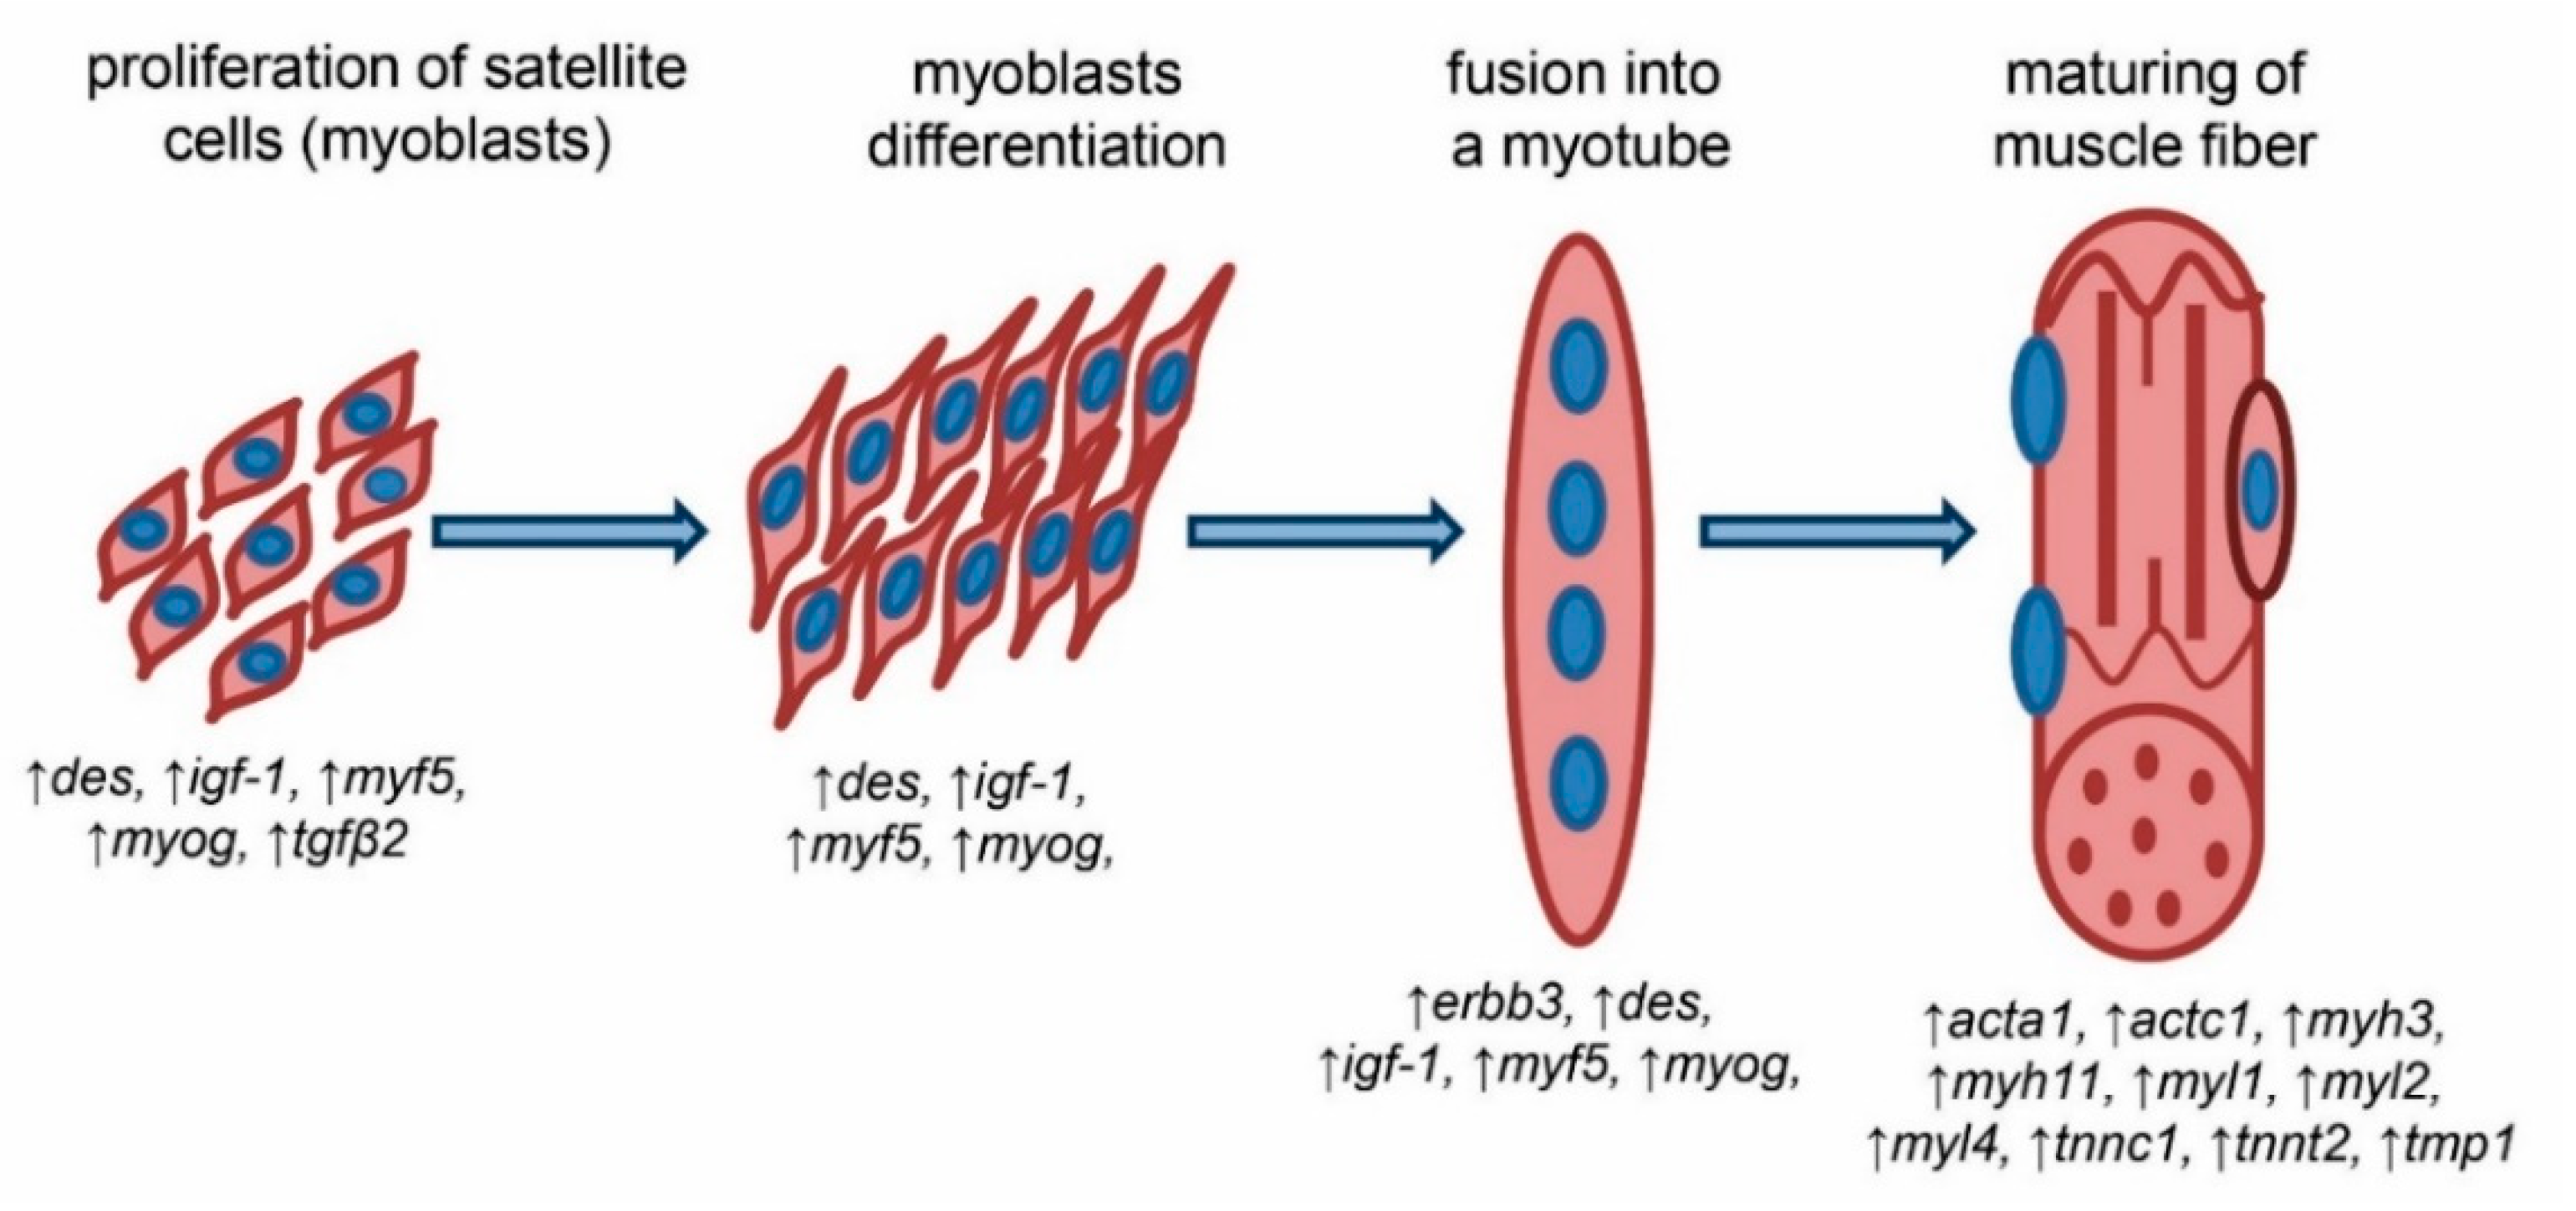
For the purposes of results verification, seven genes were selected, demonstrating similar changes of expression in both beef breeds as compared with the dairy breed and associated with the process of muscle organ development. Results obtained using the real-time polymerase chain reaction (qPCR) method demonstrated a higher level of expression in all examined genes linked to the development of the muscle organ: myf5; desmin (des); myog; erb-b2 receptor tyrosine kinase 3 (erbb3); myosin heavy chain (myh3); myosin light chain (myl2); and insulin like growth factor 1 (igf-1) in the primary culture of cells isolated from the semitendinosus muscle in beef breed bulls (Figure 4). These results confirm those obtained from the microarray analysis.

3. Discussion

The present study focused on a group of genes related to muscle organ development. Statistically significant differences observed in their expression between beef breed bulls and dairy breed bulls (Table 1) may point to their significant involvement in the process of growth and development of muscles in beef breeds. We developed a network of relationships of the identified genes common for LIM and HER, assigned by the DAVID to the process associated with muscle organ development (Figure 3): myogenesis (17 genes: des; erbb3; forkhead box C2 (foxc2); GATA binding protein 6 (gata6); igf-1; integrin alpha 7 (itga7); myf5; myl2; myh3; myog; sarcoglycan alpha (sgca); SMAD family member 7 (smad7); striated muscle enriched protein kinase (speg); SRSF protein kinase 3 (srpk3); teratocarcinoma-derived growth factor 1 (tdgf1); transforming growth factor beta 2 (tgf-β2); utrophin (utrn)); myoblasts proliferation (9 genes: des; foxc2; FKBP prolyl isomerase 1A (fkbp1a); igf-1; itga7; myf5; myog; protein phosphatase 3 catalytic subunit alpha (ppp3ca); tgf-β2); myoblasts differentiation (6 genes: des; foxc2; homer scaffold protein 1 (homer1); igf-1; myf5; myog); and myoblasts fusion (5 genes: des, erbb3, igf-1, myf5, myog) (Figure 3).
The first genes identified and validated by qPCR are myf5 and myog (Figure 4, Table 1). Both were assigned to processes associated with myogenesis, myoblast proliferation, myoblast differentiation, and myoblast fusion (Figure 3). It is well-known that myf5 and myogenin belong to MRFs and play a significant role in the development and growth of skeletal muscles. This regulation consists of activation of quiescent satellite cells, their proliferation, differentiation, and fusion into multinucleated myotubes, maturing into functional muscle fibers [7,8,10].
Myf5 is a muscle-specific factor, which undergoes expression at the earliest stage during the development of skeletal muscles, and its expression is necessary to direct myogenic cells [17,18]. Activated satellite cells exhibit myf5 expression, as it is the first factor that promotes their proliferation [19]. In numerous studies, a higher level of myf5 expression in proliferating muscle cells was observed as well as a decrease in the number of cells as a result of myf5 downregulation [20,21,22]. In the study conducted by Coles et al. [23], a higher level of MYF5 expression and higher proliferation potential of myoblasts originating from the muscle was observed in Angus and HER breeds than in the Wagyu breed and was positively correlated with higher muscle mass in these breeds. Consequently, the higher myf5 expression level in proliferating cells from beef bulls demonstrated herein (Figure 4, Table 1) may further contribute to the higher muscle mass growths in individuals of beef breeds, which are characterized by a significantly higher share of muscle in carcasses, and higher dressing percentage and content of valuable cuts than the dairy breed [24,25].
Myogenin plays a key role in the development of skeletal muscles during the process of myoblast differentiation. As a result of induction of differentiation, myogenin translocates from the cytoplasm to the nucleus, which allows cells to begin this process [26]. Myogenin expression, despite being lower in proliferating than in differentiating myoblasts, begins before the cells leave the cellular cycle and enter the postmitotic stage, determining fusion with neighboring cells [20,27,28,29,30]. The ultimate differentiation of myogenic progenitor cells is characterized by early MYOG expression, followed by myofibrillar protein expression, such as the myosin heavy chain, right before fusion with the forming myotubes [31,32]. Myogenin expression was also demonstrated in proliferating and differentiating bovine satellite cells [33,34]. It is likely that at least some of the tested cells isolated from semitendinosus muscle in LIM and HER breeds of cattle had already commenced differentiation which determines fusion into multinucleated myotubes, indicating increased expression of myogenin and other genes described in the following part of the Discussion, including myl2, myh3, actin alpha 1 skeletal muscle (acta1), actin alpha cardiac muscle 1 (actc1), tropomyosin 1 (tpm1), troponin T2, cardiac type (tnnt2), and troponin C type 1, slow (tnnc1). These genes play a key role in the differentiation and fusion of muscle cells, and also have a positive impact on the process of myogenesis of skeletal muscles [35,36,37,38].
Higher myog expression in beef breeds may also stem from the elevated igf-1 expression, which was upregulated in beef breeds (Figure 4, Table 1). IGF-1 stimulates MRFs such as MyoD, myogenin, and MYH3 [39,40,41,42]. According to functional analysis, igf-1 was assigned to the following biological processes: myogenesis, myoblast proliferation, myoblast differentiation, and myoblast fusion (Figure 3). In addition, IGF-1 is considered to be a factor involved in muscle tissue hypertrophy and regeneration processes [41,43]. An elevated IGF-1 level stimulates the synthesis of skeletal muscle proteins, primarily myofibrils such as actins, troponins, tropomyosins incorporated into thin myofilaments, and myosin included in thick myofilaments. These proteins comprise approximately 80% of the sarcoplasm of muscle fibers and participate in the construction of sarcomere. Elevated synthesis of structural proteins contributes to better growth of muscle tissue [44,45]. It is worth noting that various expression levels of IGF1 may result from DNA mutations and differences in single nucleotide polymorphisms (SNPs) prevalence between the examined breeds. Previous studies have shown the effect of the SNP of the IGF-1 gene on the growth rate and meat production traits in beef cattle such as: Limousin and Hereford [46], Angus [47,48], Montbeliarde [49], and Hanwoo [50]. It is possible that the higher igf-1 expression level in LIM and HER bulls compared with HF further contributes to achieving higher muscle mass growth in typical beef breeds.
Results of the transcriptomic analysis performed as part of the present study demonstrated that muscle cells of beef cattle are characterized by a higher expression level of genes associated with myosin heavy chains (myh3 and myh11) as well as genes associated with myosin light chains (myl1, myl2, myl4) (Figure 4, Table 1). These genes were classified to the myogenesis process (Figure 3). Myosin light chains (MYL1, MYL2) constitute myosin complex components and can act as a molecular motor providing energy to muscle contraction [51]. An elevated expression level of myh3 and myl2 genes was identified during the differentiation of cattle [33,52], mouse [53], and human satellite cells [54]. On the contrary, lowered expression of MYH3 and MYL2 was shown in muscle cells deprived of myogenin [33]. Myosin heavy chains 3 (MYH3) undergoes expression in skeletal muscle cells, promotes cell fusion into myotubes [35,55], and its expression is positively correlated with higher growth of muscle mass in cattle [56,57]. Similar relationships were observed in the present study, with a higher myh3 expression level in beef bulls (Figure 4, Table 1). Additionally, a reduced myh3 level was observed in myoblasts with lowered IGF-1 expression, however, the administration of IGF-1 to the medium resulted in elevated Myh3 expression [58]. It is possible that elevated myogenin and igf-1 expression necessary for the normal course of myogenesis, also identified in LIM and HER bulls, are responsible for increased myh3 and myl2 expression and may influence muscle development in bulls from beef breeds.
Other genes that may constitute significant regulators of growth and development of skeletal muscles are acta1 and actc1, tpm1, tnnc1, and tnnt2 (Figure 3, Table 1). The elevated expression level of the aforementioned muscle-specific genes in myoblasts differentiating into multinucleated myotubes was confirmed [59,60,61,62] and may be responsible for an elevated level of proteins forming a contractile apparatus, thus contributing to a more intensive hypertrophy of muscle tissue observed in beef breeds at a later stage of skeletal muscle development. The expression of genes encoding proteins of the contractile apparatus may be stimulated by the aforementioned myogenin and IGF-1 [63,64]. It is a known fact that in the early stages of myoblast differentiation, the MyoD+/MYOG+ myocytes begin to accumulate muscle-specific ACTA1 and MYH3. Subsequently, myocytes may fuse, forming α-actinin+/MYOG+ multinucleated myotubes, and finally, muscle fibers [65].
Another gene identified via microarray analysis, the expression of which was higher in cells, originating from beef breeds is transforming growth factor, beta 2 (tgf-β2) (Table 1). Tgf-β2 was classified to biological processes associated with myogenesis and myoblast proliferation (Figure 3). Tgf-β2 is a factor belonging to the TGF-β superfamily, which regulates skeletal muscle growth, stimulating the proliferation of skeletal muscle satellite cells [66]. Rudolf et al. [67] demonstrated that exogenous TGF-β2 stimulation restores muscle regeneration potential by disturbing the level of β-catenin in satellite cells. Szcześniak et al. [68] revealed that the expression of the tgf-β2 gene was downregulated in equine satellite cells (ESC) treated with β-hydroxy-β-methyl butyrate (HMB). However, this study was conducted on differentiating cells.
Desmin, which showed higher expression in muscle cells of beef breed individuals, is another important gene involved in the process of muscle organ development (Figure 4, Table 1). Functional analysis demonstrated its association with the myogenesis, proliferation, differentiation, and fusion of myoblasts (Figure 3). Desmin is the key protein of the muscle cell cytoskeleton, located on thin (actin) myofilaments, and responsible for the normal function of muscle cells, including integrity of the internal environment and regulation of the location and function of the contractile apparatus, cell nucleus, and mitochondria [69]. Desmin is a muscle-specific protein expressed at the beginning and the end of the myogenic program and accumulated during in vitro myogenesis and is one of the key markers of muscle differentiation [70,71]. During myogenesis, desmin is subject to expression in undifferentiated muscle cells, myotubes, and muscle fibers, and its expression precedes that of other proteins of the contractile apparatus, such as actin, myosin, troponin, and tropomyosin and also precedes the expression of muscle-specific genes, such as myod, myf5, myog, and mrf4 [72,73]. Therefore, such an early appearance of desmin mRNA confirms its key role in the development and function of muscle cells. Moreover, Yu et al. [19] demonstrated that IGF-1 administration considerably increased the expression of myogenic factors, including desmin. Higher desmin expression in LIM and HER bulls may depend on the higher igf-1 expression in beef breeds (Table 1).
The last identified gene that was classified to myogenesis processes and myoblast fusion, the expression of which was higher in muscle cells in beef breeds, is erbb3 (Figure 3 and Figure 4, Table 1). Erbb3 encodes the tyrosine surface receptor for neuregulin (NRG) also expressed in cultured myotubes. NRG participates in several processes associated with the development of skeletal muscles, such as myogenesis, muscle fiber survival, and muscle spindle development [74,75]. Muscle cells commencing the differentiation process secrete neuregulin that is necessary for the induction of the early stage of differentiation [76,77]. As a myogenic factor, NRG promotes myogenin expression, thus stimulating myoblasts for withdrawal from the cellular cycle and beginning differentiation, inducing fusion to multinucleated myotubes and formation of the muscle spindle through an increase in MyHC expression [78,79,80]. It has been revealed that NRG increases protein synthesis, contributing to the regulation of skeletal muscle mass [79,81]. On the contrary, Sadkowski et al. [24] revealed a decreased level of erbb3 expression in the tissue of semitendinosus muscle in LIM and HER bull breeds as in the HF breed. However, it should be emphasized that the study was carried out on a fully mature muscle tissue, with an established number of muscle fibers. Thus, it seems that the higher erbb3 expression observed in muscle cells from both beef breeds (Figure 4, Table 1) is associated with proliferation and may be highly important for the regulation of this process.
In conclusion, a higher expression level of genes identified in the cell cultures isolated from semitendinosus muscle of LIM and HER breeds may indicate their significant role in the processes of the formation and maturation of skeletal muscle in beef cattle. Hence, it is plausible that the increased differentiation stimulation by key genes associated with the general myogenesis process such as myf5, myog, des, igf-1, erbb3, and tgfb2, and elevated contractile apparatus proteins levels such as acta1, actc1, myh3, myl2, tpm1, tnnt2, and tnnc1 responsible for building a significant portion of the muscle fiber mass, is the mechanism that allows the greater growth and development rate of muscle tissue in cattle classified as beef breeds. It needs to be highlighted that myogenin and IGF-1 could be the main factors orchestrating the aforementioned genes by the stimulation of differentiation progression and protein synthesis necessary for higher muscle mass growth. As a summary, the involvement of the identified genes in the distinct processes associated with the development and maturation of muscle fibers with a fully developed contractile apparatus is presented in Figure 5.
This study extends the current knowledge about genes’ involvement in the myogenesis process and describes their effect on the skeletal muscle development in the studied cattle breeds. The results of this study can be useful in selecting cattle towards highly efficient beef production which may have economic significance.

4. Materials and Methods

4.1. Ethics Statement

This study complies with national and institutional guidelines of the use of animals in research according to the Polish Legal Act of January 21, 2005. Since sample collection was performed during routine slaughter and no additional procedures that were harmful or painful for the animals were applied, this study did not require a formal ethics approval.

4.2. Animals and Cell Samples

Transcriptome analyses were conducted on primary cultures of skeletal muscle cell isolated from semitendinosus muscle of 15-month-old bulls. The experimental group was composed of four bulls of each breed of varying performance (HER and LIM beef bulls; HF dairy bulls—a reference). The bulls were housed, fed, and slaughtered at the age of 15 months as described earlier [16,82].
Samples of semitendinosus muscle were immediately taken after the slaughter of the animals in an abattoir and washed four times in phosphate-buffered saline (PBS, Sigma-Aldrich, Saint Louis, MO, USA) with an antibiotic at decreasing concentration (40,000 and 20,000 units Penicillinum crystallisatum /100 mL PBS) (Penicillinum crystallisatum TZF; Polfa Tarchomin, Warsaw, Poland). Next, skeletal muscle samples were cleaned from connective and adipose tissue and cut into small pieces using sterile surgical instruments. Fragmented samples were suspended in sterile fetal bovine serum (FBS) with 10% dimethyl sulfoxide (DMSO) (Sigma-Aldrich, Saint Louis, MO, USA). The prepared samples were gradually cooled to −80 °C and then stored in liquid nitrogen until satellite cell isolation.

4.3. Skeletal Muscle Cells Isolation, Proliferation, and Differentiation

To isolate muscle cells, samples of semitendinosus muscle were thawed immediately in a water bath and subsequently washed in PBS with Penicillinum crystallisatum. After PBS aspiration, the incubation medium (Dulbecco’s modified Eagle medium (DMEM) (Gibco, Life Technologies, Carlsbad, CA, USA), Pronase from Streptomyces griseus (Sigma-Aldrich, Saint Louis, MO, USA) at 0.5 mg/mL, 10% FBS, Penicillinum crystallisatum) was added. Samples were incubated for 1.5 h at 37 °C with constant mixing. Afterwards, the suspension with isolated muscle cells was sieved through a 70-µm nylon filter to separate tissue debris. The filtrate-containing cells were centrifuged three times and resuspended in proliferation medium (10%FBS/DMEM/1% penicillin–streptomycin and 0.5% amphotericin B (Gibco, Life Technologies, Carlsbad, CA, USA)) and transferred to Primaria tissue culture flasks (Becton Dickinson, Franklin Lakes, NJ, USA). The 1-h preplating applied four times finally allowed for achieving 60–70% myoblast purity [16]. Next, 100,000 cells were transferred to culture flasks. Isolated muscle cells of beef and dairy breeds were cultured in proliferation medium until 80% of confluence, which was changed every 48 h. Then, the cells were trypsinized and centrifuged, the supernatant was discarded, and the cell pellet was frozen for further analysis.

4.4. Immunocytochemical Analysis

A part of the isolated cells was cultured to obtain 90% of confluence. Then, the proliferation medium was replaced with a differentiation medium (2% horse serum-HS (Gibco, Life Technologies, Carlsbad, CA, USA)/DMEM/1% penicillin–streptomycin and 0.5% amphotericin B) in the next 6 days in order to validate the type of isolated cells, using immunofluorescence, and carry out morphological analysis of the culture. The differentiation medium was replaced every 48 h. After the sixth day, the cells were fixed with 0.25% paraformaldehyde (Sigma-Aldrich, Saint Louis, MO, USA) for 30 min, washed with PBS, and incubated in ice-cold 70% methanol. Then, cells were incubated with rabbit primary anti-MyHC antibody (Santa Cruz Biotechnology, Dallas, TX, USA) diluted 1:100 with PBS for 1 h. In addition, anti-rabbit secondary antibody conjugated with Alexa Fluor 488 fluorescent dye (Sigma-Aldrich, Saint Louis, MO, USA) suspended in PBS (1:500 dilution) was added and incubated for 1 h. To stain the nuclei, the cells were incubated for 30 min in a solution of 7-aminoactinomycin D (7AAD; Sigma-Aldrich, Saint Louis, MO, USA) (5 mg/mL). The cells were observed using the FV-500 confocal laser scanning microscope (Olympus Optical Co., Hamburg, Germany).

4.5. RNA Isolation and Validation

Total RNA was isolated from muscle cells using a Total RNA kit (A&A Biotechnology, Gdynia, Poland) according to the manufacturer’s instructions. Samples were validated using a Nanodrop spectrophotometer (Nanodrop Technologies, Wilmington, DE, USA) and Bioanalyzer 2100 (Agilent Technologies, Santa Clara, CA, USA). The eluted RNA was stored at −80 °C until further analysis. Only samples with RNA Integrity Number (RIN) > 9 were included in further analysis.

4.6. Gene Expression Analysis

Gene expression was evaluated using Bovine (V2) Gene Expression Microarray 4×44K oligonucleotide slides (Agilent Technologies, Santa Clara, CA, USA) and Two-Color Microarray-Based Gene Expression Analysis kit (Agilent Technologies, Santa Clara, CA, USA). Probe labeling, hybridization, signal detection, and data extraction were performed as described in a previous paper [83]. Differentially expressed genes were identified by the Gene Spring 13.0 software (Agilent Technologies, Santa Clara, CA, USA) using t-test with p ≤ 0.05 and fold change (FC) ≥ 1.3 as the criteria of significance. The data obtained in the microarray experiment were deposited in the National Center for Biotechnology Information (NCBI) Gene Expression Omnibus database (GEO) and numbered GSE151274. Sequences that were not assigned a gene name by the microarray manufacturer were compared with the NCBI Blastn Nucleotide base. Sequences not showing 100% complementarity with eukaryotic mRNA were excluded from further analyses.

4.7. qPCR Validation

To validate the microarray results, selected genes were examined using the qPCR technique. The mRNA sequences of genes were obtained from the NCBI Nucleotide database. Primer sequences were designed using the Primer3 (http://frodo.wi.mit.edu/primer3/) and Primer-Blast software (http://0-www-ncbi-nlm-nih-gov.brum.beds.ac.uk/tools/primer-blast/) and then checked using Oligo Calculator (http://www.basic.northwestern.edu/biotools/oligocalc.html) as described previously [84]. Primer sequences, annealing temperatures, and product length measurements are listed in Table S4. Glyceraldehyde-3-phosphate dehydrogenase (gapdh) was used for normalization as the reference gene [85]. qPCR was performed according to an earlier described methodology [86]. Results were calculated using the Livak method [87] and presented in ΔΔCT as the ratio of verified target gene expression to the expression of the reference gene (gapdh) that was calculated as the arithmetic mean.

4.8. Statistical Analysis

Statistical analysis of microarray data was performed using the Gene Spring 13.0 software (Agilent Technologies, Santa Clara, CA, USA). The mRNA qPCR results were analyzed using Prism 5.0 (GraphPad Software, La Jolla, CA, USA). Statistical significance was checked by one-way analysis of variance (ANOVA) with Tukey’s post hoc testing considering p-value ≤ 0.05 as significant. The data are shown as mean ± standard error.

4.9. Functional Analysis

The results were subjected to ontological analysis using the following online available databases: Panther Classification System 7.0 (http://www.pantherdb.org) using a statistical overrepresentation test with Bonferroni correction; Database for Annotation, Visualization, and Integrated Discovery (DAVID v6 database 7; https://david.ncifcrf.gov/; with the Benjamini and Hochberg test correction (false discovery rate—FDR)). Pathway Studio Web (Elsevier, Amsterdam, Netherlands; https://mammalcedfx.pathwaystudio.com/) was used for the intergene interaction network design. In addition, during the development of data from microarrays, numerous internet databases, which are grouped in NCBI, such as GenBank, OMIM, PubMed, and iHOP, were used.

Supplementary Materials

Supplementary materials can be found at https://0-www-mdpi-com.brum.beds.ac.uk/1422-0067/21/13/4794/s1.

Author Contributions

A.C. performed the muscle sampling, bovine satellite cells isolation, immunocytochemical analysis, RNA isolation, microarray and qPCR analyses, functional analysis, interpretation of the obtained data and wrote the manuscript. T.S. designed the study, supervised the project, performed muscle sampling, statistical analysis of microarray and qPCR data, and assisted in the manuscript preparation and revision. T.M. assisted in the manuscript preparation and revision. All authors read and approved the final manuscript.

Funding

This research was funded by the Ministry of Science and Higher Education, Grant No. N311 123538 and by the National Science Centre (Poland), Grant No. 2011/03/B/NZ9/03987.

Conflicts of Interest

The authors declare no conflict of interest. The funders had no role in the design of the study; in the collection, analyses, or interpretation of data; in the writing of the manuscript, or in the decision to publish the results.

Abbreviations

7AAD7-aminoactinomycin D
DAVIDDatabase for Annotation, Visualization, and Integrated Discovery
DMEMDulbecco’s Modified Eagle Medium
DMSODimethyl sulfoxide
FBSFetal bovine serum
FCFold change
GAPDHGlyceraldehyde-3-phosphate dehydrogenase
HERHereford
HFHolstein-Friesian
HSHorse serum
LIMLimousin
NCBI GEONational Center for Biotechnology Information Gene Expression Omnibus database
PBSPhosphate-buffered saline
qPCRReal-time polymerase chain reaction
RINRNA Integrity Number

References

  1. Motyl, T.; Sadkowski, T.; Jank, M.; Wicik, Z. Miogeneza-rozwój mięśni szkieletowych. In Genomika Bydła i Świń-Wybrane Zagadnienia; Zwierzchowski, L., Świtoński, M., Eds.; Instytut Genetyki i Hodowli Zwierząt, Polska Akademia Nauk: Jastrzębiec, Poland, 2009; Volume 9.1, pp. 250–261. [Google Scholar]
  2. Sadkowski, T.; Jank, M.; Oprzadek, J.; Motyl, T. Age-dependent changes in bovine skeletal muscle transcriptomic profile. J. Physiol. Pharmacol. 2006, 57, S95–S110. [Google Scholar]
  3. Robelin, J.; Tulloh, N.M. Paterns of growth of cattle. In Beef Cattle Production; Jarrige, R., Beranger, C., Eds.; Elsevier: Paris, France, 1992; pp. 111–129. [Google Scholar]
  4. Dhawan, J.; Rando, T.A. Stem cells in postnatal myogenesis: Molecular mechanisms of satellite cell quiescence, activation and replenishment. Trends Cell Biol. 2005, 15, 666–673. [Google Scholar] [CrossRef] [PubMed]
  5. Relaix, F.; Zammit, P.S. Satellite cells are essential for skeletal muscle regeneration: The cell on the edge returns centre stage. Development 2012, 139, 2845–2856. [Google Scholar] [CrossRef] [PubMed] [Green Version]
  6. Steyn, P.J.; Dzobo, K.; Smith, R.I.; Myburgh, K.H. Interleukin-6 Induces Myogenic Differentiation via JAK2-STAT3 Signaling in Mouse C2C12 Myoblast Cell Line and Primary Human Myoblasts. Int. J. Mol. Sci. 2019, 20, 5273. [Google Scholar] [CrossRef] [PubMed] [Green Version]
  7. Kuang, S.; Rudnicki, M.A. The emerging biology of satellite cells and their therapeutic potential. Trends Mol. Med. 2008, 14, 82–91. [Google Scholar] [CrossRef]
  8. Bazgir, B.; Fathi, R.; Rezazadeh Valojerdi, M.; Mozdziak, P.; Asgari, A. Satellite Cells Contribution to Exercise Mediated Muscle Hypertrophy and Repair. Cell J. 2017, 18, 473–484. [Google Scholar] [CrossRef] [PubMed]
  9. Yamakawa, H.; Kusumoto, D.; Hashimoto, H.; Yuasa, S. Stem Cell Aging in Skeletal Muscle Regeneration and Disease. Int. J. Mol. Sci. 2020, 21, 1830. [Google Scholar] [CrossRef] [Green Version]
  10. Ciecierska, A.; Sadkowski, T.; Motyl, T. Role of satellite cells in growth and regeneration of skeletal muscles. Med. Weter. 2019, 75, 707–712. [Google Scholar] [CrossRef]
  11. Goh, Q.; Millay, D.P. Requirement of myomaker-mediated stem cell fusion for skeletal muscle hypertrophy. Elife 2017, 6, 20007. [Google Scholar] [CrossRef]
  12. Chen, J.F.; Tao, Y.; Li, J.; Deng, Z.; Yan, Z.; Xiao, X.; Wang, D.Z. MicroRNA-1 and microRNA-206 regulate skeletal muscle satellite cell proliferation and differentiation by repressing Pax7. J. Cell Biol. 2010, 190, 867–879. [Google Scholar] [CrossRef] [Green Version]
  13. Lee, E.J.; Pokharel, S.; Jan, A.T.; Huh, S.; Galope, R.; Lim, J.H.; Lee, D.M.; Choi, S.W.; Nahm, S.S.; Kim, Y.W.; et al. Transthyretin: A Transporter Protein Essential for Proliferation of Myoblast in the Myogenic Program. Int. J. Mol. Sci. 2017, 18, 115. [Google Scholar] [CrossRef] [PubMed] [Green Version]
  14. Dey, B.; Gagan, J.; Dutta, A. MiR-206 and -486 induce myoblast differentiation by downregulating Pax7. Mol. Cell Biol. 2011, 31, 203–214. [Google Scholar] [CrossRef] [Green Version]
  15. Berkes, C.A.; Tapscott, S.J. MyoD and the transcriptional control of myogenesis. Semin. Cell Dev. Biol. 2005, 16, 585–595. [Google Scholar] [CrossRef] [PubMed]
  16. Sadkowski, T.; Ciecierska, A.; Oprządek, J.; Balcerek, E. Breed-dependent microRNA expression in the primary culture of skeletal muscle cells subjected to myogenic differentiation. BMC Genom. 2018, 19, 109. [Google Scholar] [CrossRef] [PubMed] [Green Version]
  17. Laker, R.C.; Ryall, J.G. DNA Methylation in Skeletal Muscle Stem Cell Specification, Proliferation, and Differentiation. Stem Cells Int. 2016, 2016, 5725927. [Google Scholar] [CrossRef] [Green Version]
  18. Zammit, P.S. Function of the myogenic regulatory factors Myf5, MyoD, Myogenin and MRF4 in skeletal muscle, satellite cells and regenerative myogenesis. Semin. Cell Dev. Biol. 2017, 72, 19–32. [Google Scholar] [CrossRef]
  19. Yu, M.; Wang, H.; Xu, Y.; Yu, D.; Li, D.; Liu, X.; Du, W. Insulin-like growth factor-1 (IGF-1) promotes myoblast proliferation and skeletal muscle growth of embryonic chickens via the PI3K/Akt signalling pathway. Cell Biol. Int. 2015, 39, 910–922. [Google Scholar] [CrossRef]
  20. Lindon, C.; Montarras, D.; Pinset, C. Cell cycle-regulated expression of the muscle determination factor Myf5 in proliferating myoblasts. J. Cell Biol. 1998, 140, 111–118. [Google Scholar] [CrossRef] [Green Version]
  21. Panda, A.C.; Abdelmohsen, K.; Martindale, J.L.; Di Germanio, C.; Yang, X.; Grammatikakis, I.; Noh, J.H.; Zhang, Y.; Lehrmann, E.; Dudekula, D.B.; et al. Novel RNA-binding activity of MYF5 enhances Ccnd1/Cyclin D1 mRNA translation during myogenesis. Nucleic Acids Res. 2016, 44, 2393–2408. [Google Scholar] [CrossRef] [Green Version]
  22. Ustanina, S.; Carvajal, J.; Rigby, P.; Braun, T. The myogenic factor Myf5 supports efficient skeletal muscle regeneration by enabling transient myoblast amplification. Stem Cells 2007, 25, 2006–2016. [Google Scholar] [CrossRef]
  23. Coles, C.A.; Wadeson, J.; Leyton, C.P.; Siddell, J.P.; Greenwood, P.L.; White, J.D.; McDonagh, M.B. Proliferation rates of bovine primary muscle cells relate to liveweight and carcase weight in cattle. PLoS ONE 2015, 10, e0124468. [Google Scholar] [CrossRef] [PubMed] [Green Version]
  24. Sadkowski, T.; Jank, M.; Zwierzchowski, L.; Oprzadek, J.; Motyl, T. Transcriptomic index of skeletal muscle of beef breeds bulls. J. Physiol. Pharmacol. 2009, 60, S15–S28. [Google Scholar]
  25. Iwanowska, A.; Pospiech, E.; Łyczyński, A.; Rosochacki, S.; Grześl, B.; Mikołajczak, B.; Iwańska, E.; Rzosińska, E.; Czyżak-Runowska, G. Evaluation of variations in principal indices of the culinary meat quality obtained from young bulls of various breeds. Acta Sci. Pol. Technol. Aliment. 2010, 9, 133–149. [Google Scholar]
  26. De Arcangelis, V.; Coletti, D.; Conti, M.; Lagarde, M.; Molinaro, M.; Adamo, S.; Nemoz, G.; Naro, F. IGF-I-induced differentiation of L6 myogenic cells requires the activity of cAMP-phosphodiesterase. Mol. Biol. Cell 2003, 14, 1392–1404. [Google Scholar] [CrossRef] [Green Version]
  27. Lawson-Smith, M.J.; McGeachie, J.K. The identification of myogenic cells in skeletal muscle, with emphasis on the use of tritiated thymidine autoradiography and desmin antibodies. J. Anat. 1998, 192, 161–171. [Google Scholar] [CrossRef] [PubMed]
  28. Aswad, H.; Jalabert, A.; Rome, S. Depleting extracellular vesicles from fetal bovine serum alters proliferation and differentiation of skeletal muscle cells in vitro. BMC Biotechnol. 2016, 16, 32. [Google Scholar] [CrossRef] [PubMed] [Green Version]
  29. Malik, A.; Lee, E.J.; Jan, A.T.; Ahmad, S.; Cho, K.H.; Kim, J.; Choi, I. Network Analysis for the Identification of Differentially Expressed Hub Genes Using Myogenin Knock-down Muscle Satellite Cells. PLoS ONE 2015, 10, e0133597. [Google Scholar] [CrossRef] [Green Version]
  30. Oldham, J.M.; Martyn, J.A.; Sharma, M.; Jeanplong, F.; Kambadur, R.; Bass, J.J. Molecular expression of myostatin and MyoD is greater in double-muscled than normal-muscled cattle fetuses. Am. J. Physiol. Regul. Integr. Comp. Physiol. 2001, 280, R1488–R1493. [Google Scholar] [CrossRef]
  31. Wang, Y.X.; Dumont, N.A.; Rudnicki, M.A. Muscle stem cells at a glance. J. Cell Sci. 2014, 127, 4543–4548. [Google Scholar] [CrossRef] [Green Version]
  32. André, L.M.; Ausems, C.R.M.; Wansink, D.G.; Wieringa, B. Abnormalities in Skeletal Muscle Myogenesis, Growth, and Regeneration in Myotonic Dystrophy. Front. Neurol. 2018, 9, 368. [Google Scholar] [CrossRef]
  33. Lee, E.J.; Malik, A.; Pokharel, S.; Ahmad, S.; Mir, B.A.; Cho, K.H.; Kim, J.; Kong, J.C.; Lee, D.M.; Chung, K.Y.; et al. Identification of genes differentially expressed in myogenin knock-down bovine muscle satellite cells during differentiation through RNA sequencing analysis. PLoS ONE 2014, 9, e92447. [Google Scholar] [CrossRef] [PubMed]
  34. Rønning, S.B.; Pedersen, M.E.; Andersen, P.V.; Hollung, K. The combination of glycosaminoglycans and fibrous proteins improves cell proliferation and early differentiation of bovine primary skeletal muscle cells. Differentiation 2013, 86, 13–22. [Google Scholar] [CrossRef] [PubMed] [Green Version]
  35. Fu, Y.; Li, S.; Tong, H.; Li, S.; Yan, Y. WDR13 promotes the differentiation of bovine skeletal muscle-derived satellite cells by affecting PI3K/AKT signaling. Cell Biol. Int. 2019, 43, 799–808. [Google Scholar] [CrossRef] [PubMed]
  36. De Las Heras-Saldana, S.; Chung, K.Y.; Lee, S.H.; Gondro, C. Gene expression of Hanwoo satellite cell differentiation in longissimus dorsi and semimembranosus. BMC Genom. 2019, 20, 156. [Google Scholar] [CrossRef] [PubMed] [Green Version]
  37. Younis, S.; Naboulsi, R.; Wang, X.; Cao, X.; Larsson, M.; Sargsyan, E.; Bergsten, P.; Welsh, N.; Andersson, L. Dissection of the cellular function of the ZBED6 transcription factor in mouse myoblast cells using gene editing, RNAseq and proteomics. bioRxiv 2019. [Google Scholar] [CrossRef]
  38. Park, J.W.; Lee, J.H.; Kim, S.W.; Han, J.S.; Kang, K.S.; Kim, S.J.; Park, T.S. Muscle differentiation induced up-regulation of calcium-related gene expression in quail myoblasts. Asian-Australas. J. Anim. Sci. 2018, 31, 1507–1515. [Google Scholar] [CrossRef]
  39. Kumar, A.; Yamauchi, J.; Girgenrath, T.; Girgenrath, M. Muscle-specific expression of insulin-like growth factor 1 improves outcome in Lama2Dy-w mice, a model for congenital muscular dystrophy type 1A. Hum. Mol. Genet. 2011, 20, 2333–2343. [Google Scholar] [CrossRef] [Green Version]
  40. Adams, G.R.; Haddad, F.; Baldwin, K.M. Time course of changes in markers of myogenesis in overloaded rat skeletal muscles. J. Appl. Physiol. 1999, 87, 1705–1712. [Google Scholar] [CrossRef]
  41. McKay, B.R.; O’Reilly, C.E.; Phillips, S.M.; Tarnopolsky, M.A.; Parise, G. Co-expression of IGF-1 family members with myogenic regulatory factors following acute damaging muscle-lengthening contractions in humans. J. Physiol. 2008, 586, 5549–5560. [Google Scholar] [CrossRef]
  42. Chal, J.; Pourquié, O. Making muscle: Skeletal myogenesis in vivo and in vitro. Development 2017, 144, 2104–2122. [Google Scholar] [CrossRef] [Green Version]
  43. Ascenzi, F.; Barberi, L.; Dobrowolny, G.; Villa Nova Bacurau, A.; Nicoletti, C.; Rizzuto, E.; Rosenthal, N.; Scicchitano, B.M.; Musarò, A. Effects of IGF-1 isoforms on muscle growth and sarcopenia. Aging Cell 2019, 18, e12954. [Google Scholar] [CrossRef] [PubMed]
  44. Musarò, A.; McCullagh, K.; Paul, A.; Houghton, L.; Dobrowolny, G.; Molinaro, M.; Barton, E.R.; Sweeney, H.L.; Rosenthal, N. Localized Igf-1 transgene expression sustains hypertrophy and regeneration in senescent skeletal muscle. Nat. Genet. 2001, 27, 195–200. [Google Scholar] [CrossRef] [PubMed]
  45. Pietrangelo, T.; Puglielli, C.; Mancinelli, R.; Beccafico, S.; Fanò, G.; Fulle, S. Molecular basis of the myogenic profile of aged human skeletal muscle satellite cells during differentiation. Exp. Gerontol. 2009, 44, 523–531. [Google Scholar] [CrossRef] [PubMed] [Green Version]
  46. Szewczuk, M.; Sablik, P.; Kulig, H. The effect of polymorphism within exon 12 of IGF1R gene on meat production traits in Limousin and Hereford cattle. Acta Sci. Pol. Zootech. 2017, 16, 53–56. [Google Scholar] [CrossRef]
  47. Ge, W.; Davis, M.E.; Hines, H.C.; Irvin, K.M.; Simmen, R.C. Association of a genetic marker with blood serum insulin-like growth factor-I concentration and growth traits in Angus cattle. J. Anim. Sci. 2001, 79, 1757–1762. [Google Scholar] [CrossRef] [Green Version]
  48. Szewczuk, M.; Zych, S.; Wójcik, J.; Czerniawska-Piątkowska, E. Association of two SNPs in the coding region of the insulin-like growth factor 1 receptor (IGF1R) gene with growth-related traits in Angus cattle. J. Appl. Genet. 2013, 54, 305–308. [Google Scholar] [CrossRef] [PubMed] [Green Version]
  49. Szewczuk, M. Analysis of the relationship between insulin-like growth factor 1 receptor gene polymorphisms in Montbeliarde cows and the birth weight of their calves. Acta Vet. Brno. 2016, 85, 41–47. [Google Scholar] [CrossRef] [Green Version]
  50. Chung, E.; Kim, W. Association of SNP Marker in IGF-I and MYF5 Candidate Genes with Growth Traits in Korean Cattle. Asian-Aust. J. Anim. Sci. 2005, 18, 1061–1065. [Google Scholar] [CrossRef]
  51. Ouyang, H.; Wang, Z.; Chen, X.; Yu, J.; Li, Z.; Nie, Q. Proteomic Analysis of Chicken Skeletal Muscle during Embryonic Development. Front. Physiol. 2017, 8, 281. [Google Scholar] [CrossRef] [Green Version]
  52. Lee, E.J.; Bajracharya, P.; Lee, D.M.; Kang, S.W.; Lee, Y.S.; Lee, H.J.; Hong, S.K.; Chang, J.; Kim, J.W.; Schnabel, R.D.; et al. Gene expression profiles during differentiation and transdifferentiation of bovine myogenic satellite cells. Genes Genom. 2012, 34, 133–148. [Google Scholar] [CrossRef]
  53. Moran, J.L.; Li, Y.; Hill, A.A.; Mounts, W.M.; Miller, C.P. Gene expression changes during mouse skeletal myoblast differentiation revealed by transcriptional profiling. Physiol. Genom. 2002, 10, 103–111. [Google Scholar] [CrossRef] [PubMed] [Green Version]
  54. Sterrenburg, E.; Turk, R.; Hoen, P.A.; van Deutekom, J.C.; Boer, J.M.; van Ommen, G.J.; den Dunnen, J.T. Large-scale gene expression analysis of human skeletal myoblast differentiation. Neuromuscul. Disord. 2004, 14, 507–518. [Google Scholar] [CrossRef] [PubMed]
  55. Zhang, J.; Xu, X.; Liu, Y.; Zhang, L.; Odle, J.; Lin, X.; Zhu, H.; Wang, X.; Liu, Y. EPA and DHA Inhibit Myogenesis and Downregulate the Expression of Muscle-related Genes in C2C12 Myoblasts. Genes (Basel) 2019, 10, 64. [Google Scholar] [CrossRef] [Green Version]
  56. Xu, Y.; Shi, T.; Cai, H.; Zhou, Y.; Lan, X.; Zhang, C.; Lei, C.; Qi, X.; Chen, H. Associations of MYH3 gene copy number variations with transcriptional expression and growth traits in Chinese cattle. Gene 2014, 535, 106–111. [Google Scholar] [CrossRef] [PubMed]
  57. Wang, L.; Liu, X.; Niu, F.; Wang, H.; He, H.; Gu, Y. Single nucleotide polymorphisms, haplotypes and combined genotypes in MYH3 gene and their associations with growth and carcass traits in Qinchuan cattle. Mol. Biol. Rep. 2013, 40, 417–426. [Google Scholar] [CrossRef] [PubMed] [Green Version]
  58. Matheny, R.W., Jr.; Nindl, B.C. Loss of IGF-IEa or IGF-IEb impairs myogenic differentiation. Endocrinology 2011, 152, 1923–1934. [Google Scholar] [CrossRef] [Green Version]
  59. Cronin, E.M.; Thurmond, F.A.; Bassel-Duby, R.; Williams, R.S.; Wright, W.E.; Nelson, K.D.; Garner, H.R. Protein-coated poly(L-lactic acid) fibers provide a substrate for differentiation of human skeletal muscle cells. J. Biomed. Mater. Res. A 2004, 69, 373–381. [Google Scholar] [CrossRef]
  60. Li, X.J.; Zhou, J.; Liu, L.Q.; Qian, K.; Wang, C.L. Identification of genes in longissimus dorsi muscle differentially expressed between Wannanhua and Yorkshire pigs using RNA-sequencing. Anim. Genet. 2016, 47, 324–333. [Google Scholar] [CrossRef]
  61. Yan, Z.; Choi, S.; Liu, X.; Zhang, M.; Schageman, J.J.; Lee, S.Y.; Hart, R.; Lin, L.; Thurmond, F.A.; Williams, R.S. Highly coordinated gene regulation in mouse skeletal muscle regeneration. J. Biol. Chem. 2003, 278, 8826–8836. [Google Scholar] [CrossRef] [Green Version]
  62. Jaeger, M.A.; Sonnemann, K.J.; Fitzsimons, D.P.; Prins, K.W.; Ervasti, J.M. Context-dependent functional substitution of alpha-skeletal actin by gamma-cytoplasmic actin. FASEB J. 2009, 23, 2205–2214. [Google Scholar] [CrossRef] [PubMed] [Green Version]
  63. Lolis, A.A.; Londhe, P.; Beggs, B.C.; Byrum, S.D.; Tackett, A.J.; Davie, J.K. Myogenin recruits the histone chaperone facilitates chromatin transcription (FACT) to promote nucleosome disassembly at muscle-specific genes. J. Biol. Chem. 2013, 288, 7676–7687. [Google Scholar] [CrossRef] [Green Version]
  64. Bisping, E.; Ikeda, S.; Sedej, M.; Wakula, P.; McMullen, J.R.; Tarnavski, O.; Sedej, S.; Izumo, S.; Pu, W.T.; Pieske, B. Transcription factor GATA4 is activated but not required for insulin-like growth factor 1 (IGF1)-induced cardiac hypertrophy. J. Biol. Chem. 2012, 287, 9827–9834. [Google Scholar] [CrossRef] [PubMed] [Green Version]
  65. Chua, M.J.; Yildirim, E.D.; Tan, J.E.; Chua, Y.B.; Low, S.C.; Ding, S.L.S.; Li, C.W.; Jiang, Z.; Teh, B.T.; Yu, K.; et al. Assessment of different strategies for scalable production and proliferation of human myoblasts. Cell Prolif. 2019, 52, e12602. [Google Scholar] [CrossRef] [Green Version]
  66. De Mello, F.; Streit, D.P., Jr.; Sabin, N.; Gabillard, J.C. Dynamic expression of tgf-β2, tgf-β3 and inhibin βA during muscle growth resumption and satellite cell differentiation in rainbow trout (Oncorhynchus mykiss). Gen. Comp. Endocrinol. 2015, 210, 23–29. [Google Scholar] [CrossRef]
  67. Rudolf, A.; Schirwis, E.; Giordani, L.; Parisi, A.; Lepper, C.; Taketo, M.M.; Le Grand, F. β-Catenin Activation in Muscle Progenitor Cells Regulates Tissue Repair. Cell Rep. 2016, 15, 1277–1290. [Google Scholar] [CrossRef] [PubMed] [Green Version]
  68. Szcześniak, K.A.; Ciecierska, A.; Ostaszewski, P.; Sadkowski, T. Characterisation of equine satellite cell transcriptomic profile response to β-hydroxy-β-methylbutyrate (HMB). Br. J. Nutr. 2016, 116, 1315–1325. [Google Scholar] [CrossRef] [Green Version]
  69. Pawlak, A.; Gil, R.J.; Grajkowska, W.; Nasierowska-Guttmejer, A.M.; Rzezak, J.; Kulawik, T. Significance of low desmin expression in cardiomyocytes in patients with idiopathic dilated cardiomyopathy. Am. J. Cardiol. 2013, 111, 393–399. [Google Scholar] [CrossRef]
  70. Kelc, R.; Trapecar, M.; Gradisnik, L.; Rupnik, M.S.; Vogrin, M. Platelet-rich plasma, especially when combined with a TGF-β inhibitor promotes proliferation, viability and myogenic differentiation of myoblasts in vitro. PLoS ONE 2015, 10, e0117302. [Google Scholar] [CrossRef] [PubMed]
  71. Portilho, D.M.; Soares, C.P.; Morrot, A.; Thiago, L.S.; Butler-Browne, G.; Savino, W.; Costa, M.L.; Mermelstein, C. Cholesterol depletion by methyl-β-cyclodextrin enhances cell proliferation and increases the number of desmin-positive cells in myoblast cultures. Eur. J. Pharmacol. 2012, 694, 1–12. [Google Scholar] [CrossRef] [Green Version]
  72. Kobayashi, F.; Yamamoto, M.; Kitamura, K.; Asuka, K.; Kinoshita, H.; Matsunaga, S.; Abe, S. Desmin and Vimentin Expression during Embryonic Development of Tensor Veli Palatini Muscle in Mice. J. Hard Tissue Biol. 2015, 24, 134–142. [Google Scholar] [CrossRef] [Green Version]
  73. Pawlak, A.; Gil, R.J. Desmin—An important structural protein of a cardiac myocyte. Kardiol. Pol. 2007, 65, 303–309. [Google Scholar] [PubMed]
  74. Juretić, N.; Díaz, J.; Romero, F.; González, G.; Jaimovich, E.; Riveros, N. Interleukin-6 and neuregulin-1 as regulators of utrophin expression via the activation of NRG-1/ErbB signaling pathway in mdx cells. Biochim. Biophys. Acta Mol. Basis Dis. 2017, 1863, 770–780. [Google Scholar] [CrossRef] [PubMed]
  75. Moscoso, L.M.; Chu, G.C.; Gautam, M.; Noakes, P.G.; Merlie, J.P.; Sanes, J.R. Synapse-associated expression of an acetylcholine receptor-inducing protein, ARIA/heregulin, and its putative receptors, ErbB2 and ErbB3, in developing mammalian muscle. Dev. Biol. 1995, 172, 158–169. [Google Scholar] [CrossRef] [PubMed] [Green Version]
  76. Zorzano, A.; Kaliman, P.; Gumà, A.; Palacín, M. Intracellular signals involved in the effects of insulin-like growth factors and neuregulins on myofibre formation. Cell Signal. 2003, 15, 141–149. [Google Scholar] [CrossRef]
  77. Kim, D.; Chi, S.; Lee, K.H.; Rhee, S.; Kwon, Y.K.; Chung, C.H.; Kwon, H.; Kang, M.S. Neuregulin stimulates myogenic differentiation in an autocrine manner. J. Biol. Chem. 1999, 274, 15395–15400. [Google Scholar] [CrossRef] [Green Version]
  78. Jacobson, C.; Duggan, D.; Fischbach, G. Neuregulin induces the expression of transcription factors and myosin heavy chains typical of muscle spindles in cultured human muscle. Proc. Natl. Acad. Sci. USA 2004, 101, 12218–12223. [Google Scholar] [CrossRef] [Green Version]
  79. Gumà, A.; Martínez-Redondo, V.; López-Soldado, I.; Cantó, C.; Zorzano, A. Emerging role of neuregulin as a modulator of muscle metabolism. Am. J. Physiol. Endocrinol. Metab. 2010, 298, E742–E750. [Google Scholar] [CrossRef] [Green Version]
  80. Liu, L.; Liu, X.; Bai, Y.; Tang, N.; Li, J.; Zhang, Y.; Wu, J.; Wang, X.; Wei, J. Neuregulin-1β modulates myogenesis in septic mouse serum-treated C2C12 myotubes in vitro through PPARγ/NF-κB signaling. Mol. Biol. Rep. 2018, 45, 1611–1619. [Google Scholar] [CrossRef]
  81. Hellyer, N.J.; Mantilla, C.B.; Park, E.W.; Zhan, W.Z.; Sieck, G.C. Neuregulin-dependent protein synthesis in C2C12 myotubes and rat diaphragm muscle. Am. J. Physiol. Cell Physiol. 2006, 291, C1056–C1061. [Google Scholar] [CrossRef] [Green Version]
  82. Sadkowski, T.; Jank, M.; Zwierzchowski, L.; Oprzadek, J.; Motyl, T. Comparison of skeletal muscle transcriptional profiles in dairy and beef breeds bulls. J. Appl. Genet. 2009, 50, 109–123. [Google Scholar] [CrossRef] [PubMed]
  83. Wicik, Z.; Sadkowski, T.; Jank, M.; Motyl, T. The transcriptomic signature of myostatin inhibitory influence on the differentiation of mouse C2C12 myoblasts. Pol. J. Vet. Sci. 2011, 14, 643–652. [Google Scholar] [CrossRef] [PubMed] [Green Version]
  84. Szcześniak, K.A.; Ciecierska, A.; Ostaszewski, P.; Sadkowski, T. Transcriptomic profile adaptations following exposure of equine satellite cells to nutriactive phytochemical gamma-oryzanol. Genes Nutr. 2016, 11, 5. [Google Scholar] [CrossRef] [PubMed] [Green Version]
  85. Pérez, R.; Tupac-Yupanqui, I.; Dunner, S. Evaluation of suitable reference genes for gene expression studies in bovine muscular tissue. BMC Mol. Biol. 2008, 9, 79. [Google Scholar] [CrossRef] [PubMed] [Green Version]
  86. Sadkowski, T.; Ciecierska, A.; Majewska, A.; Oprządek, J.; Dasiewicz, K.; Ollik, M.; Wicik, Z.; Motyl, T. Transcriptional background of beef marbling - novel genes implicated in intramuscular fat deposition. Meat Sci. 2014, 97, 32–41. [Google Scholar] [CrossRef] [PubMed]
  87. Schmittgen, T.D.; Livak, K.J. Analyzing real-time PCR data by the comparative C(T) method. Nat. Protoc. 2008, 3, 1101–1108. [Google Scholar] [CrossRef] [PubMed]
Figure 1. The number of transcripts identified as part of the comparison between primary cultures of semitendinosus muscle cells of beef breeds (Limousin (LIM) and Hereford (HER)) relative to the dairy breed (Holstein-Friesian (HF)), showing statistically significant differences in expression (p ≤ 0.05; fold change (FC) ≥ 1.3) (n = 4 for each breed).
Ijms 21 04794 g001
Figure 2. Functional classification of the identified genes that differed statistically significantly (p ≤ 0.05) in expression between proliferating muscle cells of 15-month-old bulls from beef breeds (LIM and HER) and HF, a dairy breed, in terms of their involvement (A) in biological processes (BP), (B) developmental processes (DP) and (C) system development (SD). Analysis was performed using the Panther 7.0 software.
Ijms 21 04794 g002
Figure 3. Intergene interaction network of identified common genes for beef breeds and their classification to biological processes associated with muscle organ development (Pathway Studio).
Ijms 21 04794 g003
Figure 4. qPCR verification of selected genes associated with muscle organ development. The obtained results were statistically elaborated using one-way analysis of variance and Tukey’s multiple range test. Results are presented as mean ± standard error and are marked with asterisk * for p < 0.05; n = 4 for each breed; gapdh—reference gene; GraphPad Prism 5 (GraphPad Software Inc., USA).
Ijms 21 04794 g004
Figure 5. Involvement of the identified genes in processes associated with the development and maturation of muscle fibers.
Ijms 21 04794 g005
Table 1. List of identified common genes associated with muscle organ development (Database for Annotation, Visualization, and Integrated Discovery—DAVID).
No.Gene symbolGene name (GenBank Accession Number)LIM vs. HF FCHER vs. HF FC
1acta1Bos taurus actin, alpha 1, skeletal muscle (ACTA1), mRNA [NM_174225]26.7125.31
2unc45bunc-45 homolog B (C. elegans) [Source:HGNC Symbol;Acc:14304] [ENSBTAT00000003766]22.1510.91
3myh3Bos taurus myosin, heavy chain 3, skeletal muscle, embryonic (MYH3), mRNA [NM_001101835]19.6916.58
4myl2Bos taurus myosin, light chain 2, regulatory, cardiac, slow (MYL2), mRNA [NM_001035025]15.108.60
5col11a1Bos taurus collagen, type XI, alpha 1 (COL11A1), mRNA [NM_001166509]14.608.95
6actc1Bos taurus actin, alpha, cardiac muscle 1 (ACTC1), mRNA [NM_001034585]12.398.16
7elnelastin [Source:HGNC Symbol;Acc:3327] [ENSBTAT00000057593]12.108.66
8tnnt2Bos taurus troponin T type 2 (cardiac) (TNNT2), mRNA [NM_174771]11.9012.98
9myl1Bos taurus myosin, light chain 1, alkali; skeletal, fast (MYL1), mRNA [NM_001079578]11.568.76
10igf1PREDICTED: Bos taurus insulin like growth factor 1 (IGF1), transcript variant X8, mRNA [XM_005206500]11.1013.75
11ttntitin [Source:HGNC Symbol;Acc:12403] [ENSBTAT00000061449]9.104.27
12tnnc1Bos taurus troponin C type 1 (slow) (TNNC1), mRNA [NM_001034351]8.075.69
13desBos taurus desmin (DES), mRNA [NM_001081575]7.515.54
14hspg2PREDICTED: Bos taurus heparan sulfate proteoglycan 2 (HSPG2), mRNA [XM_582024]7.074.37
15myf5Bos taurus myogenic factor 5 (MYF5), mRNA [NM_174116]5.322.61
16sgcaPREDICTED: Bos taurus sarcoglycan alpha (SGCA), transcript variant X1, mRNA [XM_005220623]4.904.57
17tpm1Bos taurus tropomyosin 1 (alpha) (TPM1), mRNA [NM_001013590]4.874.38
18myl4Bos taurus myosin, light chain 4, alkali; atrial, embryonic (MYL4), mRNA [NM_001075149]4.263.43
19myogBos taurus myogenin (myogenic factor 4) (MYOG), mRNA [NM_001111325]4.114.19
20tagln3Bos taurus transgelin 3 (TAGLN3), mRNA [NM_001034499]3.382.97
21spegBos taurus SPEG complex locus, mRNA (cDNA clone IMAGE:8085922), partial cds, [BC113258]3.363.57
22itga7Bos taurus integrin, alpha 7 (ITGA7), mRNA [NM_001191305]3.102.64
23erbb3Bos taurus v-erb-b2 erythroblastic leukemia viral oncogene homolog 3 (avian) (ERBB3), mRNA [NM_001103105]2.911.57
24myl6bBos taurus myosin, light chain 6B, alkali, smooth muscle and non-muscle (MYL6B), mRNA [NM_001075713]2.912.33
25homer1PREDICTED: Bos taurus homer scaffolding protein 1 (HOMER1), transcript variant X2, mRNA [XM_015473042] 2.833.15
26sgceBos taurus sarcoglycan, epsilon (SGCE), mRNA [NM_001075145]2.592.11
27tgfb2Bos taurus transforming growth factor, beta 2 (TGFB2), mRNA [NM_001113252]2.572.39
28chrna1Bos taurus cholinergic receptor, nicotinic, alpha 1 (muscle) (CHRNA1), mRNA [NM_176664]2.462.82
29foxo4Bos taurus forkhead box O4 (FOXO4), mRNA [NM_001101277]2.442.28
30myh11Bos taurus myosin, heavy chain 11, smooth muscle (MYH11), mRNA [NM_001102127]2.243.88
31myl6Bos taurus myosin, light chain 6, alkali, smooth muscle and non-muscle (MYL6), mRNA [NM_175780]2.181.62
32sgcbBos taurus sarcoglycan, beta (43kDa dystrophin-associated glycoprotein) (SGCB), mRNA [NM_001102188]2.131.83
33fkbp1aBos taurus FK506 binding protein 1A, 12kDa, mRNA (cDNA clone IMAGE:7951983), partial cds. [BC102338]2.051.80
34utrnBos taurus utrophin (UTRN), mRNA [NM_001278561]1.952.26
35hand1Bos taurus heart and neural crest derivatives expressed 1 (HAND1), mRNA [NM_001075761]−2.84−1.80
36csrp2Bos taurus cysteine and glycine-rich protein 2 (CSRP2), mRNA [NM_001038183]−2.59−2.34
37gata6GATA binding protein 6 [Source:HGNC Symbol;Acc:4174] [ENSBTAT00000007537]−2.51−1.75
38srpk3Bos taurus SRSF protein kinase 3 (SRPK3), mRNA [NM_001083390]−2.27−1.69
39smad7PREDICTED: Bos taurus SMAD family member 7 (SMAD7), transcript variant X1, mRNA [XM_005224231]−2.27−2.11
40ppp3caBos taurus protein phosphatase 3, catalytic subunit, alpha isozyme (PPP3CA), mRNA [NM_174787]−1.73−1.79
41tdgf1Bos taurus teratocarcinoma-derived growth factor 1 (TDGF1), mRNA [NM_001080358]−1.72−1.58
42foxc2Bos taurus forkhead box C2 (MFH-1, mesenchyme forkhead 1) (FOXC2), mRNA [NM_001193072]−1.61−1.49
43nf1Bos taurus neurofibromin 1 (NF1), mRNA, [Source:RefSeq mRNA;Acc:NM_001122728] [ENSBTAT00000015699]−1.33−1.49
FC ≥ 1.3; p ≤ 0.05; n = 4 for each breed. FC, fold change; LIM, Limousin; HER, Hereford; HF, Holstein-Friesian.

